Richmond, IL Map & Demographics
Richmond Map
Richmond Overview
$38,341
PER CAPITA INCOME
$83,125
AVG FAMILY INCOME
$62,756
AVG HOUSEHOLD INCOME
7.9%
WAGE / INCOME GAP [ % ]
92.1¢/ $1
WAGE / INCOME GAP [ $ ]
$10,130
FAMILY INCOME DEFICIT
0.42
INEQUALITY / GINI INDEX
2,266
TOTAL POPULATION
1,151
MALE POPULATION
1,115
FEMALE POPULATION
103.23
MALES / 100 FEMALES
96.87
FEMALES / 100 MALES
36.8
MEDIAN AGE
2.8
AVG FAMILY SIZE
2.0
AVG HOUSEHOLD SIZE
1,250
LABOR FORCE [ PEOPLE ]
67.3%
PERCENT IN LABOR FORCE
11.4%
UNEMPLOYMENT RATE
Richmond Zip Codes
Richmond Area Codes
Income in Richmond
Income Overview in Richmond
Per Capita Income in Richmond is $38,341, while median incomes of families and households are $83,125 and $62,756 respectively.
| Characteristic | Number | Measure |
| Per Capita Income | 2,266 | $38,341 |
| Median Family Income | 523 | $83,125 |
| Mean Family Income | 523 | $106,913 |
| Median Household Income | 1,098 | $62,756 |
| Mean Household Income | 1,098 | $78,080 |
| Income Deficit | 523 | $10,130 |
| Wage / Income Gap (%) | 2,266 | 7.88% |
| Wage / Income Gap ($) | 2,266 | 92.12¢ per $1 |
| Gini / Inequality Index | 2,266 | 0.42 |
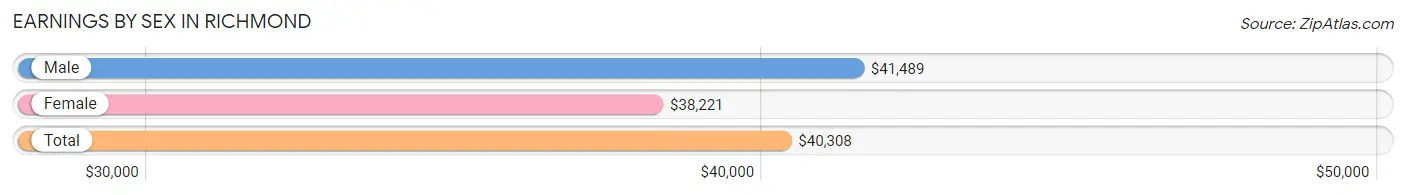
Earnings by Sex in Richmond
Average Earnings in Richmond are $40,308, $41,489 for men and $38,221 for women, a difference of 7.9%.
| Sex | Number | Average Earnings |
| Male | 684 (52.1%) | $41,489 |
| Female | 629 (47.9%) | $38,221 |
| Total | 1,313 (100.0%) | $40,308 |
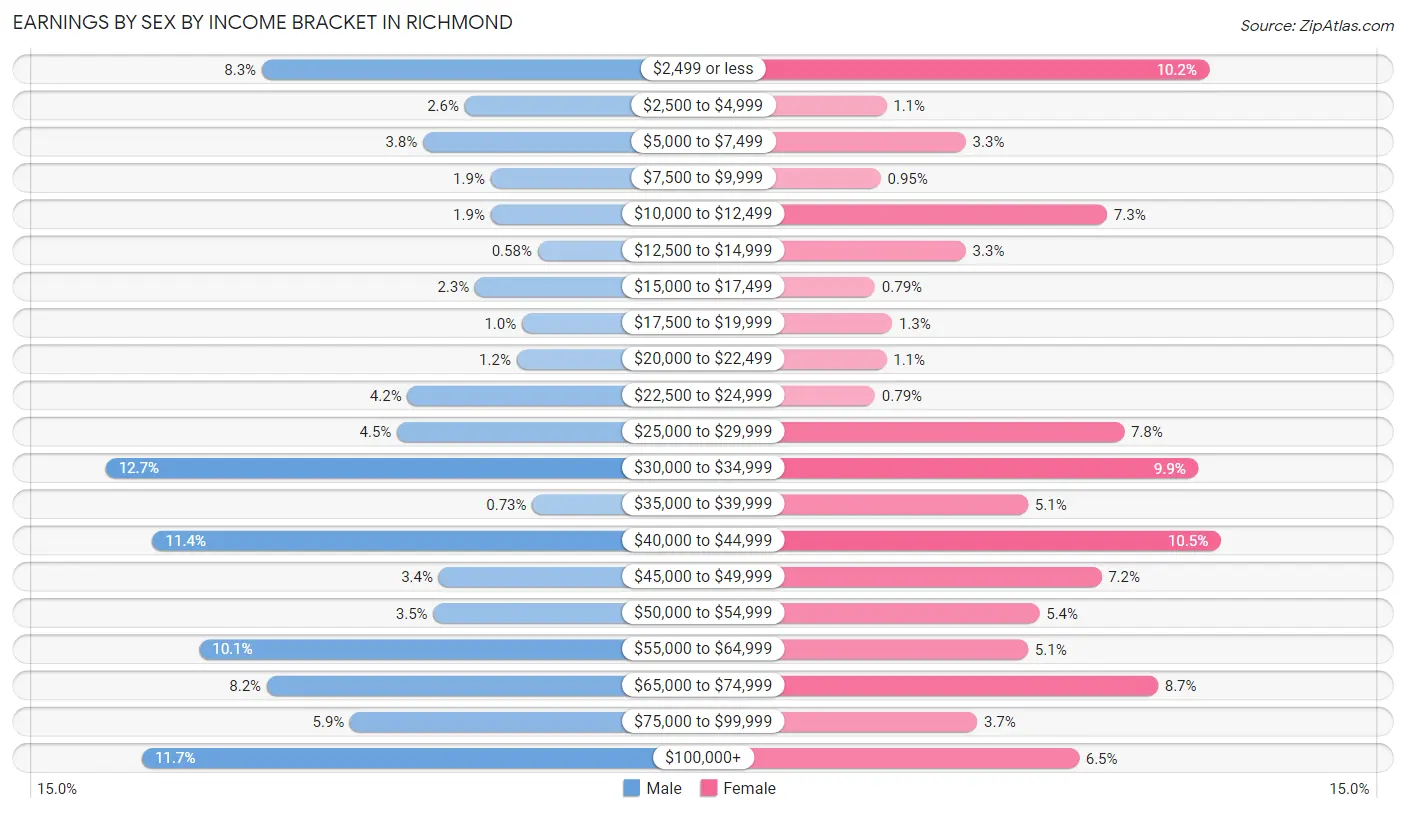
Earnings by Sex by Income Bracket in Richmond
The most common earnings brackets in Richmond are $30,000 to $34,999 for men (87 | 12.7%) and $40,000 to $44,999 for women (66 | 10.5%).
| Income | Male | Female |
| $2,499 or less | 57 (8.3%) | 64 (10.2%) |
| $2,500 to $4,999 | 18 (2.6%) | 7 (1.1%) |
| $5,000 to $7,499 | 26 (3.8%) | 21 (3.3%) |
| $7,500 to $9,999 | 13 (1.9%) | 6 (0.9%) |
| $10,000 to $12,499 | 13 (1.9%) | 46 (7.3%) |
| $12,500 to $14,999 | 4 (0.6%) | 21 (3.3%) |
| $15,000 to $17,499 | 16 (2.3%) | 5 (0.8%) |
| $17,500 to $19,999 | 7 (1.0%) | 8 (1.3%) |
| $20,000 to $22,499 | 8 (1.2%) | 7 (1.1%) |
| $22,500 to $24,999 | 29 (4.2%) | 5 (0.8%) |
| $25,000 to $29,999 | 31 (4.5%) | 49 (7.8%) |
| $30,000 to $34,999 | 87 (12.7%) | 62 (9.9%) |
| $35,000 to $39,999 | 5 (0.7%) | 32 (5.1%) |
| $40,000 to $44,999 | 78 (11.4%) | 66 (10.5%) |
| $45,000 to $49,999 | 23 (3.4%) | 45 (7.1%) |
| $50,000 to $54,999 | 24 (3.5%) | 34 (5.4%) |
| $55,000 to $64,999 | 69 (10.1%) | 32 (5.1%) |
| $65,000 to $74,999 | 56 (8.2%) | 55 (8.7%) |
| $75,000 to $99,999 | 40 (5.9%) | 23 (3.7%) |
| $100,000+ | 80 (11.7%) | 41 (6.5%) |
| Total | 684 (100.0%) | 629 (100.0%) |
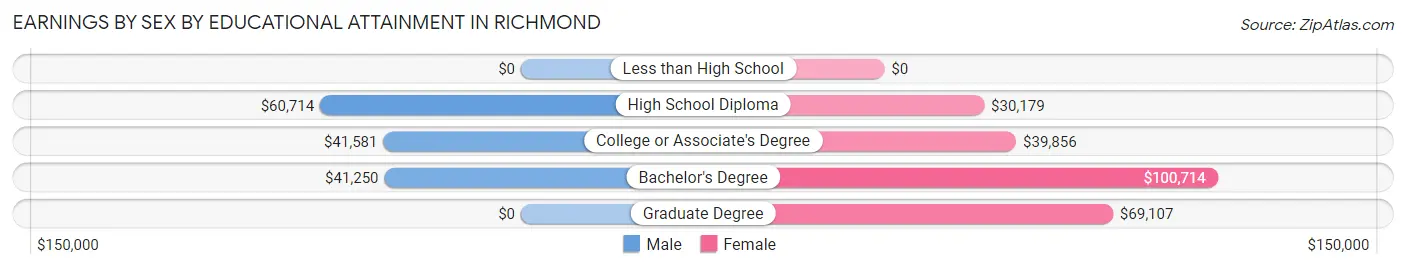
Earnings by Sex by Educational Attainment in Richmond
Average earnings in Richmond are $43,333 for men and $41,750 for women, a difference of 3.6%. Men with an educational attainment of high school diploma enjoy the highest average annual earnings of $60,714, while those with bachelor's degree education earn the least with $41,250. Women with an educational attainment of bachelor's degree earn the most with the average annual earnings of $100,714, while those with high school diploma education have the smallest earnings of $30,179.
| Educational Attainment | Male Income | Female Income |
| Less than High School | - | - |
| High School Diploma | $60,714 | $30,179 |
| College or Associate's Degree | $41,581 | $39,856 |
| Bachelor's Degree | $41,250 | $100,714 |
| Graduate Degree | - | - |
| Total | $43,333 | $41,750 |
Family Income in Richmond
Family Income Brackets in Richmond
According to the Richmond family income data, there are 108 families falling into the $50,000 to $74,999 income range, which is the most common income bracket and makes up 20.6% of all families.
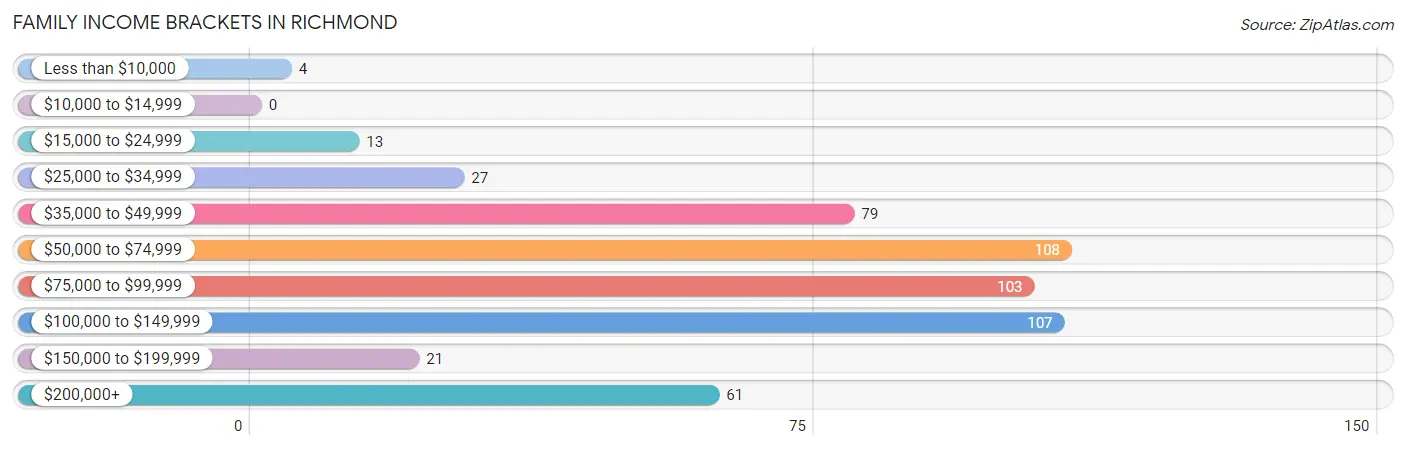
| Income Bracket | # Families | % Families |
| Less than $10,000 | 4 | 0.8% |
| $10,000 to $14,999 | 0 | 0.0% |
| $15,000 to $24,999 | 13 | 2.5% |
| $25,000 to $34,999 | 27 | 5.2% |
| $35,000 to $49,999 | 79 | 15.1% |
| $50,000 to $74,999 | 108 | 20.7% |
| $75,000 to $99,999 | 103 | 19.7% |
| $100,000 to $149,999 | 107 | 20.5% |
| $150,000 to $199,999 | 21 | 4.0% |
| $200,000+ | 61 | 11.7% |
Family Income by Famaliy Size in Richmond
3-person families (61 | 11.7%) account for the highest median family income in Richmond with $148,958 per family, while 3-person families (61 | 11.7%) have the highest median income of $49,653 per family member.
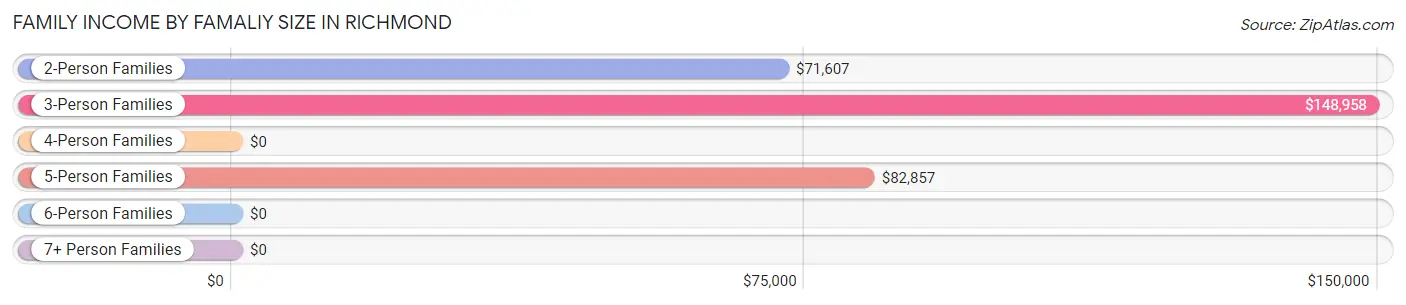
| Income Bracket | # Families | Median Income |
| 2-Person Families | 323 (61.8%) | $71,607 |
| 3-Person Families | 61 (11.7%) | $148,958 |
| 4-Person Families | 56 (10.7%) | $0 |
| 5-Person Families | 64 (12.2%) | $82,857 |
| 6-Person Families | 19 (3.6%) | $0 |
| 7+ Person Families | 0 (0.0%) | $0 |
| Total | 523 (100.0%) | $83,125 |
Family Income by Number of Earners in Richmond
The median family income in Richmond is $83,125, with families comprising 3+ earners (67) having the highest median family income of $149,375, while families with 1 earner (112) have the lowest median family income of $51,250, accounting for 12.8% and 21.4% of families, respectively.
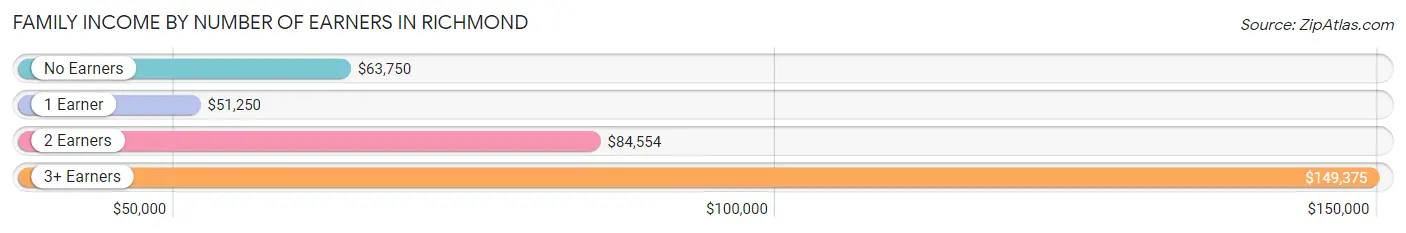
| Number of Earners | # Families | Median Income |
| No Earners | 117 (22.4%) | $63,750 |
| 1 Earner | 112 (21.4%) | $51,250 |
| 2 Earners | 227 (43.4%) | $84,554 |
| 3+ Earners | 67 (12.8%) | $149,375 |
| Total | 523 (100.0%) | $83,125 |
Household Income in Richmond
Household Income Brackets in Richmond
With 231 households falling in the category, the $50,000 to $74,999 income range is the most frequent in Richmond, accounting for 21.0% of all households. In contrast, only 5 households (0.5%) fall into the $10,000 to $14,999 income bracket, making it the least populous group.
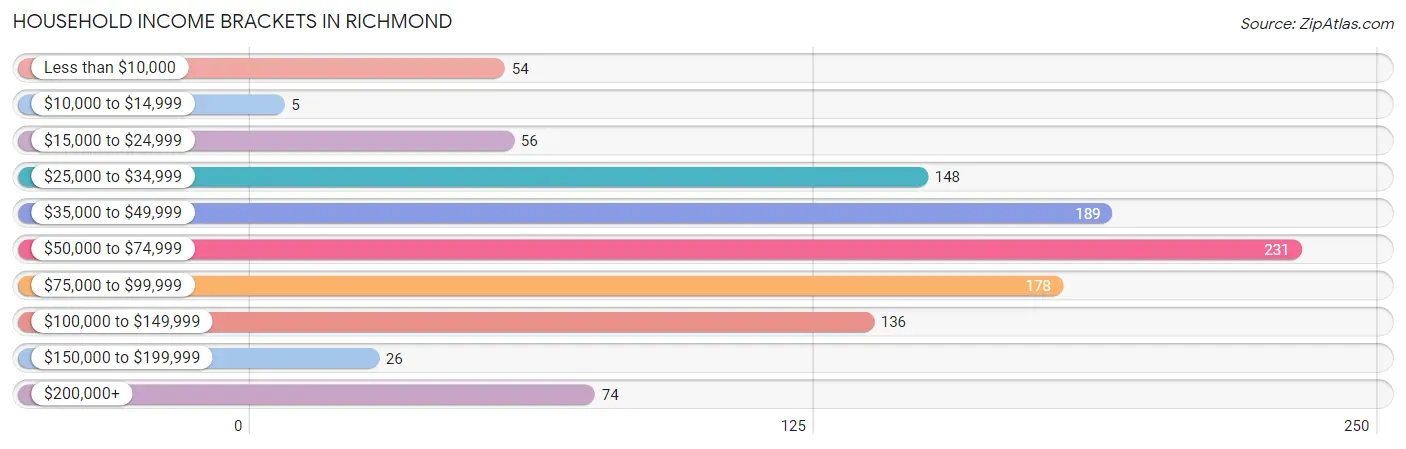
| Income Bracket | # Households | % Households |
| Less than $10,000 | 54 | 4.9% |
| $10,000 to $14,999 | 5 | 0.5% |
| $15,000 to $24,999 | 56 | 5.1% |
| $25,000 to $34,999 | 148 | 13.5% |
| $35,000 to $49,999 | 189 | 17.2% |
| $50,000 to $74,999 | 231 | 21.0% |
| $75,000 to $99,999 | 178 | 16.2% |
| $100,000 to $149,999 | 136 | 12.4% |
| $150,000 to $199,999 | 26 | 2.4% |
| $200,000+ | 74 | 6.7% |
Household Income by Householder Age in Richmond
The median household income in Richmond is $62,756, with the highest median household income of $78,750 found in the 45 to 64 years age bracket for the primary householder. A total of 315 households (28.7%) fall into this category. Meanwhile, the 65+ years age bracket for the primary householder has the lowest median household income of $42,250, with 309 households (28.1%) in this group.
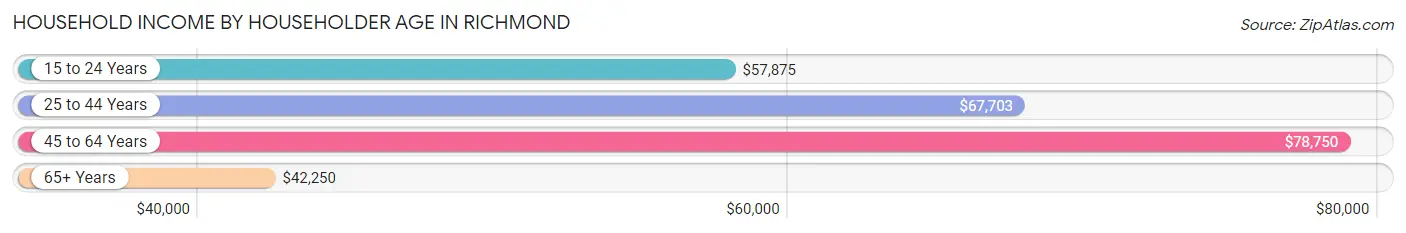
| Income Bracket | # Households | Median Income |
| 15 to 24 Years | 83 (7.6%) | $57,875 |
| 25 to 44 Years | 391 (35.6%) | $67,703 |
| 45 to 64 Years | 315 (28.7%) | $78,750 |
| 65+ Years | 309 (28.1%) | $42,250 |
| Total | 1,098 (100.0%) | $62,756 |
Poverty in Richmond
Income Below Poverty by Sex and Age in Richmond
With 8.0% poverty level for males and 9.2% for females among the residents of Richmond, 15 year old males and 45 to 54 year old females are the most vulnerable to poverty, with 8 males (100.0%) and 27 females (27.3%) in their respective age groups living below the poverty level.
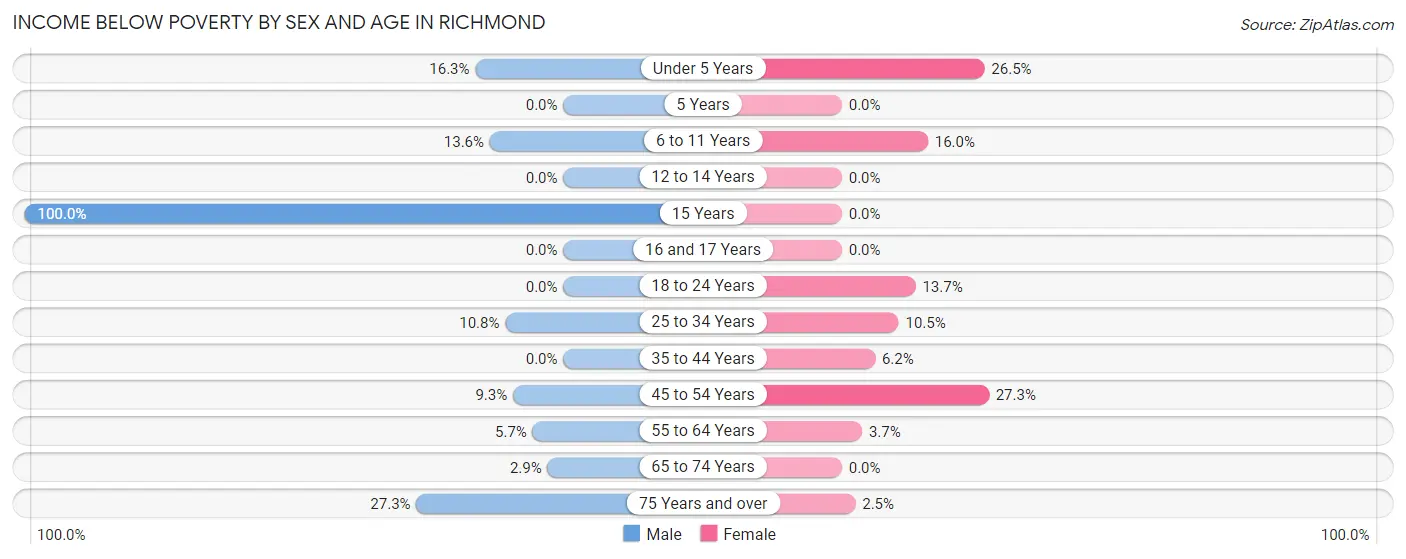
| Age Bracket | Male | Female |
| Under 5 Years | 8 (16.3%) | 9 (26.5%) |
| 5 Years | 0 (0.0%) | 0 (0.0%) |
| 6 to 11 Years | 9 (13.6%) | 15 (16.0%) |
| 12 to 14 Years | 0 (0.0%) | 0 (0.0%) |
| 15 Years | 8 (100.0%) | 0 (0.0%) |
| 16 and 17 Years | 0 (0.0%) | 0 (0.0%) |
| 18 to 24 Years | 0 (0.0%) | 16 (13.7%) |
| 25 to 34 Years | 21 (10.8%) | 18 (10.5%) |
| 35 to 44 Years | 0 (0.0%) | 8 (6.1%) |
| 45 to 54 Years | 7 (9.3%) | 27 (27.3%) |
| 55 to 64 Years | 7 (5.7%) | 7 (3.7%) |
| 65 to 74 Years | 4 (2.9%) | 0 (0.0%) |
| 75 Years and over | 24 (27.3%) | 3 (2.5%) |
| Total | 88 (8.0%) | 103 (9.2%) |
Income Above Poverty by Sex and Age in Richmond
According to the poverty statistics in Richmond, males aged 5 years and females aged 5 years are the age groups that are most secure financially, with 100.0% of males and 100.0% of females in these age groups living above the poverty line.
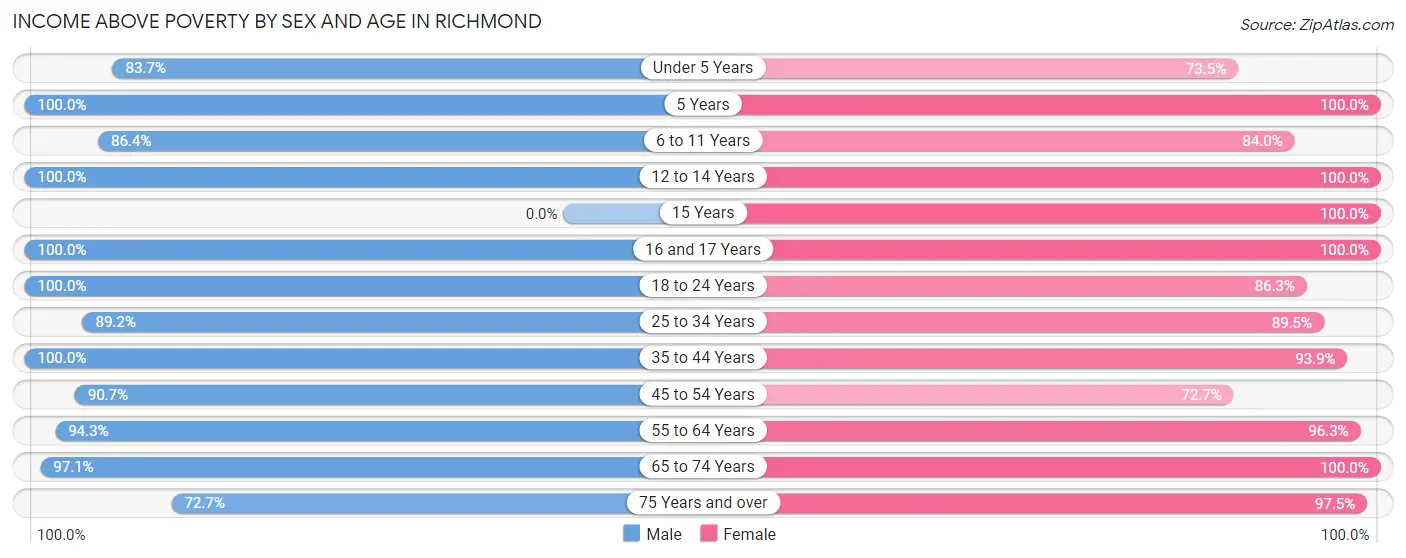
| Age Bracket | Male | Female |
| Under 5 Years | 41 (83.7%) | 25 (73.5%) |
| 5 Years | 21 (100.0%) | 14 (100.0%) |
| 6 to 11 Years | 57 (86.4%) | 79 (84.0%) |
| 12 to 14 Years | 28 (100.0%) | 34 (100.0%) |
| 15 Years | 0 (0.0%) | 7 (100.0%) |
| 16 and 17 Years | 26 (100.0%) | 24 (100.0%) |
| 18 to 24 Years | 111 (100.0%) | 101 (86.3%) |
| 25 to 34 Years | 174 (89.2%) | 153 (89.5%) |
| 35 to 44 Years | 171 (100.0%) | 122 (93.9%) |
| 45 to 54 Years | 68 (90.7%) | 72 (72.7%) |
| 55 to 64 Years | 116 (94.3%) | 180 (96.3%) |
| 65 to 74 Years | 132 (97.1%) | 84 (100.0%) |
| 75 Years and over | 64 (72.7%) | 117 (97.5%) |
| Total | 1,009 (92.0%) | 1,012 (90.8%) |
Income Below Poverty Among Married-Couple Families in Richmond
The poverty statistics for married-couple families in Richmond show that 5.2% or 20 of the total 382 families live below the poverty line. Families with 3 or 4 children have the highest poverty rate of 14.1%, comprising of 9 families. On the other hand, families with no children have the lowest poverty rate of 1.7%, which includes 4 families.
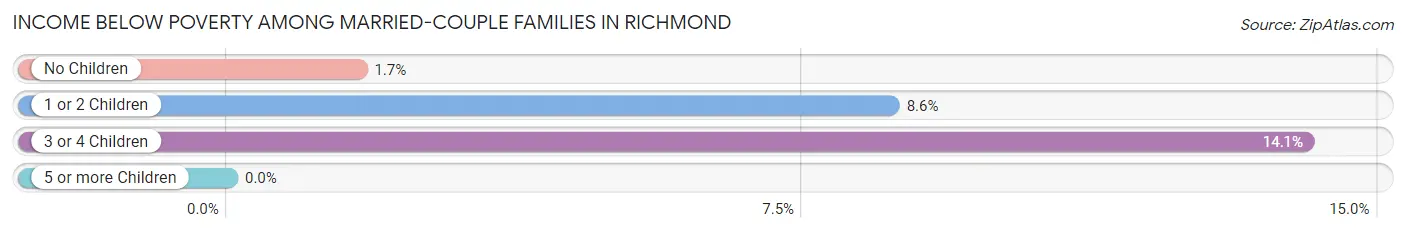
| Children | Above Poverty | Below Poverty |
| No Children | 233 (98.3%) | 4 (1.7%) |
| 1 or 2 Children | 74 (91.4%) | 7 (8.6%) |
| 3 or 4 Children | 55 (85.9%) | 9 (14.1%) |
| 5 or more Children | 0 (0.0%) | 0 (0.0%) |
| Total | 362 (94.8%) | 20 (5.2%) |
Income Below Poverty Among Single-Parent Households in Richmond
| Children | Single Father | Single Mother |
| No Children | 0 (0.0%) | 0 (0.0%) |
| 1 or 2 Children | 0 (0.0%) | 0 (0.0%) |
| 3 or 4 Children | 0 (0.0%) | 0 (0.0%) |
| 5 or more Children | 0 (0.0%) | 0 (0.0%) |
| Total | 0 (0.0%) | 0 (0.0%) |
Income Below Poverty Among Married-Couple vs Single-Parent Households in Richmond
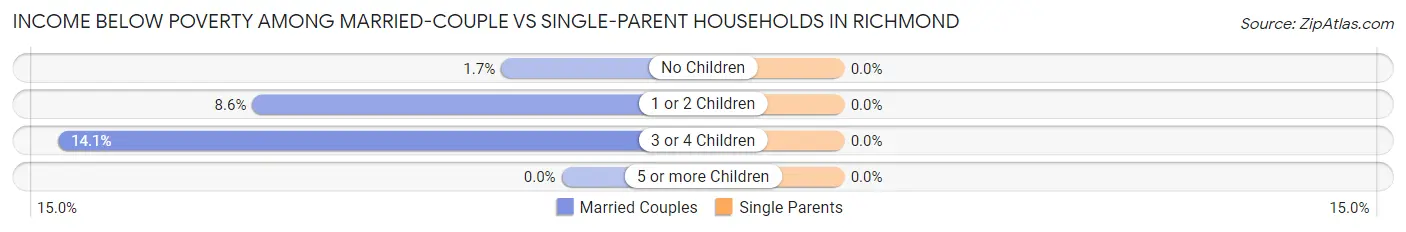
| Children | Married-Couple Families | Single-Parent Households |
| No Children | 4 (1.7%) | 0 (0.0%) |
| 1 or 2 Children | 7 (8.6%) | 0 (0.0%) |
| 3 or 4 Children | 9 (14.1%) | 0 (0.0%) |
| 5 or more Children | 0 (0.0%) | 0 (0.0%) |
| Total | 20 (5.2%) | 0 (0.0%) |
Race in Richmond
The most populous races in Richmond are White / Caucasian (2,013 | 88.8%), Hispanic or Latino (299 | 13.2%), and Two or more Races (239 | 10.5%).
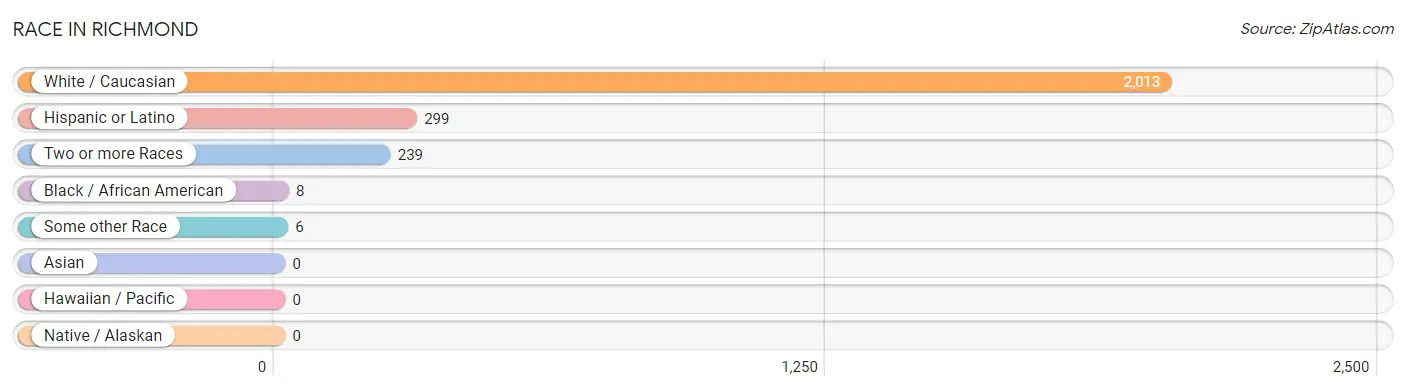
| Race | # Population | % Population |
| Asian | 0 | 0.0% |
| Black / African American | 8 | 0.4% |
| Hawaiian / Pacific | 0 | 0.0% |
| Hispanic or Latino | 299 | 13.2% |
| Native / Alaskan | 0 | 0.0% |
| White / Caucasian | 2,013 | 88.8% |
| Two or more Races | 239 | 10.5% |
| Some other Race | 6 | 0.3% |
| Total | 2,266 | 100.0% |
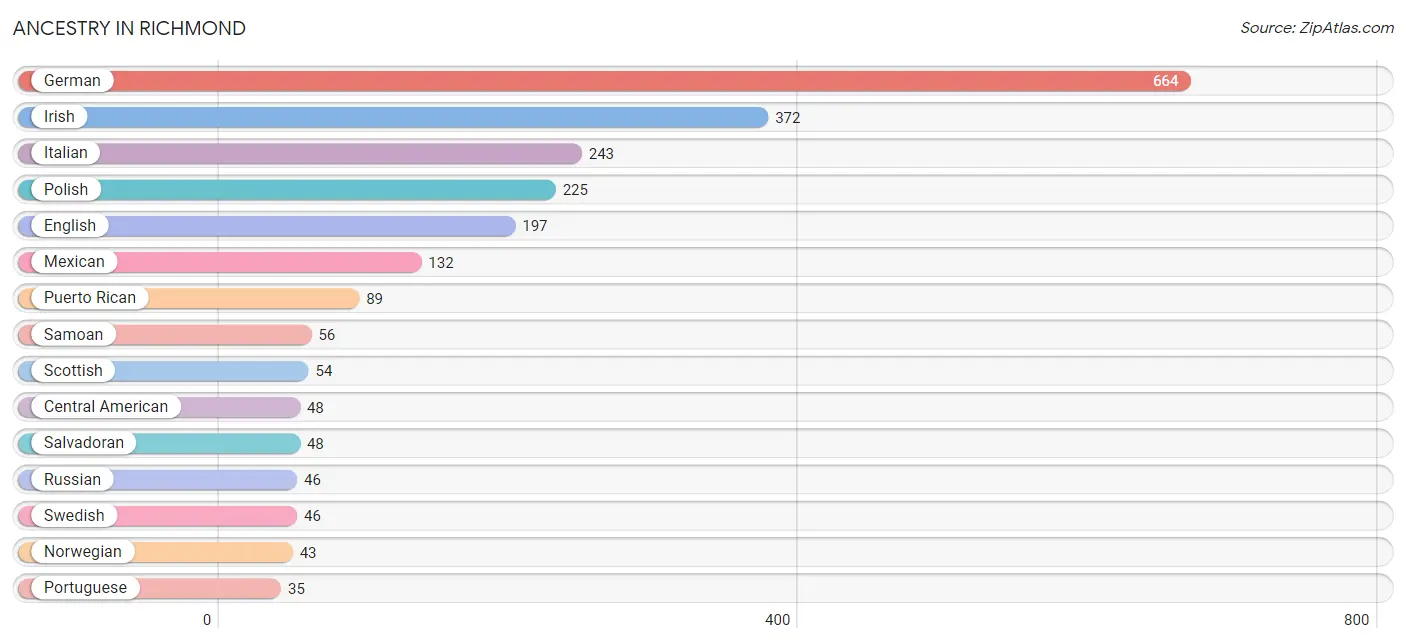
Ancestry in Richmond
The most populous ancestries reported in Richmond are German (664 | 29.3%), Irish (372 | 16.4%), Italian (243 | 10.7%), Polish (225 | 9.9%), and English (197 | 8.7%), together accounting for 75.1% of all Richmond residents.
| Ancestry | # Population | % Population |
| American | 26 | 1.1% |
| Arab | 7 | 0.3% |
| Austrian | 14 | 0.6% |
| Belgian | 7 | 0.3% |
| British | 7 | 0.3% |
| Central American | 48 | 2.1% |
| Chippewa | 10 | 0.4% |
| Croatian | 12 | 0.5% |
| Czech | 26 | 1.1% |
| Czechoslovakian | 8 | 0.4% |
| Danish | 17 | 0.7% |
| Dutch | 17 | 0.7% |
| Eastern European | 9 | 0.4% |
| English | 197 | 8.7% |
| European | 32 | 1.4% |
| French | 18 | 0.8% |
| French Canadian | 5 | 0.2% |
| German | 664 | 29.3% |
| Greek | 6 | 0.3% |
| Hungarian | 13 | 0.6% |
| Irish | 372 | 16.4% |
| Italian | 243 | 10.7% |
| Lithuanian | 32 | 1.4% |
| Mexican | 132 | 5.8% |
| Norwegian | 43 | 1.9% |
| Palestinian | 7 | 0.3% |
| Polish | 225 | 9.9% |
| Portuguese | 35 | 1.5% |
| Puerto Rican | 89 | 3.9% |
| Russian | 46 | 2.0% |
| Salvadoran | 48 | 2.1% |
| Samoan | 56 | 2.5% |
| Scandinavian | 8 | 0.4% |
| Scottish | 54 | 2.4% |
| Slovene | 11 | 0.5% |
| Spaniard | 16 | 0.7% |
| Swedish | 46 | 2.0% |
| Swiss | 7 | 0.3% |
| Welsh | 26 | 1.1% | View All 39 Rows |
Immigrants in Richmond
The most numerous immigrant groups reported in Richmond came from Europe (33 | 1.5%), Austria (18 | 0.8%), Western Europe (18 | 0.8%), England (10 | 0.4%), and Northern Europe (10 | 0.4%), together accounting for 3.9% of all Richmond residents.
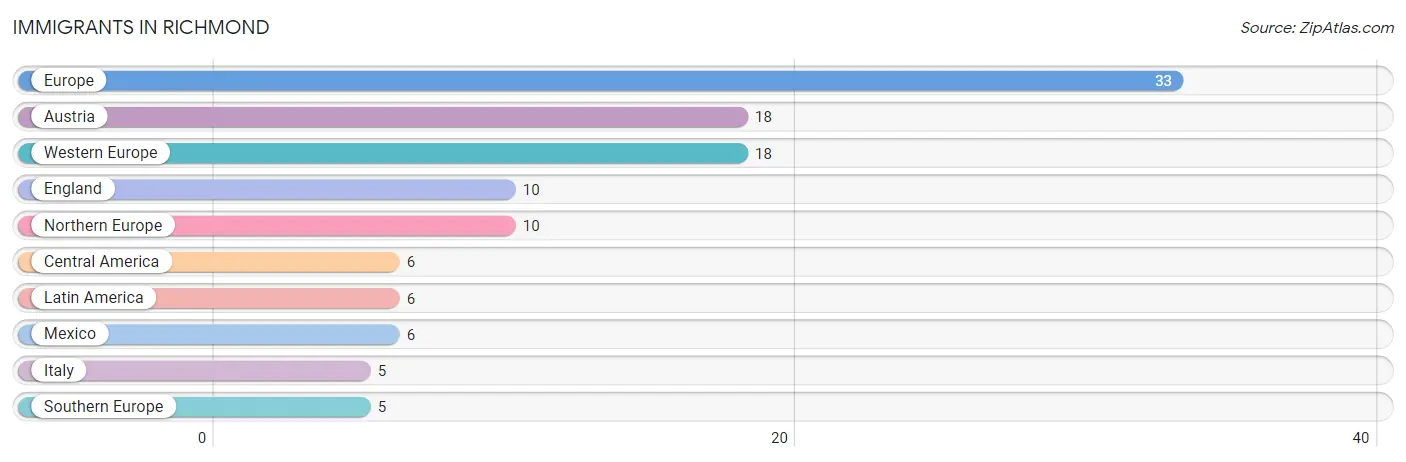
| Immigration Origin | # Population | % Population |
| Austria | 18 | 0.8% |
| Central America | 6 | 0.3% |
| England | 10 | 0.4% |
| Europe | 33 | 1.5% |
| Italy | 5 | 0.2% |
| Latin America | 6 | 0.3% |
| Mexico | 6 | 0.3% |
| Northern Europe | 10 | 0.4% |
| Southern Europe | 5 | 0.2% |
| Western Europe | 18 | 0.8% | View All 10 Rows |
Sex and Age in Richmond
Sex and Age in Richmond
The most populous age groups in Richmond are 25 to 29 Years (105 | 9.1%) for men and 25 to 29 Years (109 | 9.8%) for women.
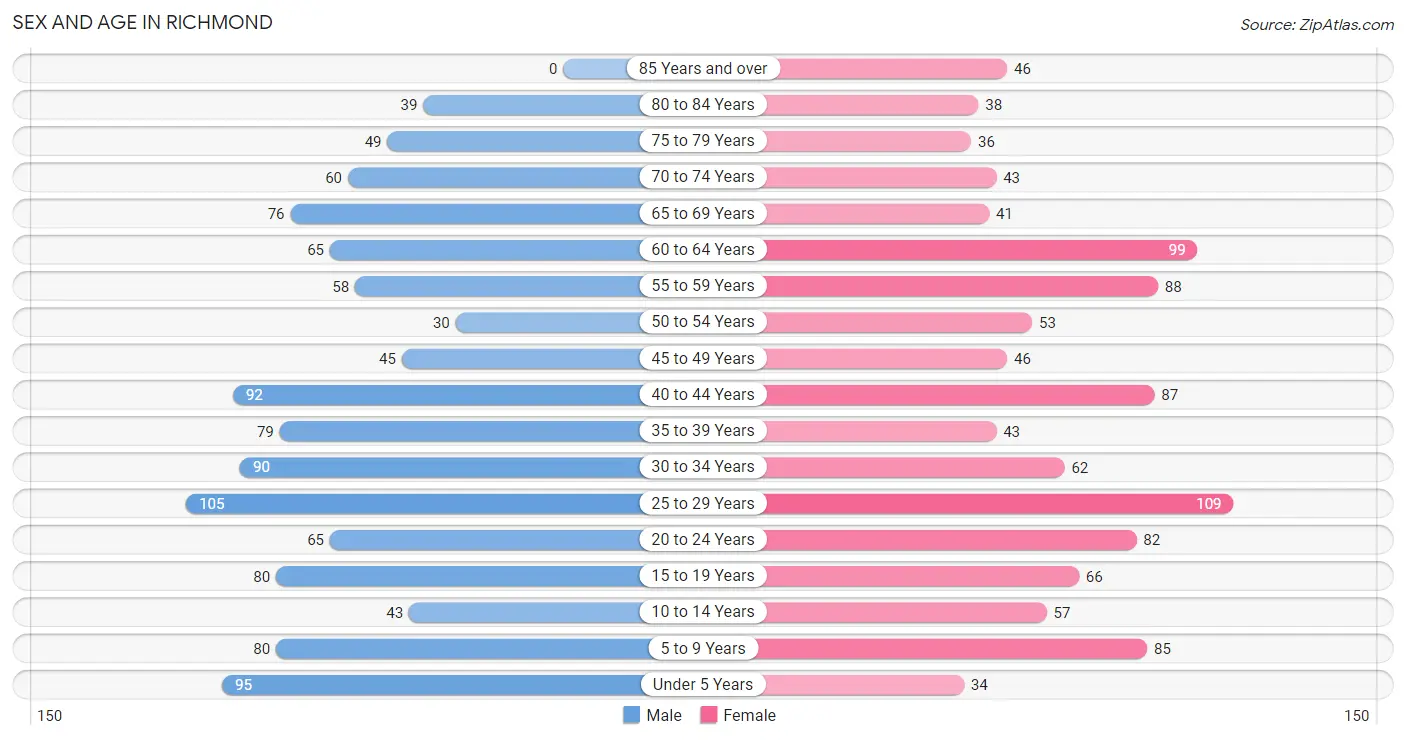
| Age Bracket | Male | Female |
| Under 5 Years | 95 (8.3%) | 34 (3.0%) |
| 5 to 9 Years | 80 (7.0%) | 85 (7.6%) |
| 10 to 14 Years | 43 (3.7%) | 57 (5.1%) |
| 15 to 19 Years | 80 (7.0%) | 66 (5.9%) |
| 20 to 24 Years | 65 (5.7%) | 82 (7.3%) |
| 25 to 29 Years | 105 (9.1%) | 109 (9.8%) |
| 30 to 34 Years | 90 (7.8%) | 62 (5.6%) |
| 35 to 39 Years | 79 (6.9%) | 43 (3.9%) |
| 40 to 44 Years | 92 (8.0%) | 87 (7.8%) |
| 45 to 49 Years | 45 (3.9%) | 46 (4.1%) |
| 50 to 54 Years | 30 (2.6%) | 53 (4.8%) |
| 55 to 59 Years | 58 (5.0%) | 88 (7.9%) |
| 60 to 64 Years | 65 (5.7%) | 99 (8.9%) |
| 65 to 69 Years | 76 (6.6%) | 41 (3.7%) |
| 70 to 74 Years | 60 (5.2%) | 43 (3.9%) |
| 75 to 79 Years | 49 (4.3%) | 36 (3.2%) |
| 80 to 84 Years | 39 (3.4%) | 38 (3.4%) |
| 85 Years and over | 0 (0.0%) | 46 (4.1%) |
| Total | 1,151 (100.0%) | 1,115 (100.0%) |
Families and Households in Richmond
Median Family Size in Richmond
The median family size in Richmond is 2.81 persons per family, with married-couple families (382 | 73.0%) accounting for the largest median family size of 3.02 persons per family. On the other hand, single male/father families (42 | 8.0%) represent the smallest median family size with 2.10 persons per family.
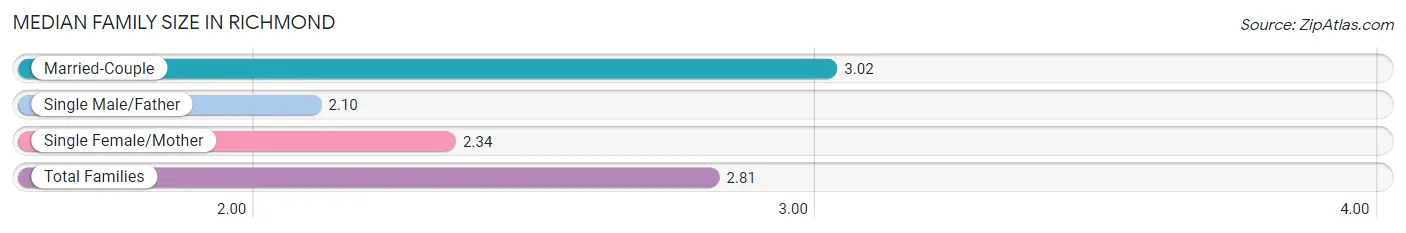
| Family Type | # Families | Family Size |
| Married-Couple | 382 (73.0%) | 3.02 |
| Single Male/Father | 42 (8.0%) | 2.10 |
| Single Female/Mother | 99 (18.9%) | 2.34 |
| Total Families | 523 (100.0%) | 2.81 |
Median Household Size in Richmond
The median household size in Richmond is 2.03 persons per household, with married-couple households (382 | 34.8%) accounting for the largest median household size of 3.02 persons per household. non-family households (575 | 52.4%) represent the smallest median household size with 1.20 persons per household.
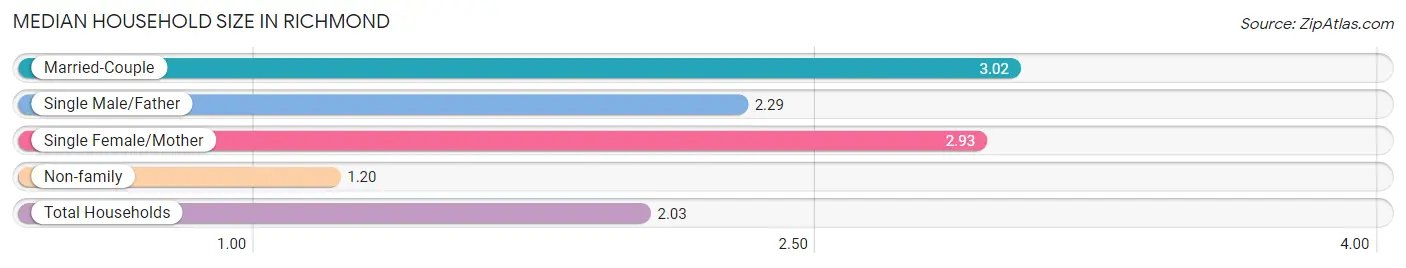
| Household Type | # Households | Household Size |
| Married-Couple | 382 (34.8%) | 3.02 |
| Single Male/Father | 42 (3.8%) | 2.29 |
| Single Female/Mother | 99 (9.0%) | 2.93 |
| Non-family | 575 (52.4%) | 1.20 |
| Total Households | 1,098 (100.0%) | 2.03 |
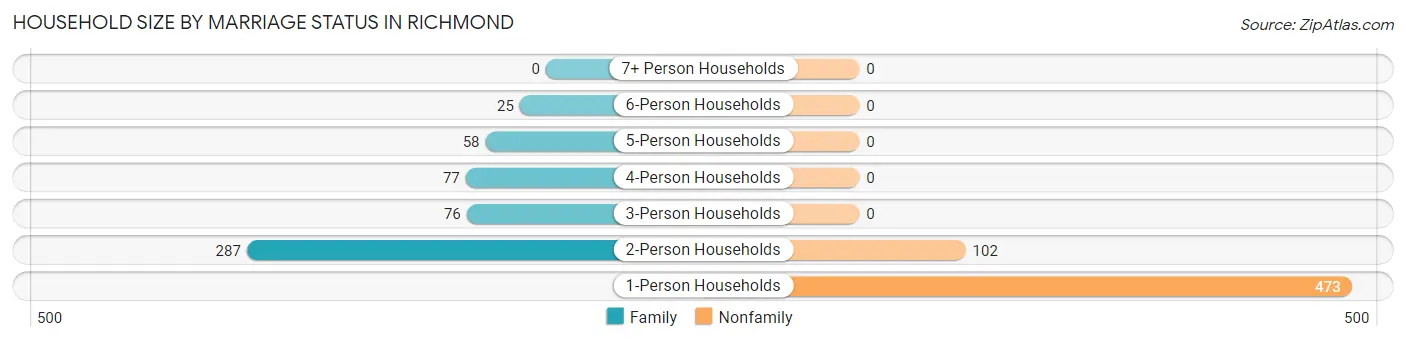
Household Size by Marriage Status in Richmond
Out of a total of 1,098 households in Richmond, 523 (47.6%) are family households, while 575 (52.4%) are nonfamily households. The most numerous type of family households are 2-person households, comprising 287, and the most common type of nonfamily households are 1-person households, comprising 473.
| Household Size | Family Households | Nonfamily Households |
| 1-Person Households | - | 473 (43.1%) |
| 2-Person Households | 287 (26.1%) | 102 (9.3%) |
| 3-Person Households | 76 (6.9%) | 0 (0.0%) |
| 4-Person Households | 77 (7.0%) | 0 (0.0%) |
| 5-Person Households | 58 (5.3%) | 0 (0.0%) |
| 6-Person Households | 25 (2.3%) | 0 (0.0%) |
| 7+ Person Households | 0 (0.0%) | 0 (0.0%) |
| Total | 523 (47.6%) | 575 (52.4%) |
Female Fertility in Richmond
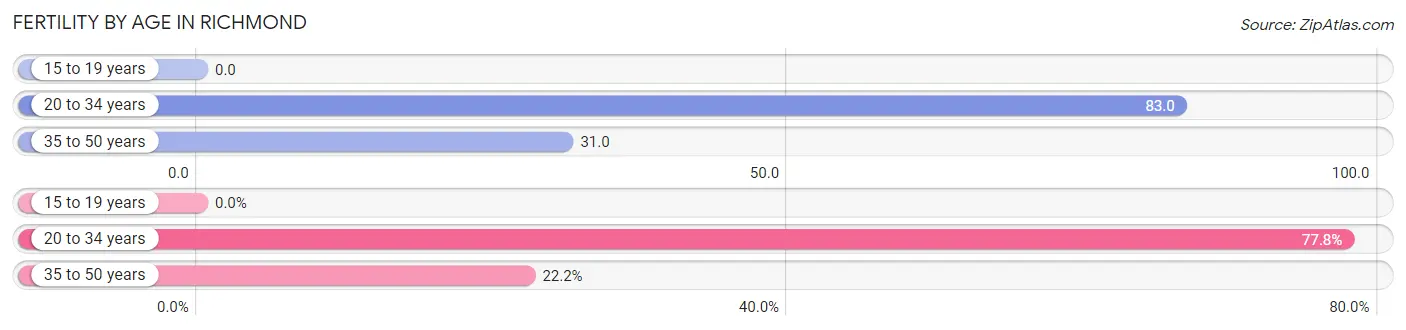
Fertility by Age in Richmond
Average fertility rate in Richmond is 53.0 births per 1,000 women. Women in the age bracket of 20 to 34 years have the highest fertility rate with 83.0 births per 1,000 women. Women in the age bracket of 20 to 34 years acount for 77.8% of all women with births.
| Age Bracket | Women with Births | Births / 1,000 Women |
| 15 to 19 years | 0 (0.0%) | 0.0 |
| 20 to 34 years | 21 (77.8%) | 83.0 |
| 35 to 50 years | 6 (22.2%) | 31.0 |
| Total | 27 (100.0%) | 53.0 |
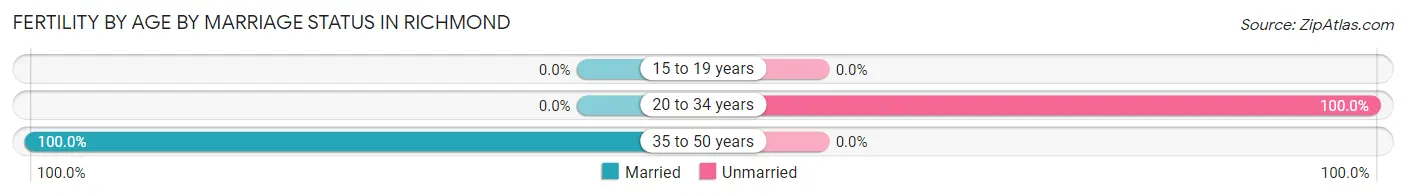
Fertility by Age by Marriage Status in Richmond
22.2% of women with births (27) in Richmond are married. The highest percentage of unmarried women with births falls into 20 to 34 years age bracket with 100.0% of them unmarried at the time of birth, while the lowest percentage of unmarried women with births belong to 35 to 50 years age bracket with 0.0% of them unmarried.
| Age Bracket | Married | Unmarried |
| 15 to 19 years | 0 (0.0%) | 0 (0.0%) |
| 20 to 34 years | 0 (0.0%) | 21 (100.0%) |
| 35 to 50 years | 6 (100.0%) | 0 (0.0%) |
| Total | 6 (22.2%) | 21 (77.8%) |
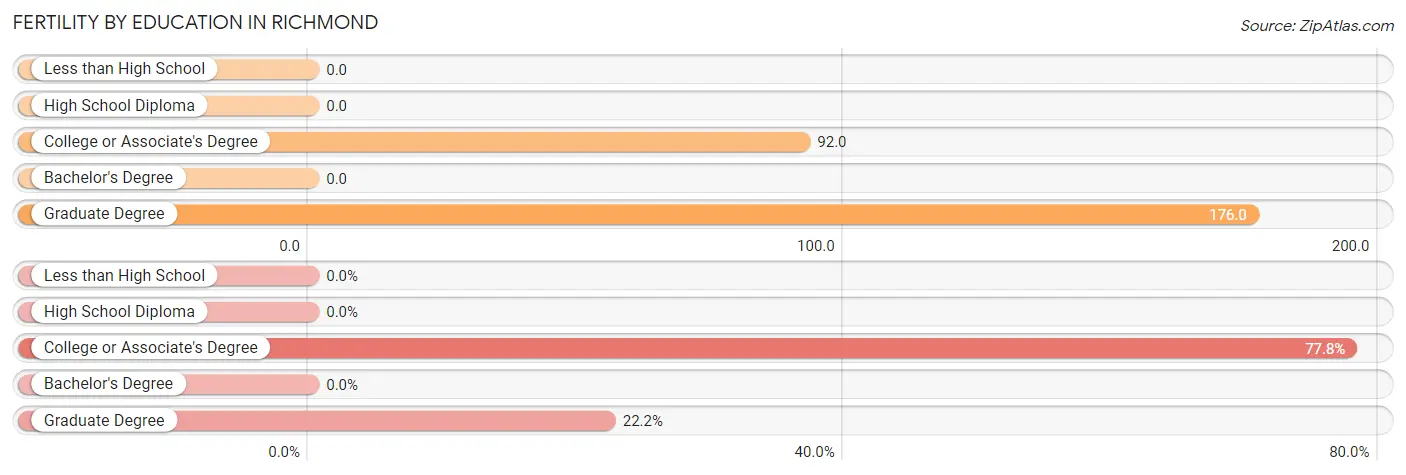
Fertility by Education in Richmond
| Educational Attainment | Women with Births | Births / 1,000 Women |
| Less than High School | 0 (0.0%) | 0.0 |
| High School Diploma | 0 (0.0%) | 0.0 |
| College or Associate's Degree | 21 (77.8%) | 92.0 |
| Bachelor's Degree | 0 (0.0%) | 0.0 |
| Graduate Degree | 6 (22.2%) | 176.0 |
| Total | 27 (100.0%) | 53.0 |
Fertility by Education by Marriage Status in Richmond
77.8% of women with births in Richmond are unmarried. Women with the educational attainment of graduate degree are most likely to be married with 100.0% of them married at childbirth, while women with the educational attainment of college or associate's degree are least likely to be married with 100.0% of them unmarried at childbirth.
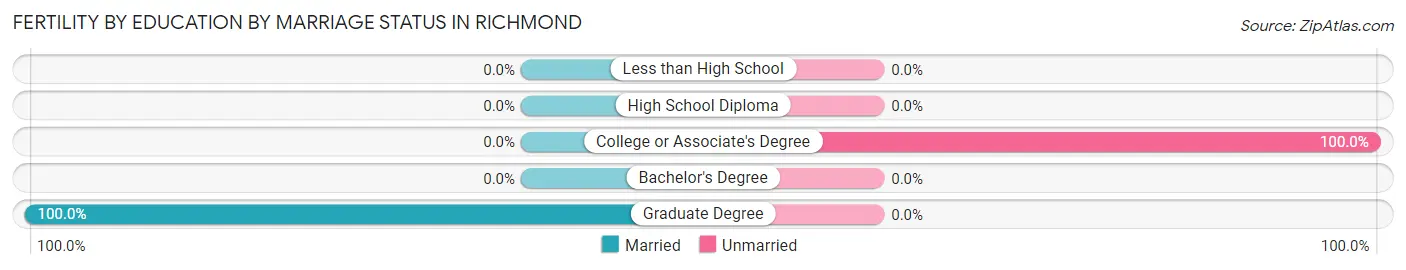
| Educational Attainment | Married | Unmarried |
| Less than High School | 0 (0.0%) | 0 (0.0%) |
| High School Diploma | 0 (0.0%) | 0 (0.0%) |
| College or Associate's Degree | 0 (0.0%) | 21 (100.0%) |
| Bachelor's Degree | 0 (0.0%) | 0 (0.0%) |
| Graduate Degree | 6 (100.0%) | 0 (0.0%) |
| Total | 6 (22.2%) | 21 (77.8%) |
Employment Characteristics in Richmond
Employment by Class of Employer in Richmond
Among the 1,096 employed individuals in Richmond, private company employees (832 | 75.9%), local government employees (92 | 8.4%), and self-employed (not incorporated) (62 | 5.7%) make up the most common classes of employment.
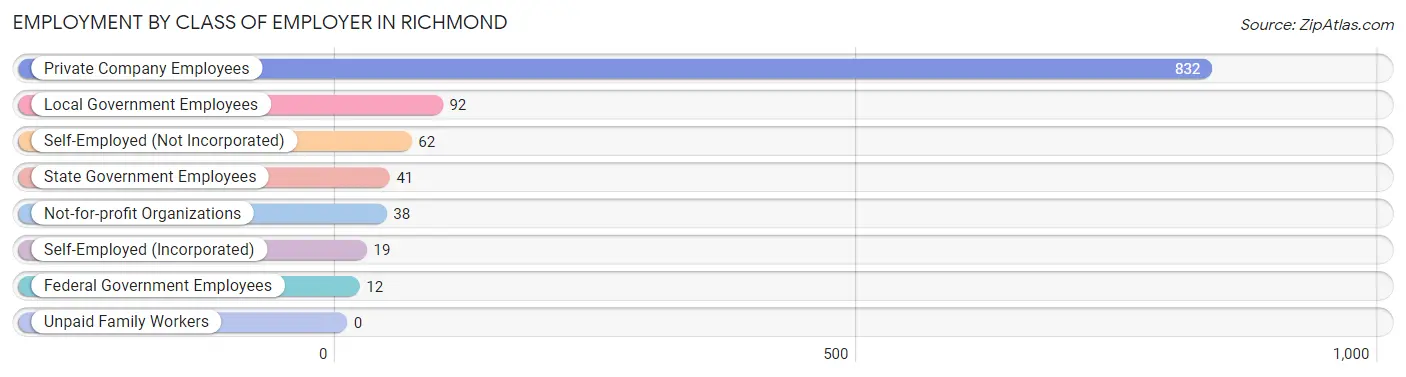
| Employer Class | # Employees | % Employees |
| Private Company Employees | 832 | 75.9% |
| Self-Employed (Incorporated) | 19 | 1.7% |
| Self-Employed (Not Incorporated) | 62 | 5.7% |
| Not-for-profit Organizations | 38 | 3.5% |
| Local Government Employees | 92 | 8.4% |
| State Government Employees | 41 | 3.7% |
| Federal Government Employees | 12 | 1.1% |
| Unpaid Family Workers | 0 | 0.0% |
| Total | 1,096 | 100.0% |
Employment Status by Age in Richmond
According to the labor force statistics for Richmond, out of the total population over 16 years of age (1,857), 67.3% or 1,250 individuals are in the labor force, with 11.4% or 142 of them unemployed. The age group with the highest labor force participation rate is 20 to 24 years, with 100.0% or 147 individuals in the labor force. Within the labor force, the 35 to 44 years age range has the highest percentage of unemployed individuals, with 26.0% or 69 of them being unemployed.
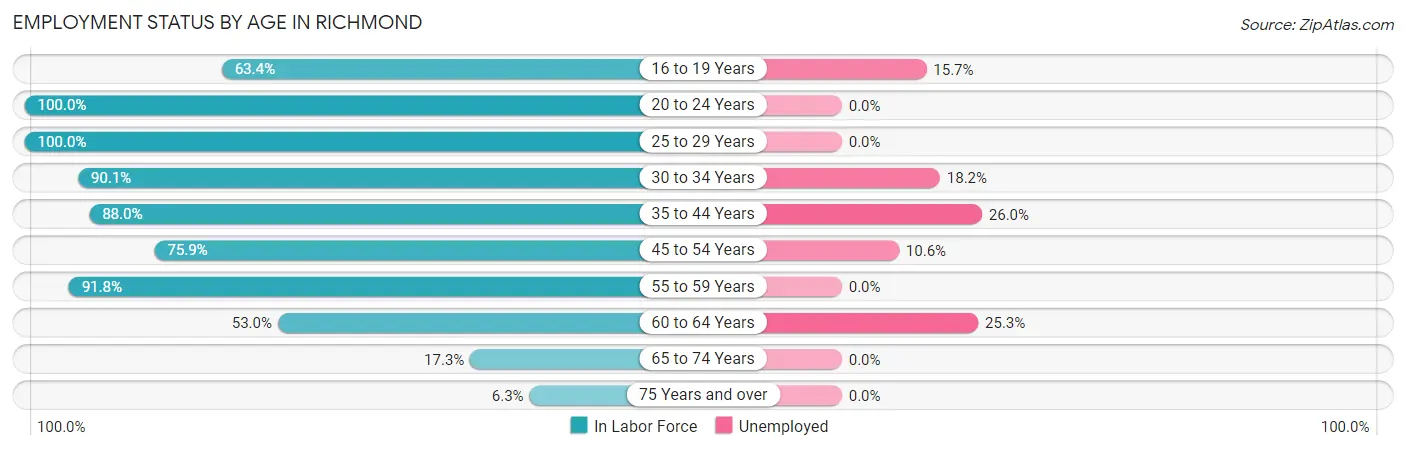
| Age Bracket | In Labor Force | Unemployed |
| 16 to 19 Years | 83 (63.4%) | 13 (15.7%) |
| 20 to 24 Years | 147 (100.0%) | 0 (0.0%) |
| 25 to 29 Years | 214 (100.0%) | 0 (0.0%) |
| 30 to 34 Years | 137 (90.1%) | 25 (18.2%) |
| 35 to 44 Years | 265 (88.0%) | 69 (26.0%) |
| 45 to 54 Years | 132 (75.9%) | 14 (10.6%) |
| 55 to 59 Years | 134 (91.8%) | 0 (0.0%) |
| 60 to 64 Years | 87 (53.0%) | 22 (25.3%) |
| 65 to 74 Years | 38 (17.3%) | 0 (0.0%) |
| 75 Years and over | 13 (6.3%) | 0 (0.0%) |
| Total | 1,250 (67.3%) | 142 (11.4%) |
Employment Status by Educational Attainment in Richmond
According to labor force statistics for Richmond, 84.2% of individuals (969) out of the total population between 25 and 64 years of age (1,151) are in the labor force, with 13.4% or 130 of them being unemployed. The group with the highest labor force participation rate are those with the educational attainment of college / associate degree, with 88.5% or 483 individuals in the labor force. Within the labor force, individuals with less than high school education have the highest percentage of unemployment, with 71.1% or 27 of them being unemployed.
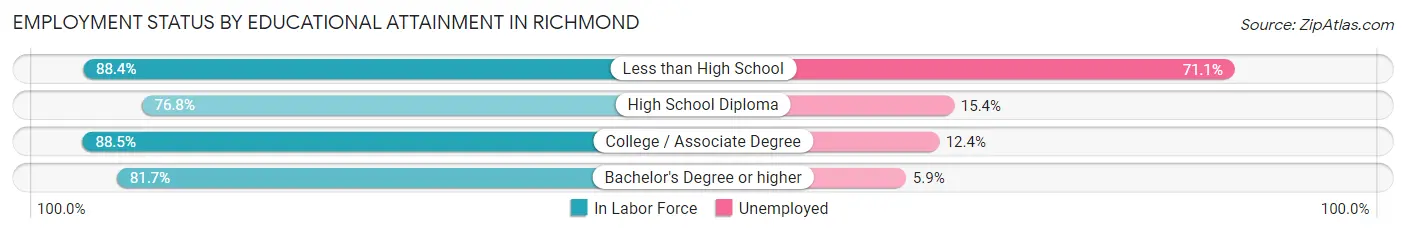
| Educational Attainment | In Labor Force | Unemployed |
| Less than High School | 38 (88.4%) | 31 (71.1%) |
| High School Diploma | 175 (76.8%) | 35 (15.4%) |
| College / Associate Degree | 483 (88.5%) | 68 (12.4%) |
| Bachelor's Degree or higher | 273 (81.7%) | 20 (5.9%) |
| Total | 969 (84.2%) | 154 (13.4%) |
Employment Occupations by Sex in Richmond
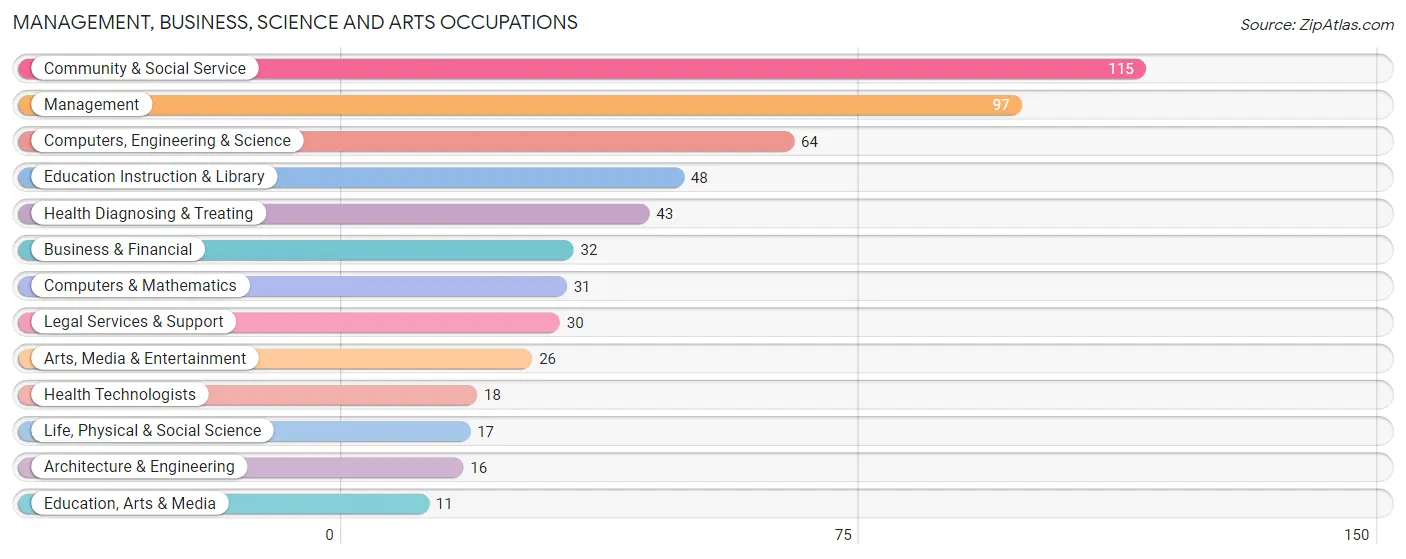
Management, Business, Science and Arts Occupations
The most common Management, Business, Science and Arts occupations in Richmond are Community & Social Service (115 | 10.4%), Management (97 | 8.8%), Computers, Engineering & Science (64 | 5.8%), Education Instruction & Library (48 | 4.3%), and Health Diagnosing & Treating (43 | 3.9%).
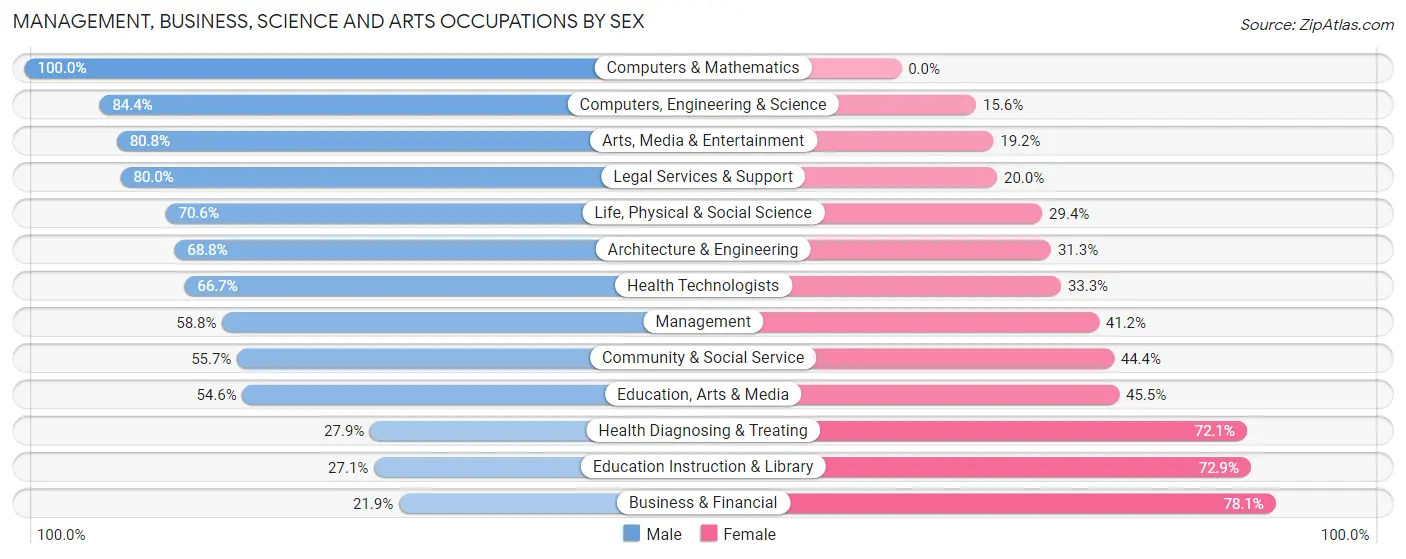
Management, Business, Science and Arts Occupations by Sex
Within the Management, Business, Science and Arts occupations in Richmond, the most male-oriented occupations are Computers & Mathematics (100.0%), Computers, Engineering & Science (84.4%), and Arts, Media & Entertainment (80.8%), while the most female-oriented occupations are Business & Financial (78.1%), Education Instruction & Library (72.9%), and Health Diagnosing & Treating (72.1%).
| Occupation | Male | Female |
| Management | 57 (58.8%) | 40 (41.2%) |
| Business & Financial | 7 (21.9%) | 25 (78.1%) |
| Computers, Engineering & Science | 54 (84.4%) | 10 (15.6%) |
| Computers & Mathematics | 31 (100.0%) | 0 (0.0%) |
| Architecture & Engineering | 11 (68.8%) | 5 (31.2%) |
| Life, Physical & Social Science | 12 (70.6%) | 5 (29.4%) |
| Community & Social Service | 64 (55.6%) | 51 (44.4%) |
| Education, Arts & Media | 6 (54.5%) | 5 (45.5%) |
| Legal Services & Support | 24 (80.0%) | 6 (20.0%) |
| Education Instruction & Library | 13 (27.1%) | 35 (72.9%) |
| Arts, Media & Entertainment | 21 (80.8%) | 5 (19.2%) |
| Health Diagnosing & Treating | 12 (27.9%) | 31 (72.1%) |
| Health Technologists | 12 (66.7%) | 6 (33.3%) |
| Total (Category) | 194 (55.3%) | 157 (44.7%) |
| Total (Overall) | 571 (51.6%) | 536 (48.4%) |
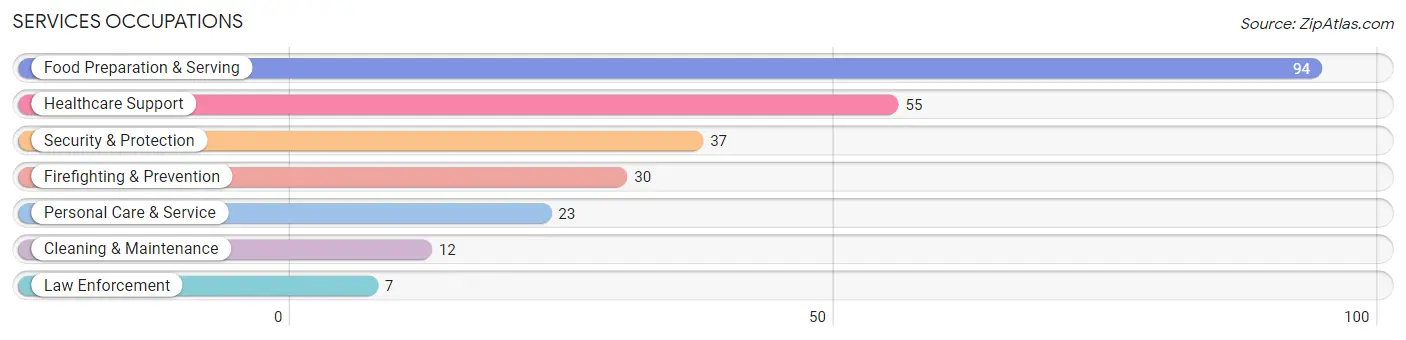
Services Occupations
The most common Services occupations in Richmond are Food Preparation & Serving (94 | 8.5%), Healthcare Support (55 | 5.0%), Security & Protection (37 | 3.3%), Firefighting & Prevention (30 | 2.7%), and Personal Care & Service (23 | 2.1%).
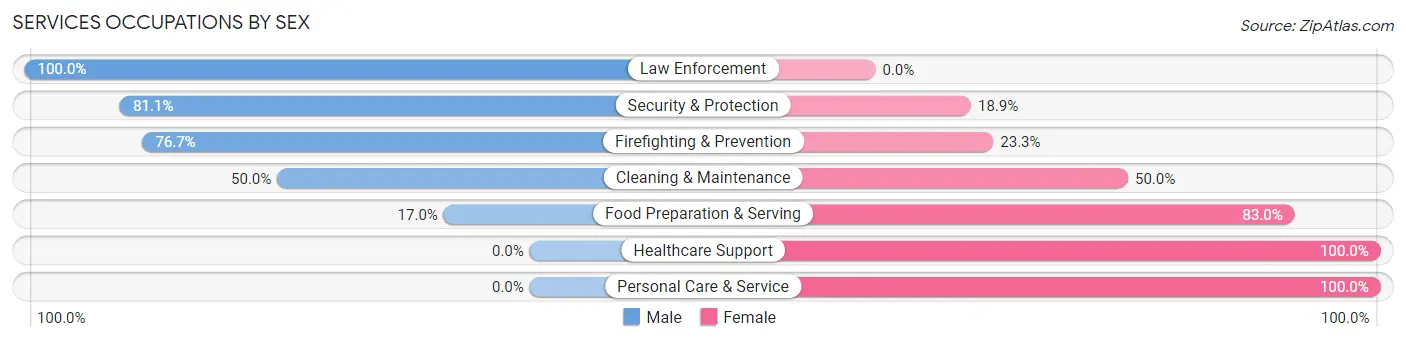
Services Occupations by Sex
Within the Services occupations in Richmond, the most male-oriented occupations are Law Enforcement (100.0%), Security & Protection (81.1%), and Firefighting & Prevention (76.7%), while the most female-oriented occupations are Healthcare Support (100.0%), Personal Care & Service (100.0%), and Food Preparation & Serving (83.0%).
| Occupation | Male | Female |
| Healthcare Support | 0 (0.0%) | 55 (100.0%) |
| Security & Protection | 30 (81.1%) | 7 (18.9%) |
| Firefighting & Prevention | 23 (76.7%) | 7 (23.3%) |
| Law Enforcement | 7 (100.0%) | 0 (0.0%) |
| Food Preparation & Serving | 16 (17.0%) | 78 (83.0%) |
| Cleaning & Maintenance | 6 (50.0%) | 6 (50.0%) |
| Personal Care & Service | 0 (0.0%) | 23 (100.0%) |
| Total (Category) | 52 (23.5%) | 169 (76.5%) |
| Total (Overall) | 571 (51.6%) | 536 (48.4%) |
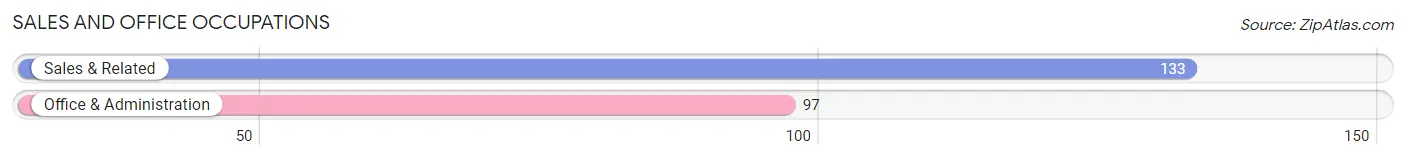
Sales and Office Occupations
The most common Sales and Office occupations in Richmond are Sales & Related (133 | 12.0%), and Office & Administration (97 | 8.8%).
Sales and Office Occupations by Sex
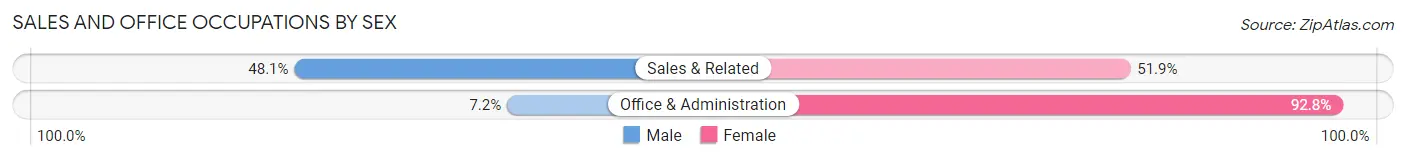
| Occupation | Male | Female |
| Sales & Related | 64 (48.1%) | 69 (51.9%) |
| Office & Administration | 7 (7.2%) | 90 (92.8%) |
| Total (Category) | 71 (30.9%) | 159 (69.1%) |
| Total (Overall) | 571 (51.6%) | 536 (48.4%) |
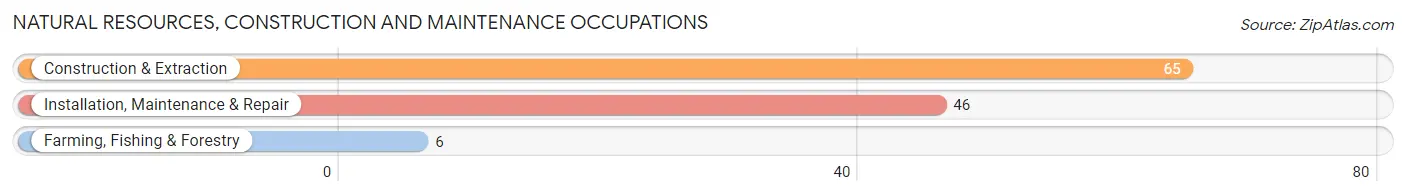
Natural Resources, Construction and Maintenance Occupations
The most common Natural Resources, Construction and Maintenance occupations in Richmond are Construction & Extraction (65 | 5.9%), Installation, Maintenance & Repair (46 | 4.2%), and Farming, Fishing & Forestry (6 | 0.5%).
Natural Resources, Construction and Maintenance Occupations by Sex
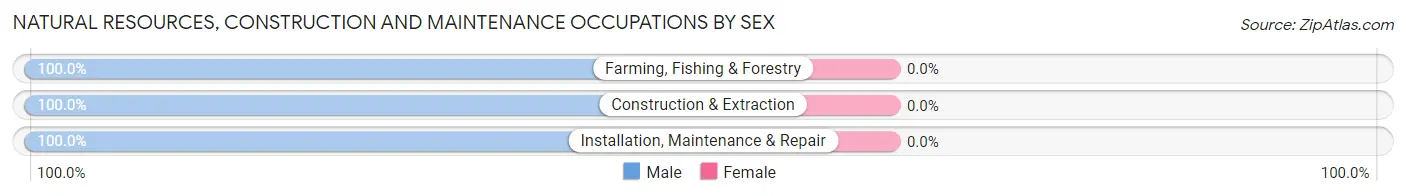
| Occupation | Male | Female |
| Farming, Fishing & Forestry | 6 (100.0%) | 0 (0.0%) |
| Construction & Extraction | 65 (100.0%) | 0 (0.0%) |
| Installation, Maintenance & Repair | 46 (100.0%) | 0 (0.0%) |
| Total (Category) | 117 (100.0%) | 0 (0.0%) |
| Total (Overall) | 571 (51.6%) | 536 (48.4%) |
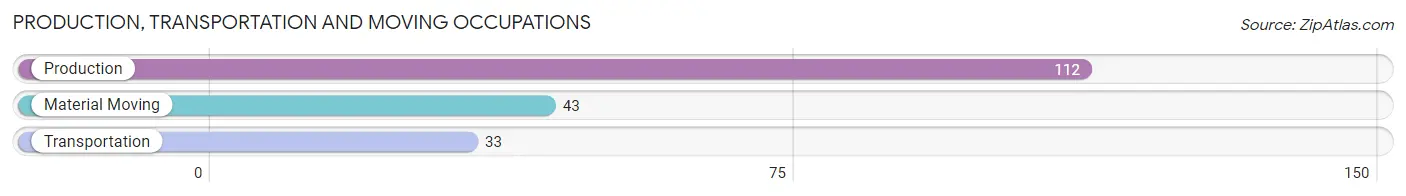
Production, Transportation and Moving Occupations
The most common Production, Transportation and Moving occupations in Richmond are Production (112 | 10.1%), Material Moving (43 | 3.9%), and Transportation (33 | 3.0%).
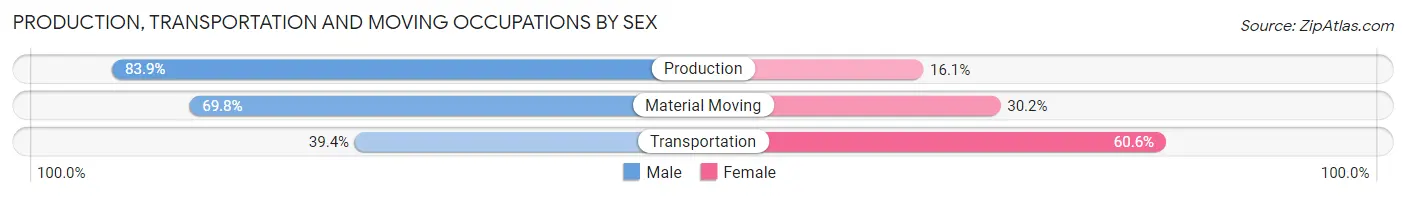
Production, Transportation and Moving Occupations by Sex
| Occupation | Male | Female |
| Production | 94 (83.9%) | 18 (16.1%) |
| Transportation | 13 (39.4%) | 20 (60.6%) |
| Material Moving | 30 (69.8%) | 13 (30.2%) |
| Total (Category) | 137 (72.9%) | 51 (27.1%) |
| Total (Overall) | 571 (51.6%) | 536 (48.4%) |
Employment Industries by Sex in Richmond
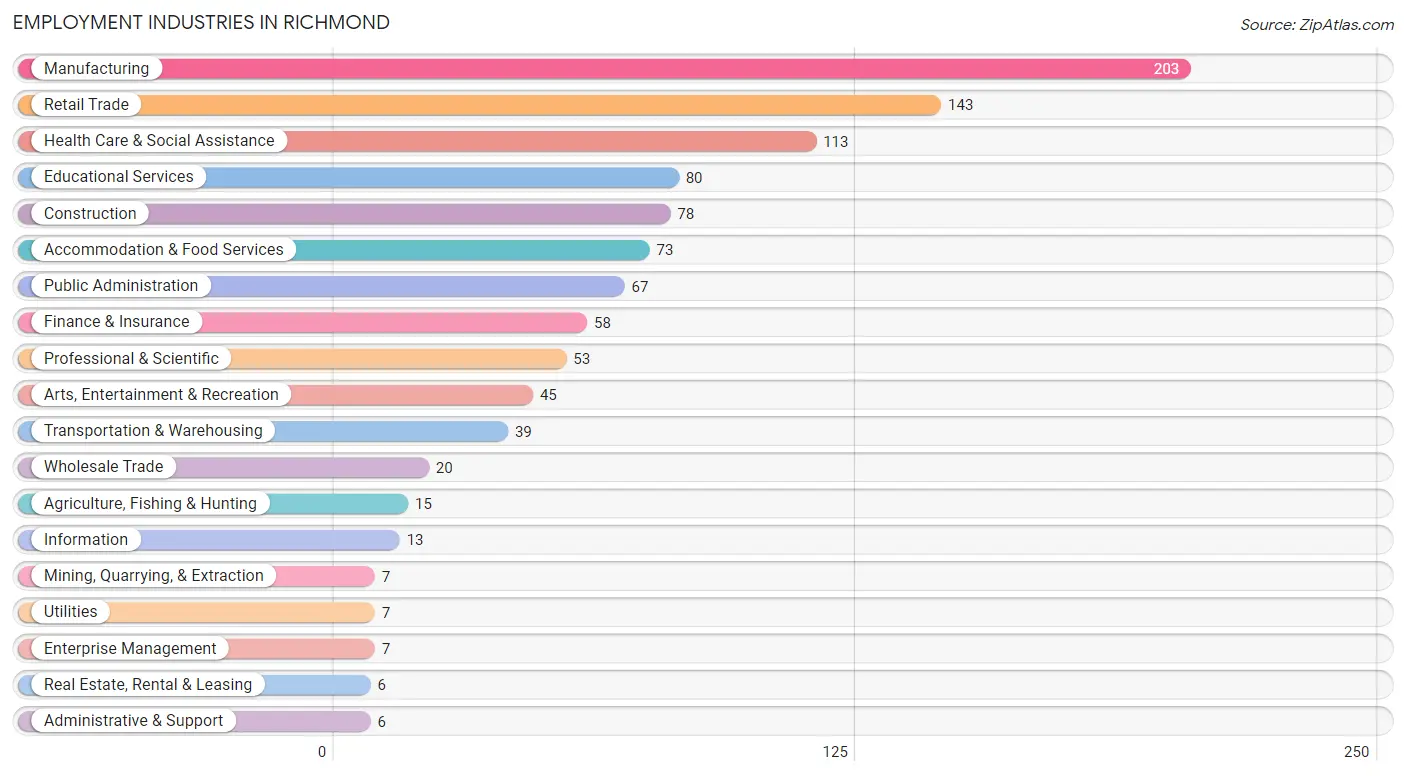
Employment Industries in Richmond
The major employment industries in Richmond include Manufacturing (203 | 18.3%), Retail Trade (143 | 12.9%), Health Care & Social Assistance (113 | 10.2%), Educational Services (80 | 7.2%), and Construction (78 | 7.0%).
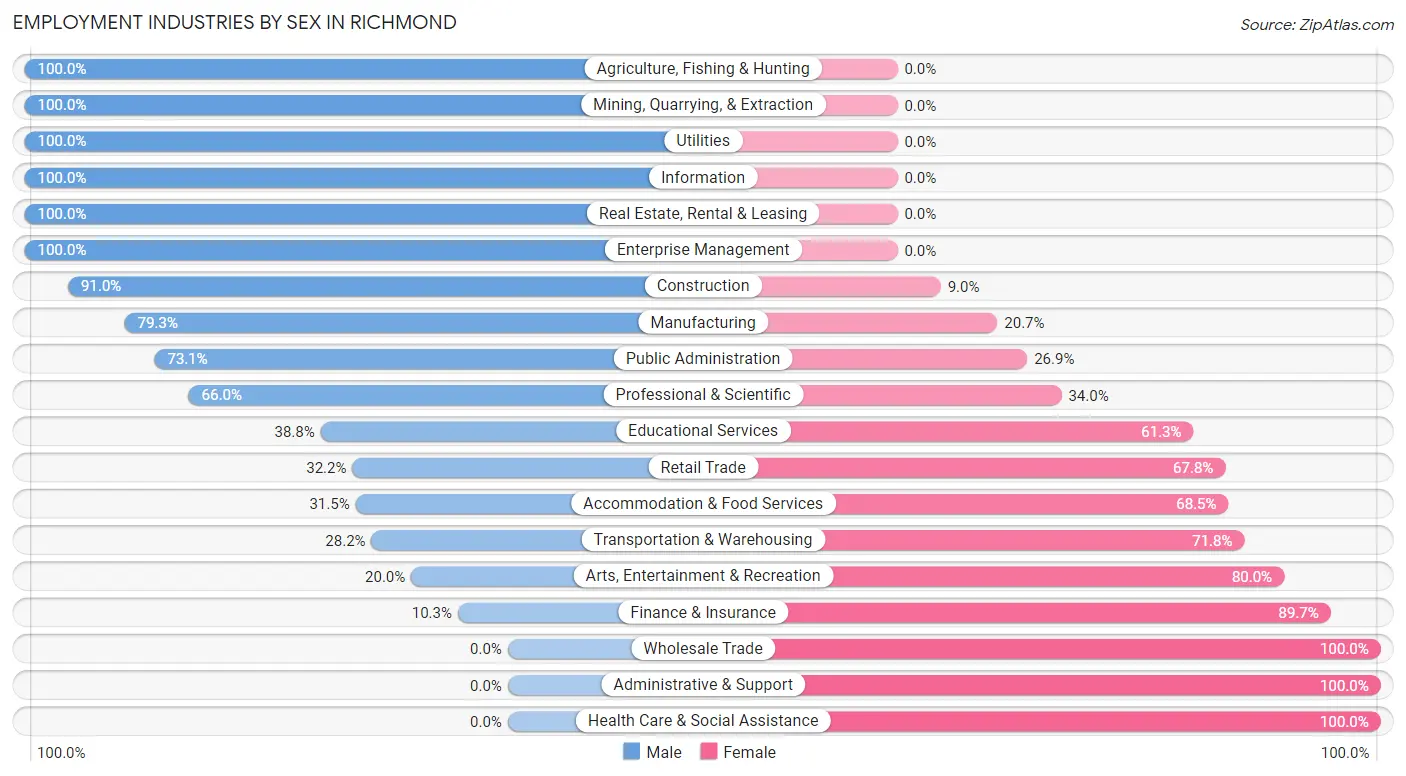
Employment Industries by Sex in Richmond
The Richmond industries that see more men than women are Agriculture, Fishing & Hunting (100.0%), Mining, Quarrying, & Extraction (100.0%), and Utilities (100.0%), whereas the industries that tend to have a higher number of women are Wholesale Trade (100.0%), Administrative & Support (100.0%), and Health Care & Social Assistance (100.0%).
| Industry | Male | Female |
| Agriculture, Fishing & Hunting | 15 (100.0%) | 0 (0.0%) |
| Mining, Quarrying, & Extraction | 7 (100.0%) | 0 (0.0%) |
| Construction | 71 (91.0%) | 7 (9.0%) |
| Manufacturing | 161 (79.3%) | 42 (20.7%) |
| Wholesale Trade | 0 (0.0%) | 20 (100.0%) |
| Retail Trade | 46 (32.2%) | 97 (67.8%) |
| Transportation & Warehousing | 11 (28.2%) | 28 (71.8%) |
| Utilities | 7 (100.0%) | 0 (0.0%) |
| Information | 13 (100.0%) | 0 (0.0%) |
| Finance & Insurance | 6 (10.3%) | 52 (89.7%) |
| Real Estate, Rental & Leasing | 6 (100.0%) | 0 (0.0%) |
| Professional & Scientific | 35 (66.0%) | 18 (34.0%) |
| Enterprise Management | 7 (100.0%) | 0 (0.0%) |
| Administrative & Support | 0 (0.0%) | 6 (100.0%) |
| Educational Services | 31 (38.8%) | 49 (61.3%) |
| Health Care & Social Assistance | 0 (0.0%) | 113 (100.0%) |
| Arts, Entertainment & Recreation | 9 (20.0%) | 36 (80.0%) |
| Accommodation & Food Services | 23 (31.5%) | 50 (68.5%) |
| Public Administration | 49 (73.1%) | 18 (26.9%) |
| Total | 571 (51.6%) | 536 (48.4%) |
Education in Richmond
School Enrollment in Richmond
The most common levels of schooling among the 436 students in Richmond are college / undergraduate (101 | 23.2%), elementary school (99 | 22.7%), and high school (97 | 22.3%).
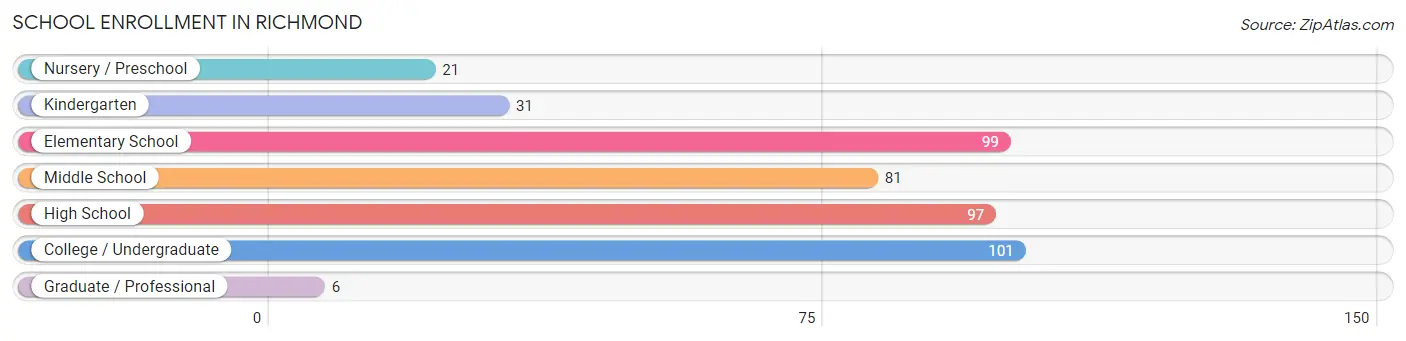
| School Level | # Students | % Students |
| Nursery / Preschool | 21 | 4.8% |
| Kindergarten | 31 | 7.1% |
| Elementary School | 99 | 22.7% |
| Middle School | 81 | 18.6% |
| High School | 97 | 22.3% |
| College / Undergraduate | 101 | 23.2% |
| Graduate / Professional | 6 | 1.4% |
| Total | 436 | 100.0% |
School Enrollment by Age by Funding Source in Richmond
Out of a total of 436 students who are enrolled in schools in Richmond, 25 (5.7%) attend a private institution, while the remaining 411 (94.3%) are enrolled in public schools. The age group of 3 to 4 year olds has the highest likelihood of being enrolled in private schools, with 6 (40.0% in the age bracket) enrolled. Conversely, the age group of 10 to 14 year olds has the lowest likelihood of being enrolled in a private school, with 87 (100.0% in the age bracket) attending a public institution.
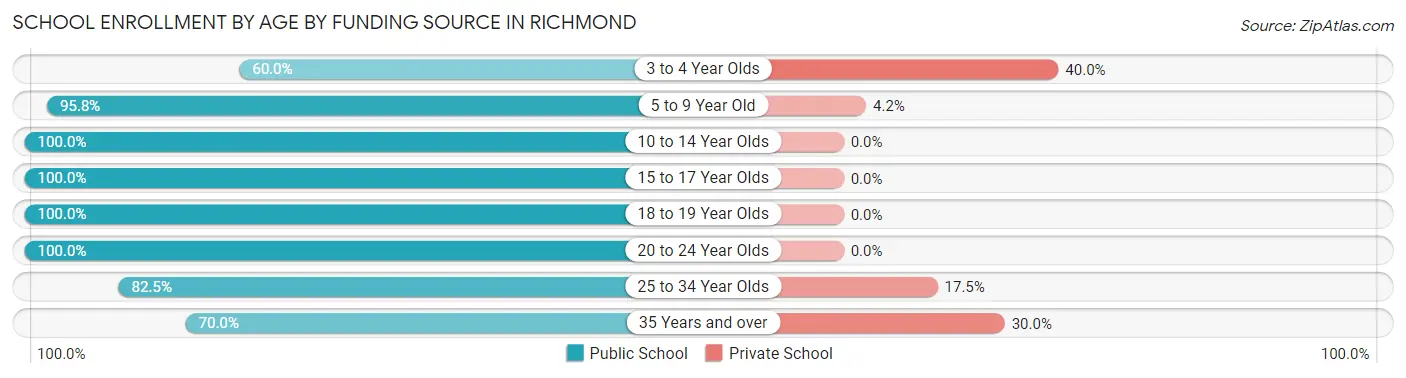
| Age Bracket | Public School | Private School |
| 3 to 4 Year Olds | 9 (60.0%) | 6 (40.0%) |
| 5 to 9 Year Old | 138 (95.8%) | 6 (4.2%) |
| 10 to 14 Year Olds | 87 (100.0%) | 0 (0.0%) |
| 15 to 17 Year Olds | 57 (100.0%) | 0 (0.0%) |
| 18 to 19 Year Olds | 39 (100.0%) | 0 (0.0%) |
| 20 to 24 Year Olds | 34 (100.0%) | 0 (0.0%) |
| 25 to 34 Year Olds | 33 (82.5%) | 7 (17.5%) |
| 35 Years and over | 14 (70.0%) | 6 (30.0%) |
| Total | 411 (94.3%) | 25 (5.7%) |
Educational Attainment by Field of Study in Richmond
Business (165 | 36.0%), science & technology (52 | 11.4%), education (42 | 9.2%), visual & performing arts (41 | 8.9%), and arts & humanities (35 | 7.6%) are the most common fields of study among 458 individuals in Richmond who have obtained a bachelor's degree or higher.
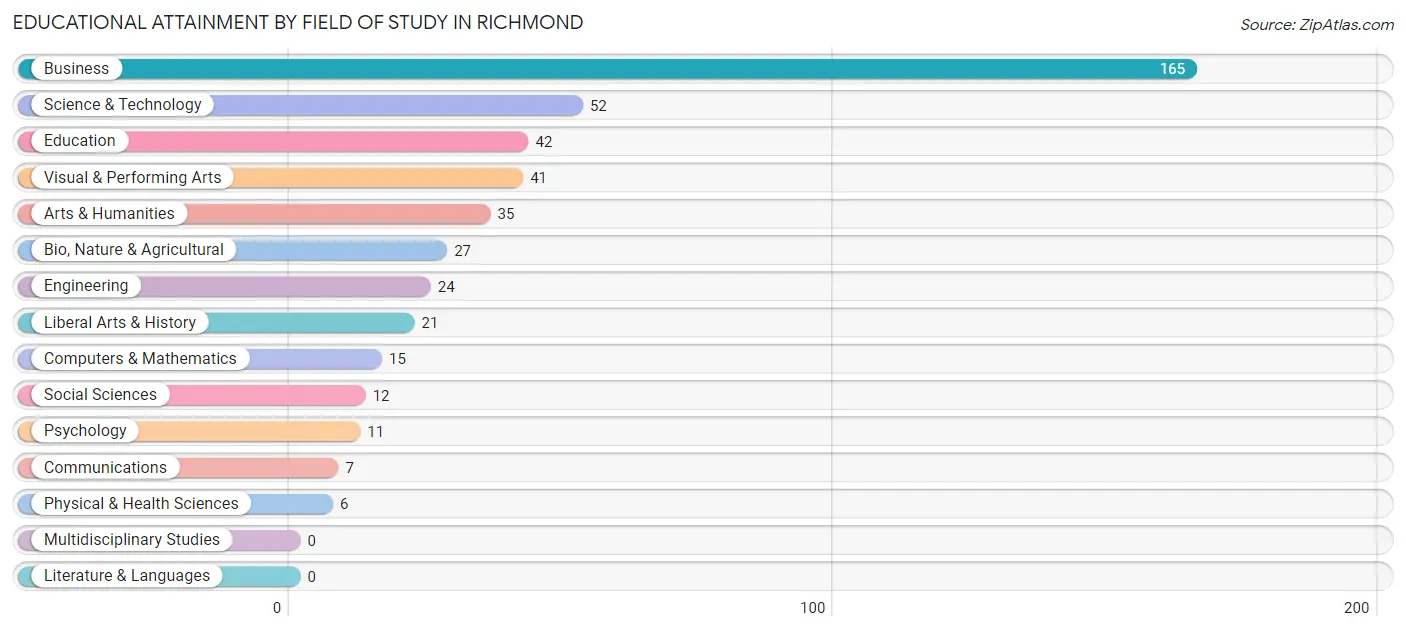
| Field of Study | # Graduates | % Graduates |
| Computers & Mathematics | 15 | 3.3% |
| Bio, Nature & Agricultural | 27 | 5.9% |
| Physical & Health Sciences | 6 | 1.3% |
| Psychology | 11 | 2.4% |
| Social Sciences | 12 | 2.6% |
| Engineering | 24 | 5.2% |
| Multidisciplinary Studies | 0 | 0.0% |
| Science & Technology | 52 | 11.4% |
| Business | 165 | 36.0% |
| Education | 42 | 9.2% |
| Literature & Languages | 0 | 0.0% |
| Liberal Arts & History | 21 | 4.6% |
| Visual & Performing Arts | 41 | 8.9% |
| Communications | 7 | 1.5% |
| Arts & Humanities | 35 | 7.6% |
| Total | 458 | 100.0% |
Transportation & Commute in Richmond
Vehicle Availability by Sex in Richmond
The most prevalent vehicle ownership categories in Richmond are males with 2 vehicles (253, accounting for 44.3%) and females with 2 vehicles (227, making up 48.2%).
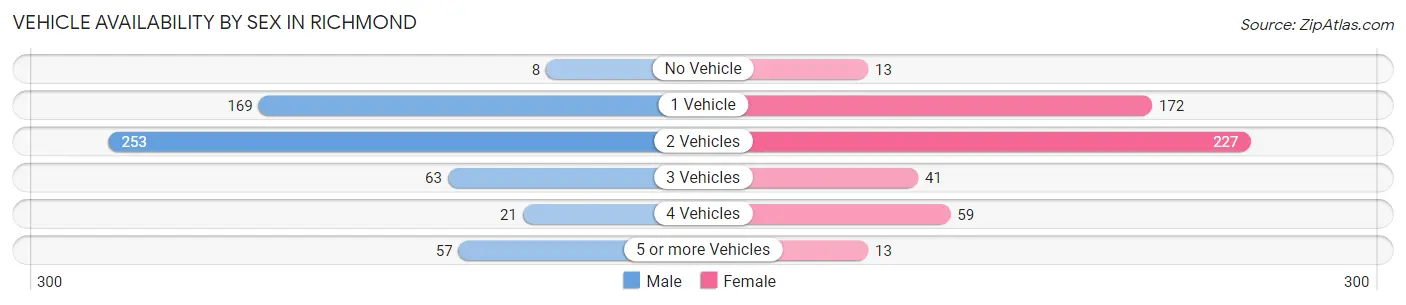
| Vehicles Available | Male | Female |
| No Vehicle | 8 (1.4%) | 13 (2.5%) |
| 1 Vehicle | 169 (29.6%) | 172 (32.8%) |
| 2 Vehicles | 253 (44.3%) | 227 (43.2%) |
| 3 Vehicles | 63 (11.0%) | 41 (7.8%) |
| 4 Vehicles | 21 (3.7%) | 59 (11.2%) |
| 5 or more Vehicles | 57 (10.0%) | 13 (2.5%) |
| Total | 571 (100.0%) | 525 (100.0%) |
Commute Time in Richmond
The most frequently occuring commute durations in Richmond are 25 to 29 minutes (195 commuters, 19.4%), 40 to 44 minutes (125 commuters, 12.4%), and 20 to 24 minutes (103 commuters, 10.3%).
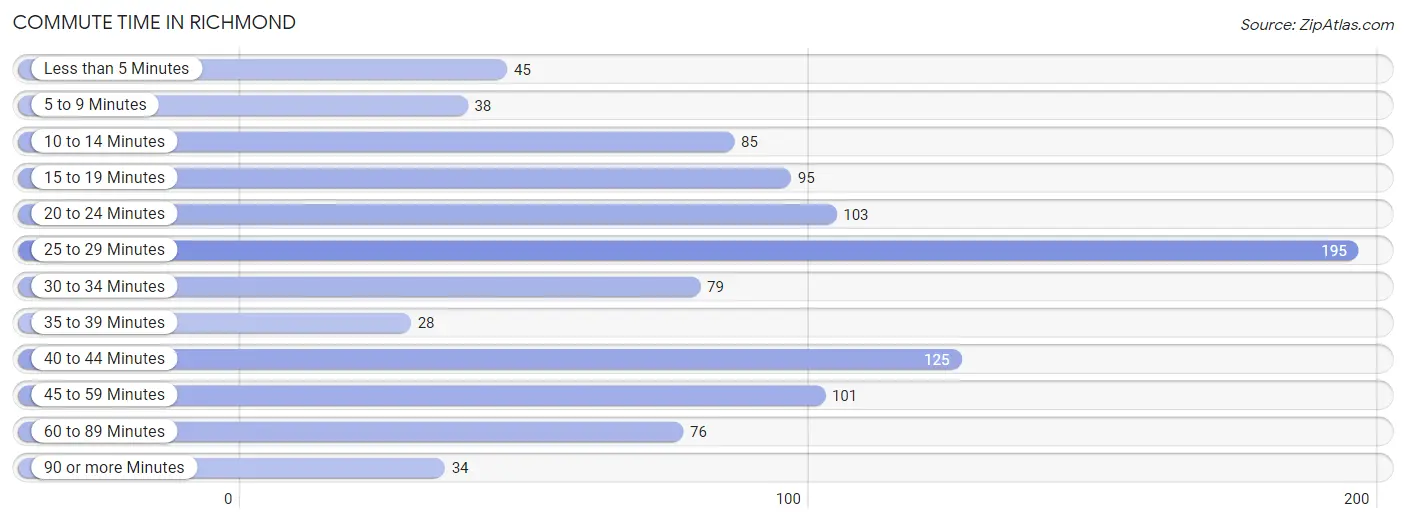
| Commute Time | # Commuters | % Commuters |
| Less than 5 Minutes | 45 | 4.5% |
| 5 to 9 Minutes | 38 | 3.8% |
| 10 to 14 Minutes | 85 | 8.5% |
| 15 to 19 Minutes | 95 | 9.5% |
| 20 to 24 Minutes | 103 | 10.3% |
| 25 to 29 Minutes | 195 | 19.4% |
| 30 to 34 Minutes | 79 | 7.9% |
| 35 to 39 Minutes | 28 | 2.8% |
| 40 to 44 Minutes | 125 | 12.4% |
| 45 to 59 Minutes | 101 | 10.1% |
| 60 to 89 Minutes | 76 | 7.6% |
| 90 or more Minutes | 34 | 3.4% |
Commute Time by Sex in Richmond
The most common commute times in Richmond are 25 to 29 minutes (95 commuters, 18.3%) for males and 25 to 29 minutes (100 commuters, 20.7%) for females.
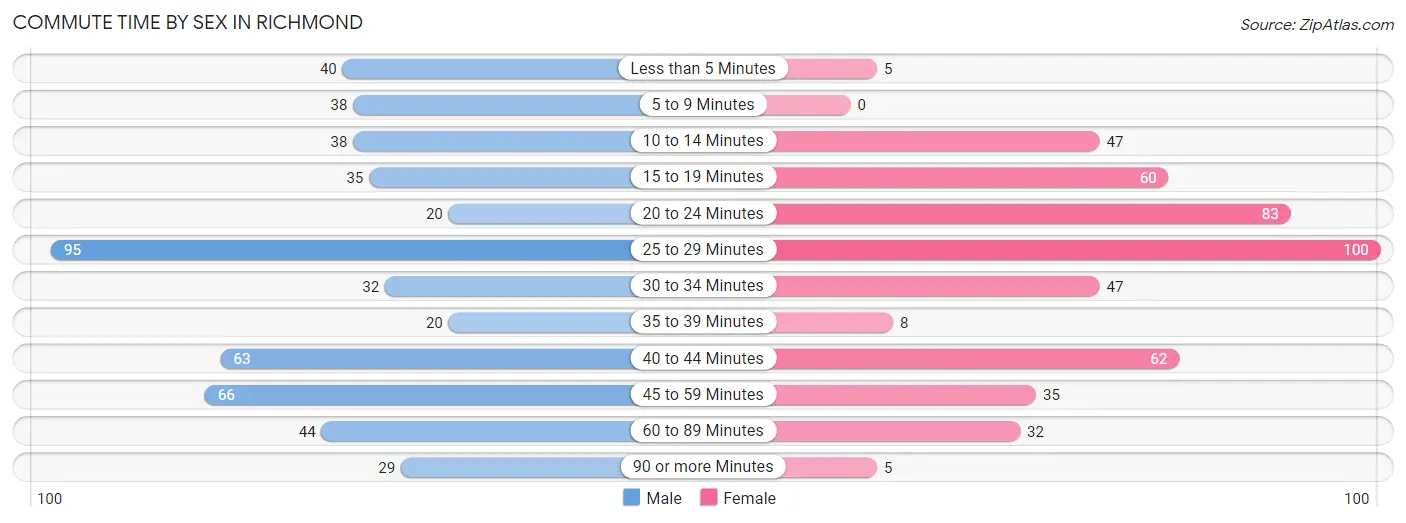
| Commute Time | Male | Female |
| Less than 5 Minutes | 40 (7.7%) | 5 (1.0%) |
| 5 to 9 Minutes | 38 (7.3%) | 0 (0.0%) |
| 10 to 14 Minutes | 38 (7.3%) | 47 (9.7%) |
| 15 to 19 Minutes | 35 (6.7%) | 60 (12.4%) |
| 20 to 24 Minutes | 20 (3.8%) | 83 (17.2%) |
| 25 to 29 Minutes | 95 (18.3%) | 100 (20.7%) |
| 30 to 34 Minutes | 32 (6.1%) | 47 (9.7%) |
| 35 to 39 Minutes | 20 (3.8%) | 8 (1.7%) |
| 40 to 44 Minutes | 63 (12.1%) | 62 (12.8%) |
| 45 to 59 Minutes | 66 (12.7%) | 35 (7.2%) |
| 60 to 89 Minutes | 44 (8.5%) | 32 (6.6%) |
| 90 or more Minutes | 29 (5.6%) | 5 (1.0%) |
Time of Departure to Work by Sex in Richmond
The most frequent times of departure to work in Richmond are 5:30 AM to 5:59 AM (120, 23.1%) for males and 7:30 AM to 7:59 AM (107, 22.1%) for females.
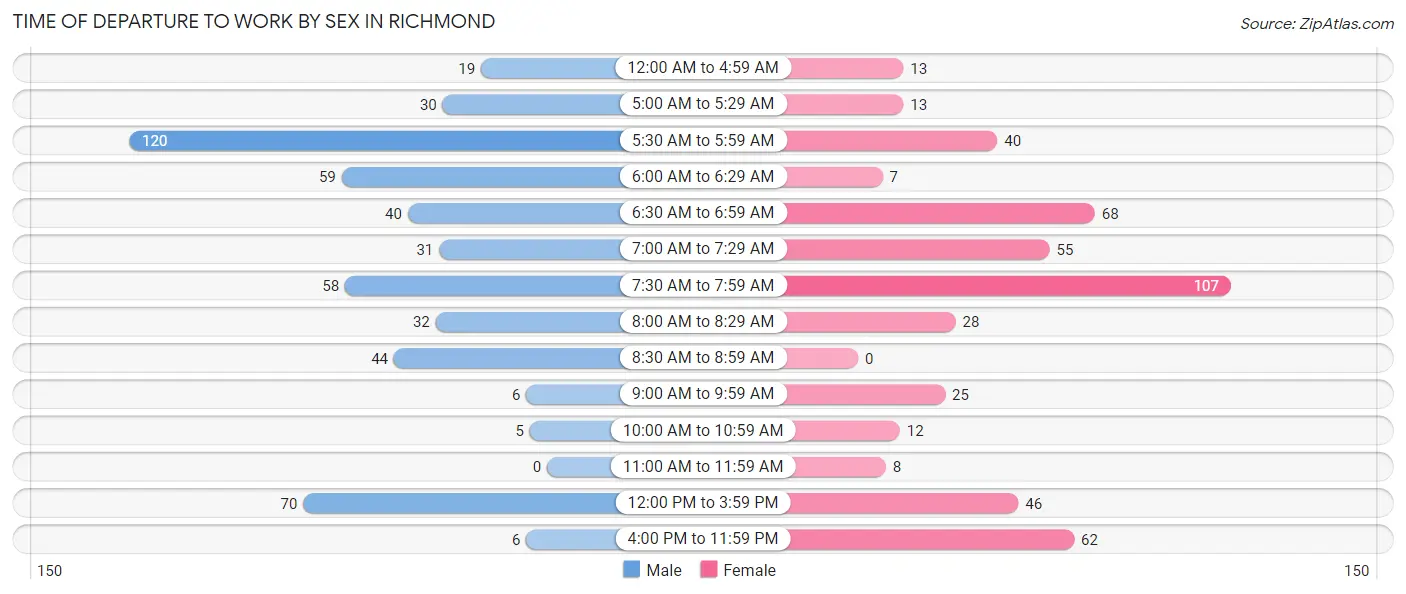
| Time of Departure | Male | Female |
| 12:00 AM to 4:59 AM | 19 (3.6%) | 13 (2.7%) |
| 5:00 AM to 5:29 AM | 30 (5.8%) | 13 (2.7%) |
| 5:30 AM to 5:59 AM | 120 (23.1%) | 40 (8.3%) |
| 6:00 AM to 6:29 AM | 59 (11.4%) | 7 (1.5%) |
| 6:30 AM to 6:59 AM | 40 (7.7%) | 68 (14.1%) |
| 7:00 AM to 7:29 AM | 31 (6.0%) | 55 (11.4%) |
| 7:30 AM to 7:59 AM | 58 (11.2%) | 107 (22.1%) |
| 8:00 AM to 8:29 AM | 32 (6.1%) | 28 (5.8%) |
| 8:30 AM to 8:59 AM | 44 (8.5%) | 0 (0.0%) |
| 9:00 AM to 9:59 AM | 6 (1.1%) | 25 (5.2%) |
| 10:00 AM to 10:59 AM | 5 (1.0%) | 12 (2.5%) |
| 11:00 AM to 11:59 AM | 0 (0.0%) | 8 (1.7%) |
| 12:00 PM to 3:59 PM | 70 (13.5%) | 46 (9.5%) |
| 4:00 PM to 11:59 PM | 6 (1.1%) | 62 (12.8%) |
| Total | 520 (100.0%) | 484 (100.0%) |
Housing Occupancy in Richmond
Occupancy by Ownership in Richmond
Of the total 1,098 dwellings in Richmond, owner-occupied units account for 585 (53.3%), while renter-occupied units make up 513 (46.7%).
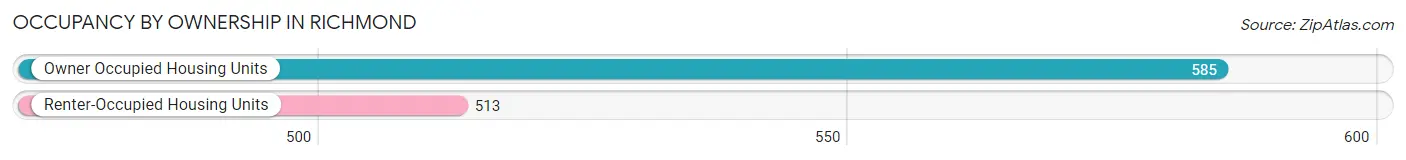
| Occupancy | # Housing Units | % Housing Units |
| Owner Occupied Housing Units | 585 | 53.3% |
| Renter-Occupied Housing Units | 513 | 46.7% |
| Total Occupied Housing Units | 1,098 | 100.0% |
Occupancy by Household Size in Richmond
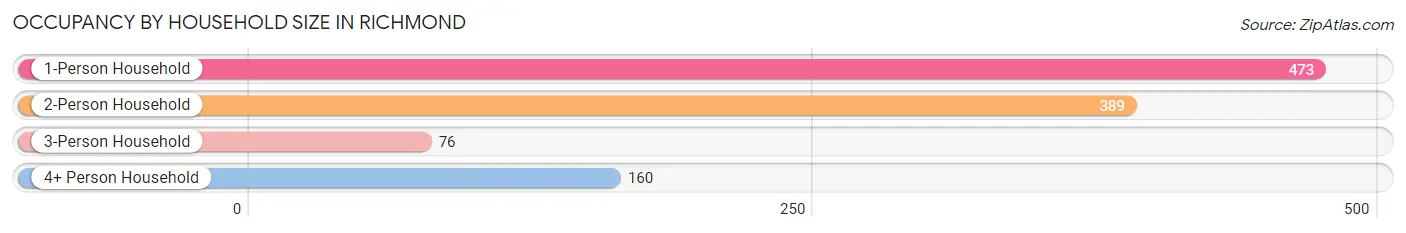
| Household Size | # Housing Units | % Housing Units |
| 1-Person Household | 473 | 43.1% |
| 2-Person Household | 389 | 35.4% |
| 3-Person Household | 76 | 6.9% |
| 4+ Person Household | 160 | 14.6% |
| Total Housing Units | 1,098 | 100.0% |
Occupancy by Ownership by Household Size in Richmond
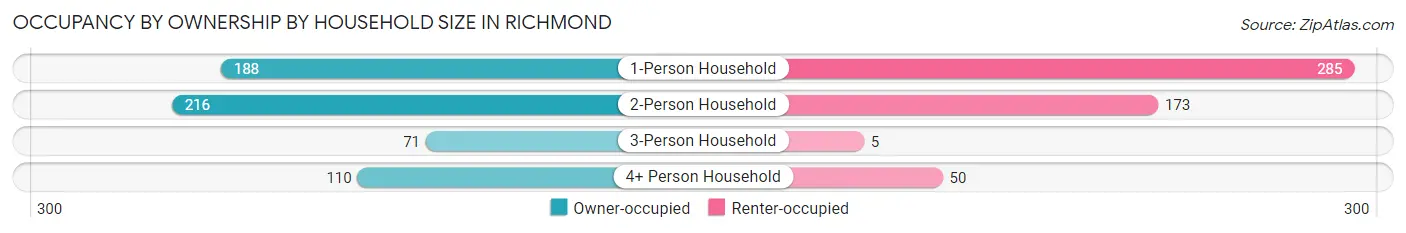
| Household Size | Owner-occupied | Renter-occupied |
| 1-Person Household | 188 (39.8%) | 285 (60.3%) |
| 2-Person Household | 216 (55.5%) | 173 (44.5%) |
| 3-Person Household | 71 (93.4%) | 5 (6.6%) |
| 4+ Person Household | 110 (68.8%) | 50 (31.2%) |
| Total Housing Units | 585 (53.3%) | 513 (46.7%) |
Occupancy by Educational Attainment in Richmond
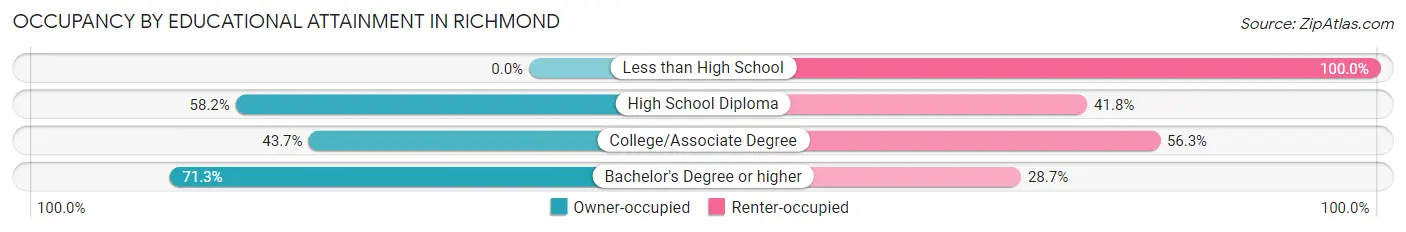
| Household Size | Owner-occupied | Renter-occupied |
| Less than High School | 0 (0.0%) | 47 (100.0%) |
| High School Diploma | 153 (58.2%) | 110 (41.8%) |
| College/Associate Degree | 206 (43.7%) | 265 (56.3%) |
| Bachelor's Degree or higher | 226 (71.3%) | 91 (28.7%) |
Occupancy by Age of Householder in Richmond
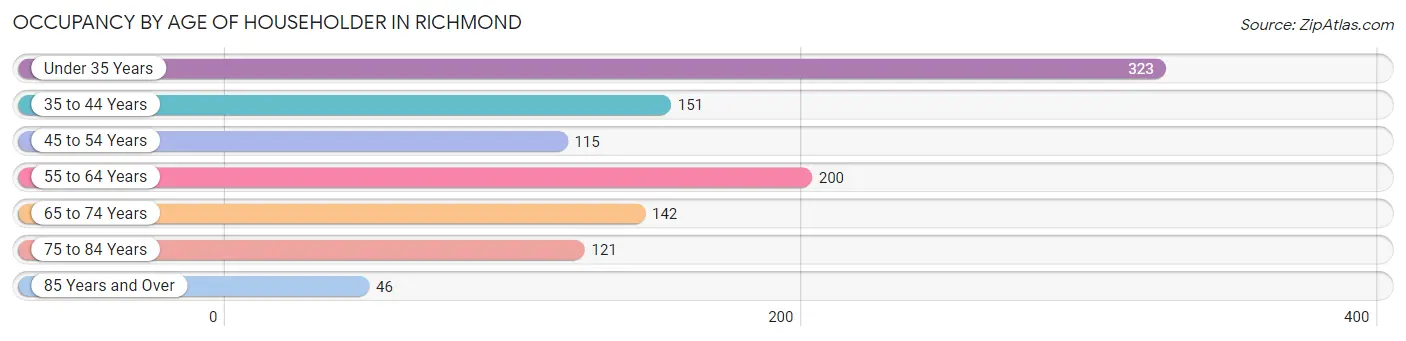
| Age Bracket | # Households | % Households |
| Under 35 Years | 323 | 29.4% |
| 35 to 44 Years | 151 | 13.8% |
| 45 to 54 Years | 115 | 10.5% |
| 55 to 64 Years | 200 | 18.2% |
| 65 to 74 Years | 142 | 12.9% |
| 75 to 84 Years | 121 | 11.0% |
| 85 Years and Over | 46 | 4.2% |
| Total | 1,098 | 100.0% |
Housing Finances in Richmond
Median Income by Occupancy in Richmond
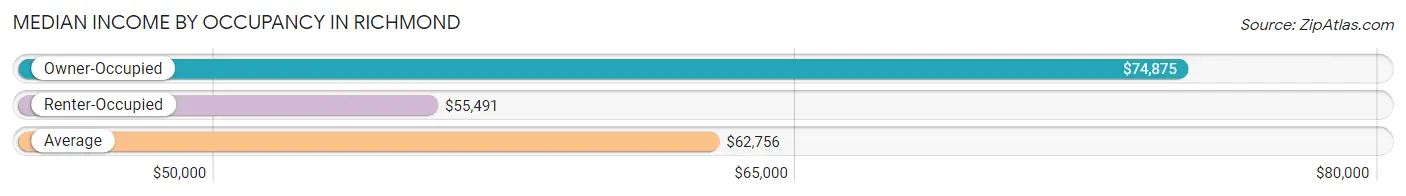
| Occupancy Type | # Households | Median Income |
| Owner-Occupied | 585 (53.3%) | $74,875 |
| Renter-Occupied | 513 (46.7%) | $55,491 |
| Average | 1,098 (100.0%) | $62,756 |
Occupancy by Householder Income Bracket in Richmond
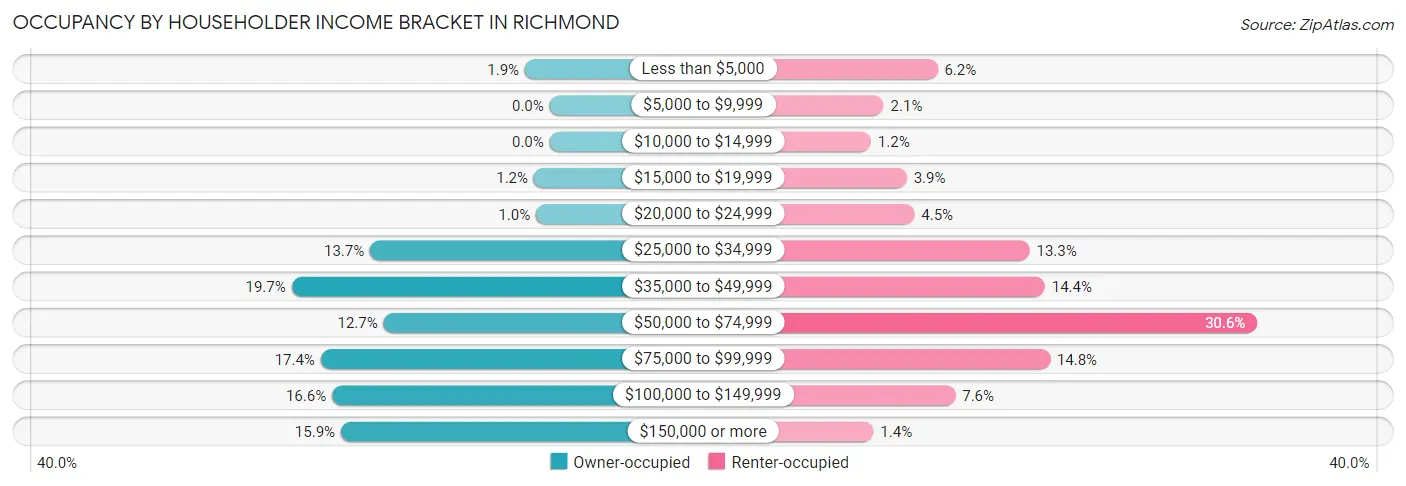
| Income Bracket | Owner-occupied | Renter-occupied |
| Less than $5,000 | 11 (1.9%) | 32 (6.2%) |
| $5,000 to $9,999 | 0 (0.0%) | 11 (2.1%) |
| $10,000 to $14,999 | 0 (0.0%) | 6 (1.2%) |
| $15,000 to $19,999 | 7 (1.2%) | 20 (3.9%) |
| $20,000 to $24,999 | 6 (1.0%) | 23 (4.5%) |
| $25,000 to $34,999 | 80 (13.7%) | 68 (13.3%) |
| $35,000 to $49,999 | 115 (19.7%) | 74 (14.4%) |
| $50,000 to $74,999 | 74 (12.7%) | 157 (30.6%) |
| $75,000 to $99,999 | 102 (17.4%) | 76 (14.8%) |
| $100,000 to $149,999 | 97 (16.6%) | 39 (7.6%) |
| $150,000 or more | 93 (15.9%) | 7 (1.4%) |
| Total | 585 (100.0%) | 513 (100.0%) |
Monthly Housing Cost Tiers in Richmond
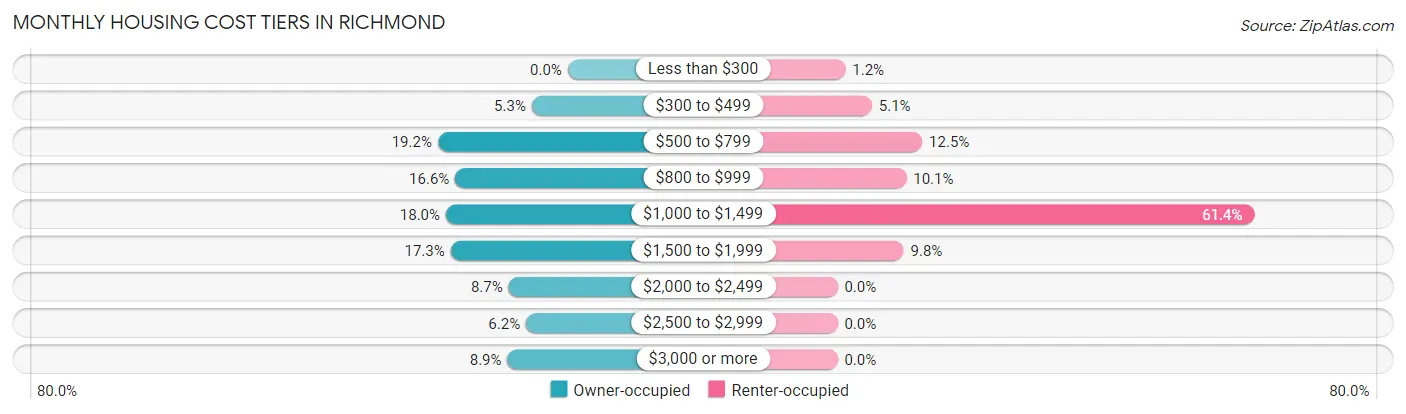
| Monthly Cost | Owner-occupied | Renter-occupied |
| Less than $300 | 0 (0.0%) | 6 (1.2%) |
| $300 to $499 | 31 (5.3%) | 26 (5.1%) |
| $500 to $799 | 112 (19.2%) | 64 (12.5%) |
| $800 to $999 | 97 (16.6%) | 52 (10.1%) |
| $1,000 to $1,499 | 105 (17.9%) | 315 (61.4%) |
| $1,500 to $1,999 | 101 (17.3%) | 50 (9.8%) |
| $2,000 to $2,499 | 51 (8.7%) | 0 (0.0%) |
| $2,500 to $2,999 | 36 (6.1%) | 0 (0.0%) |
| $3,000 or more | 52 (8.9%) | 0 (0.0%) |
| Total | 585 (100.0%) | 513 (100.0%) |
Physical Housing Characteristics in Richmond
Housing Structures in Richmond
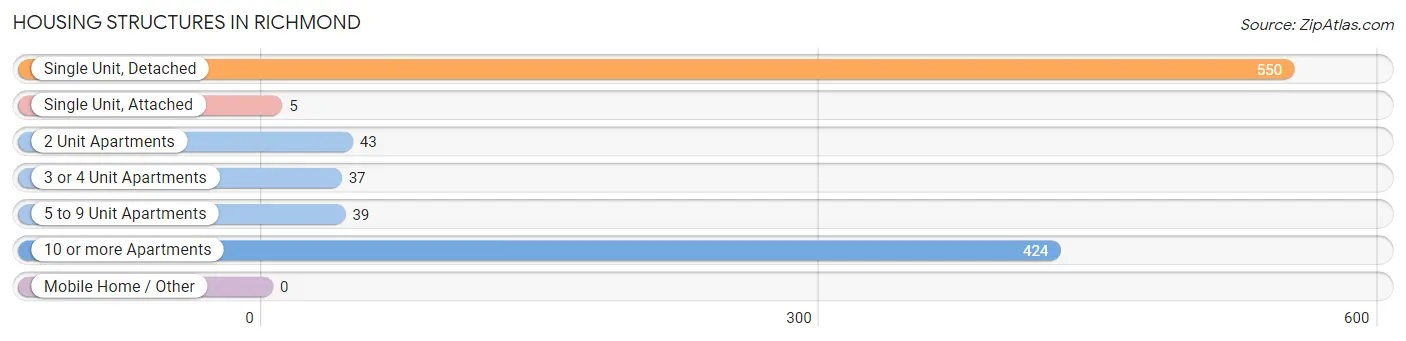
| Structure Type | # Housing Units | % Housing Units |
| Single Unit, Detached | 550 | 50.1% |
| Single Unit, Attached | 5 | 0.5% |
| 2 Unit Apartments | 43 | 3.9% |
| 3 or 4 Unit Apartments | 37 | 3.4% |
| 5 to 9 Unit Apartments | 39 | 3.5% |
| 10 or more Apartments | 424 | 38.6% |
| Mobile Home / Other | 0 | 0.0% |
| Total | 1,098 | 100.0% |
Housing Structures by Occupancy in Richmond
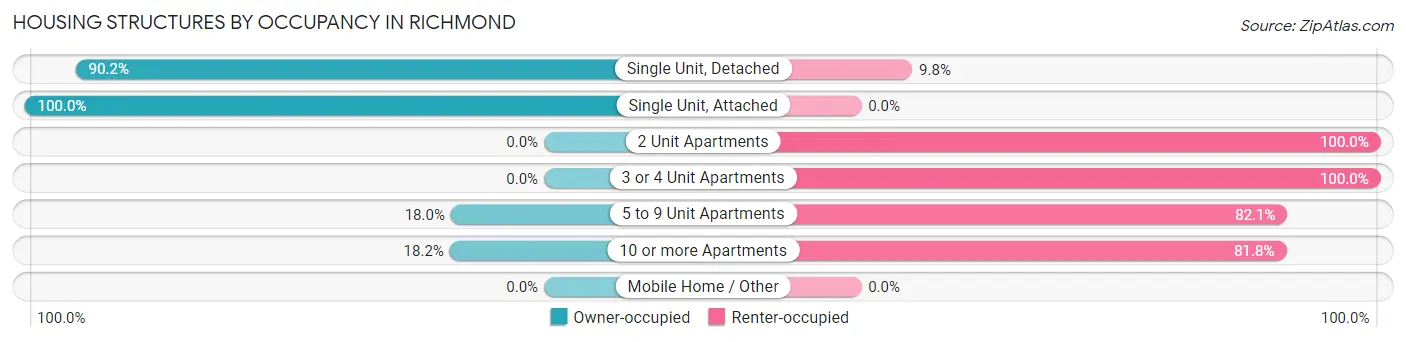
| Structure Type | Owner-occupied | Renter-occupied |
| Single Unit, Detached | 496 (90.2%) | 54 (9.8%) |
| Single Unit, Attached | 5 (100.0%) | 0 (0.0%) |
| 2 Unit Apartments | 0 (0.0%) | 43 (100.0%) |
| 3 or 4 Unit Apartments | 0 (0.0%) | 37 (100.0%) |
| 5 to 9 Unit Apartments | 7 (17.9%) | 32 (82.1%) |
| 10 or more Apartments | 77 (18.2%) | 347 (81.8%) |
| Mobile Home / Other | 0 (0.0%) | 0 (0.0%) |
| Total | 585 (53.3%) | 513 (46.7%) |
Housing Structures by Number of Rooms in Richmond
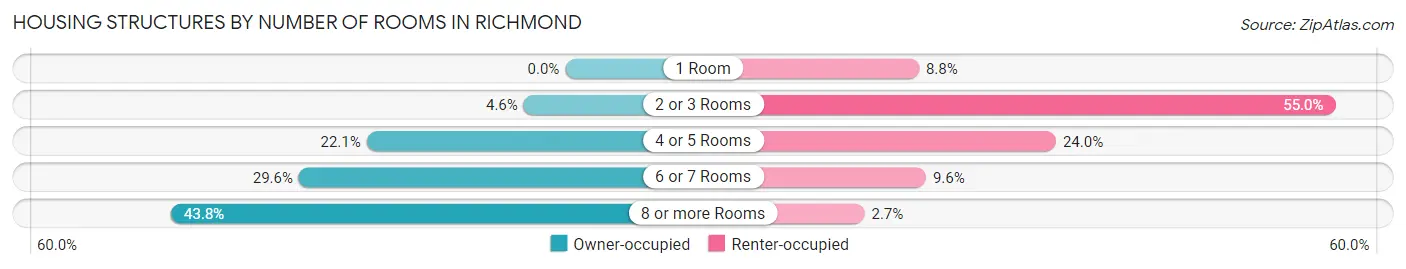
| Number of Rooms | Owner-occupied | Renter-occupied |
| 1 Room | 0 (0.0%) | 45 (8.8%) |
| 2 or 3 Rooms | 27 (4.6%) | 282 (55.0%) |
| 4 or 5 Rooms | 129 (22.1%) | 123 (24.0%) |
| 6 or 7 Rooms | 173 (29.6%) | 49 (9.6%) |
| 8 or more Rooms | 256 (43.8%) | 14 (2.7%) |
| Total | 585 (100.0%) | 513 (100.0%) |
Housing Structure by Heating Type in Richmond
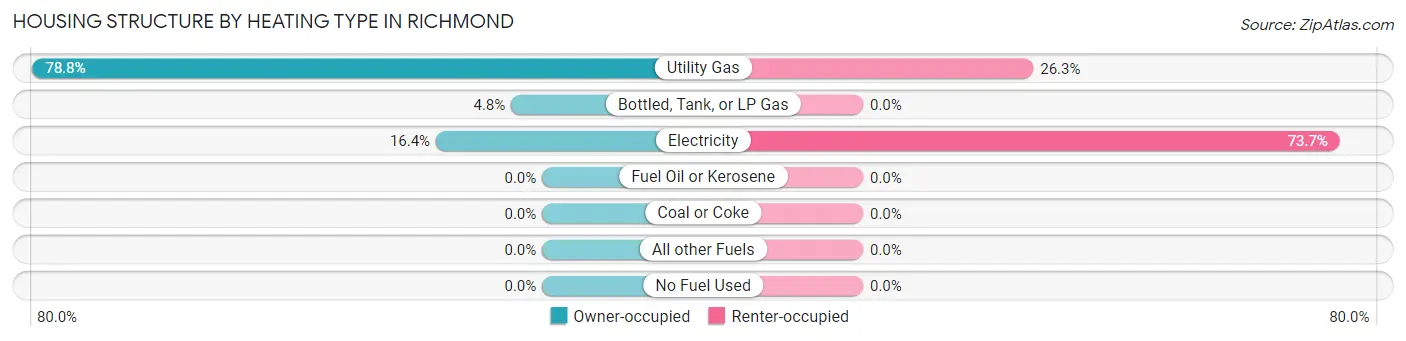
| Heating Type | Owner-occupied | Renter-occupied |
| Utility Gas | 461 (78.8%) | 135 (26.3%) |
| Bottled, Tank, or LP Gas | 28 (4.8%) | 0 (0.0%) |
| Electricity | 96 (16.4%) | 378 (73.7%) |
| Fuel Oil or Kerosene | 0 (0.0%) | 0 (0.0%) |
| Coal or Coke | 0 (0.0%) | 0 (0.0%) |
| All other Fuels | 0 (0.0%) | 0 (0.0%) |
| No Fuel Used | 0 (0.0%) | 0 (0.0%) |
| Total | 585 (100.0%) | 513 (100.0%) |
Household Vehicle Usage in Richmond
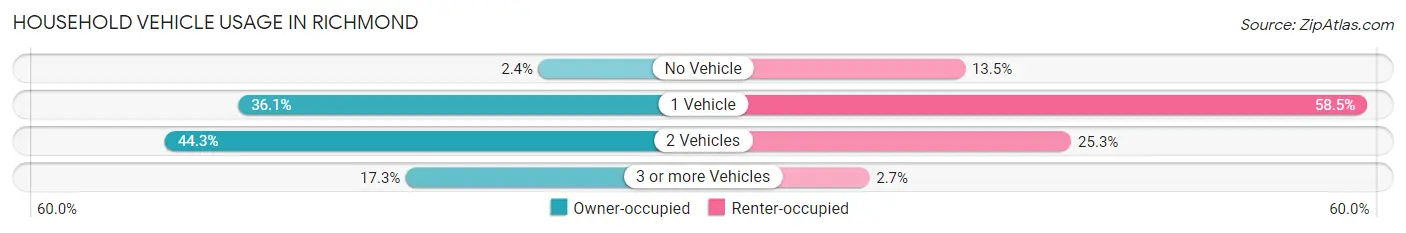
| Vehicles per Household | Owner-occupied | Renter-occupied |
| No Vehicle | 14 (2.4%) | 69 (13.5%) |
| 1 Vehicle | 211 (36.1%) | 300 (58.5%) |
| 2 Vehicles | 259 (44.3%) | 130 (25.3%) |
| 3 or more Vehicles | 101 (17.3%) | 14 (2.7%) |
| Total | 585 (100.0%) | 513 (100.0%) |
Real Estate & Mortgages in Richmond
Real Estate and Mortgage Overview in Richmond
| Characteristic | Without Mortgage | With Mortgage |
| Housing Units | 211 | 374 |
| Median Property Value | $229,900 | $224,300 |
| Median Household Income | $36,148 | $88 |
| Monthly Housing Costs | $765 | $52 |
| Real Estate Taxes | $5,281 | $17 |
Property Value by Mortgage Status in Richmond
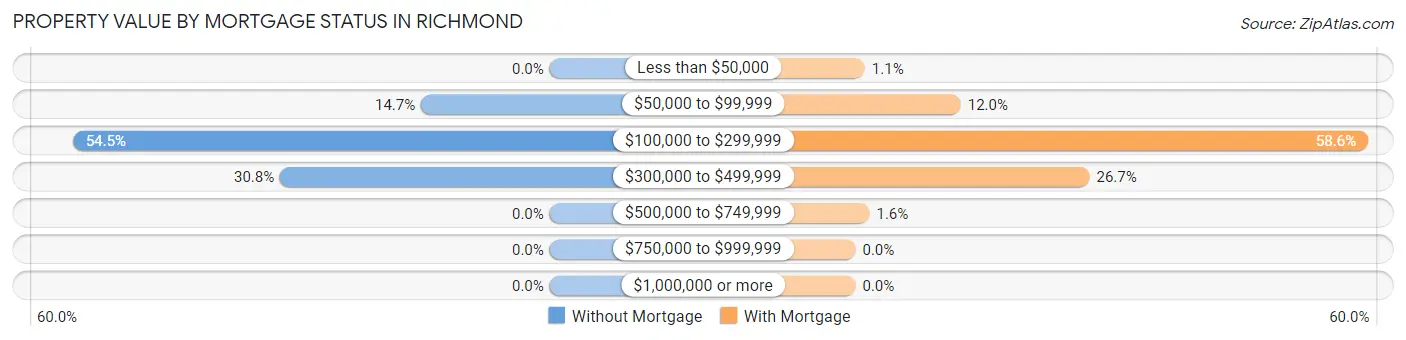
| Property Value | Without Mortgage | With Mortgage |
| Less than $50,000 | 0 (0.0%) | 4 (1.1%) |
| $50,000 to $99,999 | 31 (14.7%) | 45 (12.0%) |
| $100,000 to $299,999 | 115 (54.5%) | 219 (58.6%) |
| $300,000 to $499,999 | 65 (30.8%) | 100 (26.7%) |
| $500,000 to $749,999 | 0 (0.0%) | 6 (1.6%) |
| $750,000 to $999,999 | 0 (0.0%) | 0 (0.0%) |
| $1,000,000 or more | 0 (0.0%) | 0 (0.0%) |
| Total | 211 (100.0%) | 374 (100.0%) |
Household Income by Mortgage Status in Richmond
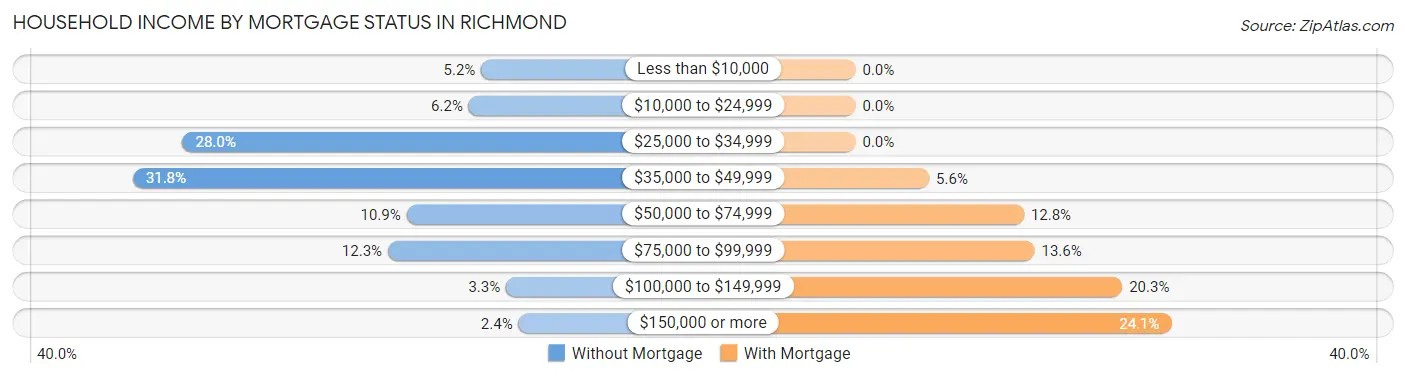
| Household Income | Without Mortgage | With Mortgage |
| Less than $10,000 | 11 (5.2%) | 0 (0.0%) |
| $10,000 to $24,999 | 13 (6.2%) | 0 (0.0%) |
| $25,000 to $34,999 | 59 (28.0%) | 0 (0.0%) |
| $35,000 to $49,999 | 67 (31.8%) | 21 (5.6%) |
| $50,000 to $74,999 | 23 (10.9%) | 48 (12.8%) |
| $75,000 to $99,999 | 26 (12.3%) | 51 (13.6%) |
| $100,000 to $149,999 | 7 (3.3%) | 76 (20.3%) |
| $150,000 or more | 5 (2.4%) | 90 (24.1%) |
| Total | 211 (100.0%) | 374 (100.0%) |
Property Value to Household Income Ratio in Richmond
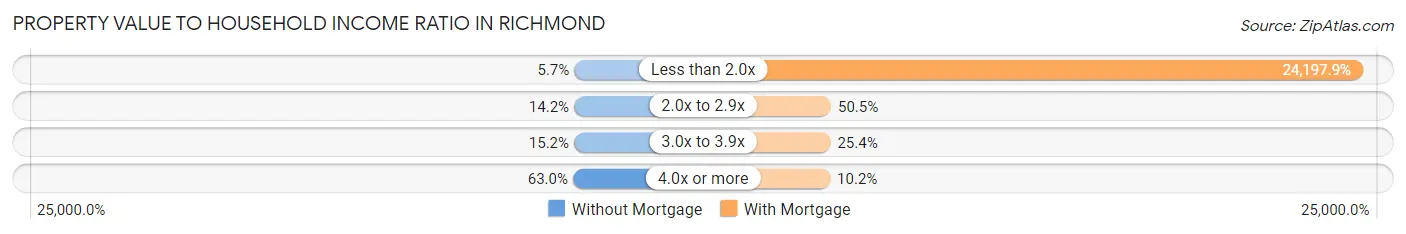
| Value-to-Income Ratio | Without Mortgage | With Mortgage |
| Less than 2.0x | 12 (5.7%) | 90,500 (24,197.9%) |
| 2.0x to 2.9x | 30 (14.2%) | 189 (50.5%) |
| 3.0x to 3.9x | 32 (15.2%) | 95 (25.4%) |
| 4.0x or more | 133 (63.0%) | 38 (10.2%) |
| Total | 211 (100.0%) | 374 (100.0%) |
Real Estate Taxes by Mortgage Status in Richmond
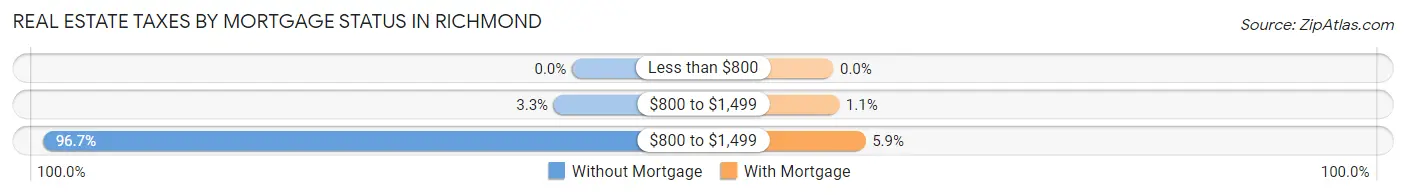
| Property Taxes | Without Mortgage | With Mortgage |
| Less than $800 | 0 (0.0%) | 0 (0.0%) |
| $800 to $1,499 | 7 (3.3%) | 4 (1.1%) |
| $800 to $1,499 | 204 (96.7%) | 22 (5.9%) |
| Total | 211 (100.0%) | 374 (100.0%) |
Health & Disability in Richmond
Health Insurance Coverage by Age in Richmond
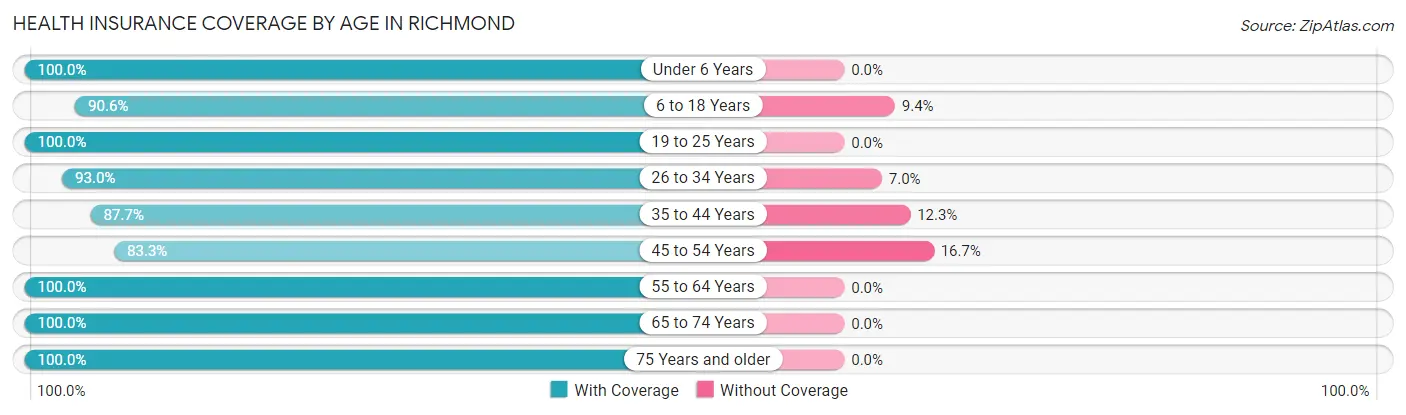
| Age Bracket | With Coverage | Without Coverage |
| Under 6 Years | 164 (100.0%) | 0 (0.0%) |
| 6 to 18 Years | 317 (90.6%) | 33 (9.4%) |
| 19 to 25 Years | 225 (100.0%) | 0 (0.0%) |
| 26 to 34 Years | 292 (93.0%) | 22 (7.0%) |
| 35 to 44 Years | 264 (87.7%) | 37 (12.3%) |
| 45 to 54 Years | 145 (83.3%) | 29 (16.7%) |
| 55 to 64 Years | 310 (100.0%) | 0 (0.0%) |
| 65 to 74 Years | 220 (100.0%) | 0 (0.0%) |
| 75 Years and older | 208 (100.0%) | 0 (0.0%) |
| Total | 2,145 (94.7%) | 121 (5.3%) |
Health Insurance Coverage by Citizenship Status in Richmond
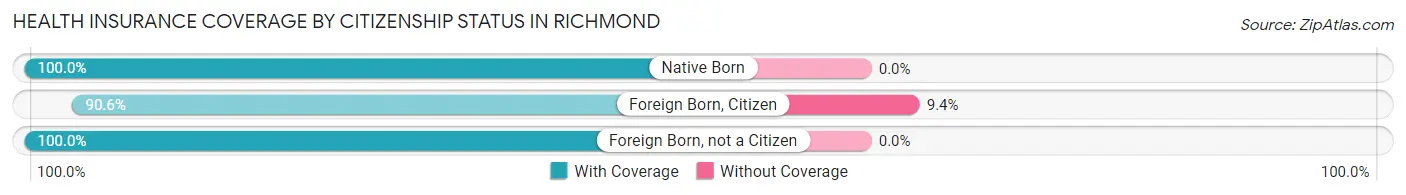
| Citizenship Status | With Coverage | Without Coverage |
| Native Born | 164 (100.0%) | 0 (0.0%) |
| Foreign Born, Citizen | 317 (90.6%) | 33 (9.4%) |
| Foreign Born, not a Citizen | 225 (100.0%) | 0 (0.0%) |
Health Insurance Coverage by Household Income in Richmond
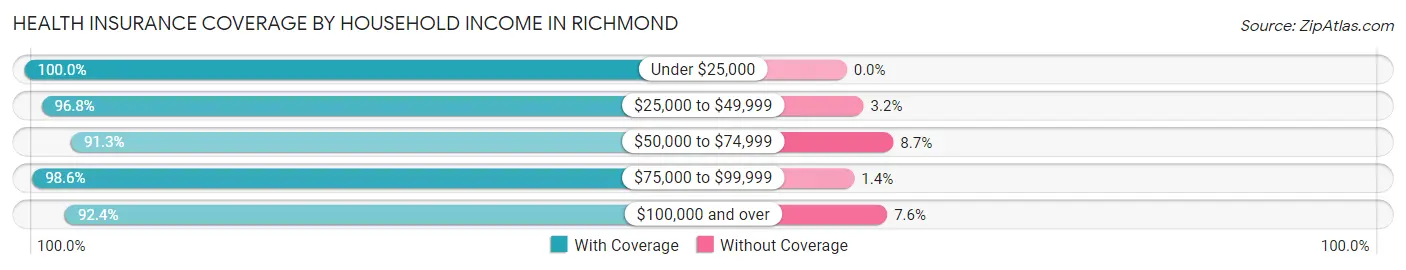
| Household Income | With Coverage | Without Coverage |
| Under $25,000 | 146 (100.0%) | 0 (0.0%) |
| $25,000 to $49,999 | 521 (96.8%) | 17 (3.2%) |
| $50,000 to $74,999 | 387 (91.3%) | 37 (8.7%) |
| $75,000 to $99,999 | 413 (98.6%) | 6 (1.4%) |
| $100,000 and over | 647 (92.4%) | 53 (7.6%) |
Public vs Private Health Insurance Coverage by Age in Richmond
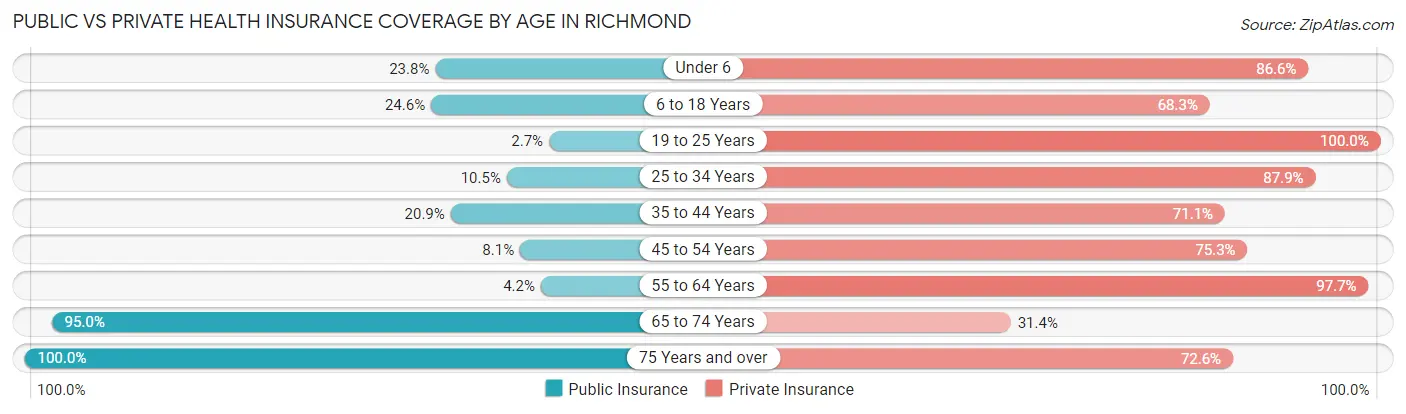
| Age Bracket | Public Insurance | Private Insurance |
| Under 6 | 39 (23.8%) | 142 (86.6%) |
| 6 to 18 Years | 86 (24.6%) | 239 (68.3%) |
| 19 to 25 Years | 6 (2.7%) | 225 (100.0%) |
| 25 to 34 Years | 33 (10.5%) | 276 (87.9%) |
| 35 to 44 Years | 63 (20.9%) | 214 (71.1%) |
| 45 to 54 Years | 14 (8.1%) | 131 (75.3%) |
| 55 to 64 Years | 13 (4.2%) | 303 (97.7%) |
| 65 to 74 Years | 209 (95.0%) | 69 (31.4%) |
| 75 Years and over | 208 (100.0%) | 151 (72.6%) |
| Total | 671 (29.6%) | 1,750 (77.2%) |
Disability Status by Sex by Age in Richmond
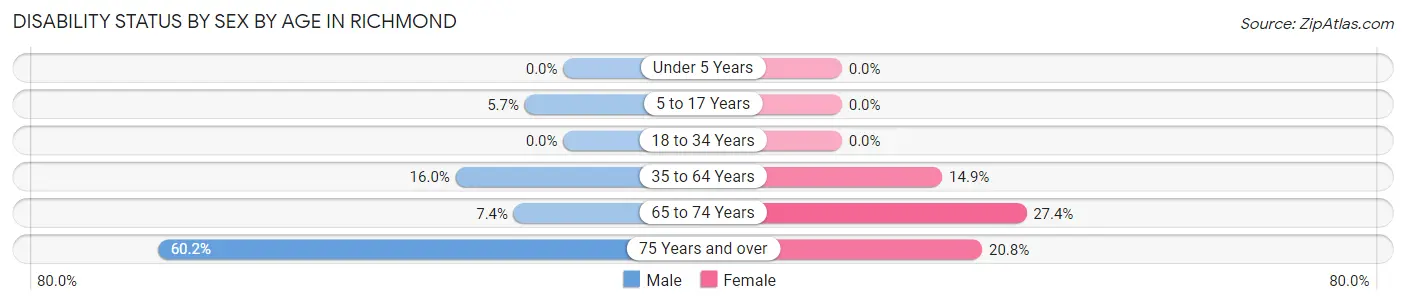
| Age Bracket | Male | Female |
| Under 5 Years | 0 (0.0%) | 0 (0.0%) |
| 5 to 17 Years | 9 (5.7%) | 0 (0.0%) |
| 18 to 34 Years | 0 (0.0%) | 0 (0.0%) |
| 35 to 64 Years | 59 (16.0%) | 62 (14.9%) |
| 65 to 74 Years | 10 (7.3%) | 23 (27.4%) |
| 75 Years and over | 53 (60.2%) | 25 (20.8%) |
Disability Class by Sex by Age in Richmond
Disability Class: Hearing Difficulty
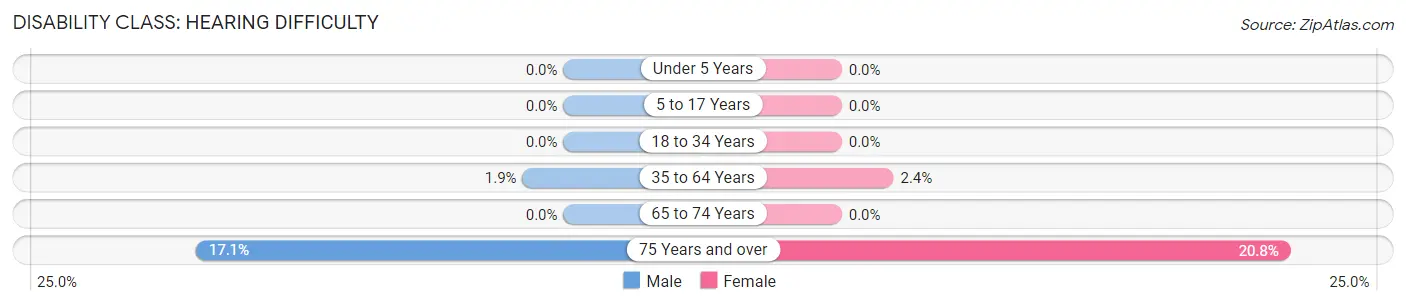
| Age Bracket | Male | Female |
| Under 5 Years | 0 (0.0%) | 0 (0.0%) |
| 5 to 17 Years | 0 (0.0%) | 0 (0.0%) |
| 18 to 34 Years | 0 (0.0%) | 0 (0.0%) |
| 35 to 64 Years | 7 (1.9%) | 10 (2.4%) |
| 65 to 74 Years | 0 (0.0%) | 0 (0.0%) |
| 75 Years and over | 15 (17.1%) | 25 (20.8%) |
Disability Class: Vision Difficulty
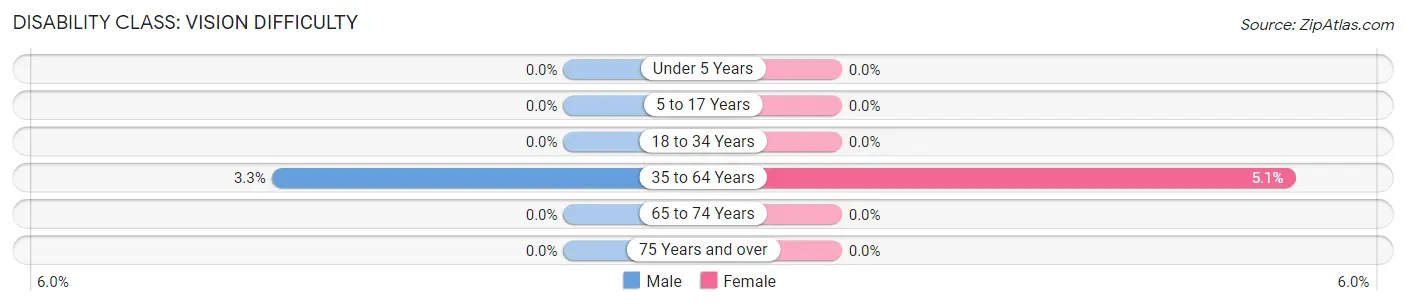
| Age Bracket | Male | Female |
| Under 5 Years | 0 (0.0%) | 0 (0.0%) |
| 5 to 17 Years | 0 (0.0%) | 0 (0.0%) |
| 18 to 34 Years | 0 (0.0%) | 0 (0.0%) |
| 35 to 64 Years | 12 (3.3%) | 21 (5.1%) |
| 65 to 74 Years | 0 (0.0%) | 0 (0.0%) |
| 75 Years and over | 0 (0.0%) | 0 (0.0%) |
Disability Class: Cognitive Difficulty
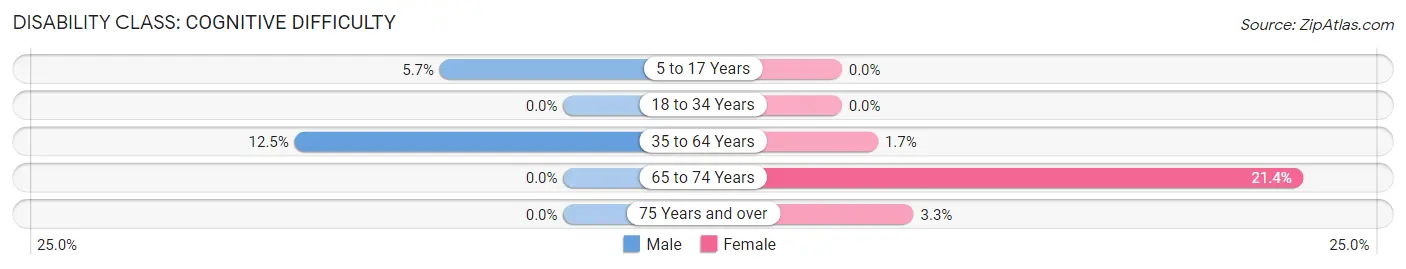
| Age Bracket | Male | Female |
| 5 to 17 Years | 9 (5.7%) | 0 (0.0%) |
| 18 to 34 Years | 0 (0.0%) | 0 (0.0%) |
| 35 to 64 Years | 46 (12.5%) | 7 (1.7%) |
| 65 to 74 Years | 0 (0.0%) | 18 (21.4%) |
| 75 Years and over | 0 (0.0%) | 4 (3.3%) |
Disability Class: Ambulatory Difficulty
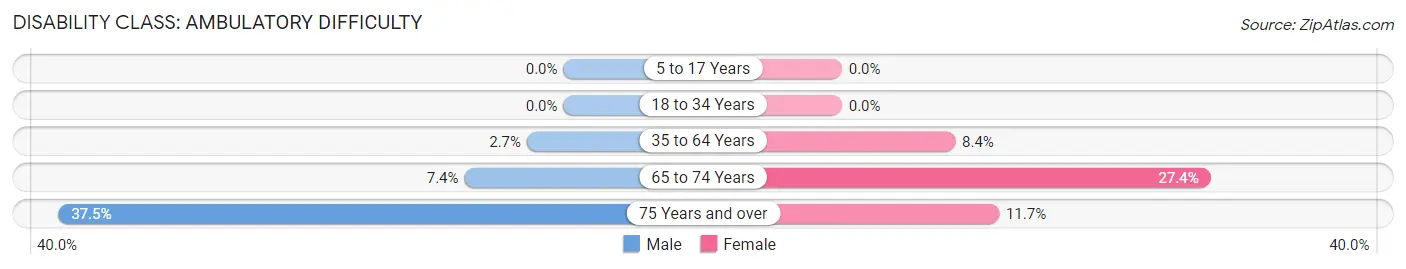
| Age Bracket | Male | Female |
| 5 to 17 Years | 0 (0.0%) | 0 (0.0%) |
| 18 to 34 Years | 0 (0.0%) | 0 (0.0%) |
| 35 to 64 Years | 10 (2.7%) | 35 (8.4%) |
| 65 to 74 Years | 10 (7.3%) | 23 (27.4%) |
| 75 Years and over | 33 (37.5%) | 14 (11.7%) |
Disability Class: Self-Care Difficulty
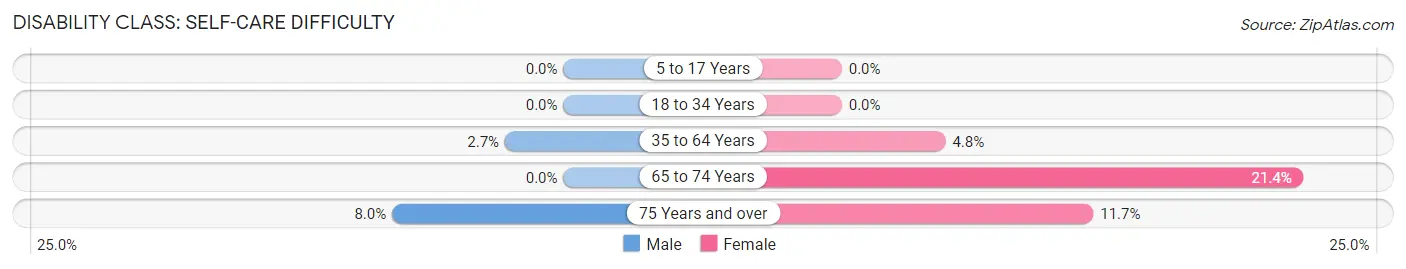
| Age Bracket | Male | Female |
| 5 to 17 Years | 0 (0.0%) | 0 (0.0%) |
| 18 to 34 Years | 0 (0.0%) | 0 (0.0%) |
| 35 to 64 Years | 10 (2.7%) | 20 (4.8%) |
| 65 to 74 Years | 0 (0.0%) | 18 (21.4%) |
| 75 Years and over | 7 (8.0%) | 14 (11.7%) |
Technology Access in Richmond
Computing Device Access in Richmond
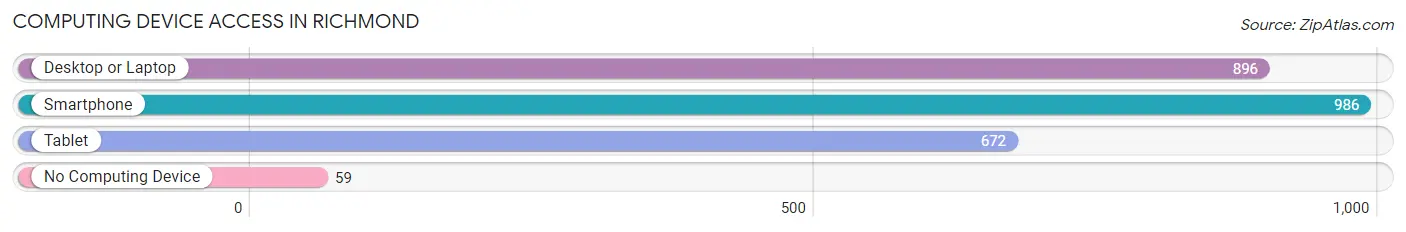
| Device Type | # Households | % Households |
| Desktop or Laptop | 896 | 81.6% |
| Smartphone | 986 | 89.8% |
| Tablet | 672 | 61.2% |
| No Computing Device | 59 | 5.4% |
| Total | 1,098 | 100.0% |
Internet Access in Richmond
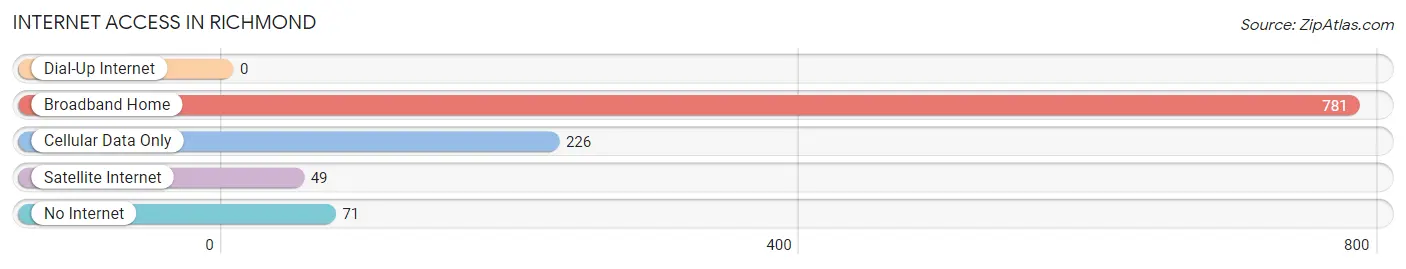
| Internet Type | # Households | % Households |
| Dial-Up Internet | 0 | 0.0% |
| Broadband Home | 781 | 71.1% |
| Cellular Data Only | 226 | 20.6% |
| Satellite Internet | 49 | 4.5% |
| No Internet | 71 | 6.5% |
| Total | 1,098 | 100.0% |
Richmond Summary
Richmond, Illinois is a small village located in McHenry County, Illinois. It is situated on the banks of the Fox River, about 40 miles northwest of Chicago. The village has a population of about 4,000 people and is part of the larger Fox Valley region.
History
Richmond was first settled in 1836 by a group of settlers from New York. The village was originally known as Richmond Station, as it was a stop on the Chicago and Northwestern Railroad. The village was officially incorporated in 1872.
In the late 19th century, Richmond was a thriving agricultural community. The village was home to several grain elevators, a flour mill, and a canning factory. The village also had a number of stores and businesses, including a hotel, a bank, and a post office.
In the early 20th century, Richmond began to experience a decline in population as many of its residents moved to larger cities in search of better job opportunities. The village also suffered from a series of floods in the 1920s and 1930s, which caused significant damage to the local economy.
Geography
Richmond is located in McHenry County, Illinois, about 40 miles northwest of Chicago. The village is situated on the banks of the Fox River, which flows through the village and provides a scenic backdrop. The village is surrounded by rolling hills and farmland, and is located near several state parks and recreational areas.
The village has a total area of 1.2 square miles, all of which is land. The village is located at an elevation of 745 feet above sea level.
Economy
Richmond’s economy is largely based on agriculture and tourism. The village is home to several farms, which produce a variety of crops, including corn, soybeans, and wheat. The village also has several wineries and breweries, which attract tourists from all over the region.
The village is also home to several small businesses, including restaurants, retail stores, and service providers. The village is also home to a number of manufacturing companies, which produce a variety of products, including furniture, automotive parts, and medical supplies.
Demographics
As of the 2010 census, Richmond had a population of 4,039 people. The racial makeup of the village was 94.3% White, 0.7% African American, 0.2% Native American, 0.7% Asian, 0.1% Pacific Islander, 2.2% from other races, and 1.9% from two or more races. Hispanic or Latino of any race were 5.2% of the population.
The median household income in Richmond was $60,938, and the median family income was $68,958. The per capita income for the village was $25,945. About 4.3% of families and 5.7% of the population were below the poverty line, including 8.2% of those under age 18 and 4.2% of those age 65 or over.
Common Questions
What is Per Capita Income in Richmond?
Per Capita income in Richmond is $38,341.
What is the Median Family Income in Richmond?
Median Family Income in Richmond is $83,125.
What is the Median Household income in Richmond?
Median Household Income in Richmond is $62,756.
What is Income or Wage Gap in Richmond?
Income or Wage Gap in Richmond is 7.9%.
Women in Richmond earn 92.1 cents for every dollar earned by a man.
What is Family Income Deficit in Richmond?
Family Income Deficit in Richmond is $10,130.
Families that are below poverty line in Richmond earn $10,130 less on average than the poverty threshold level.
What is Inequality or Gini Index in Richmond?
Inequality or Gini Index in Richmond is 0.42.
What is the Total Population of Richmond?
Total Population of Richmond is 2,266.
What is the Total Male Population of Richmond?
Total Male Population of Richmond is 1,151.
What is the Total Female Population of Richmond?
Total Female Population of Richmond is 1,115.
What is the Ratio of Males per 100 Females in Richmond?
There are 103.23 Males per 100 Females in Richmond.
What is the Ratio of Females per 100 Males in Richmond?
There are 96.87 Females per 100 Males in Richmond.
What is the Median Population Age in Richmond?
Median Population Age in Richmond is 36.8 Years.
What is the Average Family Size in Richmond
Average Family Size in Richmond is 2.8 People.
What is the Average Household Size in Richmond
Average Household Size in Richmond is 2.0 People.
How Large is the Labor Force in Richmond?
There are 1,250 People in the Labor Forcein in Richmond.
What is the Percentage of People in the Labor Force in Richmond?
67.3% of People are in the Labor Force in Richmond.
What is the Unemployment Rate in Richmond?
Unemployment Rate in Richmond is 11.4%.