Mattoon, IL Map & Demographics
Mattoon Map
Mattoon Overview
$27,000
PER CAPITA INCOME
$63,082
AVG FAMILY INCOME
$45,953
AVG HOUSEHOLD INCOME
11.0%
WAGE / INCOME GAP [ % ]
89.0¢/ $1
WAGE / INCOME GAP [ $ ]
$8,056
FAMILY INCOME DEFICIT
0.42
INEQUALITY / GINI INDEX
16,830
TOTAL POPULATION
8,207
MALE POPULATION
8,623
FEMALE POPULATION
95.18
MALES / 100 FEMALES
105.07
FEMALES / 100 MALES
42.4
MEDIAN AGE
2.6
AVG FAMILY SIZE
2.1
AVG HOUSEHOLD SIZE
8,438
LABOR FORCE [ PEOPLE ]
62.0%
PERCENT IN LABOR FORCE
7.9%
UNEMPLOYMENT RATE
Mattoon Zip Codes
Mattoon Area Codes
Income in Mattoon
Income Overview in Mattoon
Per Capita Income in Mattoon is $27,000, while median incomes of families and households are $63,082 and $45,953 respectively.
| Characteristic | Number | Measure |
| Per Capita Income | 16,830 | $27,000 |
| Median Family Income | 4,399 | $63,082 |
| Mean Family Income | 4,399 | $71,683 |
| Median Household Income | 7,884 | $45,953 |
| Mean Household Income | 7,884 | $57,800 |
| Income Deficit | 4,399 | $8,056 |
| Wage / Income Gap (%) | 16,830 | 11.02% |
| Wage / Income Gap ($) | 16,830 | 88.98¢ per $1 |
| Gini / Inequality Index | 16,830 | 0.42 |
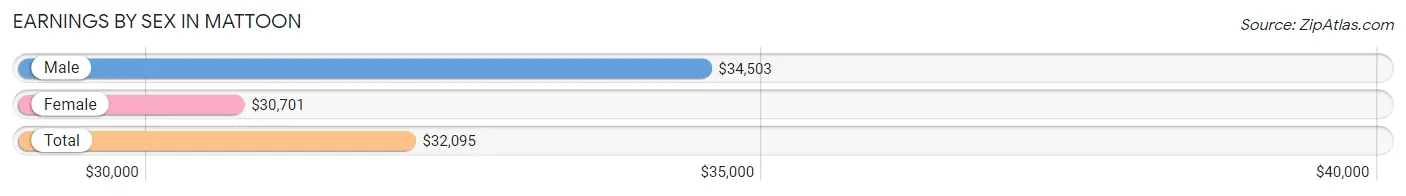
Earnings by Sex in Mattoon
Average Earnings in Mattoon are $32,095, $34,503 for men and $30,701 for women, a difference of 11.0%.
| Sex | Number | Average Earnings |
| Male | 4,606 (53.0%) | $34,503 |
| Female | 4,084 (47.0%) | $30,701 |
| Total | 8,690 (100.0%) | $32,095 |
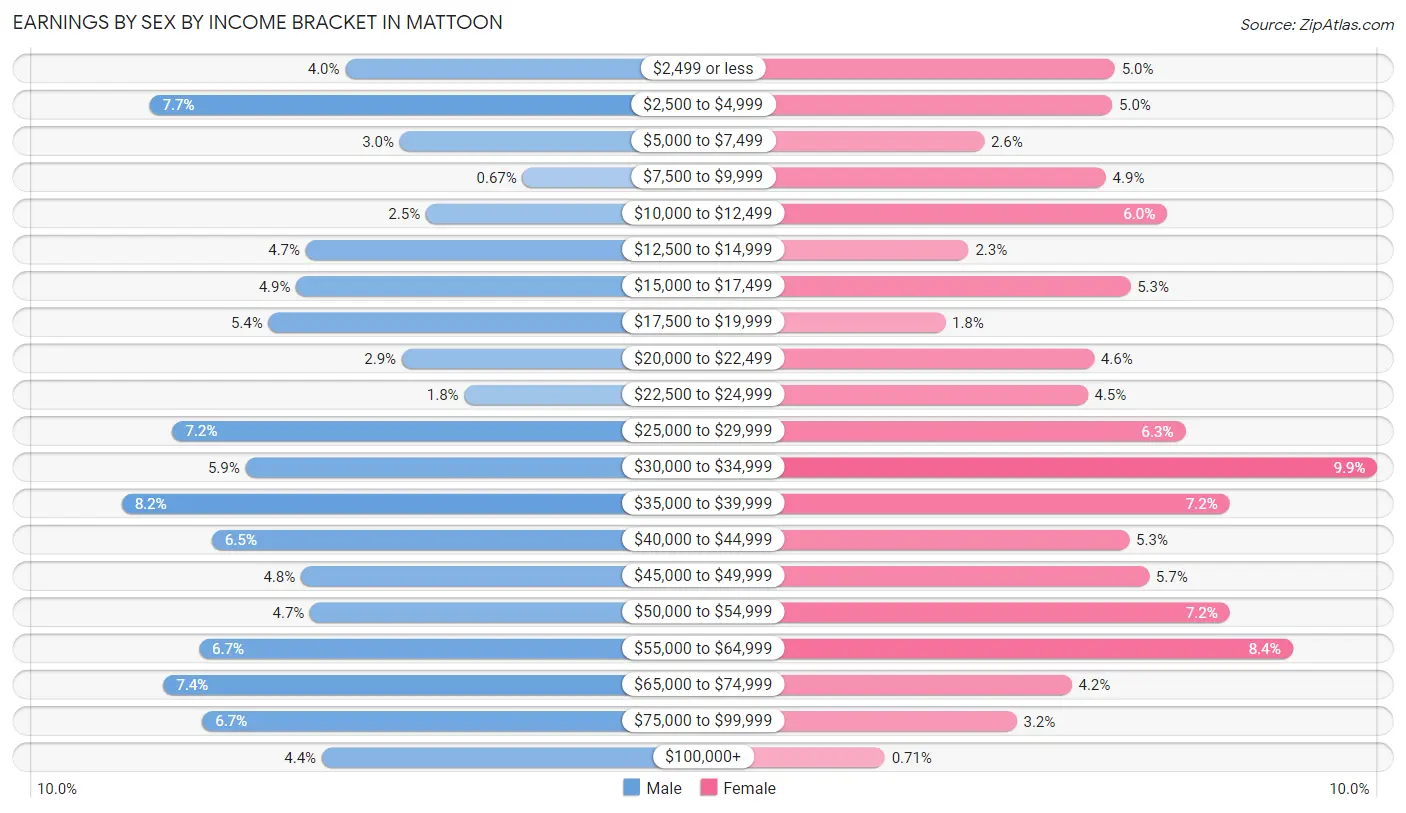
Earnings by Sex by Income Bracket in Mattoon
The most common earnings brackets in Mattoon are $35,000 to $39,999 for men (377 | 8.2%) and $30,000 to $34,999 for women (406 | 9.9%).
| Income | Male | Female |
| $2,499 or less | 184 (4.0%) | 205 (5.0%) |
| $2,500 to $4,999 | 353 (7.7%) | 203 (5.0%) |
| $5,000 to $7,499 | 137 (3.0%) | 105 (2.6%) |
| $7,500 to $9,999 | 31 (0.7%) | 198 (4.9%) |
| $10,000 to $12,499 | 114 (2.5%) | 245 (6.0%) |
| $12,500 to $14,999 | 218 (4.7%) | 93 (2.3%) |
| $15,000 to $17,499 | 226 (4.9%) | 217 (5.3%) |
| $17,500 to $19,999 | 250 (5.4%) | 75 (1.8%) |
| $20,000 to $22,499 | 135 (2.9%) | 189 (4.6%) |
| $22,500 to $24,999 | 81 (1.8%) | 184 (4.5%) |
| $25,000 to $29,999 | 333 (7.2%) | 259 (6.3%) |
| $30,000 to $34,999 | 270 (5.9%) | 406 (9.9%) |
| $35,000 to $39,999 | 377 (8.2%) | 293 (7.2%) |
| $40,000 to $44,999 | 299 (6.5%) | 216 (5.3%) |
| $45,000 to $49,999 | 222 (4.8%) | 231 (5.7%) |
| $50,000 to $54,999 | 214 (4.6%) | 293 (7.2%) |
| $55,000 to $64,999 | 310 (6.7%) | 341 (8.4%) |
| $65,000 to $74,999 | 341 (7.4%) | 172 (4.2%) |
| $75,000 to $99,999 | 307 (6.7%) | 130 (3.2%) |
| $100,000+ | 204 (4.4%) | 29 (0.7%) |
| Total | 4,606 (100.0%) | 4,084 (100.0%) |
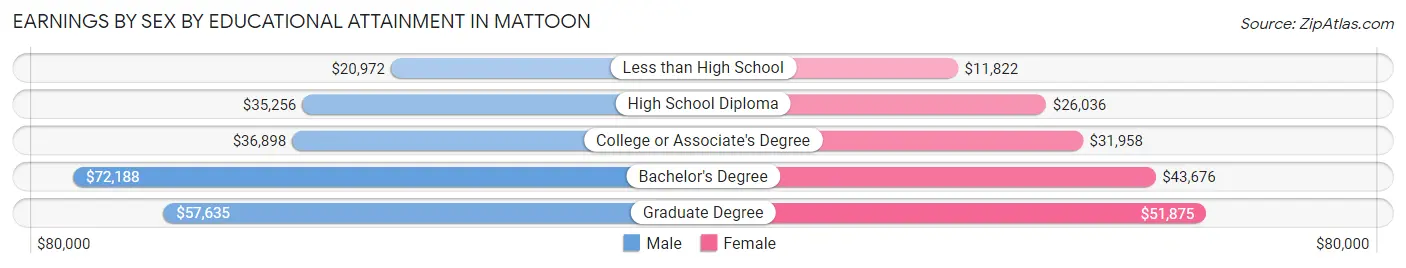
Earnings by Sex by Educational Attainment in Mattoon
Average earnings in Mattoon are $38,398 for men and $32,570 for women, a difference of 15.2%. Men with an educational attainment of bachelor's degree enjoy the highest average annual earnings of $72,188, while those with less than high school education earn the least with $20,972. Women with an educational attainment of graduate degree earn the most with the average annual earnings of $51,875, while those with less than high school education have the smallest earnings of $11,822.
| Educational Attainment | Male Income | Female Income |
| Less than High School | $20,972 | $11,822 |
| High School Diploma | $35,256 | $26,036 |
| College or Associate's Degree | $36,898 | $31,958 |
| Bachelor's Degree | $72,188 | $43,676 |
| Graduate Degree | $57,635 | $51,875 |
| Total | $38,398 | $32,570 |
Family Income in Mattoon
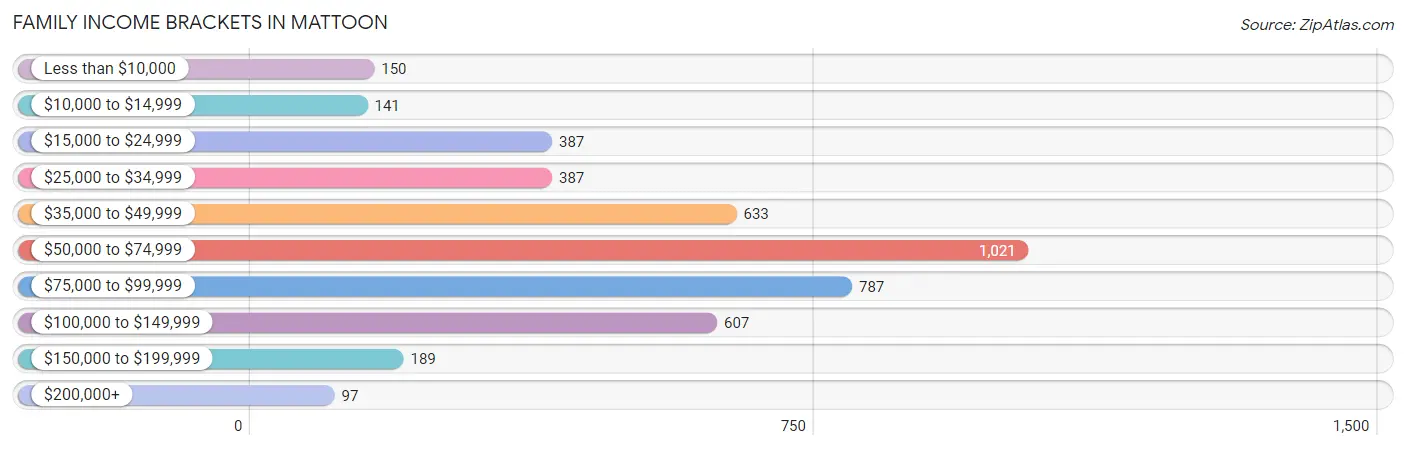
Family Income Brackets in Mattoon
According to the Mattoon family income data, there are 1,021 families falling into the $50,000 to $74,999 income range, which is the most common income bracket and makes up 23.2% of all families. Conversely, the $200,000+ income bracket is the least frequent group with only 97 families (2.2%) belonging to this category.
| Income Bracket | # Families | % Families |
| Less than $10,000 | 150 | 3.4% |
| $10,000 to $14,999 | 141 | 3.2% |
| $15,000 to $24,999 | 387 | 8.8% |
| $25,000 to $34,999 | 387 | 8.8% |
| $35,000 to $49,999 | 633 | 14.4% |
| $50,000 to $74,999 | 1,021 | 23.2% |
| $75,000 to $99,999 | 787 | 17.9% |
| $100,000 to $149,999 | 607 | 13.8% |
| $150,000 to $199,999 | 189 | 4.3% |
| $200,000+ | 97 | 2.2% |
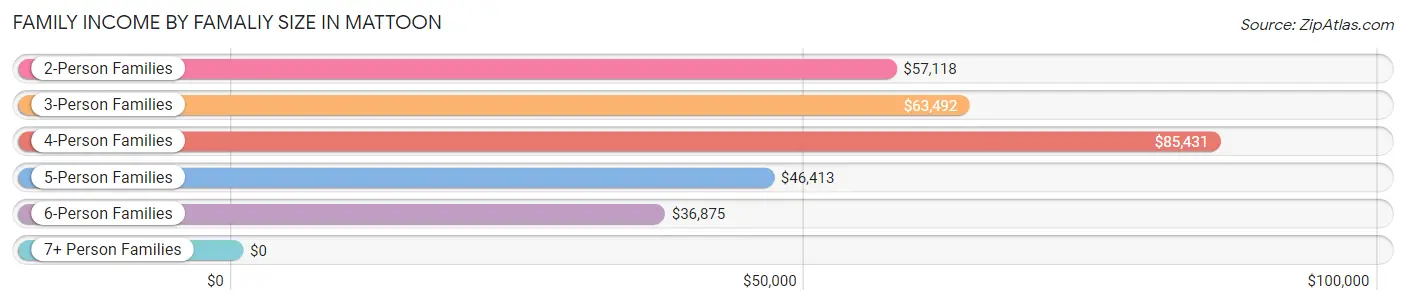
Family Income by Famaliy Size in Mattoon
4-person families (582 | 13.2%) account for the highest median family income in Mattoon with $85,431 per family, while 2-person families (2,399 | 54.5%) have the highest median income of $28,559 per family member.
| Income Bracket | # Families | Median Income |
| 2-Person Families | 2,399 (54.5%) | $57,118 |
| 3-Person Families | 1,133 (25.8%) | $63,492 |
| 4-Person Families | 582 (13.2%) | $85,431 |
| 5-Person Families | 244 (5.6%) | $46,413 |
| 6-Person Families | 34 (0.8%) | $36,875 |
| 7+ Person Families | 7 (0.2%) | $0 |
| Total | 4,399 (100.0%) | $63,082 |
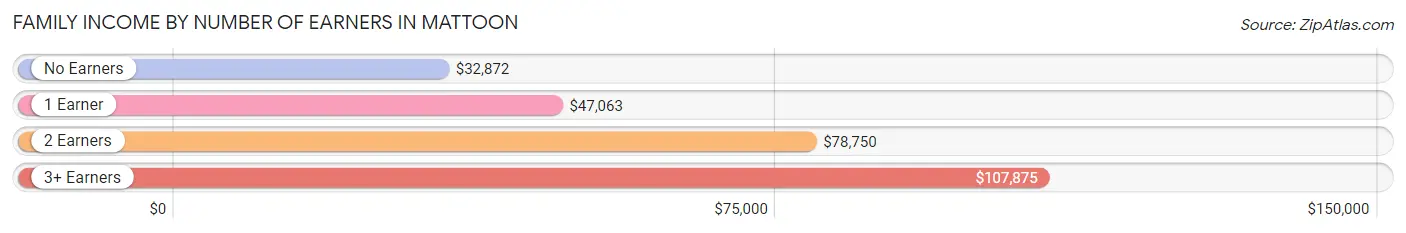
Family Income by Number of Earners in Mattoon
The median family income in Mattoon is $63,082, with families comprising 3+ earners (307) having the highest median family income of $107,875, while families with no earners (610) have the lowest median family income of $32,872, accounting for 7.0% and 13.9% of families, respectively.
| Number of Earners | # Families | Median Income |
| No Earners | 610 (13.9%) | $32,872 |
| 1 Earner | 1,529 (34.8%) | $47,063 |
| 2 Earners | 1,953 (44.4%) | $78,750 |
| 3+ Earners | 307 (7.0%) | $107,875 |
| Total | 4,399 (100.0%) | $63,082 |
Household Income in Mattoon
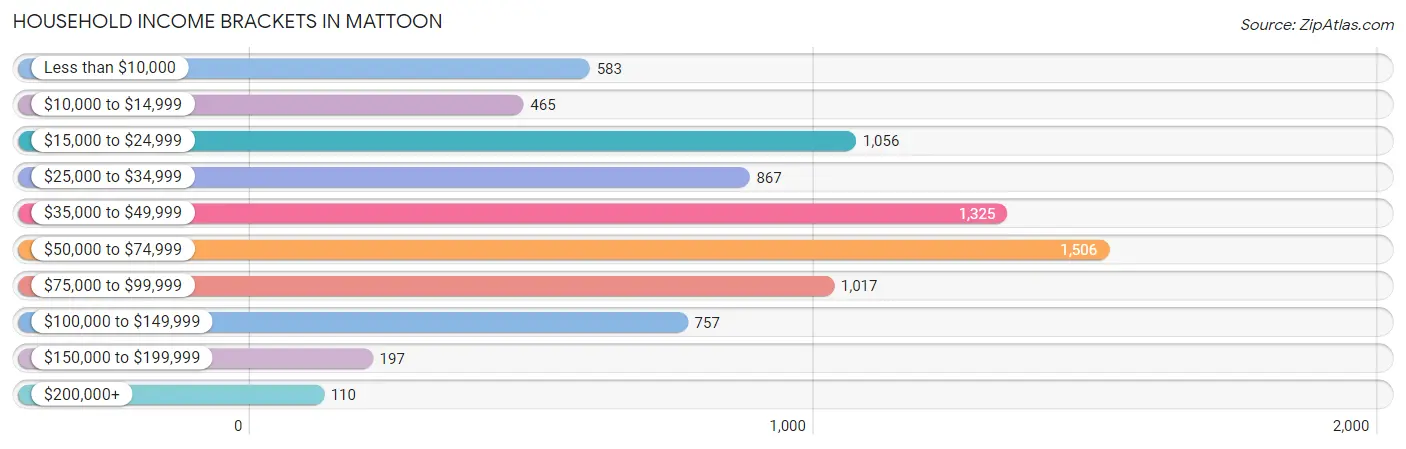
Household Income Brackets in Mattoon
With 1,506 households falling in the category, the $50,000 to $74,999 income range is the most frequent in Mattoon, accounting for 19.1% of all households. In contrast, only 110 households (1.4%) fall into the $200,000+ income bracket, making it the least populous group.
| Income Bracket | # Households | % Households |
| Less than $10,000 | 583 | 7.4% |
| $10,000 to $14,999 | 465 | 5.9% |
| $15,000 to $24,999 | 1,056 | 13.4% |
| $25,000 to $34,999 | 867 | 11.0% |
| $35,000 to $49,999 | 1,325 | 16.8% |
| $50,000 to $74,999 | 1,506 | 19.1% |
| $75,000 to $99,999 | 1,017 | 12.9% |
| $100,000 to $149,999 | 757 | 9.6% |
| $150,000 to $199,999 | 197 | 2.5% |
| $200,000+ | 110 | 1.4% |
Household Income by Householder Age in Mattoon
The median household income in Mattoon is $45,953, with the highest median household income of $52,225 found in the 45 to 64 years age bracket for the primary householder. A total of 2,705 households (34.3%) fall into this category. Meanwhile, the 65+ years age bracket for the primary householder has the lowest median household income of $36,795, with 2,247 households (28.5%) in this group.
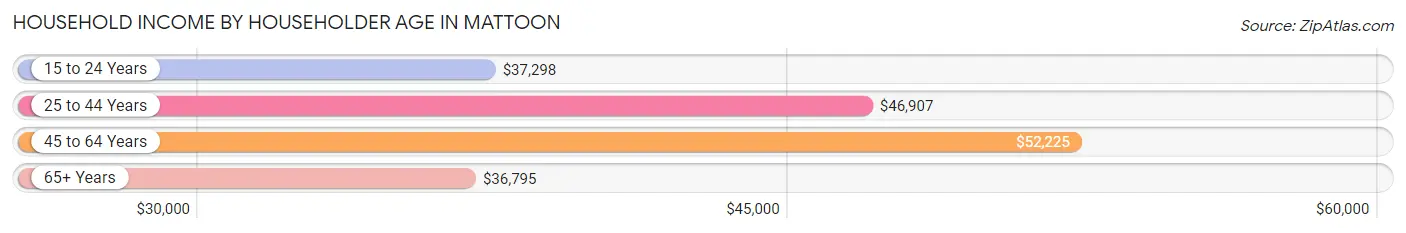
| Income Bracket | # Households | Median Income |
| 15 to 24 Years | 533 (6.8%) | $37,298 |
| 25 to 44 Years | 2,399 (30.4%) | $46,907 |
| 45 to 64 Years | 2,705 (34.3%) | $52,225 |
| 65+ Years | 2,247 (28.5%) | $36,795 |
| Total | 7,884 (100.0%) | $45,953 |
Poverty in Mattoon
Income Below Poverty by Sex and Age in Mattoon
With 19.1% poverty level for males and 23.0% for females among the residents of Mattoon, 12 to 14 year old males and 5 year old females are the most vulnerable to poverty, with 188 males (48.2%) and 84 females (76.4%) in their respective age groups living below the poverty level.
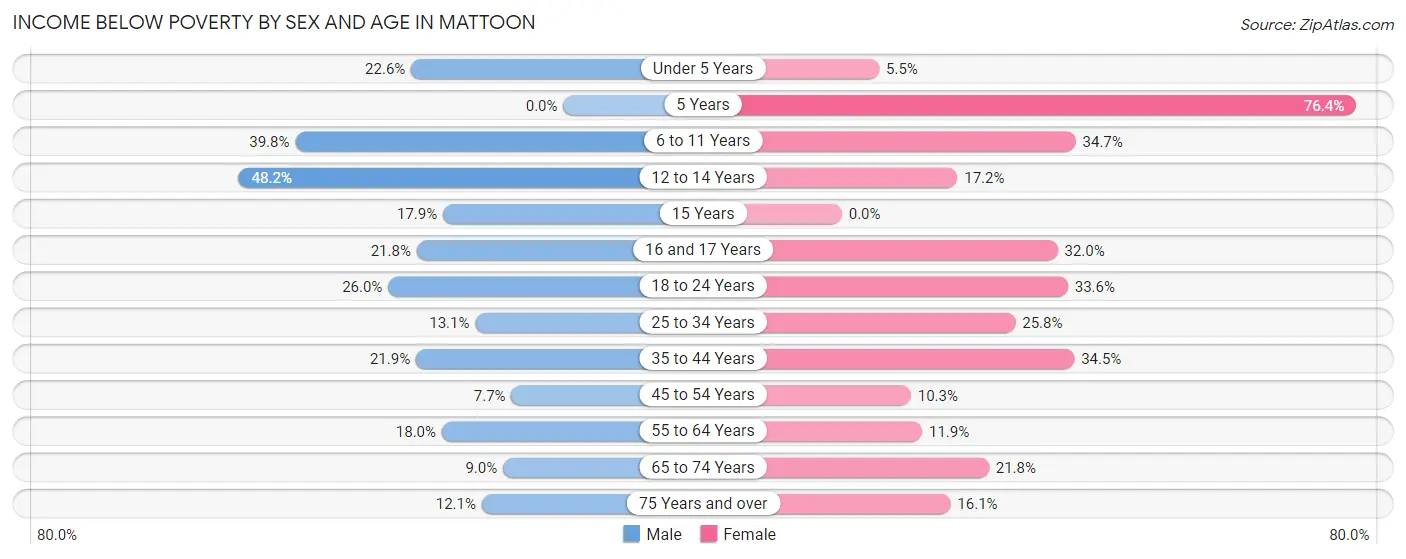
| Age Bracket | Male | Female |
| Under 5 Years | 101 (22.6%) | 24 (5.5%) |
| 5 Years | 0 (0.0%) | 84 (76.4%) |
| 6 to 11 Years | 201 (39.8%) | 258 (34.7%) |
| 12 to 14 Years | 188 (48.2%) | 41 (17.2%) |
| 15 Years | 30 (17.9%) | 0 (0.0%) |
| 16 and 17 Years | 32 (21.8%) | 58 (32.0%) |
| 18 to 24 Years | 206 (26.0%) | 242 (33.6%) |
| 25 to 34 Years | 132 (13.1%) | 272 (25.8%) |
| 35 to 44 Years | 244 (21.9%) | 373 (34.5%) |
| 45 to 54 Years | 83 (7.7%) | 104 (10.2%) |
| 55 to 64 Years | 191 (18.0%) | 124 (11.9%) |
| 65 to 74 Years | 67 (8.9%) | 219 (21.8%) |
| 75 Years and over | 59 (12.1%) | 110 (16.1%) |
| Total | 1,534 (19.1%) | 1,909 (23.0%) |
Income Above Poverty by Sex and Age in Mattoon
According to the poverty statistics in Mattoon, males aged 5 years and females aged 15 years are the age groups that are most secure financially, with 100.0% of males and 100.0% of females in these age groups living above the poverty line.
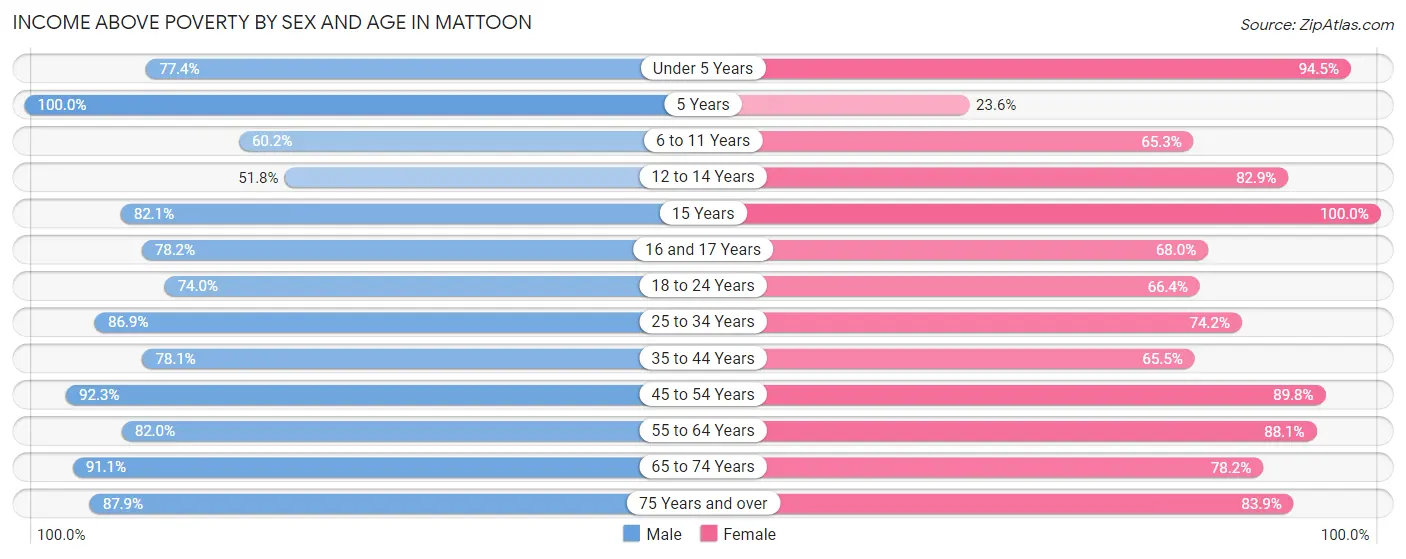
| Age Bracket | Male | Female |
| Under 5 Years | 346 (77.4%) | 409 (94.5%) |
| 5 Years | 89 (100.0%) | 26 (23.6%) |
| 6 to 11 Years | 304 (60.2%) | 485 (65.3%) |
| 12 to 14 Years | 202 (51.8%) | 198 (82.9%) |
| 15 Years | 138 (82.1%) | 10 (100.0%) |
| 16 and 17 Years | 115 (78.2%) | 123 (68.0%) |
| 18 to 24 Years | 586 (74.0%) | 479 (66.4%) |
| 25 to 34 Years | 877 (86.9%) | 784 (74.2%) |
| 35 to 44 Years | 871 (78.1%) | 708 (65.5%) |
| 45 to 54 Years | 994 (92.3%) | 911 (89.7%) |
| 55 to 64 Years | 868 (82.0%) | 916 (88.1%) |
| 65 to 74 Years | 682 (91.0%) | 784 (78.2%) |
| 75 Years and over | 428 (87.9%) | 572 (83.9%) |
| Total | 6,500 (80.9%) | 6,405 (77.0%) |
Income Below Poverty Among Married-Couple Families in Mattoon
The poverty statistics for married-couple families in Mattoon show that 3.5% or 93 of the total 2,659 families live below the poverty line. Families with 3 or 4 children have the highest poverty rate of 24.0%, comprising of 46 families. On the other hand, families with 5 or more children have the lowest poverty rate of 0.0%, which includes 0 families.
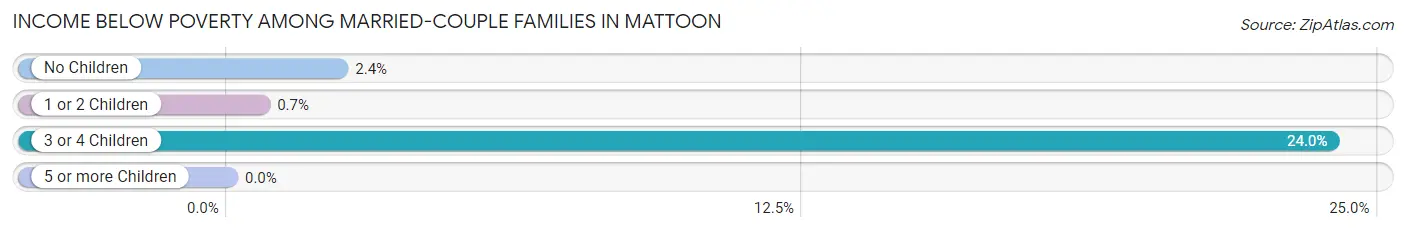
| Children | Above Poverty | Below Poverty |
| No Children | 1,705 (97.6%) | 42 (2.4%) |
| 1 or 2 Children | 708 (99.3%) | 5 (0.7%) |
| 3 or 4 Children | 146 (76.0%) | 46 (24.0%) |
| 5 or more Children | 7 (100.0%) | 0 (0.0%) |
| Total | 2,566 (96.5%) | 93 (3.5%) |
Income Below Poverty Among Single-Parent Households in Mattoon
According to the poverty data in Mattoon, 40.7% or 195 single-father households and 23.8% or 300 single-mother households are living below the poverty line. Among single-father households, those with 3 or 4 children have the highest poverty rate, with 19 households (100.0%) experiencing poverty. Likewise, among single-mother households, those with 5 or more children have the highest poverty rate, with 14 households (100.0%) falling below the poverty line.
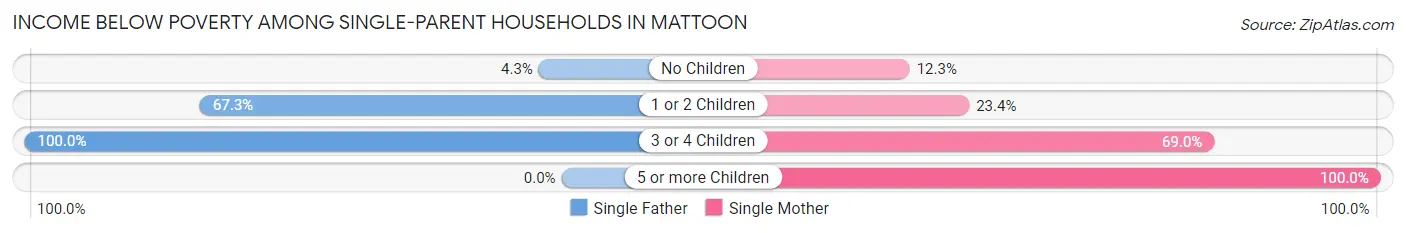
| Children | Single Father | Single Mother |
| No Children | 9 (4.3%) | 57 (12.3%) |
| 1 or 2 Children | 167 (67.3%) | 160 (23.4%) |
| 3 or 4 Children | 19 (100.0%) | 69 (69.0%) |
| 5 or more Children | 0 (0.0%) | 14 (100.0%) |
| Total | 195 (40.7%) | 300 (23.8%) |
Income Below Poverty Among Married-Couple vs Single-Parent Households in Mattoon
The poverty data for Mattoon shows that 93 of the married-couple family households (3.5%) and 495 of the single-parent households (28.4%) are living below the poverty level. Within the married-couple family households, those with 3 or 4 children have the highest poverty rate, with 46 households (24.0%) falling below the poverty line. Among the single-parent households, those with 5 or more children have the highest poverty rate, with 14 household (100.0%) living below poverty.
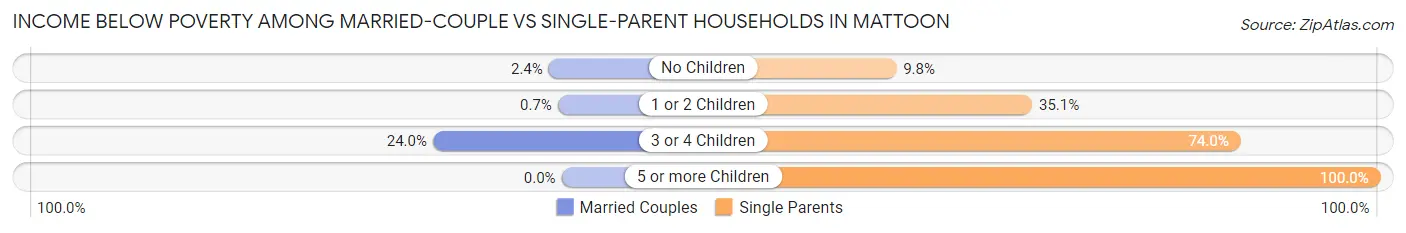
| Children | Married-Couple Families | Single-Parent Households |
| No Children | 42 (2.4%) | 66 (9.8%) |
| 1 or 2 Children | 5 (0.7%) | 327 (35.1%) |
| 3 or 4 Children | 46 (24.0%) | 88 (74.0%) |
| 5 or more Children | 0 (0.0%) | 14 (100.0%) |
| Total | 93 (3.5%) | 495 (28.4%) |
Race in Mattoon
The most populous races in Mattoon are White / Caucasian (15,741 | 93.5%), Two or more Races (588 | 3.5%), and Hispanic or Latino (410 | 2.4%).
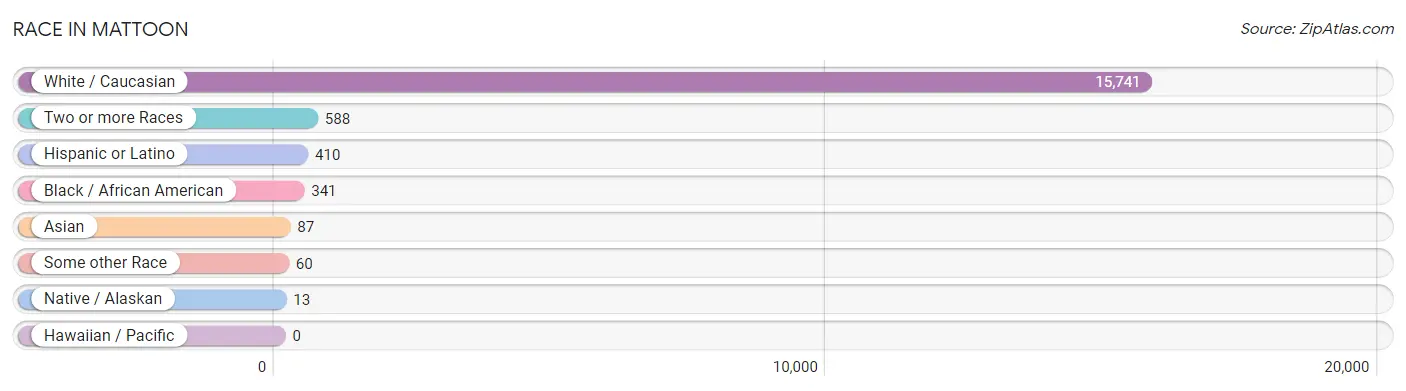
| Race | # Population | % Population |
| Asian | 87 | 0.5% |
| Black / African American | 341 | 2.0% |
| Hawaiian / Pacific | 0 | 0.0% |
| Hispanic or Latino | 410 | 2.4% |
| Native / Alaskan | 13 | 0.1% |
| White / Caucasian | 15,741 | 93.5% |
| Two or more Races | 588 | 3.5% |
| Some other Race | 60 | 0.4% |
| Total | 16,830 | 100.0% |
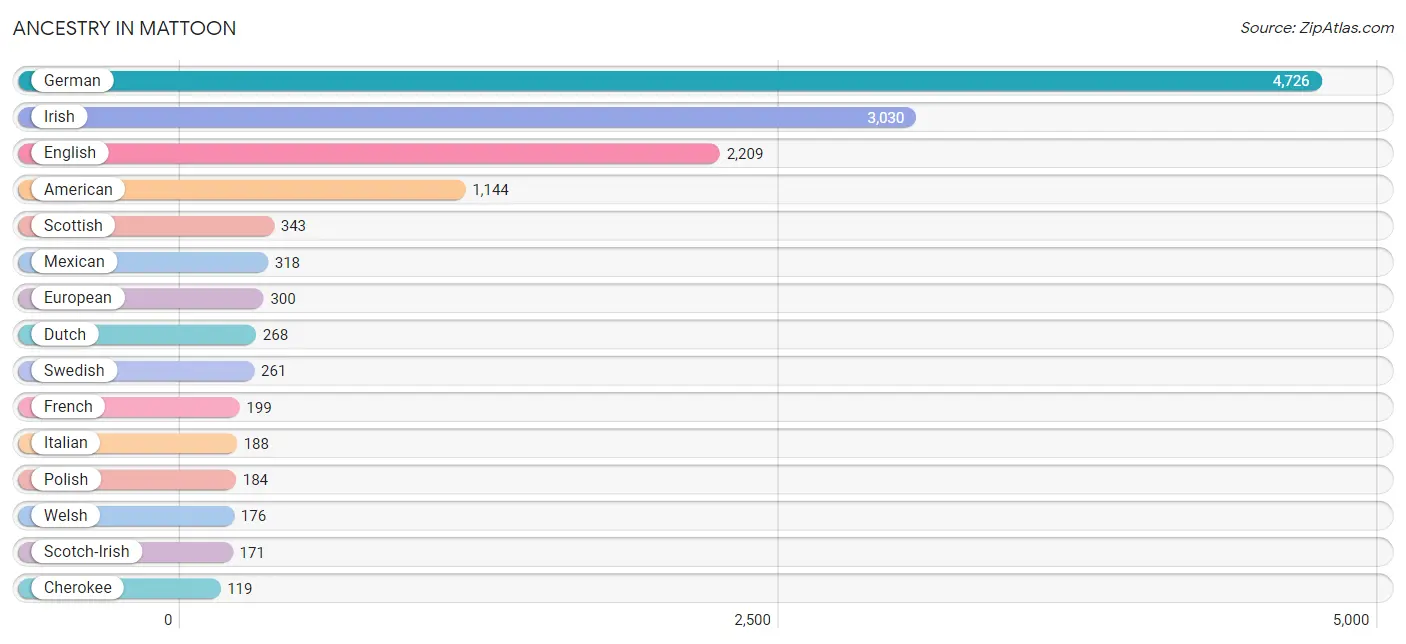
Ancestry in Mattoon
The most populous ancestries reported in Mattoon are German (4,726 | 28.1%), Irish (3,030 | 18.0%), English (2,209 | 13.1%), American (1,144 | 6.8%), and Scottish (343 | 2.0%), together accounting for 68.0% of all Mattoon residents.
| Ancestry | # Population | % Population |
| African | 65 | 0.4% |
| American | 1,144 | 6.8% |
| Belgian | 12 | 0.1% |
| Bhutanese | 10 | 0.1% |
| Blackfeet | 8 | 0.1% |
| British | 60 | 0.4% |
| Canadian | 47 | 0.3% |
| Cherokee | 119 | 0.7% |
| Cuban | 13 | 0.1% |
| Czech | 103 | 0.6% |
| Czechoslovakian | 6 | 0.0% |
| Danish | 33 | 0.2% |
| Dutch | 268 | 1.6% |
| Eastern European | 25 | 0.2% |
| English | 2,209 | 13.1% |
| European | 300 | 1.8% |
| Finnish | 85 | 0.5% |
| French | 199 | 1.2% |
| French Canadian | 41 | 0.2% |
| German | 4,726 | 28.1% |
| Greek | 19 | 0.1% |
| Hungarian | 8 | 0.1% |
| Indian (Asian) | 8 | 0.1% |
| Irish | 3,030 | 18.0% |
| Italian | 188 | 1.1% |
| Japanese | 11 | 0.1% |
| Korean | 96 | 0.6% |
| Lithuanian | 10 | 0.1% |
| Mexican | 318 | 1.9% |
| Nigerian | 49 | 0.3% |
| Northern European | 11 | 0.1% |
| Norwegian | 47 | 0.3% |
| Pakistani | 4 | 0.0% |
| Pennsylvania German | 41 | 0.2% |
| Polish | 184 | 1.1% |
| Puerto Rican | 56 | 0.3% |
| Scandinavian | 1 | 0.0% |
| Scotch-Irish | 171 | 1.0% |
| Scottish | 343 | 2.0% |
| Serbian | 29 | 0.2% |
| Shoshone | 44 | 0.3% |
| South American | 23 | 0.1% |
| Subsaharan African | 101 | 0.6% |
| Swedish | 261 | 1.5% |
| Swiss | 71 | 0.4% |
| Tongan | 11 | 0.1% |
| Ukrainian | 13 | 0.1% |
| Venezuelan | 23 | 0.1% |
| Welsh | 176 | 1.1% |
| Yugoslavian | 17 | 0.1% | View All 50 Rows |
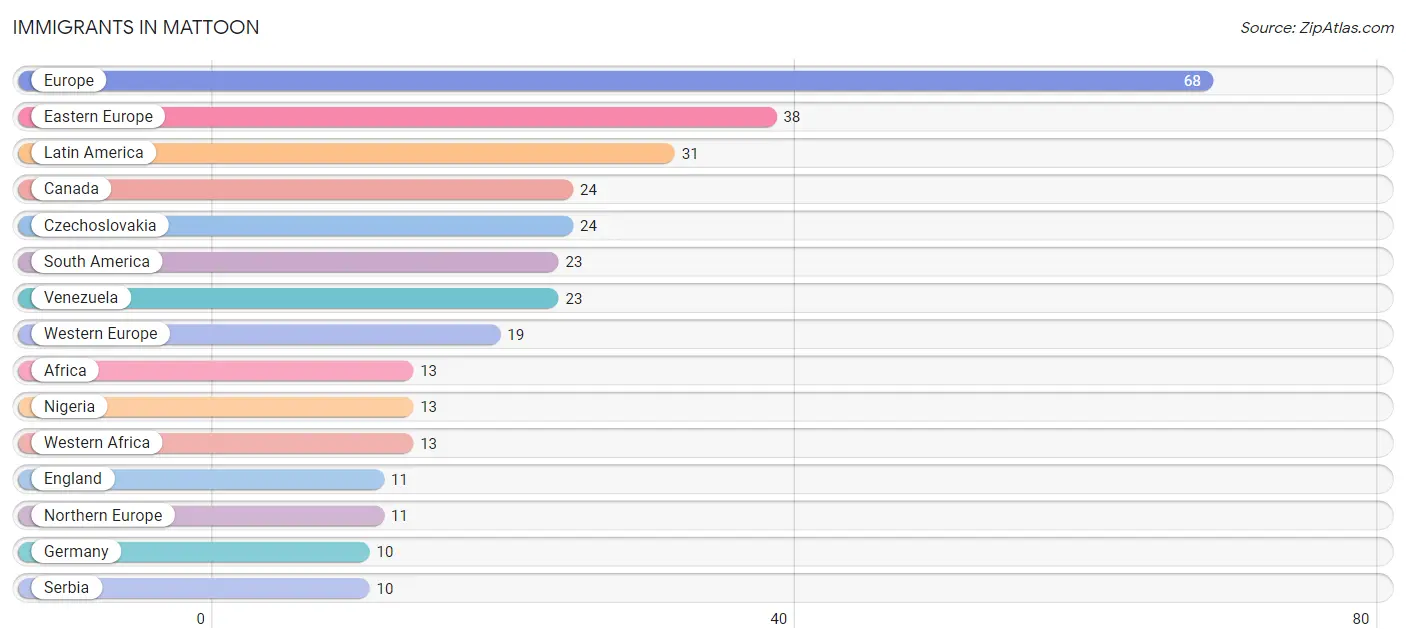
Immigrants in Mattoon
The most numerous immigrant groups reported in Mattoon came from Europe (68 | 0.4%), Eastern Europe (38 | 0.2%), Latin America (31 | 0.2%), Canada (24 | 0.1%), and Czechoslovakia (24 | 0.1%), together accounting for 1.1% of all Mattoon residents.
| Immigration Origin | # Population | % Population |
| Africa | 13 | 0.1% |
| Asia | 4 | 0.0% |
| Cambodia | 4 | 0.0% |
| Canada | 24 | 0.1% |
| Central America | 8 | 0.1% |
| Czechoslovakia | 24 | 0.1% |
| Eastern Europe | 38 | 0.2% |
| England | 11 | 0.1% |
| Europe | 68 | 0.4% |
| France | 9 | 0.1% |
| Germany | 10 | 0.1% |
| Latin America | 31 | 0.2% |
| Mexico | 8 | 0.1% |
| Nigeria | 13 | 0.1% |
| Northern Europe | 11 | 0.1% |
| Russia | 4 | 0.0% |
| Serbia | 10 | 0.1% |
| South America | 23 | 0.1% |
| South Eastern Asia | 4 | 0.0% |
| Venezuela | 23 | 0.1% |
| Western Africa | 13 | 0.1% |
| Western Europe | 19 | 0.1% | View All 22 Rows |
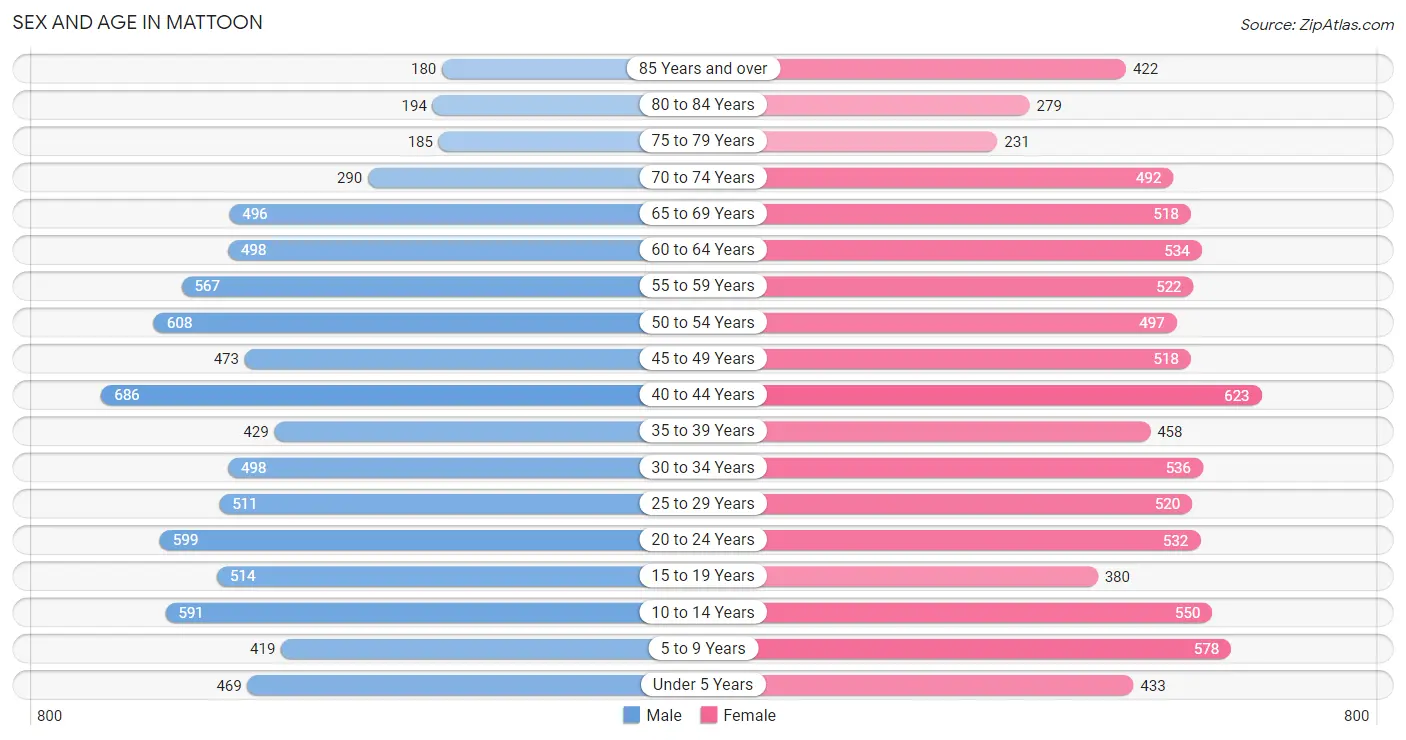
Sex and Age in Mattoon
Sex and Age in Mattoon
The most populous age groups in Mattoon are 40 to 44 Years (686 | 8.4%) for men and 40 to 44 Years (623 | 7.2%) for women.
| Age Bracket | Male | Female |
| Under 5 Years | 469 (5.7%) | 433 (5.0%) |
| 5 to 9 Years | 419 (5.1%) | 578 (6.7%) |
| 10 to 14 Years | 591 (7.2%) | 550 (6.4%) |
| 15 to 19 Years | 514 (6.3%) | 380 (4.4%) |
| 20 to 24 Years | 599 (7.3%) | 532 (6.2%) |
| 25 to 29 Years | 511 (6.2%) | 520 (6.0%) |
| 30 to 34 Years | 498 (6.1%) | 536 (6.2%) |
| 35 to 39 Years | 429 (5.2%) | 458 (5.3%) |
| 40 to 44 Years | 686 (8.4%) | 623 (7.2%) |
| 45 to 49 Years | 473 (5.8%) | 518 (6.0%) |
| 50 to 54 Years | 608 (7.4%) | 497 (5.8%) |
| 55 to 59 Years | 567 (6.9%) | 522 (6.0%) |
| 60 to 64 Years | 498 (6.1%) | 534 (6.2%) |
| 65 to 69 Years | 496 (6.0%) | 518 (6.0%) |
| 70 to 74 Years | 290 (3.5%) | 492 (5.7%) |
| 75 to 79 Years | 185 (2.2%) | 231 (2.7%) |
| 80 to 84 Years | 194 (2.4%) | 279 (3.2%) |
| 85 Years and over | 180 (2.2%) | 422 (4.9%) |
| Total | 8,207 (100.0%) | 8,623 (100.0%) |
Families and Households in Mattoon
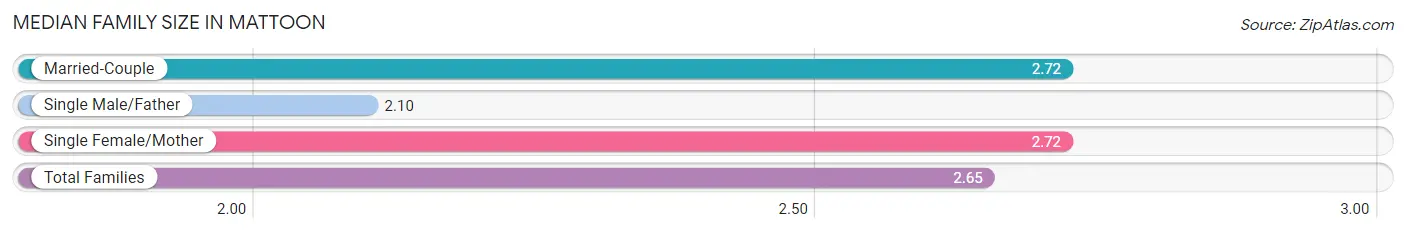
Median Family Size in Mattoon
The median family size in Mattoon is 2.65 persons per family, with married-couple families (2,659 | 60.5%) accounting for the largest median family size of 2.72 persons per family. On the other hand, single male/father families (479 | 10.9%) represent the smallest median family size with 2.10 persons per family.
| Family Type | # Families | Family Size |
| Married-Couple | 2,659 (60.5%) | 2.72 |
| Single Male/Father | 479 (10.9%) | 2.10 |
| Single Female/Mother | 1,261 (28.7%) | 2.72 |
| Total Families | 4,399 (100.0%) | 2.65 |
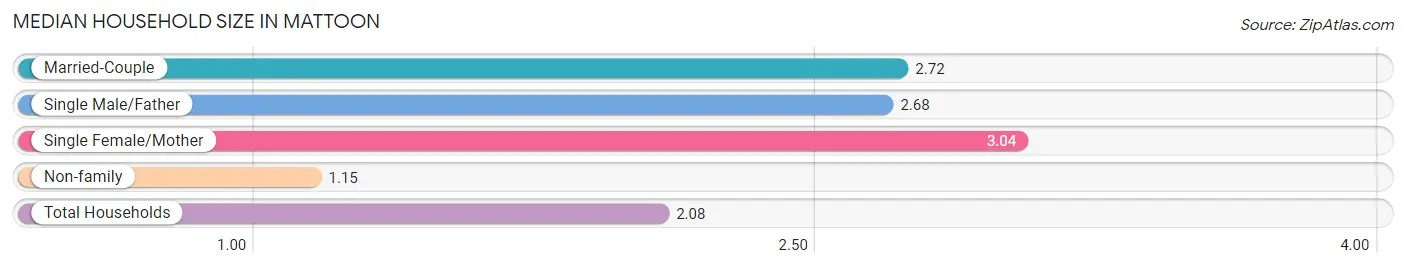
Median Household Size in Mattoon
The median household size in Mattoon is 2.08 persons per household, with single female/mother households (1,261 | 16.0%) accounting for the largest median household size of 3.04 persons per household. non-family households (3,485 | 44.2%) represent the smallest median household size with 1.15 persons per household.
| Household Type | # Households | Household Size |
| Married-Couple | 2,659 (33.7%) | 2.72 |
| Single Male/Father | 479 (6.1%) | 2.68 |
| Single Female/Mother | 1,261 (16.0%) | 3.04 |
| Non-family | 3,485 (44.2%) | 1.15 |
| Total Households | 7,884 (100.0%) | 2.08 |
Household Size by Marriage Status in Mattoon
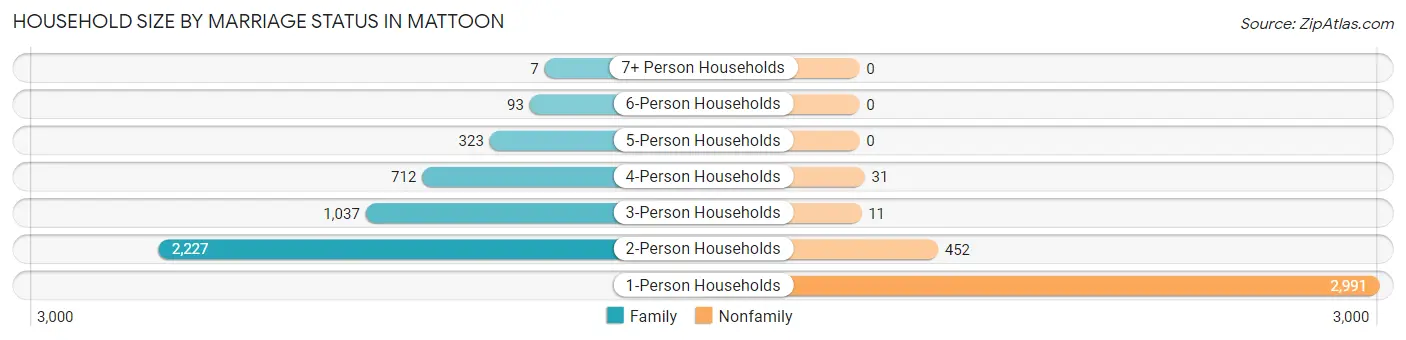
Out of a total of 7,884 households in Mattoon, 4,399 (55.8%) are family households, while 3,485 (44.2%) are nonfamily households. The most numerous type of family households are 2-person households, comprising 2,227, and the most common type of nonfamily households are 1-person households, comprising 2,991.
| Household Size | Family Households | Nonfamily Households |
| 1-Person Households | - | 2,991 (37.9%) |
| 2-Person Households | 2,227 (28.2%) | 452 (5.7%) |
| 3-Person Households | 1,037 (13.2%) | 11 (0.1%) |
| 4-Person Households | 712 (9.0%) | 31 (0.4%) |
| 5-Person Households | 323 (4.1%) | 0 (0.0%) |
| 6-Person Households | 93 (1.2%) | 0 (0.0%) |
| 7+ Person Households | 7 (0.1%) | 0 (0.0%) |
| Total | 4,399 (55.8%) | 3,485 (44.2%) |
Female Fertility in Mattoon
Fertility by Age in Mattoon
Average fertility rate in Mattoon is 47.0 births per 1,000 women. Women in the age bracket of 20 to 34 years have the highest fertility rate with 98.0 births per 1,000 women. Women in the age bracket of 20 to 34 years acount for 92.3% of all women with births.

| Age Bracket | Women with Births | Births / 1,000 Women |
| 15 to 19 years | 0 (0.0%) | 0.0 |
| 20 to 34 years | 156 (92.3%) | 98.0 |
| 35 to 50 years | 13 (7.7%) | 8.0 |
| Total | 169 (100.0%) | 47.0 |
Fertility by Age by Marriage Status in Mattoon
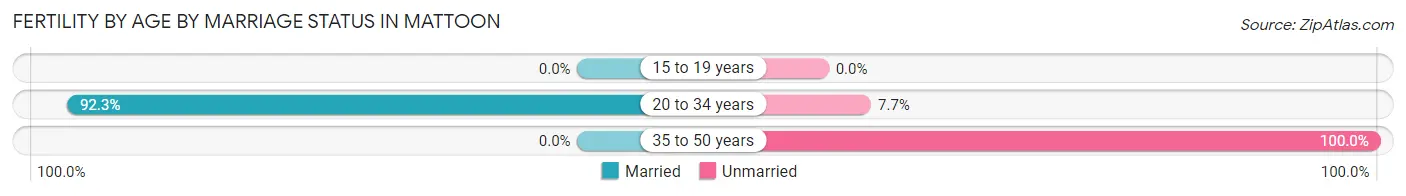
85.2% of women with births (169) in Mattoon are married. The highest percentage of unmarried women with births falls into 35 to 50 years age bracket with 100.0% of them unmarried at the time of birth, while the lowest percentage of unmarried women with births belong to 20 to 34 years age bracket with 7.7% of them unmarried.
| Age Bracket | Married | Unmarried |
| 15 to 19 years | 0 (0.0%) | 0 (0.0%) |
| 20 to 34 years | 144 (92.3%) | 12 (7.7%) |
| 35 to 50 years | 0 (0.0%) | 13 (100.0%) |
| Total | 144 (85.2%) | 25 (14.8%) |
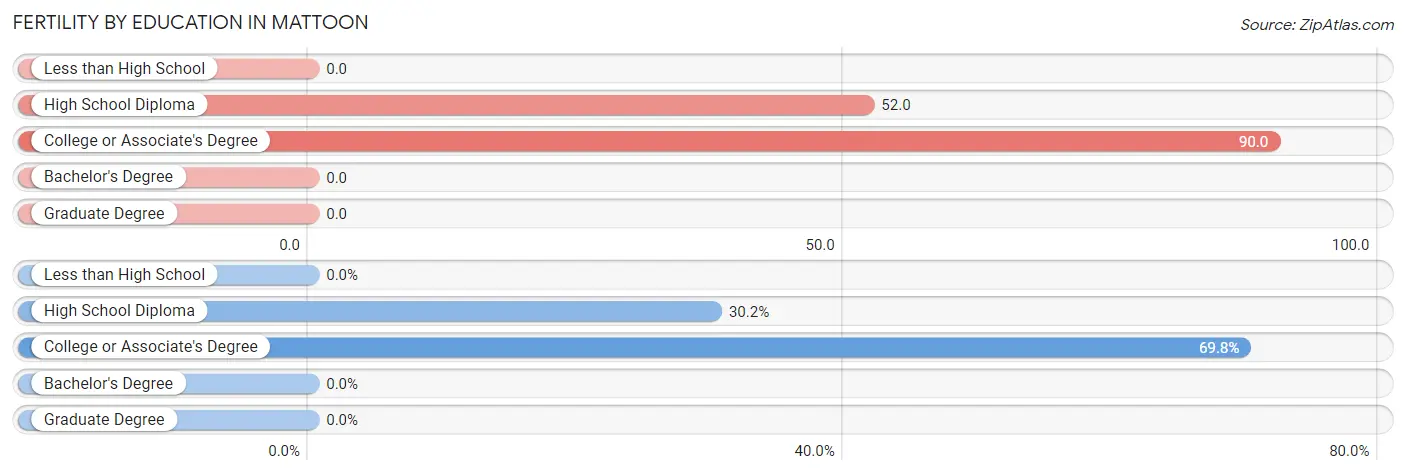
Fertility by Education in Mattoon
| Educational Attainment | Women with Births | Births / 1,000 Women |
| Less than High School | 0 (0.0%) | 0.0 |
| High School Diploma | 51 (30.2%) | 52.0 |
| College or Associate's Degree | 118 (69.8%) | 90.0 |
| Bachelor's Degree | 0 (0.0%) | 0.0 |
| Graduate Degree | 0 (0.0%) | 0.0 |
| Total | 169 (100.0%) | 47.0 |
Fertility by Education by Marriage Status in Mattoon
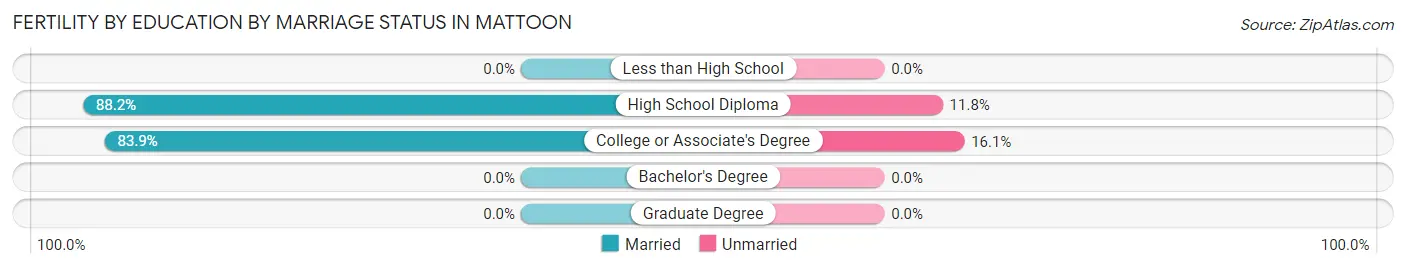
14.8% of women with births in Mattoon are unmarried. Women with the educational attainment of high school diploma are most likely to be married with 88.2% of them married at childbirth, while women with the educational attainment of college or associate's degree are least likely to be married with 16.1% of them unmarried at childbirth.
| Educational Attainment | Married | Unmarried |
| Less than High School | 0 (0.0%) | 0 (0.0%) |
| High School Diploma | 45 (88.2%) | 6 (11.8%) |
| College or Associate's Degree | 99 (83.9%) | 19 (16.1%) |
| Bachelor's Degree | 0 (0.0%) | 0 (0.0%) |
| Graduate Degree | 0 (0.0%) | 0 (0.0%) |
| Total | 144 (85.2%) | 25 (14.8%) |
Employment Characteristics in Mattoon
Employment by Class of Employer in Mattoon
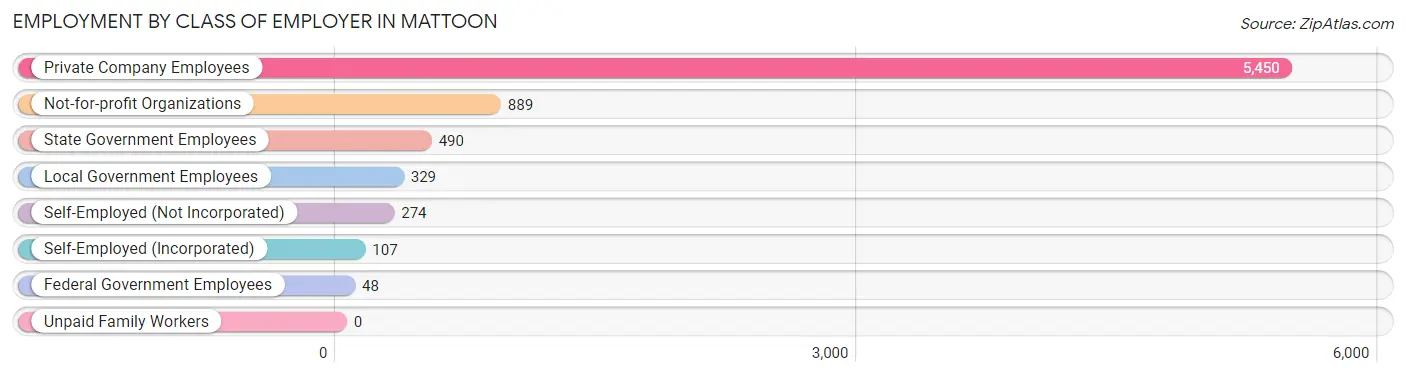
Among the 7,587 employed individuals in Mattoon, private company employees (5,450 | 71.8%), not-for-profit organizations (889 | 11.7%), and state government employees (490 | 6.5%) make up the most common classes of employment.
| Employer Class | # Employees | % Employees |
| Private Company Employees | 5,450 | 71.8% |
| Self-Employed (Incorporated) | 107 | 1.4% |
| Self-Employed (Not Incorporated) | 274 | 3.6% |
| Not-for-profit Organizations | 889 | 11.7% |
| Local Government Employees | 329 | 4.3% |
| State Government Employees | 490 | 6.5% |
| Federal Government Employees | 48 | 0.6% |
| Unpaid Family Workers | 0 | 0.0% |
| Total | 7,587 | 100.0% |
Employment Status by Age in Mattoon
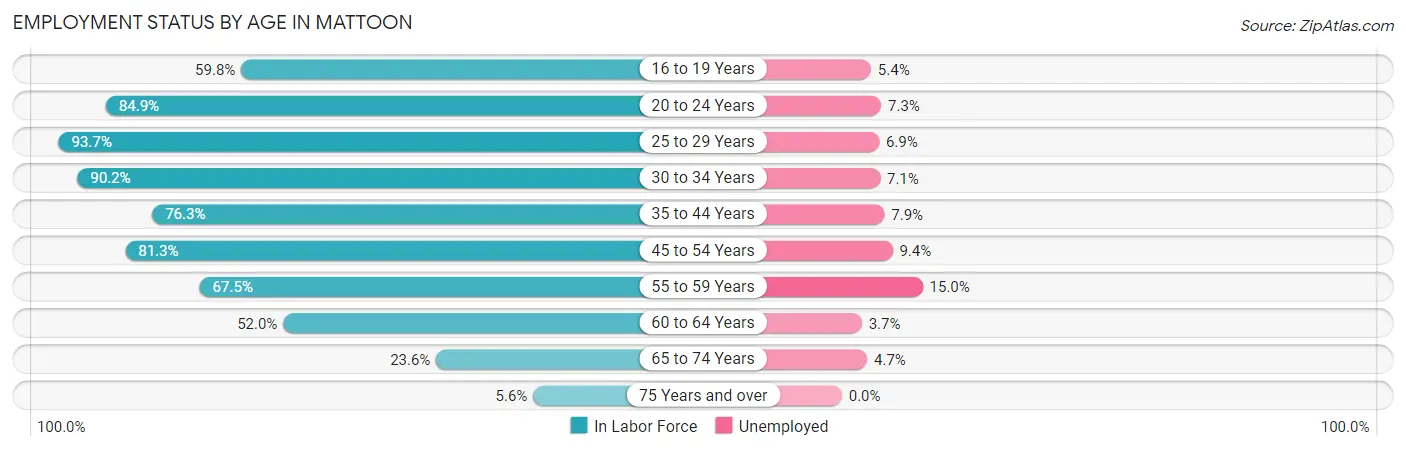
According to the labor force statistics for Mattoon, out of the total population over 16 years of age (13,610), 62.0% or 8,438 individuals are in the labor force, with 7.9% or 667 of them unemployed. The age group with the highest labor force participation rate is 25 to 29 years, with 93.7% or 966 individuals in the labor force. Within the labor force, the 55 to 59 years age range has the highest percentage of unemployed individuals, with 15.0% or 110 of them being unemployed.
| Age Bracket | In Labor Force | Unemployed |
| 16 to 19 Years | 427 (59.8%) | 23 (5.4%) |
| 20 to 24 Years | 960 (84.9%) | 70 (7.3%) |
| 25 to 29 Years | 966 (93.7%) | 67 (6.9%) |
| 30 to 34 Years | 933 (90.2%) | 66 (7.1%) |
| 35 to 44 Years | 1,676 (76.3%) | 132 (7.9%) |
| 45 to 54 Years | 1,704 (81.3%) | 160 (9.4%) |
| 55 to 59 Years | 735 (67.5%) | 110 (15.0%) |
| 60 to 64 Years | 537 (52.0%) | 20 (3.7%) |
| 65 to 74 Years | 424 (23.6%) | 20 (4.7%) |
| 75 Years and over | 83 (5.6%) | 0 (0.0%) |
| Total | 8,438 (62.0%) | 667 (7.9%) |
Employment Status by Educational Attainment in Mattoon
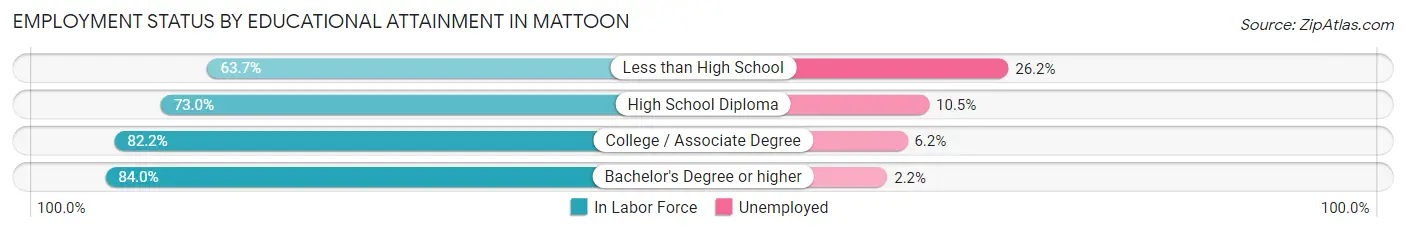
According to labor force statistics for Mattoon, 77.2% of individuals (6,545) out of the total population between 25 and 64 years of age (8,478) are in the labor force, with 8.5% or 556 of them being unemployed. The group with the highest labor force participation rate are those with the educational attainment of bachelor's degree or higher, with 84.0% or 1,358 individuals in the labor force. Within the labor force, individuals with less than high school education have the highest percentage of unemployment, with 26.2% or 135 of them being unemployed.
| Educational Attainment | In Labor Force | Unemployed |
| Less than High School | 515 (63.7%) | 212 (26.2%) |
| High School Diploma | 2,382 (73.0%) | 343 (10.5%) |
| College / Associate Degree | 2,293 (82.2%) | 173 (6.2%) |
| Bachelor's Degree or higher | 1,358 (84.0%) | 36 (2.2%) |
| Total | 6,545 (77.2%) | 721 (8.5%) |
Employment Occupations by Sex in Mattoon
Management, Business, Science and Arts Occupations
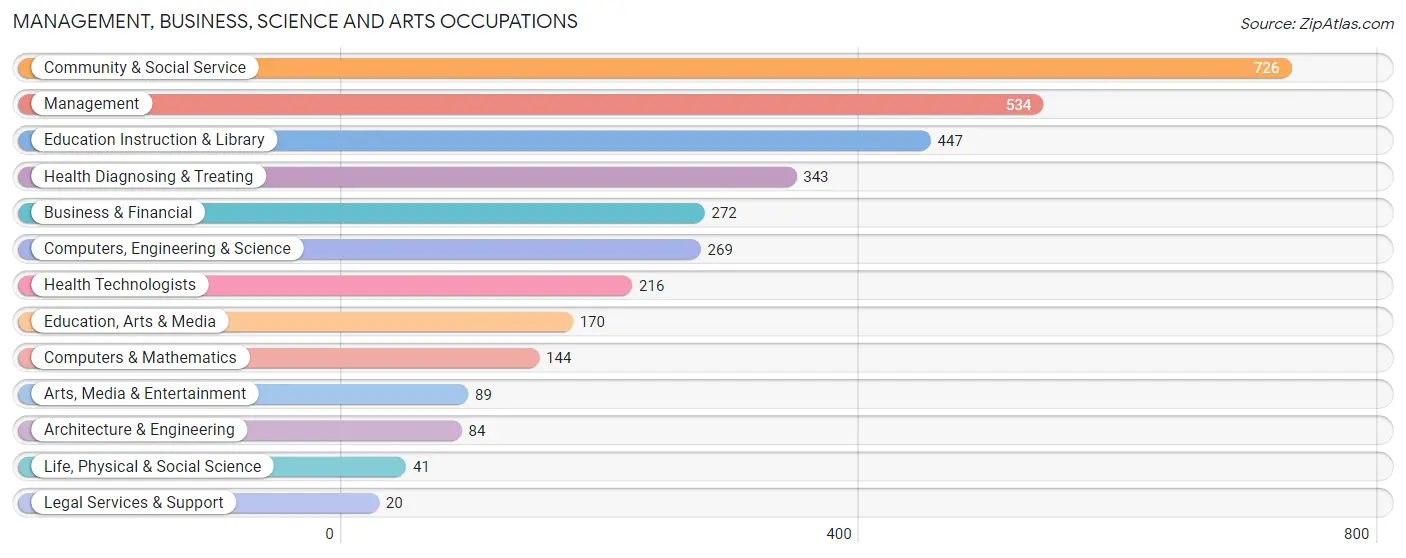
The most common Management, Business, Science and Arts occupations in Mattoon are Community & Social Service (726 | 9.3%), Management (534 | 6.9%), Education Instruction & Library (447 | 5.8%), Health Diagnosing & Treating (343 | 4.4%), and Business & Financial (272 | 3.5%).
Management, Business, Science and Arts Occupations by Sex
Within the Management, Business, Science and Arts occupations in Mattoon, the most male-oriented occupations are Architecture & Engineering (100.0%), Legal Services & Support (100.0%), and Computers, Engineering & Science (65.1%), while the most female-oriented occupations are Life, Physical & Social Science (100.0%), Health Technologists (92.1%), and Education Instruction & Library (88.1%).
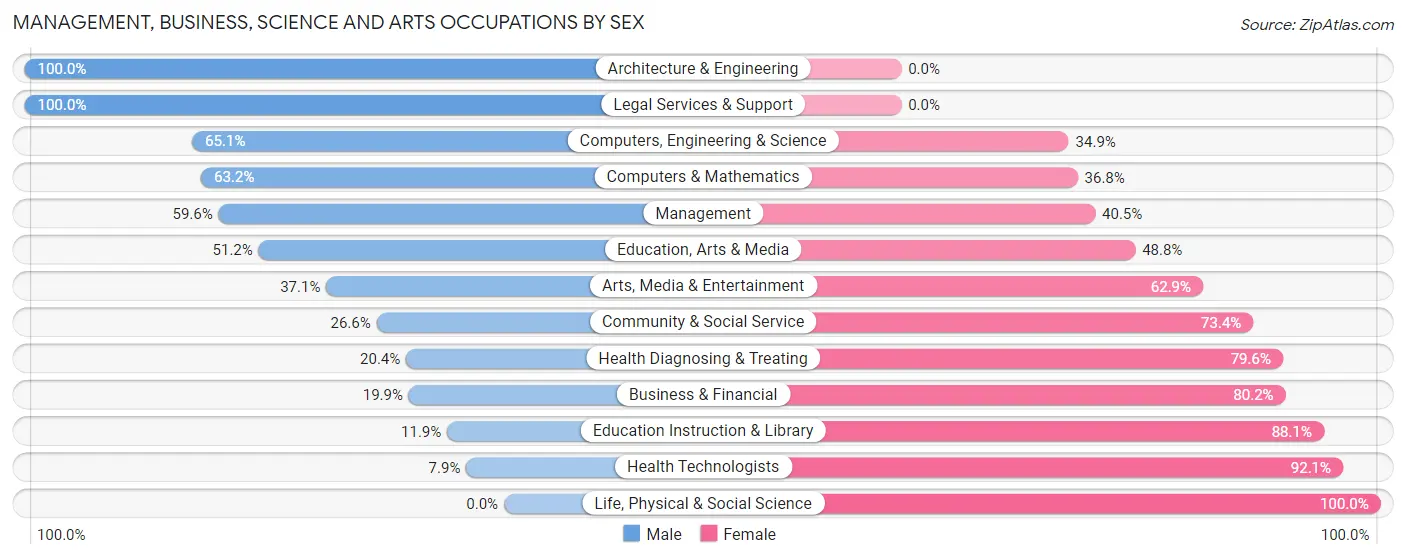
| Occupation | Male | Female |
| Management | 318 (59.6%) | 216 (40.5%) |
| Business & Financial | 54 (19.9%) | 218 (80.1%) |
| Computers, Engineering & Science | 175 (65.1%) | 94 (34.9%) |
| Computers & Mathematics | 91 (63.2%) | 53 (36.8%) |
| Architecture & Engineering | 84 (100.0%) | 0 (0.0%) |
| Life, Physical & Social Science | 0 (0.0%) | 41 (100.0%) |
| Community & Social Service | 193 (26.6%) | 533 (73.4%) |
| Education, Arts & Media | 87 (51.2%) | 83 (48.8%) |
| Legal Services & Support | 20 (100.0%) | 0 (0.0%) |
| Education Instruction & Library | 53 (11.9%) | 394 (88.1%) |
| Arts, Media & Entertainment | 33 (37.1%) | 56 (62.9%) |
| Health Diagnosing & Treating | 70 (20.4%) | 273 (79.6%) |
| Health Technologists | 17 (7.9%) | 199 (92.1%) |
| Total (Category) | 810 (37.8%) | 1,334 (62.2%) |
| Total (Overall) | 4,042 (52.0%) | 3,731 (48.0%) |
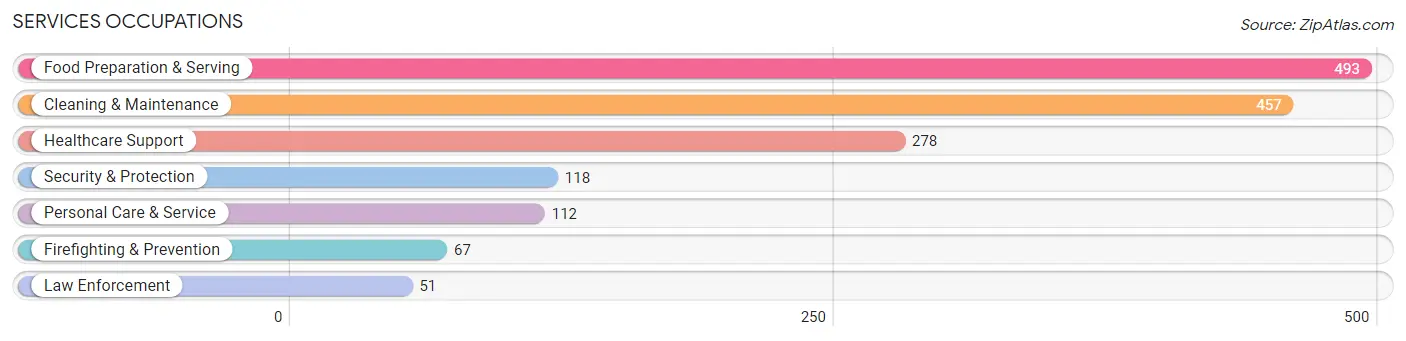
Services Occupations
The most common Services occupations in Mattoon are Food Preparation & Serving (493 | 6.3%), Cleaning & Maintenance (457 | 5.9%), Healthcare Support (278 | 3.6%), Security & Protection (118 | 1.5%), and Personal Care & Service (112 | 1.4%).
Services Occupations by Sex
Within the Services occupations in Mattoon, the most male-oriented occupations are Security & Protection (100.0%), Firefighting & Prevention (100.0%), and Law Enforcement (100.0%), while the most female-oriented occupations are Healthcare Support (100.0%), Personal Care & Service (76.8%), and Cleaning & Maintenance (54.0%).
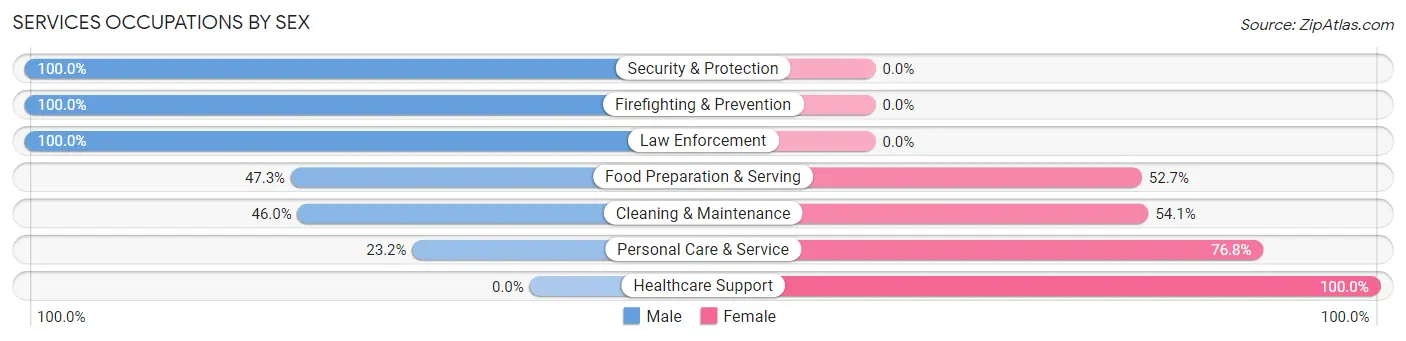
| Occupation | Male | Female |
| Healthcare Support | 0 (0.0%) | 278 (100.0%) |
| Security & Protection | 118 (100.0%) | 0 (0.0%) |
| Firefighting & Prevention | 67 (100.0%) | 0 (0.0%) |
| Law Enforcement | 51 (100.0%) | 0 (0.0%) |
| Food Preparation & Serving | 233 (47.3%) | 260 (52.7%) |
| Cleaning & Maintenance | 210 (46.0%) | 247 (54.0%) |
| Personal Care & Service | 26 (23.2%) | 86 (76.8%) |
| Total (Category) | 587 (40.3%) | 871 (59.7%) |
| Total (Overall) | 4,042 (52.0%) | 3,731 (48.0%) |
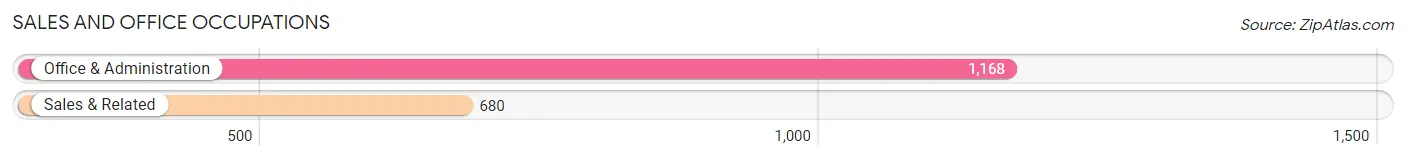
Sales and Office Occupations
The most common Sales and Office occupations in Mattoon are Office & Administration (1,168 | 15.0%), and Sales & Related (680 | 8.7%).
Sales and Office Occupations by Sex
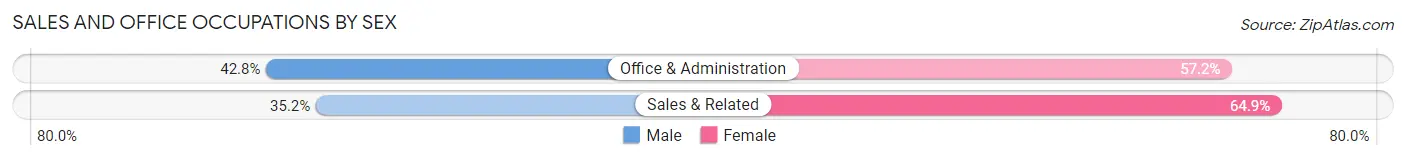
| Occupation | Male | Female |
| Sales & Related | 239 (35.1%) | 441 (64.8%) |
| Office & Administration | 500 (42.8%) | 668 (57.2%) |
| Total (Category) | 739 (40.0%) | 1,109 (60.0%) |
| Total (Overall) | 4,042 (52.0%) | 3,731 (48.0%) |
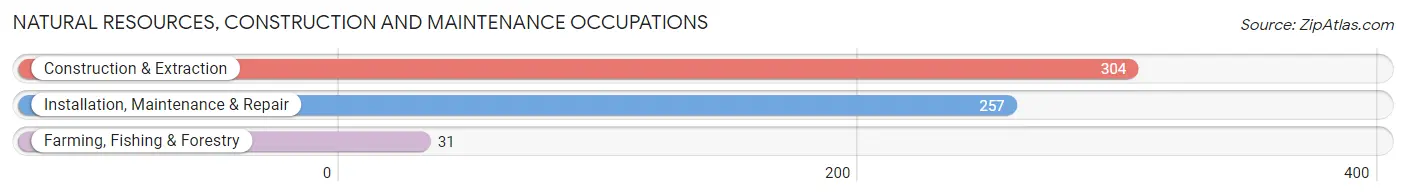
Natural Resources, Construction and Maintenance Occupations
The most common Natural Resources, Construction and Maintenance occupations in Mattoon are Construction & Extraction (304 | 3.9%), Installation, Maintenance & Repair (257 | 3.3%), and Farming, Fishing & Forestry (31 | 0.4%).
Natural Resources, Construction and Maintenance Occupations by Sex
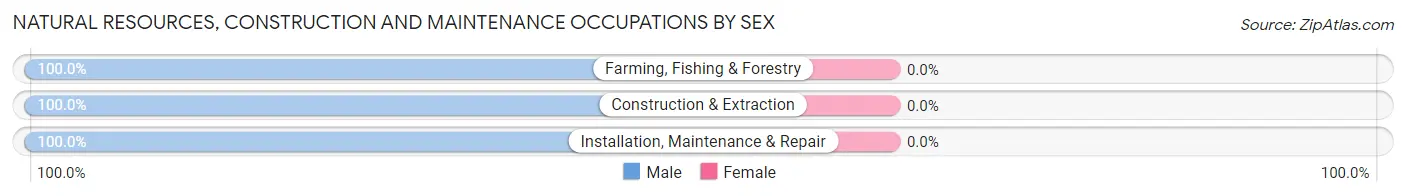
| Occupation | Male | Female |
| Farming, Fishing & Forestry | 31 (100.0%) | 0 (0.0%) |
| Construction & Extraction | 304 (100.0%) | 0 (0.0%) |
| Installation, Maintenance & Repair | 257 (100.0%) | 0 (0.0%) |
| Total (Category) | 592 (100.0%) | 0 (0.0%) |
| Total (Overall) | 4,042 (52.0%) | 3,731 (48.0%) |
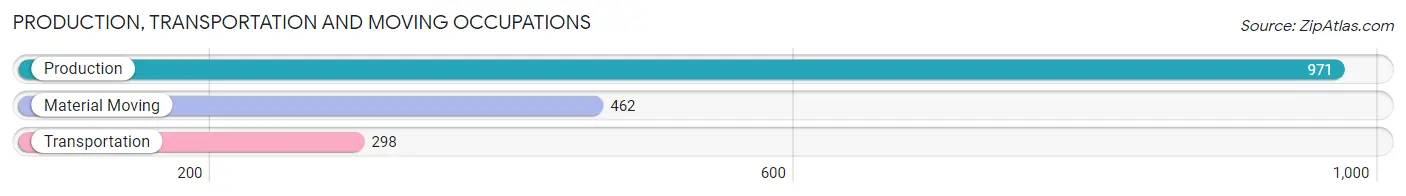
Production, Transportation and Moving Occupations
The most common Production, Transportation and Moving occupations in Mattoon are Production (971 | 12.5%), Material Moving (462 | 5.9%), and Transportation (298 | 3.8%).
Production, Transportation and Moving Occupations by Sex
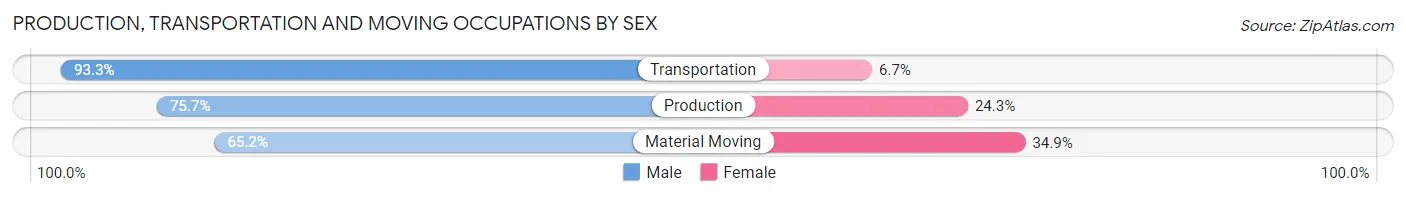
| Occupation | Male | Female |
| Production | 735 (75.7%) | 236 (24.3%) |
| Transportation | 278 (93.3%) | 20 (6.7%) |
| Material Moving | 301 (65.1%) | 161 (34.8%) |
| Total (Category) | 1,314 (75.9%) | 417 (24.1%) |
| Total (Overall) | 4,042 (52.0%) | 3,731 (48.0%) |
Employment Industries by Sex in Mattoon
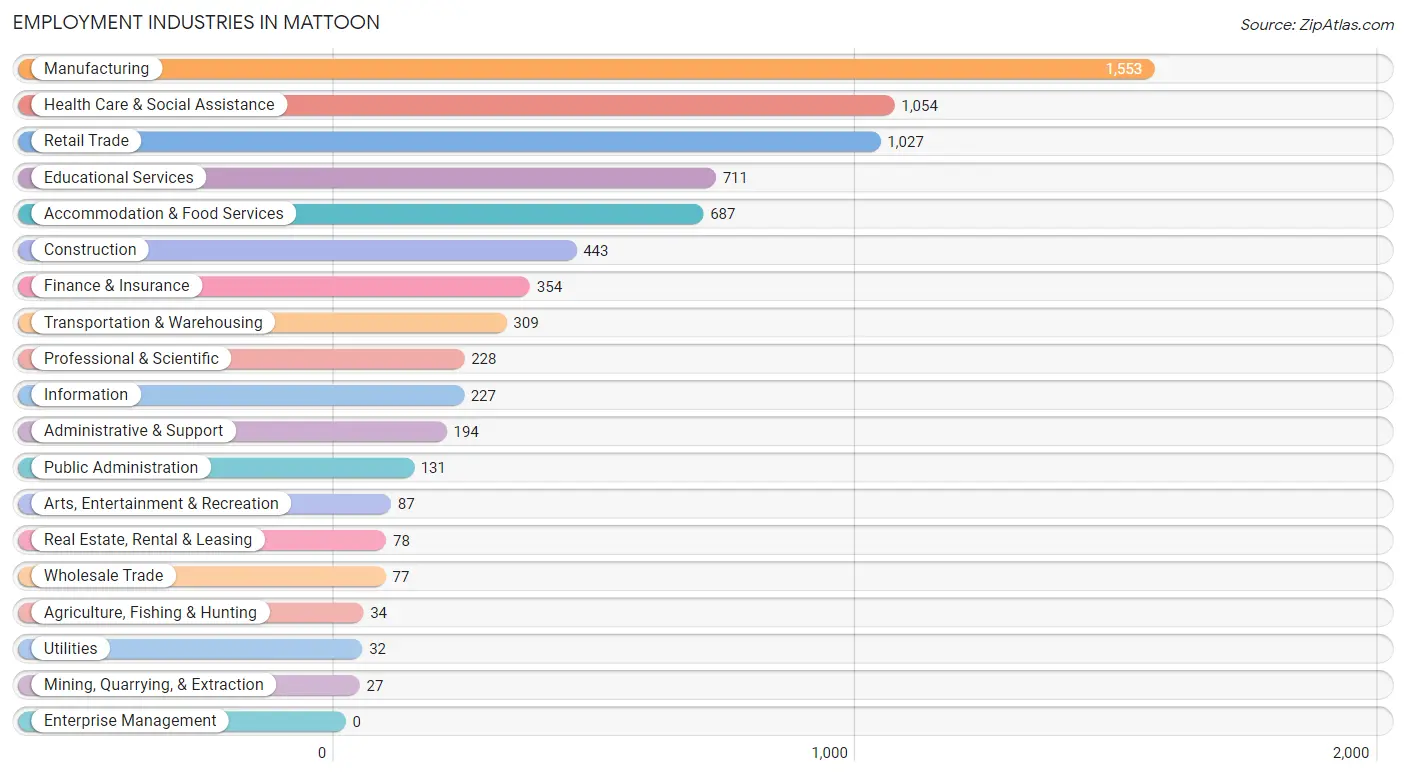
Employment Industries in Mattoon
The major employment industries in Mattoon include Manufacturing (1,553 | 20.0%), Health Care & Social Assistance (1,054 | 13.6%), Retail Trade (1,027 | 13.2%), Educational Services (711 | 9.1%), and Accommodation & Food Services (687 | 8.8%).
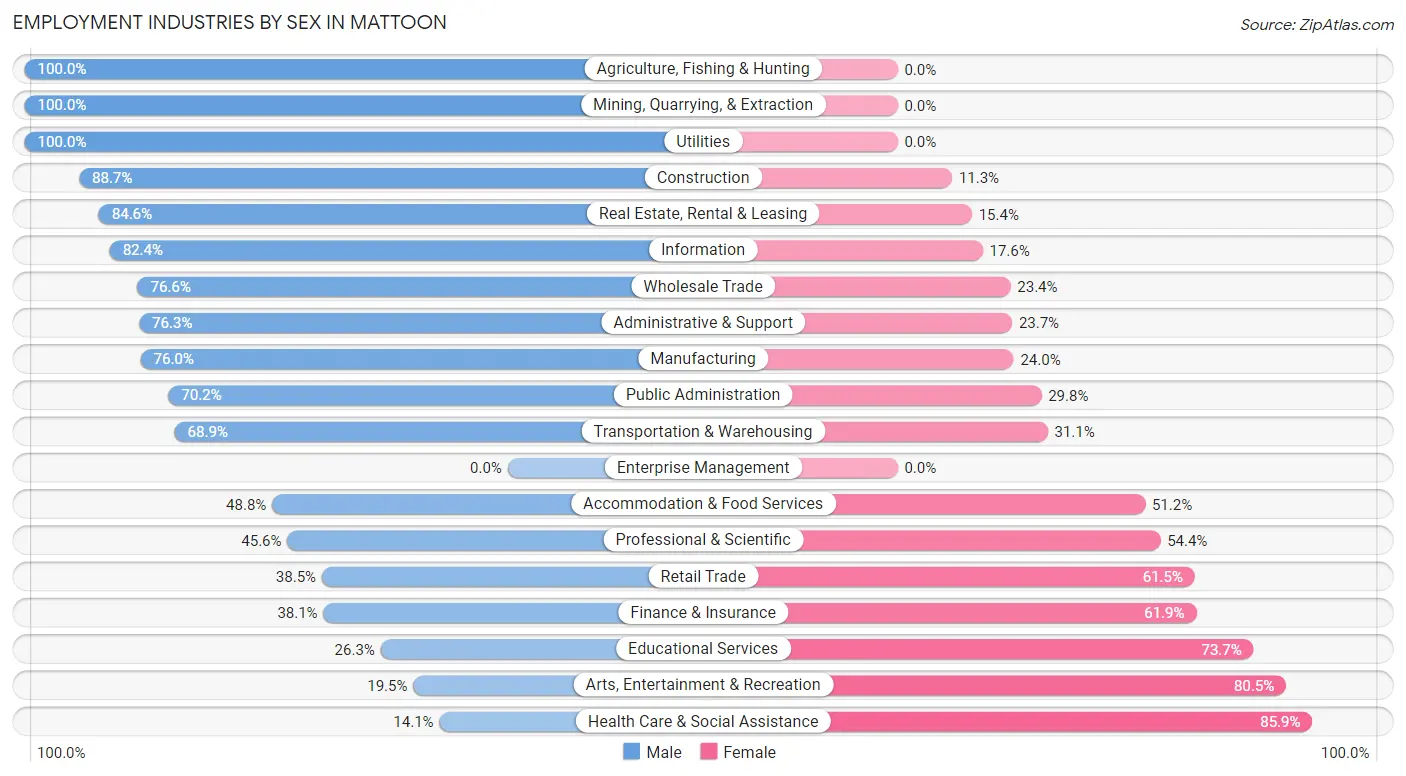
Employment Industries by Sex in Mattoon
The Mattoon industries that see more men than women are Agriculture, Fishing & Hunting (100.0%), Mining, Quarrying, & Extraction (100.0%), and Utilities (100.0%), whereas the industries that tend to have a higher number of women are Health Care & Social Assistance (85.9%), Arts, Entertainment & Recreation (80.5%), and Educational Services (73.7%).
| Industry | Male | Female |
| Agriculture, Fishing & Hunting | 34 (100.0%) | 0 (0.0%) |
| Mining, Quarrying, & Extraction | 27 (100.0%) | 0 (0.0%) |
| Construction | 393 (88.7%) | 50 (11.3%) |
| Manufacturing | 1,180 (76.0%) | 373 (24.0%) |
| Wholesale Trade | 59 (76.6%) | 18 (23.4%) |
| Retail Trade | 395 (38.5%) | 632 (61.5%) |
| Transportation & Warehousing | 213 (68.9%) | 96 (31.1%) |
| Utilities | 32 (100.0%) | 0 (0.0%) |
| Information | 187 (82.4%) | 40 (17.6%) |
| Finance & Insurance | 135 (38.1%) | 219 (61.9%) |
| Real Estate, Rental & Leasing | 66 (84.6%) | 12 (15.4%) |
| Professional & Scientific | 104 (45.6%) | 124 (54.4%) |
| Enterprise Management | 0 (0.0%) | 0 (0.0%) |
| Administrative & Support | 148 (76.3%) | 46 (23.7%) |
| Educational Services | 187 (26.3%) | 524 (73.7%) |
| Health Care & Social Assistance | 149 (14.1%) | 905 (85.9%) |
| Arts, Entertainment & Recreation | 17 (19.5%) | 70 (80.5%) |
| Accommodation & Food Services | 335 (48.8%) | 352 (51.2%) |
| Public Administration | 92 (70.2%) | 39 (29.8%) |
| Total | 4,042 (52.0%) | 3,731 (48.0%) |
Education in Mattoon
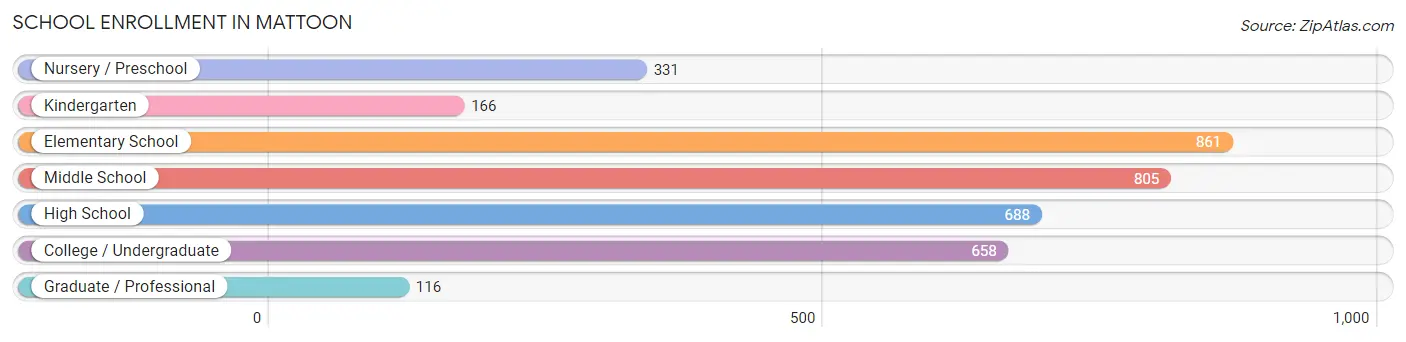
School Enrollment in Mattoon
The most common levels of schooling among the 3,625 students in Mattoon are elementary school (861 | 23.7%), middle school (805 | 22.2%), and high school (688 | 19.0%).
| School Level | # Students | % Students |
| Nursery / Preschool | 331 | 9.1% |
| Kindergarten | 166 | 4.6% |
| Elementary School | 861 | 23.7% |
| Middle School | 805 | 22.2% |
| High School | 688 | 19.0% |
| College / Undergraduate | 658 | 18.1% |
| Graduate / Professional | 116 | 3.2% |
| Total | 3,625 | 100.0% |
School Enrollment by Age by Funding Source in Mattoon
Out of a total of 3,625 students who are enrolled in schools in Mattoon, 511 (14.1%) attend a private institution, while the remaining 3,114 (85.9%) are enrolled in public schools. The age group of 25 to 34 year olds has the highest likelihood of being enrolled in private schools, with 80 (36.7% in the age bracket) enrolled. Conversely, the age group of 15 to 17 year olds has the lowest likelihood of being enrolled in a private school, with 493 (96.7% in the age bracket) attending a public institution.
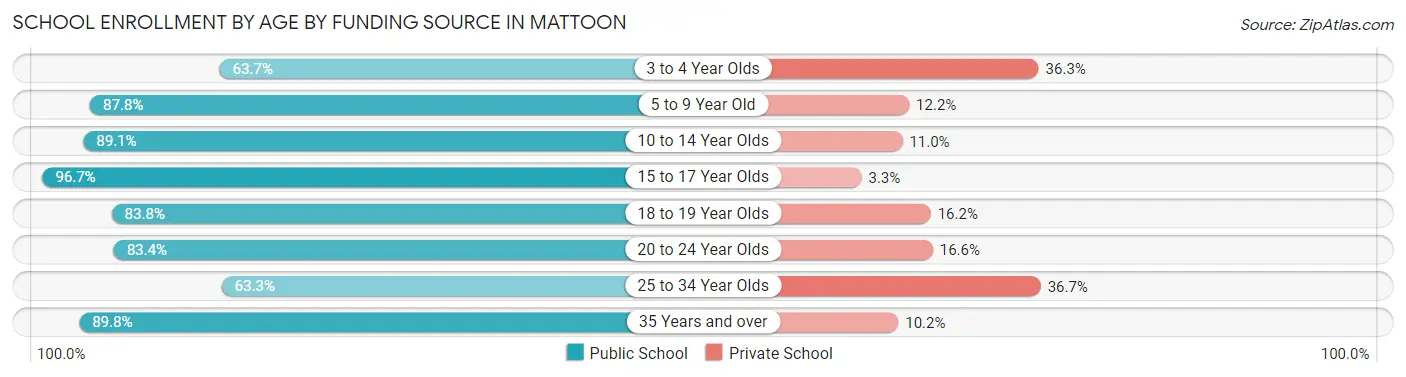
| Age Bracket | Public School | Private School |
| 3 to 4 Year Olds | 149 (63.7%) | 85 (36.3%) |
| 5 to 9 Year Old | 849 (87.8%) | 118 (12.2%) |
| 10 to 14 Year Olds | 911 (89.0%) | 112 (11.0%) |
| 15 to 17 Year Olds | 493 (96.7%) | 17 (3.3%) |
| 18 to 19 Year Olds | 217 (83.8%) | 42 (16.2%) |
| 20 to 24 Year Olds | 206 (83.4%) | 41 (16.6%) |
| 25 to 34 Year Olds | 138 (63.3%) | 80 (36.7%) |
| 35 Years and over | 150 (89.8%) | 17 (10.2%) |
| Total | 3,114 (85.9%) | 511 (14.1%) |
Educational Attainment by Field of Study in Mattoon
Education (557 | 23.5%), business (411 | 17.4%), science & technology (188 | 7.9%), arts & humanities (184 | 7.8%), and psychology (168 | 7.1%) are the most common fields of study among 2,368 individuals in Mattoon who have obtained a bachelor's degree or higher.
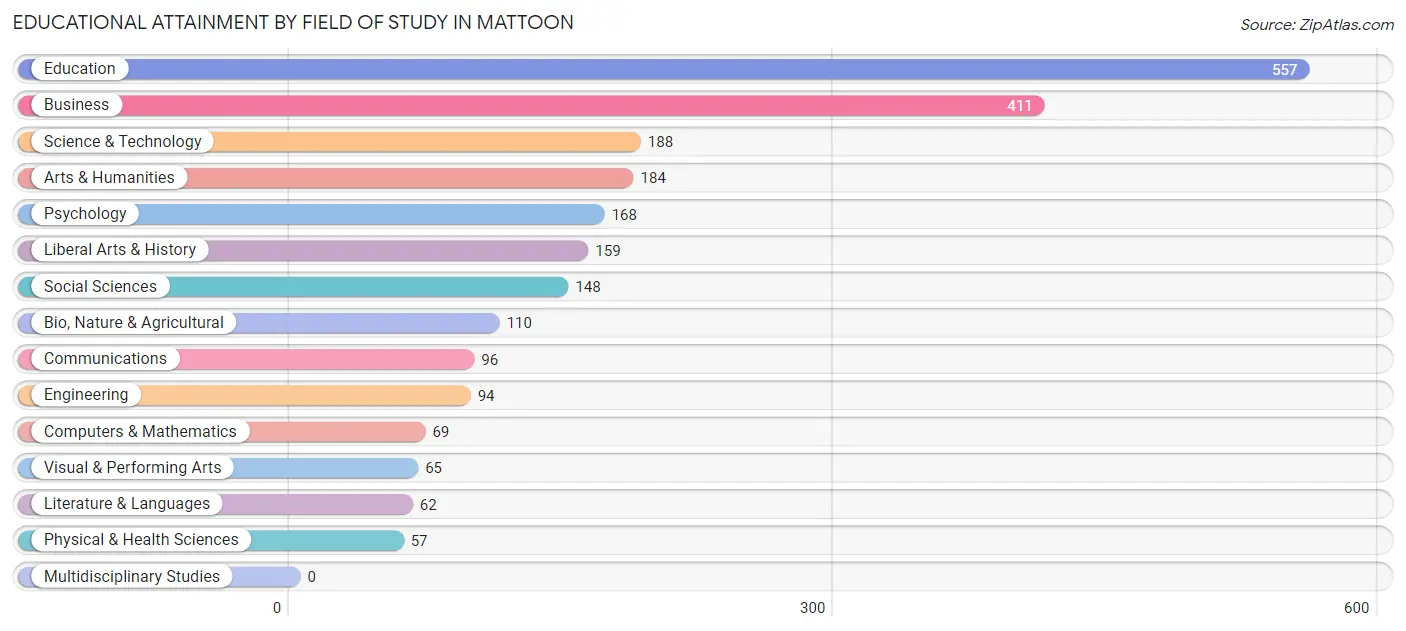
| Field of Study | # Graduates | % Graduates |
| Computers & Mathematics | 69 | 2.9% |
| Bio, Nature & Agricultural | 110 | 4.6% |
| Physical & Health Sciences | 57 | 2.4% |
| Psychology | 168 | 7.1% |
| Social Sciences | 148 | 6.2% |
| Engineering | 94 | 4.0% |
| Multidisciplinary Studies | 0 | 0.0% |
| Science & Technology | 188 | 7.9% |
| Business | 411 | 17.4% |
| Education | 557 | 23.5% |
| Literature & Languages | 62 | 2.6% |
| Liberal Arts & History | 159 | 6.7% |
| Visual & Performing Arts | 65 | 2.7% |
| Communications | 96 | 4.1% |
| Arts & Humanities | 184 | 7.8% |
| Total | 2,368 | 100.0% |
Transportation & Commute in Mattoon
Vehicle Availability by Sex in Mattoon
The most prevalent vehicle ownership categories in Mattoon are males with 2 vehicles (1,737, accounting for 43.9%) and females with 2 vehicles (1,723, making up 47.9%).
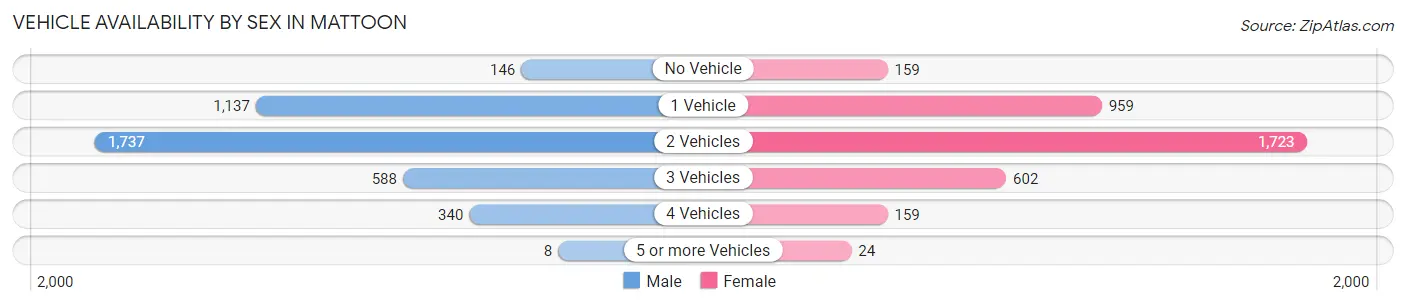
| Vehicles Available | Male | Female |
| No Vehicle | 146 (3.7%) | 159 (4.4%) |
| 1 Vehicle | 1,137 (28.7%) | 959 (26.5%) |
| 2 Vehicles | 1,737 (43.9%) | 1,723 (47.5%) |
| 3 Vehicles | 588 (14.9%) | 602 (16.6%) |
| 4 Vehicles | 340 (8.6%) | 159 (4.4%) |
| 5 or more Vehicles | 8 (0.2%) | 24 (0.7%) |
| Total | 3,956 (100.0%) | 3,626 (100.0%) |
Commute Time in Mattoon
The most frequently occuring commute durations in Mattoon are 5 to 9 minutes (2,128 commuters, 29.0%), 10 to 14 minutes (1,486 commuters, 20.2%), and 15 to 19 minutes (1,018 commuters, 13.9%).
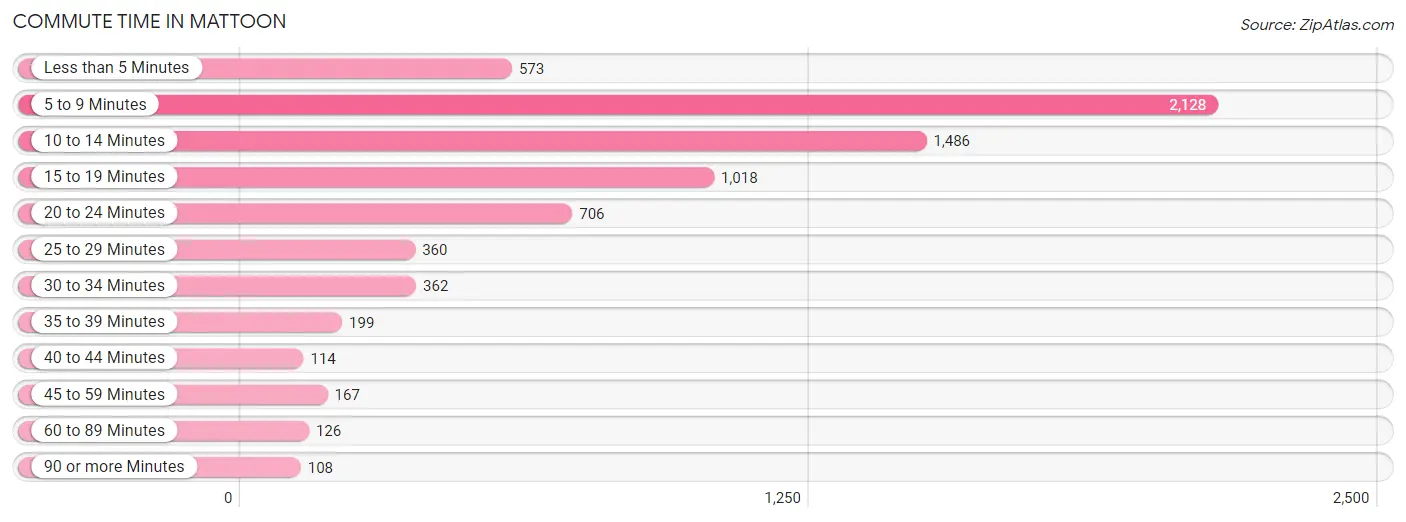
| Commute Time | # Commuters | % Commuters |
| Less than 5 Minutes | 573 | 7.8% |
| 5 to 9 Minutes | 2,128 | 29.0% |
| 10 to 14 Minutes | 1,486 | 20.2% |
| 15 to 19 Minutes | 1,018 | 13.9% |
| 20 to 24 Minutes | 706 | 9.6% |
| 25 to 29 Minutes | 360 | 4.9% |
| 30 to 34 Minutes | 362 | 4.9% |
| 35 to 39 Minutes | 199 | 2.7% |
| 40 to 44 Minutes | 114 | 1.5% |
| 45 to 59 Minutes | 167 | 2.3% |
| 60 to 89 Minutes | 126 | 1.7% |
| 90 or more Minutes | 108 | 1.5% |
Commute Time by Sex in Mattoon
The most common commute times in Mattoon are 5 to 9 minutes (1,026 commuters, 26.7%) for males and 5 to 9 minutes (1,102 commuters, 31.5%) for females.
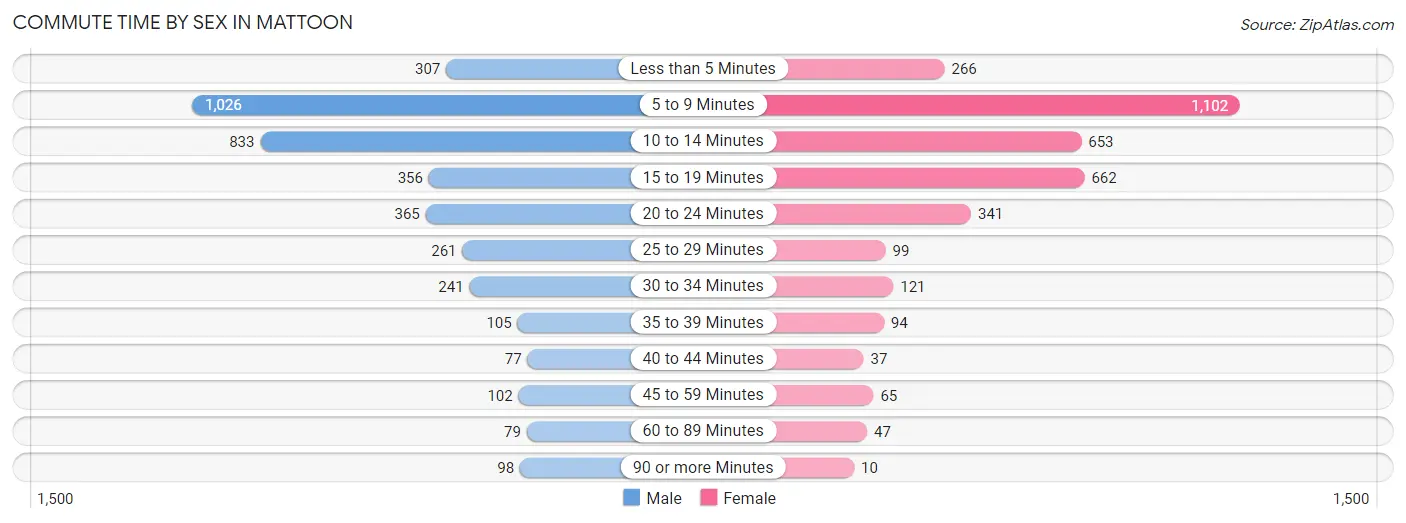
| Commute Time | Male | Female |
| Less than 5 Minutes | 307 (8.0%) | 266 (7.6%) |
| 5 to 9 Minutes | 1,026 (26.7%) | 1,102 (31.5%) |
| 10 to 14 Minutes | 833 (21.6%) | 653 (18.7%) |
| 15 to 19 Minutes | 356 (9.2%) | 662 (18.9%) |
| 20 to 24 Minutes | 365 (9.5%) | 341 (9.8%) |
| 25 to 29 Minutes | 261 (6.8%) | 99 (2.8%) |
| 30 to 34 Minutes | 241 (6.3%) | 121 (3.5%) |
| 35 to 39 Minutes | 105 (2.7%) | 94 (2.7%) |
| 40 to 44 Minutes | 77 (2.0%) | 37 (1.1%) |
| 45 to 59 Minutes | 102 (2.6%) | 65 (1.9%) |
| 60 to 89 Minutes | 79 (2.1%) | 47 (1.3%) |
| 90 or more Minutes | 98 (2.5%) | 10 (0.3%) |
Time of Departure to Work by Sex in Mattoon
The most frequent times of departure to work in Mattoon are 4:00 PM to 11:59 PM (571, 14.8%) for males and 7:30 AM to 7:59 AM (589, 16.8%) for females.
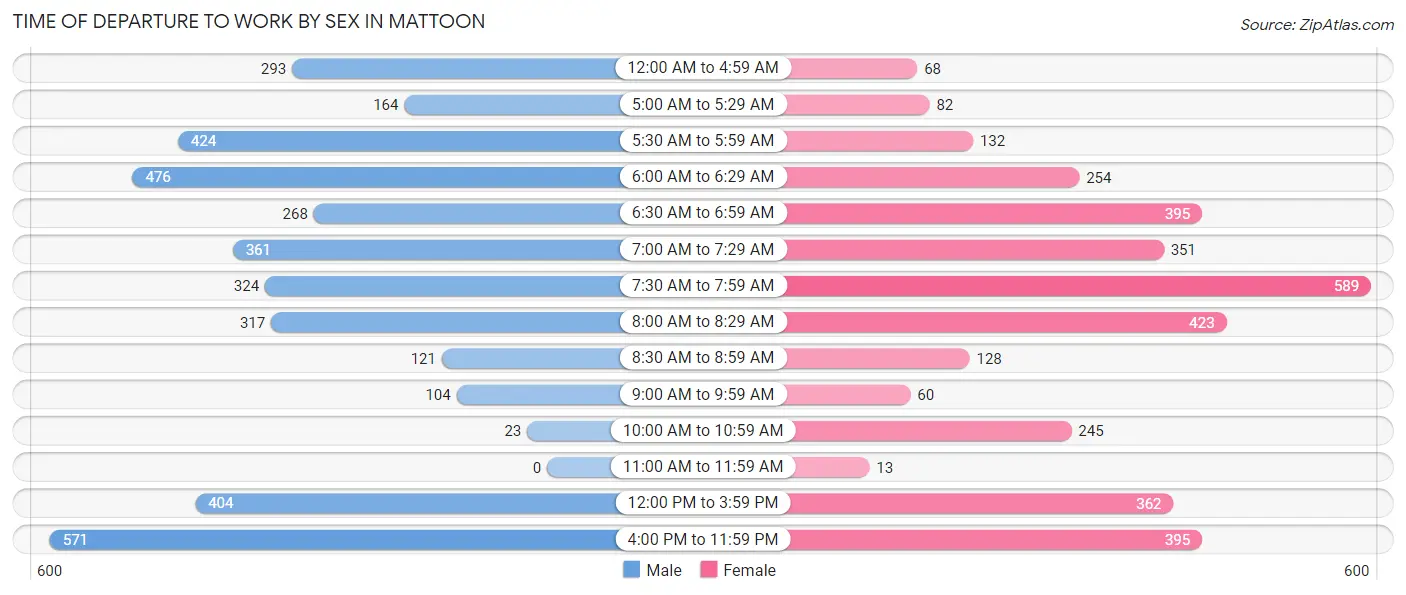
| Time of Departure | Male | Female |
| 12:00 AM to 4:59 AM | 293 (7.6%) | 68 (1.9%) |
| 5:00 AM to 5:29 AM | 164 (4.3%) | 82 (2.3%) |
| 5:30 AM to 5:59 AM | 424 (11.0%) | 132 (3.8%) |
| 6:00 AM to 6:29 AM | 476 (12.4%) | 254 (7.3%) |
| 6:30 AM to 6:59 AM | 268 (7.0%) | 395 (11.3%) |
| 7:00 AM to 7:29 AM | 361 (9.4%) | 351 (10.0%) |
| 7:30 AM to 7:59 AM | 324 (8.4%) | 589 (16.8%) |
| 8:00 AM to 8:29 AM | 317 (8.2%) | 423 (12.1%) |
| 8:30 AM to 8:59 AM | 121 (3.1%) | 128 (3.7%) |
| 9:00 AM to 9:59 AM | 104 (2.7%) | 60 (1.7%) |
| 10:00 AM to 10:59 AM | 23 (0.6%) | 245 (7.0%) |
| 11:00 AM to 11:59 AM | 0 (0.0%) | 13 (0.4%) |
| 12:00 PM to 3:59 PM | 404 (10.5%) | 362 (10.3%) |
| 4:00 PM to 11:59 PM | 571 (14.8%) | 395 (11.3%) |
| Total | 3,850 (100.0%) | 3,497 (100.0%) |
Housing Occupancy in Mattoon
Occupancy by Ownership in Mattoon
Of the total 7,884 dwellings in Mattoon, owner-occupied units account for 4,336 (55.0%), while renter-occupied units make up 3,548 (45.0%).
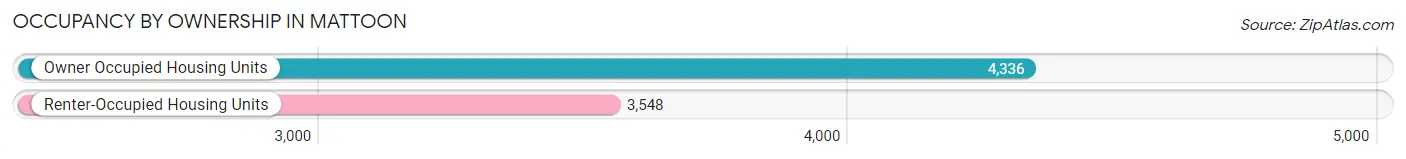
| Occupancy | # Housing Units | % Housing Units |
| Owner Occupied Housing Units | 4,336 | 55.0% |
| Renter-Occupied Housing Units | 3,548 | 45.0% |
| Total Occupied Housing Units | 7,884 | 100.0% |
Occupancy by Household Size in Mattoon
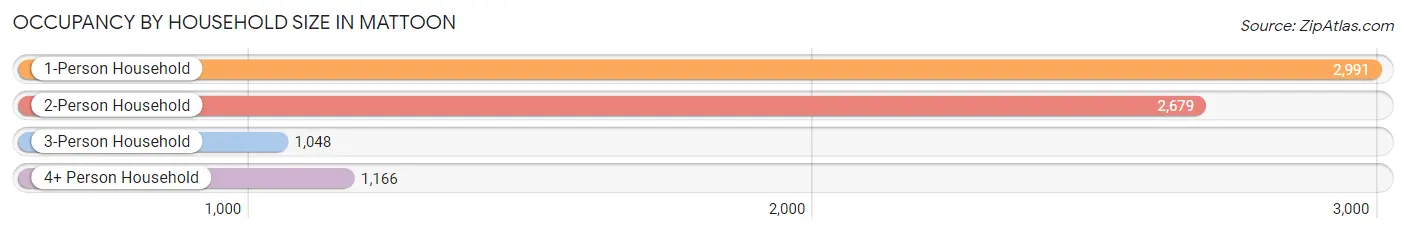
| Household Size | # Housing Units | % Housing Units |
| 1-Person Household | 2,991 | 37.9% |
| 2-Person Household | 2,679 | 34.0% |
| 3-Person Household | 1,048 | 13.3% |
| 4+ Person Household | 1,166 | 14.8% |
| Total Housing Units | 7,884 | 100.0% |
Occupancy by Ownership by Household Size in Mattoon
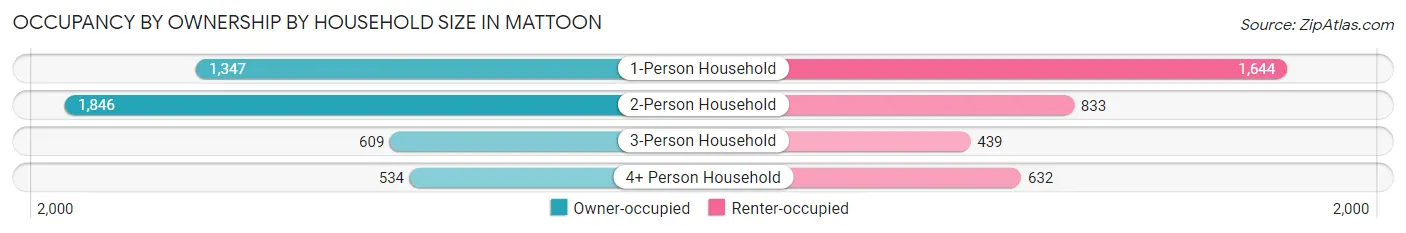
| Household Size | Owner-occupied | Renter-occupied |
| 1-Person Household | 1,347 (45.0%) | 1,644 (55.0%) |
| 2-Person Household | 1,846 (68.9%) | 833 (31.1%) |
| 3-Person Household | 609 (58.1%) | 439 (41.9%) |
| 4+ Person Household | 534 (45.8%) | 632 (54.2%) |
| Total Housing Units | 4,336 (55.0%) | 3,548 (45.0%) |
Occupancy by Educational Attainment in Mattoon
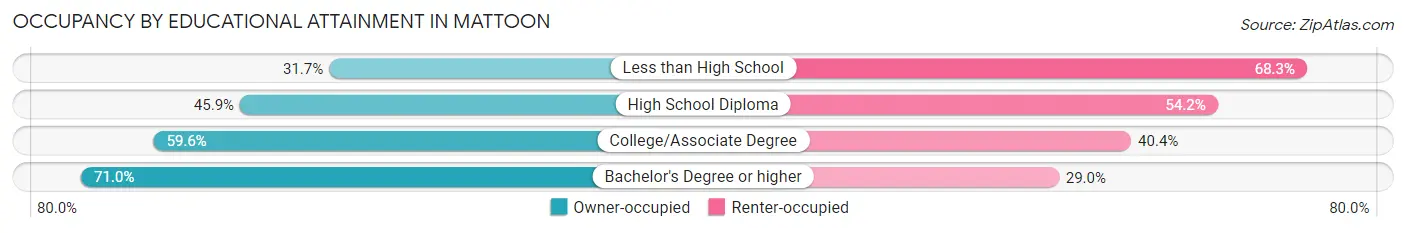
| Household Size | Owner-occupied | Renter-occupied |
| Less than High School | 202 (31.7%) | 435 (68.3%) |
| High School Diploma | 1,265 (45.9%) | 1,494 (54.1%) |
| College/Associate Degree | 1,657 (59.6%) | 1,125 (40.4%) |
| Bachelor's Degree or higher | 1,212 (71.0%) | 494 (29.0%) |
Occupancy by Age of Householder in Mattoon
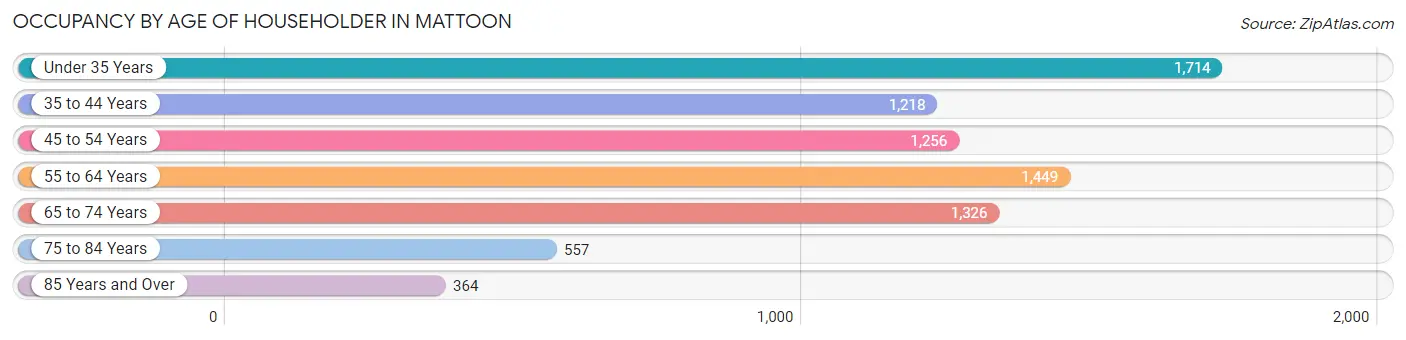
| Age Bracket | # Households | % Households |
| Under 35 Years | 1,714 | 21.7% |
| 35 to 44 Years | 1,218 | 15.4% |
| 45 to 54 Years | 1,256 | 15.9% |
| 55 to 64 Years | 1,449 | 18.4% |
| 65 to 74 Years | 1,326 | 16.8% |
| 75 to 84 Years | 557 | 7.1% |
| 85 Years and Over | 364 | 4.6% |
| Total | 7,884 | 100.0% |
Housing Finances in Mattoon
Median Income by Occupancy in Mattoon
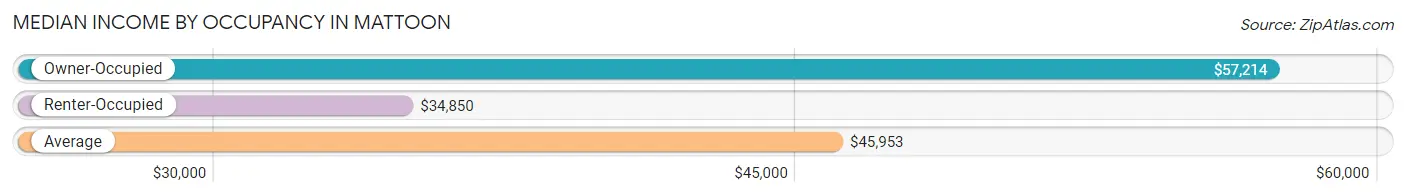
| Occupancy Type | # Households | Median Income |
| Owner-Occupied | 4,336 (55.0%) | $57,214 |
| Renter-Occupied | 3,548 (45.0%) | $34,850 |
| Average | 7,884 (100.0%) | $45,953 |
Occupancy by Householder Income Bracket in Mattoon
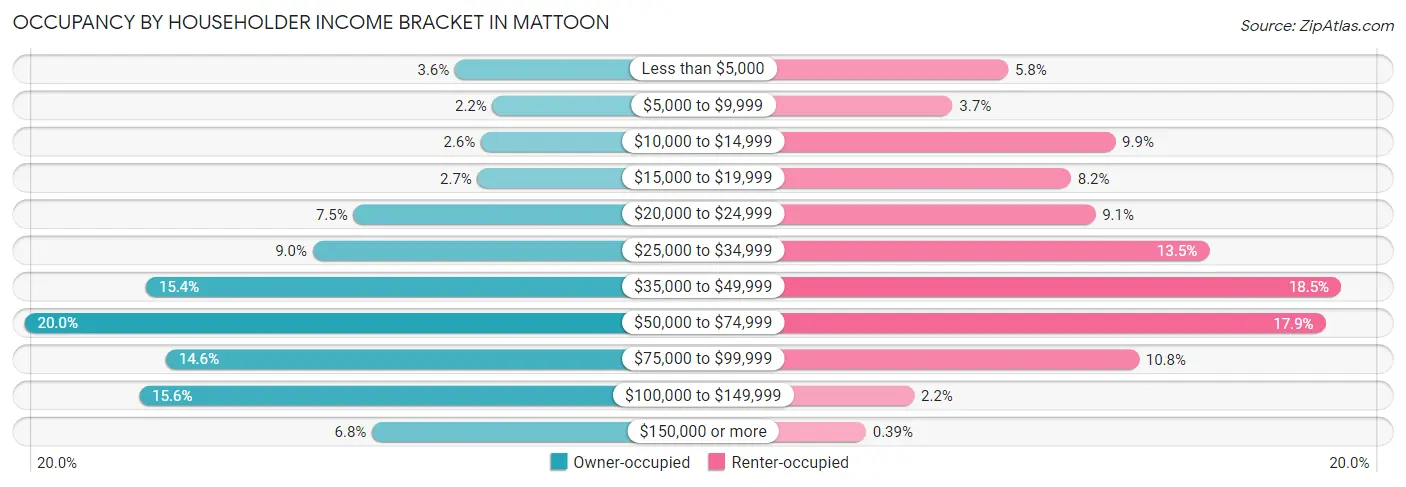
| Income Bracket | Owner-occupied | Renter-occupied |
| Less than $5,000 | 156 (3.6%) | 206 (5.8%) |
| $5,000 to $9,999 | 94 (2.2%) | 131 (3.7%) |
| $10,000 to $14,999 | 113 (2.6%) | 351 (9.9%) |
| $15,000 to $19,999 | 119 (2.7%) | 291 (8.2%) |
| $20,000 to $24,999 | 324 (7.5%) | 324 (9.1%) |
| $25,000 to $34,999 | 391 (9.0%) | 478 (13.5%) |
| $35,000 to $49,999 | 667 (15.4%) | 656 (18.5%) |
| $50,000 to $74,999 | 867 (20.0%) | 635 (17.9%) |
| $75,000 to $99,999 | 634 (14.6%) | 383 (10.8%) |
| $100,000 to $149,999 | 678 (15.6%) | 79 (2.2%) |
| $150,000 or more | 293 (6.8%) | 14 (0.4%) |
| Total | 4,336 (100.0%) | 3,548 (100.0%) |
Monthly Housing Cost Tiers in Mattoon
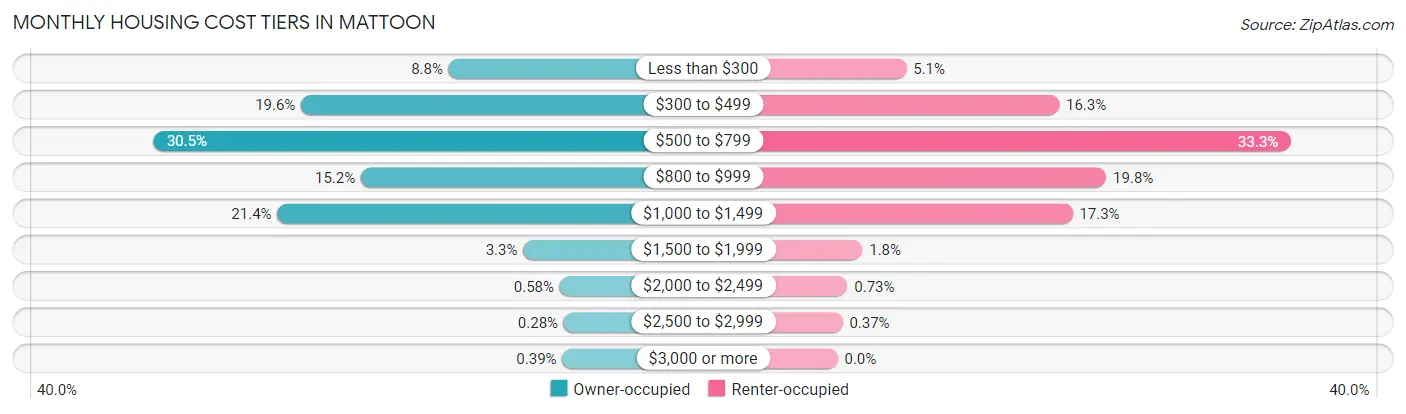
| Monthly Cost | Owner-occupied | Renter-occupied |
| Less than $300 | 380 (8.8%) | 180 (5.1%) |
| $300 to $499 | 851 (19.6%) | 579 (16.3%) |
| $500 to $799 | 1,322 (30.5%) | 1,183 (33.3%) |
| $800 to $999 | 660 (15.2%) | 702 (19.8%) |
| $1,000 to $1,499 | 927 (21.4%) | 614 (17.3%) |
| $1,500 to $1,999 | 142 (3.3%) | 65 (1.8%) |
| $2,000 to $2,499 | 25 (0.6%) | 26 (0.7%) |
| $2,500 to $2,999 | 12 (0.3%) | 13 (0.4%) |
| $3,000 or more | 17 (0.4%) | 0 (0.0%) |
| Total | 4,336 (100.0%) | 3,548 (100.0%) |
Physical Housing Characteristics in Mattoon
Housing Structures in Mattoon
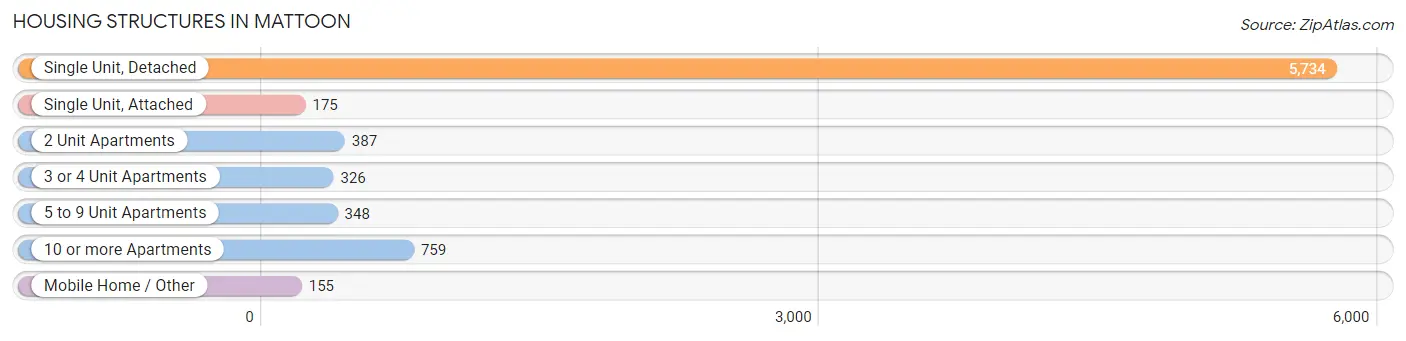
| Structure Type | # Housing Units | % Housing Units |
| Single Unit, Detached | 5,734 | 72.7% |
| Single Unit, Attached | 175 | 2.2% |
| 2 Unit Apartments | 387 | 4.9% |
| 3 or 4 Unit Apartments | 326 | 4.1% |
| 5 to 9 Unit Apartments | 348 | 4.4% |
| 10 or more Apartments | 759 | 9.6% |
| Mobile Home / Other | 155 | 2.0% |
| Total | 7,884 | 100.0% |
Housing Structures by Occupancy in Mattoon
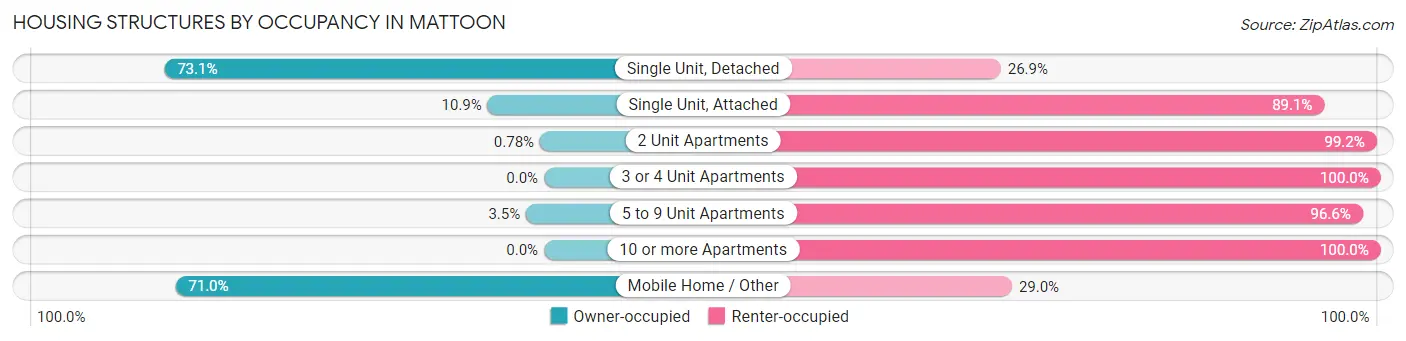
| Structure Type | Owner-occupied | Renter-occupied |
| Single Unit, Detached | 4,192 (73.1%) | 1,542 (26.9%) |
| Single Unit, Attached | 19 (10.9%) | 156 (89.1%) |
| 2 Unit Apartments | 3 (0.8%) | 384 (99.2%) |
| 3 or 4 Unit Apartments | 0 (0.0%) | 326 (100.0%) |
| 5 to 9 Unit Apartments | 12 (3.5%) | 336 (96.6%) |
| 10 or more Apartments | 0 (0.0%) | 759 (100.0%) |
| Mobile Home / Other | 110 (71.0%) | 45 (29.0%) |
| Total | 4,336 (55.0%) | 3,548 (45.0%) |
Housing Structures by Number of Rooms in Mattoon
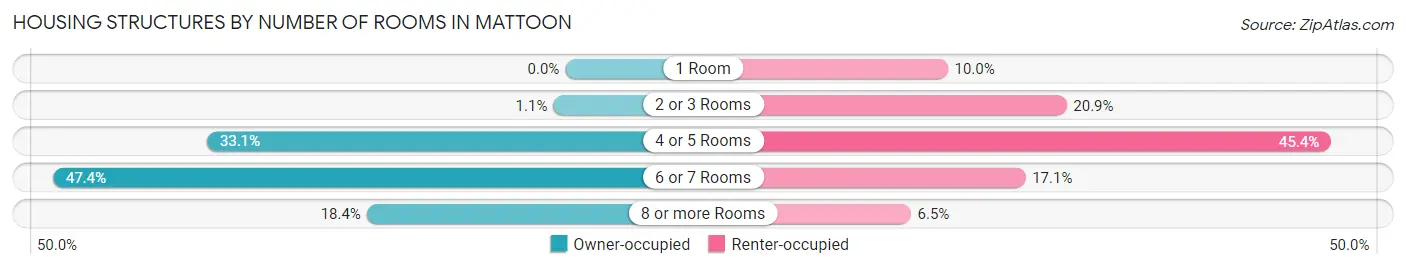
| Number of Rooms | Owner-occupied | Renter-occupied |
| 1 Room | 0 (0.0%) | 353 (10.0%) |
| 2 or 3 Rooms | 48 (1.1%) | 743 (20.9%) |
| 4 or 5 Rooms | 1,437 (33.1%) | 1,612 (45.4%) |
| 6 or 7 Rooms | 2,055 (47.4%) | 608 (17.1%) |
| 8 or more Rooms | 796 (18.4%) | 232 (6.5%) |
| Total | 4,336 (100.0%) | 3,548 (100.0%) |
Housing Structure by Heating Type in Mattoon
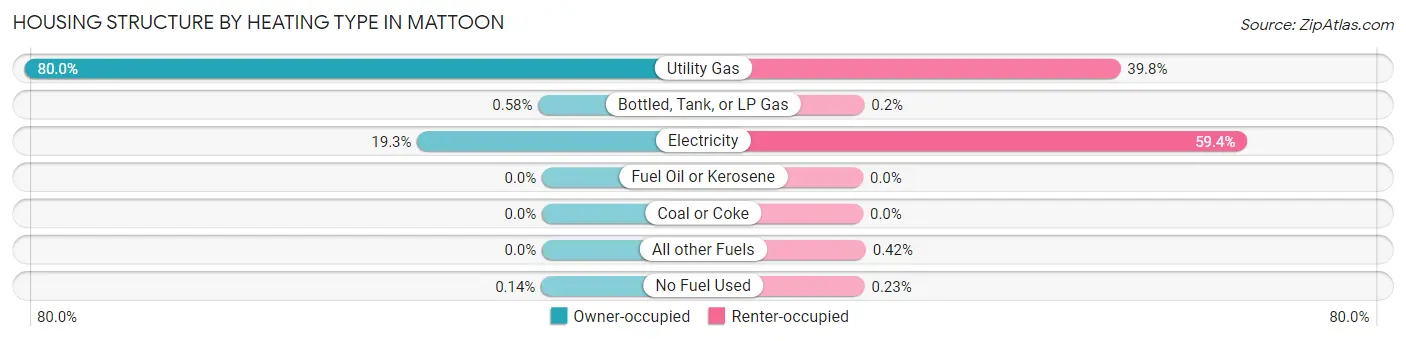
| Heating Type | Owner-occupied | Renter-occupied |
| Utility Gas | 3,469 (80.0%) | 1,411 (39.8%) |
| Bottled, Tank, or LP Gas | 25 (0.6%) | 7 (0.2%) |
| Electricity | 836 (19.3%) | 2,107 (59.4%) |
| Fuel Oil or Kerosene | 0 (0.0%) | 0 (0.0%) |
| Coal or Coke | 0 (0.0%) | 0 (0.0%) |
| All other Fuels | 0 (0.0%) | 15 (0.4%) |
| No Fuel Used | 6 (0.1%) | 8 (0.2%) |
| Total | 4,336 (100.0%) | 3,548 (100.0%) |
Household Vehicle Usage in Mattoon
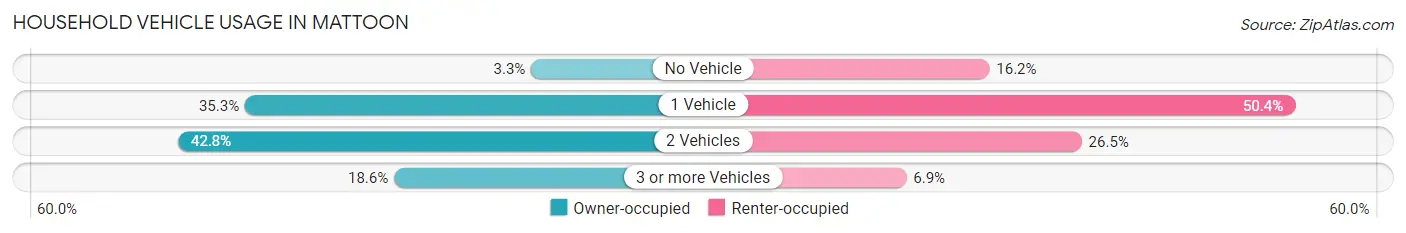
| Vehicles per Household | Owner-occupied | Renter-occupied |
| No Vehicle | 141 (3.3%) | 574 (16.2%) |
| 1 Vehicle | 1,531 (35.3%) | 1,789 (50.4%) |
| 2 Vehicles | 1,857 (42.8%) | 941 (26.5%) |
| 3 or more Vehicles | 807 (18.6%) | 244 (6.9%) |
| Total | 4,336 (100.0%) | 3,548 (100.0%) |
Real Estate & Mortgages in Mattoon
Real Estate and Mortgage Overview in Mattoon
| Characteristic | Without Mortgage | With Mortgage |
| Housing Units | 2,099 | 2,237 |
| Median Property Value | $83,800 | $96,200 |
| Median Household Income | $47,111 | $193 |
| Monthly Housing Costs | $458 | $0 |
| Real Estate Taxes | $1,536 | $13 |
Property Value by Mortgage Status in Mattoon
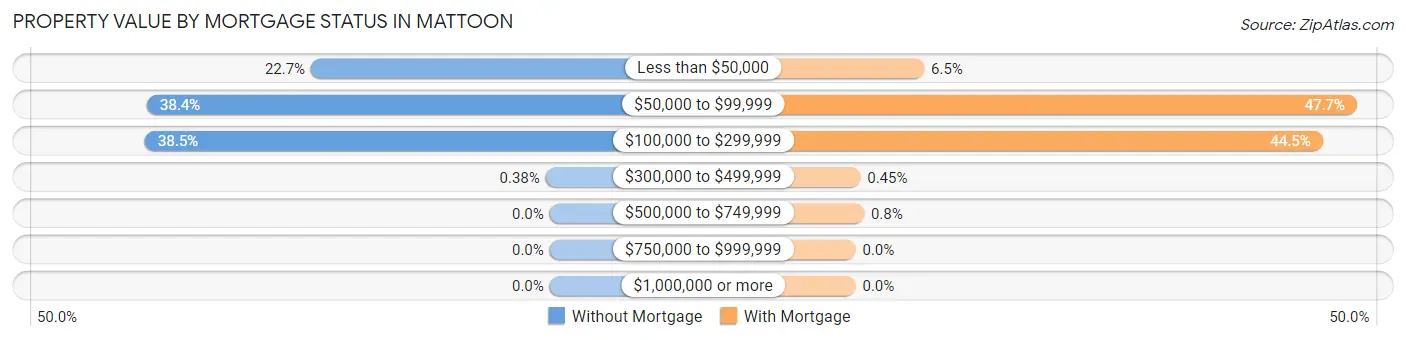
| Property Value | Without Mortgage | With Mortgage |
| Less than $50,000 | 477 (22.7%) | 146 (6.5%) |
| $50,000 to $99,999 | 805 (38.4%) | 1,068 (47.7%) |
| $100,000 to $299,999 | 809 (38.5%) | 995 (44.5%) |
| $300,000 to $499,999 | 8 (0.4%) | 10 (0.4%) |
| $500,000 to $749,999 | 0 (0.0%) | 18 (0.8%) |
| $750,000 to $999,999 | 0 (0.0%) | 0 (0.0%) |
| $1,000,000 or more | 0 (0.0%) | 0 (0.0%) |
| Total | 2,099 (100.0%) | 2,237 (100.0%) |
Household Income by Mortgage Status in Mattoon

| Household Income | Without Mortgage | With Mortgage |
| Less than $10,000 | 204 (9.7%) | 52 (2.3%) |
| $10,000 to $24,999 | 357 (17.0%) | 46 (2.1%) |
| $25,000 to $34,999 | 218 (10.4%) | 199 (8.9%) |
| $35,000 to $49,999 | 282 (13.4%) | 173 (7.7%) |
| $50,000 to $74,999 | 466 (22.2%) | 385 (17.2%) |
| $75,000 to $99,999 | 278 (13.2%) | 401 (17.9%) |
| $100,000 to $149,999 | 194 (9.2%) | 356 (15.9%) |
| $150,000 or more | 100 (4.8%) | 484 (21.6%) |
| Total | 2,099 (100.0%) | 2,237 (100.0%) |
Property Value to Household Income Ratio in Mattoon
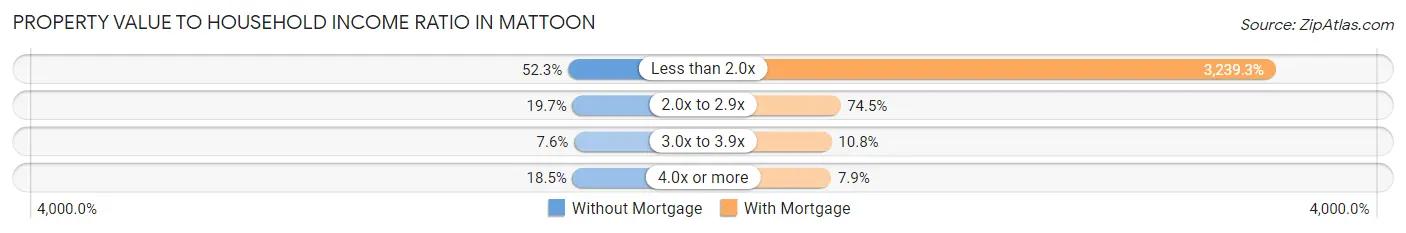
| Value-to-Income Ratio | Without Mortgage | With Mortgage |
| Less than 2.0x | 1,097 (52.3%) | 72,464 (3,239.3%) |
| 2.0x to 2.9x | 414 (19.7%) | 1,667 (74.5%) |
| 3.0x to 3.9x | 160 (7.6%) | 242 (10.8%) |
| 4.0x or more | 389 (18.5%) | 177 (7.9%) |
| Total | 2,099 (100.0%) | 2,237 (100.0%) |
Real Estate Taxes by Mortgage Status in Mattoon
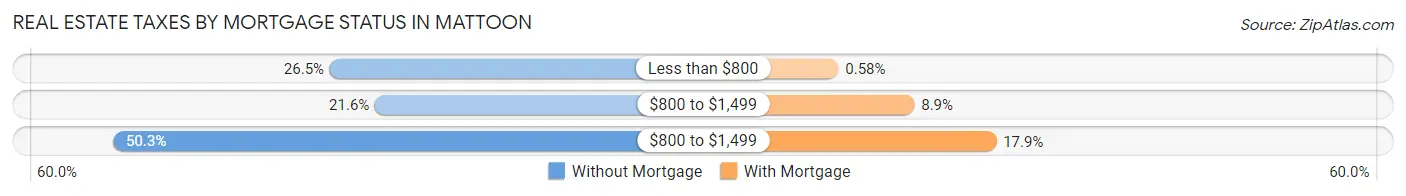
| Property Taxes | Without Mortgage | With Mortgage |
| Less than $800 | 557 (26.5%) | 13 (0.6%) |
| $800 to $1,499 | 453 (21.6%) | 199 (8.9%) |
| $800 to $1,499 | 1,056 (50.3%) | 400 (17.9%) |
| Total | 2,099 (100.0%) | 2,237 (100.0%) |
Health & Disability in Mattoon
Health Insurance Coverage by Age in Mattoon
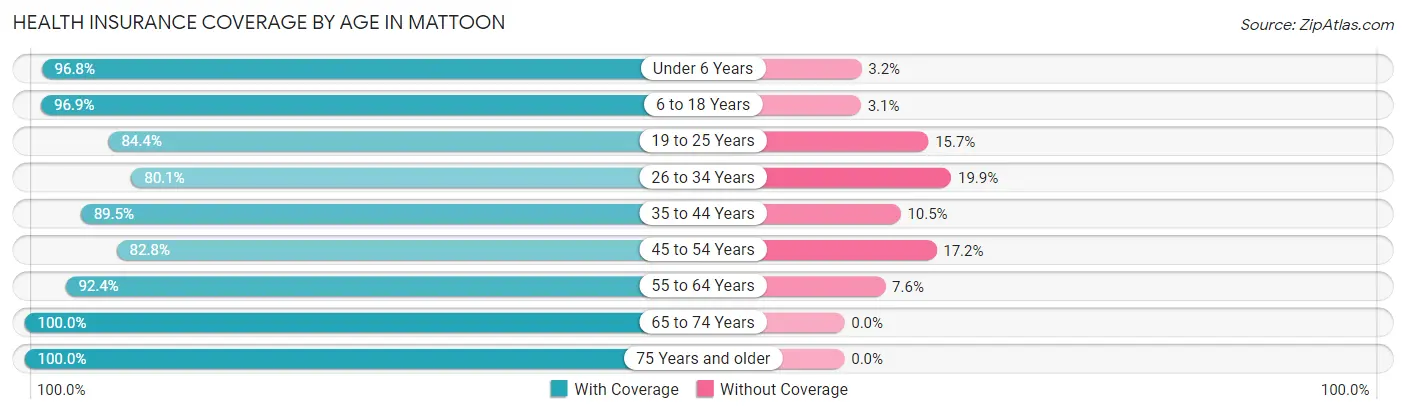
| Age Bracket | With Coverage | Without Coverage |
| Under 6 Years | 1,096 (96.8%) | 36 (3.2%) |
| 6 to 18 Years | 2,524 (96.9%) | 80 (3.1%) |
| 19 to 25 Years | 1,315 (84.4%) | 244 (15.7%) |
| 26 to 34 Years | 1,464 (80.1%) | 364 (19.9%) |
| 35 to 44 Years | 1,966 (89.5%) | 230 (10.5%) |
| 45 to 54 Years | 1,733 (82.8%) | 359 (17.2%) |
| 55 to 64 Years | 1,939 (92.4%) | 160 (7.6%) |
| 65 to 74 Years | 1,752 (100.0%) | 0 (0.0%) |
| 75 Years and older | 1,169 (100.0%) | 0 (0.0%) |
| Total | 14,958 (91.0%) | 1,473 (9.0%) |
Health Insurance Coverage by Citizenship Status in Mattoon
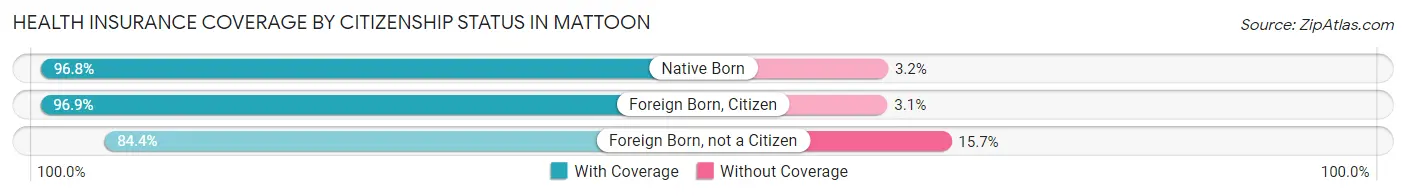
| Citizenship Status | With Coverage | Without Coverage |
| Native Born | 1,096 (96.8%) | 36 (3.2%) |
| Foreign Born, Citizen | 2,524 (96.9%) | 80 (3.1%) |
| Foreign Born, not a Citizen | 1,315 (84.4%) | 244 (15.7%) |
Health Insurance Coverage by Household Income in Mattoon
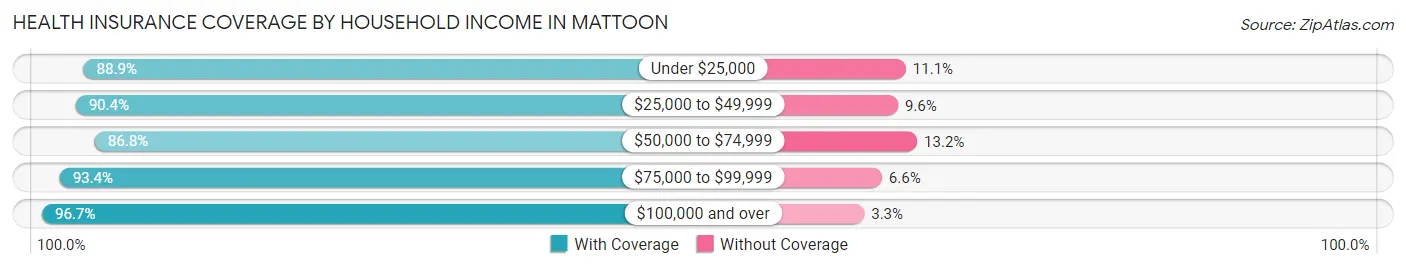
| Household Income | With Coverage | Without Coverage |
| Under $25,000 | 3,046 (88.9%) | 379 (11.1%) |
| $25,000 to $49,999 | 3,828 (90.4%) | 406 (9.6%) |
| $50,000 to $74,999 | 2,839 (86.8%) | 431 (13.2%) |
| $75,000 to $99,999 | 2,230 (93.4%) | 157 (6.6%) |
| $100,000 and over | 2,947 (96.7%) | 100 (3.3%) |
Public vs Private Health Insurance Coverage by Age in Mattoon
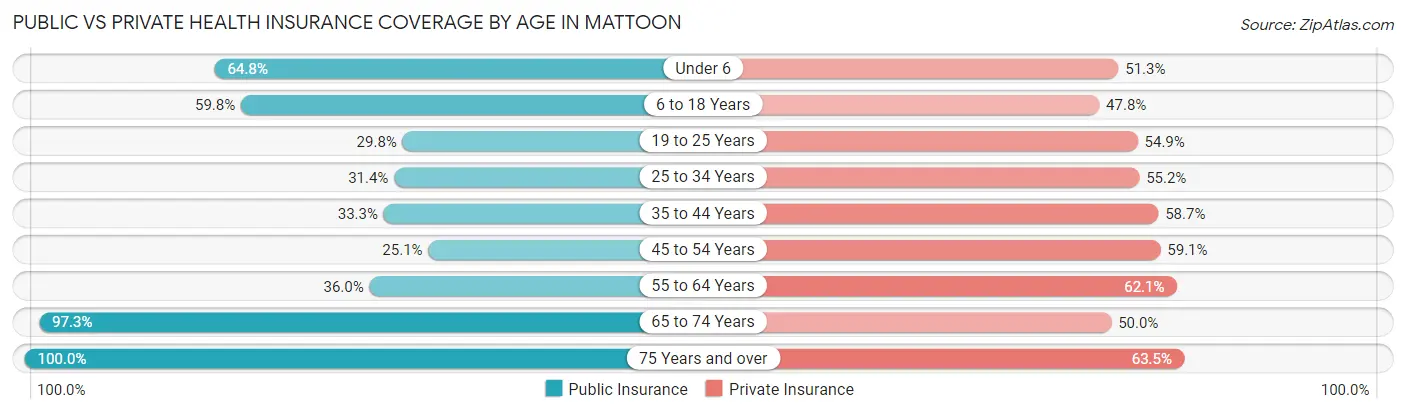
| Age Bracket | Public Insurance | Private Insurance |
| Under 6 | 733 (64.7%) | 581 (51.3%) |
| 6 to 18 Years | 1,558 (59.8%) | 1,244 (47.8%) |
| 19 to 25 Years | 465 (29.8%) | 856 (54.9%) |
| 25 to 34 Years | 574 (31.4%) | 1,009 (55.2%) |
| 35 to 44 Years | 732 (33.3%) | 1,290 (58.7%) |
| 45 to 54 Years | 524 (25.1%) | 1,237 (59.1%) |
| 55 to 64 Years | 755 (36.0%) | 1,303 (62.1%) |
| 65 to 74 Years | 1,705 (97.3%) | 876 (50.0%) |
| 75 Years and over | 1,169 (100.0%) | 742 (63.5%) |
| Total | 8,215 (50.0%) | 9,138 (55.6%) |
Disability Status by Sex by Age in Mattoon
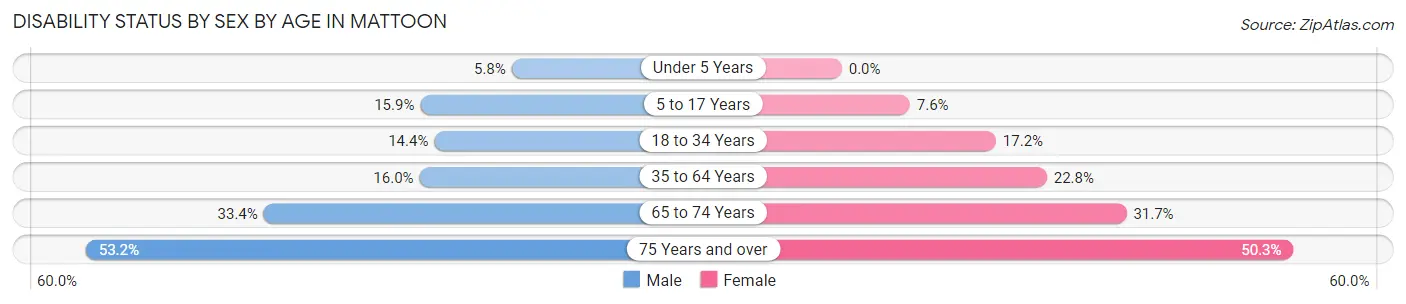
| Age Bracket | Male | Female |
| Under 5 Years | 27 (5.8%) | 0 (0.0%) |
| 5 to 17 Years | 211 (15.9%) | 100 (7.6%) |
| 18 to 34 Years | 259 (14.4%) | 305 (17.2%) |
| 35 to 64 Years | 521 (16.0%) | 716 (22.8%) |
| 65 to 74 Years | 250 (33.4%) | 318 (31.7%) |
| 75 Years and over | 259 (53.2%) | 343 (50.3%) |
Disability Class by Sex by Age in Mattoon
Disability Class: Hearing Difficulty
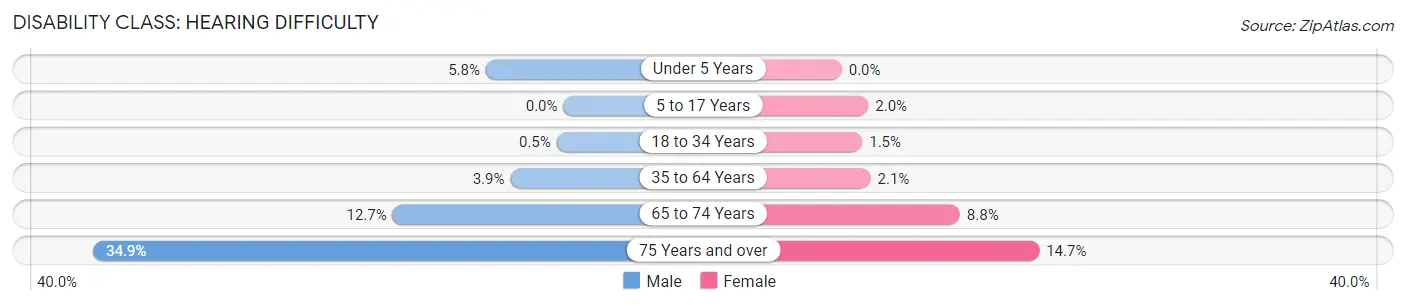
| Age Bracket | Male | Female |
| Under 5 Years | 27 (5.8%) | 0 (0.0%) |
| 5 to 17 Years | 0 (0.0%) | 26 (2.0%) |
| 18 to 34 Years | 9 (0.5%) | 27 (1.5%) |
| 35 to 64 Years | 128 (3.9%) | 67 (2.1%) |
| 65 to 74 Years | 95 (12.7%) | 88 (8.8%) |
| 75 Years and over | 170 (34.9%) | 100 (14.7%) |
Disability Class: Vision Difficulty
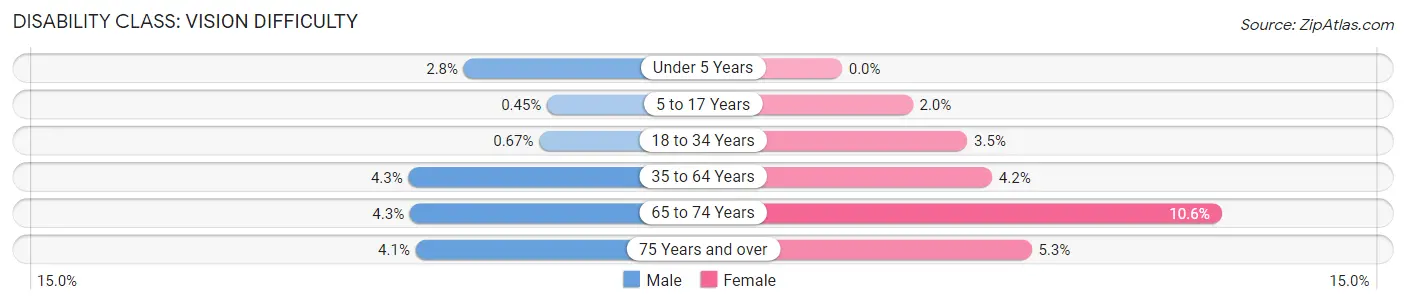
| Age Bracket | Male | Female |
| Under 5 Years | 13 (2.8%) | 0 (0.0%) |
| 5 to 17 Years | 6 (0.4%) | 26 (2.0%) |
| 18 to 34 Years | 12 (0.7%) | 62 (3.5%) |
| 35 to 64 Years | 140 (4.3%) | 131 (4.2%) |
| 65 to 74 Years | 32 (4.3%) | 106 (10.6%) |
| 75 Years and over | 20 (4.1%) | 36 (5.3%) |
Disability Class: Cognitive Difficulty
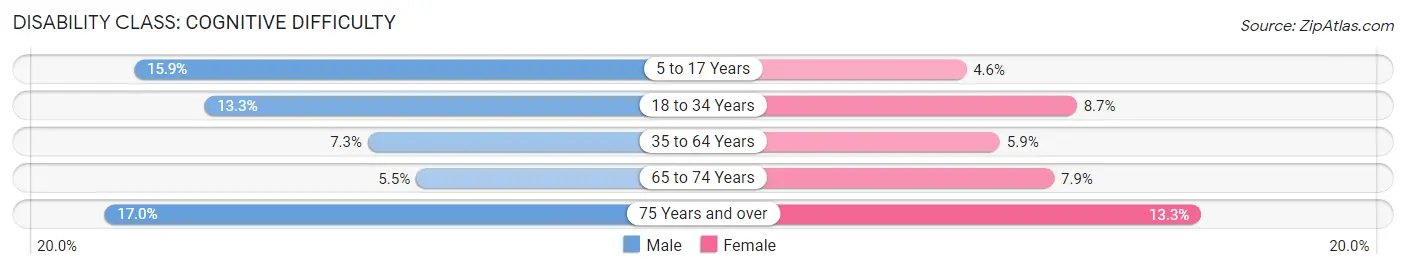
| Age Bracket | Male | Female |
| 5 to 17 Years | 211 (15.9%) | 61 (4.6%) |
| 18 to 34 Years | 240 (13.3%) | 155 (8.7%) |
| 35 to 64 Years | 236 (7.3%) | 184 (5.9%) |
| 65 to 74 Years | 41 (5.5%) | 79 (7.9%) |
| 75 Years and over | 83 (17.0%) | 91 (13.3%) |
Disability Class: Ambulatory Difficulty
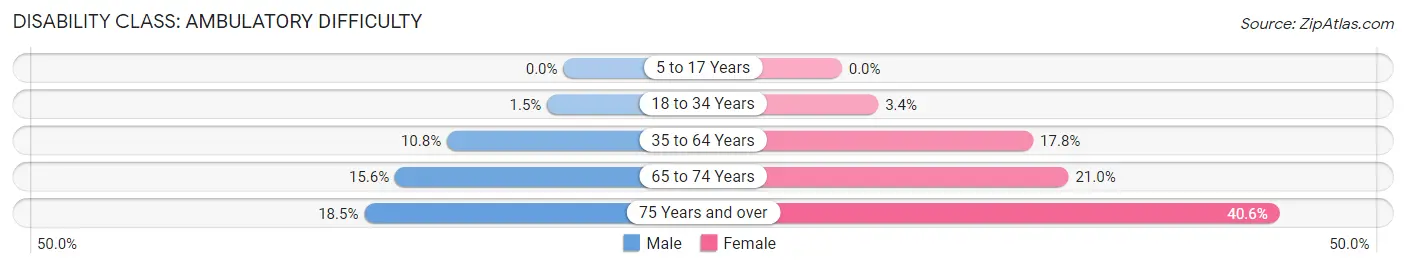
| Age Bracket | Male | Female |
| 5 to 17 Years | 0 (0.0%) | 0 (0.0%) |
| 18 to 34 Years | 27 (1.5%) | 60 (3.4%) |
| 35 to 64 Years | 351 (10.8%) | 557 (17.8%) |
| 65 to 74 Years | 117 (15.6%) | 211 (21.0%) |
| 75 Years and over | 90 (18.5%) | 277 (40.6%) |
Disability Class: Self-Care Difficulty
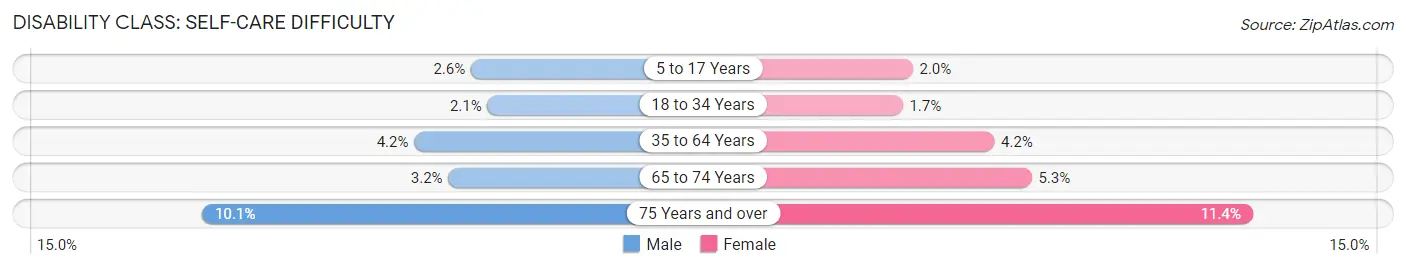
| Age Bracket | Male | Female |
| 5 to 17 Years | 34 (2.6%) | 26 (2.0%) |
| 18 to 34 Years | 38 (2.1%) | 30 (1.7%) |
| 35 to 64 Years | 135 (4.2%) | 133 (4.2%) |
| 65 to 74 Years | 24 (3.2%) | 53 (5.3%) |
| 75 Years and over | 49 (10.1%) | 78 (11.4%) |
Technology Access in Mattoon
Computing Device Access in Mattoon
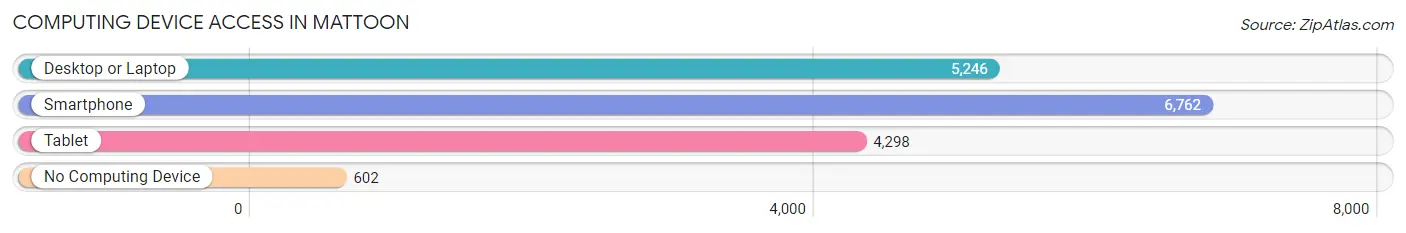
| Device Type | # Households | % Households |
| Desktop or Laptop | 5,246 | 66.5% |
| Smartphone | 6,762 | 85.8% |
| Tablet | 4,298 | 54.5% |
| No Computing Device | 602 | 7.6% |
| Total | 7,884 | 100.0% |
Internet Access in Mattoon
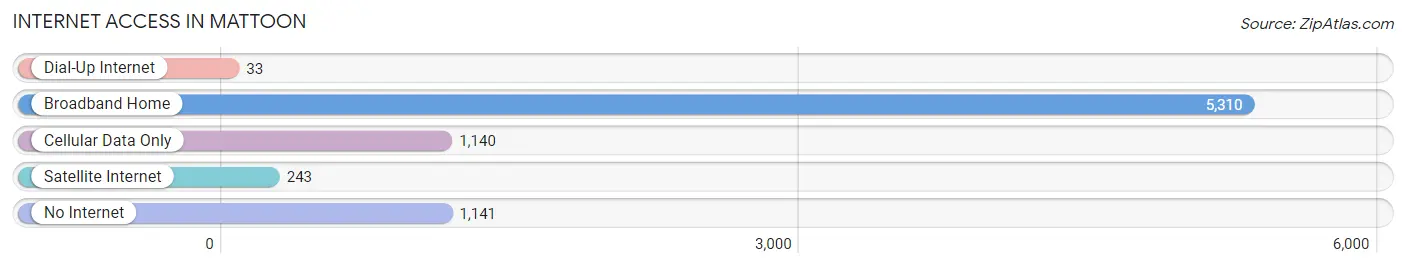
| Internet Type | # Households | % Households |
| Dial-Up Internet | 33 | 0.4% |
| Broadband Home | 5,310 | 67.3% |
| Cellular Data Only | 1,140 | 14.5% |
| Satellite Internet | 243 | 3.1% |
| No Internet | 1,141 | 14.5% |
| Total | 7,884 | 100.0% |
Mattoon Summary
Mattoon, Illinois is a city located in Coles County in the east-central part of the state. It is situated along the Embarras River, about halfway between Champaign and Effingham. The city has a population of 18,555 as of the 2010 census, making it the largest city in Coles County.
History
The area that is now Mattoon was first settled in 1854 by William and Mary Mattoon, who had moved from New York. The Mattoons built a log cabin and began farming the land. The town was officially founded in 1858 and was named after the Mattoons.
In 1864, the Chicago and Eastern Illinois Railroad was built through the town, connecting it to the rest of the state. This allowed for the growth of the town, and by 1870, the population had grown to 1,000.
In 1872, the Mattoon and Charleston Railroad was built, connecting Mattoon to Charleston. This allowed for the growth of the coal mining industry in the area, and by 1880, the population had grown to 2,500.
In 1887, the Mattoon Street Railway was built, connecting Mattoon to nearby towns. This allowed for the growth of the town, and by 1900, the population had grown to 5,000.
In the early 20th century, Mattoon experienced a period of rapid growth. The population had grown to 10,000 by 1920, and to 15,000 by 1940.
Geography
Mattoon is located in east-central Illinois, about halfway between Champaign and Effingham. It is situated along the Embarras River, and is surrounded by rural farmland. The city has a total area of 8.3 square miles, of which 8.2 square miles is land and 0.1 square miles is water.
Climate
Mattoon has a humid continental climate, with hot, humid summers and cold, snowy winters. The average temperature in July is 79°F, and the average temperature in January is 24°F. The average annual precipitation is 40 inches.
Economy
Mattoon’s economy is largely based on manufacturing and retail. The city is home to several large manufacturing companies, including Caterpillar, Inc., which produces construction and mining equipment, and the Mattoon Manufacturing Company, which produces automotive parts.
Retail is also an important part of the local economy. The city is home to several large retail stores, including Walmart, Target, and Kohl’s.
Demographics
As of the 2010 census, Mattoon had a population of 18,555. The racial makeup of the city was 87.3% White, 8.2% African American, 0.7% Native American, 0.7% Asian, 0.1% Pacific Islander, 1.2% from other races, and 1.9% from two or more races. Hispanic or Latino of any race were 3.2% of the population.
The median income for a household in Mattoon was $37,945, and the median income for a family was $45,945. The per capita income for the city was $19,945. About 11.3% of the population was below the poverty line.
Common Questions
What is Per Capita Income in Mattoon?
Per Capita income in Mattoon is $27,000.
What is the Median Family Income in Mattoon?
Median Family Income in Mattoon is $63,082.
What is the Median Household income in Mattoon?
Median Household Income in Mattoon is $45,953.
What is Income or Wage Gap in Mattoon?
Income or Wage Gap in Mattoon is 11.0%.
Women in Mattoon earn 89.0 cents for every dollar earned by a man.
What is Family Income Deficit in Mattoon?
Family Income Deficit in Mattoon is $8,056.
Families that are below poverty line in Mattoon earn $8,056 less on average than the poverty threshold level.
What is Inequality or Gini Index in Mattoon?
Inequality or Gini Index in Mattoon is 0.42.
What is the Total Population of Mattoon?
Total Population of Mattoon is 16,830.
What is the Total Male Population of Mattoon?
Total Male Population of Mattoon is 8,207.
What is the Total Female Population of Mattoon?
Total Female Population of Mattoon is 8,623.
What is the Ratio of Males per 100 Females in Mattoon?
There are 95.18 Males per 100 Females in Mattoon.
What is the Ratio of Females per 100 Males in Mattoon?
There are 105.07 Females per 100 Males in Mattoon.
What is the Median Population Age in Mattoon?
Median Population Age in Mattoon is 42.4 Years.
What is the Average Family Size in Mattoon
Average Family Size in Mattoon is 2.6 People.
What is the Average Household Size in Mattoon
Average Household Size in Mattoon is 2.1 People.
How Large is the Labor Force in Mattoon?
There are 8,438 People in the Labor Forcein in Mattoon.
What is the Percentage of People in the Labor Force in Mattoon?
62.0% of People are in the Labor Force in Mattoon.
What is the Unemployment Rate in Mattoon?
Unemployment Rate in Mattoon is 7.9%.