Polo, IL Map & Demographics
Polo Map
Polo Overview
$26,369
PER CAPITA INCOME
$69,615
AVG FAMILY INCOME
$57,931
AVG HOUSEHOLD INCOME
16.9%
WAGE / INCOME GAP [ % ]
83.1¢/ $1
WAGE / INCOME GAP [ $ ]
0.38
INEQUALITY / GINI INDEX
2,520
TOTAL POPULATION
1,266
MALE POPULATION
1,254
FEMALE POPULATION
100.96
MALES / 100 FEMALES
99.05
FEMALES / 100 MALES
30.2
MEDIAN AGE
2.9
AVG FAMILY SIZE
2.5
AVG HOUSEHOLD SIZE
1,191
LABOR FORCE [ PEOPLE ]
64.3%
PERCENT IN LABOR FORCE
3.4%
UNEMPLOYMENT RATE
Polo Zip Codes
Income in Polo
Income Overview in Polo
Per Capita Income in Polo is $26,369, while median incomes of families and households are $69,615 and $57,931 respectively.
| Characteristic | Number | Measure |
| Per Capita Income | 2,520 | $26,369 |
| Median Family Income | 650 | $69,615 |
| Mean Family Income | 650 | $69,184 |
| Median Household Income | 978 | $57,931 |
| Mean Household Income | 978 | $64,355 |
| Income Deficit | 650 | $0 |
| Wage / Income Gap (%) | 2,520 | 16.86% |
| Wage / Income Gap ($) | 2,520 | 83.14¢ per $1 |
| Gini / Inequality Index | 2,520 | 0.38 |
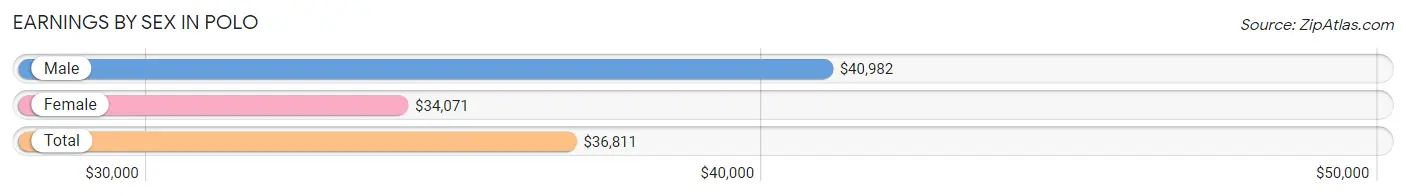
Earnings by Sex in Polo
Average Earnings in Polo are $36,811, $40,982 for men and $34,071 for women, a difference of 16.9%.
| Sex | Number | Average Earnings |
| Male | 669 (54.1%) | $40,982 |
| Female | 567 (45.9%) | $34,071 |
| Total | 1,236 (100.0%) | $36,811 |
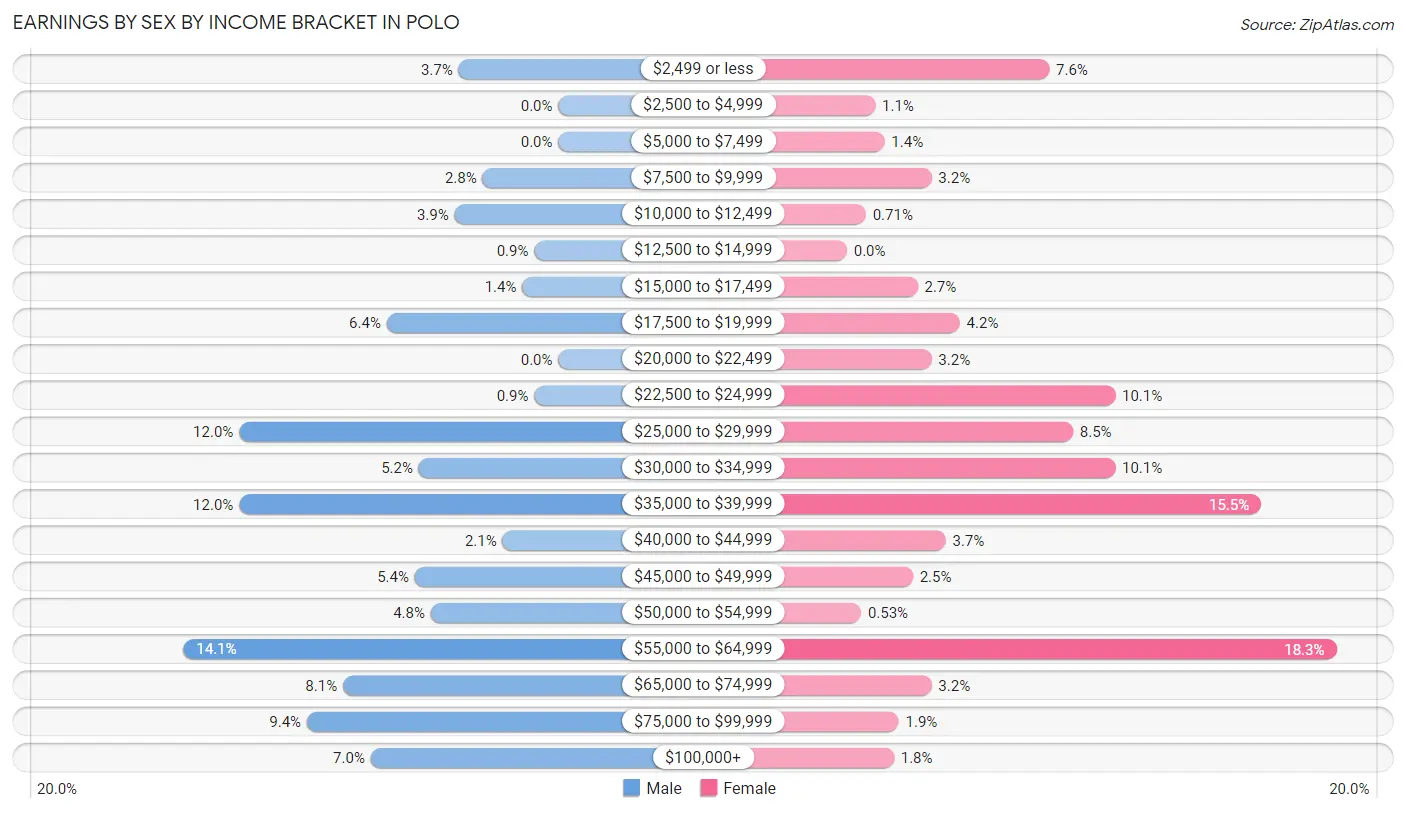
Earnings by Sex by Income Bracket in Polo
The most common earnings brackets in Polo are $55,000 to $64,999 for men (94 | 14.1%) and $55,000 to $64,999 for women (104 | 18.3%).
| Income | Male | Female |
| $2,499 or less | 25 (3.7%) | 43 (7.6%) |
| $2,500 to $4,999 | 0 (0.0%) | 6 (1.1%) |
| $5,000 to $7,499 | 0 (0.0%) | 8 (1.4%) |
| $7,500 to $9,999 | 19 (2.8%) | 18 (3.2%) |
| $10,000 to $12,499 | 26 (3.9%) | 4 (0.7%) |
| $12,500 to $14,999 | 6 (0.9%) | 0 (0.0%) |
| $15,000 to $17,499 | 9 (1.3%) | 15 (2.6%) |
| $17,500 to $19,999 | 43 (6.4%) | 24 (4.2%) |
| $20,000 to $22,499 | 0 (0.0%) | 18 (3.2%) |
| $22,500 to $24,999 | 6 (0.9%) | 57 (10.1%) |
| $25,000 to $29,999 | 80 (12.0%) | 48 (8.5%) |
| $30,000 to $34,999 | 35 (5.2%) | 57 (10.1%) |
| $35,000 to $39,999 | 80 (12.0%) | 88 (15.5%) |
| $40,000 to $44,999 | 14 (2.1%) | 21 (3.7%) |
| $45,000 to $49,999 | 36 (5.4%) | 14 (2.5%) |
| $50,000 to $54,999 | 32 (4.8%) | 3 (0.5%) |
| $55,000 to $64,999 | 94 (14.1%) | 104 (18.3%) |
| $65,000 to $74,999 | 54 (8.1%) | 18 (3.2%) |
| $75,000 to $99,999 | 63 (9.4%) | 11 (1.9%) |
| $100,000+ | 47 (7.0%) | 10 (1.8%) |
| Total | 669 (100.0%) | 567 (100.0%) |
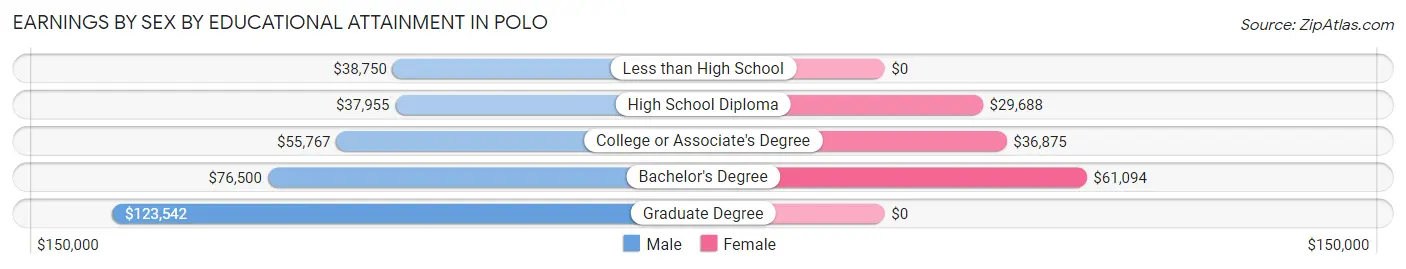
Earnings by Sex by Educational Attainment in Polo
Average earnings in Polo are $45,486 for men and $33,846 for women, a difference of 25.6%. Men with an educational attainment of graduate degree enjoy the highest average annual earnings of $123,542, while those with high school diploma education earn the least with $37,955. Women with an educational attainment of bachelor's degree earn the most with the average annual earnings of $61,094, while those with high school diploma education have the smallest earnings of $29,688.
| Educational Attainment | Male Income | Female Income |
| Less than High School | $38,750 | $0 |
| High School Diploma | $37,955 | $29,688 |
| College or Associate's Degree | $55,767 | $36,875 |
| Bachelor's Degree | $76,500 | $61,094 |
| Graduate Degree | $123,542 | $0 |
| Total | $45,486 | $33,846 |
Family Income in Polo
Family Income Brackets in Polo
According to the Polo family income data, there are 133 families falling into the $75,000 to $99,999 income range, which is the most common income bracket and makes up 20.5% of all families. Conversely, the $150,000 to $199,999 income bracket is the least frequent group with only 10 families (1.5%) belonging to this category.
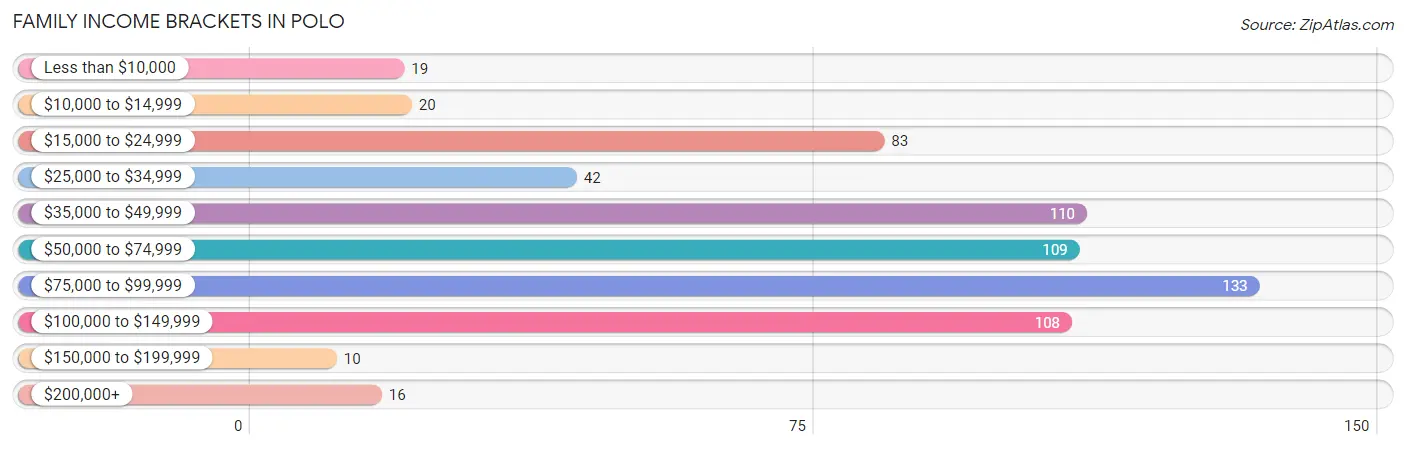
| Income Bracket | # Families | % Families |
| Less than $10,000 | 19 | 2.9% |
| $10,000 to $14,999 | 20 | 3.1% |
| $15,000 to $24,999 | 83 | 12.8% |
| $25,000 to $34,999 | 42 | 6.5% |
| $35,000 to $49,999 | 110 | 16.9% |
| $50,000 to $74,999 | 109 | 16.8% |
| $75,000 to $99,999 | 133 | 20.5% |
| $100,000 to $149,999 | 108 | 16.6% |
| $150,000 to $199,999 | 10 | 1.5% |
| $200,000+ | 16 | 2.5% |
Family Income by Famaliy Size in Polo
4-person families (31 | 4.8%) account for the highest median family income in Polo with $117,639 per family, while 2-person families (320 | 49.2%) have the highest median income of $33,854 per family member.
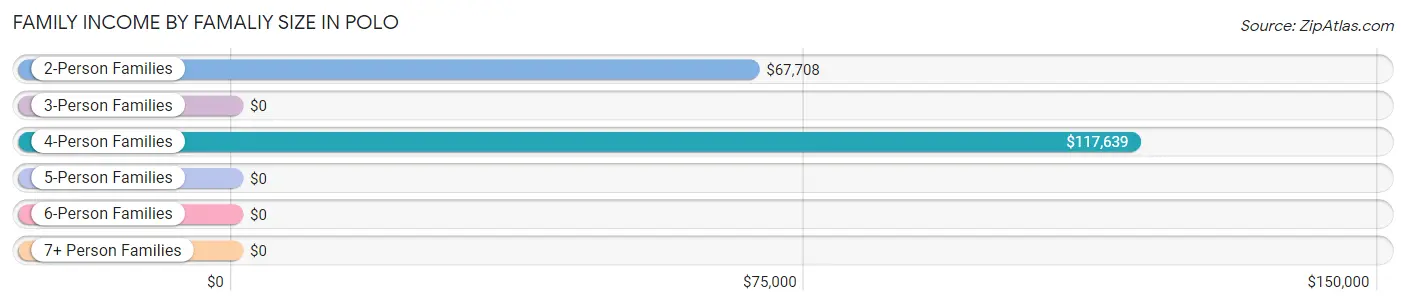
| Income Bracket | # Families | Median Income |
| 2-Person Families | 320 (49.2%) | $67,708 |
| 3-Person Families | 235 (36.1%) | $0 |
| 4-Person Families | 31 (4.8%) | $117,639 |
| 5-Person Families | 40 (6.1%) | $0 |
| 6-Person Families | 24 (3.7%) | $0 |
| 7+ Person Families | 0 (0.0%) | $0 |
| Total | 650 (100.0%) | $69,615 |
Family Income by Number of Earners in Polo
The median family income in Polo is $69,615, with families comprising 3+ earners (22) having the highest median family income of $118,056, while families with no earners (93) have the lowest median family income of $32,813, accounting for 3.4% and 14.3% of families, respectively.
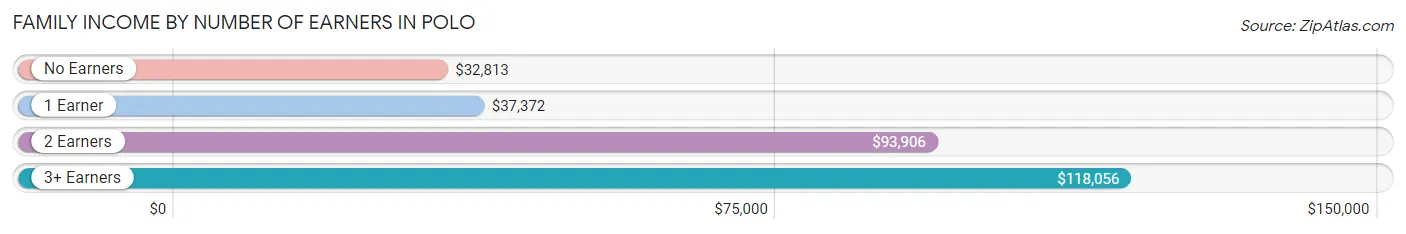
| Number of Earners | # Families | Median Income |
| No Earners | 93 (14.3%) | $32,813 |
| 1 Earner | 294 (45.2%) | $37,372 |
| 2 Earners | 241 (37.1%) | $93,906 |
| 3+ Earners | 22 (3.4%) | $118,056 |
| Total | 650 (100.0%) | $69,615 |
Household Income in Polo
Household Income Brackets in Polo
With 182 households falling in the category, the $50,000 to $74,999 income range is the most frequent in Polo, accounting for 18.6% of all households. In contrast, only 10 households (1.0%) fall into the $150,000 to $199,999 income bracket, making it the least populous group.
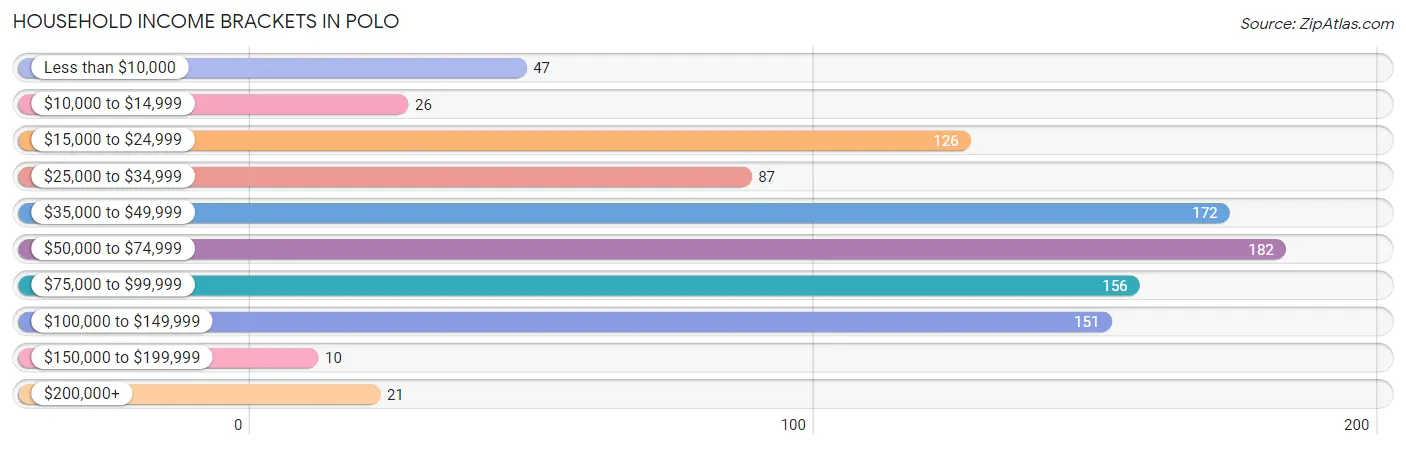
| Income Bracket | # Households | % Households |
| Less than $10,000 | 47 | 4.8% |
| $10,000 to $14,999 | 26 | 2.7% |
| $15,000 to $24,999 | 126 | 12.9% |
| $25,000 to $34,999 | 87 | 8.9% |
| $35,000 to $49,999 | 172 | 17.6% |
| $50,000 to $74,999 | 182 | 18.6% |
| $75,000 to $99,999 | 156 | 16.0% |
| $100,000 to $149,999 | 151 | 15.4% |
| $150,000 to $199,999 | 10 | 1.0% |
| $200,000+ | 21 | 2.1% |
Household Income by Householder Age in Polo
The median household income in Polo is $57,931, with the highest median household income of $70,089 found in the 25 to 44 years age bracket for the primary householder. A total of 467 households (47.7%) fall into this category. Meanwhile, the 15 to 24 years age bracket for the primary householder has the lowest median household income of $0, with 15 households (1.5%) in this group.
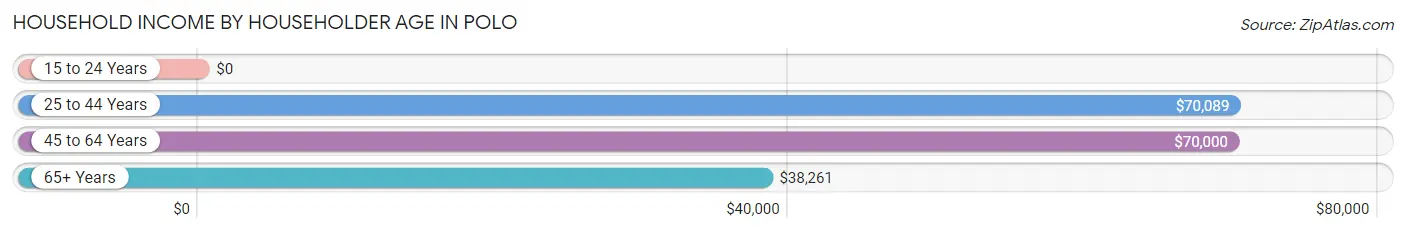
| Income Bracket | # Households | Median Income |
| 15 to 24 Years | 15 (1.5%) | $0 |
| 25 to 44 Years | 467 (47.7%) | $70,089 |
| 45 to 64 Years | 252 (25.8%) | $70,000 |
| 65+ Years | 244 (24.9%) | $38,261 |
| Total | 978 (100.0%) | $57,931 |
Poverty in Polo
Income Below Poverty by Sex and Age in Polo
With 26.4% poverty level for males and 22.8% for females among the residents of Polo, 12 to 14 year old males and 18 to 24 year old females are the most vulnerable to poverty, with 26 males (92.9%) and 24 females (48.0%) in their respective age groups living below the poverty level.
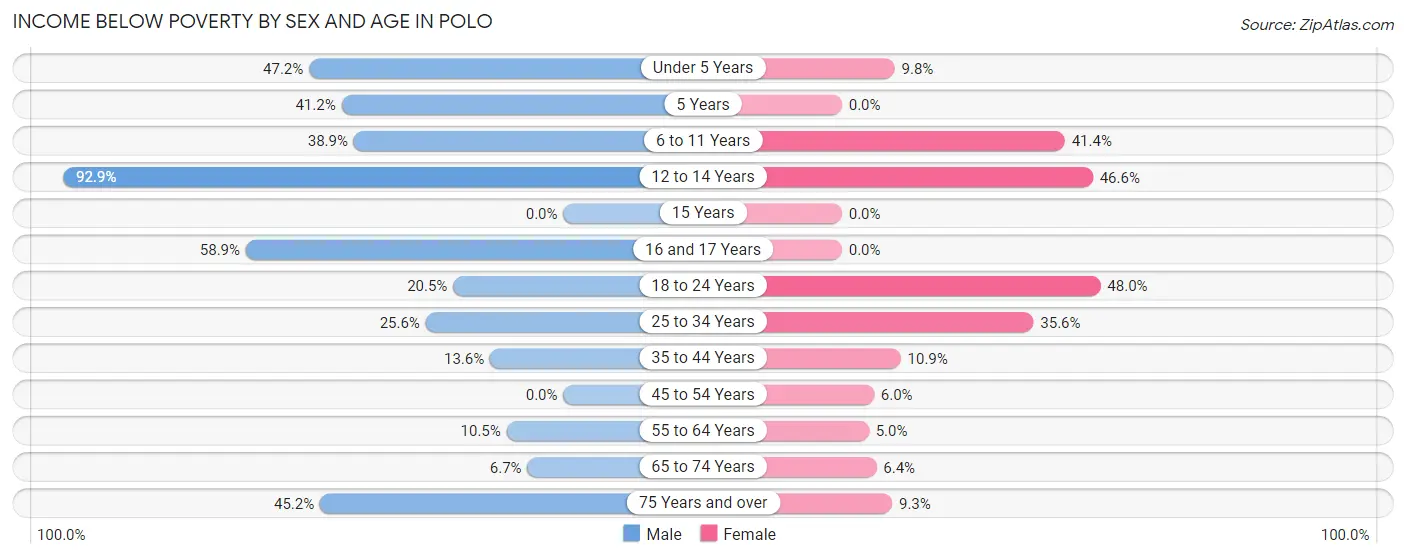
| Age Bracket | Male | Female |
| Under 5 Years | 42 (47.2%) | 10 (9.8%) |
| 5 Years | 14 (41.2%) | 0 (0.0%) |
| 6 to 11 Years | 63 (38.9%) | 12 (41.4%) |
| 12 to 14 Years | 26 (92.9%) | 75 (46.6%) |
| 15 Years | 0 (0.0%) | 0 (0.0%) |
| 16 and 17 Years | 33 (58.9%) | 0 (0.0%) |
| 18 to 24 Years | 9 (20.4%) | 24 (48.0%) |
| 25 to 34 Years | 82 (25.6%) | 117 (35.6%) |
| 35 to 44 Years | 17 (13.6%) | 13 (10.9%) |
| 45 to 54 Years | 0 (0.0%) | 5 (5.9%) |
| 55 to 64 Years | 12 (10.5%) | 5 (5.0%) |
| 65 to 74 Years | 5 (6.7%) | 7 (6.4%) |
| 75 Years and over | 28 (45.2%) | 7 (9.3%) |
| Total | 331 (26.4%) | 275 (22.8%) |
Income Above Poverty by Sex and Age in Polo
According to the poverty statistics in Polo, males aged 15 years and females aged 5 years are the age groups that are most secure financially, with 100.0% of males and 100.0% of females in these age groups living above the poverty line.
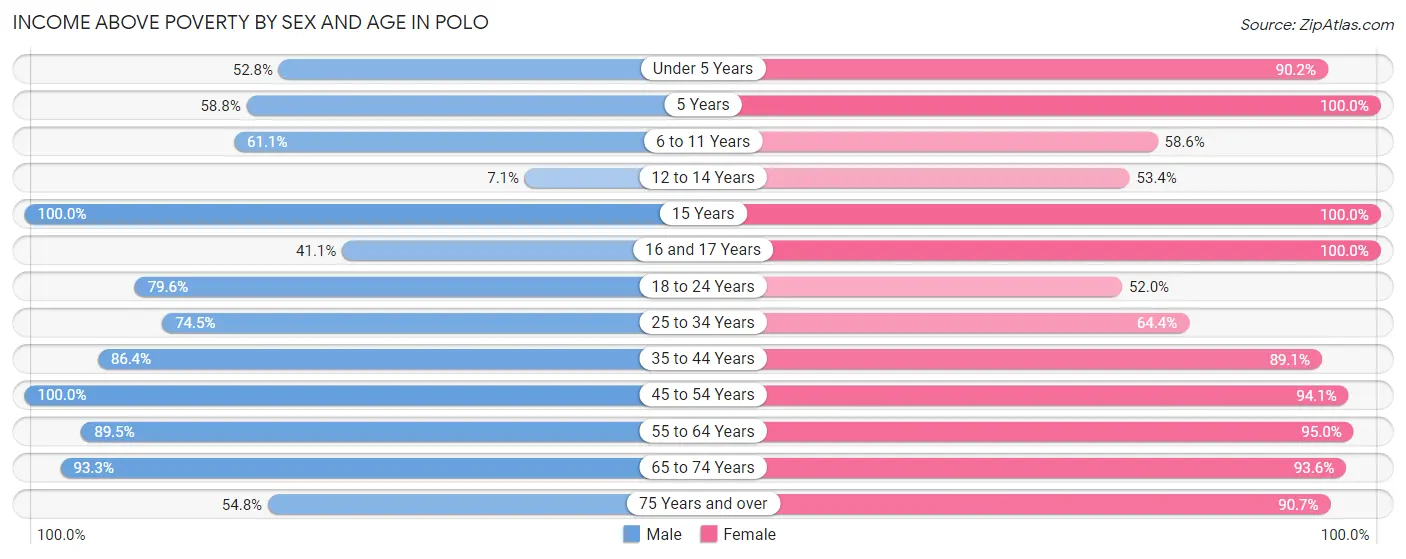
| Age Bracket | Male | Female |
| Under 5 Years | 47 (52.8%) | 92 (90.2%) |
| 5 Years | 20 (58.8%) | 36 (100.0%) |
| 6 to 11 Years | 99 (61.1%) | 17 (58.6%) |
| 12 to 14 Years | 2 (7.1%) | 86 (53.4%) |
| 15 Years | 11 (100.0%) | 5 (100.0%) |
| 16 and 17 Years | 23 (41.1%) | 10 (100.0%) |
| 18 to 24 Years | 35 (79.5%) | 26 (52.0%) |
| 25 to 34 Years | 239 (74.5%) | 212 (64.4%) |
| 35 to 44 Years | 108 (86.4%) | 106 (89.1%) |
| 45 to 54 Years | 135 (100.0%) | 79 (94.1%) |
| 55 to 64 Years | 102 (89.5%) | 95 (95.0%) |
| 65 to 74 Years | 70 (93.3%) | 102 (93.6%) |
| 75 Years and over | 34 (54.8%) | 68 (90.7%) |
| Total | 925 (73.7%) | 934 (77.2%) |
Income Below Poverty Among Married-Couple Families in Polo
The poverty statistics for married-couple families in Polo show that 6.7% or 26 of the total 390 families live below the poverty line. Families with 1 or 2 children have the highest poverty rate of 17.8%, comprising of 18 families. On the other hand, families with 3 or 4 children have the lowest poverty rate of 0.0%, which includes 0 families.
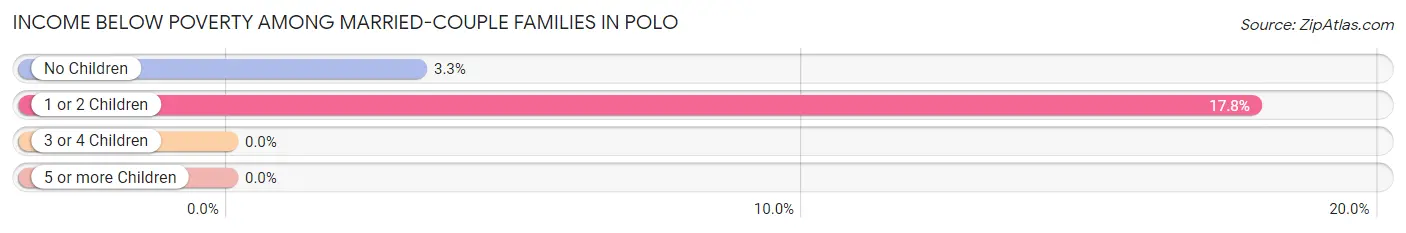
| Children | Above Poverty | Below Poverty |
| No Children | 235 (96.7%) | 8 (3.3%) |
| 1 or 2 Children | 83 (82.2%) | 18 (17.8%) |
| 3 or 4 Children | 46 (100.0%) | 0 (0.0%) |
| 5 or more Children | 0 (0.0%) | 0 (0.0%) |
| Total | 364 (93.3%) | 26 (6.7%) |
Income Below Poverty Among Single-Parent Households in Polo
According to the poverty data in Polo, 51.8% or 43 single-father households and 28.8% or 51 single-mother households are living below the poverty line. Among single-father households, those with 1 or 2 children have the highest poverty rate, with 43 households (51.8%) experiencing poverty. Likewise, among single-mother households, those with 1 or 2 children have the highest poverty rate, with 48 households (36.4%) falling below the poverty line.
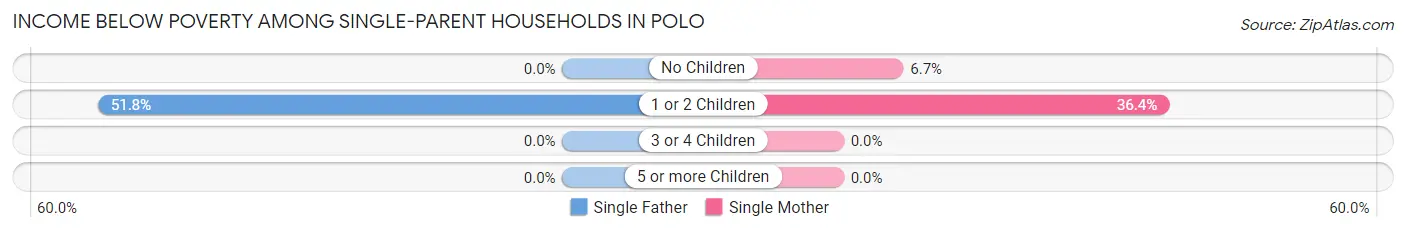
| Children | Single Father | Single Mother |
| No Children | 0 (0.0%) | 3 (6.7%) |
| 1 or 2 Children | 43 (51.8%) | 48 (36.4%) |
| 3 or 4 Children | 0 (0.0%) | 0 (0.0%) |
| 5 or more Children | 0 (0.0%) | 0 (0.0%) |
| Total | 43 (51.8%) | 51 (28.8%) |
Income Below Poverty Among Married-Couple vs Single-Parent Households in Polo
The poverty data for Polo shows that 26 of the married-couple family households (6.7%) and 94 of the single-parent households (36.1%) are living below the poverty level. Within the married-couple family households, those with 1 or 2 children have the highest poverty rate, with 18 households (17.8%) falling below the poverty line. Among the single-parent households, those with 1 or 2 children have the highest poverty rate, with 91 household (42.3%) living below poverty.
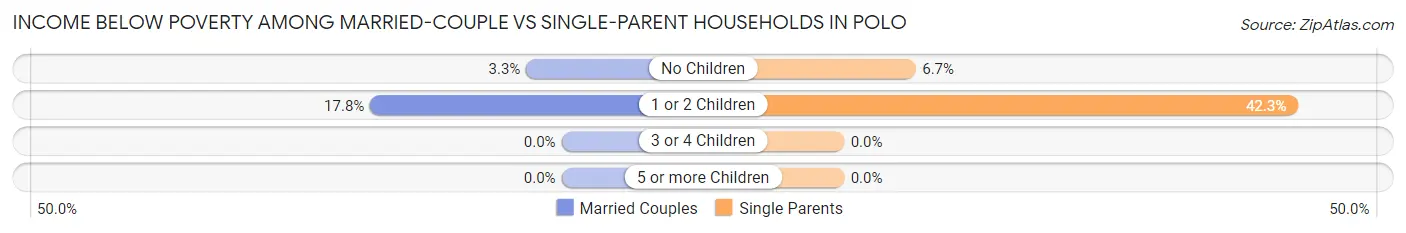
| Children | Married-Couple Families | Single-Parent Households |
| No Children | 8 (3.3%) | 3 (6.7%) |
| 1 or 2 Children | 18 (17.8%) | 91 (42.3%) |
| 3 or 4 Children | 0 (0.0%) | 0 (0.0%) |
| 5 or more Children | 0 (0.0%) | 0 (0.0%) |
| Total | 26 (6.7%) | 94 (36.1%) |
Race in Polo
The most populous races in Polo are White / Caucasian (2,465 | 97.8%), Hispanic or Latino (31 | 1.2%), and Asian (24 | 0.9%).
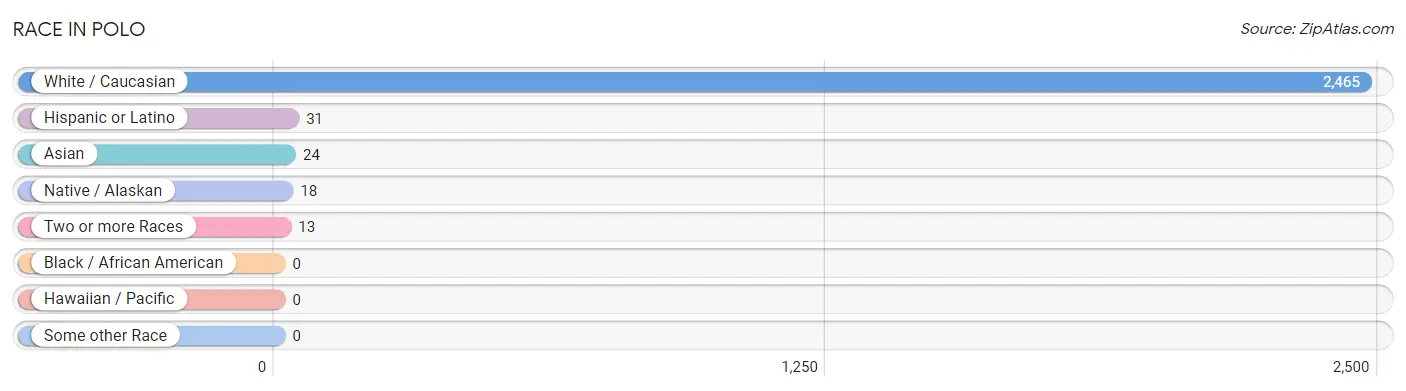
| Race | # Population | % Population |
| Asian | 24 | 0.9% |
| Black / African American | 0 | 0.0% |
| Hawaiian / Pacific | 0 | 0.0% |
| Hispanic or Latino | 31 | 1.2% |
| Native / Alaskan | 18 | 0.7% |
| White / Caucasian | 2,465 | 97.8% |
| Two or more Races | 13 | 0.5% |
| Some other Race | 0 | 0.0% |
| Total | 2,520 | 100.0% |
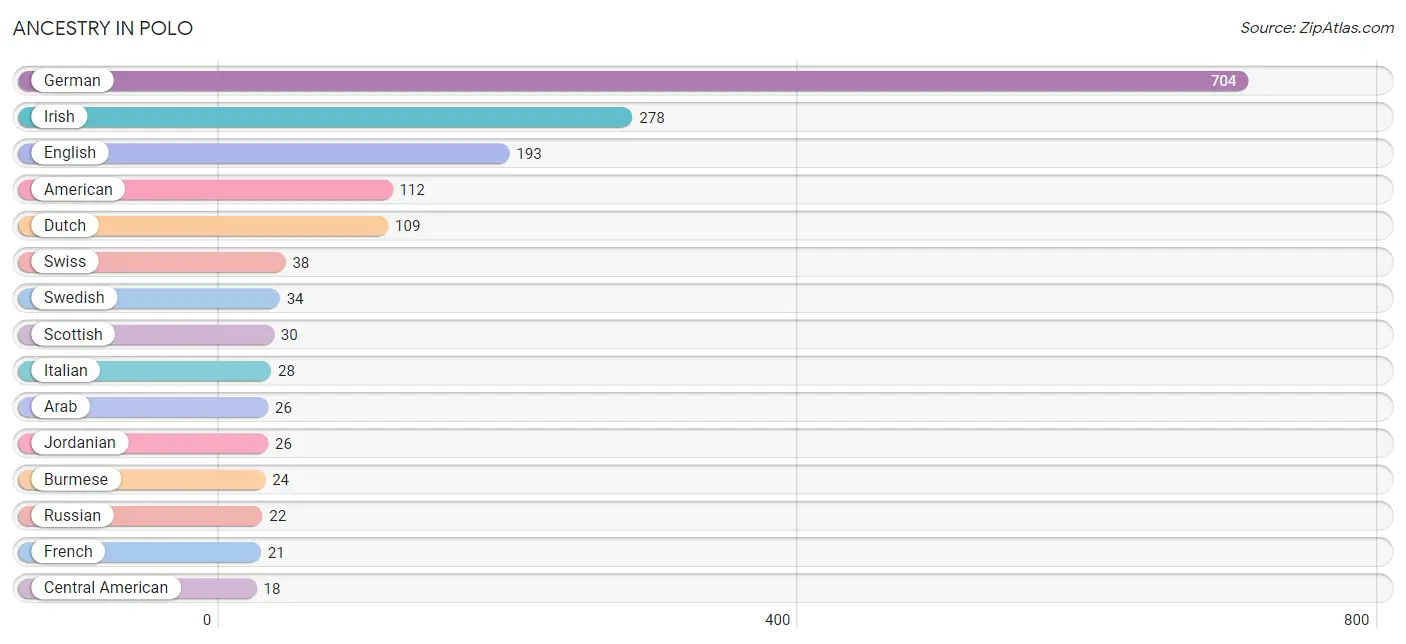
Ancestry in Polo
The most populous ancestries reported in Polo are German (704 | 27.9%), Irish (278 | 11.0%), English (193 | 7.7%), American (112 | 4.4%), and Dutch (109 | 4.3%), together accounting for 55.4% of all Polo residents.
| Ancestry | # Population | % Population |
| American | 112 | 4.4% |
| Arab | 26 | 1.0% |
| Burmese | 24 | 0.9% |
| Central American | 18 | 0.7% |
| Central American Indian | 18 | 0.7% |
| Cherokee | 1 | 0.0% |
| Czech | 12 | 0.5% |
| Danish | 12 | 0.5% |
| Dutch | 109 | 4.3% |
| Eastern European | 14 | 0.6% |
| English | 193 | 7.7% |
| European | 4 | 0.2% |
| French | 21 | 0.8% |
| French Canadian | 14 | 0.6% |
| German | 704 | 27.9% |
| Guatemalan | 18 | 0.7% |
| Irish | 278 | 11.0% |
| Italian | 28 | 1.1% |
| Jordanian | 26 | 1.0% |
| Korean | 7 | 0.3% |
| Northern European | 5 | 0.2% |
| Norwegian | 17 | 0.7% |
| Puerto Rican | 13 | 0.5% |
| Russian | 22 | 0.9% |
| Scandinavian | 4 | 0.2% |
| Scotch-Irish | 9 | 0.4% |
| Scottish | 30 | 1.2% |
| Shoshone | 1 | 0.0% |
| Slovak | 4 | 0.2% |
| Swedish | 34 | 1.3% |
| Swiss | 38 | 1.5% |
| Welsh | 2 | 0.1% | View All 32 Rows |
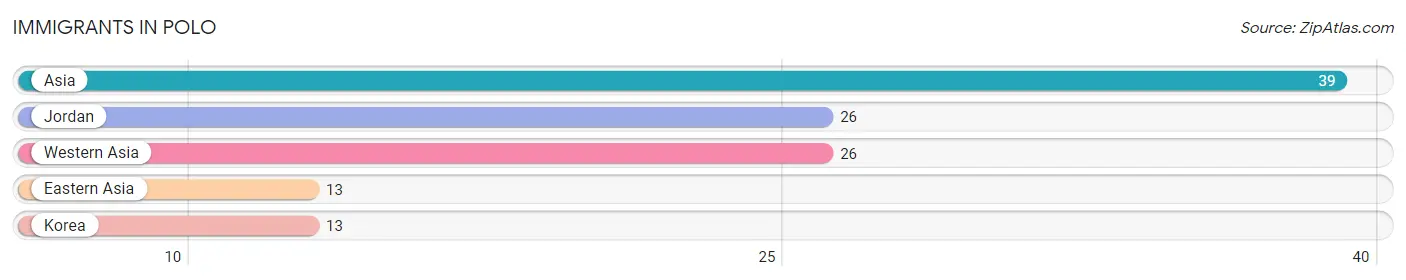
Immigrants in Polo
The most numerous immigrant groups reported in Polo came from Asia (39 | 1.5%), Jordan (26 | 1.0%), Western Asia (26 | 1.0%), Eastern Asia (13 | 0.5%), and Korea (13 | 0.5%), together accounting for 4.6% of all Polo residents.
| Immigration Origin | # Population | % Population |
| Asia | 39 | 1.5% |
| Eastern Asia | 13 | 0.5% |
| Jordan | 26 | 1.0% |
| Korea | 13 | 0.5% |
| Western Asia | 26 | 1.0% | View All 5 Rows |
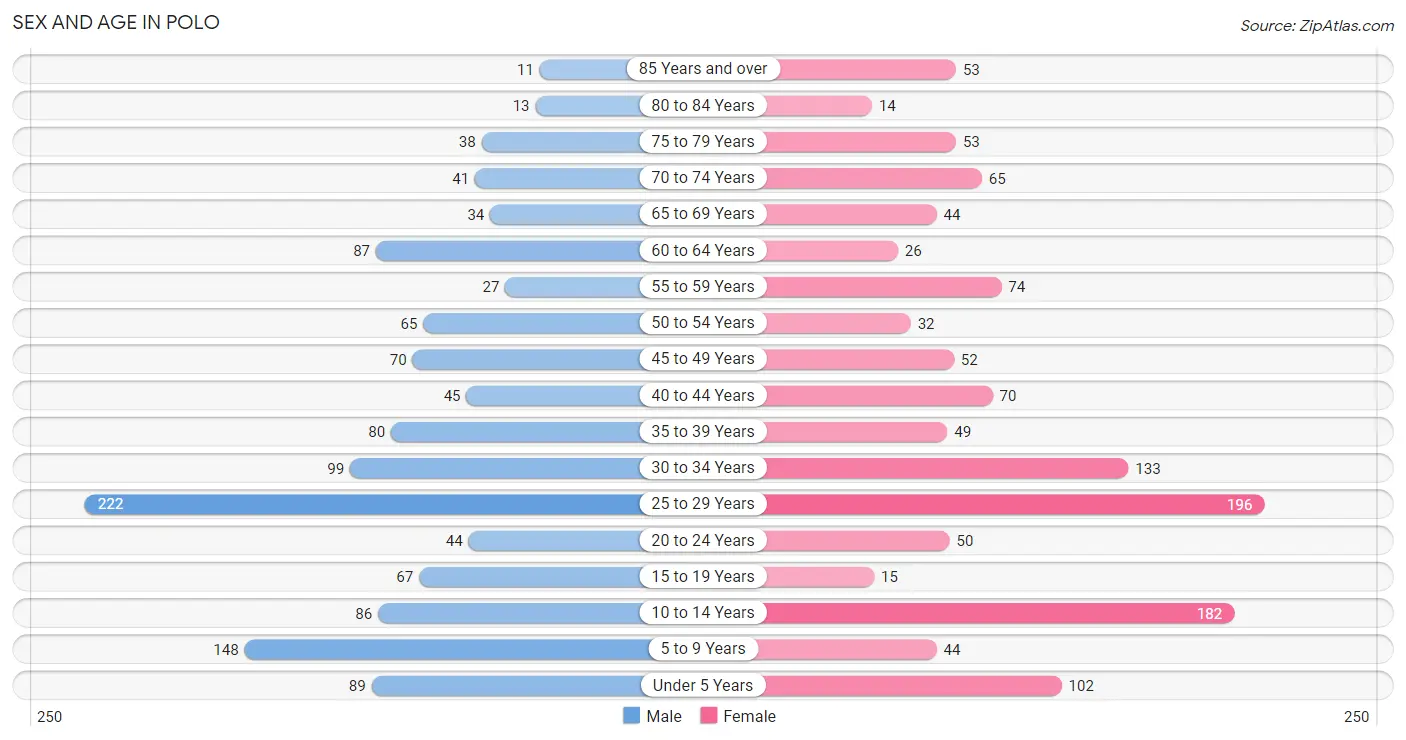
Sex and Age in Polo
Sex and Age in Polo
The most populous age groups in Polo are 25 to 29 Years (222 | 17.5%) for men and 25 to 29 Years (196 | 15.6%) for women.
| Age Bracket | Male | Female |
| Under 5 Years | 89 (7.0%) | 102 (8.1%) |
| 5 to 9 Years | 148 (11.7%) | 44 (3.5%) |
| 10 to 14 Years | 86 (6.8%) | 182 (14.5%) |
| 15 to 19 Years | 67 (5.3%) | 15 (1.2%) |
| 20 to 24 Years | 44 (3.5%) | 50 (4.0%) |
| 25 to 29 Years | 222 (17.5%) | 196 (15.6%) |
| 30 to 34 Years | 99 (7.8%) | 133 (10.6%) |
| 35 to 39 Years | 80 (6.3%) | 49 (3.9%) |
| 40 to 44 Years | 45 (3.5%) | 70 (5.6%) |
| 45 to 49 Years | 70 (5.5%) | 52 (4.2%) |
| 50 to 54 Years | 65 (5.1%) | 32 (2.5%) |
| 55 to 59 Years | 27 (2.1%) | 74 (5.9%) |
| 60 to 64 Years | 87 (6.9%) | 26 (2.1%) |
| 65 to 69 Years | 34 (2.7%) | 44 (3.5%) |
| 70 to 74 Years | 41 (3.2%) | 65 (5.2%) |
| 75 to 79 Years | 38 (3.0%) | 53 (4.2%) |
| 80 to 84 Years | 13 (1.0%) | 14 (1.1%) |
| 85 Years and over | 11 (0.9%) | 53 (4.2%) |
| Total | 1,266 (100.0%) | 1,254 (100.0%) |
Families and Households in Polo
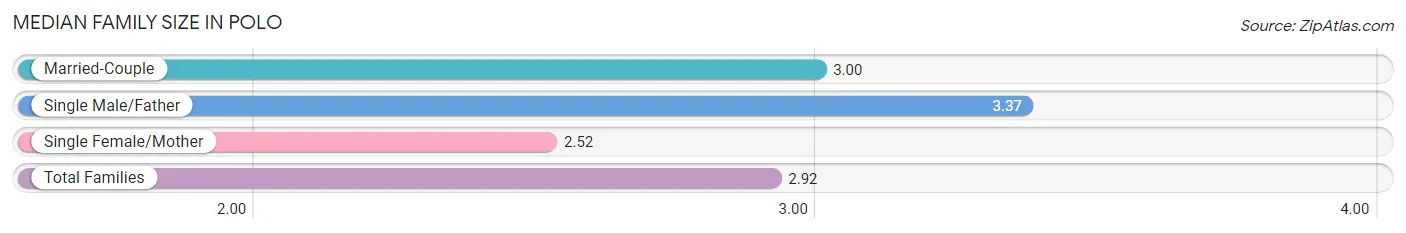
Median Family Size in Polo
The median family size in Polo is 2.92 persons per family, with single male/father families (83 | 12.8%) accounting for the largest median family size of 3.37 persons per family. On the other hand, single female/mother families (177 | 27.2%) represent the smallest median family size with 2.52 persons per family.
| Family Type | # Families | Family Size |
| Married-Couple | 390 (60.0%) | 3.00 |
| Single Male/Father | 83 (12.8%) | 3.37 |
| Single Female/Mother | 177 (27.2%) | 2.52 |
| Total Families | 650 (100.0%) | 2.92 |
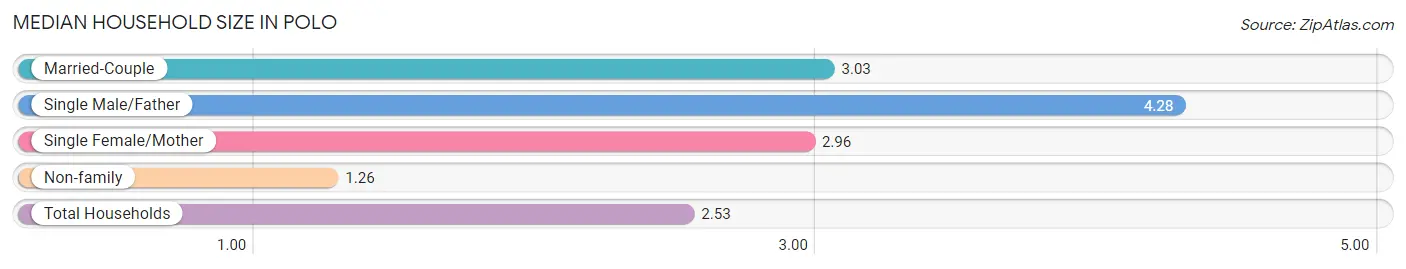
Median Household Size in Polo
The median household size in Polo is 2.53 persons per household, with single male/father households (83 | 8.5%) accounting for the largest median household size of 4.28 persons per household. non-family households (328 | 33.5%) represent the smallest median household size with 1.26 persons per household.
| Household Type | # Households | Household Size |
| Married-Couple | 390 (39.9%) | 3.03 |
| Single Male/Father | 83 (8.5%) | 4.28 |
| Single Female/Mother | 177 (18.1%) | 2.96 |
| Non-family | 328 (33.5%) | 1.26 |
| Total Households | 978 (100.0%) | 2.53 |
Household Size by Marriage Status in Polo
Out of a total of 978 households in Polo, 650 (66.5%) are family households, while 328 (33.5%) are nonfamily households. The most numerous type of family households are 2-person households, comprising 278, and the most common type of nonfamily households are 1-person households, comprising 267.
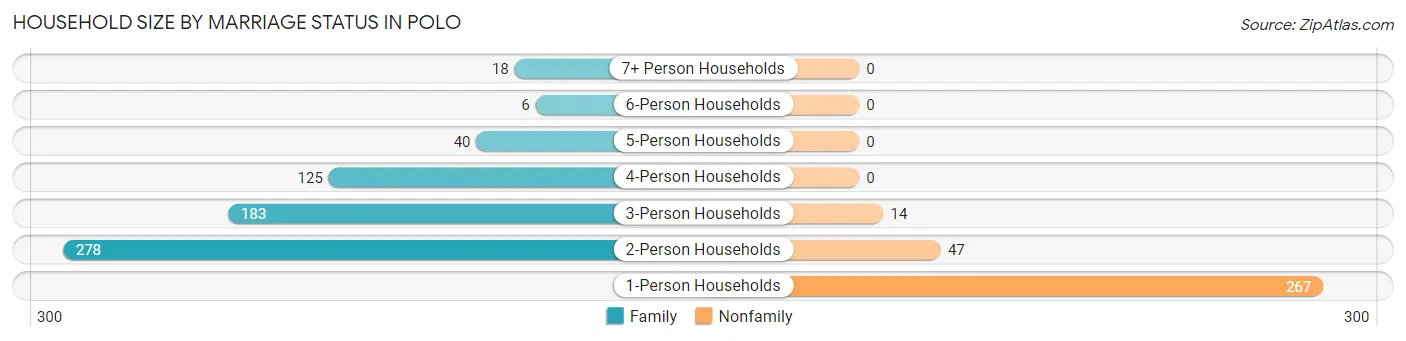
| Household Size | Family Households | Nonfamily Households |
| 1-Person Households | - | 267 (27.3%) |
| 2-Person Households | 278 (28.4%) | 47 (4.8%) |
| 3-Person Households | 183 (18.7%) | 14 (1.4%) |
| 4-Person Households | 125 (12.8%) | 0 (0.0%) |
| 5-Person Households | 40 (4.1%) | 0 (0.0%) |
| 6-Person Households | 6 (0.6%) | 0 (0.0%) |
| 7+ Person Households | 18 (1.8%) | 0 (0.0%) |
| Total | 650 (66.5%) | 328 (33.5%) |
Female Fertility in Polo
Fertility by Age in Polo
Average fertility rate in Polo is 99.0 births per 1,000 women. Women in the age bracket of 20 to 34 years have the highest fertility rate with 140.0 births per 1,000 women. Women in the age bracket of 20 to 34 years acount for 94.6% of all women with births.
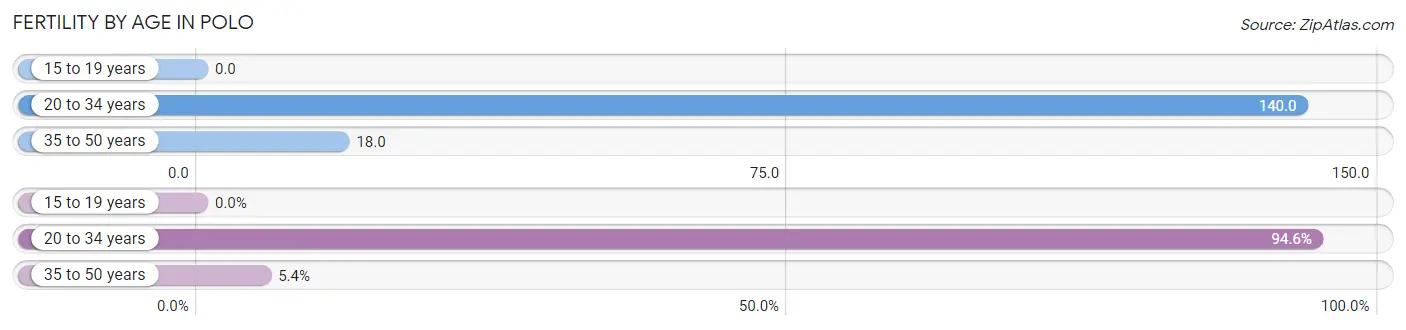
| Age Bracket | Women with Births | Births / 1,000 Women |
| 15 to 19 years | 0 (0.0%) | 0.0 |
| 20 to 34 years | 53 (94.6%) | 140.0 |
| 35 to 50 years | 3 (5.4%) | 18.0 |
| Total | 56 (100.0%) | 99.0 |
Fertility by Age by Marriage Status in Polo
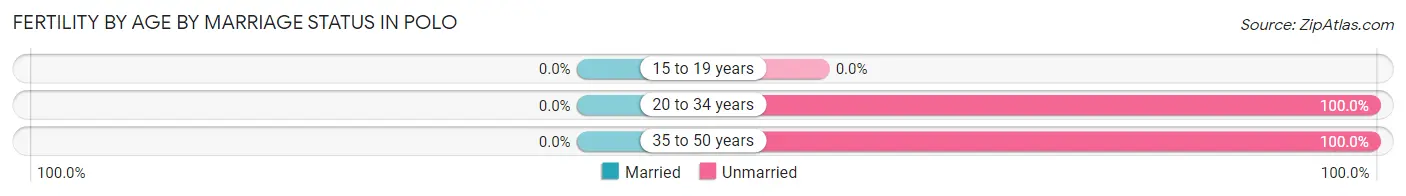
| Age Bracket | Married | Unmarried |
| 15 to 19 years | 0 (0.0%) | 0 (0.0%) |
| 20 to 34 years | 0 (0.0%) | 53 (100.0%) |
| 35 to 50 years | 0 (0.0%) | 3 (100.0%) |
| Total | 0 (0.0%) | 56 (100.0%) |
Fertility by Education in Polo
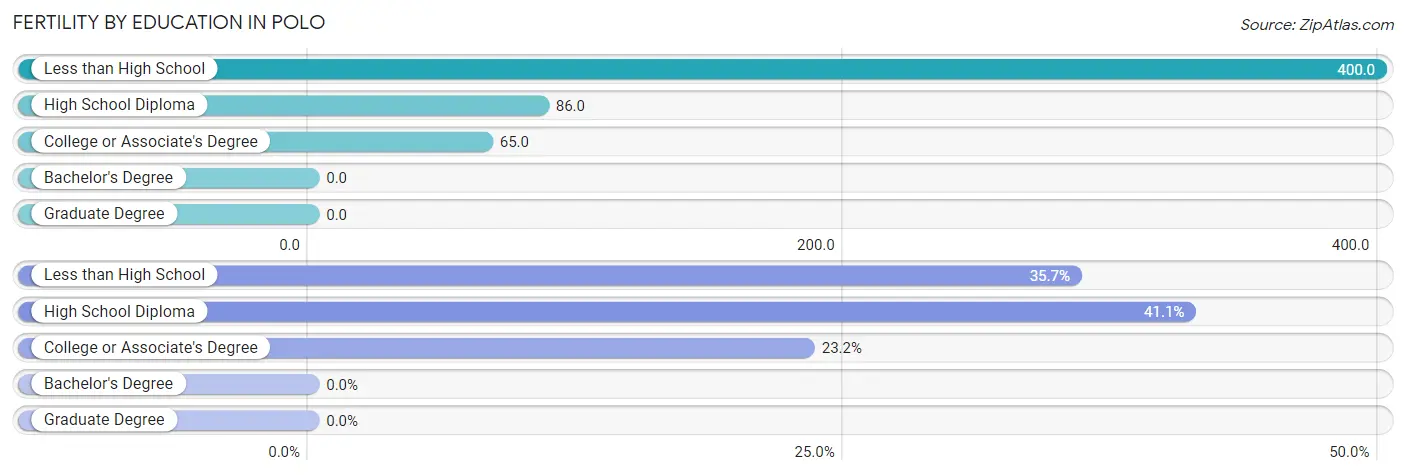
| Educational Attainment | Women with Births | Births / 1,000 Women |
| Less than High School | 20 (35.7%) | 400.0 |
| High School Diploma | 23 (41.1%) | 86.0 |
| College or Associate's Degree | 13 (23.2%) | 65.0 |
| Bachelor's Degree | 0 (0.0%) | 0.0 |
| Graduate Degree | 0 (0.0%) | 0.0 |
| Total | 56 (100.0%) | 99.0 |
Fertility by Education by Marriage Status in Polo
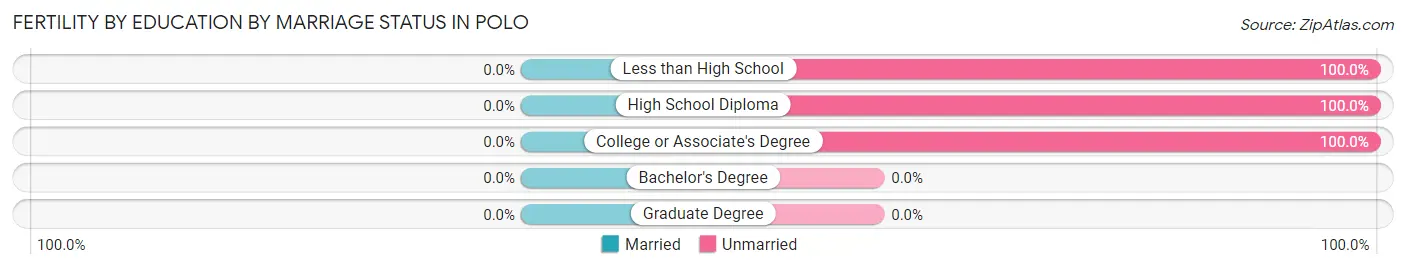
| Educational Attainment | Married | Unmarried |
| Less than High School | 0 (0.0%) | 20 (100.0%) |
| High School Diploma | 0 (0.0%) | 23 (100.0%) |
| College or Associate's Degree | 0 (0.0%) | 13 (100.0%) |
| Bachelor's Degree | 0 (0.0%) | 0 (0.0%) |
| Graduate Degree | 0 (0.0%) | 0 (0.0%) |
| Total | 0 (0.0%) | 56 (100.0%) |
Employment Characteristics in Polo
Employment by Class of Employer in Polo
Among the 1,146 employed individuals in Polo, private company employees (826 | 72.1%), not-for-profit organizations (99 | 8.6%), and local government employees (91 | 7.9%) make up the most common classes of employment.
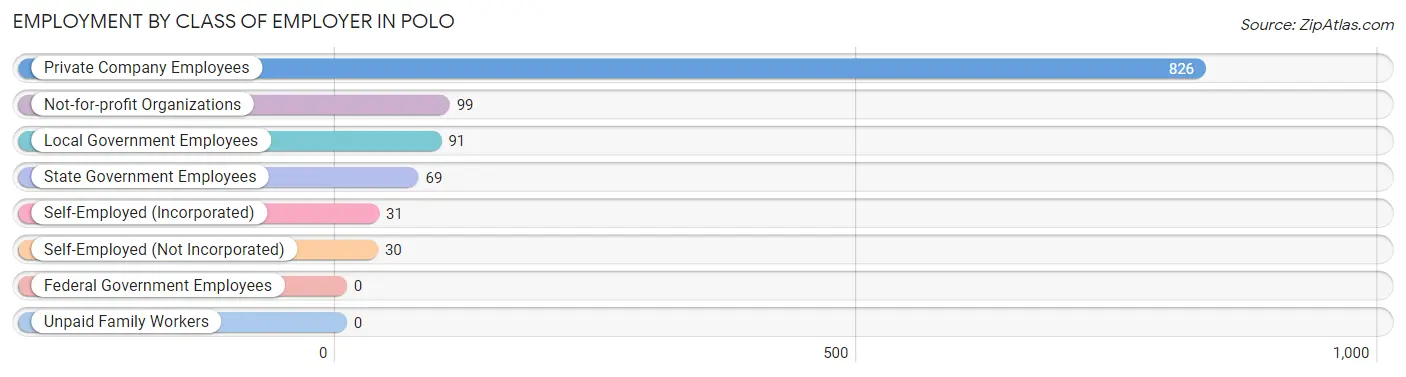
| Employer Class | # Employees | % Employees |
| Private Company Employees | 826 | 72.1% |
| Self-Employed (Incorporated) | 31 | 2.7% |
| Self-Employed (Not Incorporated) | 30 | 2.6% |
| Not-for-profit Organizations | 99 | 8.6% |
| Local Government Employees | 91 | 7.9% |
| State Government Employees | 69 | 6.0% |
| Federal Government Employees | 0 | 0.0% |
| Unpaid Family Workers | 0 | 0.0% |
| Total | 1,146 | 100.0% |
Employment Status by Age in Polo
According to the labor force statistics for Polo, out of the total population over 16 years of age (1,853), 64.3% or 1,191 individuals are in the labor force, with 3.4% or 40 of them unemployed. The age group with the highest labor force participation rate is 20 to 24 years, with 90.4% or 85 individuals in the labor force. Within the labor force, the 16 to 19 years age range has the highest percentage of unemployed individuals, with 100.0% or 19 of them being unemployed.
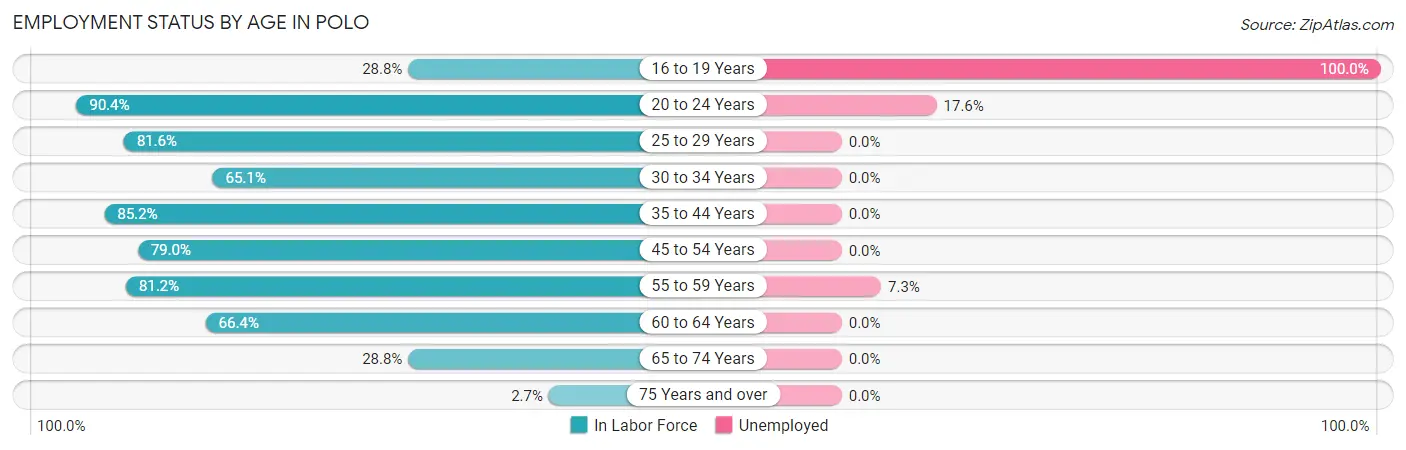
| Age Bracket | In Labor Force | Unemployed |
| 16 to 19 Years | 19 (28.8%) | 19 (100.0%) |
| 20 to 24 Years | 85 (90.4%) | 15 (17.6%) |
| 25 to 29 Years | 341 (81.6%) | 0 (0.0%) |
| 30 to 34 Years | 151 (65.1%) | 0 (0.0%) |
| 35 to 44 Years | 208 (85.2%) | 0 (0.0%) |
| 45 to 54 Years | 173 (79.0%) | 0 (0.0%) |
| 55 to 59 Years | 82 (81.2%) | 6 (7.3%) |
| 60 to 64 Years | 75 (66.4%) | 0 (0.0%) |
| 65 to 74 Years | 53 (28.8%) | 0 (0.0%) |
| 75 Years and over | 5 (2.7%) | 0 (0.0%) |
| Total | 1,191 (64.3%) | 40 (3.4%) |
Employment Status by Educational Attainment in Polo
According to labor force statistics for Polo, 77.6% of individuals (1,030) out of the total population between 25 and 64 years of age (1,327) are in the labor force, with 0.6% or 6 of them being unemployed. The group with the highest labor force participation rate are those with the educational attainment of college / associate degree, with 88.4% or 388 individuals in the labor force. Within the labor force, individuals with bachelor's degree or higher education have the highest percentage of unemployment, with 4.7% or 6 of them being unemployed.
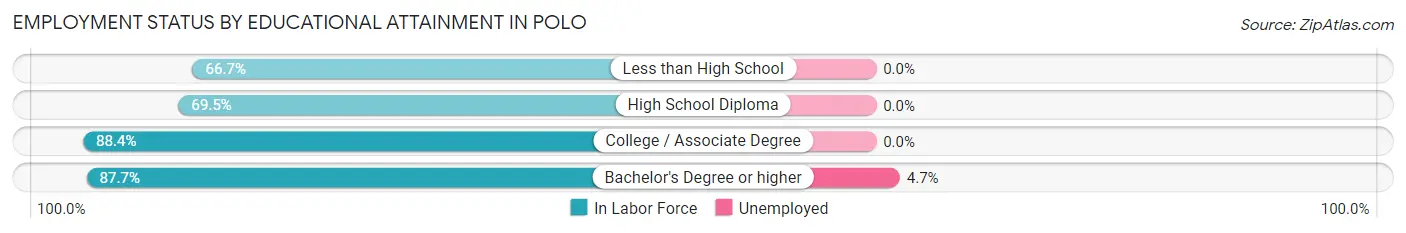
| Educational Attainment | In Labor Force | Unemployed |
| Less than High School | 42 (66.7%) | 0 (0.0%) |
| High School Diploma | 472 (69.5%) | 0 (0.0%) |
| College / Associate Degree | 388 (88.4%) | 0 (0.0%) |
| Bachelor's Degree or higher | 128 (87.7%) | 7 (4.7%) |
| Total | 1,030 (77.6%) | 8 (0.6%) |
Employment Occupations by Sex in Polo
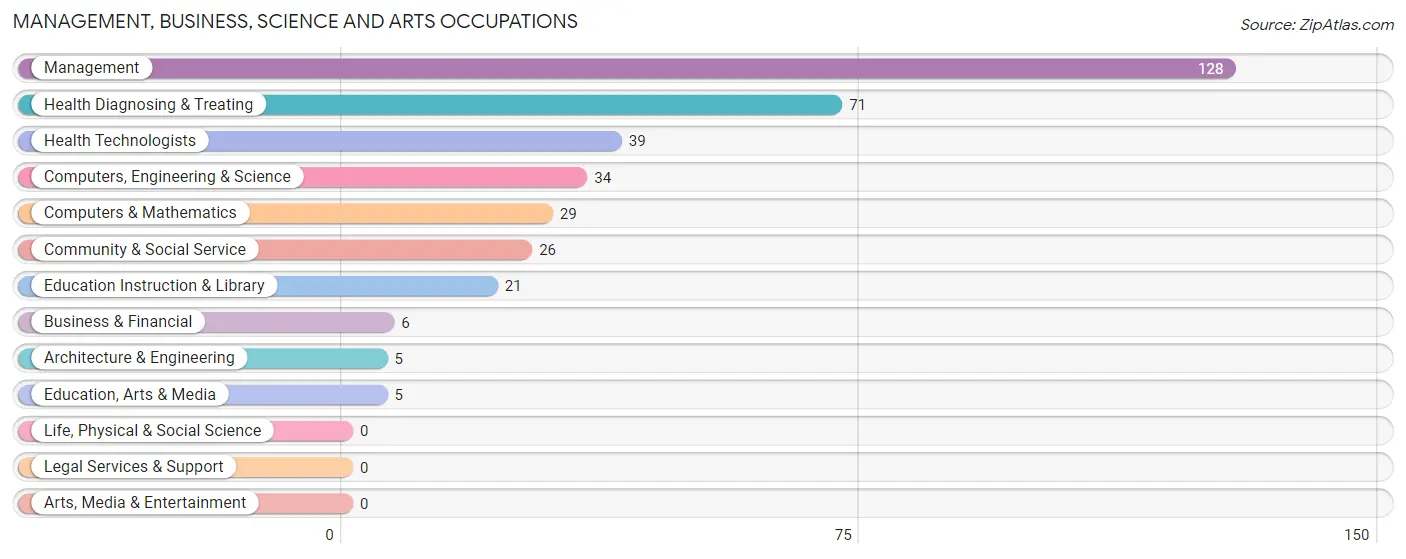
Management, Business, Science and Arts Occupations
The most common Management, Business, Science and Arts occupations in Polo are Management (128 | 11.1%), Health Diagnosing & Treating (71 | 6.2%), Health Technologists (39 | 3.4%), Computers, Engineering & Science (34 | 2.9%), and Computers & Mathematics (29 | 2.5%).
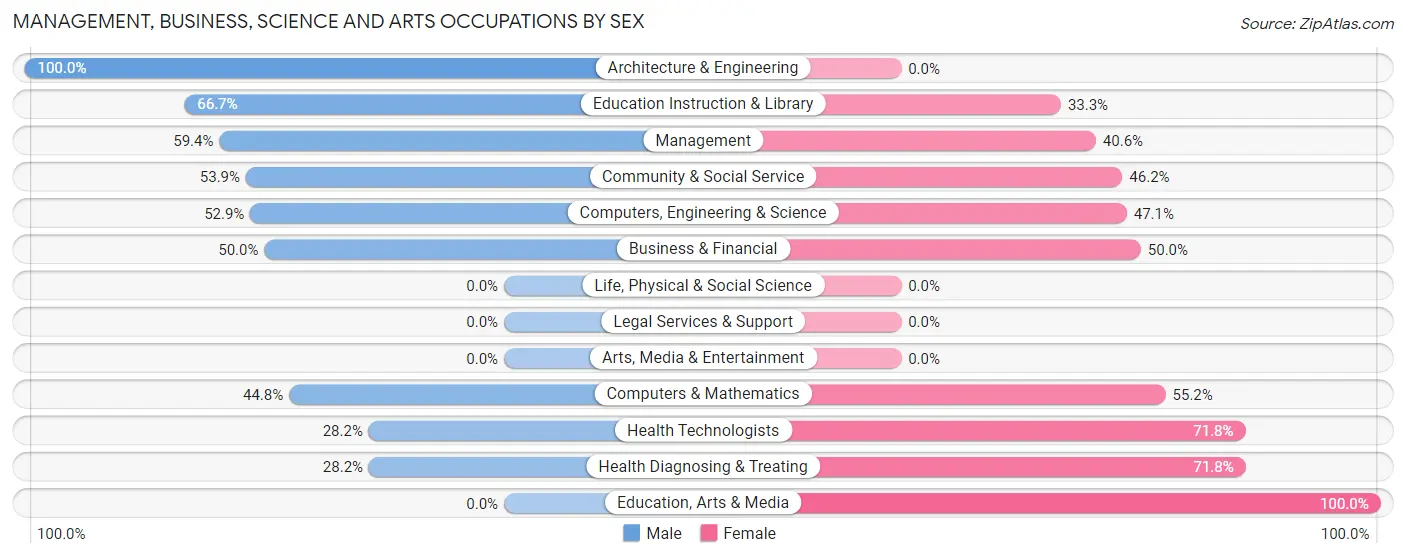
Management, Business, Science and Arts Occupations by Sex
Within the Management, Business, Science and Arts occupations in Polo, the most male-oriented occupations are Architecture & Engineering (100.0%), Education Instruction & Library (66.7%), and Management (59.4%), while the most female-oriented occupations are Education, Arts & Media (100.0%), Health Diagnosing & Treating (71.8%), and Health Technologists (71.8%).
| Occupation | Male | Female |
| Management | 76 (59.4%) | 52 (40.6%) |
| Business & Financial | 3 (50.0%) | 3 (50.0%) |
| Computers, Engineering & Science | 18 (52.9%) | 16 (47.1%) |
| Computers & Mathematics | 13 (44.8%) | 16 (55.2%) |
| Architecture & Engineering | 5 (100.0%) | 0 (0.0%) |
| Life, Physical & Social Science | 0 (0.0%) | 0 (0.0%) |
| Community & Social Service | 14 (53.8%) | 12 (46.2%) |
| Education, Arts & Media | 0 (0.0%) | 5 (100.0%) |
| Legal Services & Support | 0 (0.0%) | 0 (0.0%) |
| Education Instruction & Library | 14 (66.7%) | 7 (33.3%) |
| Arts, Media & Entertainment | 0 (0.0%) | 0 (0.0%) |
| Health Diagnosing & Treating | 20 (28.2%) | 51 (71.8%) |
| Health Technologists | 11 (28.2%) | 28 (71.8%) |
| Total (Category) | 131 (49.4%) | 134 (50.6%) |
| Total (Overall) | 618 (53.6%) | 534 (46.4%) |
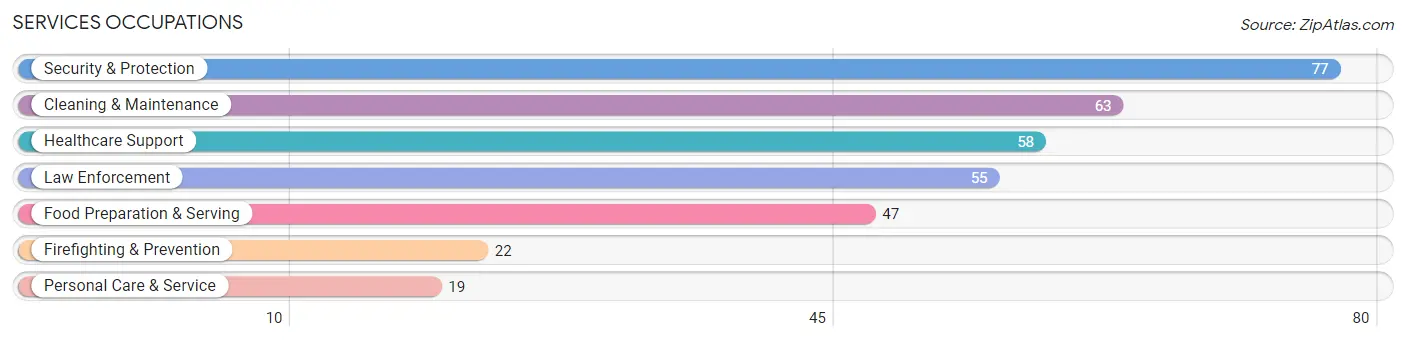
Services Occupations
The most common Services occupations in Polo are Security & Protection (77 | 6.7%), Cleaning & Maintenance (63 | 5.5%), Healthcare Support (58 | 5.0%), Law Enforcement (55 | 4.8%), and Food Preparation & Serving (47 | 4.1%).
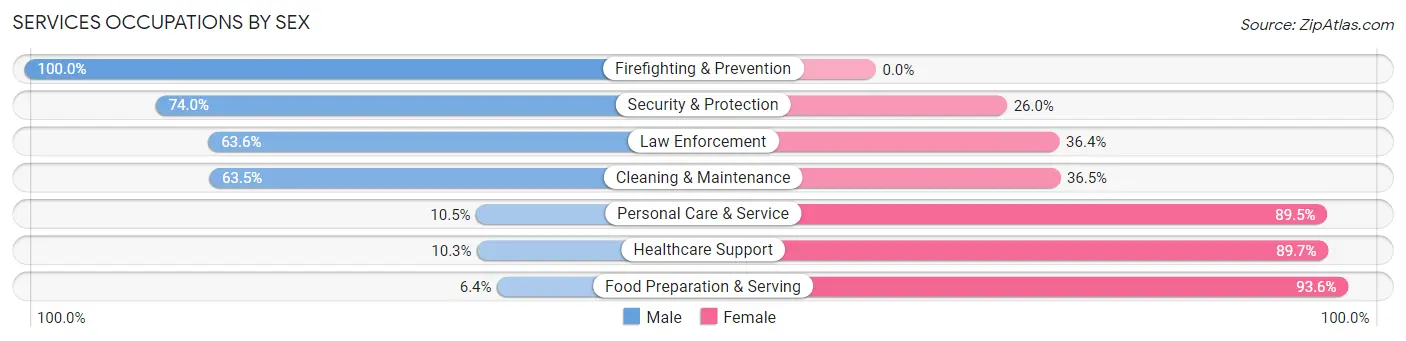
Services Occupations by Sex
Within the Services occupations in Polo, the most male-oriented occupations are Firefighting & Prevention (100.0%), Security & Protection (74.0%), and Law Enforcement (63.6%), while the most female-oriented occupations are Food Preparation & Serving (93.6%), Healthcare Support (89.7%), and Personal Care & Service (89.5%).
| Occupation | Male | Female |
| Healthcare Support | 6 (10.3%) | 52 (89.7%) |
| Security & Protection | 57 (74.0%) | 20 (26.0%) |
| Firefighting & Prevention | 22 (100.0%) | 0 (0.0%) |
| Law Enforcement | 35 (63.6%) | 20 (36.4%) |
| Food Preparation & Serving | 3 (6.4%) | 44 (93.6%) |
| Cleaning & Maintenance | 40 (63.5%) | 23 (36.5%) |
| Personal Care & Service | 2 (10.5%) | 17 (89.5%) |
| Total (Category) | 108 (40.9%) | 156 (59.1%) |
| Total (Overall) | 618 (53.6%) | 534 (46.4%) |
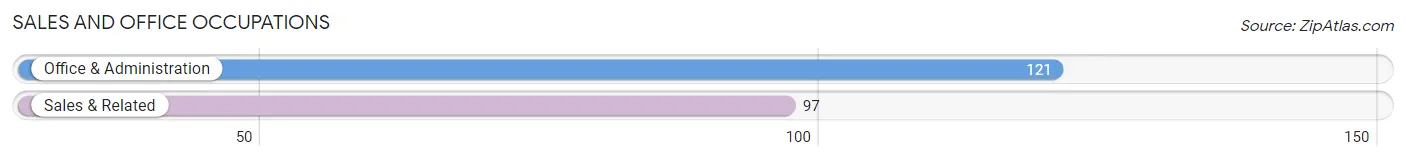
Sales and Office Occupations
The most common Sales and Office occupations in Polo are Office & Administration (121 | 10.5%), and Sales & Related (97 | 8.4%).
Sales and Office Occupations by Sex
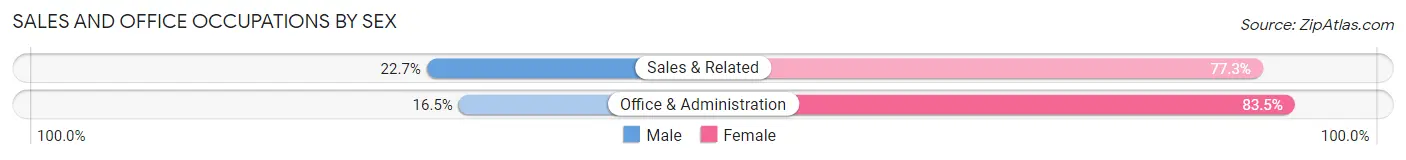
| Occupation | Male | Female |
| Sales & Related | 22 (22.7%) | 75 (77.3%) |
| Office & Administration | 20 (16.5%) | 101 (83.5%) |
| Total (Category) | 42 (19.3%) | 176 (80.7%) |
| Total (Overall) | 618 (53.6%) | 534 (46.4%) |
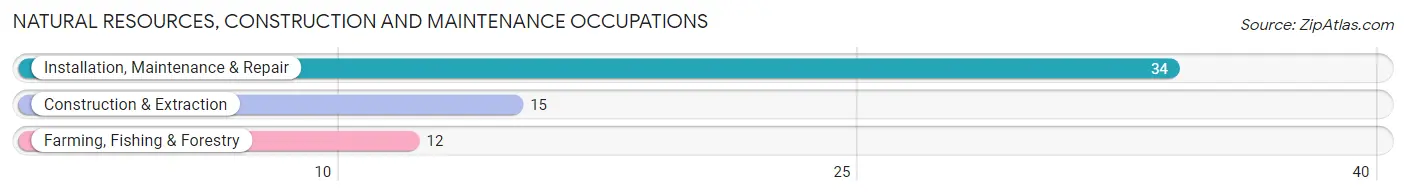
Natural Resources, Construction and Maintenance Occupations
The most common Natural Resources, Construction and Maintenance occupations in Polo are Installation, Maintenance & Repair (34 | 2.9%), Construction & Extraction (15 | 1.3%), and Farming, Fishing & Forestry (12 | 1.0%).
Natural Resources, Construction and Maintenance Occupations by Sex
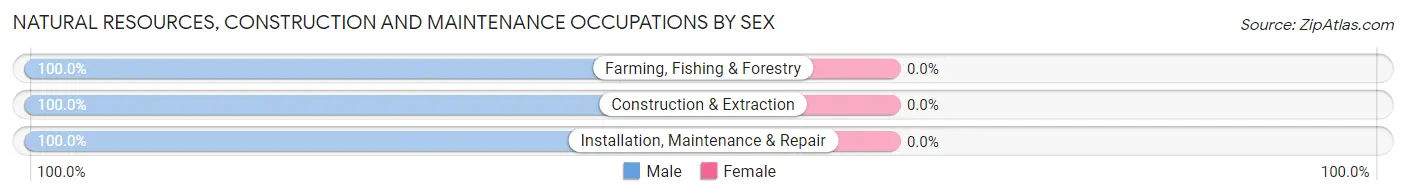
| Occupation | Male | Female |
| Farming, Fishing & Forestry | 12 (100.0%) | 0 (0.0%) |
| Construction & Extraction | 15 (100.0%) | 0 (0.0%) |
| Installation, Maintenance & Repair | 34 (100.0%) | 0 (0.0%) |
| Total (Category) | 61 (100.0%) | 0 (0.0%) |
| Total (Overall) | 618 (53.6%) | 534 (46.4%) |
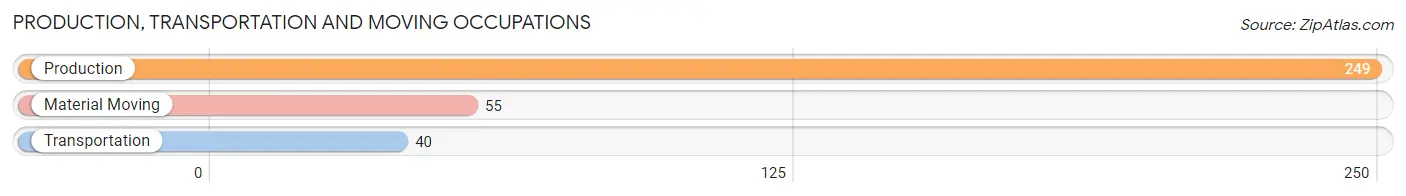
Production, Transportation and Moving Occupations
The most common Production, Transportation and Moving occupations in Polo are Production (249 | 21.6%), Material Moving (55 | 4.8%), and Transportation (40 | 3.5%).
Production, Transportation and Moving Occupations by Sex
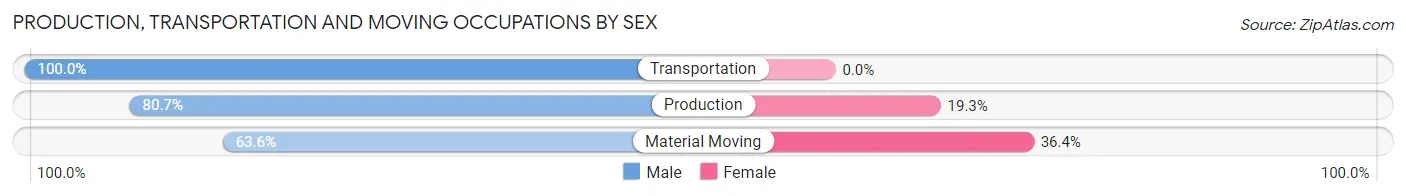
| Occupation | Male | Female |
| Production | 201 (80.7%) | 48 (19.3%) |
| Transportation | 40 (100.0%) | 0 (0.0%) |
| Material Moving | 35 (63.6%) | 20 (36.4%) |
| Total (Category) | 276 (80.2%) | 68 (19.8%) |
| Total (Overall) | 618 (53.6%) | 534 (46.4%) |
Employment Industries by Sex in Polo
Employment Industries in Polo
The major employment industries in Polo include Manufacturing (317 | 27.5%), Health Care & Social Assistance (145 | 12.6%), Retail Trade (123 | 10.7%), Accommodation & Food Services (73 | 6.3%), and Public Administration (71 | 6.2%).

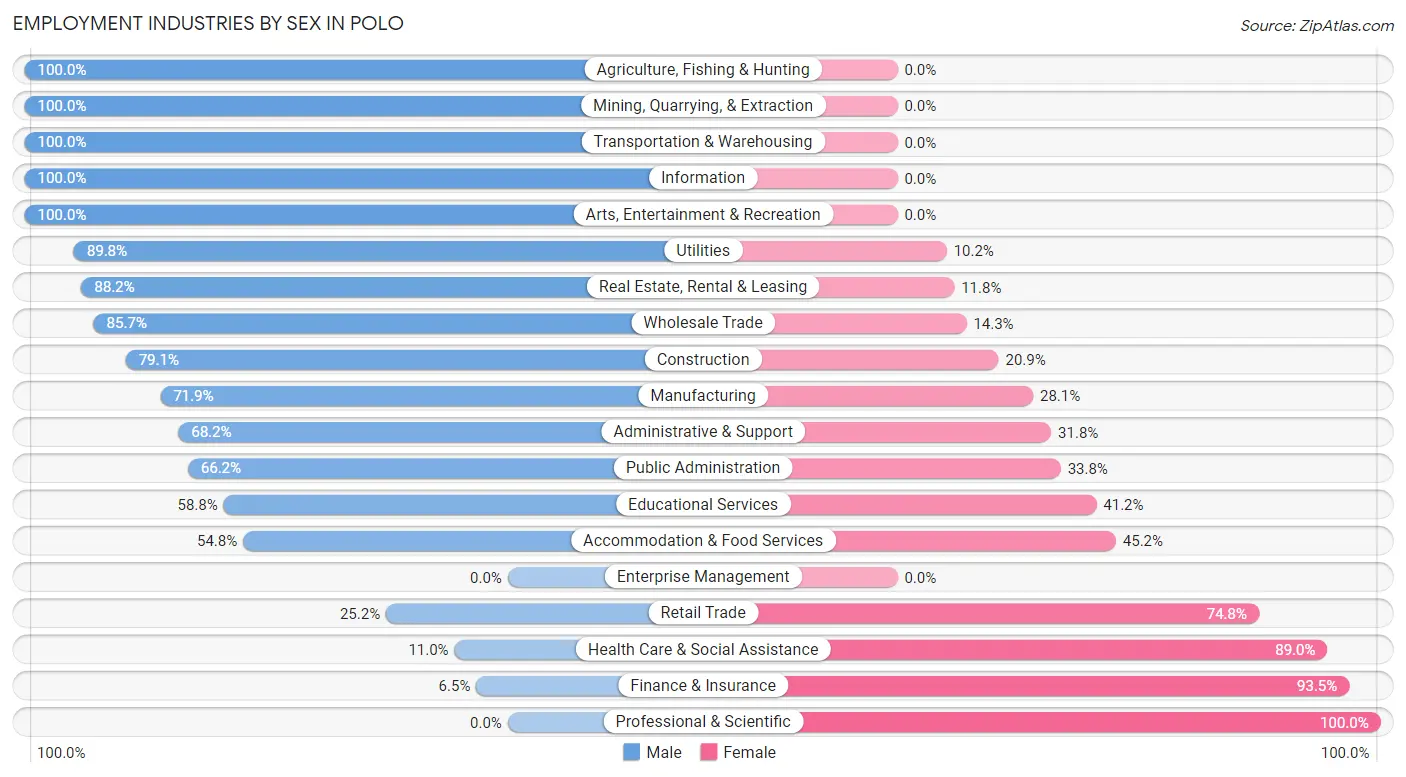
Employment Industries by Sex in Polo
The Polo industries that see more men than women are Agriculture, Fishing & Hunting (100.0%), Mining, Quarrying, & Extraction (100.0%), and Transportation & Warehousing (100.0%), whereas the industries that tend to have a higher number of women are Professional & Scientific (100.0%), Finance & Insurance (93.5%), and Health Care & Social Assistance (89.0%).
| Industry | Male | Female |
| Agriculture, Fishing & Hunting | 16 (100.0%) | 0 (0.0%) |
| Mining, Quarrying, & Extraction | 4 (100.0%) | 0 (0.0%) |
| Construction | 34 (79.1%) | 9 (20.9%) |
| Manufacturing | 228 (71.9%) | 89 (28.1%) |
| Wholesale Trade | 18 (85.7%) | 3 (14.3%) |
| Retail Trade | 31 (25.2%) | 92 (74.8%) |
| Transportation & Warehousing | 39 (100.0%) | 0 (0.0%) |
| Utilities | 44 (89.8%) | 5 (10.2%) |
| Information | 5 (100.0%) | 0 (0.0%) |
| Finance & Insurance | 3 (6.5%) | 43 (93.5%) |
| Real Estate, Rental & Leasing | 30 (88.2%) | 4 (11.8%) |
| Professional & Scientific | 0 (0.0%) | 33 (100.0%) |
| Enterprise Management | 0 (0.0%) | 0 (0.0%) |
| Administrative & Support | 30 (68.2%) | 14 (31.8%) |
| Educational Services | 20 (58.8%) | 14 (41.2%) |
| Health Care & Social Assistance | 16 (11.0%) | 129 (89.0%) |
| Arts, Entertainment & Recreation | 2 (100.0%) | 0 (0.0%) |
| Accommodation & Food Services | 40 (54.8%) | 33 (45.2%) |
| Public Administration | 47 (66.2%) | 24 (33.8%) |
| Total | 618 (53.6%) | 534 (46.4%) |
Education in Polo
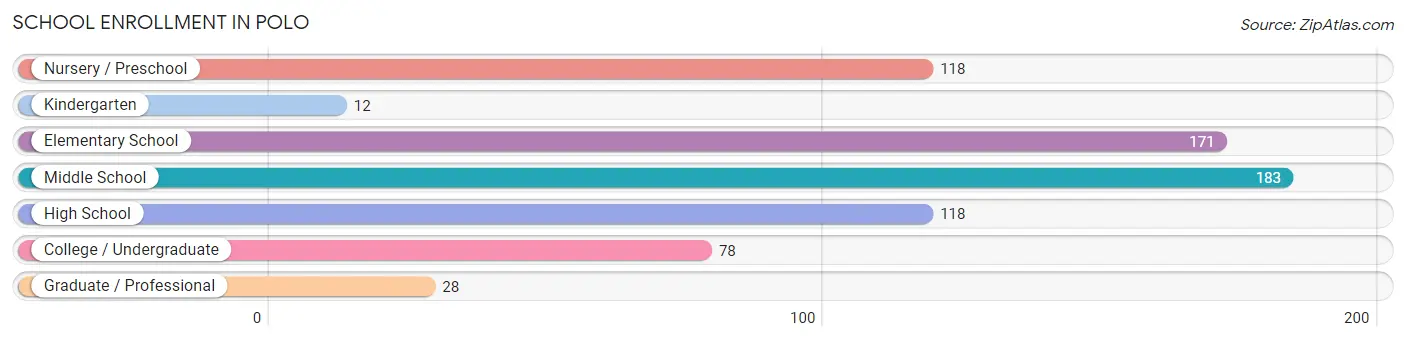
School Enrollment in Polo
The most common levels of schooling among the 708 students in Polo are middle school (183 | 25.9%), elementary school (171 | 24.1%), and nursery / preschool (118 | 16.7%).
| School Level | # Students | % Students |
| Nursery / Preschool | 118 | 16.7% |
| Kindergarten | 12 | 1.7% |
| Elementary School | 171 | 24.1% |
| Middle School | 183 | 25.9% |
| High School | 118 | 16.7% |
| College / Undergraduate | 78 | 11.0% |
| Graduate / Professional | 28 | 4.0% |
| Total | 708 | 100.0% |
School Enrollment by Age by Funding Source in Polo
Out of a total of 708 students who are enrolled in schools in Polo, 105 (14.8%) attend a private institution, while the remaining 603 (85.2%) are enrolled in public schools. The age group of 25 to 34 year olds has the highest likelihood of being enrolled in private schools, with 55 (96.5% in the age bracket) enrolled. Conversely, the age group of 3 to 4 year olds has the lowest likelihood of being enrolled in a private school, with 55 (100.0% in the age bracket) attending a public institution.
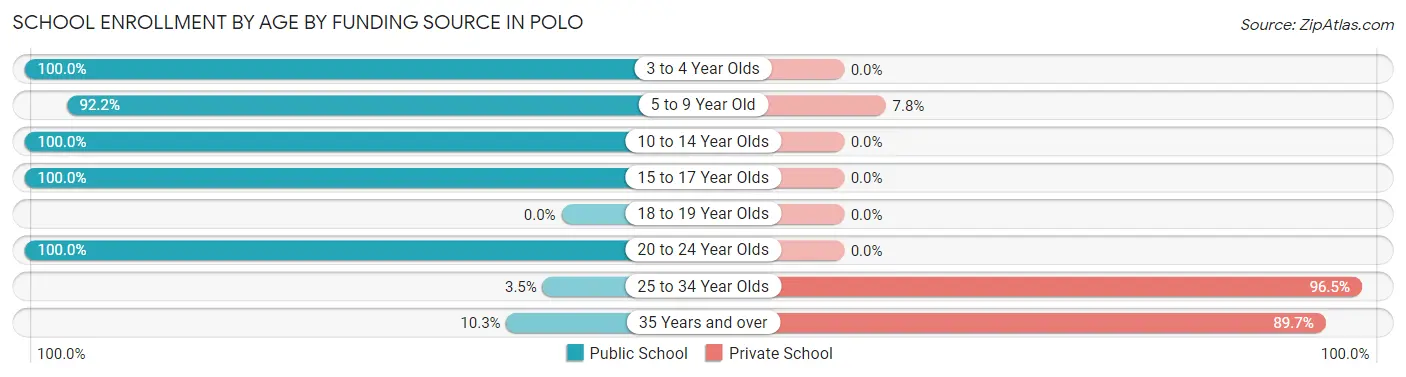
| Age Bracket | Public School | Private School |
| 3 to 4 Year Olds | 55 (100.0%) | 0 (0.0%) |
| 5 to 9 Year Old | 177 (92.2%) | 15 (7.8%) |
| 10 to 14 Year Olds | 268 (100.0%) | 0 (0.0%) |
| 15 to 17 Year Olds | 82 (100.0%) | 0 (0.0%) |
| 18 to 19 Year Olds | 0 (0.0%) | 0 (0.0%) |
| 20 to 24 Year Olds | 15 (100.0%) | 0 (0.0%) |
| 25 to 34 Year Olds | 2 (3.5%) | 55 (96.5%) |
| 35 Years and over | 4 (10.3%) | 35 (89.7%) |
| Total | 603 (85.2%) | 105 (14.8%) |
Educational Attainment by Field of Study in Polo
Arts & humanities (46 | 19.0%), science & technology (43 | 17.8%), education (36 | 14.9%), business (24 | 9.9%), and multidisciplinary studies (18 | 7.4%) are the most common fields of study among 242 individuals in Polo who have obtained a bachelor's degree or higher.
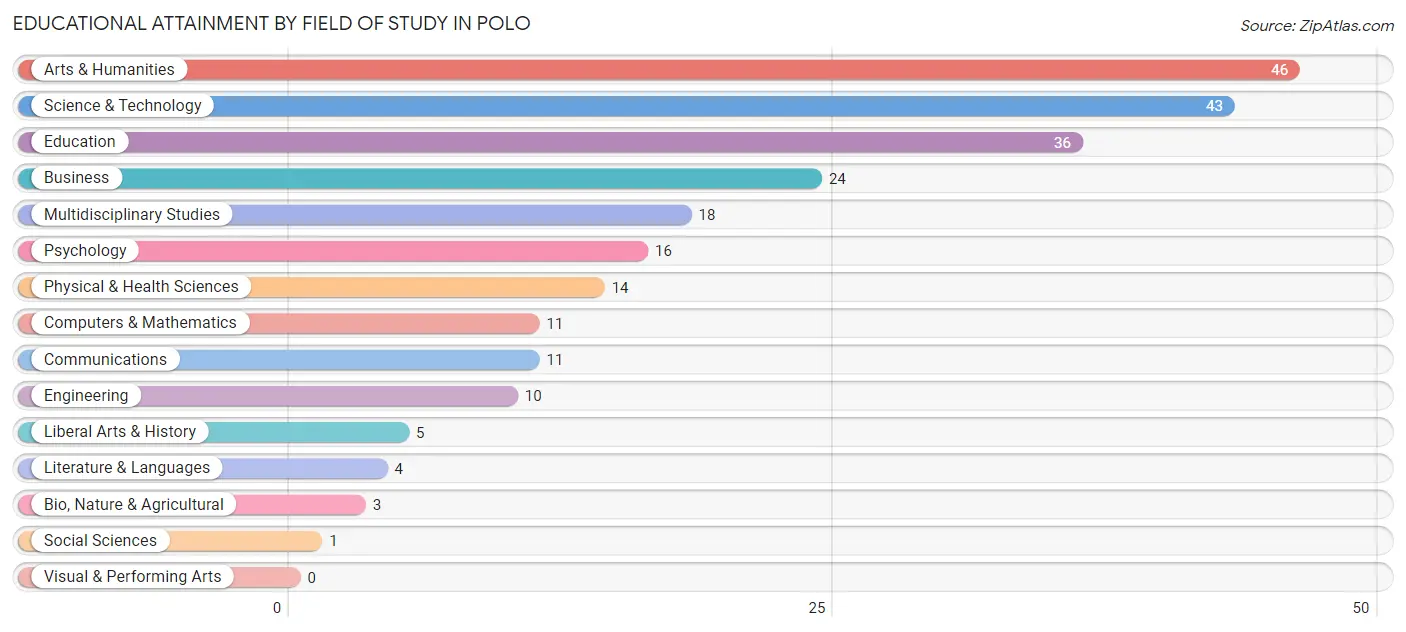
| Field of Study | # Graduates | % Graduates |
| Computers & Mathematics | 11 | 4.5% |
| Bio, Nature & Agricultural | 3 | 1.2% |
| Physical & Health Sciences | 14 | 5.8% |
| Psychology | 16 | 6.6% |
| Social Sciences | 1 | 0.4% |
| Engineering | 10 | 4.1% |
| Multidisciplinary Studies | 18 | 7.4% |
| Science & Technology | 43 | 17.8% |
| Business | 24 | 9.9% |
| Education | 36 | 14.9% |
| Literature & Languages | 4 | 1.7% |
| Liberal Arts & History | 5 | 2.1% |
| Visual & Performing Arts | 0 | 0.0% |
| Communications | 11 | 4.5% |
| Arts & Humanities | 46 | 19.0% |
| Total | 242 | 100.0% |
Transportation & Commute in Polo
Vehicle Availability by Sex in Polo
The most prevalent vehicle ownership categories in Polo are males with 2 vehicles (359, accounting for 58.7%) and females with 2 vehicles (261, making up 67.2%).
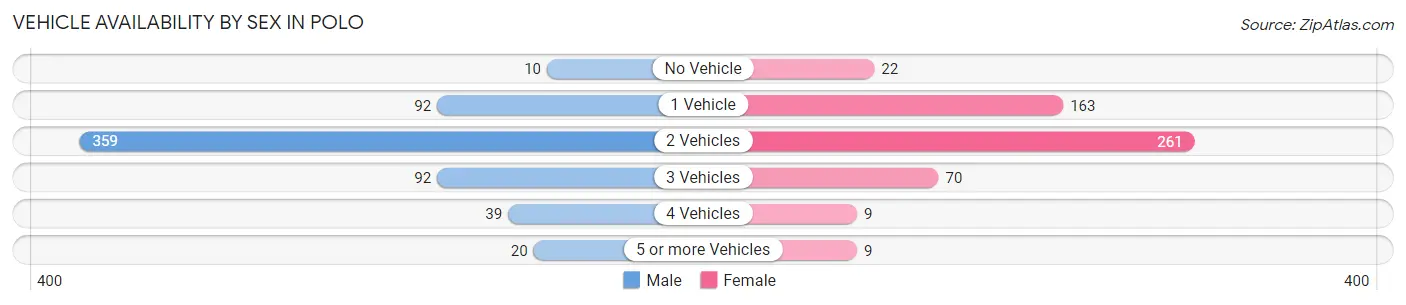
| Vehicles Available | Male | Female |
| No Vehicle | 10 (1.6%) | 22 (4.1%) |
| 1 Vehicle | 92 (15.0%) | 163 (30.5%) |
| 2 Vehicles | 359 (58.7%) | 261 (48.9%) |
| 3 Vehicles | 92 (15.0%) | 70 (13.1%) |
| 4 Vehicles | 39 (6.4%) | 9 (1.7%) |
| 5 or more Vehicles | 20 (3.3%) | 9 (1.7%) |
| Total | 612 (100.0%) | 534 (100.0%) |
Commute Time in Polo
The most frequently occuring commute durations in Polo are 25 to 29 minutes (210 commuters, 19.9%), 20 to 24 minutes (178 commuters, 16.8%), and 5 to 9 minutes (166 commuters, 15.7%).
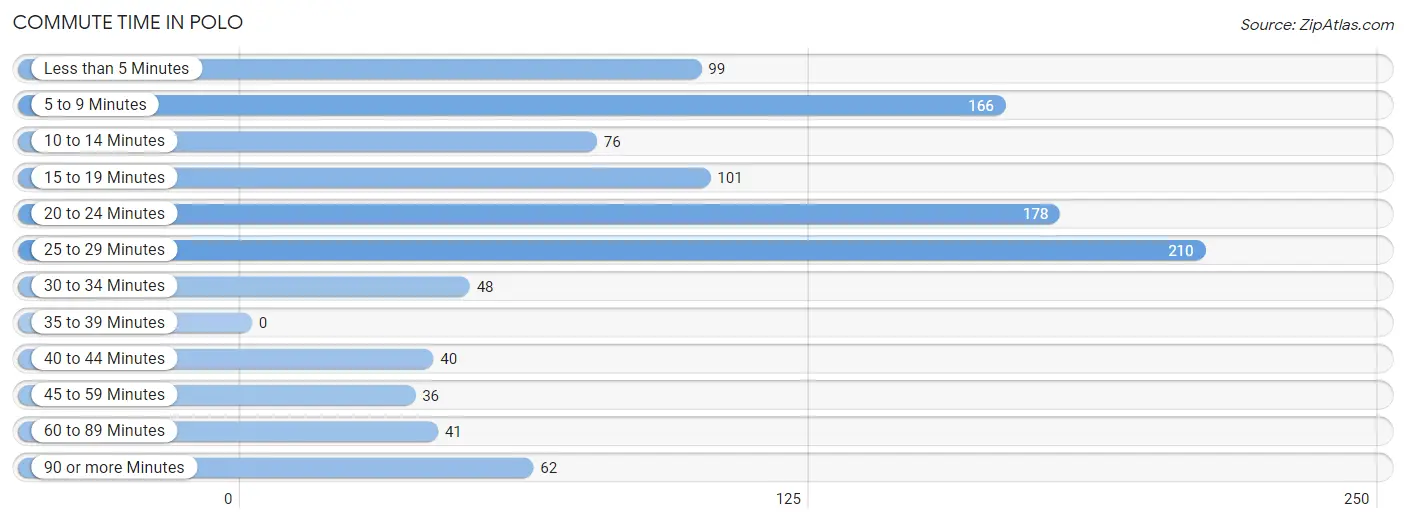
| Commute Time | # Commuters | % Commuters |
| Less than 5 Minutes | 99 | 9.4% |
| 5 to 9 Minutes | 166 | 15.7% |
| 10 to 14 Minutes | 76 | 7.2% |
| 15 to 19 Minutes | 101 | 9.6% |
| 20 to 24 Minutes | 178 | 16.8% |
| 25 to 29 Minutes | 210 | 19.9% |
| 30 to 34 Minutes | 48 | 4.5% |
| 35 to 39 Minutes | 0 | 0.0% |
| 40 to 44 Minutes | 40 | 3.8% |
| 45 to 59 Minutes | 36 | 3.4% |
| 60 to 89 Minutes | 41 | 3.9% |
| 90 or more Minutes | 62 | 5.9% |
Commute Time by Sex in Polo
The most common commute times in Polo are 5 to 9 minutes (131 commuters, 21.9%) for males and 25 to 29 minutes (143 commuters, 31.1%) for females.
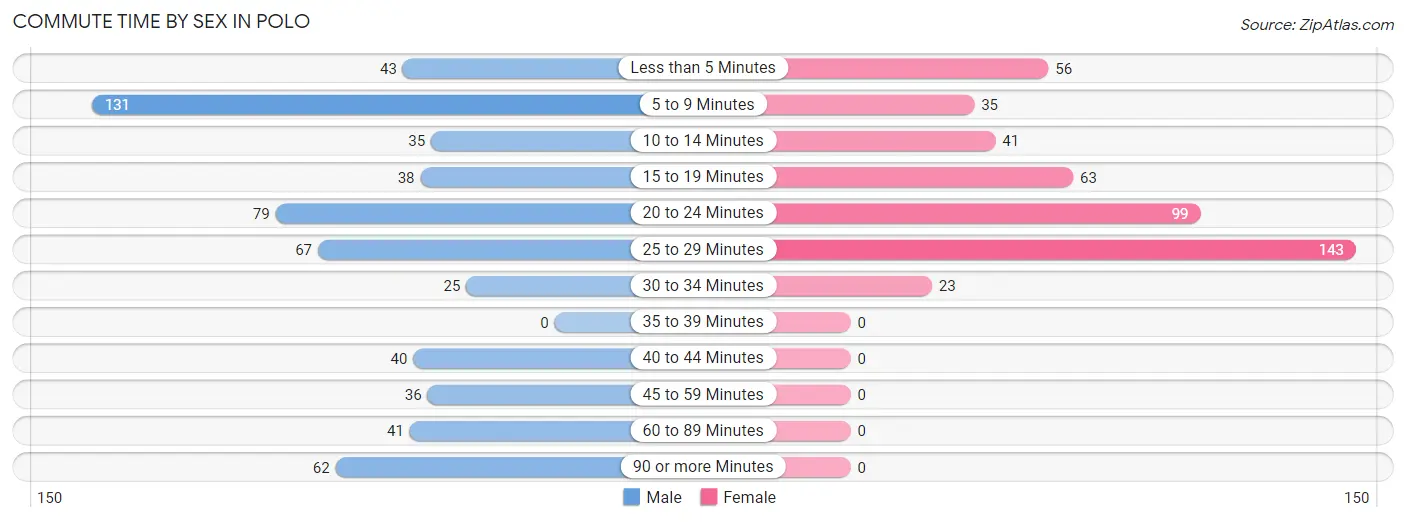
| Commute Time | Male | Female |
| Less than 5 Minutes | 43 (7.2%) | 56 (12.2%) |
| 5 to 9 Minutes | 131 (21.9%) | 35 (7.6%) |
| 10 to 14 Minutes | 35 (5.9%) | 41 (8.9%) |
| 15 to 19 Minutes | 38 (6.4%) | 63 (13.7%) |
| 20 to 24 Minutes | 79 (13.2%) | 99 (21.5%) |
| 25 to 29 Minutes | 67 (11.2%) | 143 (31.1%) |
| 30 to 34 Minutes | 25 (4.2%) | 23 (5.0%) |
| 35 to 39 Minutes | 0 (0.0%) | 0 (0.0%) |
| 40 to 44 Minutes | 40 (6.7%) | 0 (0.0%) |
| 45 to 59 Minutes | 36 (6.0%) | 0 (0.0%) |
| 60 to 89 Minutes | 41 (6.9%) | 0 (0.0%) |
| 90 or more Minutes | 62 (10.4%) | 0 (0.0%) |
Time of Departure to Work by Sex in Polo
The most frequent times of departure to work in Polo are 12:00 PM to 3:59 PM (124, 20.8%) for males and 6:30 AM to 6:59 AM (81, 17.6%) for females.
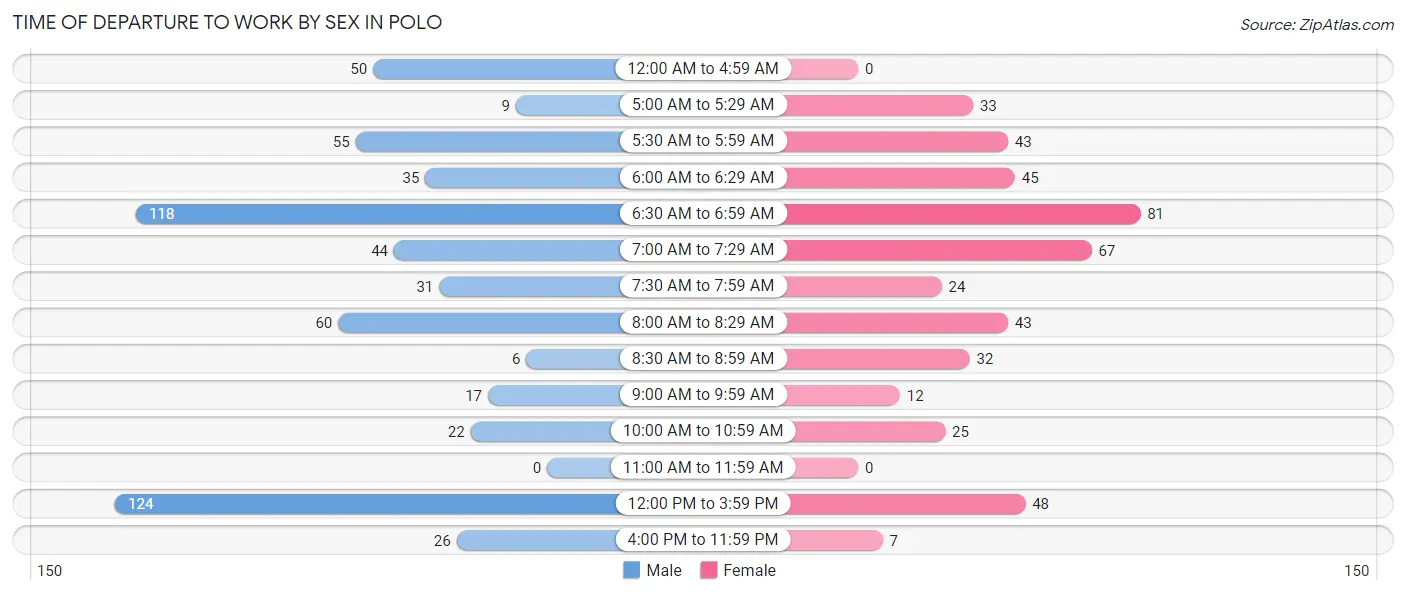
| Time of Departure | Male | Female |
| 12:00 AM to 4:59 AM | 50 (8.4%) | 0 (0.0%) |
| 5:00 AM to 5:29 AM | 9 (1.5%) | 33 (7.2%) |
| 5:30 AM to 5:59 AM | 55 (9.2%) | 43 (9.3%) |
| 6:00 AM to 6:29 AM | 35 (5.9%) | 45 (9.8%) |
| 6:30 AM to 6:59 AM | 118 (19.8%) | 81 (17.6%) |
| 7:00 AM to 7:29 AM | 44 (7.4%) | 67 (14.6%) |
| 7:30 AM to 7:59 AM | 31 (5.2%) | 24 (5.2%) |
| 8:00 AM to 8:29 AM | 60 (10.1%) | 43 (9.3%) |
| 8:30 AM to 8:59 AM | 6 (1.0%) | 32 (7.0%) |
| 9:00 AM to 9:59 AM | 17 (2.9%) | 12 (2.6%) |
| 10:00 AM to 10:59 AM | 22 (3.7%) | 25 (5.4%) |
| 11:00 AM to 11:59 AM | 0 (0.0%) | 0 (0.0%) |
| 12:00 PM to 3:59 PM | 124 (20.8%) | 48 (10.4%) |
| 4:00 PM to 11:59 PM | 26 (4.4%) | 7 (1.5%) |
| Total | 597 (100.0%) | 460 (100.0%) |
Housing Occupancy in Polo
Occupancy by Ownership in Polo
Of the total 978 dwellings in Polo, owner-occupied units account for 590 (60.3%), while renter-occupied units make up 388 (39.7%).
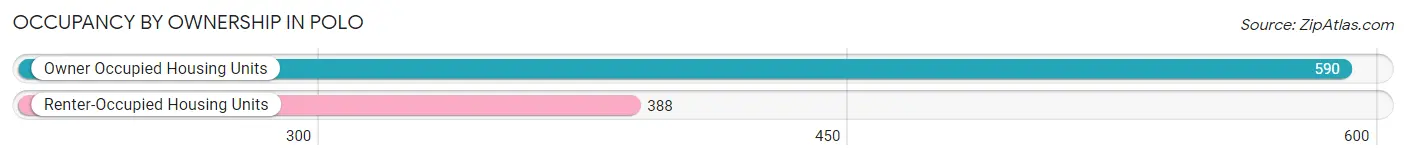
| Occupancy | # Housing Units | % Housing Units |
| Owner Occupied Housing Units | 590 | 60.3% |
| Renter-Occupied Housing Units | 388 | 39.7% |
| Total Occupied Housing Units | 978 | 100.0% |
Occupancy by Household Size in Polo
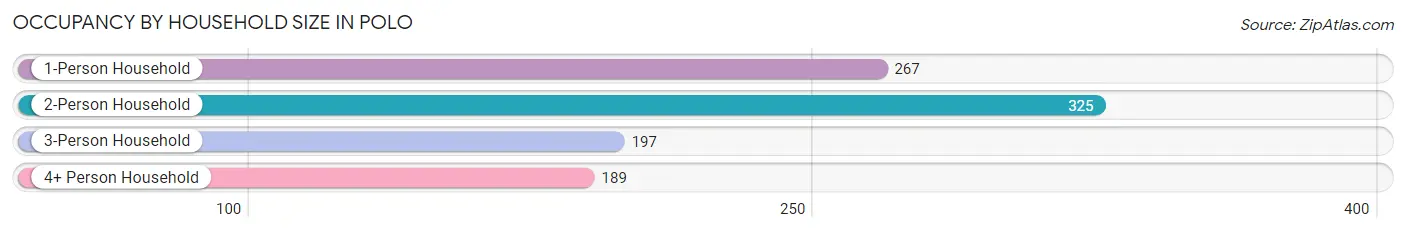
| Household Size | # Housing Units | % Housing Units |
| 1-Person Household | 267 | 27.3% |
| 2-Person Household | 325 | 33.2% |
| 3-Person Household | 197 | 20.1% |
| 4+ Person Household | 189 | 19.3% |
| Total Housing Units | 978 | 100.0% |
Occupancy by Ownership by Household Size in Polo
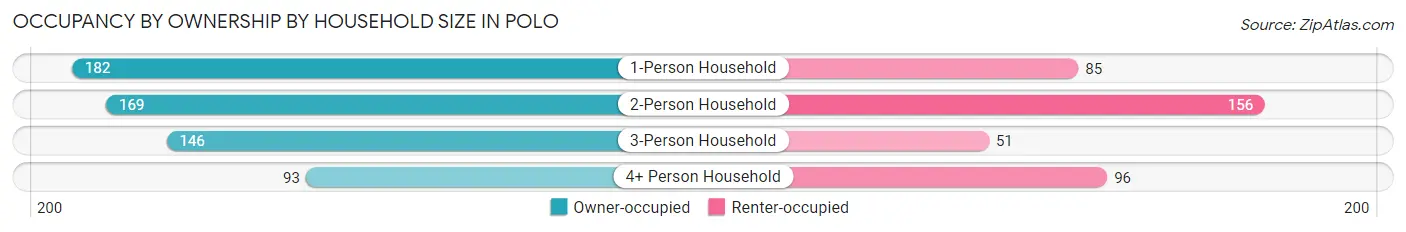
| Household Size | Owner-occupied | Renter-occupied |
| 1-Person Household | 182 (68.2%) | 85 (31.8%) |
| 2-Person Household | 169 (52.0%) | 156 (48.0%) |
| 3-Person Household | 146 (74.1%) | 51 (25.9%) |
| 4+ Person Household | 93 (49.2%) | 96 (50.8%) |
| Total Housing Units | 590 (60.3%) | 388 (39.7%) |
Occupancy by Educational Attainment in Polo
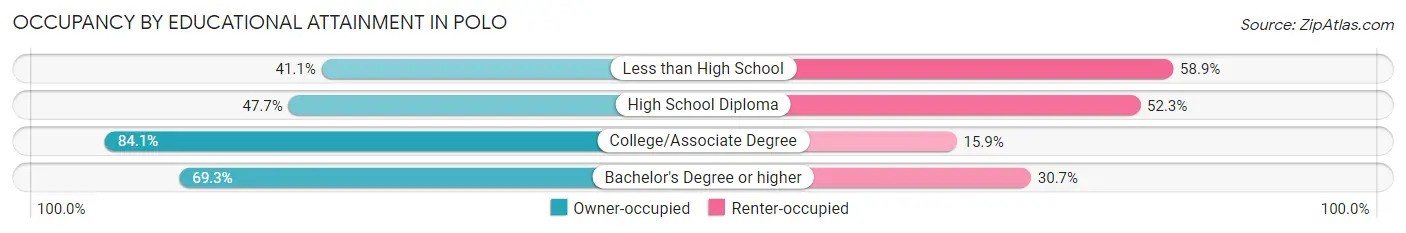
| Household Size | Owner-occupied | Renter-occupied |
| Less than High School | 44 (41.1%) | 63 (58.9%) |
| High School Diploma | 215 (47.7%) | 236 (52.3%) |
| College/Associate Degree | 227 (84.1%) | 43 (15.9%) |
| Bachelor's Degree or higher | 104 (69.3%) | 46 (30.7%) |
Occupancy by Age of Householder in Polo
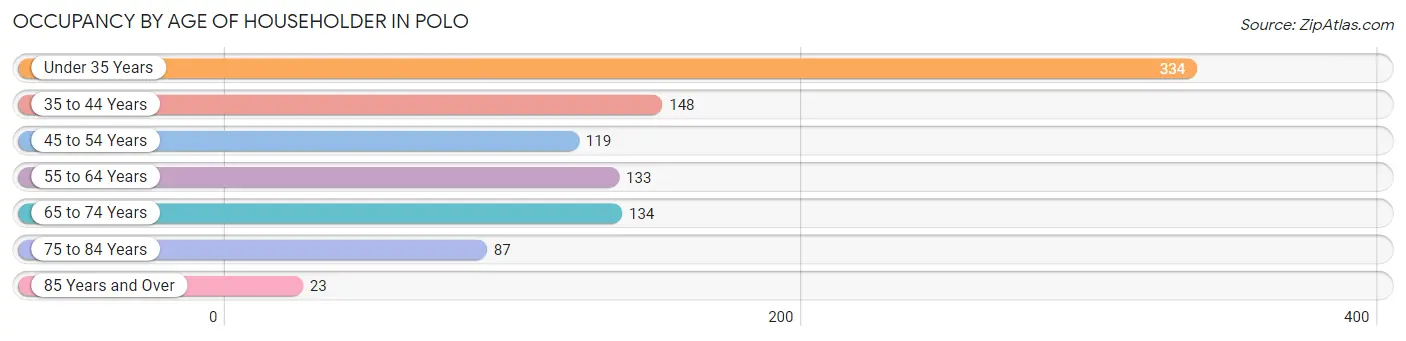
| Age Bracket | # Households | % Households |
| Under 35 Years | 334 | 34.2% |
| 35 to 44 Years | 148 | 15.1% |
| 45 to 54 Years | 119 | 12.2% |
| 55 to 64 Years | 133 | 13.6% |
| 65 to 74 Years | 134 | 13.7% |
| 75 to 84 Years | 87 | 8.9% |
| 85 Years and Over | 23 | 2.4% |
| Total | 978 | 100.0% |
Housing Finances in Polo
Median Income by Occupancy in Polo
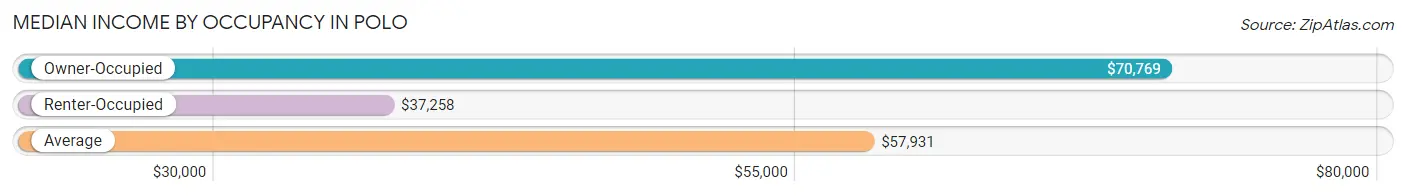
| Occupancy Type | # Households | Median Income |
| Owner-Occupied | 590 (60.3%) | $70,769 |
| Renter-Occupied | 388 (39.7%) | $37,258 |
| Average | 978 (100.0%) | $57,931 |
Occupancy by Householder Income Bracket in Polo
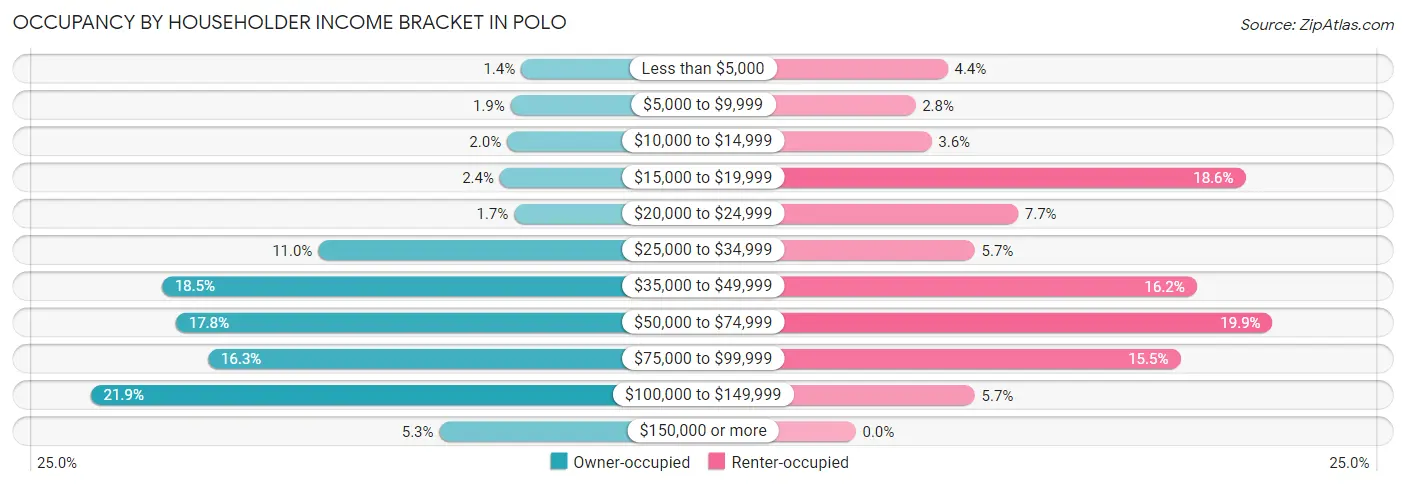
| Income Bracket | Owner-occupied | Renter-occupied |
| Less than $5,000 | 8 (1.4%) | 17 (4.4%) |
| $5,000 to $9,999 | 11 (1.9%) | 11 (2.8%) |
| $10,000 to $14,999 | 12 (2.0%) | 14 (3.6%) |
| $15,000 to $19,999 | 14 (2.4%) | 72 (18.6%) |
| $20,000 to $24,999 | 10 (1.7%) | 30 (7.7%) |
| $25,000 to $34,999 | 65 (11.0%) | 22 (5.7%) |
| $35,000 to $49,999 | 109 (18.5%) | 63 (16.2%) |
| $50,000 to $74,999 | 105 (17.8%) | 77 (19.9%) |
| $75,000 to $99,999 | 96 (16.3%) | 60 (15.5%) |
| $100,000 to $149,999 | 129 (21.9%) | 22 (5.7%) |
| $150,000 or more | 31 (5.2%) | 0 (0.0%) |
| Total | 590 (100.0%) | 388 (100.0%) |
Monthly Housing Cost Tiers in Polo
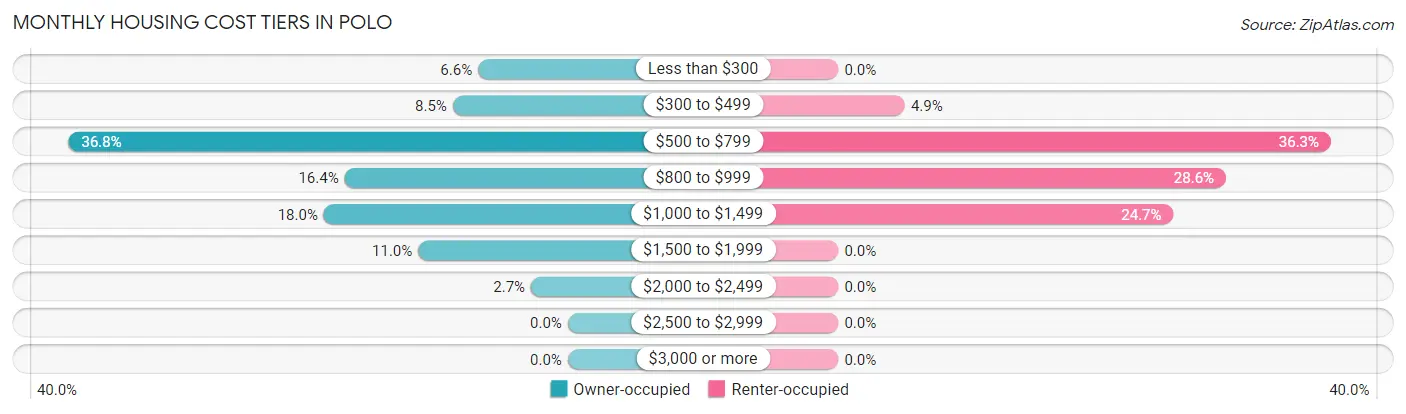
| Monthly Cost | Owner-occupied | Renter-occupied |
| Less than $300 | 39 (6.6%) | 0 (0.0%) |
| $300 to $499 | 50 (8.5%) | 19 (4.9%) |
| $500 to $799 | 217 (36.8%) | 141 (36.3%) |
| $800 to $999 | 97 (16.4%) | 111 (28.6%) |
| $1,000 to $1,499 | 106 (18.0%) | 96 (24.7%) |
| $1,500 to $1,999 | 65 (11.0%) | 0 (0.0%) |
| $2,000 to $2,499 | 16 (2.7%) | 0 (0.0%) |
| $2,500 to $2,999 | 0 (0.0%) | 0 (0.0%) |
| $3,000 or more | 0 (0.0%) | 0 (0.0%) |
| Total | 590 (100.0%) | 388 (100.0%) |
Physical Housing Characteristics in Polo
Housing Structures in Polo
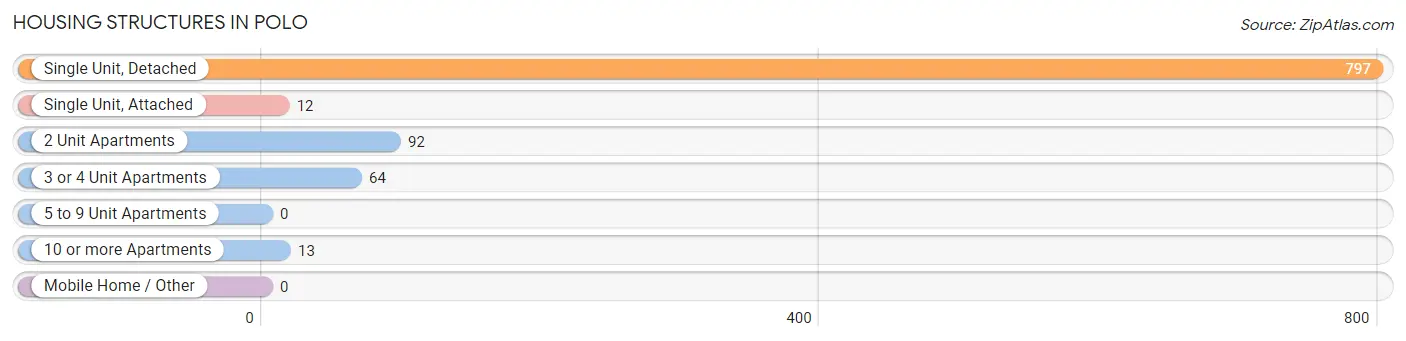
| Structure Type | # Housing Units | % Housing Units |
| Single Unit, Detached | 797 | 81.5% |
| Single Unit, Attached | 12 | 1.2% |
| 2 Unit Apartments | 92 | 9.4% |
| 3 or 4 Unit Apartments | 64 | 6.5% |
| 5 to 9 Unit Apartments | 0 | 0.0% |
| 10 or more Apartments | 13 | 1.3% |
| Mobile Home / Other | 0 | 0.0% |
| Total | 978 | 100.0% |
Housing Structures by Occupancy in Polo
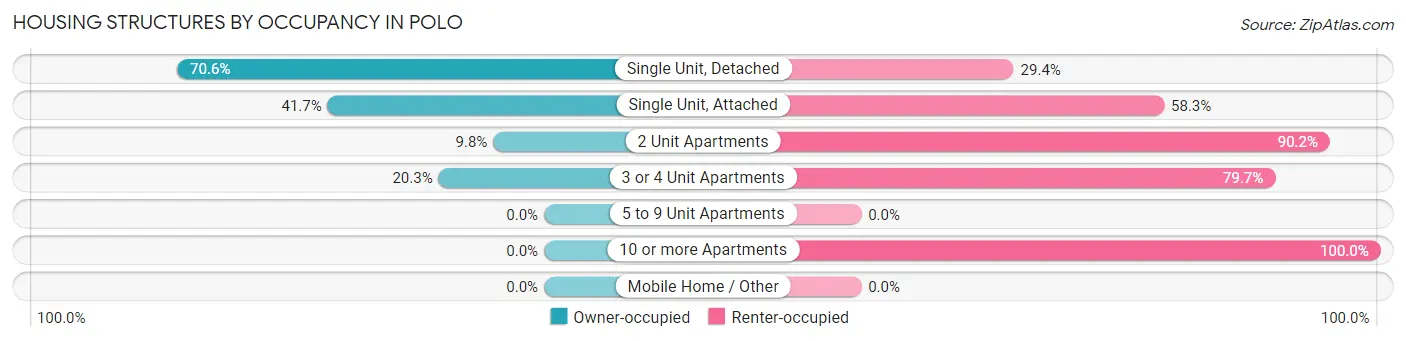
| Structure Type | Owner-occupied | Renter-occupied |
| Single Unit, Detached | 563 (70.6%) | 234 (29.4%) |
| Single Unit, Attached | 5 (41.7%) | 7 (58.3%) |
| 2 Unit Apartments | 9 (9.8%) | 83 (90.2%) |
| 3 or 4 Unit Apartments | 13 (20.3%) | 51 (79.7%) |
| 5 to 9 Unit Apartments | 0 (0.0%) | 0 (0.0%) |
| 10 or more Apartments | 0 (0.0%) | 13 (100.0%) |
| Mobile Home / Other | 0 (0.0%) | 0 (0.0%) |
| Total | 590 (60.3%) | 388 (39.7%) |
Housing Structures by Number of Rooms in Polo
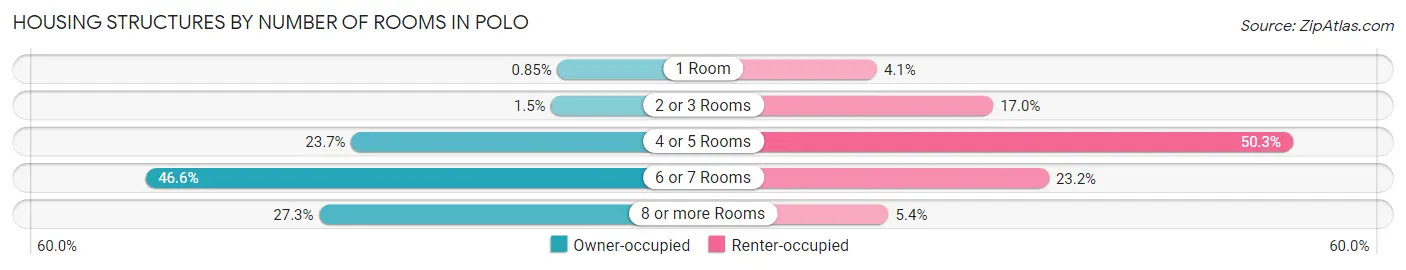
| Number of Rooms | Owner-occupied | Renter-occupied |
| 1 Room | 5 (0.9%) | 16 (4.1%) |
| 2 or 3 Rooms | 9 (1.5%) | 66 (17.0%) |
| 4 or 5 Rooms | 140 (23.7%) | 195 (50.3%) |
| 6 or 7 Rooms | 275 (46.6%) | 90 (23.2%) |
| 8 or more Rooms | 161 (27.3%) | 21 (5.4%) |
| Total | 590 (100.0%) | 388 (100.0%) |
Housing Structure by Heating Type in Polo
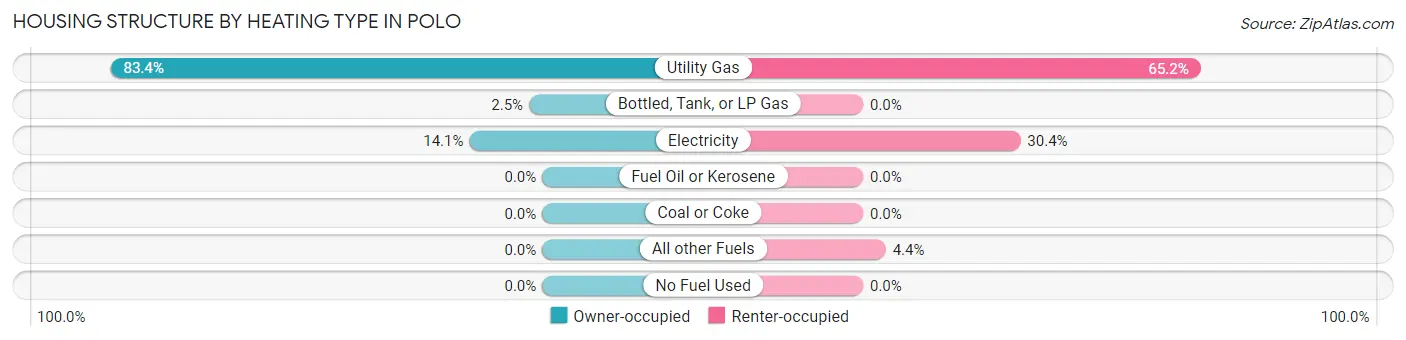
| Heating Type | Owner-occupied | Renter-occupied |
| Utility Gas | 492 (83.4%) | 253 (65.2%) |
| Bottled, Tank, or LP Gas | 15 (2.5%) | 0 (0.0%) |
| Electricity | 83 (14.1%) | 118 (30.4%) |
| Fuel Oil or Kerosene | 0 (0.0%) | 0 (0.0%) |
| Coal or Coke | 0 (0.0%) | 0 (0.0%) |
| All other Fuels | 0 (0.0%) | 17 (4.4%) |
| No Fuel Used | 0 (0.0%) | 0 (0.0%) |
| Total | 590 (100.0%) | 388 (100.0%) |
Household Vehicle Usage in Polo
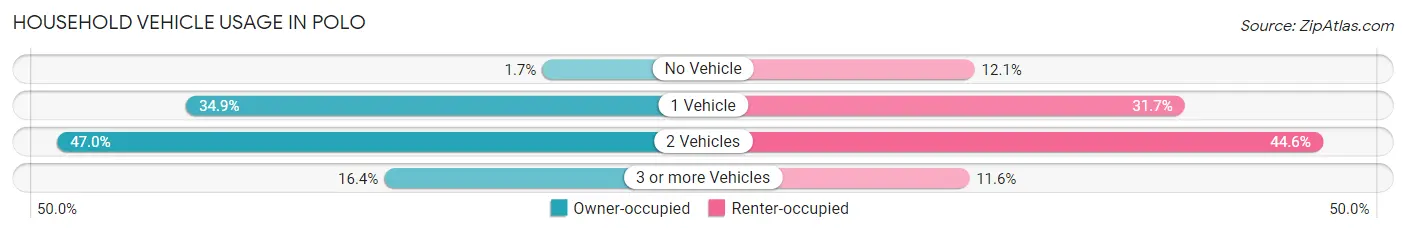
| Vehicles per Household | Owner-occupied | Renter-occupied |
| No Vehicle | 10 (1.7%) | 47 (12.1%) |
| 1 Vehicle | 206 (34.9%) | 123 (31.7%) |
| 2 Vehicles | 277 (46.9%) | 173 (44.6%) |
| 3 or more Vehicles | 97 (16.4%) | 45 (11.6%) |
| Total | 590 (100.0%) | 388 (100.0%) |
Real Estate & Mortgages in Polo
Real Estate and Mortgage Overview in Polo
| Characteristic | Without Mortgage | With Mortgage |
| Housing Units | 222 | 368 |
| Median Property Value | $111,000 | $103,100 |
| Median Household Income | $52,000 | $25 |
| Monthly Housing Costs | $567 | $0 |
| Real Estate Taxes | $2,773 | $0 |
Property Value by Mortgage Status in Polo

| Property Value | Without Mortgage | With Mortgage |
| Less than $50,000 | 19 (8.6%) | 18 (4.9%) |
| $50,000 to $99,999 | 62 (27.9%) | 157 (42.7%) |
| $100,000 to $299,999 | 141 (63.5%) | 182 (49.5%) |
| $300,000 to $499,999 | 0 (0.0%) | 11 (3.0%) |
| $500,000 to $749,999 | 0 (0.0%) | 0 (0.0%) |
| $750,000 to $999,999 | 0 (0.0%) | 0 (0.0%) |
| $1,000,000 or more | 0 (0.0%) | 0 (0.0%) |
| Total | 222 (100.0%) | 368 (100.0%) |
Household Income by Mortgage Status in Polo
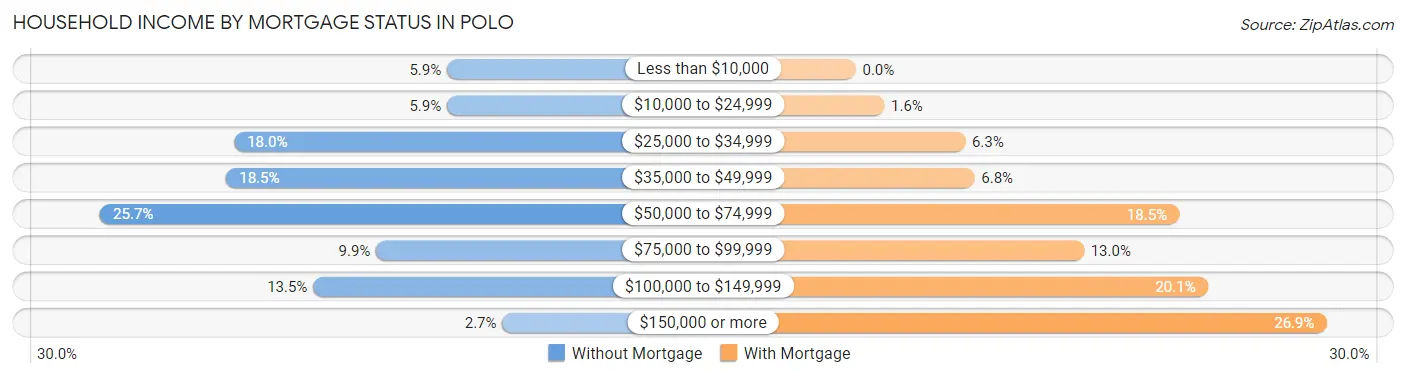
| Household Income | Without Mortgage | With Mortgage |
| Less than $10,000 | 13 (5.9%) | 0 (0.0%) |
| $10,000 to $24,999 | 13 (5.9%) | 6 (1.6%) |
| $25,000 to $34,999 | 40 (18.0%) | 23 (6.2%) |
| $35,000 to $49,999 | 41 (18.5%) | 25 (6.8%) |
| $50,000 to $74,999 | 57 (25.7%) | 68 (18.5%) |
| $75,000 to $99,999 | 22 (9.9%) | 48 (13.0%) |
| $100,000 to $149,999 | 30 (13.5%) | 74 (20.1%) |
| $150,000 or more | 6 (2.7%) | 99 (26.9%) |
| Total | 222 (100.0%) | 368 (100.0%) |
Property Value to Household Income Ratio in Polo
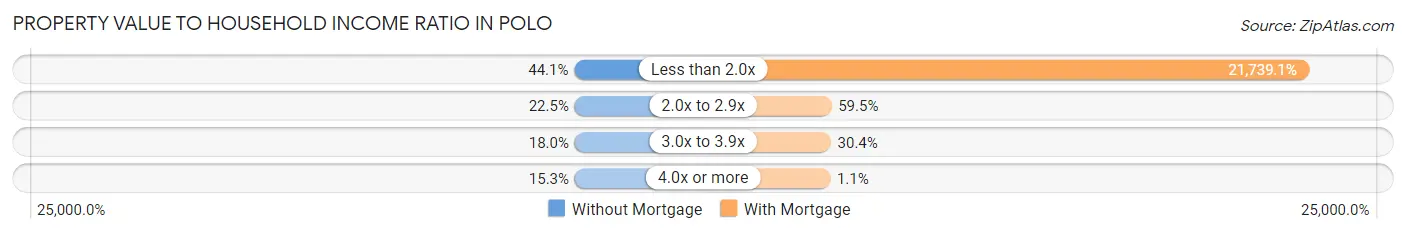
| Value-to-Income Ratio | Without Mortgage | With Mortgage |
| Less than 2.0x | 98 (44.1%) | 80,000 (21,739.1%) |
| 2.0x to 2.9x | 50 (22.5%) | 219 (59.5%) |
| 3.0x to 3.9x | 40 (18.0%) | 112 (30.4%) |
| 4.0x or more | 34 (15.3%) | 4 (1.1%) |
| Total | 222 (100.0%) | 368 (100.0%) |
Real Estate Taxes by Mortgage Status in Polo
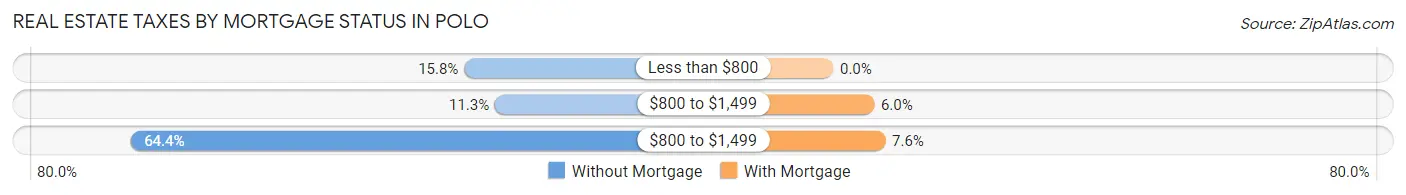
| Property Taxes | Without Mortgage | With Mortgage |
| Less than $800 | 35 (15.8%) | 0 (0.0%) |
| $800 to $1,499 | 25 (11.3%) | 22 (6.0%) |
| $800 to $1,499 | 143 (64.4%) | 28 (7.6%) |
| Total | 222 (100.0%) | 368 (100.0%) |
Health & Disability in Polo
Health Insurance Coverage by Age in Polo
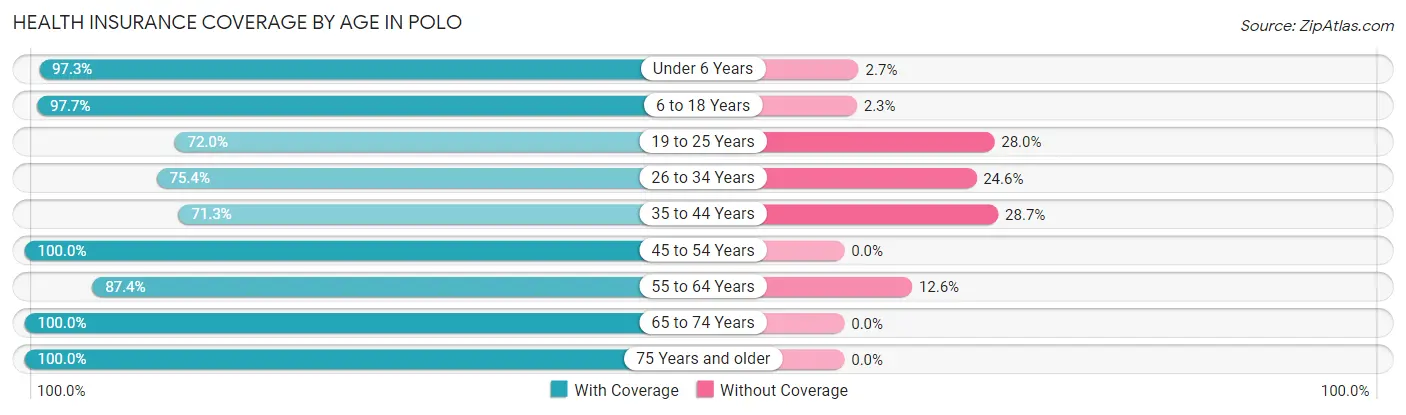
| Age Bracket | With Coverage | Without Coverage |
| Under 6 Years | 254 (97.3%) | 7 (2.7%) |
| 6 to 18 Years | 461 (97.7%) | 11 (2.3%) |
| 19 to 25 Years | 85 (72.0%) | 33 (28.0%) |
| 26 to 34 Years | 472 (75.4%) | 154 (24.6%) |
| 35 to 44 Years | 174 (71.3%) | 70 (28.7%) |
| 45 to 54 Years | 219 (100.0%) | 0 (0.0%) |
| 55 to 64 Years | 187 (87.4%) | 27 (12.6%) |
| 65 to 74 Years | 184 (100.0%) | 0 (0.0%) |
| 75 Years and older | 137 (100.0%) | 0 (0.0%) |
| Total | 2,173 (87.8%) | 302 (12.2%) |
Health Insurance Coverage by Citizenship Status in Polo
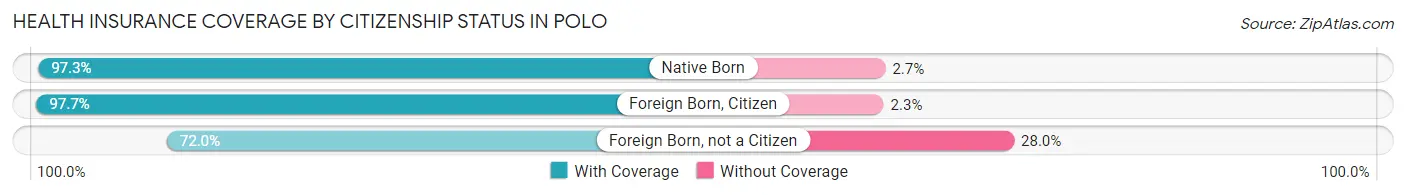
| Citizenship Status | With Coverage | Without Coverage |
| Native Born | 254 (97.3%) | 7 (2.7%) |
| Foreign Born, Citizen | 461 (97.7%) | 11 (2.3%) |
| Foreign Born, not a Citizen | 85 (72.0%) | 33 (28.0%) |
Health Insurance Coverage by Household Income in Polo
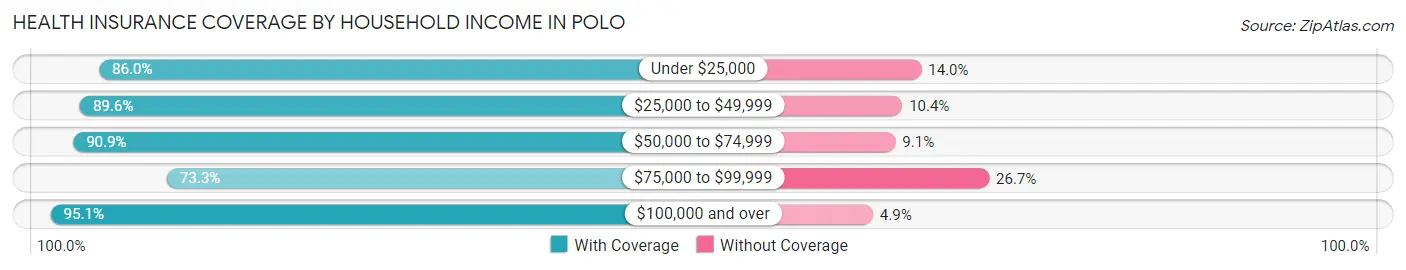
| Household Income | With Coverage | Without Coverage |
| Under $25,000 | 388 (86.0%) | 63 (14.0%) |
| $25,000 to $49,999 | 475 (89.6%) | 55 (10.4%) |
| $50,000 to $74,999 | 419 (90.9%) | 42 (9.1%) |
| $75,000 to $99,999 | 308 (73.3%) | 112 (26.7%) |
| $100,000 and over | 583 (95.1%) | 30 (4.9%) |
Public vs Private Health Insurance Coverage by Age in Polo
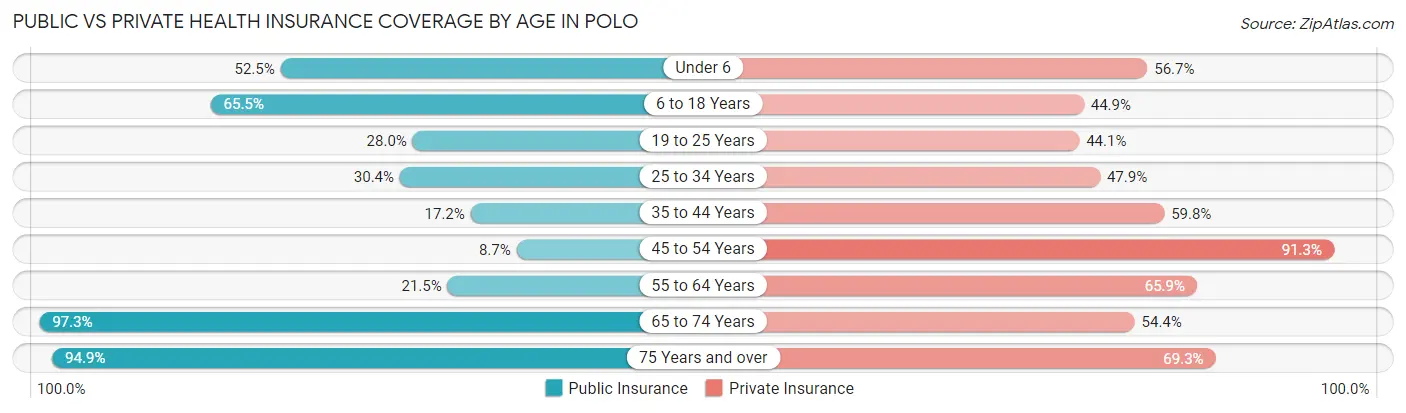
| Age Bracket | Public Insurance | Private Insurance |
| Under 6 | 137 (52.5%) | 148 (56.7%) |
| 6 to 18 Years | 309 (65.5%) | 212 (44.9%) |
| 19 to 25 Years | 33 (28.0%) | 52 (44.1%) |
| 25 to 34 Years | 190 (30.3%) | 300 (47.9%) |
| 35 to 44 Years | 42 (17.2%) | 146 (59.8%) |
| 45 to 54 Years | 19 (8.7%) | 200 (91.3%) |
| 55 to 64 Years | 46 (21.5%) | 141 (65.9%) |
| 65 to 74 Years | 179 (97.3%) | 100 (54.3%) |
| 75 Years and over | 130 (94.9%) | 95 (69.3%) |
| Total | 1,085 (43.8%) | 1,394 (56.3%) |
Disability Status by Sex by Age in Polo
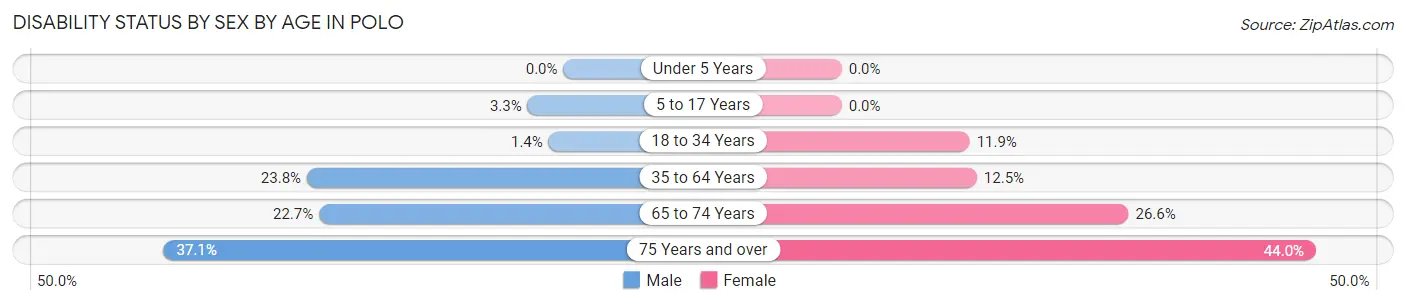
| Age Bracket | Male | Female |
| Under 5 Years | 0 (0.0%) | 0 (0.0%) |
| 5 to 17 Years | 10 (3.3%) | 0 (0.0%) |
| 18 to 34 Years | 5 (1.4%) | 45 (11.9%) |
| 35 to 64 Years | 89 (23.8%) | 38 (12.5%) |
| 65 to 74 Years | 17 (22.7%) | 29 (26.6%) |
| 75 Years and over | 23 (37.1%) | 33 (44.0%) |
Disability Class by Sex by Age in Polo
Disability Class: Hearing Difficulty
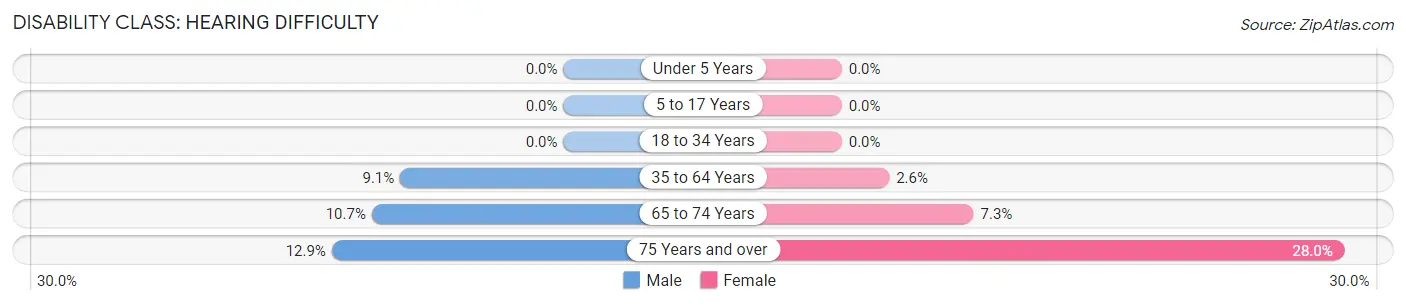
| Age Bracket | Male | Female |
| Under 5 Years | 0 (0.0%) | 0 (0.0%) |
| 5 to 17 Years | 0 (0.0%) | 0 (0.0%) |
| 18 to 34 Years | 0 (0.0%) | 0 (0.0%) |
| 35 to 64 Years | 34 (9.1%) | 8 (2.6%) |
| 65 to 74 Years | 8 (10.7%) | 8 (7.3%) |
| 75 Years and over | 8 (12.9%) | 21 (28.0%) |
Disability Class: Vision Difficulty
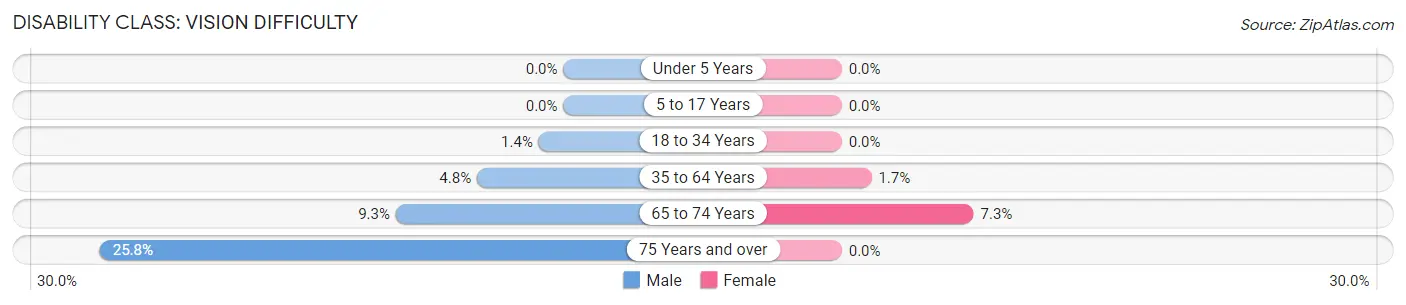
| Age Bracket | Male | Female |
| Under 5 Years | 0 (0.0%) | 0 (0.0%) |
| 5 to 17 Years | 0 (0.0%) | 0 (0.0%) |
| 18 to 34 Years | 5 (1.4%) | 0 (0.0%) |
| 35 to 64 Years | 18 (4.8%) | 5 (1.7%) |
| 65 to 74 Years | 7 (9.3%) | 8 (7.3%) |
| 75 Years and over | 16 (25.8%) | 0 (0.0%) |
Disability Class: Cognitive Difficulty
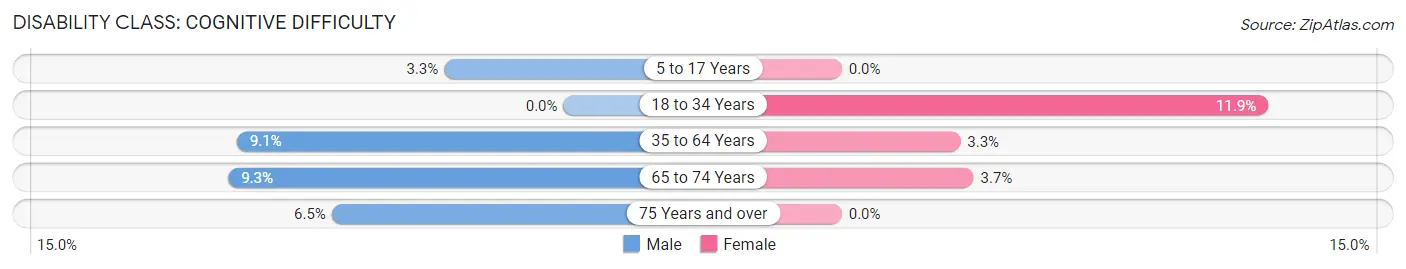
| Age Bracket | Male | Female |
| 5 to 17 Years | 10 (3.3%) | 0 (0.0%) |
| 18 to 34 Years | 0 (0.0%) | 45 (11.9%) |
| 35 to 64 Years | 34 (9.1%) | 10 (3.3%) |
| 65 to 74 Years | 7 (9.3%) | 4 (3.7%) |
| 75 Years and over | 4 (6.5%) | 0 (0.0%) |
Disability Class: Ambulatory Difficulty
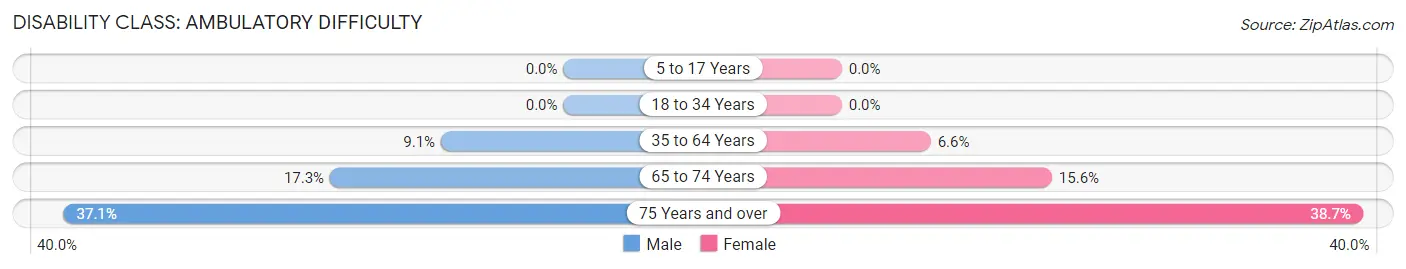
| Age Bracket | Male | Female |
| 5 to 17 Years | 0 (0.0%) | 0 (0.0%) |
| 18 to 34 Years | 0 (0.0%) | 0 (0.0%) |
| 35 to 64 Years | 34 (9.1%) | 20 (6.6%) |
| 65 to 74 Years | 13 (17.3%) | 17 (15.6%) |
| 75 Years and over | 23 (37.1%) | 29 (38.7%) |
Disability Class: Self-Care Difficulty
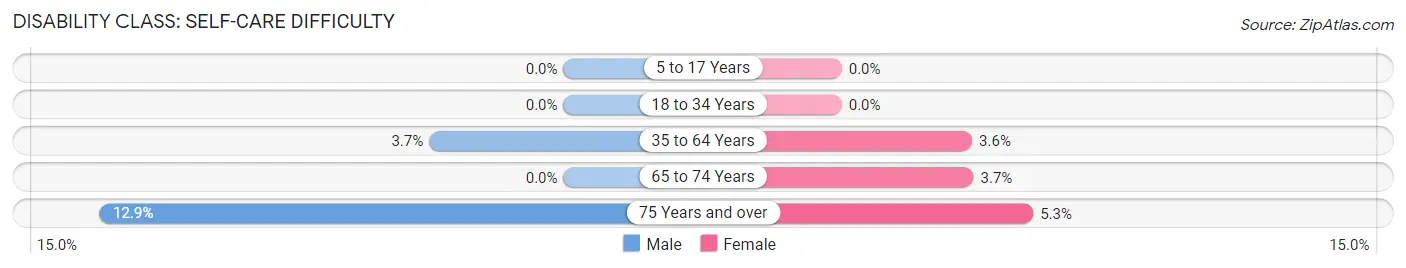
| Age Bracket | Male | Female |
| 5 to 17 Years | 0 (0.0%) | 0 (0.0%) |
| 18 to 34 Years | 0 (0.0%) | 0 (0.0%) |
| 35 to 64 Years | 14 (3.7%) | 11 (3.6%) |
| 65 to 74 Years | 0 (0.0%) | 4 (3.7%) |
| 75 Years and over | 8 (12.9%) | 4 (5.3%) |
Technology Access in Polo
Computing Device Access in Polo
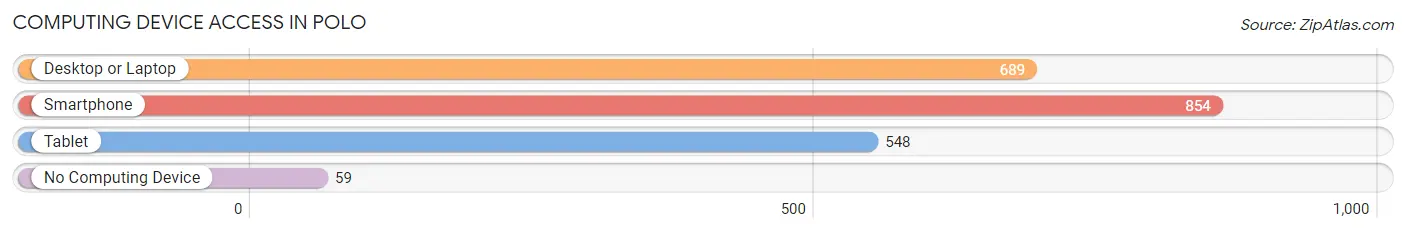
| Device Type | # Households | % Households |
| Desktop or Laptop | 689 | 70.5% |
| Smartphone | 854 | 87.3% |
| Tablet | 548 | 56.0% |
| No Computing Device | 59 | 6.0% |
| Total | 978 | 100.0% |
Internet Access in Polo
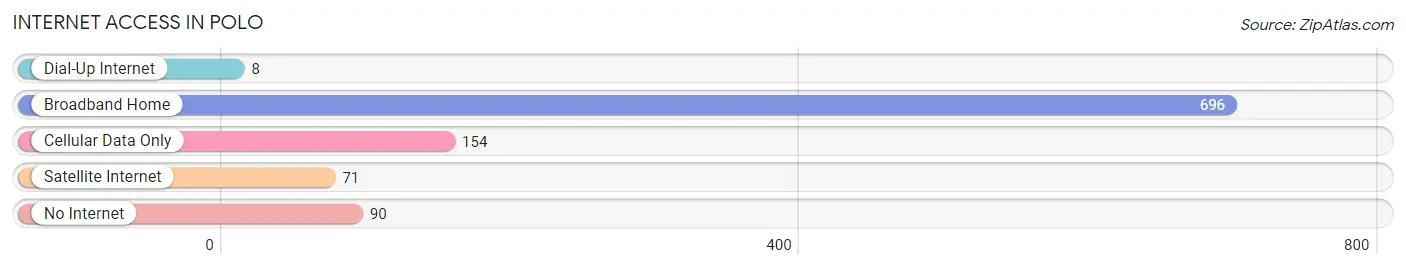
| Internet Type | # Households | % Households |
| Dial-Up Internet | 8 | 0.8% |
| Broadband Home | 696 | 71.2% |
| Cellular Data Only | 154 | 15.8% |
| Satellite Internet | 71 | 7.3% |
| No Internet | 90 | 9.2% |
| Total | 978 | 100.0% |
Polo Summary
Polo, Illinois is a small village located in Ogle County, Illinois. It is situated in the northern part of the state, about 90 miles northwest of Chicago. The village has a population of approximately 2,500 people and is part of the Rockford Metropolitan Statistical Area.
History
Polo, Illinois was founded in 1854 by a group of settlers from Ohio. The village was named after the game of polo, which was popular at the time. The first settlers were primarily farmers, and the village quickly grew to become a thriving agricultural community. The first post office was established in 1856, and the first school was built in 1858.
In the late 19th century, Polo became a popular destination for tourists. The village was known for its beautiful scenery and its many recreational activities, such as fishing, hunting, and boating. The village also had a number of hotels and resorts, which attracted visitors from all over the Midwest.
In the early 20th century, Polo experienced a period of growth and prosperity. The village was home to several factories, including a flour mill, a furniture factory, and a canning factory. The village also had a number of stores and businesses, including a bank, a newspaper, and a movie theater.
Geography
Polo is located in the northern part of Ogle County, Illinois. The village is situated on the banks of the Rock River, which flows through the village. The village is surrounded by rolling hills and farmland, and is located about 90 miles northwest of Chicago.
The climate in Polo is typical of the Midwest, with hot summers and cold winters. The average temperature in the summer is around 75 degrees Fahrenheit, and the average temperature in the winter is around 25 degrees Fahrenheit. The village receives an average of 36 inches of precipitation each year.
Economy
The economy of Polo is primarily based on agriculture. The village is home to several farms, which produce a variety of crops, including corn, soybeans, and wheat. The village also has a number of businesses, including a grocery store, a hardware store, and a bank.
The village is also home to a number of manufacturing companies, including a furniture factory, a canning factory, and a flour mill. The village also has a number of stores and restaurants, which attract visitors from all over the region.
Demographics
As of the 2010 census, the population of Polo was 2,500. The village is predominantly white, with about 95% of the population being of European descent. The median household income in the village is $45,000, and the median home value is $125,000. The village has a low unemployment rate, and the majority of the population is employed in the agricultural and manufacturing industries.
Common Questions
What is Per Capita Income in Polo?
Per Capita income in Polo is $26,369.
What is the Median Family Income in Polo?
Median Family Income in Polo is $69,615.
What is the Median Household income in Polo?
Median Household Income in Polo is $57,931.
What is Income or Wage Gap in Polo?
Income or Wage Gap in Polo is 16.9%.
Women in Polo earn 83.1 cents for every dollar earned by a man.
What is Inequality or Gini Index in Polo?
Inequality or Gini Index in Polo is 0.38.
What is the Total Population of Polo?
Total Population of Polo is 2,520.
What is the Total Male Population of Polo?
Total Male Population of Polo is 1,266.
What is the Total Female Population of Polo?
Total Female Population of Polo is 1,254.
What is the Ratio of Males per 100 Females in Polo?
There are 100.96 Males per 100 Females in Polo.
What is the Ratio of Females per 100 Males in Polo?
There are 99.05 Females per 100 Males in Polo.
What is the Median Population Age in Polo?
Median Population Age in Polo is 30.2 Years.
What is the Average Family Size in Polo
Average Family Size in Polo is 2.9 People.
What is the Average Household Size in Polo
Average Household Size in Polo is 2.5 People.
How Large is the Labor Force in Polo?
There are 1,191 People in the Labor Forcein in Polo.
What is the Percentage of People in the Labor Force in Polo?
64.3% of People are in the Labor Force in Polo.
What is the Unemployment Rate in Polo?
Unemployment Rate in Polo is 3.4%.