Rock Falls, IL Map & Demographics
Rock Falls Map
Rock Falls Overview
$31,733
PER CAPITA INCOME
$60,158
AVG FAMILY INCOME
$48,390
AVG HOUSEHOLD INCOME
46.0%
WAGE / INCOME GAP [ % ]
54.0¢/ $1
WAGE / INCOME GAP [ $ ]
0.48
INEQUALITY / GINI INDEX
8,904
TOTAL POPULATION
4,273
MALE POPULATION
4,631
FEMALE POPULATION
92.27
MALES / 100 FEMALES
108.38
FEMALES / 100 MALES
38.2
MEDIAN AGE
3.0
AVG FAMILY SIZE
2.2
AVG HOUSEHOLD SIZE
4,534
LABOR FORCE [ PEOPLE ]
64.2%
PERCENT IN LABOR FORCE
4.4%
UNEMPLOYMENT RATE
Rock Falls Zip Codes
Rock Falls Area Codes
Income in Rock Falls
Income Overview in Rock Falls
Per Capita Income in Rock Falls is $31,733, while median incomes of families and households are $60,158 and $48,390 respectively.
| Characteristic | Number | Measure |
| Per Capita Income | 8,904 | $31,733 |
| Median Family Income | 2,092 | $60,158 |
| Mean Family Income | 2,092 | $85,977 |
| Median Household Income | 3,969 | $48,390 |
| Mean Household Income | 3,969 | $68,567 |
| Income Deficit | 2,092 | $0 |
| Wage / Income Gap (%) | 8,904 | 46.05% |
| Wage / Income Gap ($) | 8,904 | 53.95¢ per $1 |
| Gini / Inequality Index | 8,904 | 0.48 |
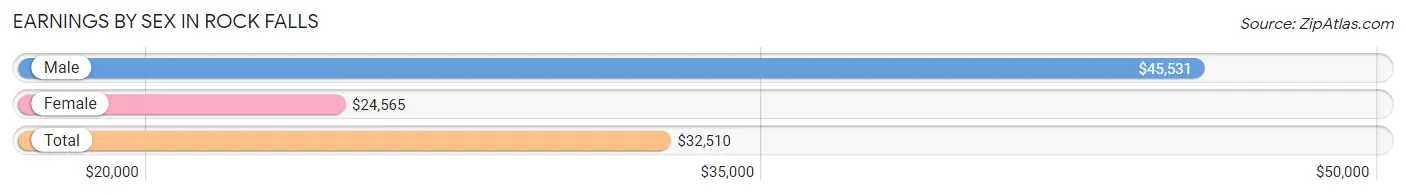
Earnings by Sex in Rock Falls
Average Earnings in Rock Falls are $32,510, $45,531 for men and $24,565 for women, a difference of 46.1%.
| Sex | Number | Average Earnings |
| Male | 2,502 (52.6%) | $45,531 |
| Female | 2,251 (47.4%) | $24,565 |
| Total | 4,753 (100.0%) | $32,510 |
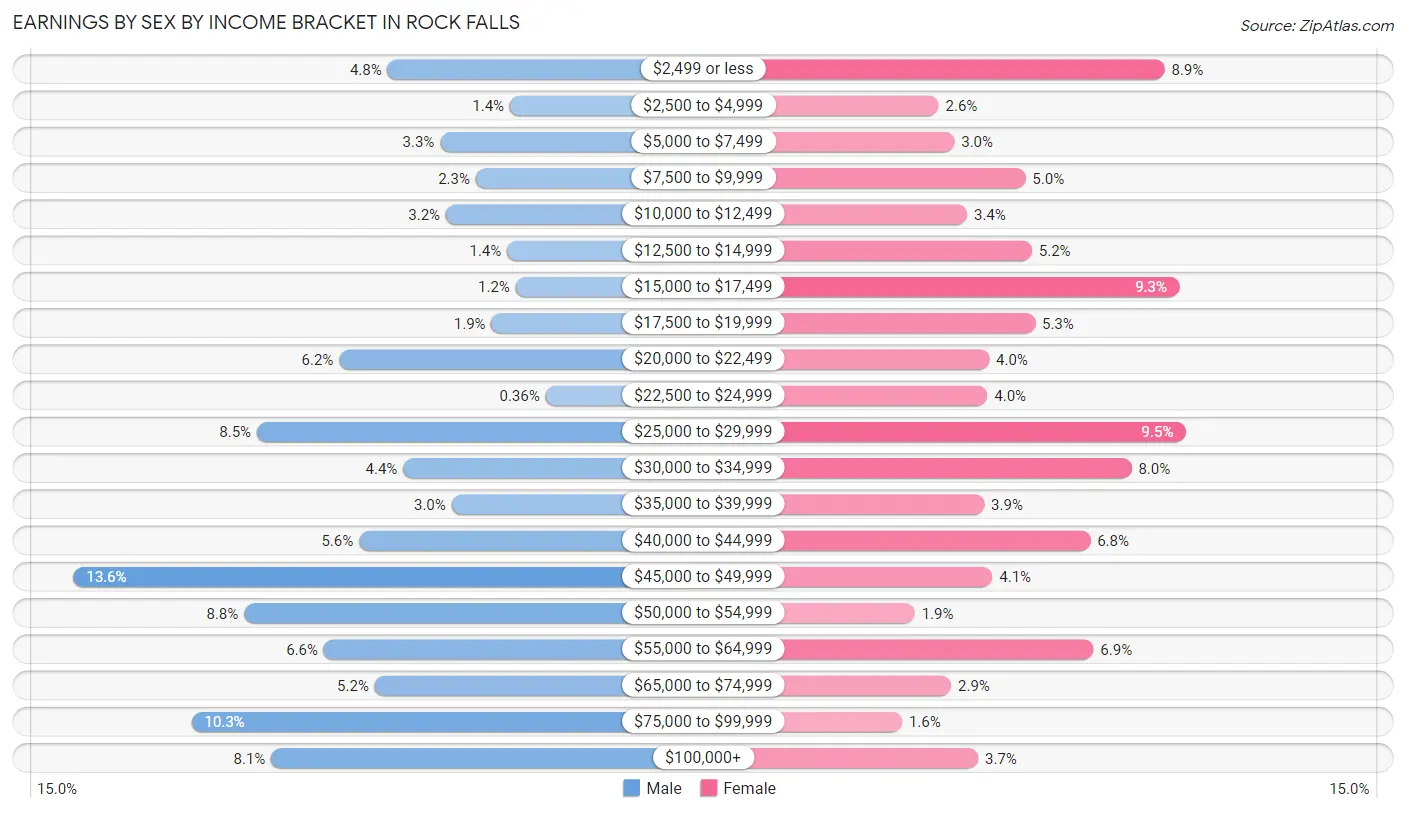
Earnings by Sex by Income Bracket in Rock Falls
The most common earnings brackets in Rock Falls are $45,000 to $49,999 for men (341 | 13.6%) and $25,000 to $29,999 for women (214 | 9.5%).
| Income | Male | Female |
| $2,499 or less | 120 (4.8%) | 201 (8.9%) |
| $2,500 to $4,999 | 34 (1.4%) | 58 (2.6%) |
| $5,000 to $7,499 | 83 (3.3%) | 68 (3.0%) |
| $7,500 to $9,999 | 58 (2.3%) | 113 (5.0%) |
| $10,000 to $12,499 | 79 (3.2%) | 76 (3.4%) |
| $12,500 to $14,999 | 36 (1.4%) | 117 (5.2%) |
| $15,000 to $17,499 | 30 (1.2%) | 210 (9.3%) |
| $17,500 to $19,999 | 47 (1.9%) | 119 (5.3%) |
| $20,000 to $22,499 | 154 (6.2%) | 90 (4.0%) |
| $22,500 to $24,999 | 9 (0.4%) | 89 (4.0%) |
| $25,000 to $29,999 | 212 (8.5%) | 214 (9.5%) |
| $30,000 to $34,999 | 109 (4.4%) | 180 (8.0%) |
| $35,000 to $39,999 | 75 (3.0%) | 87 (3.9%) |
| $40,000 to $44,999 | 140 (5.6%) | 154 (6.8%) |
| $45,000 to $49,999 | 341 (13.6%) | 92 (4.1%) |
| $50,000 to $54,999 | 221 (8.8%) | 43 (1.9%) |
| $55,000 to $64,999 | 165 (6.6%) | 156 (6.9%) |
| $65,000 to $74,999 | 129 (5.2%) | 66 (2.9%) |
| $75,000 to $99,999 | 258 (10.3%) | 35 (1.5%) |
| $100,000+ | 202 (8.1%) | 83 (3.7%) |
| Total | 2,502 (100.0%) | 2,251 (100.0%) |
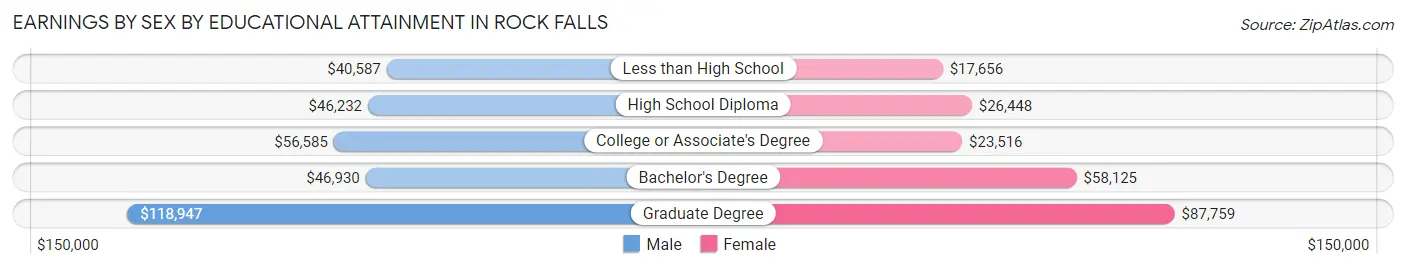
Earnings by Sex by Educational Attainment in Rock Falls
Average earnings in Rock Falls are $46,732 for men and $26,363 for women, a difference of 43.6%. Men with an educational attainment of graduate degree enjoy the highest average annual earnings of $118,947, while those with less than high school education earn the least with $40,587. Women with an educational attainment of graduate degree earn the most with the average annual earnings of $87,759, while those with less than high school education have the smallest earnings of $17,656.
| Educational Attainment | Male Income | Female Income |
| Less than High School | $40,587 | $17,656 |
| High School Diploma | $46,232 | $26,448 |
| College or Associate's Degree | $56,585 | $23,516 |
| Bachelor's Degree | $46,930 | $58,125 |
| Graduate Degree | $118,947 | $87,759 |
| Total | $46,732 | $26,363 |
Family Income in Rock Falls
Family Income Brackets in Rock Falls
According to the Rock Falls family income data, there are 395 families falling into the $50,000 to $74,999 income range, which is the most common income bracket and makes up 18.9% of all families. Conversely, the less than $10,000 income bracket is the least frequent group with only 54 families (2.6%) belonging to this category.
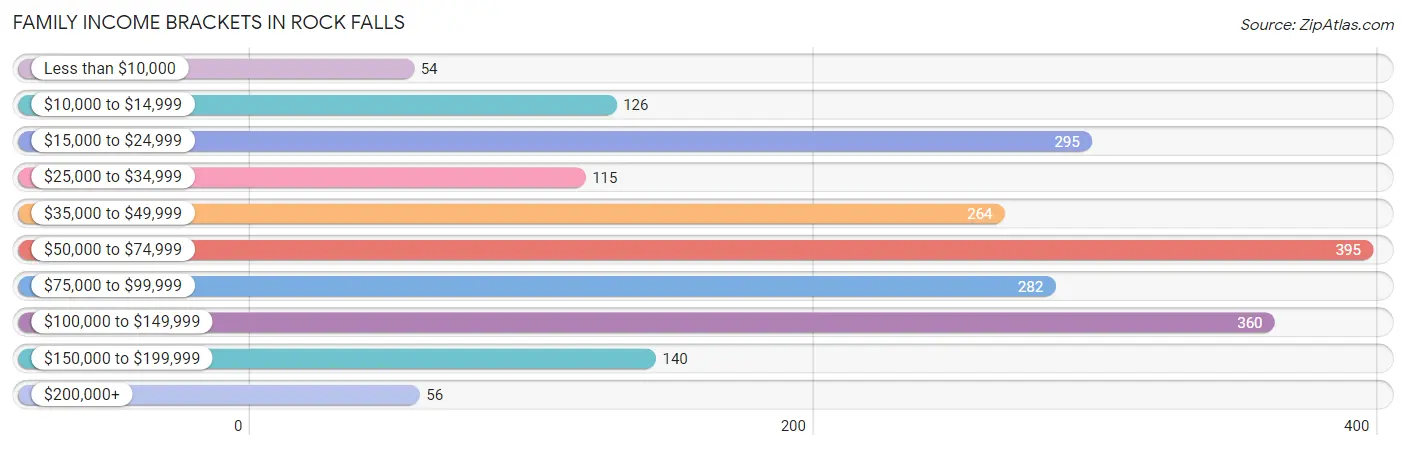
| Income Bracket | # Families | % Families |
| Less than $10,000 | 54 | 2.6% |
| $10,000 to $14,999 | 126 | 6.0% |
| $15,000 to $24,999 | 295 | 14.1% |
| $25,000 to $34,999 | 115 | 5.5% |
| $35,000 to $49,999 | 264 | 12.6% |
| $50,000 to $74,999 | 395 | 18.9% |
| $75,000 to $99,999 | 282 | 13.5% |
| $100,000 to $149,999 | 360 | 17.2% |
| $150,000 to $199,999 | 140 | 6.7% |
| $200,000+ | 56 | 2.7% |
Family Income by Famaliy Size in Rock Falls
3-person families (398 | 19.0%) account for the highest median family income in Rock Falls with $83,056 per family, while 2-person families (976 | 46.7%) have the highest median income of $31,346 per family member.
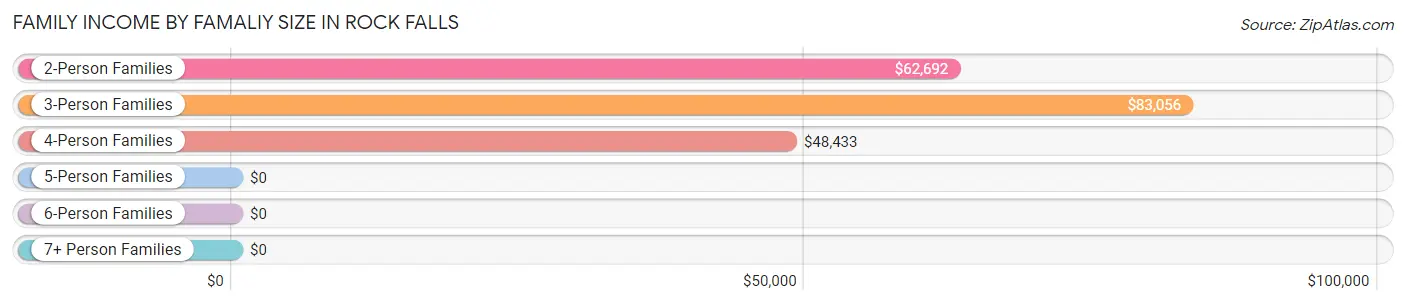
| Income Bracket | # Families | Median Income |
| 2-Person Families | 976 (46.7%) | $62,692 |
| 3-Person Families | 398 (19.0%) | $83,056 |
| 4-Person Families | 384 (18.4%) | $48,433 |
| 5-Person Families | 314 (15.0%) | $0 |
| 6-Person Families | 20 (1.0%) | $0 |
| 7+ Person Families | 0 (0.0%) | $0 |
| Total | 2,092 (100.0%) | $60,158 |
Family Income by Number of Earners in Rock Falls
The median family income in Rock Falls is $60,158, with families comprising 3+ earners (184) having the highest median family income of $122,125, while families with 1 earner (837) have the lowest median family income of $29,554, accounting for 8.8% and 40.0% of families, respectively.
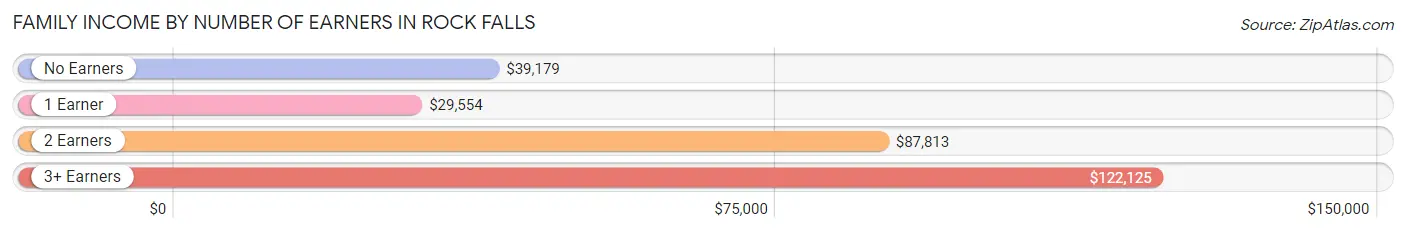
| Number of Earners | # Families | Median Income |
| No Earners | 341 (16.3%) | $39,179 |
| 1 Earner | 837 (40.0%) | $29,554 |
| 2 Earners | 730 (34.9%) | $87,813 |
| 3+ Earners | 184 (8.8%) | $122,125 |
| Total | 2,092 (100.0%) | $60,158 |
Household Income in Rock Falls
Household Income Brackets in Rock Falls
With 691 households falling in the category, the $35,000 to $49,999 income range is the most frequent in Rock Falls, accounting for 17.4% of all households. In contrast, only 87 households (2.2%) fall into the $200,000+ income bracket, making it the least populous group.
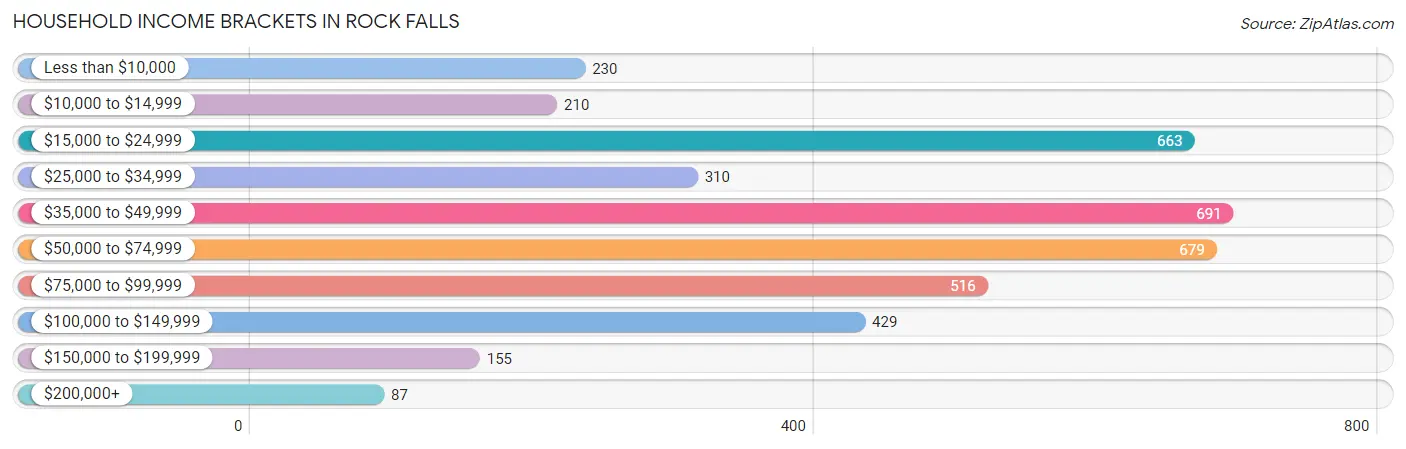
| Income Bracket | # Households | % Households |
| Less than $10,000 | 230 | 5.8% |
| $10,000 to $14,999 | 210 | 5.3% |
| $15,000 to $24,999 | 663 | 16.7% |
| $25,000 to $34,999 | 310 | 7.8% |
| $35,000 to $49,999 | 691 | 17.4% |
| $50,000 to $74,999 | 679 | 17.1% |
| $75,000 to $99,999 | 516 | 13.0% |
| $100,000 to $149,999 | 429 | 10.8% |
| $150,000 to $199,999 | 155 | 3.9% |
| $200,000+ | 87 | 2.2% |
Household Income by Householder Age in Rock Falls
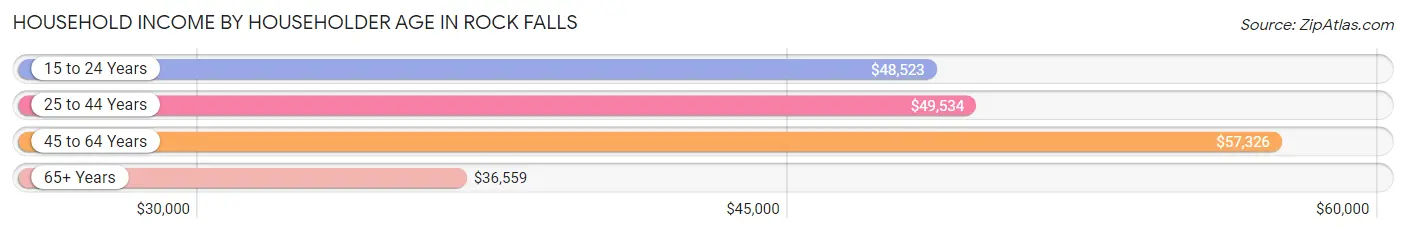
The median household income in Rock Falls is $48,390, with the highest median household income of $57,326 found in the 45 to 64 years age bracket for the primary householder. A total of 1,338 households (33.7%) fall into this category. Meanwhile, the 65+ years age bracket for the primary householder has the lowest median household income of $36,559, with 1,161 households (29.2%) in this group.
| Income Bracket | # Households | Median Income |
| 15 to 24 Years | 288 (7.3%) | $48,523 |
| 25 to 44 Years | 1,182 (29.8%) | $49,534 |
| 45 to 64 Years | 1,338 (33.7%) | $57,326 |
| 65+ Years | 1,161 (29.2%) | $36,559 |
| Total | 3,969 (100.0%) | $48,390 |
Poverty in Rock Falls
Income Below Poverty by Sex and Age in Rock Falls
With 17.2% poverty level for males and 26.4% for females among the residents of Rock Falls, 6 to 11 year old males and 5 year old females are the most vulnerable to poverty, with 185 males (70.9%) and 43 females (75.4%) in their respective age groups living below the poverty level.
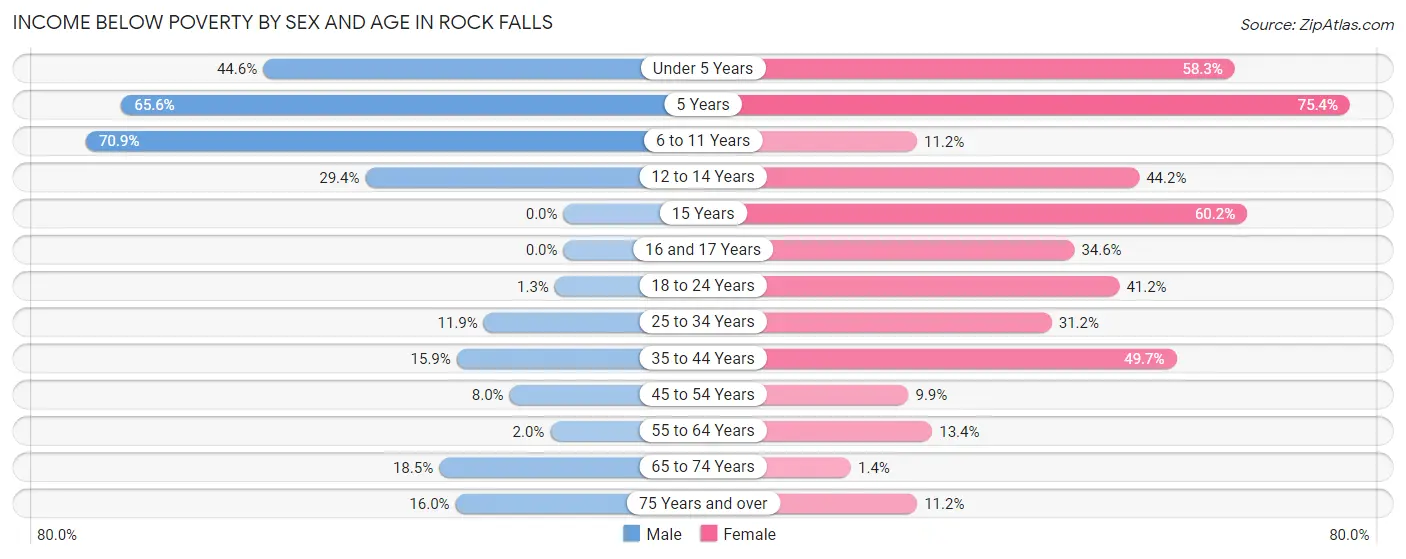
| Age Bracket | Male | Female |
| Under 5 Years | 128 (44.6%) | 161 (58.3%) |
| 5 Years | 21 (65.6%) | 43 (75.4%) |
| 6 to 11 Years | 185 (70.9%) | 34 (11.2%) |
| 12 to 14 Years | 60 (29.4%) | 91 (44.2%) |
| 15 Years | 0 (0.0%) | 77 (60.2%) |
| 16 and 17 Years | 0 (0.0%) | 38 (34.5%) |
| 18 to 24 Years | 5 (1.3%) | 188 (41.2%) |
| 25 to 34 Years | 68 (11.8%) | 159 (31.2%) |
| 35 to 44 Years | 74 (15.9%) | 225 (49.7%) |
| 45 to 54 Years | 45 (8.0%) | 54 (9.9%) |
| 55 to 64 Years | 11 (1.9%) | 84 (13.4%) |
| 65 to 74 Years | 82 (18.5%) | 7 (1.4%) |
| 75 Years and over | 42 (16.0%) | 44 (11.2%) |
| Total | 721 (17.2%) | 1,205 (26.4%) |
Income Above Poverty by Sex and Age in Rock Falls
According to the poverty statistics in Rock Falls, males aged 15 years and females aged 65 to 74 years are the age groups that are most secure financially, with 100.0% of males and 98.6% of females in these age groups living above the poverty line.
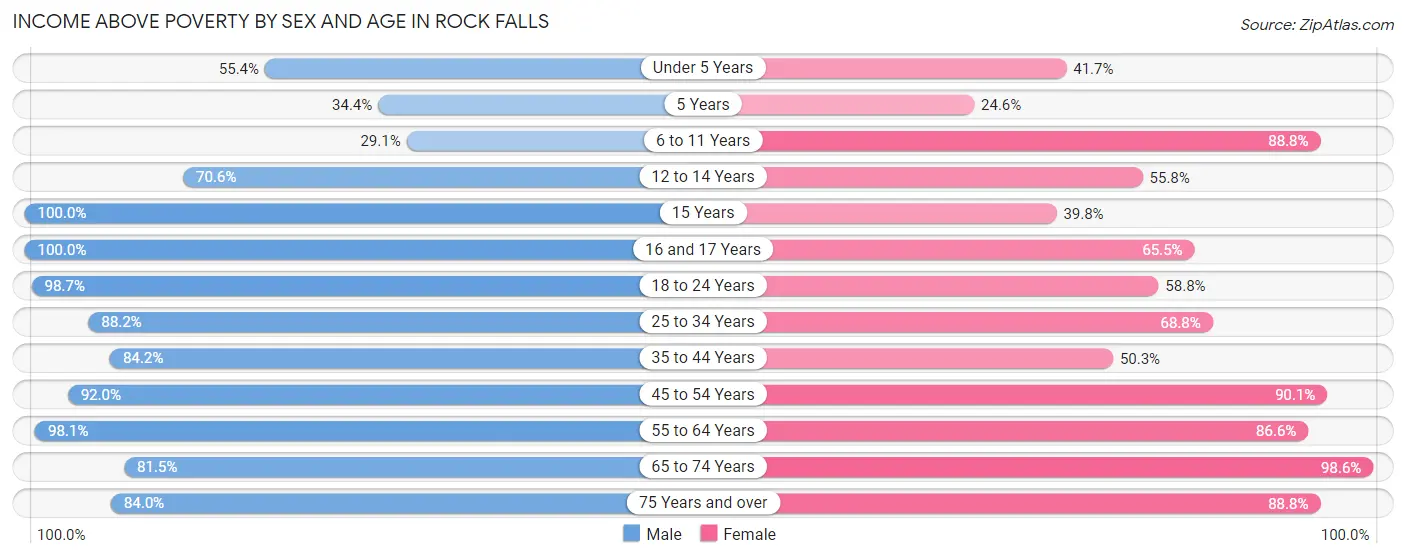
| Age Bracket | Male | Female |
| Under 5 Years | 159 (55.4%) | 115 (41.7%) |
| 5 Years | 11 (34.4%) | 14 (24.6%) |
| 6 to 11 Years | 76 (29.1%) | 270 (88.8%) |
| 12 to 14 Years | 144 (70.6%) | 115 (55.8%) |
| 15 Years | 24 (100.0%) | 51 (39.8%) |
| 16 and 17 Years | 128 (100.0%) | 72 (65.4%) |
| 18 to 24 Years | 382 (98.7%) | 268 (58.8%) |
| 25 to 34 Years | 506 (88.1%) | 351 (68.8%) |
| 35 to 44 Years | 393 (84.2%) | 228 (50.3%) |
| 45 to 54 Years | 517 (92.0%) | 491 (90.1%) |
| 55 to 64 Years | 554 (98.1%) | 541 (86.6%) |
| 65 to 74 Years | 362 (81.5%) | 502 (98.6%) |
| 75 Years and over | 220 (84.0%) | 349 (88.8%) |
| Total | 3,476 (82.8%) | 3,367 (73.6%) |
Income Below Poverty Among Married-Couple Families in Rock Falls
The poverty statistics for married-couple families in Rock Falls show that 5.6% or 63 of the total 1,133 families live below the poverty line. Families with 1 or 2 children have the highest poverty rate of 8.1%, comprising of 22 families. On the other hand, families with no children have the lowest poverty rate of 4.4%, which includes 30 families.
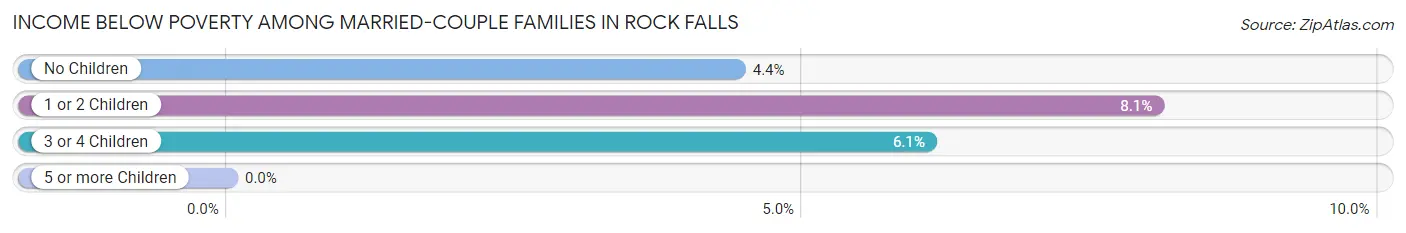
| Children | Above Poverty | Below Poverty |
| No Children | 649 (95.6%) | 30 (4.4%) |
| 1 or 2 Children | 251 (91.9%) | 22 (8.1%) |
| 3 or 4 Children | 170 (93.9%) | 11 (6.1%) |
| 5 or more Children | 0 (0.0%) | 0 (0.0%) |
| Total | 1,070 (94.4%) | 63 (5.6%) |
Income Below Poverty Among Single-Parent Households in Rock Falls
According to the poverty data in Rock Falls, 6.1% or 13 single-father households and 47.9% or 357 single-mother households are living below the poverty line. Among single-father households, those with 1 or 2 children have the highest poverty rate, with 13 households (9.0%) experiencing poverty. Likewise, among single-mother households, those with 3 or 4 children have the highest poverty rate, with 290 households (100.0%) falling below the poverty line.
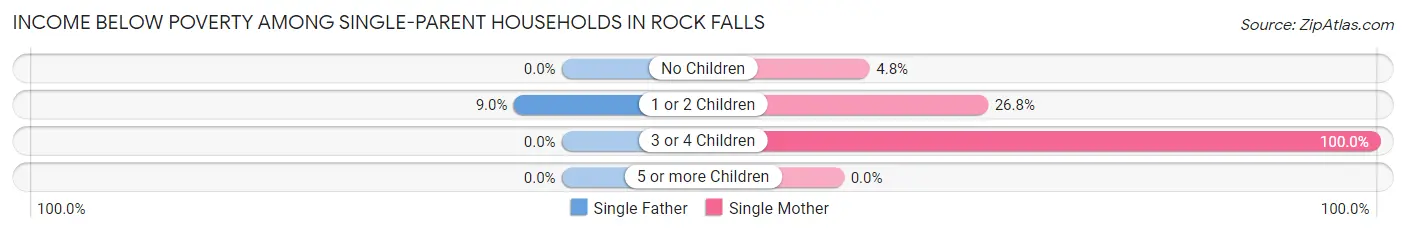
| Children | Single Father | Single Mother |
| No Children | 0 (0.0%) | 12 (4.8%) |
| 1 or 2 Children | 13 (9.0%) | 55 (26.8%) |
| 3 or 4 Children | 0 (0.0%) | 290 (100.0%) |
| 5 or more Children | 0 (0.0%) | 0 (0.0%) |
| Total | 13 (6.1%) | 357 (47.9%) |
Income Below Poverty Among Married-Couple vs Single-Parent Households in Rock Falls
The poverty data for Rock Falls shows that 63 of the married-couple family households (5.6%) and 370 of the single-parent households (38.6%) are living below the poverty level. Within the married-couple family households, those with 1 or 2 children have the highest poverty rate, with 22 households (8.1%) falling below the poverty line. Among the single-parent households, those with 3 or 4 children have the highest poverty rate, with 290 household (97.6%) living below poverty.
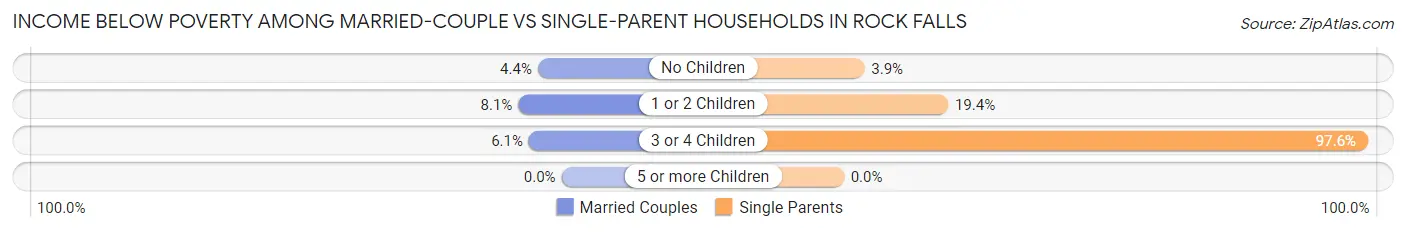
| Children | Married-Couple Families | Single-Parent Households |
| No Children | 30 (4.4%) | 12 (3.8%) |
| 1 or 2 Children | 22 (8.1%) | 68 (19.4%) |
| 3 or 4 Children | 11 (6.1%) | 290 (97.6%) |
| 5 or more Children | 0 (0.0%) | 0 (0.0%) |
| Total | 63 (5.6%) | 370 (38.6%) |
Race in Rock Falls
The most populous races in Rock Falls are White / Caucasian (7,423 | 83.4%), Hispanic or Latino (1,971 | 22.1%), and Two or more Races (1,074 | 12.1%).
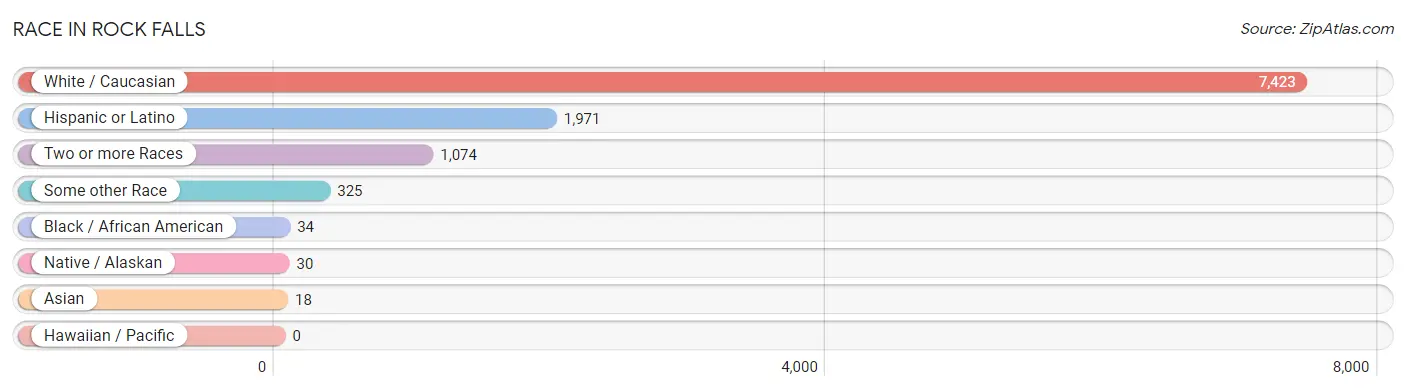
| Race | # Population | % Population |
| Asian | 18 | 0.2% |
| Black / African American | 34 | 0.4% |
| Hawaiian / Pacific | 0 | 0.0% |
| Hispanic or Latino | 1,971 | 22.1% |
| Native / Alaskan | 30 | 0.3% |
| White / Caucasian | 7,423 | 83.4% |
| Two or more Races | 1,074 | 12.1% |
| Some other Race | 325 | 3.6% |
| Total | 8,904 | 100.0% |
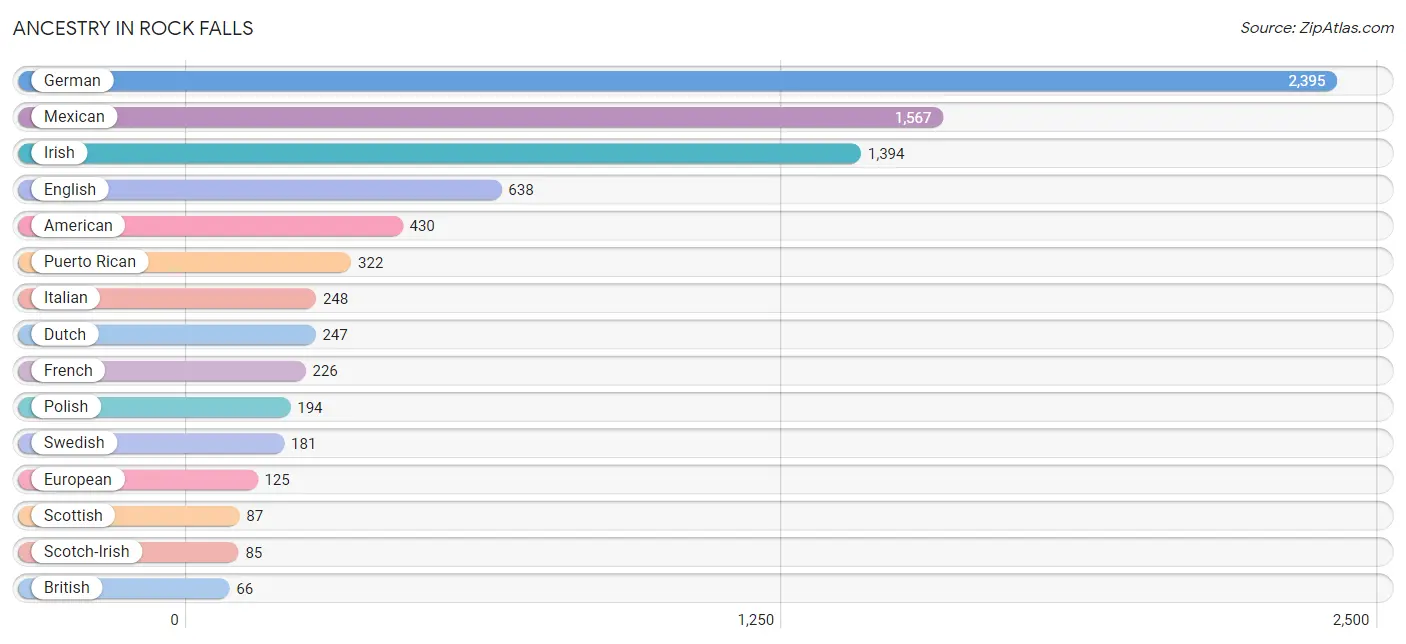
Ancestry in Rock Falls
The most populous ancestries reported in Rock Falls are German (2,395 | 26.9%), Mexican (1,567 | 17.6%), Irish (1,394 | 15.7%), English (638 | 7.2%), and American (430 | 4.8%), together accounting for 72.2% of all Rock Falls residents.
| Ancestry | # Population | % Population |
| African | 1 | 0.0% |
| American | 430 | 4.8% |
| Australian | 7 | 0.1% |
| Belgian | 35 | 0.4% |
| British | 66 | 0.7% |
| Burmese | 2 | 0.0% |
| Cuban | 12 | 0.1% |
| Czech | 16 | 0.2% |
| Danish | 28 | 0.3% |
| Dutch | 247 | 2.8% |
| English | 638 | 7.2% |
| European | 125 | 1.4% |
| French | 226 | 2.5% |
| German | 2,395 | 26.9% |
| Indian (Asian) | 50 | 0.6% |
| Irish | 1,394 | 15.7% |
| Israeli | 9 | 0.1% |
| Italian | 248 | 2.8% |
| Lithuanian | 43 | 0.5% |
| Mexican | 1,567 | 17.6% |
| Mexican American Indian | 6 | 0.1% |
| Nigerian | 25 | 0.3% |
| Northern European | 22 | 0.3% |
| Norwegian | 65 | 0.7% |
| Ottawa | 13 | 0.2% |
| Pennsylvania German | 24 | 0.3% |
| Polish | 194 | 2.2% |
| Puerto Rican | 322 | 3.6% |
| Romanian | 25 | 0.3% |
| Russian | 8 | 0.1% |
| Scandinavian | 40 | 0.4% |
| Scotch-Irish | 85 | 0.9% |
| Scottish | 87 | 1.0% |
| Sioux | 1 | 0.0% |
| Slovak | 29 | 0.3% |
| Spaniard | 33 | 0.4% |
| Spanish | 9 | 0.1% |
| Subsaharan African | 26 | 0.3% |
| Swedish | 181 | 2.0% |
| Thai | 20 | 0.2% |
| Welsh | 62 | 0.7% | View All 41 Rows |
Immigrants in Rock Falls
The most numerous immigrant groups reported in Rock Falls came from Central America (289 | 3.3%), Latin America (289 | 3.3%), Mexico (289 | 3.3%), Africa (25 | 0.3%), and Nigeria (25 | 0.3%), together accounting for 10.3% of all Rock Falls residents.
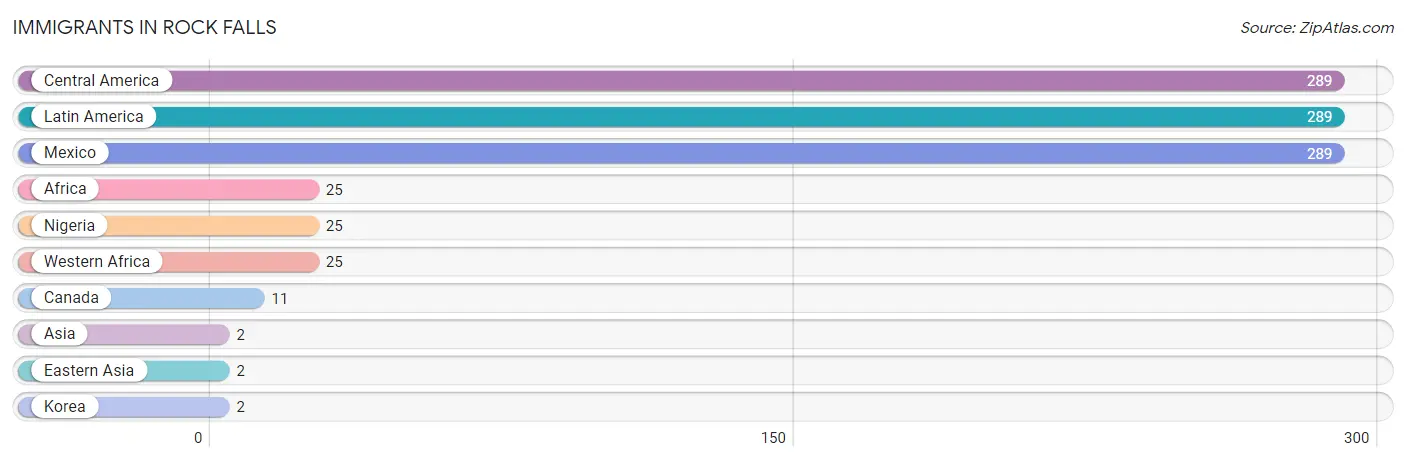
| Immigration Origin | # Population | % Population |
| Africa | 25 | 0.3% |
| Asia | 2 | 0.0% |
| Canada | 11 | 0.1% |
| Central America | 289 | 3.3% |
| Eastern Asia | 2 | 0.0% |
| Korea | 2 | 0.0% |
| Latin America | 289 | 3.3% |
| Mexico | 289 | 3.3% |
| Nigeria | 25 | 0.3% |
| Western Africa | 25 | 0.3% | View All 10 Rows |
Sex and Age in Rock Falls
Sex and Age in Rock Falls
The most populous age groups in Rock Falls are 60 to 64 Years (422 | 9.9%) for men and 20 to 24 Years (456 | 9.9%) for women.
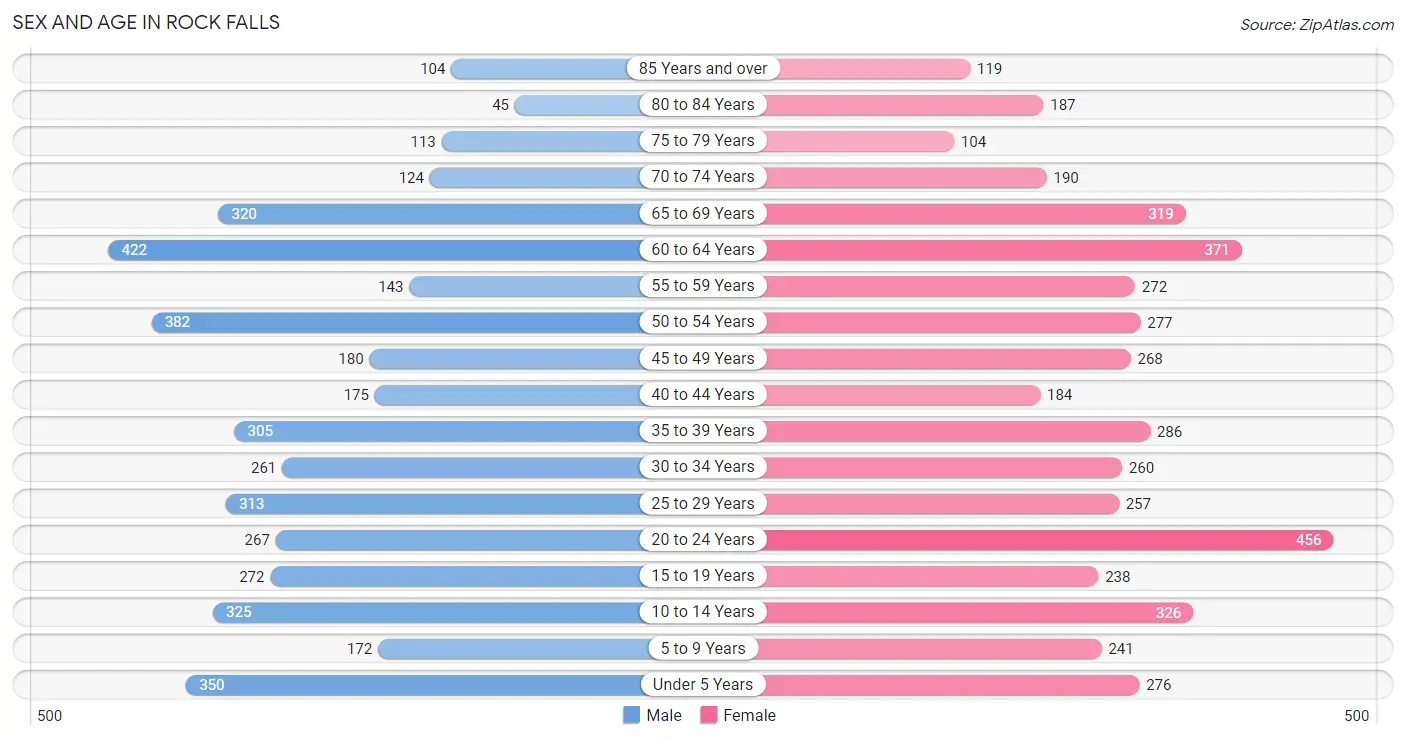
| Age Bracket | Male | Female |
| Under 5 Years | 350 (8.2%) | 276 (6.0%) |
| 5 to 9 Years | 172 (4.0%) | 241 (5.2%) |
| 10 to 14 Years | 325 (7.6%) | 326 (7.0%) |
| 15 to 19 Years | 272 (6.4%) | 238 (5.1%) |
| 20 to 24 Years | 267 (6.2%) | 456 (9.9%) |
| 25 to 29 Years | 313 (7.3%) | 257 (5.6%) |
| 30 to 34 Years | 261 (6.1%) | 260 (5.6%) |
| 35 to 39 Years | 305 (7.1%) | 286 (6.2%) |
| 40 to 44 Years | 175 (4.1%) | 184 (4.0%) |
| 45 to 49 Years | 180 (4.2%) | 268 (5.8%) |
| 50 to 54 Years | 382 (8.9%) | 277 (6.0%) |
| 55 to 59 Years | 143 (3.4%) | 272 (5.9%) |
| 60 to 64 Years | 422 (9.9%) | 371 (8.0%) |
| 65 to 69 Years | 320 (7.5%) | 319 (6.9%) |
| 70 to 74 Years | 124 (2.9%) | 190 (4.1%) |
| 75 to 79 Years | 113 (2.6%) | 104 (2.2%) |
| 80 to 84 Years | 45 (1.1%) | 187 (4.0%) |
| 85 Years and over | 104 (2.4%) | 119 (2.6%) |
| Total | 4,273 (100.0%) | 4,631 (100.0%) |
Families and Households in Rock Falls
Median Family Size in Rock Falls
The median family size in Rock Falls is 2.95 persons per family, with married-couple families (1,133 | 54.2%) accounting for the largest median family size of 3.03 persons per family. On the other hand, single male/father families (213 | 10.2%) represent the smallest median family size with 2.51 persons per family.
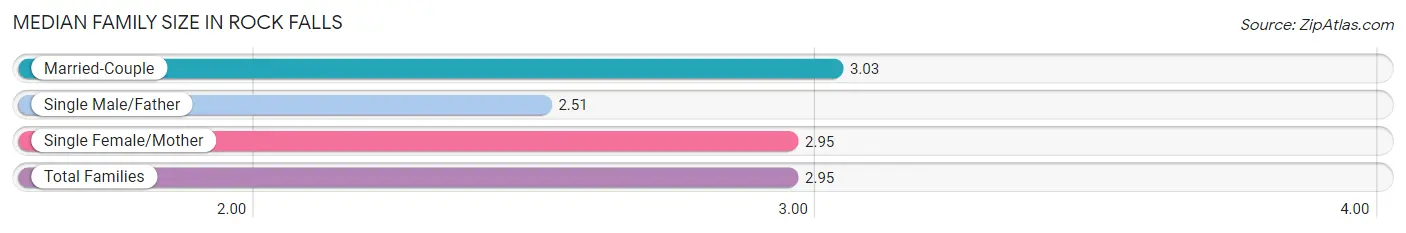
| Family Type | # Families | Family Size |
| Married-Couple | 1,133 (54.2%) | 3.03 |
| Single Male/Father | 213 (10.2%) | 2.51 |
| Single Female/Mother | 746 (35.7%) | 2.95 |
| Total Families | 2,092 (100.0%) | 2.95 |
Median Household Size in Rock Falls
The median household size in Rock Falls is 2.21 persons per household, with single female/mother households (746 | 18.8%) accounting for the largest median household size of 3.23 persons per household. non-family households (1,877 | 47.3%) represent the smallest median household size with 1.21 persons per household.
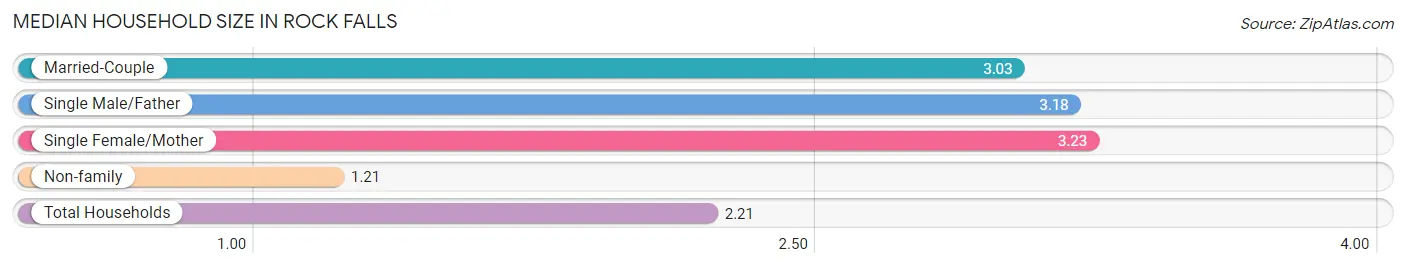
| Household Type | # Households | Household Size |
| Married-Couple | 1,133 (28.5%) | 3.03 |
| Single Male/Father | 213 (5.4%) | 3.18 |
| Single Female/Mother | 746 (18.8%) | 3.23 |
| Non-family | 1,877 (47.3%) | 1.21 |
| Total Households | 3,969 (100.0%) | 2.21 |
Household Size by Marriage Status in Rock Falls
Out of a total of 3,969 households in Rock Falls, 2,092 (52.7%) are family households, while 1,877 (47.3%) are nonfamily households. The most numerous type of family households are 2-person households, comprising 818, and the most common type of nonfamily households are 1-person households, comprising 1,610.
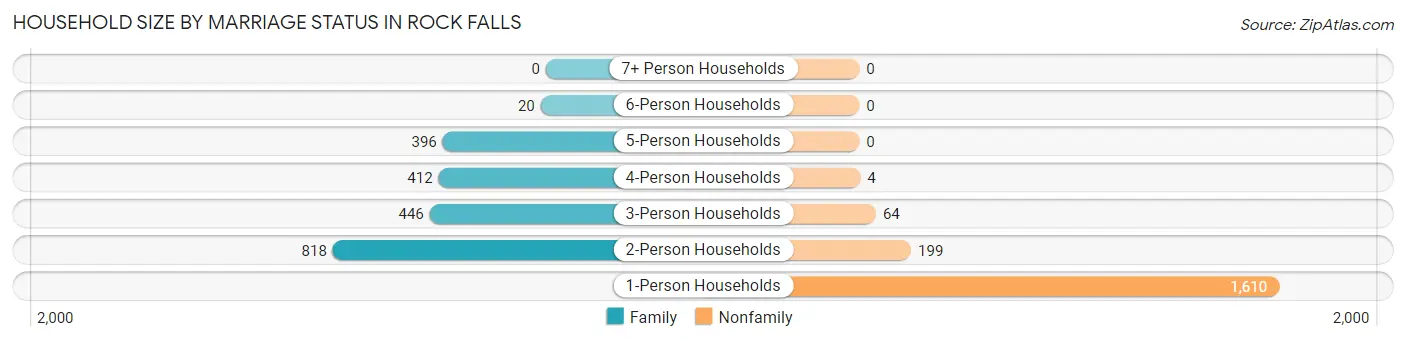
| Household Size | Family Households | Nonfamily Households |
| 1-Person Households | - | 1,610 (40.6%) |
| 2-Person Households | 818 (20.6%) | 199 (5.0%) |
| 3-Person Households | 446 (11.2%) | 64 (1.6%) |
| 4-Person Households | 412 (10.4%) | 4 (0.1%) |
| 5-Person Households | 396 (10.0%) | 0 (0.0%) |
| 6-Person Households | 20 (0.5%) | 0 (0.0%) |
| 7+ Person Households | 0 (0.0%) | 0 (0.0%) |
| Total | 2,092 (52.7%) | 1,877 (47.3%) |
Female Fertility in Rock Falls
Fertility by Age in Rock Falls
Average fertility rate in Rock Falls is 61.0 births per 1,000 women. Women in the age bracket of 20 to 34 years have the highest fertility rate with 122.0 births per 1,000 women. Women in the age bracket of 20 to 34 years acount for 96.8% of all women with births.
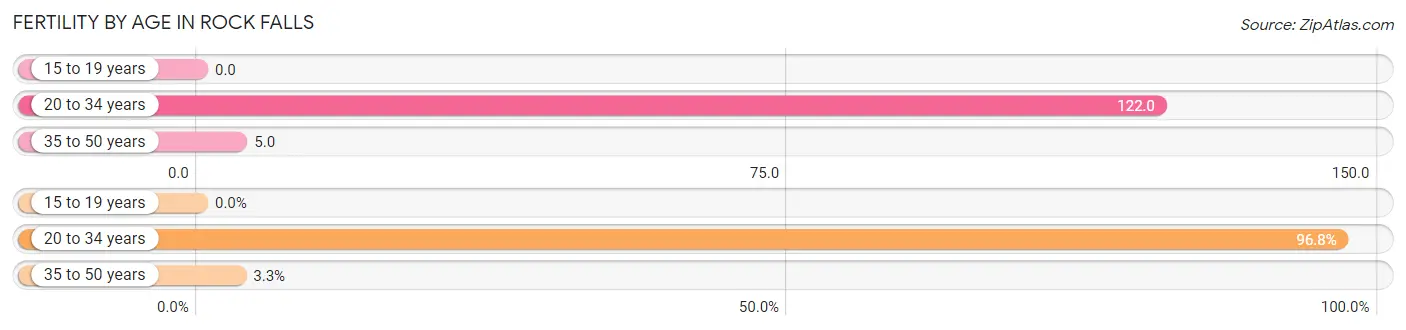
| Age Bracket | Women with Births | Births / 1,000 Women |
| 15 to 19 years | 0 (0.0%) | 0.0 |
| 20 to 34 years | 119 (96.8%) | 122.0 |
| 35 to 50 years | 4 (3.3%) | 5.0 |
| Total | 123 (100.0%) | 61.0 |
Fertility by Age by Marriage Status in Rock Falls
41.5% of women with births (123) in Rock Falls are married. The highest percentage of unmarried women with births falls into 20 to 34 years age bracket with 60.5% of them unmarried at the time of birth, while the lowest percentage of unmarried women with births belong to 35 to 50 years age bracket with 0.0% of them unmarried.
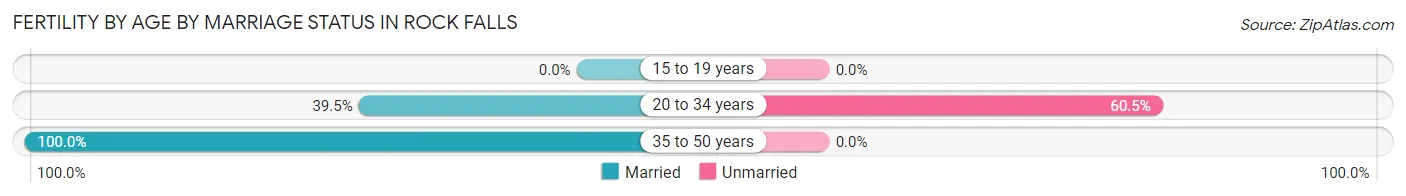
| Age Bracket | Married | Unmarried |
| 15 to 19 years | 0 (0.0%) | 0 (0.0%) |
| 20 to 34 years | 47 (39.5%) | 72 (60.5%) |
| 35 to 50 years | 4 (100.0%) | 0 (0.0%) |
| Total | 51 (41.5%) | 72 (58.5%) |
Fertility by Education in Rock Falls
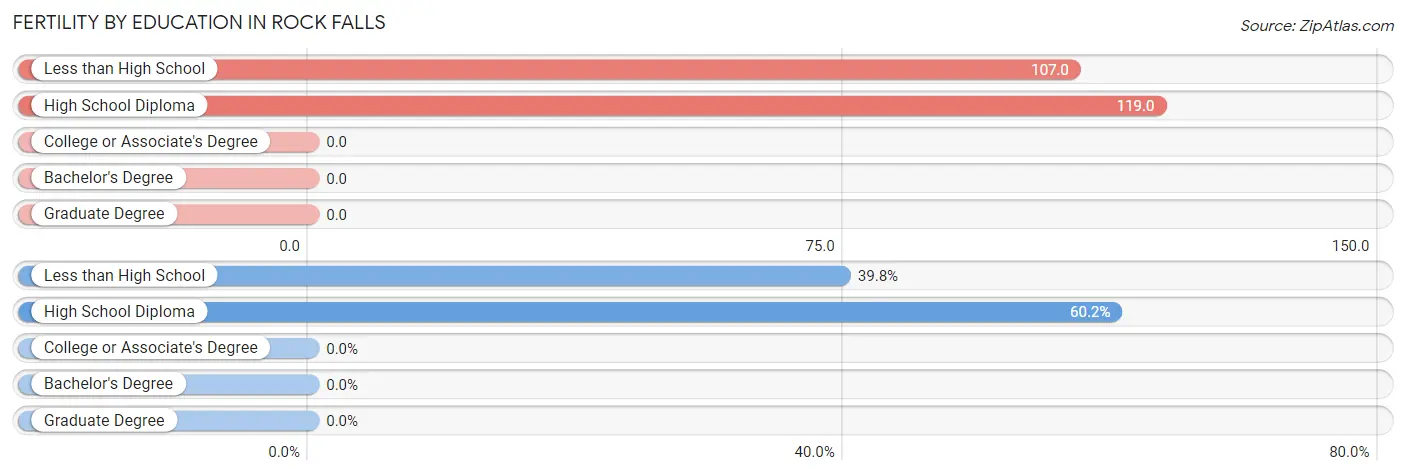
| Educational Attainment | Women with Births | Births / 1,000 Women |
| Less than High School | 49 (39.8%) | 107.0 |
| High School Diploma | 74 (60.2%) | 119.0 |
| College or Associate's Degree | 0 (0.0%) | 0.0 |
| Bachelor's Degree | 0 (0.0%) | 0.0 |
| Graduate Degree | 0 (0.0%) | 0.0 |
| Total | 123 (100.0%) | 61.0 |
Fertility by Education by Marriage Status in Rock Falls
58.5% of women with births in Rock Falls are unmarried. Women with the educational attainment of high school diploma are most likely to be married with 68.9% of them married at childbirth, while women with the educational attainment of less than high school are least likely to be married with 100.0% of them unmarried at childbirth.
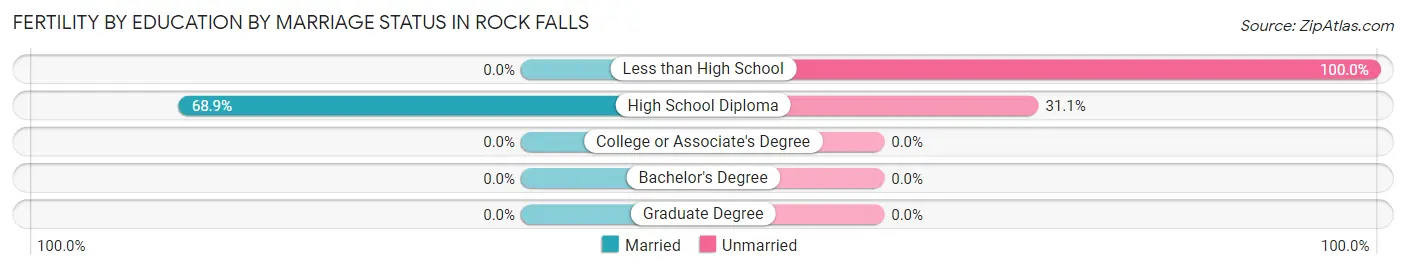
| Educational Attainment | Married | Unmarried |
| Less than High School | 0 (0.0%) | 49 (100.0%) |
| High School Diploma | 51 (68.9%) | 23 (31.1%) |
| College or Associate's Degree | 0 (0.0%) | 0 (0.0%) |
| Bachelor's Degree | 0 (0.0%) | 0 (0.0%) |
| Graduate Degree | 0 (0.0%) | 0 (0.0%) |
| Total | 51 (41.5%) | 72 (58.5%) |
Employment Characteristics in Rock Falls
Employment by Class of Employer in Rock Falls
Among the 4,114 employed individuals in Rock Falls, private company employees (3,185 | 77.4%), local government employees (378 | 9.2%), and not-for-profit organizations (261 | 6.3%) make up the most common classes of employment.
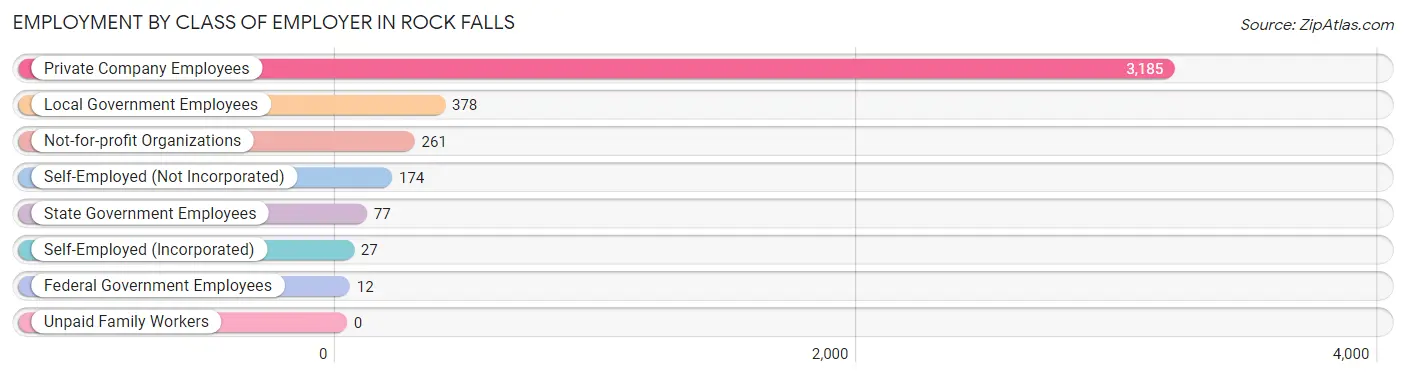
| Employer Class | # Employees | % Employees |
| Private Company Employees | 3,185 | 77.4% |
| Self-Employed (Incorporated) | 27 | 0.7% |
| Self-Employed (Not Incorporated) | 174 | 4.2% |
| Not-for-profit Organizations | 261 | 6.3% |
| Local Government Employees | 378 | 9.2% |
| State Government Employees | 77 | 1.9% |
| Federal Government Employees | 12 | 0.3% |
| Unpaid Family Workers | 0 | 0.0% |
| Total | 4,114 | 100.0% |
Employment Status by Age in Rock Falls
According to the labor force statistics for Rock Falls, out of the total population over 16 years of age (7,062), 64.2% or 4,534 individuals are in the labor force, with 4.4% or 199 of them unemployed. The age group with the highest labor force participation rate is 30 to 34 years, with 98.5% or 513 individuals in the labor force. Within the labor force, the 16 to 19 years age range has the highest percentage of unemployed individuals, with 12.7% or 34 of them being unemployed.
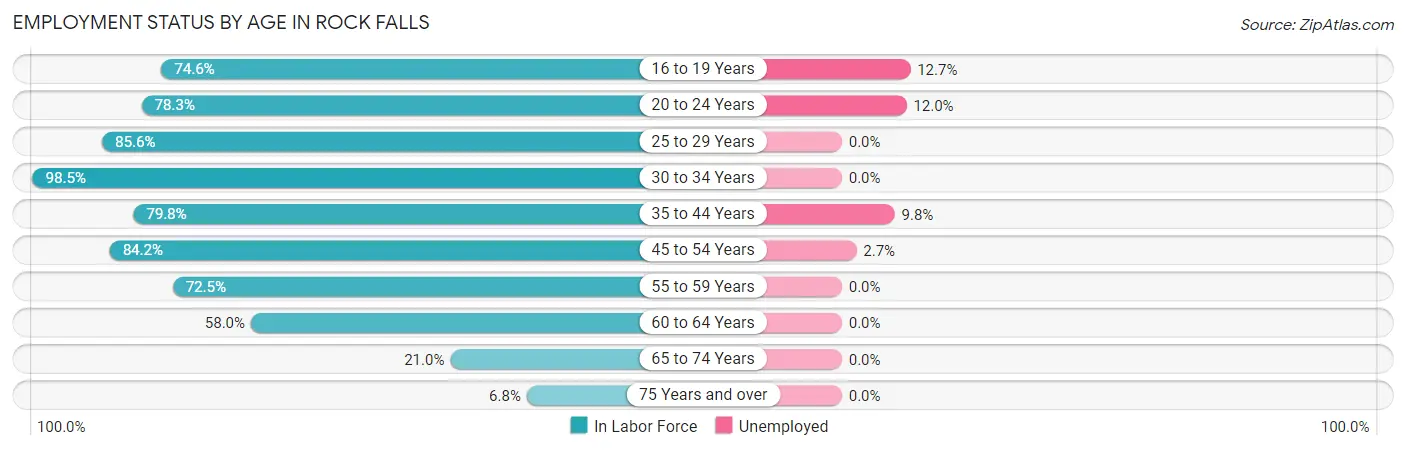
| Age Bracket | In Labor Force | Unemployed |
| 16 to 19 Years | 267 (74.6%) | 34 (12.7%) |
| 20 to 24 Years | 566 (78.3%) | 68 (12.0%) |
| 25 to 29 Years | 488 (85.6%) | 0 (0.0%) |
| 30 to 34 Years | 513 (98.5%) | 0 (0.0%) |
| 35 to 44 Years | 758 (79.8%) | 74 (9.8%) |
| 45 to 54 Years | 932 (84.2%) | 25 (2.7%) |
| 55 to 59 Years | 301 (72.5%) | 0 (0.0%) |
| 60 to 64 Years | 460 (58.0%) | 0 (0.0%) |
| 65 to 74 Years | 200 (21.0%) | 0 (0.0%) |
| 75 Years and over | 46 (6.8%) | 0 (0.0%) |
| Total | 4,534 (64.2%) | 199 (4.4%) |
Employment Status by Educational Attainment in Rock Falls
According to labor force statistics for Rock Falls, 79.2% of individuals (3,450) out of the total population between 25 and 64 years of age (4,356) are in the labor force, with 2.9% or 100 of them being unemployed. The group with the highest labor force participation rate are those with the educational attainment of college / associate degree, with 85.7% or 1,299 individuals in the labor force. Within the labor force, individuals with college / associate degree education have the highest percentage of unemployment, with 3.7% or 48 of them being unemployed.
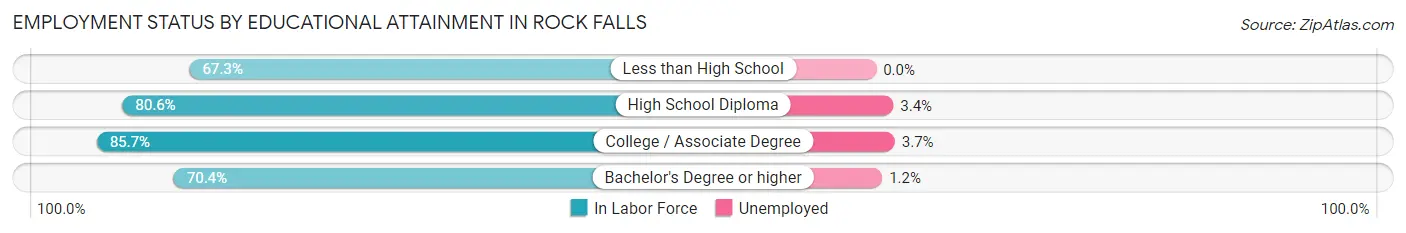
| Educational Attainment | In Labor Force | Unemployed |
| Less than High School | 327 (67.3%) | 0 (0.0%) |
| High School Diploma | 1,328 (80.6%) | 56 (3.4%) |
| College / Associate Degree | 1,299 (85.7%) | 56 (3.7%) |
| Bachelor's Degree or higher | 497 (70.4%) | 8 (1.2%) |
| Total | 3,450 (79.2%) | 126 (2.9%) |
Employment Occupations by Sex in Rock Falls
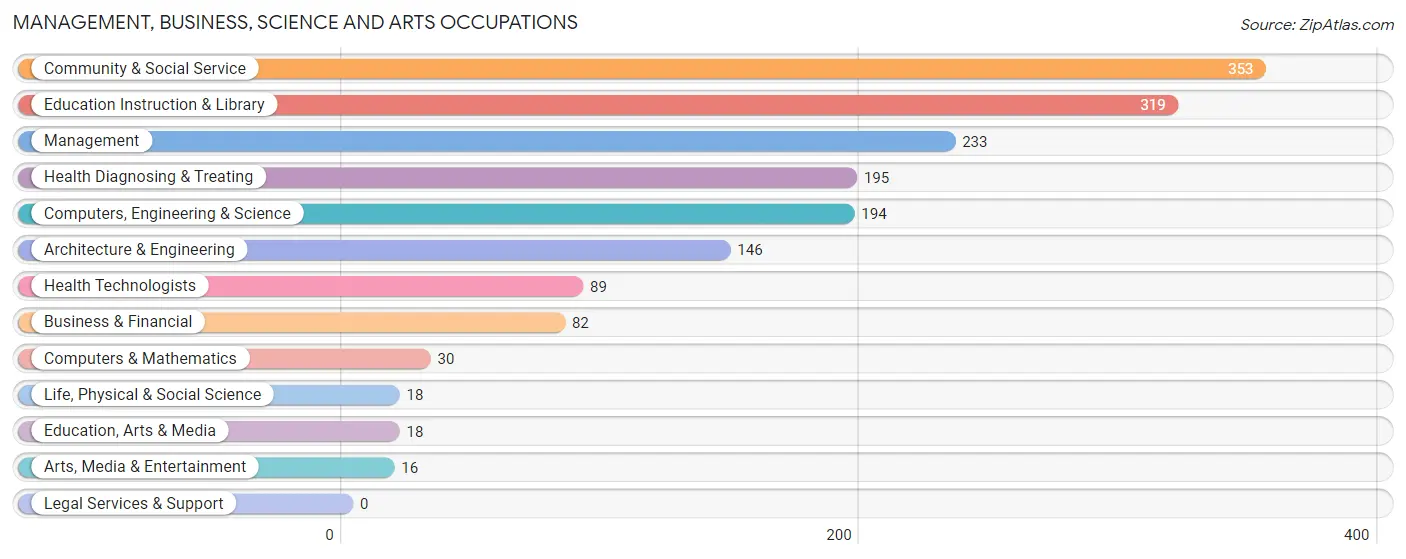
Management, Business, Science and Arts Occupations
The most common Management, Business, Science and Arts occupations in Rock Falls are Community & Social Service (353 | 8.2%), Education Instruction & Library (319 | 7.4%), Management (233 | 5.4%), Health Diagnosing & Treating (195 | 4.5%), and Computers, Engineering & Science (194 | 4.5%).
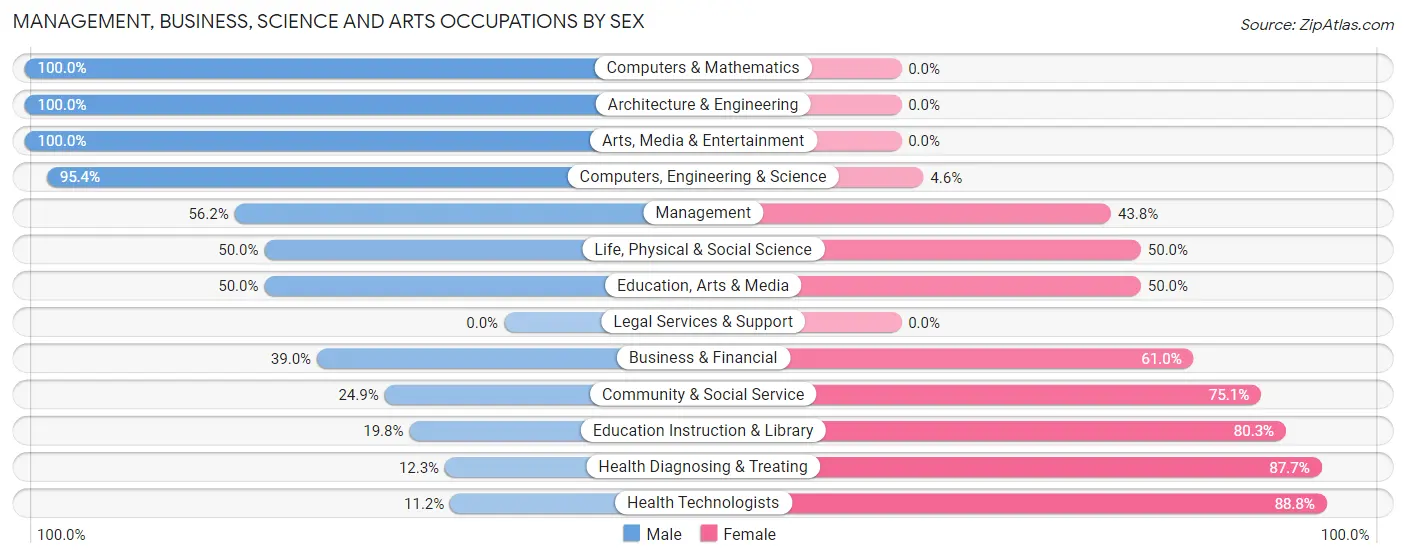
Management, Business, Science and Arts Occupations by Sex
Within the Management, Business, Science and Arts occupations in Rock Falls, the most male-oriented occupations are Computers & Mathematics (100.0%), Architecture & Engineering (100.0%), and Arts, Media & Entertainment (100.0%), while the most female-oriented occupations are Health Technologists (88.8%), Health Diagnosing & Treating (87.7%), and Education Instruction & Library (80.2%).
| Occupation | Male | Female |
| Management | 131 (56.2%) | 102 (43.8%) |
| Business & Financial | 32 (39.0%) | 50 (61.0%) |
| Computers, Engineering & Science | 185 (95.4%) | 9 (4.6%) |
| Computers & Mathematics | 30 (100.0%) | 0 (0.0%) |
| Architecture & Engineering | 146 (100.0%) | 0 (0.0%) |
| Life, Physical & Social Science | 9 (50.0%) | 9 (50.0%) |
| Community & Social Service | 88 (24.9%) | 265 (75.1%) |
| Education, Arts & Media | 9 (50.0%) | 9 (50.0%) |
| Legal Services & Support | 0 (0.0%) | 0 (0.0%) |
| Education Instruction & Library | 63 (19.8%) | 256 (80.2%) |
| Arts, Media & Entertainment | 16 (100.0%) | 0 (0.0%) |
| Health Diagnosing & Treating | 24 (12.3%) | 171 (87.7%) |
| Health Technologists | 10 (11.2%) | 79 (88.8%) |
| Total (Category) | 460 (43.5%) | 597 (56.5%) |
| Total (Overall) | 2,391 (55.2%) | 1,939 (44.8%) |
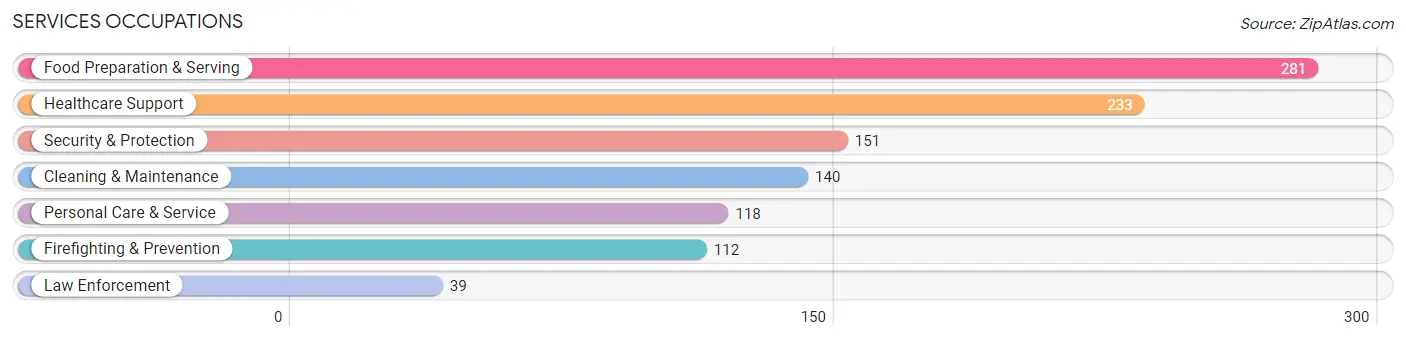
Services Occupations
The most common Services occupations in Rock Falls are Food Preparation & Serving (281 | 6.5%), Healthcare Support (233 | 5.4%), Security & Protection (151 | 3.5%), Cleaning & Maintenance (140 | 3.2%), and Personal Care & Service (118 | 2.7%).
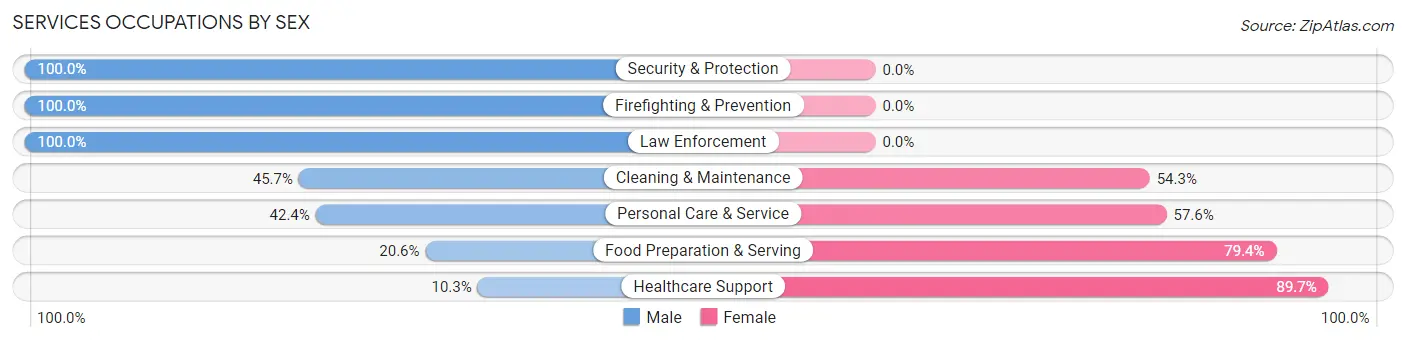
Services Occupations by Sex
Within the Services occupations in Rock Falls, the most male-oriented occupations are Security & Protection (100.0%), Firefighting & Prevention (100.0%), and Law Enforcement (100.0%), while the most female-oriented occupations are Healthcare Support (89.7%), Food Preparation & Serving (79.4%), and Personal Care & Service (57.6%).
| Occupation | Male | Female |
| Healthcare Support | 24 (10.3%) | 209 (89.7%) |
| Security & Protection | 151 (100.0%) | 0 (0.0%) |
| Firefighting & Prevention | 112 (100.0%) | 0 (0.0%) |
| Law Enforcement | 39 (100.0%) | 0 (0.0%) |
| Food Preparation & Serving | 58 (20.6%) | 223 (79.4%) |
| Cleaning & Maintenance | 64 (45.7%) | 76 (54.3%) |
| Personal Care & Service | 50 (42.4%) | 68 (57.6%) |
| Total (Category) | 347 (37.6%) | 576 (62.4%) |
| Total (Overall) | 2,391 (55.2%) | 1,939 (44.8%) |
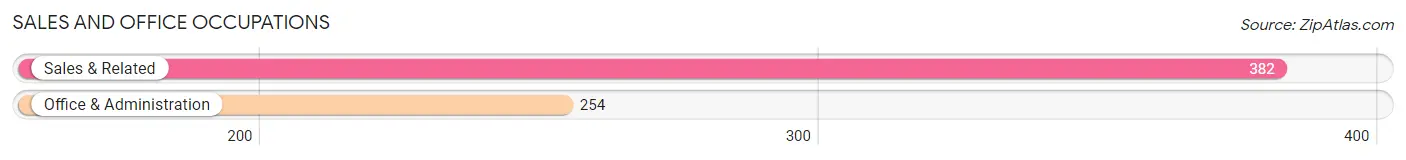
Sales and Office Occupations
The most common Sales and Office occupations in Rock Falls are Sales & Related (382 | 8.8%), and Office & Administration (254 | 5.9%).
Sales and Office Occupations by Sex
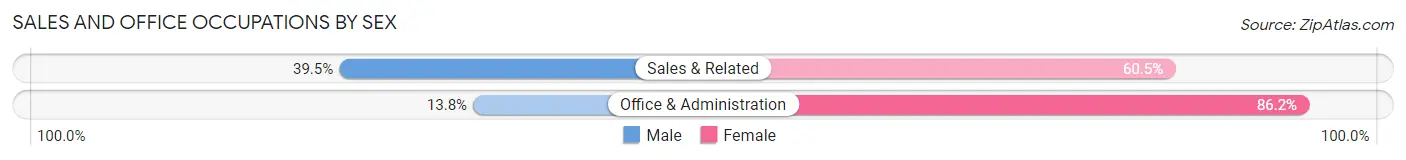
| Occupation | Male | Female |
| Sales & Related | 151 (39.5%) | 231 (60.5%) |
| Office & Administration | 35 (13.8%) | 219 (86.2%) |
| Total (Category) | 186 (29.2%) | 450 (70.8%) |
| Total (Overall) | 2,391 (55.2%) | 1,939 (44.8%) |
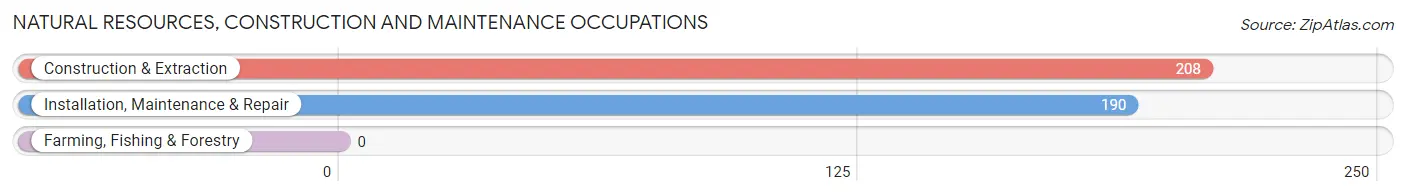
Natural Resources, Construction and Maintenance Occupations
The most common Natural Resources, Construction and Maintenance occupations in Rock Falls are Construction & Extraction (208 | 4.8%), and Installation, Maintenance & Repair (190 | 4.4%).
Natural Resources, Construction and Maintenance Occupations by Sex
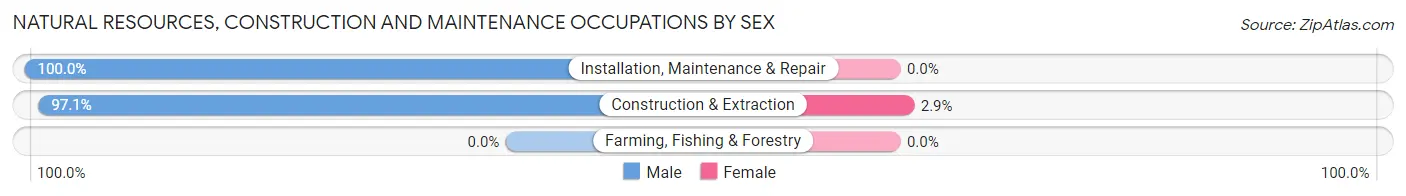
| Occupation | Male | Female |
| Farming, Fishing & Forestry | 0 (0.0%) | 0 (0.0%) |
| Construction & Extraction | 202 (97.1%) | 6 (2.9%) |
| Installation, Maintenance & Repair | 190 (100.0%) | 0 (0.0%) |
| Total (Category) | 392 (98.5%) | 6 (1.5%) |
| Total (Overall) | 2,391 (55.2%) | 1,939 (44.8%) |
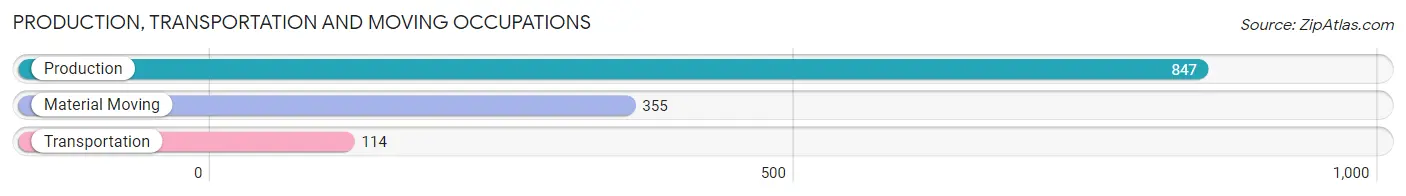
Production, Transportation and Moving Occupations
The most common Production, Transportation and Moving occupations in Rock Falls are Production (847 | 19.6%), Material Moving (355 | 8.2%), and Transportation (114 | 2.6%).
Production, Transportation and Moving Occupations by Sex
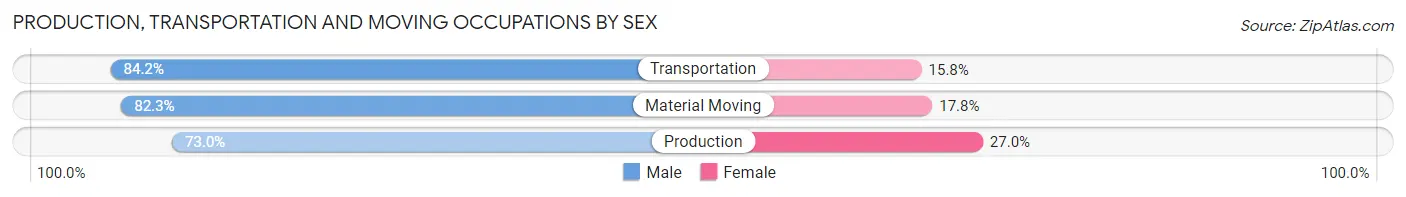
| Occupation | Male | Female |
| Production | 618 (73.0%) | 229 (27.0%) |
| Transportation | 96 (84.2%) | 18 (15.8%) |
| Material Moving | 292 (82.3%) | 63 (17.7%) |
| Total (Category) | 1,006 (76.4%) | 310 (23.6%) |
| Total (Overall) | 2,391 (55.2%) | 1,939 (44.8%) |
Employment Industries by Sex in Rock Falls
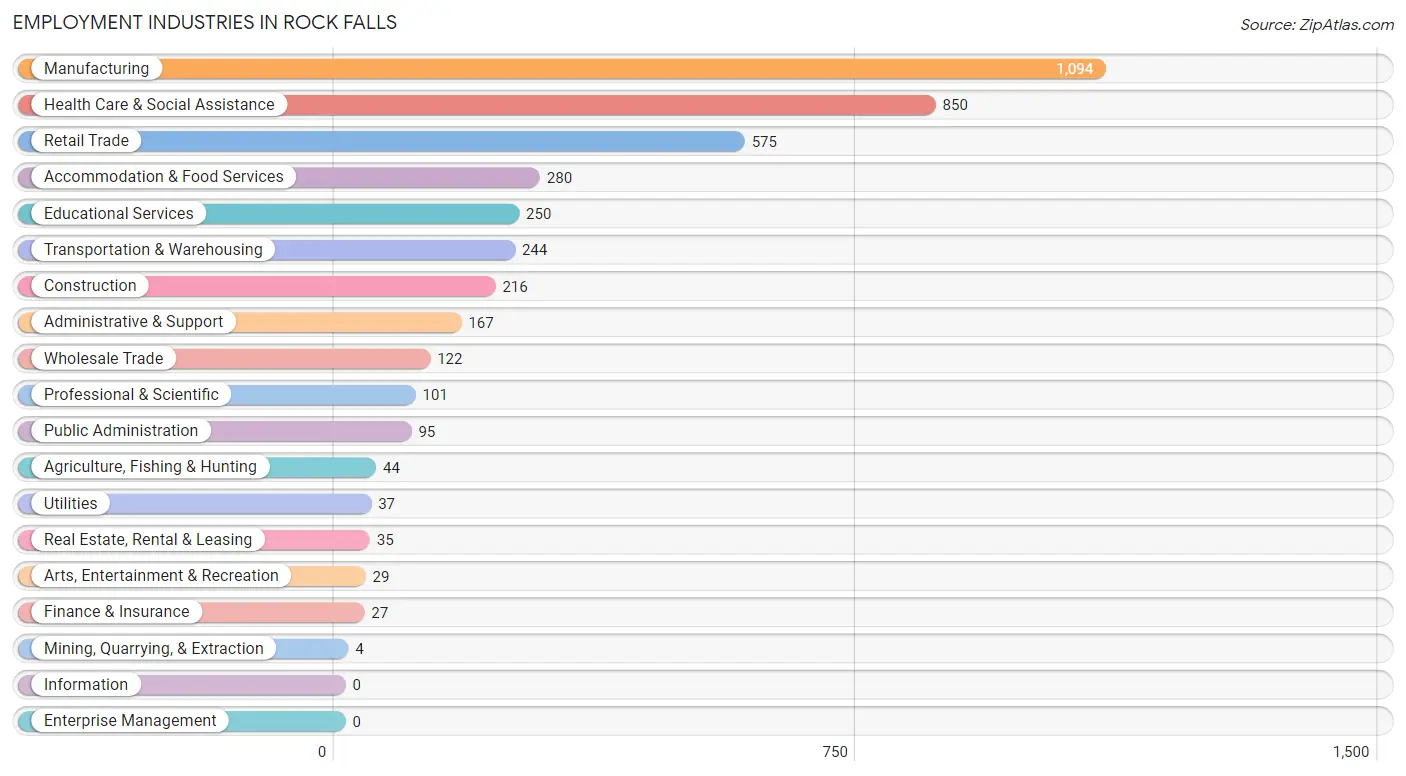
Employment Industries in Rock Falls
The major employment industries in Rock Falls include Manufacturing (1,094 | 25.3%), Health Care & Social Assistance (850 | 19.6%), Retail Trade (575 | 13.3%), Accommodation & Food Services (280 | 6.5%), and Educational Services (250 | 5.8%).
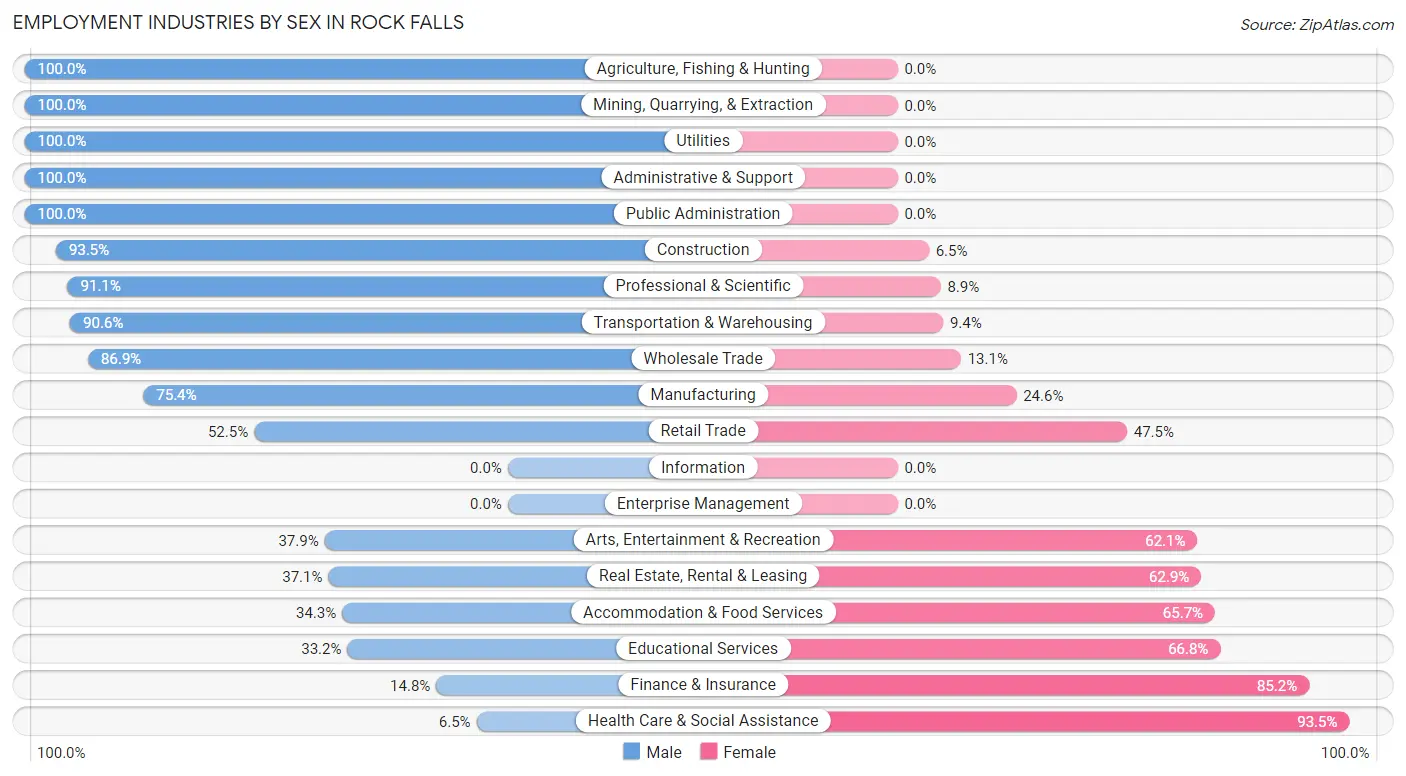
Employment Industries by Sex in Rock Falls
The Rock Falls industries that see more men than women are Agriculture, Fishing & Hunting (100.0%), Mining, Quarrying, & Extraction (100.0%), and Utilities (100.0%), whereas the industries that tend to have a higher number of women are Health Care & Social Assistance (93.5%), Finance & Insurance (85.2%), and Educational Services (66.8%).
| Industry | Male | Female |
| Agriculture, Fishing & Hunting | 44 (100.0%) | 0 (0.0%) |
| Mining, Quarrying, & Extraction | 4 (100.0%) | 0 (0.0%) |
| Construction | 202 (93.5%) | 14 (6.5%) |
| Manufacturing | 825 (75.4%) | 269 (24.6%) |
| Wholesale Trade | 106 (86.9%) | 16 (13.1%) |
| Retail Trade | 302 (52.5%) | 273 (47.5%) |
| Transportation & Warehousing | 221 (90.6%) | 23 (9.4%) |
| Utilities | 37 (100.0%) | 0 (0.0%) |
| Information | 0 (0.0%) | 0 (0.0%) |
| Finance & Insurance | 4 (14.8%) | 23 (85.2%) |
| Real Estate, Rental & Leasing | 13 (37.1%) | 22 (62.9%) |
| Professional & Scientific | 92 (91.1%) | 9 (8.9%) |
| Enterprise Management | 0 (0.0%) | 0 (0.0%) |
| Administrative & Support | 167 (100.0%) | 0 (0.0%) |
| Educational Services | 83 (33.2%) | 167 (66.8%) |
| Health Care & Social Assistance | 55 (6.5%) | 795 (93.5%) |
| Arts, Entertainment & Recreation | 11 (37.9%) | 18 (62.1%) |
| Accommodation & Food Services | 96 (34.3%) | 184 (65.7%) |
| Public Administration | 95 (100.0%) | 0 (0.0%) |
| Total | 2,391 (55.2%) | 1,939 (44.8%) |
Education in Rock Falls
School Enrollment in Rock Falls
The most common levels of schooling among the 2,019 students in Rock Falls are high school (518 | 25.7%), middle school (492 | 24.4%), and elementary school (316 | 15.7%).
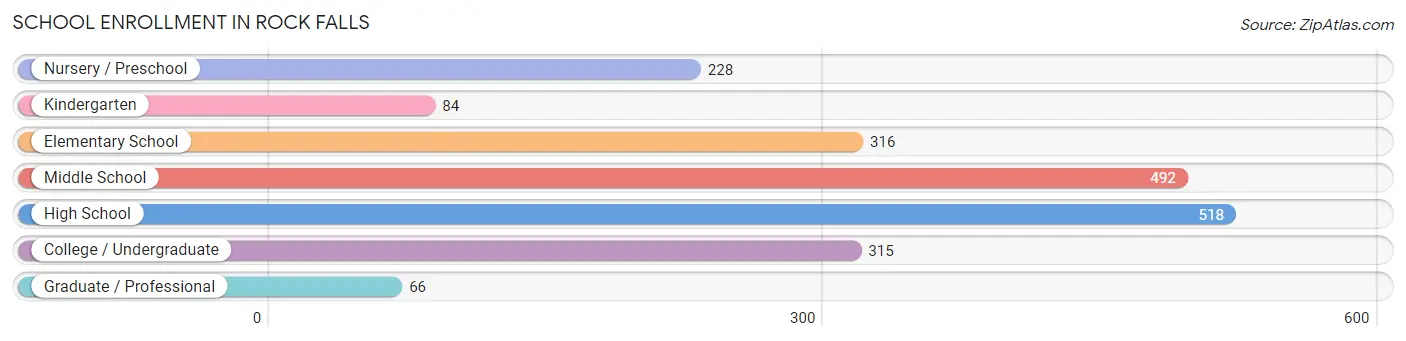
| School Level | # Students | % Students |
| Nursery / Preschool | 228 | 11.3% |
| Kindergarten | 84 | 4.2% |
| Elementary School | 316 | 15.7% |
| Middle School | 492 | 24.4% |
| High School | 518 | 25.7% |
| College / Undergraduate | 315 | 15.6% |
| Graduate / Professional | 66 | 3.3% |
| Total | 2,019 | 100.0% |
School Enrollment by Age by Funding Source in Rock Falls
Out of a total of 2,019 students who are enrolled in schools in Rock Falls, 81 (4.0%) attend a private institution, while the remaining 1,938 (96.0%) are enrolled in public schools. The age group of 18 to 19 year olds has the highest likelihood of being enrolled in private schools, with 16 (51.6% in the age bracket) enrolled. Conversely, the age group of 3 to 4 year olds has the lowest likelihood of being enrolled in a private school, with 219 (100.0% in the age bracket) attending a public institution.
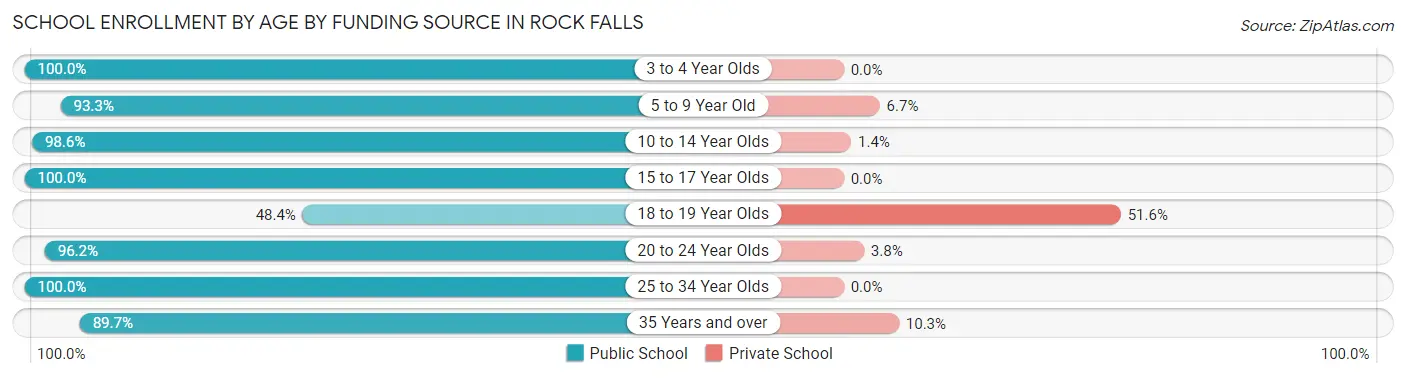
| Age Bracket | Public School | Private School |
| 3 to 4 Year Olds | 219 (100.0%) | 0 (0.0%) |
| 5 to 9 Year Old | 376 (93.3%) | 27 (6.7%) |
| 10 to 14 Year Olds | 642 (98.6%) | 9 (1.4%) |
| 15 to 17 Year Olds | 316 (100.0%) | 0 (0.0%) |
| 18 to 19 Year Olds | 15 (48.4%) | 16 (51.6%) |
| 20 to 24 Year Olds | 153 (96.2%) | 6 (3.8%) |
| 25 to 34 Year Olds | 26 (100.0%) | 0 (0.0%) |
| 35 Years and over | 192 (89.7%) | 22 (10.3%) |
| Total | 1,938 (96.0%) | 81 (4.0%) |
Educational Attainment by Field of Study in Rock Falls
Education (298 | 33.5%), business (144 | 16.2%), engineering (95 | 10.7%), bio, nature & agricultural (84 | 9.4%), and science & technology (84 | 9.4%) are the most common fields of study among 891 individuals in Rock Falls who have obtained a bachelor's degree or higher.
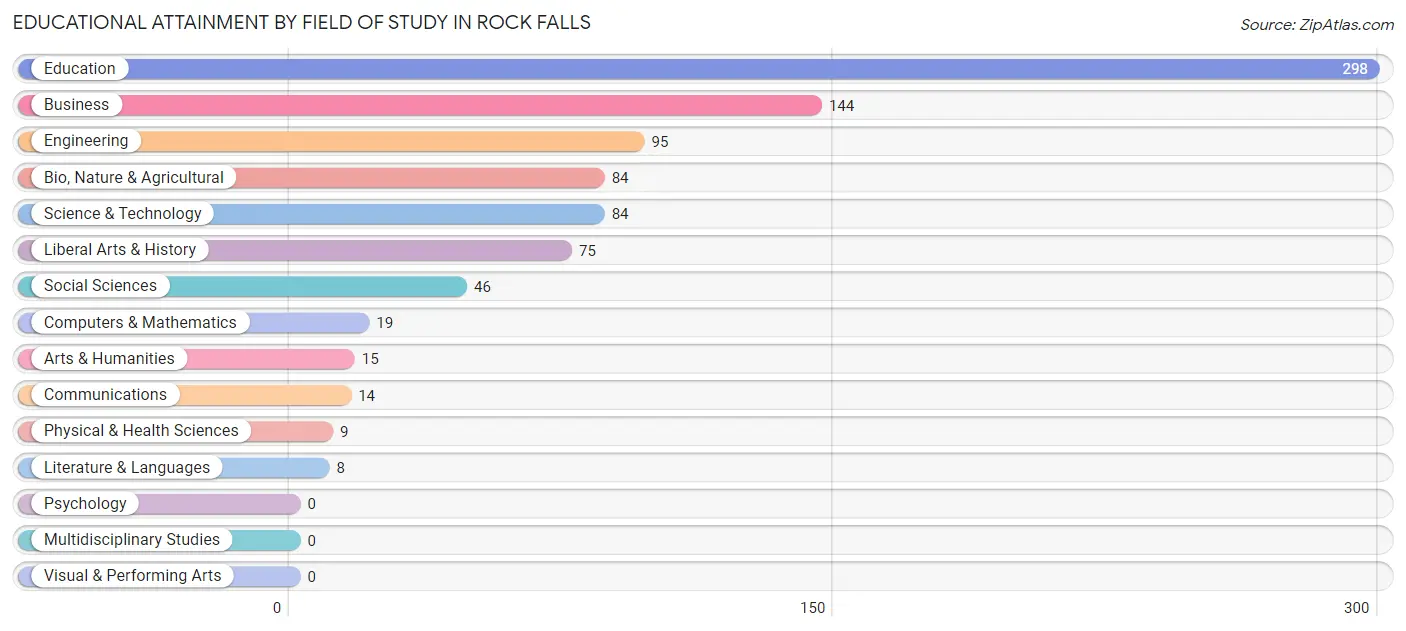
| Field of Study | # Graduates | % Graduates |
| Computers & Mathematics | 19 | 2.1% |
| Bio, Nature & Agricultural | 84 | 9.4% |
| Physical & Health Sciences | 9 | 1.0% |
| Psychology | 0 | 0.0% |
| Social Sciences | 46 | 5.2% |
| Engineering | 95 | 10.7% |
| Multidisciplinary Studies | 0 | 0.0% |
| Science & Technology | 84 | 9.4% |
| Business | 144 | 16.2% |
| Education | 298 | 33.5% |
| Literature & Languages | 8 | 0.9% |
| Liberal Arts & History | 75 | 8.4% |
| Visual & Performing Arts | 0 | 0.0% |
| Communications | 14 | 1.6% |
| Arts & Humanities | 15 | 1.7% |
| Total | 891 | 100.0% |
Transportation & Commute in Rock Falls
Vehicle Availability by Sex in Rock Falls
The most prevalent vehicle ownership categories in Rock Falls are males with 2 vehicles (1,160, accounting for 50.1%) and females with 2 vehicles (846, making up 64.6%).
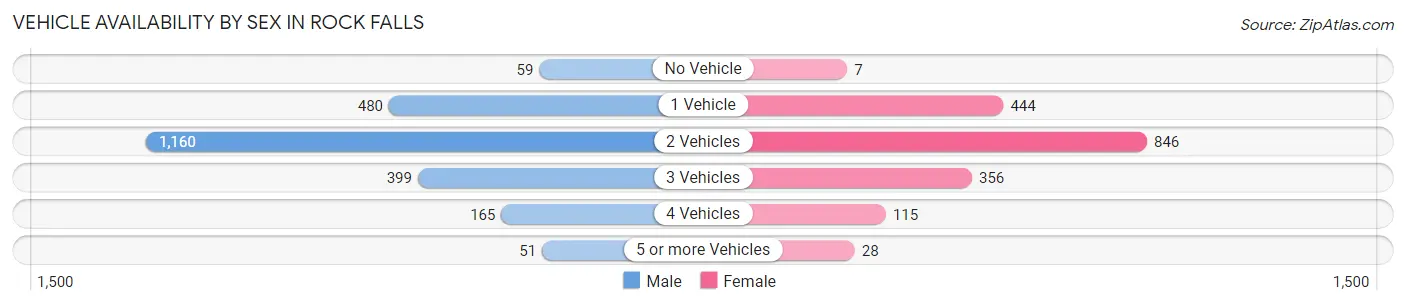
| Vehicles Available | Male | Female |
| No Vehicle | 59 (2.5%) | 7 (0.4%) |
| 1 Vehicle | 480 (20.7%) | 444 (24.7%) |
| 2 Vehicles | 1,160 (50.1%) | 846 (47.1%) |
| 3 Vehicles | 399 (17.2%) | 356 (19.8%) |
| 4 Vehicles | 165 (7.1%) | 115 (6.4%) |
| 5 or more Vehicles | 51 (2.2%) | 28 (1.6%) |
| Total | 2,314 (100.0%) | 1,796 (100.0%) |
Commute Time in Rock Falls
The most frequently occuring commute durations in Rock Falls are 10 to 14 minutes (1,355 commuters, 34.4%), 20 to 24 minutes (688 commuters, 17.4%), and 5 to 9 minutes (578 commuters, 14.7%).
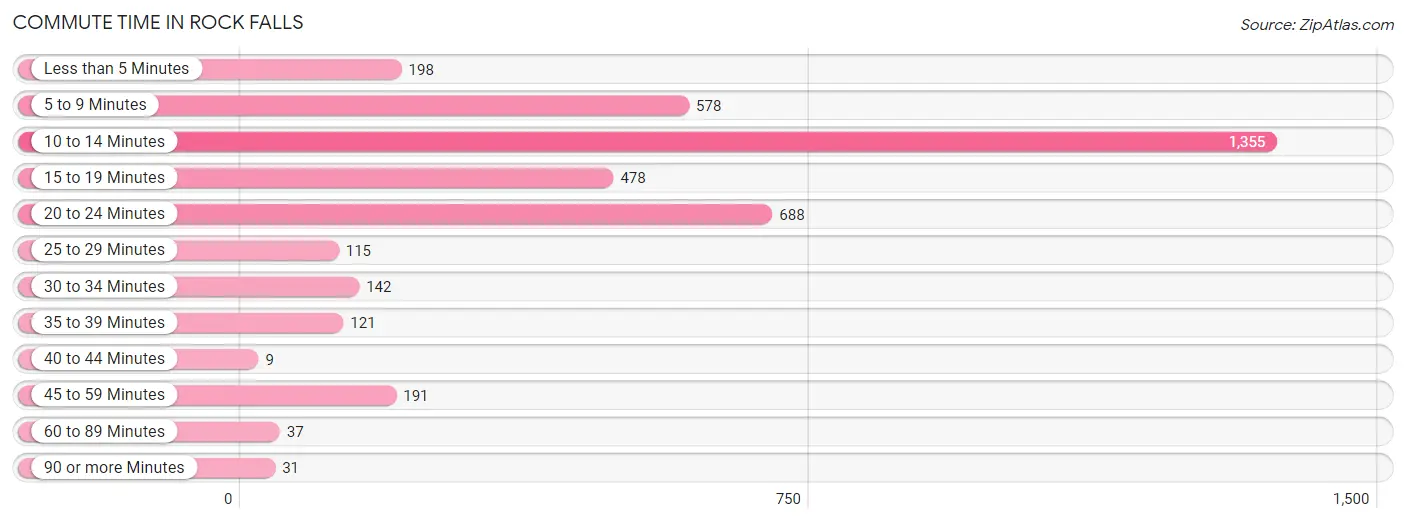
| Commute Time | # Commuters | % Commuters |
| Less than 5 Minutes | 198 | 5.0% |
| 5 to 9 Minutes | 578 | 14.7% |
| 10 to 14 Minutes | 1,355 | 34.4% |
| 15 to 19 Minutes | 478 | 12.1% |
| 20 to 24 Minutes | 688 | 17.4% |
| 25 to 29 Minutes | 115 | 2.9% |
| 30 to 34 Minutes | 142 | 3.6% |
| 35 to 39 Minutes | 121 | 3.1% |
| 40 to 44 Minutes | 9 | 0.2% |
| 45 to 59 Minutes | 191 | 4.8% |
| 60 to 89 Minutes | 37 | 0.9% |
| 90 or more Minutes | 31 | 0.8% |
Commute Time by Sex in Rock Falls
The most common commute times in Rock Falls are 10 to 14 minutes (773 commuters, 34.8%) for males and 10 to 14 minutes (582 commuters, 33.9%) for females.
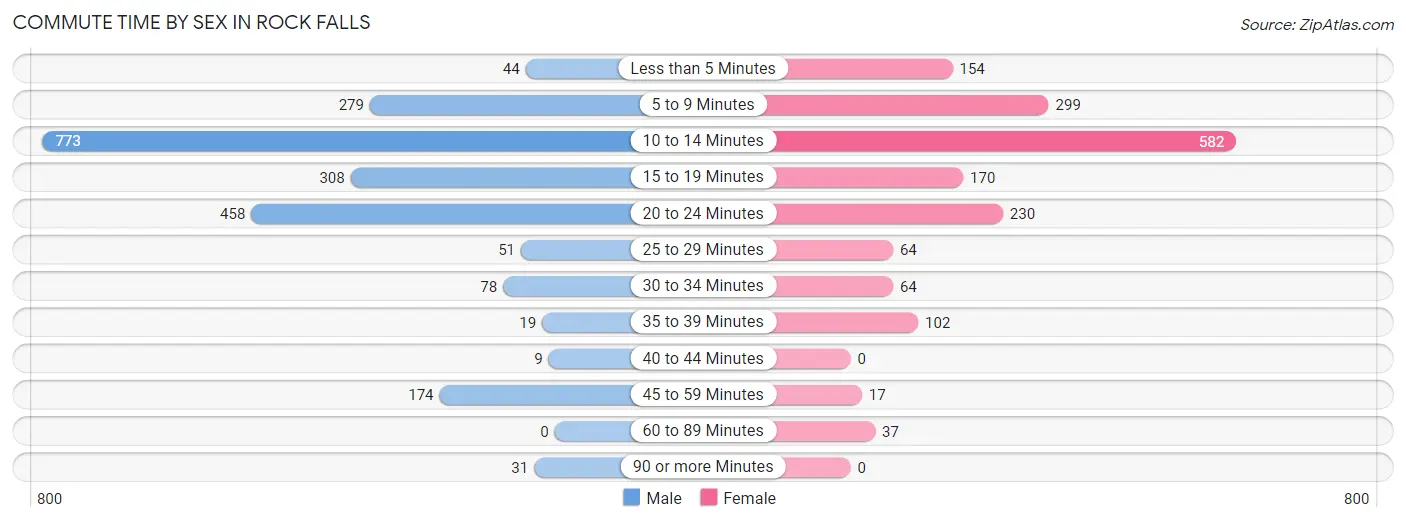
| Commute Time | Male | Female |
| Less than 5 Minutes | 44 (2.0%) | 154 (9.0%) |
| 5 to 9 Minutes | 279 (12.5%) | 299 (17.4%) |
| 10 to 14 Minutes | 773 (34.8%) | 582 (33.9%) |
| 15 to 19 Minutes | 308 (13.9%) | 170 (9.9%) |
| 20 to 24 Minutes | 458 (20.6%) | 230 (13.4%) |
| 25 to 29 Minutes | 51 (2.3%) | 64 (3.7%) |
| 30 to 34 Minutes | 78 (3.5%) | 64 (3.7%) |
| 35 to 39 Minutes | 19 (0.9%) | 102 (5.9%) |
| 40 to 44 Minutes | 9 (0.4%) | 0 (0.0%) |
| 45 to 59 Minutes | 174 (7.8%) | 17 (1.0%) |
| 60 to 89 Minutes | 0 (0.0%) | 37 (2.1%) |
| 90 or more Minutes | 31 (1.4%) | 0 (0.0%) |
Time of Departure to Work by Sex in Rock Falls
The most frequent times of departure to work in Rock Falls are 12:00 AM to 4:59 AM (374, 16.8%) for males and 6:30 AM to 6:59 AM (297, 17.3%) for females.
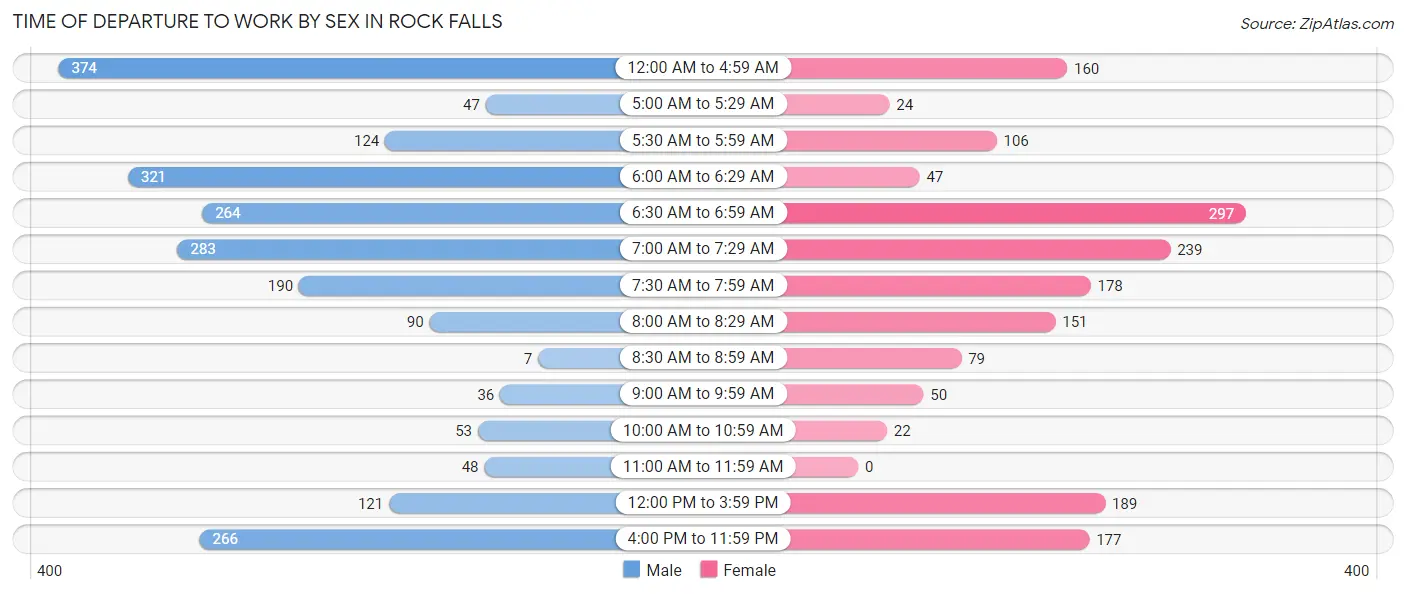
| Time of Departure | Male | Female |
| 12:00 AM to 4:59 AM | 374 (16.8%) | 160 (9.3%) |
| 5:00 AM to 5:29 AM | 47 (2.1%) | 24 (1.4%) |
| 5:30 AM to 5:59 AM | 124 (5.6%) | 106 (6.2%) |
| 6:00 AM to 6:29 AM | 321 (14.4%) | 47 (2.7%) |
| 6:30 AM to 6:59 AM | 264 (11.9%) | 297 (17.3%) |
| 7:00 AM to 7:29 AM | 283 (12.7%) | 239 (13.9%) |
| 7:30 AM to 7:59 AM | 190 (8.5%) | 178 (10.3%) |
| 8:00 AM to 8:29 AM | 90 (4.1%) | 151 (8.8%) |
| 8:30 AM to 8:59 AM | 7 (0.3%) | 79 (4.6%) |
| 9:00 AM to 9:59 AM | 36 (1.6%) | 50 (2.9%) |
| 10:00 AM to 10:59 AM | 53 (2.4%) | 22 (1.3%) |
| 11:00 AM to 11:59 AM | 48 (2.2%) | 0 (0.0%) |
| 12:00 PM to 3:59 PM | 121 (5.4%) | 189 (11.0%) |
| 4:00 PM to 11:59 PM | 266 (12.0%) | 177 (10.3%) |
| Total | 2,224 (100.0%) | 1,719 (100.0%) |
Housing Occupancy in Rock Falls
Occupancy by Ownership in Rock Falls
Of the total 3,969 dwellings in Rock Falls, owner-occupied units account for 2,576 (64.9%), while renter-occupied units make up 1,393 (35.1%).
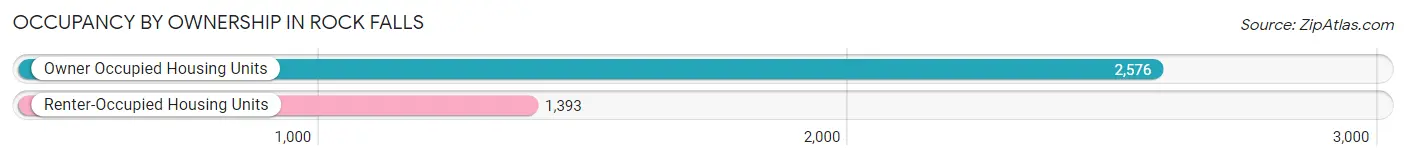
| Occupancy | # Housing Units | % Housing Units |
| Owner Occupied Housing Units | 2,576 | 64.9% |
| Renter-Occupied Housing Units | 1,393 | 35.1% |
| Total Occupied Housing Units | 3,969 | 100.0% |
Occupancy by Household Size in Rock Falls
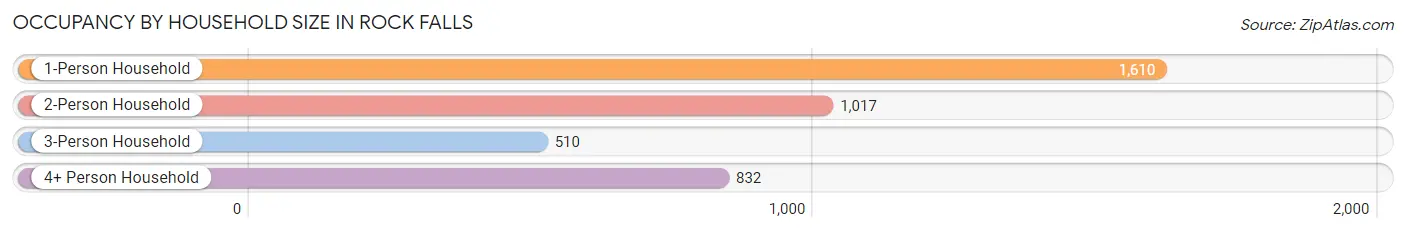
| Household Size | # Housing Units | % Housing Units |
| 1-Person Household | 1,610 | 40.6% |
| 2-Person Household | 1,017 | 25.6% |
| 3-Person Household | 510 | 12.9% |
| 4+ Person Household | 832 | 21.0% |
| Total Housing Units | 3,969 | 100.0% |
Occupancy by Ownership by Household Size in Rock Falls
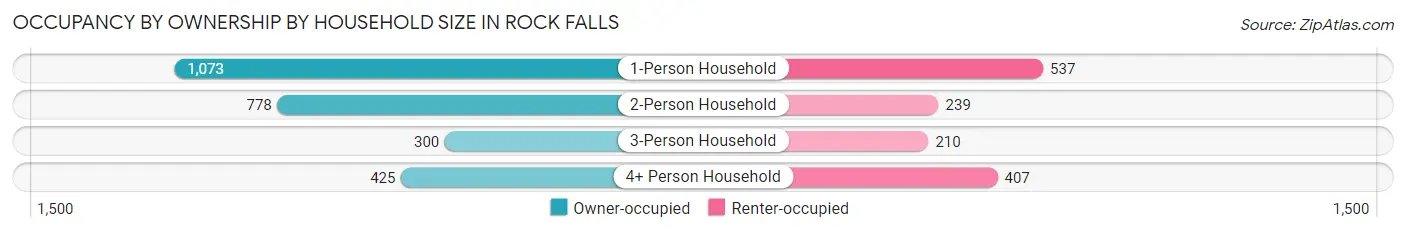
| Household Size | Owner-occupied | Renter-occupied |
| 1-Person Household | 1,073 (66.6%) | 537 (33.4%) |
| 2-Person Household | 778 (76.5%) | 239 (23.5%) |
| 3-Person Household | 300 (58.8%) | 210 (41.2%) |
| 4+ Person Household | 425 (51.1%) | 407 (48.9%) |
| Total Housing Units | 2,576 (64.9%) | 1,393 (35.1%) |
Occupancy by Educational Attainment in Rock Falls
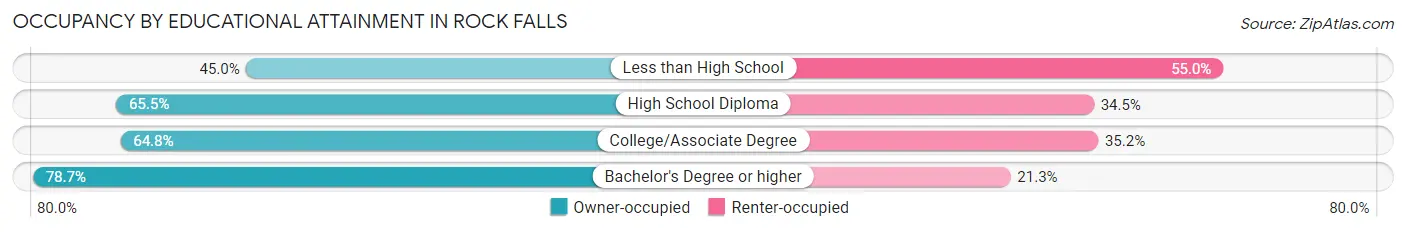
| Household Size | Owner-occupied | Renter-occupied |
| Less than High School | 214 (45.0%) | 262 (55.0%) |
| High School Diploma | 951 (65.5%) | 501 (34.5%) |
| College/Associate Degree | 912 (64.8%) | 495 (35.2%) |
| Bachelor's Degree or higher | 499 (78.7%) | 135 (21.3%) |
Occupancy by Age of Householder in Rock Falls
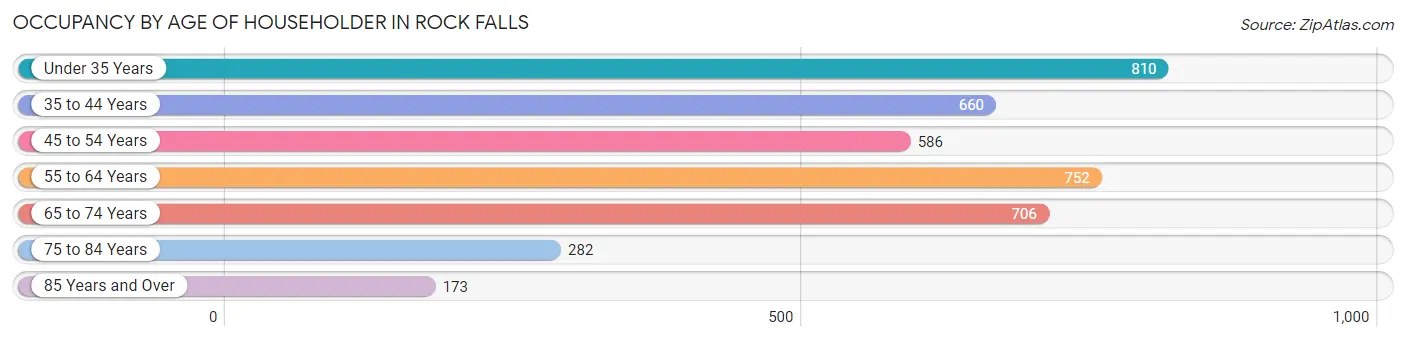
| Age Bracket | # Households | % Households |
| Under 35 Years | 810 | 20.4% |
| 35 to 44 Years | 660 | 16.6% |
| 45 to 54 Years | 586 | 14.8% |
| 55 to 64 Years | 752 | 19.0% |
| 65 to 74 Years | 706 | 17.8% |
| 75 to 84 Years | 282 | 7.1% |
| 85 Years and Over | 173 | 4.4% |
| Total | 3,969 | 100.0% |
Housing Finances in Rock Falls
Median Income by Occupancy in Rock Falls
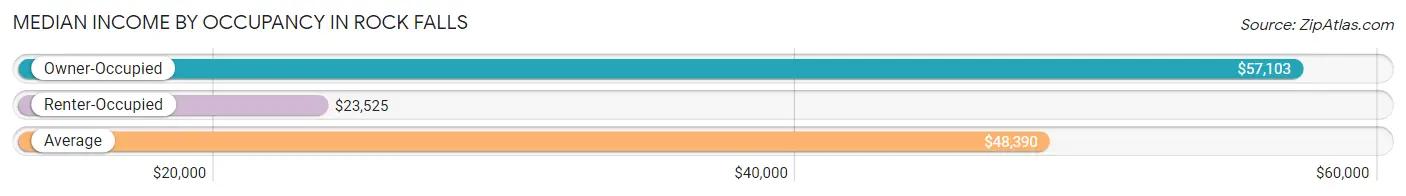
| Occupancy Type | # Households | Median Income |
| Owner-Occupied | 2,576 (64.9%) | $57,103 |
| Renter-Occupied | 1,393 (35.1%) | $23,525 |
| Average | 3,969 (100.0%) | $48,390 |
Occupancy by Householder Income Bracket in Rock Falls
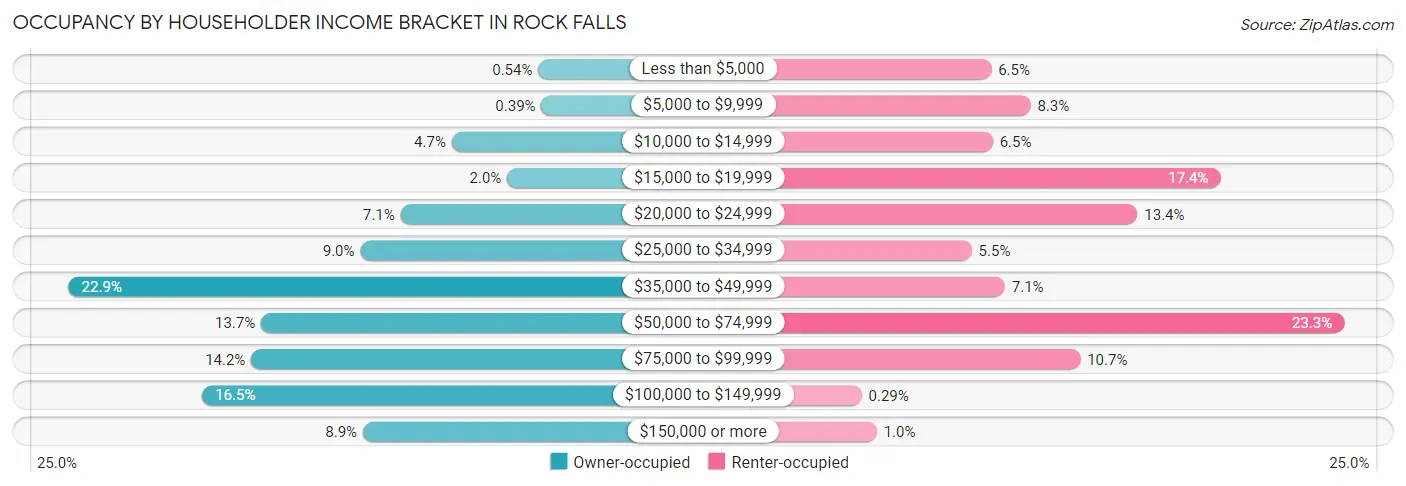
| Income Bracket | Owner-occupied | Renter-occupied |
| Less than $5,000 | 14 (0.5%) | 90 (6.5%) |
| $5,000 to $9,999 | 10 (0.4%) | 116 (8.3%) |
| $10,000 to $14,999 | 120 (4.7%) | 91 (6.5%) |
| $15,000 to $19,999 | 52 (2.0%) | 242 (17.4%) |
| $20,000 to $24,999 | 183 (7.1%) | 187 (13.4%) |
| $25,000 to $34,999 | 232 (9.0%) | 77 (5.5%) |
| $35,000 to $49,999 | 590 (22.9%) | 99 (7.1%) |
| $50,000 to $74,999 | 354 (13.7%) | 324 (23.3%) |
| $75,000 to $99,999 | 366 (14.2%) | 149 (10.7%) |
| $100,000 to $149,999 | 426 (16.5%) | 4 (0.3%) |
| $150,000 or more | 229 (8.9%) | 14 (1.0%) |
| Total | 2,576 (100.0%) | 1,393 (100.0%) |
Monthly Housing Cost Tiers in Rock Falls
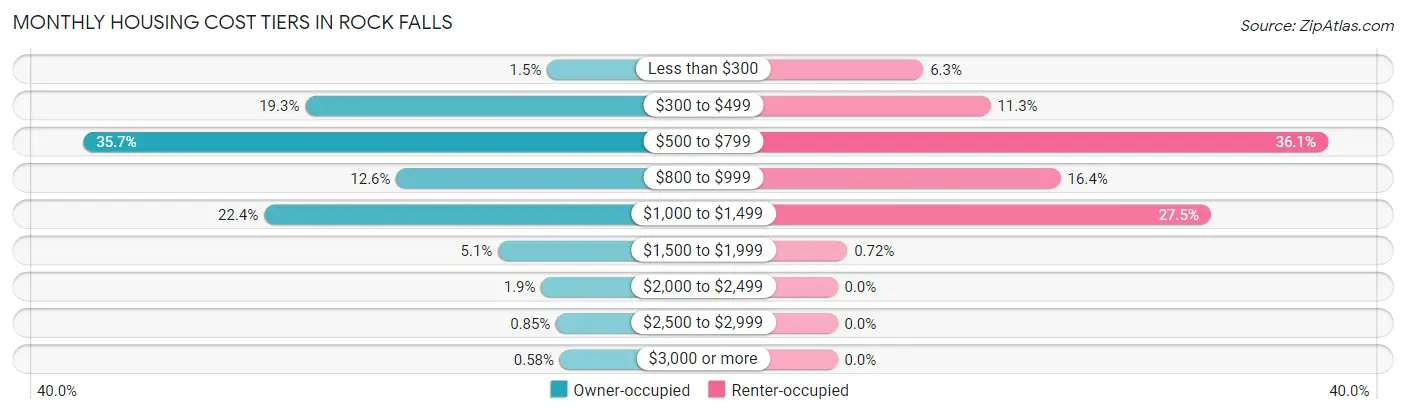
| Monthly Cost | Owner-occupied | Renter-occupied |
| Less than $300 | 39 (1.5%) | 88 (6.3%) |
| $300 to $499 | 498 (19.3%) | 157 (11.3%) |
| $500 to $799 | 919 (35.7%) | 503 (36.1%) |
| $800 to $999 | 325 (12.6%) | 229 (16.4%) |
| $1,000 to $1,499 | 576 (22.4%) | 383 (27.5%) |
| $1,500 to $1,999 | 132 (5.1%) | 10 (0.7%) |
| $2,000 to $2,499 | 50 (1.9%) | 0 (0.0%) |
| $2,500 to $2,999 | 22 (0.9%) | 0 (0.0%) |
| $3,000 or more | 15 (0.6%) | 0 (0.0%) |
| Total | 2,576 (100.0%) | 1,393 (100.0%) |
Physical Housing Characteristics in Rock Falls
Housing Structures in Rock Falls
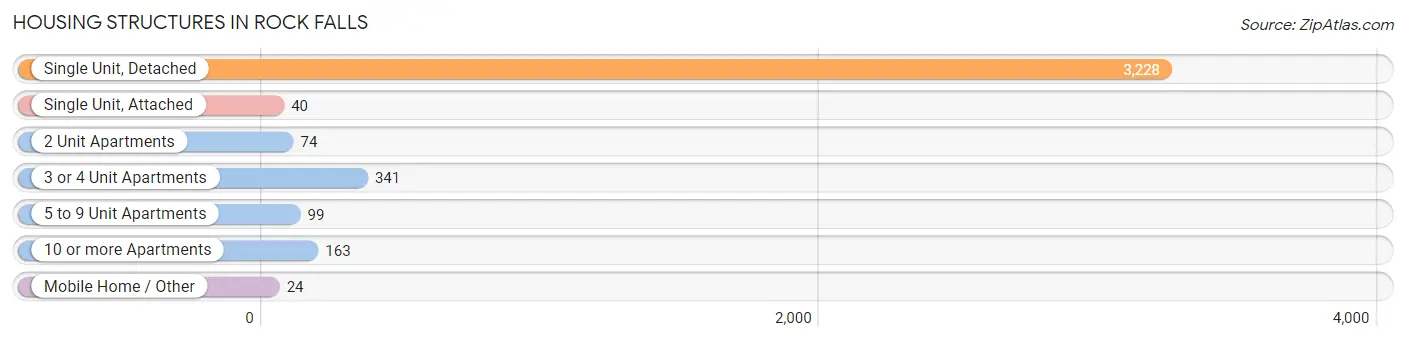
| Structure Type | # Housing Units | % Housing Units |
| Single Unit, Detached | 3,228 | 81.3% |
| Single Unit, Attached | 40 | 1.0% |
| 2 Unit Apartments | 74 | 1.9% |
| 3 or 4 Unit Apartments | 341 | 8.6% |
| 5 to 9 Unit Apartments | 99 | 2.5% |
| 10 or more Apartments | 163 | 4.1% |
| Mobile Home / Other | 24 | 0.6% |
| Total | 3,969 | 100.0% |
Housing Structures by Occupancy in Rock Falls
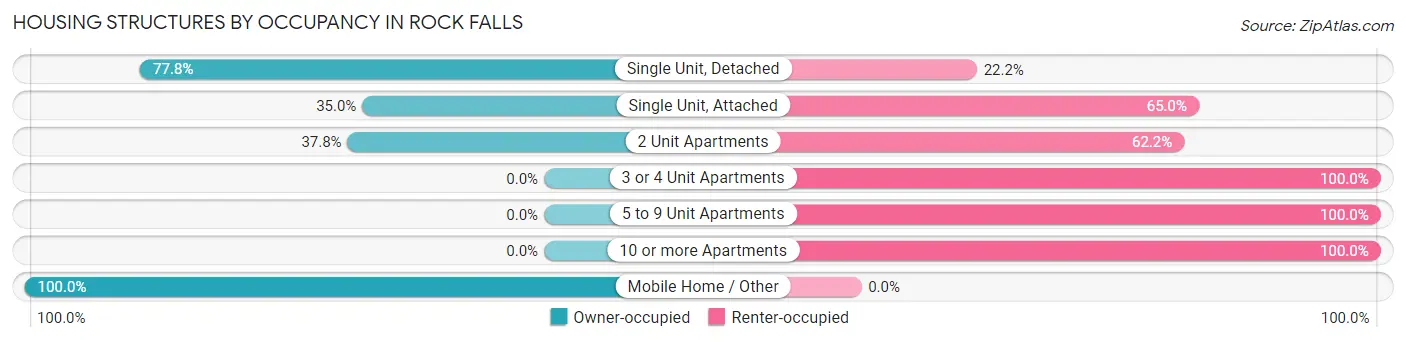
| Structure Type | Owner-occupied | Renter-occupied |
| Single Unit, Detached | 2,510 (77.8%) | 718 (22.2%) |
| Single Unit, Attached | 14 (35.0%) | 26 (65.0%) |
| 2 Unit Apartments | 28 (37.8%) | 46 (62.2%) |
| 3 or 4 Unit Apartments | 0 (0.0%) | 341 (100.0%) |
| 5 to 9 Unit Apartments | 0 (0.0%) | 99 (100.0%) |
| 10 or more Apartments | 0 (0.0%) | 163 (100.0%) |
| Mobile Home / Other | 24 (100.0%) | 0 (0.0%) |
| Total | 2,576 (64.9%) | 1,393 (35.1%) |
Housing Structures by Number of Rooms in Rock Falls
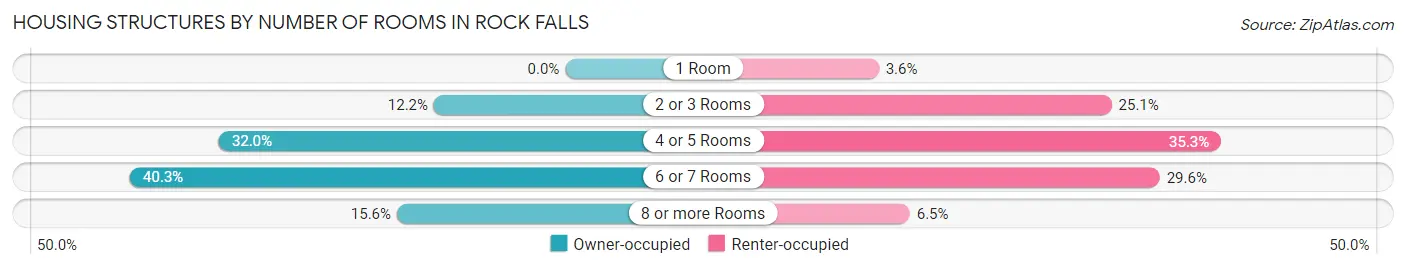
| Number of Rooms | Owner-occupied | Renter-occupied |
| 1 Room | 0 (0.0%) | 50 (3.6%) |
| 2 or 3 Rooms | 313 (12.1%) | 350 (25.1%) |
| 4 or 5 Rooms | 825 (32.0%) | 491 (35.2%) |
| 6 or 7 Rooms | 1,037 (40.3%) | 412 (29.6%) |
| 8 or more Rooms | 401 (15.6%) | 90 (6.5%) |
| Total | 2,576 (100.0%) | 1,393 (100.0%) |
Housing Structure by Heating Type in Rock Falls
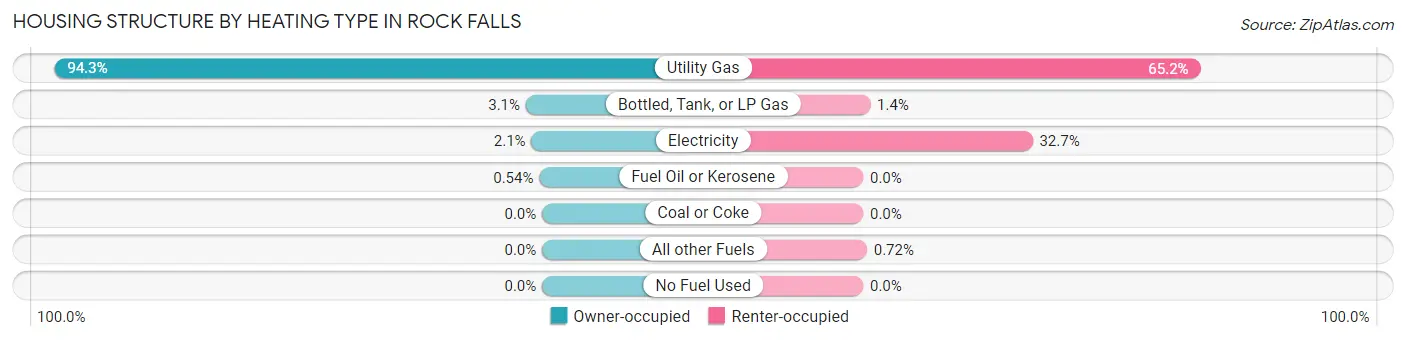
| Heating Type | Owner-occupied | Renter-occupied |
| Utility Gas | 2,428 (94.3%) | 908 (65.2%) |
| Bottled, Tank, or LP Gas | 81 (3.1%) | 19 (1.4%) |
| Electricity | 53 (2.1%) | 456 (32.7%) |
| Fuel Oil or Kerosene | 14 (0.5%) | 0 (0.0%) |
| Coal or Coke | 0 (0.0%) | 0 (0.0%) |
| All other Fuels | 0 (0.0%) | 10 (0.7%) |
| No Fuel Used | 0 (0.0%) | 0 (0.0%) |
| Total | 2,576 (100.0%) | 1,393 (100.0%) |
Household Vehicle Usage in Rock Falls
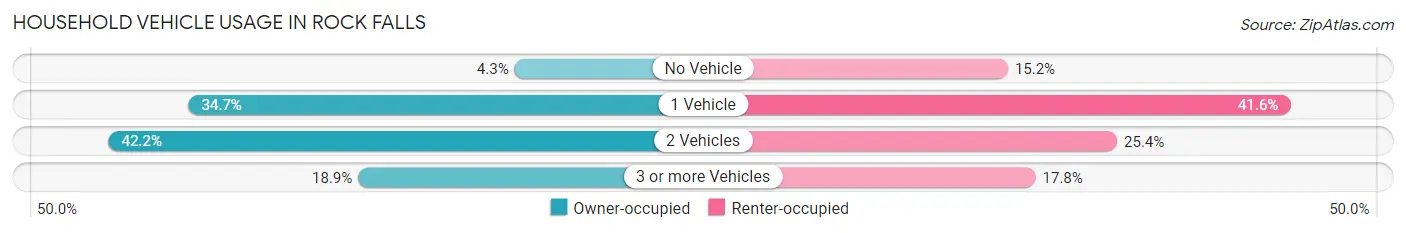
| Vehicles per Household | Owner-occupied | Renter-occupied |
| No Vehicle | 110 (4.3%) | 212 (15.2%) |
| 1 Vehicle | 894 (34.7%) | 579 (41.6%) |
| 2 Vehicles | 1,086 (42.2%) | 354 (25.4%) |
| 3 or more Vehicles | 486 (18.9%) | 248 (17.8%) |
| Total | 2,576 (100.0%) | 1,393 (100.0%) |
Real Estate & Mortgages in Rock Falls
Real Estate and Mortgage Overview in Rock Falls
| Characteristic | Without Mortgage | With Mortgage |
| Housing Units | 963 | 1,613 |
| Median Property Value | $87,400 | $79,200 |
| Median Household Income | $49,554 | $143 |
| Monthly Housing Costs | $515 | $15 |
| Real Estate Taxes | $2,108 | $13 |
Property Value by Mortgage Status in Rock Falls
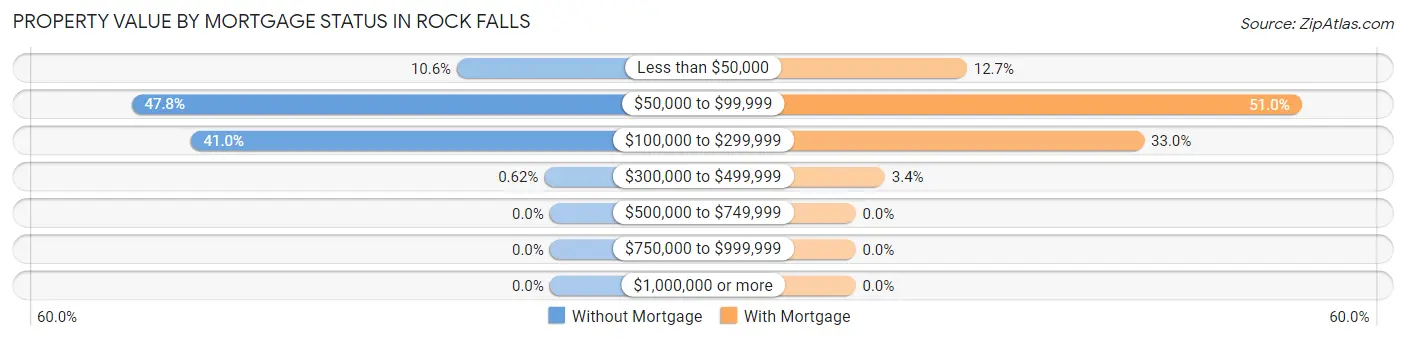
| Property Value | Without Mortgage | With Mortgage |
| Less than $50,000 | 102 (10.6%) | 205 (12.7%) |
| $50,000 to $99,999 | 460 (47.8%) | 822 (51.0%) |
| $100,000 to $299,999 | 395 (41.0%) | 532 (33.0%) |
| $300,000 to $499,999 | 6 (0.6%) | 54 (3.4%) |
| $500,000 to $749,999 | 0 (0.0%) | 0 (0.0%) |
| $750,000 to $999,999 | 0 (0.0%) | 0 (0.0%) |
| $1,000,000 or more | 0 (0.0%) | 0 (0.0%) |
| Total | 963 (100.0%) | 1,613 (100.0%) |
Household Income by Mortgage Status in Rock Falls
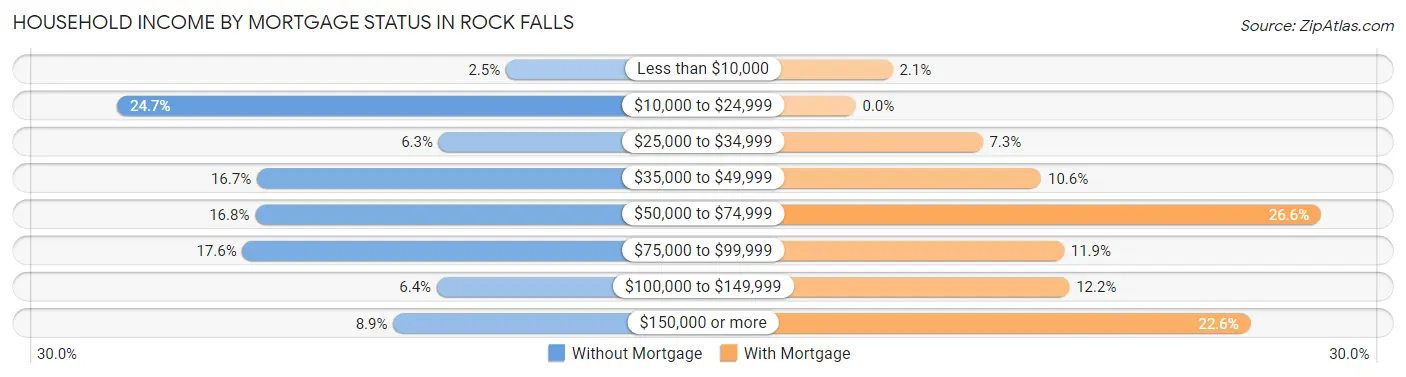
| Household Income | Without Mortgage | With Mortgage |
| Less than $10,000 | 24 (2.5%) | 34 (2.1%) |
| $10,000 to $24,999 | 238 (24.7%) | 0 (0.0%) |
| $25,000 to $34,999 | 61 (6.3%) | 117 (7.2%) |
| $35,000 to $49,999 | 161 (16.7%) | 171 (10.6%) |
| $50,000 to $74,999 | 162 (16.8%) | 429 (26.6%) |
| $75,000 to $99,999 | 169 (17.5%) | 192 (11.9%) |
| $100,000 to $149,999 | 62 (6.4%) | 197 (12.2%) |
| $150,000 or more | 86 (8.9%) | 364 (22.6%) |
| Total | 963 (100.0%) | 1,613 (100.0%) |
Property Value to Household Income Ratio in Rock Falls
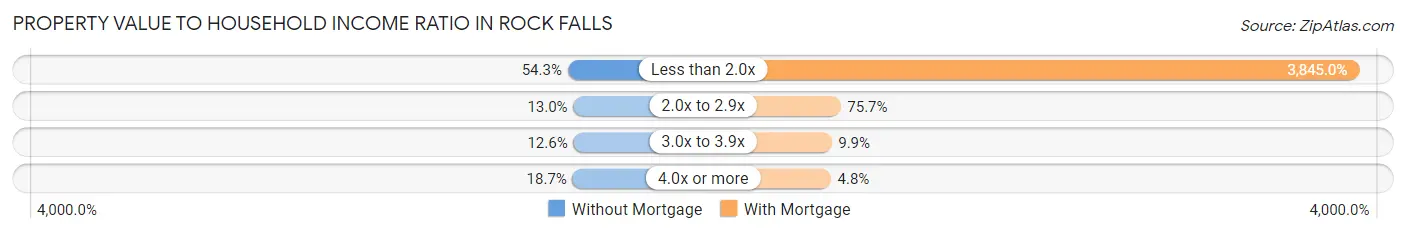
| Value-to-Income Ratio | Without Mortgage | With Mortgage |
| Less than 2.0x | 523 (54.3%) | 62,019 (3,845.0%) |
| 2.0x to 2.9x | 125 (13.0%) | 1,221 (75.7%) |
| 3.0x to 3.9x | 121 (12.6%) | 159 (9.9%) |
| 4.0x or more | 180 (18.7%) | 78 (4.8%) |
| Total | 963 (100.0%) | 1,613 (100.0%) |
Real Estate Taxes by Mortgage Status in Rock Falls
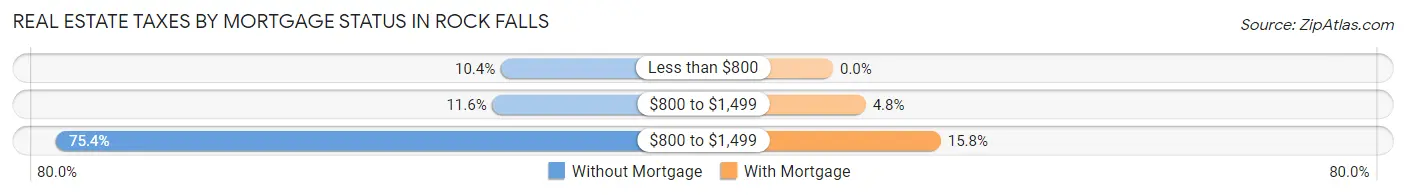
| Property Taxes | Without Mortgage | With Mortgage |
| Less than $800 | 100 (10.4%) | 0 (0.0%) |
| $800 to $1,499 | 112 (11.6%) | 77 (4.8%) |
| $800 to $1,499 | 726 (75.4%) | 254 (15.8%) |
| Total | 963 (100.0%) | 1,613 (100.0%) |
Health & Disability in Rock Falls
Health Insurance Coverage by Age in Rock Falls
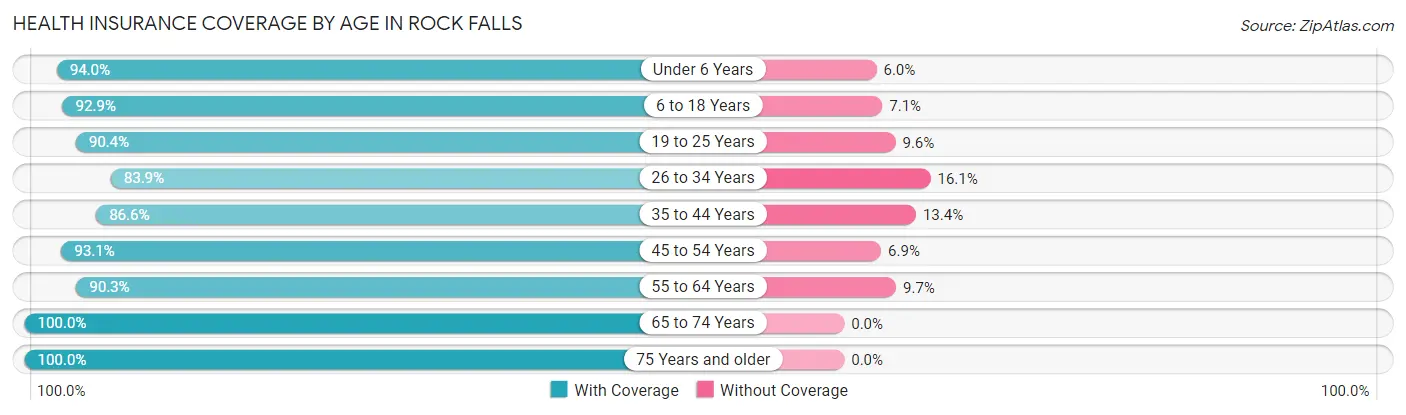
| Age Bracket | With Coverage | Without Coverage |
| Under 6 Years | 672 (94.0%) | 43 (6.0%) |
| 6 to 18 Years | 1,297 (92.9%) | 99 (7.1%) |
| 19 to 25 Years | 776 (90.4%) | 82 (9.6%) |
| 26 to 34 Years | 871 (83.9%) | 167 (16.1%) |
| 35 to 44 Years | 797 (86.6%) | 123 (13.4%) |
| 45 to 54 Years | 1,031 (93.1%) | 76 (6.9%) |
| 55 to 64 Years | 1,075 (90.3%) | 115 (9.7%) |
| 65 to 74 Years | 953 (100.0%) | 0 (0.0%) |
| 75 Years and older | 655 (100.0%) | 0 (0.0%) |
| Total | 8,127 (92.0%) | 705 (8.0%) |
Health Insurance Coverage by Citizenship Status in Rock Falls
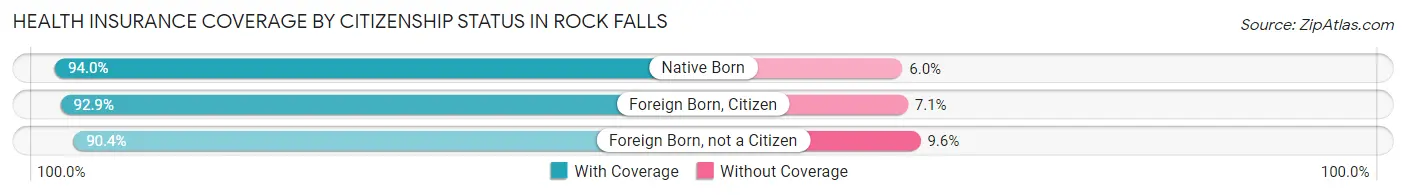
| Citizenship Status | With Coverage | Without Coverage |
| Native Born | 672 (94.0%) | 43 (6.0%) |
| Foreign Born, Citizen | 1,297 (92.9%) | 99 (7.1%) |
| Foreign Born, not a Citizen | 776 (90.4%) | 82 (9.6%) |
Health Insurance Coverage by Household Income in Rock Falls
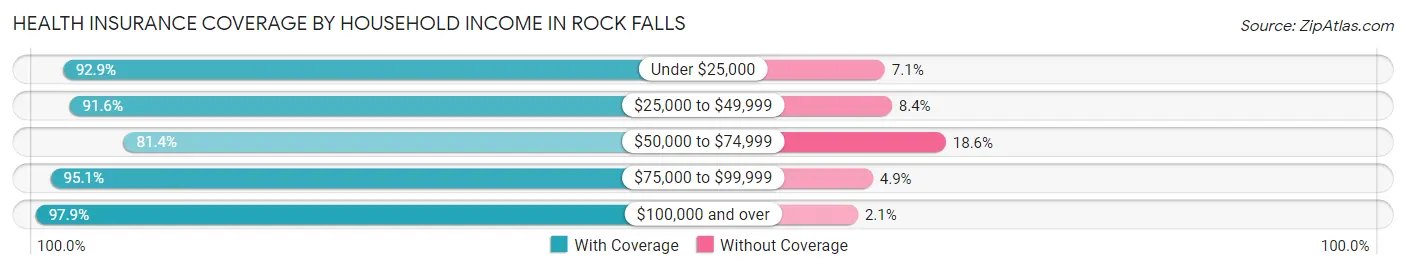
| Household Income | With Coverage | Without Coverage |
| Under $25,000 | 1,809 (92.9%) | 139 (7.1%) |
| $25,000 to $49,999 | 1,562 (91.6%) | 144 (8.4%) |
| $50,000 to $74,999 | 1,369 (81.4%) | 312 (18.6%) |
| $75,000 to $99,999 | 1,287 (95.1%) | 66 (4.9%) |
| $100,000 and over | 2,057 (97.9%) | 44 (2.1%) |
Public vs Private Health Insurance Coverage by Age in Rock Falls
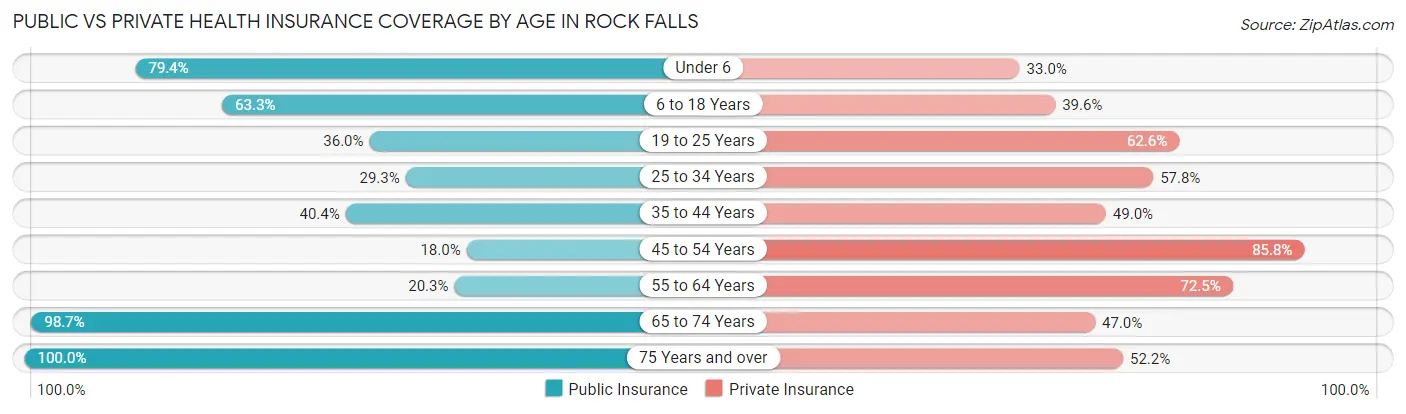
| Age Bracket | Public Insurance | Private Insurance |
| Under 6 | 568 (79.4%) | 236 (33.0%) |
| 6 to 18 Years | 884 (63.3%) | 553 (39.6%) |
| 19 to 25 Years | 309 (36.0%) | 537 (62.6%) |
| 25 to 34 Years | 304 (29.3%) | 600 (57.8%) |
| 35 to 44 Years | 372 (40.4%) | 451 (49.0%) |
| 45 to 54 Years | 199 (18.0%) | 950 (85.8%) |
| 55 to 64 Years | 241 (20.3%) | 863 (72.5%) |
| 65 to 74 Years | 941 (98.7%) | 448 (47.0%) |
| 75 Years and over | 655 (100.0%) | 342 (52.2%) |
| Total | 4,473 (50.6%) | 4,980 (56.4%) |
Disability Status by Sex by Age in Rock Falls
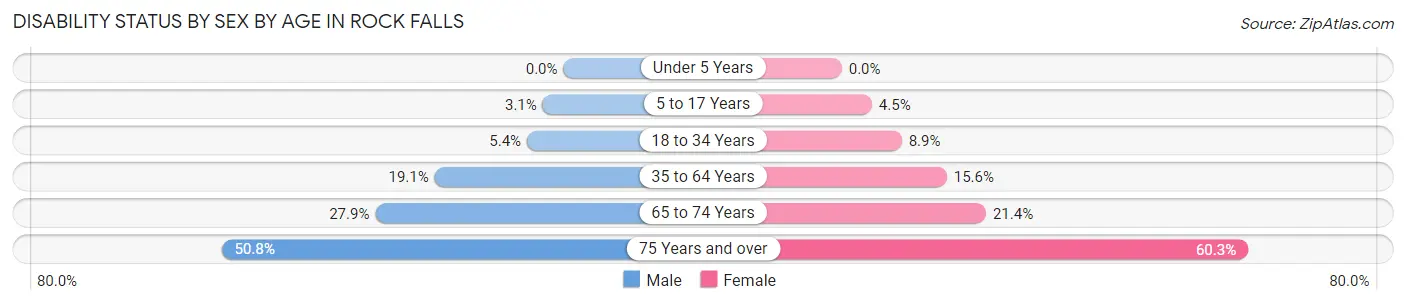
| Age Bracket | Male | Female |
| Under 5 Years | 0 (0.0%) | 0 (0.0%) |
| 5 to 17 Years | 20 (3.1%) | 36 (4.5%) |
| 18 to 34 Years | 52 (5.4%) | 86 (8.9%) |
| 35 to 64 Years | 305 (19.1%) | 253 (15.6%) |
| 65 to 74 Years | 124 (27.9%) | 109 (21.4%) |
| 75 Years and over | 133 (50.8%) | 237 (60.3%) |
Disability Class by Sex by Age in Rock Falls
Disability Class: Hearing Difficulty
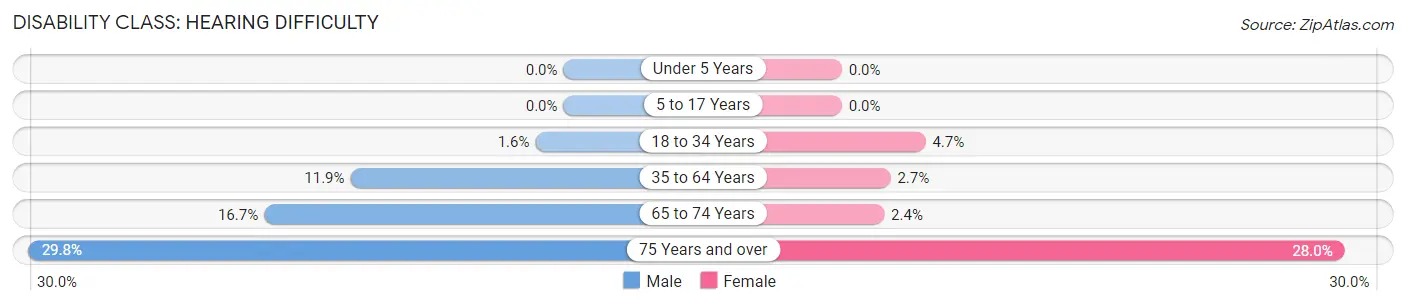
| Age Bracket | Male | Female |
| Under 5 Years | 0 (0.0%) | 0 (0.0%) |
| 5 to 17 Years | 0 (0.0%) | 0 (0.0%) |
| 18 to 34 Years | 15 (1.6%) | 45 (4.7%) |
| 35 to 64 Years | 189 (11.9%) | 44 (2.7%) |
| 65 to 74 Years | 74 (16.7%) | 12 (2.4%) |
| 75 Years and over | 78 (29.8%) | 110 (28.0%) |
Disability Class: Vision Difficulty
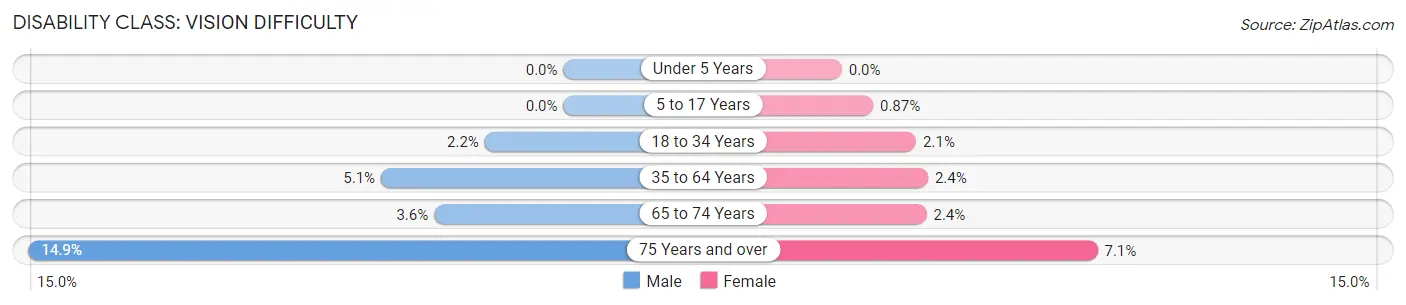
| Age Bracket | Male | Female |
| Under 5 Years | 0 (0.0%) | 0 (0.0%) |
| 5 to 17 Years | 0 (0.0%) | 7 (0.9%) |
| 18 to 34 Years | 21 (2.2%) | 20 (2.1%) |
| 35 to 64 Years | 81 (5.1%) | 39 (2.4%) |
| 65 to 74 Years | 16 (3.6%) | 12 (2.4%) |
| 75 Years and over | 39 (14.9%) | 28 (7.1%) |
Disability Class: Cognitive Difficulty
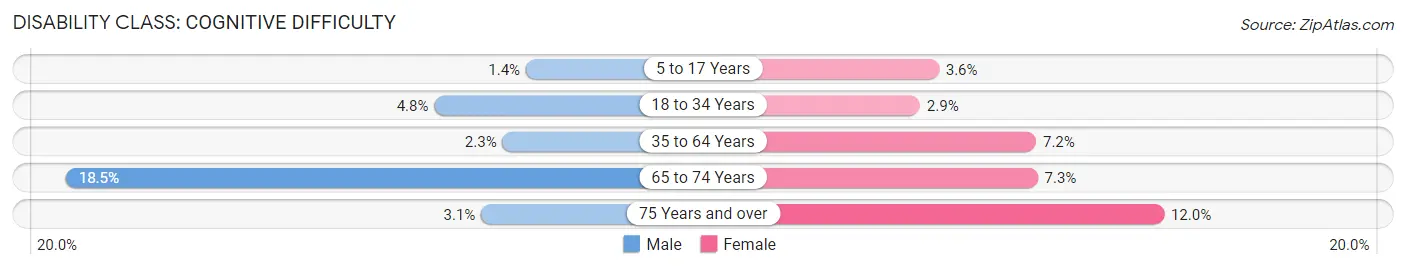
| Age Bracket | Male | Female |
| 5 to 17 Years | 9 (1.4%) | 29 (3.6%) |
| 18 to 34 Years | 46 (4.8%) | 28 (2.9%) |
| 35 to 64 Years | 36 (2.3%) | 117 (7.2%) |
| 65 to 74 Years | 82 (18.5%) | 37 (7.3%) |
| 75 Years and over | 8 (3.0%) | 47 (12.0%) |
Disability Class: Ambulatory Difficulty
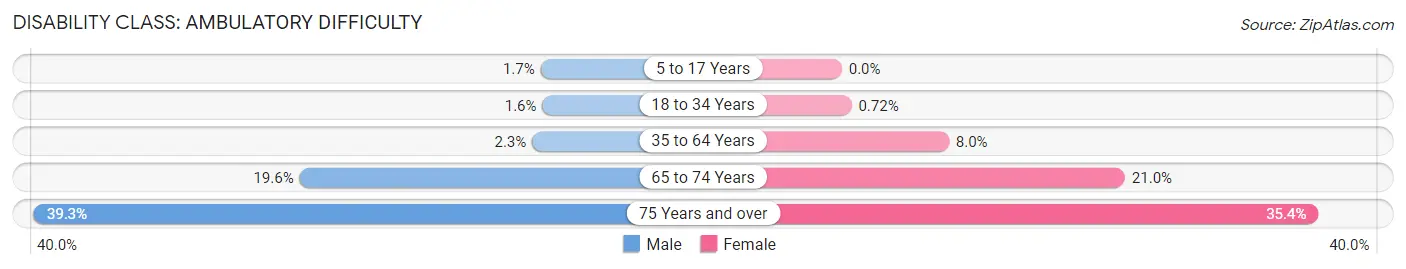
| Age Bracket | Male | Female |
| 5 to 17 Years | 11 (1.7%) | 0 (0.0%) |
| 18 to 34 Years | 15 (1.6%) | 7 (0.7%) |
| 35 to 64 Years | 37 (2.3%) | 129 (8.0%) |
| 65 to 74 Years | 87 (19.6%) | 107 (21.0%) |
| 75 Years and over | 103 (39.3%) | 139 (35.4%) |
Disability Class: Self-Care Difficulty
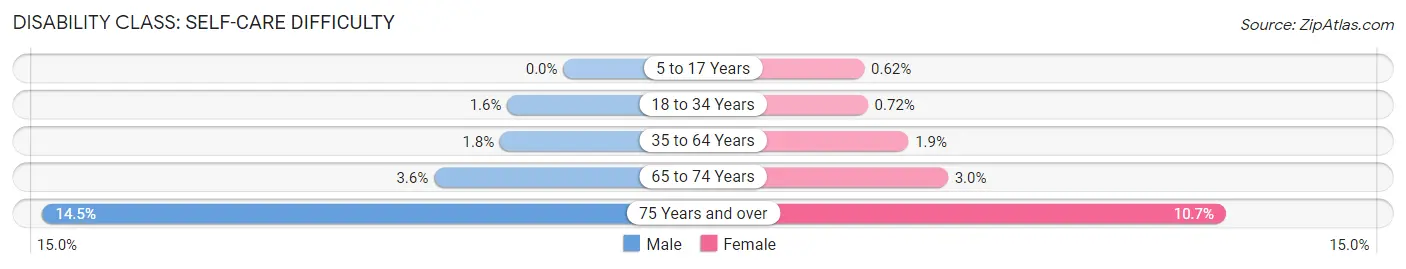
| Age Bracket | Male | Female |
| 5 to 17 Years | 0 (0.0%) | 5 (0.6%) |
| 18 to 34 Years | 15 (1.6%) | 7 (0.7%) |
| 35 to 64 Years | 28 (1.8%) | 30 (1.8%) |
| 65 to 74 Years | 16 (3.6%) | 15 (2.9%) |
| 75 Years and over | 38 (14.5%) | 42 (10.7%) |
Technology Access in Rock Falls
Computing Device Access in Rock Falls
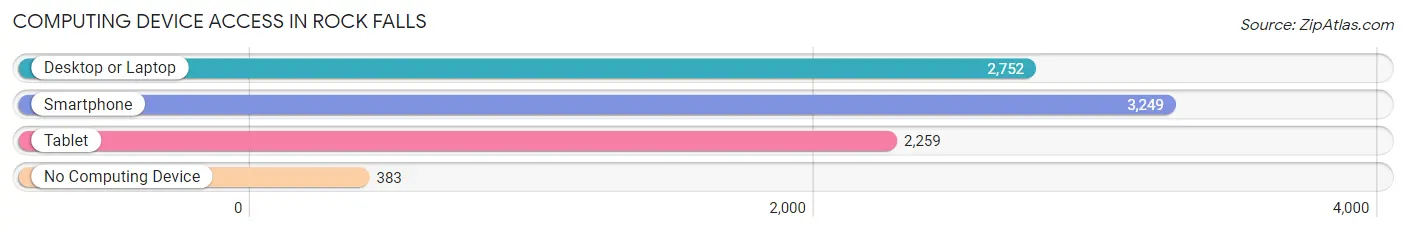
| Device Type | # Households | % Households |
| Desktop or Laptop | 2,752 | 69.3% |
| Smartphone | 3,249 | 81.9% |
| Tablet | 2,259 | 56.9% |
| No Computing Device | 383 | 9.7% |
| Total | 3,969 | 100.0% |
Internet Access in Rock Falls
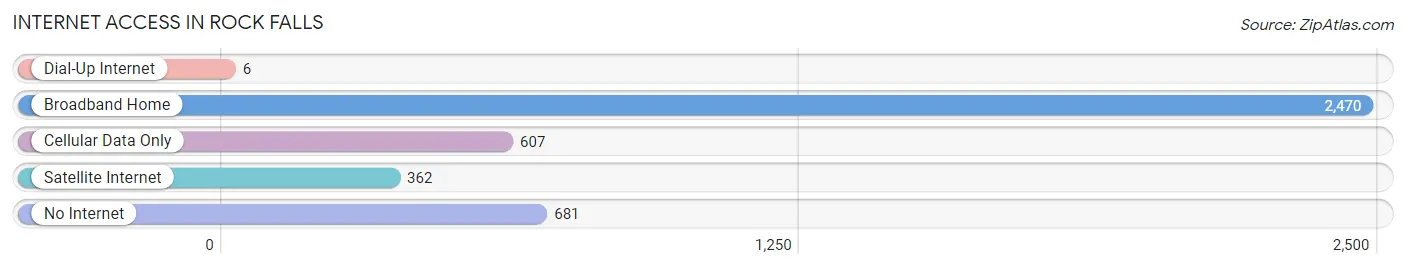
| Internet Type | # Households | % Households |
| Dial-Up Internet | 6 | 0.2% |
| Broadband Home | 2,470 | 62.2% |
| Cellular Data Only | 607 | 15.3% |
| Satellite Internet | 362 | 9.1% |
| No Internet | 681 | 17.2% |
| Total | 3,969 | 100.0% |
Rock Falls Summary
History
Rock Falls, Illinois is a small city located in Whiteside County, Illinois. It is situated on the banks of the Rock River, and is part of the Sterling-Rock Falls Metropolitan Statistical Area. The city was founded in 1854 by William B. Talcott, who named it after the nearby rapids in the Rock River. The city was incorporated in 1872, and has since grown to a population of over 9,000 people.
Rock Falls has a rich history, and has been home to many notable figures throughout its history. The city was the birthplace of the famous American author, Ernest Hemingway, who was born in 1899. The city was also home to the first African-American mayor in the state of Illinois, William E. Brown, who served from 1967 to 1971.
Geography
Rock Falls is located in the northwestern corner of Illinois, in Whiteside County. It is situated on the banks of the Rock River, and is part of the Sterling-Rock Falls Metropolitan Statistical Area. The city is located approximately 80 miles west of Chicago, and is part of the Quad Cities region. The city has a total area of 4.2 square miles, all of which is land.
The city has a humid continental climate, with hot, humid summers and cold, snowy winters. The average temperature in the summer is around 75 degrees Fahrenheit, and the average temperature in the winter is around 25 degrees Fahrenheit. The city receives an average of 36 inches of precipitation per year.
Economy
Rock Falls has a diverse economy, with a variety of industries and businesses. The city is home to several manufacturing companies, including the Rock Falls Manufacturing Company, which produces industrial equipment and supplies. The city is also home to several retail stores, restaurants, and other businesses.
The city is also home to several educational institutions, including Sauk Valley Community College, which offers a variety of degree and certificate programs. The city is also home to the Rock Falls Public Library, which provides access to books, magazines, and other resources.
Demographics
As of the 2010 census, Rock Falls had a population of 9,266 people. The racial makeup of the city was 87.3% White, 5.3% African American, 0.4% Native American, 0.7% Asian, 0.1% Pacific Islander, 4.2% from other races, and 2.0% from two or more races. Hispanic or Latino of any race were 10.2% of the population.
The median household income in Rock Falls was $41,945, and the median family income was $50,945. The per capita income for the city was $20,845. About 11.2% of families and 14.2% of the population were below the poverty line, including 19.2% of those under age 18 and 8.2% of those age 65 or over.
Common Questions
What is Per Capita Income in Rock Falls?
Per Capita income in Rock Falls is $31,733.
What is the Median Family Income in Rock Falls?
Median Family Income in Rock Falls is $60,158.
What is the Median Household income in Rock Falls?
Median Household Income in Rock Falls is $48,390.
What is Income or Wage Gap in Rock Falls?
Income or Wage Gap in Rock Falls is 46.0%.
Women in Rock Falls earn 54.0 cents for every dollar earned by a man.
What is Inequality or Gini Index in Rock Falls?
Inequality or Gini Index in Rock Falls is 0.48.
What is the Total Population of Rock Falls?
Total Population of Rock Falls is 8,904.
What is the Total Male Population of Rock Falls?
Total Male Population of Rock Falls is 4,273.
What is the Total Female Population of Rock Falls?
Total Female Population of Rock Falls is 4,631.
What is the Ratio of Males per 100 Females in Rock Falls?
There are 92.27 Males per 100 Females in Rock Falls.
What is the Ratio of Females per 100 Males in Rock Falls?
There are 108.38 Females per 100 Males in Rock Falls.
What is the Median Population Age in Rock Falls?
Median Population Age in Rock Falls is 38.2 Years.
What is the Average Family Size in Rock Falls
Average Family Size in Rock Falls is 3.0 People.
What is the Average Household Size in Rock Falls
Average Household Size in Rock Falls is 2.2 People.
How Large is the Labor Force in Rock Falls?
There are 4,534 People in the Labor Forcein in Rock Falls.
What is the Percentage of People in the Labor Force in Rock Falls?
64.2% of People are in the Labor Force in Rock Falls.
What is the Unemployment Rate in Rock Falls?
Unemployment Rate in Rock Falls is 4.4%.