Woodbridge, VA Map & Demographics
Woodbridge Map
Woodbridge Overview
$40,321
PER CAPITA INCOME
$99,318
AVG FAMILY INCOME
$93,347
AVG HOUSEHOLD INCOME
23.3%
WAGE / INCOME GAP [ % ]
76.7¢/ $1
WAGE / INCOME GAP [ $ ]
$12,463
FAMILY INCOME DEFICIT
0.45
INEQUALITY / GINI INDEX
42,619
TOTAL POPULATION
20,782
MALE POPULATION
21,837
FEMALE POPULATION
95.17
MALES / 100 FEMALES
105.08
FEMALES / 100 MALES
34.2
MEDIAN AGE
3.7
AVG FAMILY SIZE
3.1
AVG HOUSEHOLD SIZE
25,314
LABOR FORCE [ PEOPLE ]
76.4%
PERCENT IN LABOR FORCE
7.4%
UNEMPLOYMENT RATE
Income in Woodbridge
Income Overview in Woodbridge
Per Capita Income in Woodbridge is $40,321, while median incomes of families and households are $99,318 and $93,347 respectively.
| Characteristic | Number | Measure |
| Per Capita Income | 42,619 | $40,321 |
| Median Family Income | 9,408 | $99,318 |
| Mean Family Income | 9,408 | $131,084 |
| Median Household Income | 13,655 | $93,347 |
| Mean Household Income | 13,655 | $122,711 |
| Income Deficit | 9,408 | $12,463 |
| Wage / Income Gap (%) | 42,619 | 23.26% |
| Wage / Income Gap ($) | 42,619 | 76.74¢ per $1 |
| Gini / Inequality Index | 42,619 | 0.45 |
Earnings by Sex in Woodbridge
Average Earnings in Woodbridge are $40,026, $44,449 for men and $34,109 for women, a difference of 23.3%.
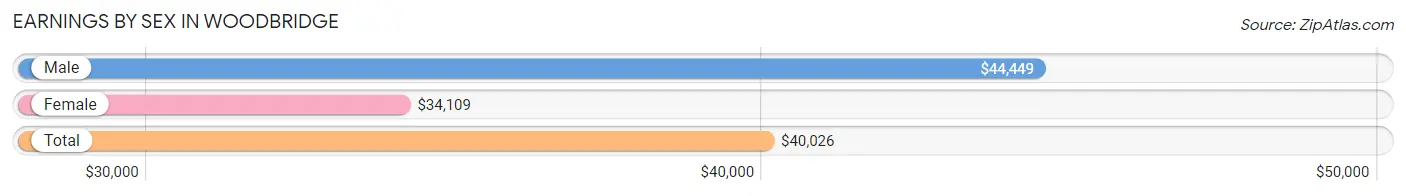
| Sex | Number | Average Earnings |
| Male | 13,540 (53.7%) | $44,449 |
| Female | 11,694 (46.3%) | $34,109 |
| Total | 25,234 (100.0%) | $40,026 |
Earnings by Sex by Income Bracket in Woodbridge
The most common earnings brackets in Woodbridge are $100,000+ for men (2,071 | 15.3%) and $100,000+ for women (1,202 | 10.3%).
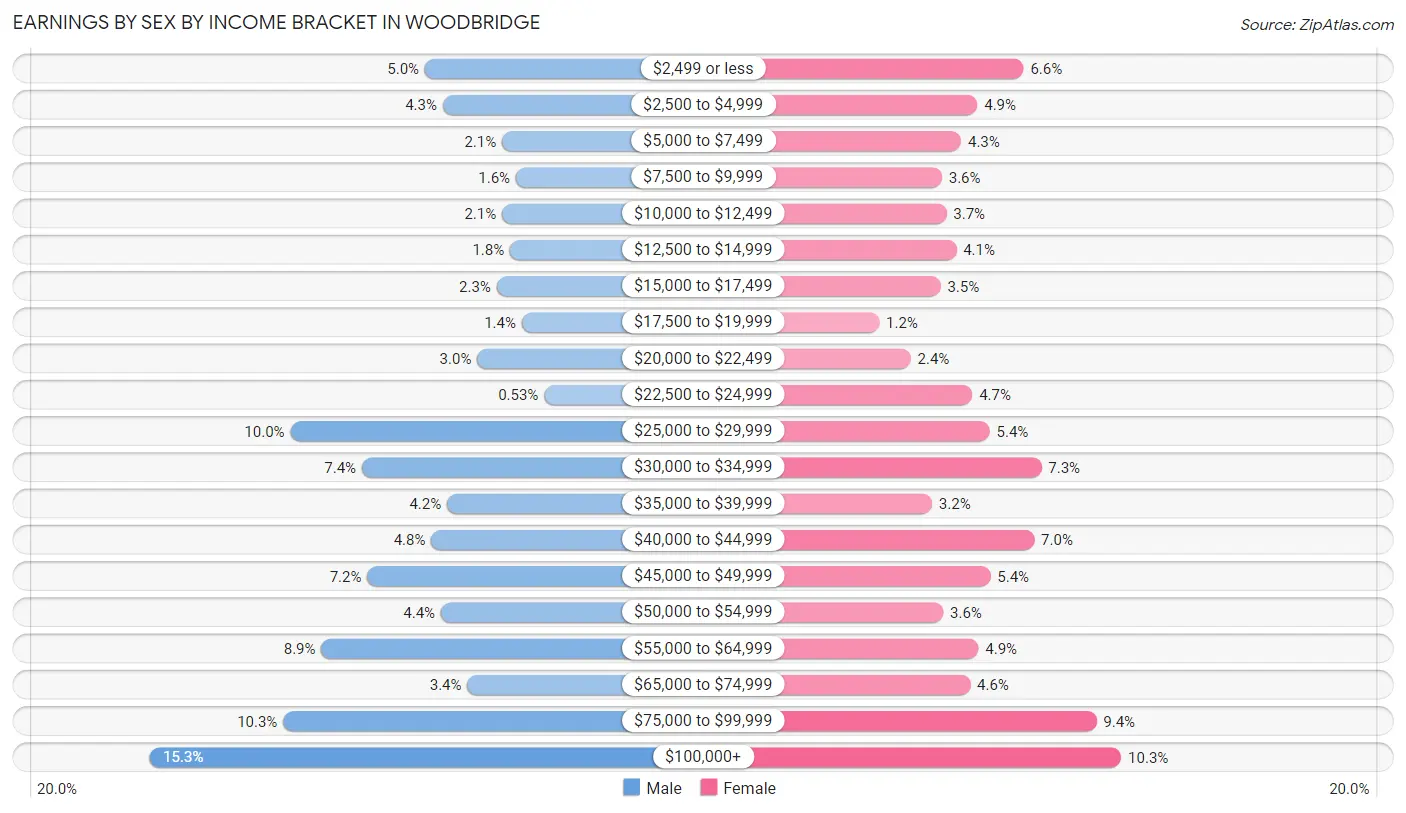
| Income | Male | Female |
| $2,499 or less | 677 (5.0%) | 774 (6.6%) |
| $2,500 to $4,999 | 586 (4.3%) | 572 (4.9%) |
| $5,000 to $7,499 | 286 (2.1%) | 501 (4.3%) |
| $7,500 to $9,999 | 215 (1.6%) | 416 (3.6%) |
| $10,000 to $12,499 | 286 (2.1%) | 436 (3.7%) |
| $12,500 to $14,999 | 245 (1.8%) | 479 (4.1%) |
| $15,000 to $17,499 | 313 (2.3%) | 411 (3.5%) |
| $17,500 to $19,999 | 186 (1.4%) | 141 (1.2%) |
| $20,000 to $22,499 | 411 (3.0%) | 280 (2.4%) |
| $22,500 to $24,999 | 72 (0.5%) | 550 (4.7%) |
| $25,000 to $29,999 | 1,359 (10.0%) | 626 (5.3%) |
| $30,000 to $34,999 | 997 (7.4%) | 852 (7.3%) |
| $35,000 to $39,999 | 565 (4.2%) | 373 (3.2%) |
| $40,000 to $44,999 | 645 (4.8%) | 821 (7.0%) |
| $45,000 to $49,999 | 970 (7.2%) | 629 (5.4%) |
| $50,000 to $54,999 | 596 (4.4%) | 422 (3.6%) |
| $55,000 to $64,999 | 1,202 (8.9%) | 576 (4.9%) |
| $65,000 to $74,999 | 462 (3.4%) | 540 (4.6%) |
| $75,000 to $99,999 | 1,396 (10.3%) | 1,093 (9.3%) |
| $100,000+ | 2,071 (15.3%) | 1,202 (10.3%) |
| Total | 13,540 (100.0%) | 11,694 (100.0%) |
Earnings by Sex by Educational Attainment in Woodbridge
Average earnings in Woodbridge are $48,051 for men and $41,834 for women, a difference of 12.9%. Men with an educational attainment of graduate degree enjoy the highest average annual earnings of $90,294, while those with less than high school education earn the least with $36,135. Women with an educational attainment of graduate degree earn the most with the average annual earnings of $75,442, while those with less than high school education have the smallest earnings of $24,638.
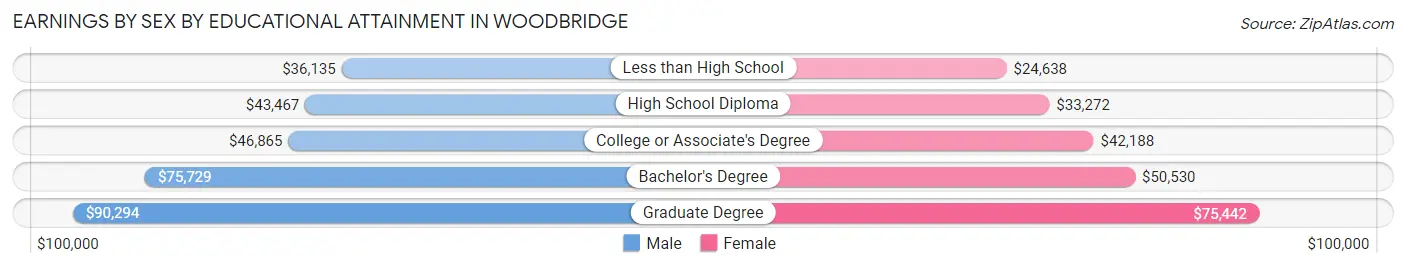
| Educational Attainment | Male Income | Female Income |
| Less than High School | $36,135 | $24,638 |
| High School Diploma | $43,467 | $33,272 |
| College or Associate's Degree | $46,865 | $42,188 |
| Bachelor's Degree | $75,729 | $50,530 |
| Graduate Degree | $90,294 | $75,442 |
| Total | $48,051 | $41,834 |
Family Income in Woodbridge
Family Income Brackets in Woodbridge
According to the Woodbridge family income data, there are 2,644 families falling into the $100,000 to $149,999 income range, which is the most common income bracket and makes up 28.1% of all families. Conversely, the $10,000 to $14,999 income bracket is the least frequent group with only 85 families (0.9%) belonging to this category.
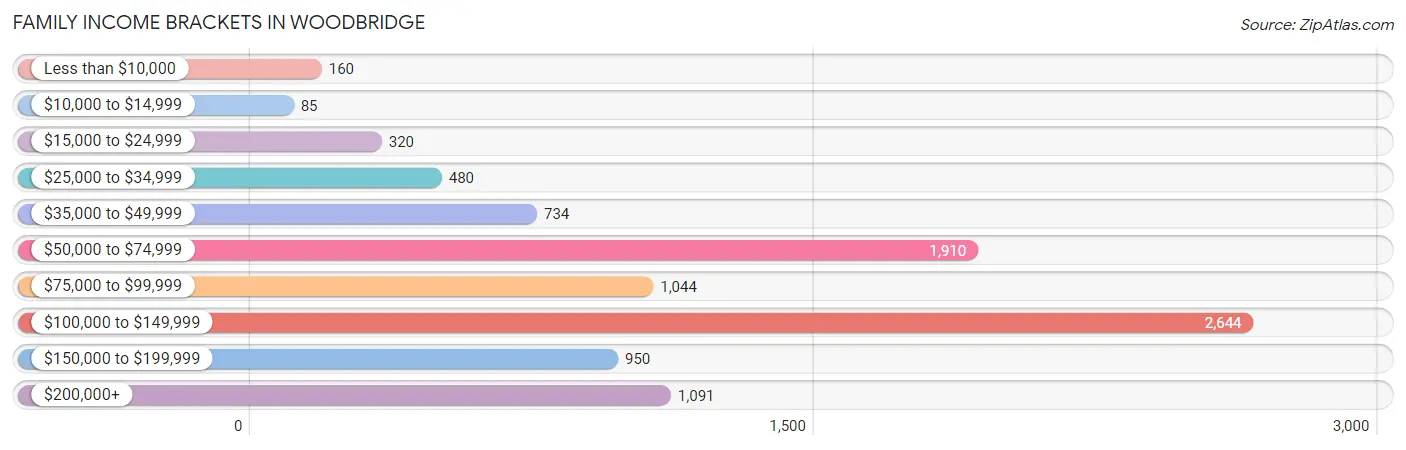
| Income Bracket | # Families | % Families |
| Less than $10,000 | 160 | 1.7% |
| $10,000 to $14,999 | 85 | 0.9% |
| $15,000 to $24,999 | 320 | 3.4% |
| $25,000 to $34,999 | 480 | 5.1% |
| $35,000 to $49,999 | 734 | 7.8% |
| $50,000 to $74,999 | 1,910 | 20.3% |
| $75,000 to $99,999 | 1,044 | 11.1% |
| $100,000 to $149,999 | 2,644 | 28.1% |
| $150,000 to $199,999 | 950 | 10.1% |
| $200,000+ | 1,091 | 11.6% |
Family Income by Famaliy Size in Woodbridge
4-person families (2,240 | 23.8%) account for the highest median family income in Woodbridge with $107,143 per family, while 2-person families (2,894 | 30.8%) have the highest median income of $52,660 per family member.
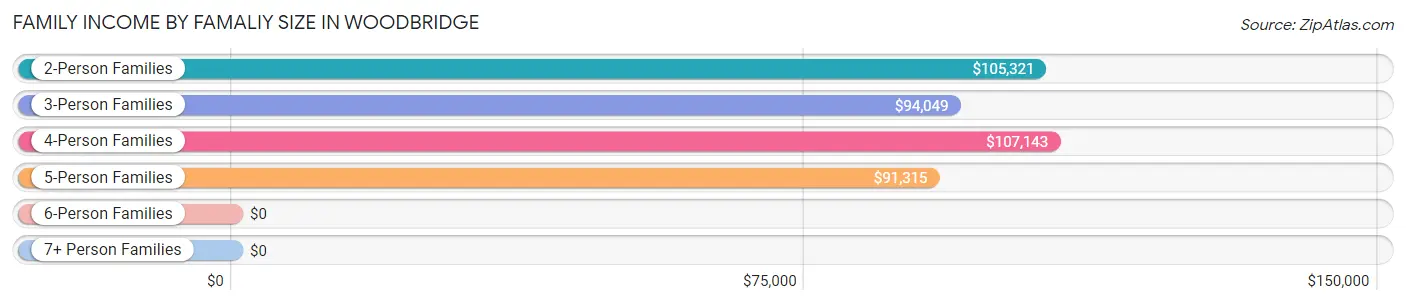
| Income Bracket | # Families | Median Income |
| 2-Person Families | 2,894 (30.8%) | $105,321 |
| 3-Person Families | 1,927 (20.5%) | $94,049 |
| 4-Person Families | 2,240 (23.8%) | $107,143 |
| 5-Person Families | 1,489 (15.8%) | $91,315 |
| 6-Person Families | 605 (6.4%) | $0 |
| 7+ Person Families | 253 (2.7%) | $0 |
| Total | 9,408 (100.0%) | $99,318 |
Family Income by Number of Earners in Woodbridge
The median family income in Woodbridge is $99,318, with families comprising 3+ earners (2,273) having the highest median family income of $132,813, while families with 1 earner (2,578) have the lowest median family income of $58,521, accounting for 24.2% and 27.4% of families, respectively.
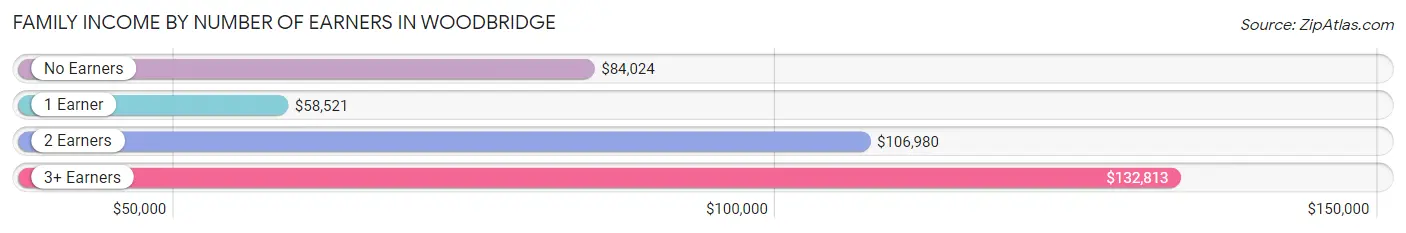
| Number of Earners | # Families | Median Income |
| No Earners | 456 (4.9%) | $84,024 |
| 1 Earner | 2,578 (27.4%) | $58,521 |
| 2 Earners | 4,101 (43.6%) | $106,980 |
| 3+ Earners | 2,273 (24.2%) | $132,813 |
| Total | 9,408 (100.0%) | $99,318 |
Household Income in Woodbridge
Household Income Brackets in Woodbridge
With 3,414 households falling in the category, the $100,000 to $149,999 income range is the most frequent in Woodbridge, accounting for 25.0% of all households. In contrast, only 164 households (1.2%) fall into the $10,000 to $14,999 income bracket, making it the least populous group.
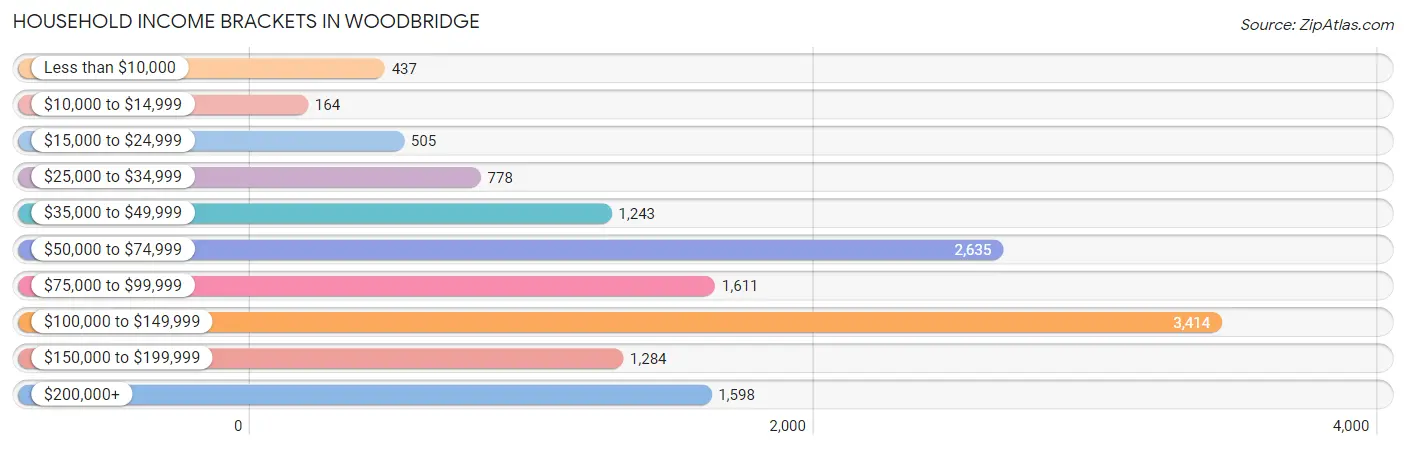
| Income Bracket | # Households | % Households |
| Less than $10,000 | 437 | 3.2% |
| $10,000 to $14,999 | 164 | 1.2% |
| $15,000 to $24,999 | 505 | 3.7% |
| $25,000 to $34,999 | 778 | 5.7% |
| $35,000 to $49,999 | 1,243 | 9.1% |
| $50,000 to $74,999 | 2,635 | 19.3% |
| $75,000 to $99,999 | 1,611 | 11.8% |
| $100,000 to $149,999 | 3,414 | 25.0% |
| $150,000 to $199,999 | 1,284 | 9.4% |
| $200,000+ | 1,598 | 11.7% |
Household Income by Householder Age in Woodbridge
The median household income in Woodbridge is $93,347, with the highest median household income of $106,326 found in the 45 to 64 years age bracket for the primary householder. A total of 5,621 households (41.2%) fall into this category. Meanwhile, the 15 to 24 years age bracket for the primary householder has the lowest median household income of $53,088, with 520 households (3.8%) in this group.
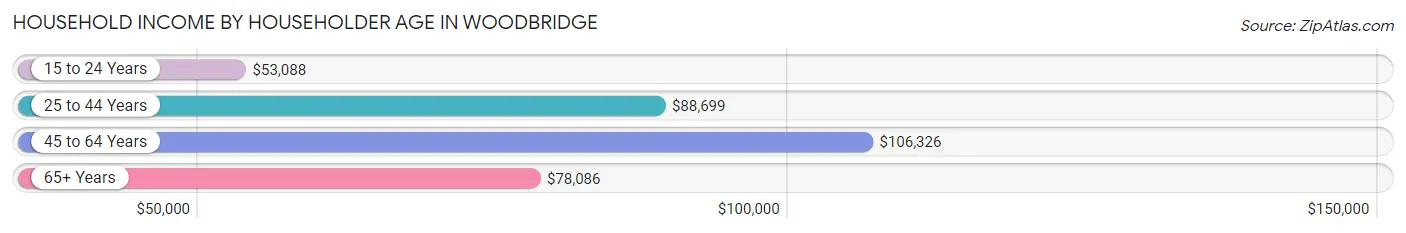
| Income Bracket | # Households | Median Income |
| 15 to 24 Years | 520 (3.8%) | $53,088 |
| 25 to 44 Years | 5,191 (38.0%) | $88,699 |
| 45 to 64 Years | 5,621 (41.2%) | $106,326 |
| 65+ Years | 2,323 (17.0%) | $78,086 |
| Total | 13,655 (100.0%) | $93,347 |
Poverty in Woodbridge
Income Below Poverty by Sex and Age in Woodbridge
With 8.5% poverty level for males and 10.3% for females among the residents of Woodbridge, 6 to 11 year old males and 15 year old females are the most vulnerable to poverty, with 253 males (18.4%) and 98 females (26.3%) in their respective age groups living below the poverty level.
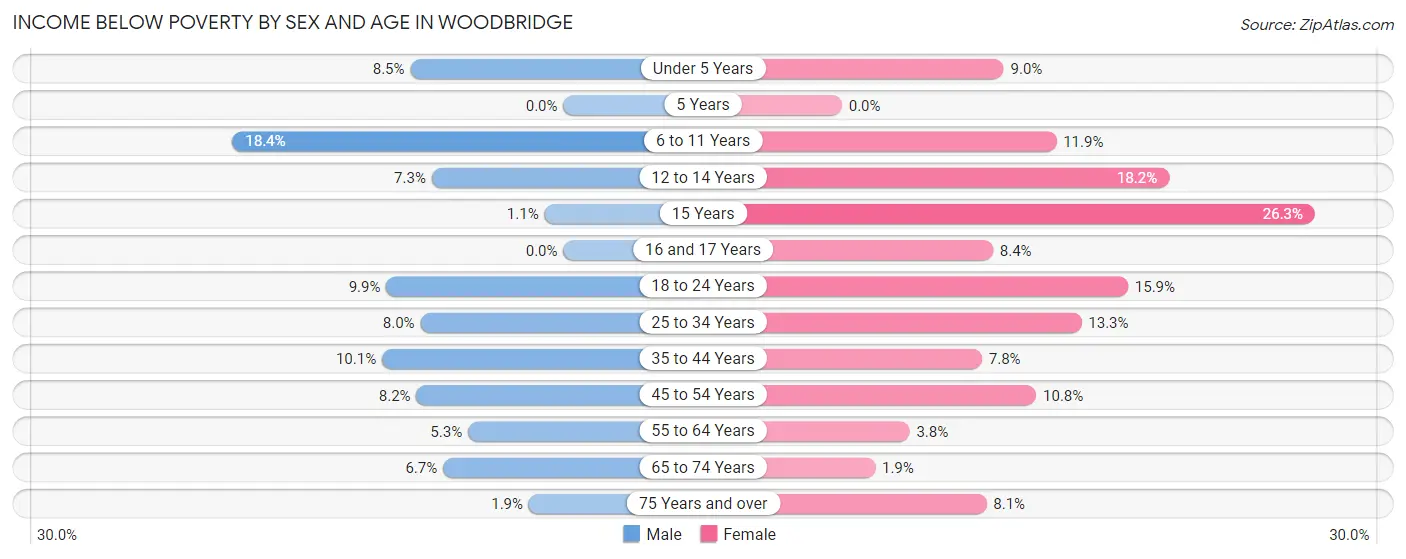
| Age Bracket | Male | Female |
| Under 5 Years | 100 (8.5%) | 115 (9.0%) |
| 5 Years | 0 (0.0%) | 0 (0.0%) |
| 6 to 11 Years | 253 (18.4%) | 333 (11.9%) |
| 12 to 14 Years | 65 (7.3%) | 90 (18.2%) |
| 15 Years | 3 (1.1%) | 98 (26.3%) |
| 16 and 17 Years | 0 (0.0%) | 53 (8.4%) |
| 18 to 24 Years | 242 (9.9%) | 409 (15.9%) |
| 25 to 34 Years | 261 (8.0%) | 420 (13.3%) |
| 35 to 44 Years | 327 (10.1%) | 233 (7.8%) |
| 45 to 54 Years | 276 (8.2%) | 302 (10.8%) |
| 55 to 64 Years | 114 (5.3%) | 83 (3.8%) |
| 65 to 74 Years | 89 (6.7%) | 27 (1.8%) |
| 75 Years and over | 9 (1.9%) | 56 (8.1%) |
| Total | 1,739 (8.5%) | 2,219 (10.3%) |
Income Above Poverty by Sex and Age in Woodbridge
According to the poverty statistics in Woodbridge, males aged 5 years and females aged 5 years are the age groups that are most secure financially, with 100.0% of males and 100.0% of females in these age groups living above the poverty line.
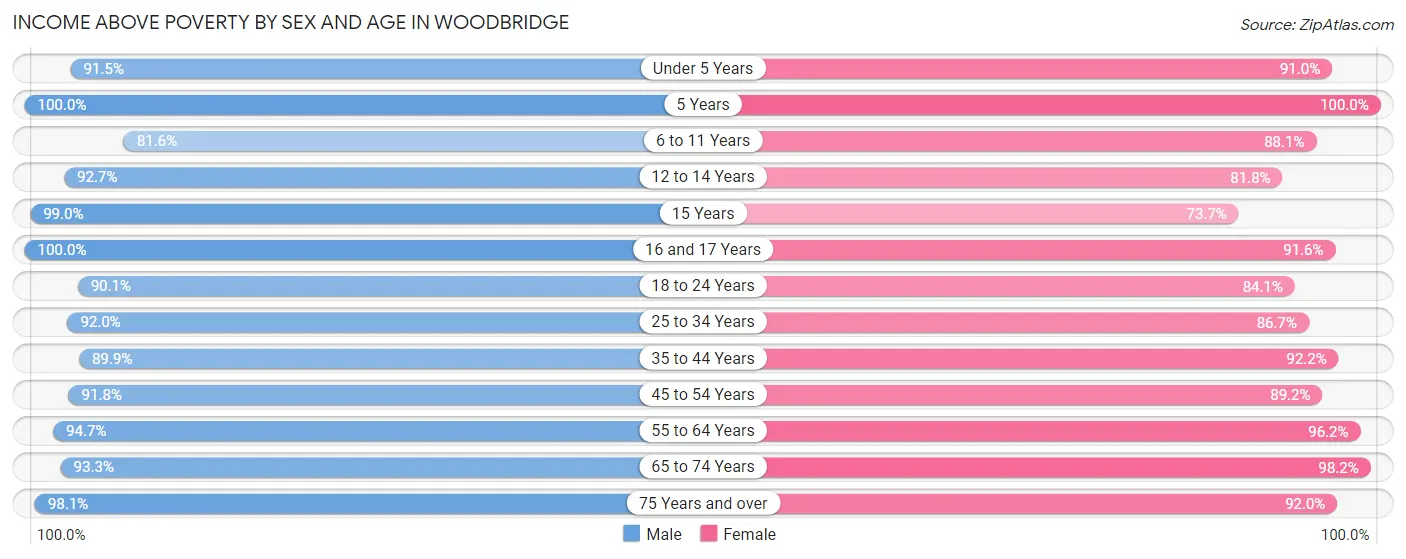
| Age Bracket | Male | Female |
| Under 5 Years | 1,074 (91.5%) | 1,161 (91.0%) |
| 5 Years | 184 (100.0%) | 165 (100.0%) |
| 6 to 11 Years | 1,120 (81.6%) | 2,455 (88.1%) |
| 12 to 14 Years | 822 (92.7%) | 404 (81.8%) |
| 15 Years | 284 (99.0%) | 274 (73.7%) |
| 16 and 17 Years | 358 (100.0%) | 577 (91.6%) |
| 18 to 24 Years | 2,212 (90.1%) | 2,159 (84.1%) |
| 25 to 34 Years | 3,017 (92.0%) | 2,728 (86.7%) |
| 35 to 44 Years | 2,910 (89.9%) | 2,756 (92.2%) |
| 45 to 54 Years | 3,099 (91.8%) | 2,488 (89.2%) |
| 55 to 64 Years | 2,034 (94.7%) | 2,121 (96.2%) |
| 65 to 74 Years | 1,239 (93.3%) | 1,434 (98.2%) |
| 75 Years and over | 460 (98.1%) | 640 (91.9%) |
| Total | 18,813 (91.5%) | 19,362 (89.7%) |
Income Below Poverty Among Married-Couple Families in Woodbridge
The poverty statistics for married-couple families in Woodbridge show that 6.5% or 404 of the total 6,250 families live below the poverty line. Families with 3 or 4 children have the highest poverty rate of 19.7%, comprising of 136 families. On the other hand, families with no children have the lowest poverty rate of 1.5%, which includes 45 families.
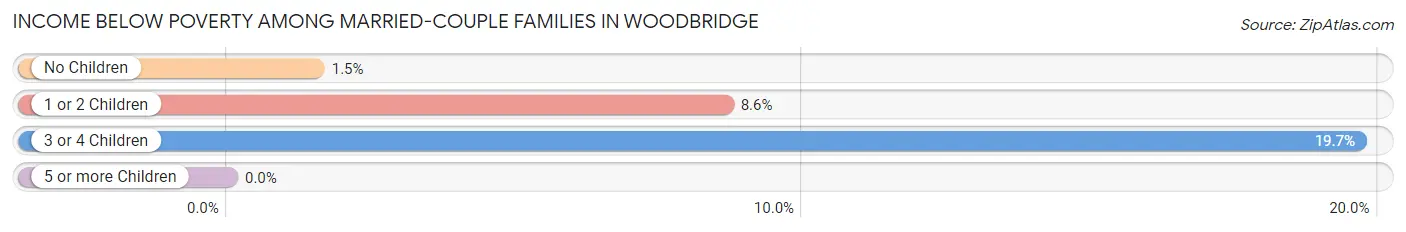
| Children | Above Poverty | Below Poverty |
| No Children | 2,928 (98.5%) | 45 (1.5%) |
| 1 or 2 Children | 2,362 (91.4%) | 223 (8.6%) |
| 3 or 4 Children | 556 (80.3%) | 136 (19.7%) |
| 5 or more Children | 0 (0.0%) | 0 (0.0%) |
| Total | 5,846 (93.5%) | 404 (6.5%) |
Income Below Poverty Among Single-Parent Households in Woodbridge
According to the poverty data in Woodbridge, 3.2% or 31 single-father households and 7.6% or 166 single-mother households are living below the poverty line. Among single-father households, those with no children have the highest poverty rate, with 15 households (3.9%) experiencing poverty. Likewise, among single-mother households, those with 3 or 4 children have the highest poverty rate, with 56 households (17.8%) falling below the poverty line.
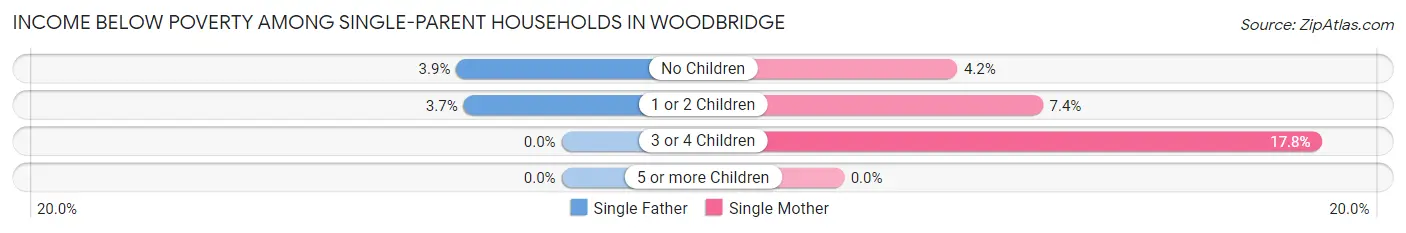
| Children | Single Father | Single Mother |
| No Children | 15 (3.9%) | 37 (4.2%) |
| 1 or 2 Children | 16 (3.6%) | 73 (7.4%) |
| 3 or 4 Children | 0 (0.0%) | 56 (17.8%) |
| 5 or more Children | 0 (0.0%) | 0 (0.0%) |
| Total | 31 (3.2%) | 166 (7.6%) |
Income Below Poverty Among Married-Couple vs Single-Parent Households in Woodbridge
The poverty data for Woodbridge shows that 404 of the married-couple family households (6.5%) and 197 of the single-parent households (6.2%) are living below the poverty level. Within the married-couple family households, those with 3 or 4 children have the highest poverty rate, with 136 households (19.7%) falling below the poverty line. Among the single-parent households, those with 3 or 4 children have the highest poverty rate, with 56 household (11.8%) living below poverty.
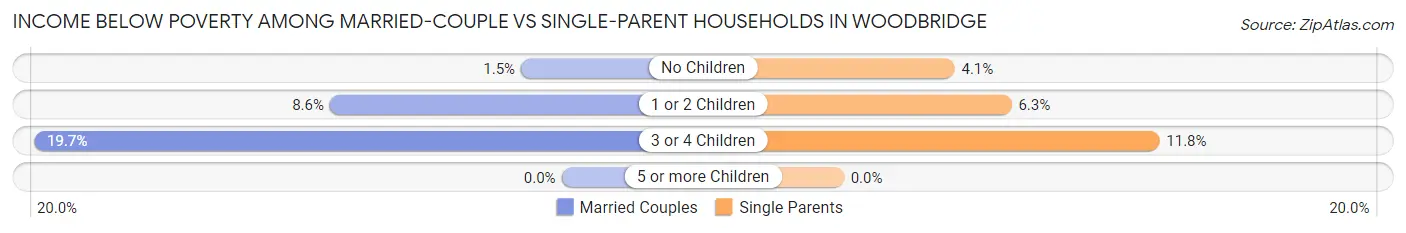
| Children | Married-Couple Families | Single-Parent Households |
| No Children | 45 (1.5%) | 52 (4.1%) |
| 1 or 2 Children | 223 (8.6%) | 89 (6.2%) |
| 3 or 4 Children | 136 (19.7%) | 56 (11.8%) |
| 5 or more Children | 0 (0.0%) | 0 (0.0%) |
| Total | 404 (6.5%) | 197 (6.2%) |
Race in Woodbridge
The most populous races in Woodbridge are Hispanic or Latino (17,686 | 41.5%), White / Caucasian (14,773 | 34.7%), and Black / African American (10,886 | 25.5%).
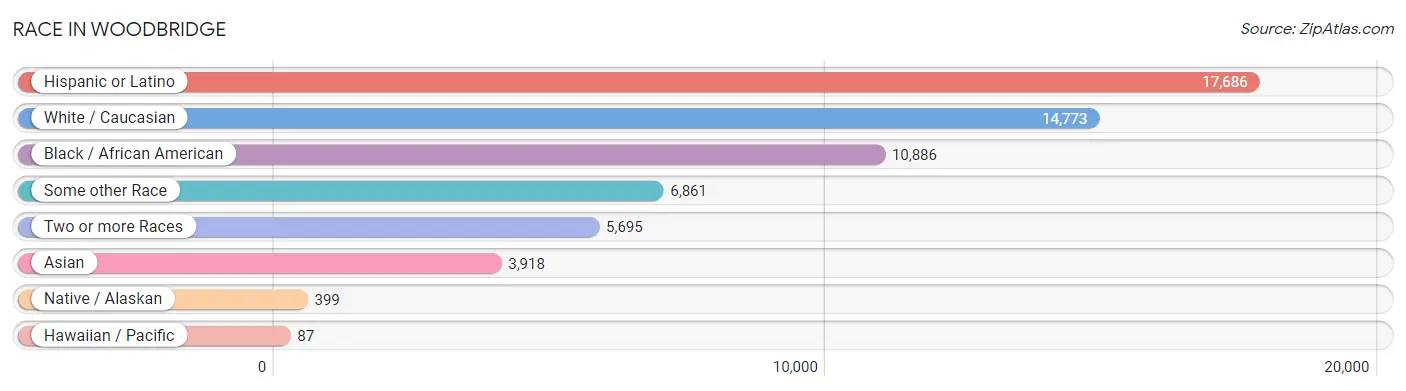
| Race | # Population | % Population |
| Asian | 3,918 | 9.2% |
| Black / African American | 10,886 | 25.5% |
| Hawaiian / Pacific | 87 | 0.2% |
| Hispanic or Latino | 17,686 | 41.5% |
| Native / Alaskan | 399 | 0.9% |
| White / Caucasian | 14,773 | 34.7% |
| Two or more Races | 5,695 | 13.4% |
| Some other Race | 6,861 | 16.1% |
| Total | 42,619 | 100.0% |
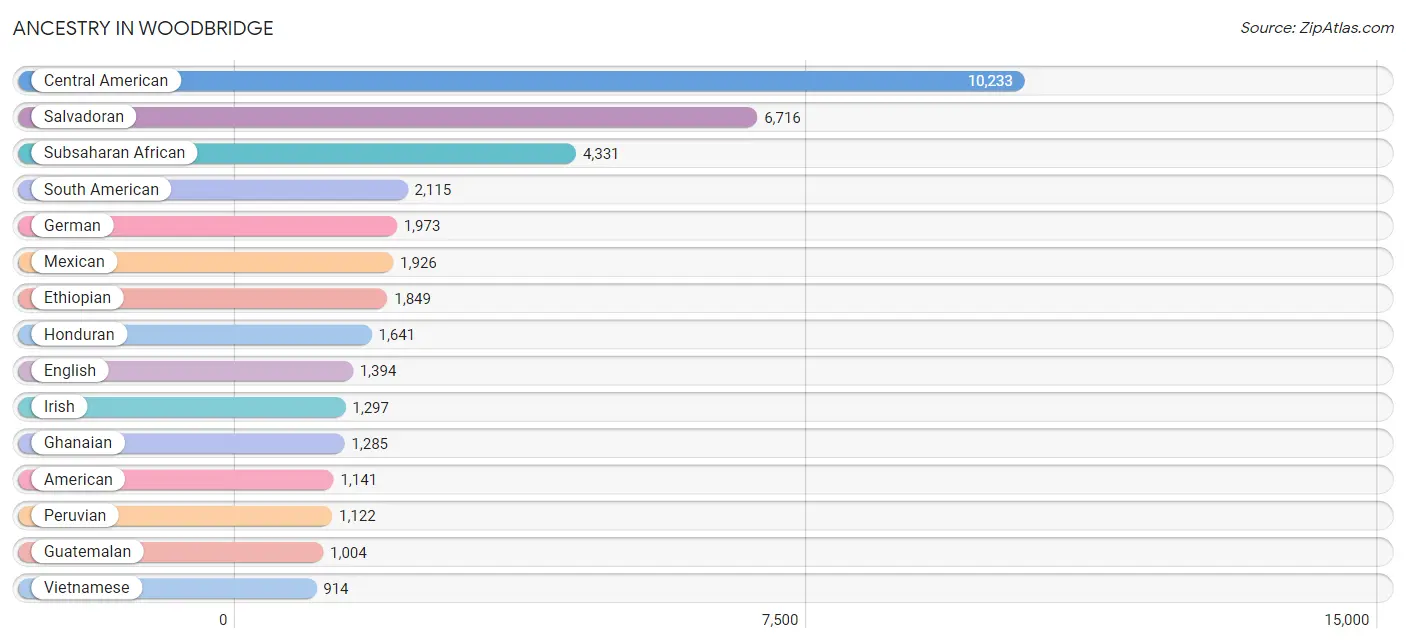
Ancestry in Woodbridge
The most populous ancestries reported in Woodbridge are Central American (10,233 | 24.0%), Salvadoran (6,716 | 15.8%), Subsaharan African (4,331 | 10.2%), South American (2,115 | 5.0%), and German (1,973 | 4.6%), together accounting for 59.5% of all Woodbridge residents.
| Ancestry | # Population | % Population |
| Afghan | 697 | 1.6% |
| African | 286 | 0.7% |
| American | 1,141 | 2.7% |
| Arab | 195 | 0.5% |
| Argentinean | 29 | 0.1% |
| Bhutanese | 245 | 0.6% |
| Bolivian | 290 | 0.7% |
| Brazilian | 170 | 0.4% |
| British | 153 | 0.4% |
| Burmese | 499 | 1.2% |
| Canadian | 9 | 0.0% |
| Central American | 10,233 | 24.0% |
| Central American Indian | 46 | 0.1% |
| Cherokee | 66 | 0.2% |
| Chickasaw | 6 | 0.0% |
| Choctaw | 33 | 0.1% |
| Colombian | 177 | 0.4% |
| Costa Rican | 69 | 0.2% |
| Croatian | 18 | 0.0% |
| Cuban | 105 | 0.3% |
| Czech | 54 | 0.1% |
| Danish | 31 | 0.1% |
| Dominican | 19 | 0.0% |
| Dutch | 107 | 0.3% |
| Eastern European | 21 | 0.1% |
| Ecuadorian | 225 | 0.5% |
| Egyptian | 47 | 0.1% |
| English | 1,394 | 3.3% |
| Ethiopian | 1,849 | 4.3% |
| European | 207 | 0.5% |
| Finnish | 22 | 0.1% |
| French | 333 | 0.8% |
| French Canadian | 39 | 0.1% |
| German | 1,973 | 4.6% |
| Ghanaian | 1,285 | 3.0% |
| Greek | 40 | 0.1% |
| Guamanian / Chamorro | 131 | 0.3% |
| Guatemalan | 1,004 | 2.4% |
| Haitian | 81 | 0.2% |
| Honduran | 1,641 | 3.8% |
| Hungarian | 14 | 0.0% |
| Indian (Asian) | 192 | 0.4% |
| Iranian | 22 | 0.1% |
| Iraqi | 39 | 0.1% |
| Irish | 1,297 | 3.0% |
| Italian | 796 | 1.9% |
| Jamaican | 113 | 0.3% |
| Japanese | 19 | 0.0% |
| Korean | 890 | 2.1% |
| Laotian | 12 | 0.0% |
| Lebanese | 55 | 0.1% |
| Liberian | 332 | 0.8% |
| Lithuanian | 9 | 0.0% |
| Malaysian | 160 | 0.4% |
| Mexican | 1,926 | 4.5% |
| Mexican American Indian | 209 | 0.5% |
| Moroccan | 35 | 0.1% |
| Native Hawaiian | 76 | 0.2% |
| Nicaraguan | 762 | 1.8% |
| Northern European | 153 | 0.4% |
| Norwegian | 29 | 0.1% |
| Pakistani | 206 | 0.5% |
| Panamanian | 41 | 0.1% |
| Paraguayan | 176 | 0.4% |
| Peruvian | 1,122 | 2.6% |
| Polish | 612 | 1.4% |
| Portuguese | 16 | 0.0% |
| Puerto Rican | 792 | 1.9% |
| Russian | 104 | 0.2% |
| Salvadoran | 6,716 | 15.8% |
| Scandinavian | 20 | 0.1% |
| Scotch-Irish | 227 | 0.5% |
| Scottish | 155 | 0.4% |
| Serbian | 10 | 0.0% |
| Sierra Leonean | 241 | 0.6% |
| Slovak | 40 | 0.1% |
| South American | 2,115 | 5.0% |
| Spaniard | 89 | 0.2% |
| Spanish | 162 | 0.4% |
| Sri Lankan | 200 | 0.5% |
| Subsaharan African | 4,331 | 10.2% |
| Swedish | 92 | 0.2% |
| Swiss | 19 | 0.0% |
| Thai | 516 | 1.2% |
| Trinidadian and Tobagonian | 9 | 0.0% |
| Ugandan | 228 | 0.5% |
| Ukrainian | 208 | 0.5% |
| Uruguayan | 26 | 0.1% |
| Venezuelan | 70 | 0.2% |
| Vietnamese | 914 | 2.1% |
| Welsh | 42 | 0.1% |
| West Indian | 64 | 0.2% |
| Yaqui | 73 | 0.2% | View All 93 Rows |
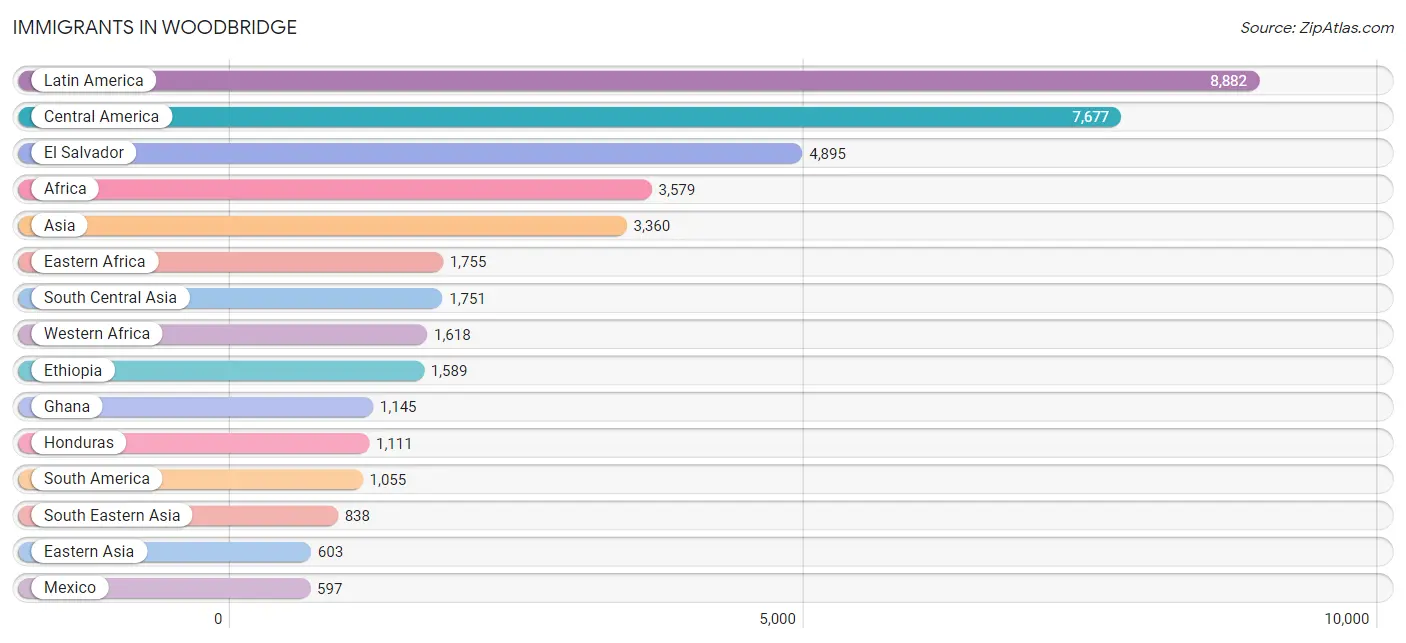
Immigrants in Woodbridge
The most numerous immigrant groups reported in Woodbridge came from Latin America (8,882 | 20.8%), Central America (7,677 | 18.0%), El Salvador (4,895 | 11.5%), Africa (3,579 | 8.4%), and Asia (3,360 | 7.9%), together accounting for 66.6% of all Woodbridge residents.
| Immigration Origin | # Population | % Population |
| Afghanistan | 521 | 1.2% |
| Africa | 3,579 | 8.4% |
| Asia | 3,360 | 7.9% |
| Bangladesh | 574 | 1.3% |
| Belize | 36 | 0.1% |
| Bolivia | 168 | 0.4% |
| Brazil | 24 | 0.1% |
| Cambodia | 19 | 0.0% |
| Cameroon | 128 | 0.3% |
| Caribbean | 150 | 0.4% |
| Central America | 7,677 | 18.0% |
| China | 53 | 0.1% |
| Colombia | 177 | 0.4% |
| Costa Rica | 42 | 0.1% |
| Cuba | 49 | 0.1% |
| Eastern Africa | 1,755 | 4.1% |
| Eastern Asia | 603 | 1.4% |
| Eastern Europe | 168 | 0.4% |
| Egypt | 19 | 0.0% |
| El Salvador | 4,895 | 11.5% |
| Eritrea | 11 | 0.0% |
| Ethiopia | 1,589 | 3.7% |
| Europe | 387 | 0.9% |
| France | 10 | 0.0% |
| Germany | 56 | 0.1% |
| Ghana | 1,145 | 2.7% |
| Greece | 9 | 0.0% |
| Guatemala | 566 | 1.3% |
| Guyana | 27 | 0.1% |
| Haiti | 28 | 0.1% |
| Honduras | 1,111 | 2.6% |
| Hong Kong | 16 | 0.0% |
| India | 313 | 0.7% |
| Indonesia | 7 | 0.0% |
| Iran | 10 | 0.0% |
| Iraq | 41 | 0.1% |
| Ireland | 3 | 0.0% |
| Italy | 112 | 0.3% |
| Jamaica | 58 | 0.1% |
| Japan | 19 | 0.0% |
| Kenya | 12 | 0.0% |
| Korea | 531 | 1.3% |
| Kuwait | 9 | 0.0% |
| Laos | 68 | 0.2% |
| Latin America | 8,882 | 20.8% |
| Lebanon | 52 | 0.1% |
| Liberia | 190 | 0.4% |
| Mexico | 597 | 1.4% |
| Middle Africa | 163 | 0.4% |
| Morocco | 24 | 0.1% |
| Nepal | 34 | 0.1% |
| Nicaragua | 400 | 0.9% |
| Northern Africa | 43 | 0.1% |
| Northern Europe | 12 | 0.0% |
| Pakistan | 299 | 0.7% |
| Panama | 30 | 0.1% |
| Peru | 397 | 0.9% |
| Philippines | 525 | 1.2% |
| Poland | 62 | 0.2% |
| Portugal | 20 | 0.1% |
| Saudi Arabia | 56 | 0.1% |
| Scotland | 9 | 0.0% |
| Sierra Leone | 254 | 0.6% |
| Singapore | 9 | 0.0% |
| South America | 1,055 | 2.5% |
| South Central Asia | 1,751 | 4.1% |
| South Eastern Asia | 838 | 2.0% |
| Southern Europe | 141 | 0.3% |
| Thailand | 91 | 0.2% |
| Uganda | 114 | 0.3% |
| Ukraine | 106 | 0.3% |
| Uruguay | 26 | 0.1% |
| Venezuela | 60 | 0.1% |
| Vietnam | 119 | 0.3% |
| Western Africa | 1,618 | 3.8% |
| Western Asia | 168 | 0.4% |
| Western Europe | 66 | 0.2% |
| Zimbabwe | 29 | 0.1% | View All 78 Rows |
Sex and Age in Woodbridge
Sex and Age in Woodbridge
The most populous age groups in Woodbridge are 30 to 34 Years (1,791 | 8.6%) for men and 20 to 24 Years (2,265 | 10.4%) for women.
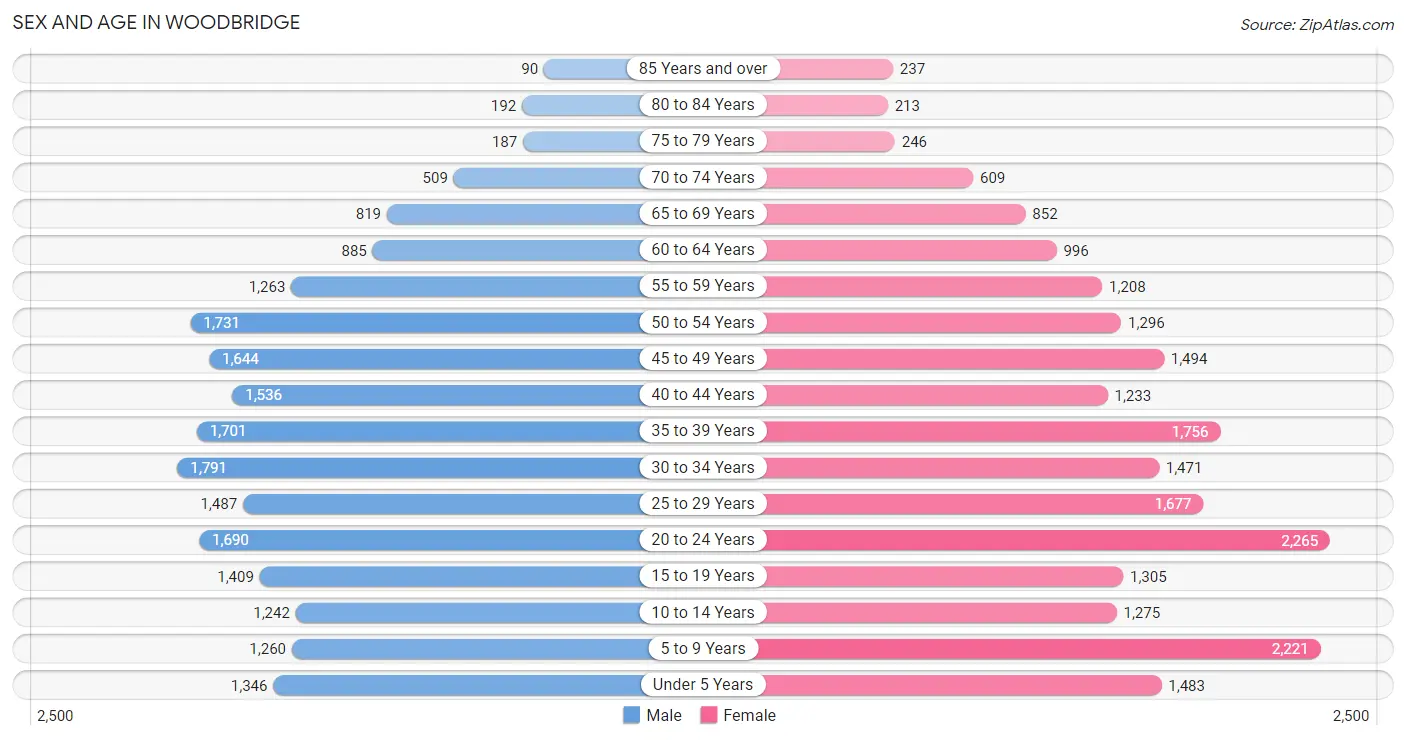
| Age Bracket | Male | Female |
| Under 5 Years | 1,346 (6.5%) | 1,483 (6.8%) |
| 5 to 9 Years | 1,260 (6.1%) | 2,221 (10.2%) |
| 10 to 14 Years | 1,242 (6.0%) | 1,275 (5.8%) |
| 15 to 19 Years | 1,409 (6.8%) | 1,305 (6.0%) |
| 20 to 24 Years | 1,690 (8.1%) | 2,265 (10.4%) |
| 25 to 29 Years | 1,487 (7.2%) | 1,677 (7.7%) |
| 30 to 34 Years | 1,791 (8.6%) | 1,471 (6.7%) |
| 35 to 39 Years | 1,701 (8.2%) | 1,756 (8.0%) |
| 40 to 44 Years | 1,536 (7.4%) | 1,233 (5.7%) |
| 45 to 49 Years | 1,644 (7.9%) | 1,494 (6.8%) |
| 50 to 54 Years | 1,731 (8.3%) | 1,296 (5.9%) |
| 55 to 59 Years | 1,263 (6.1%) | 1,208 (5.5%) |
| 60 to 64 Years | 885 (4.3%) | 996 (4.6%) |
| 65 to 69 Years | 819 (3.9%) | 852 (3.9%) |
| 70 to 74 Years | 509 (2.5%) | 609 (2.8%) |
| 75 to 79 Years | 187 (0.9%) | 246 (1.1%) |
| 80 to 84 Years | 192 (0.9%) | 213 (1.0%) |
| 85 Years and over | 90 (0.4%) | 237 (1.1%) |
| Total | 20,782 (100.0%) | 21,837 (100.0%) |
Families and Households in Woodbridge
Median Family Size in Woodbridge
The median family size in Woodbridge is 3.74 persons per family, with single female/mother families (2,175 | 23.1%) accounting for the largest median family size of 3.94 persons per family. On the other hand, married-couple families (6,250 | 66.4%) represent the smallest median family size with 3.64 persons per family.
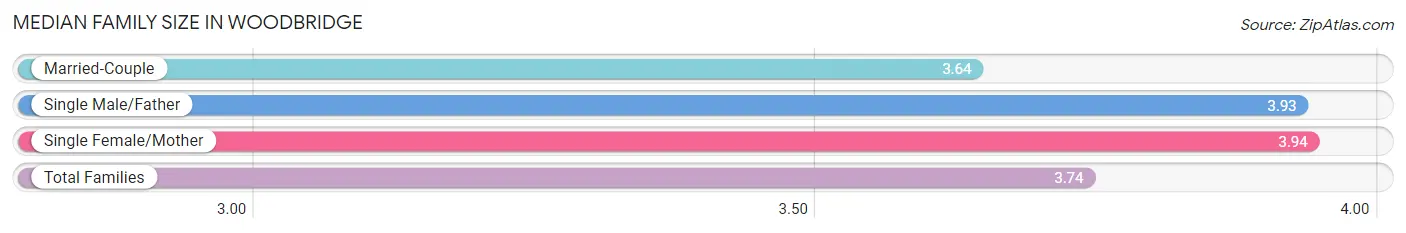
| Family Type | # Families | Family Size |
| Married-Couple | 6,250 (66.4%) | 3.64 |
| Single Male/Father | 983 (10.4%) | 3.93 |
| Single Female/Mother | 2,175 (23.1%) | 3.94 |
| Total Families | 9,408 (100.0%) | 3.74 |
Median Household Size in Woodbridge
The median household size in Woodbridge is 3.12 persons per household, with single male/father households (983 | 7.2%) accounting for the largest median household size of 4.57 persons per household. non-family households (4,247 | 31.1%) represent the smallest median household size with 1.40 persons per household.
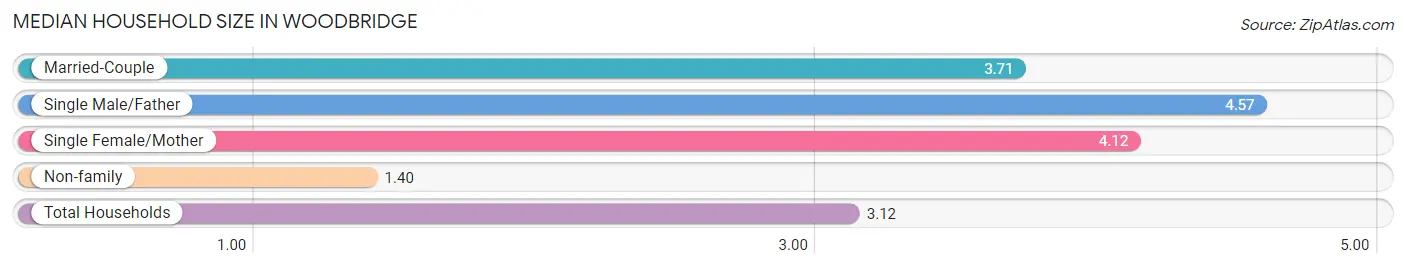
| Household Type | # Households | Household Size |
| Married-Couple | 6,250 (45.8%) | 3.71 |
| Single Male/Father | 983 (7.2%) | 4.57 |
| Single Female/Mother | 2,175 (15.9%) | 4.12 |
| Non-family | 4,247 (31.1%) | 1.40 |
| Total Households | 13,655 (100.0%) | 3.12 |
Household Size by Marriage Status in Woodbridge
Out of a total of 13,655 households in Woodbridge, 9,408 (68.9%) are family households, while 4,247 (31.1%) are nonfamily households. The most numerous type of family households are 2-person households, comprising 2,642, and the most common type of nonfamily households are 1-person households, comprising 3,303.
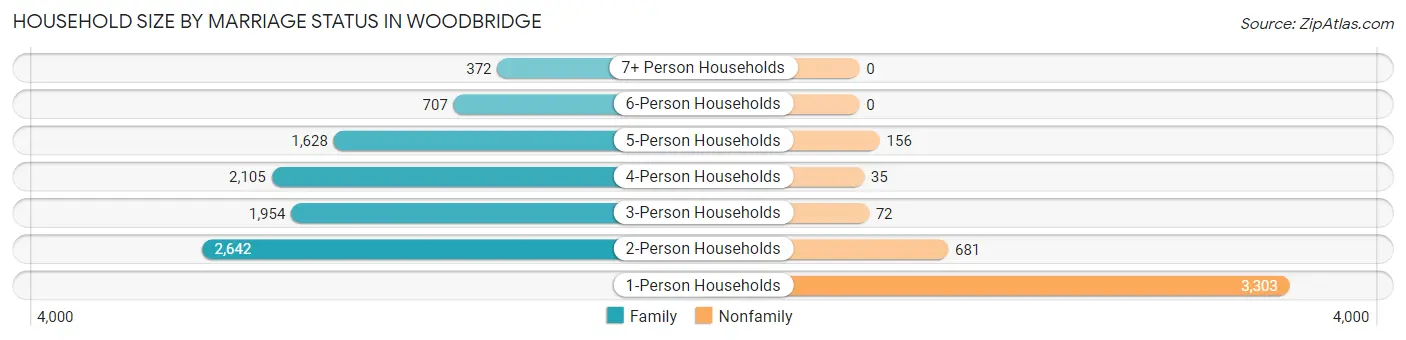
| Household Size | Family Households | Nonfamily Households |
| 1-Person Households | - | 3,303 (24.2%) |
| 2-Person Households | 2,642 (19.4%) | 681 (5.0%) |
| 3-Person Households | 1,954 (14.3%) | 72 (0.5%) |
| 4-Person Households | 2,105 (15.4%) | 35 (0.3%) |
| 5-Person Households | 1,628 (11.9%) | 156 (1.1%) |
| 6-Person Households | 707 (5.2%) | 0 (0.0%) |
| 7+ Person Households | 372 (2.7%) | 0 (0.0%) |
| Total | 9,408 (68.9%) | 4,247 (31.1%) |
Female Fertility in Woodbridge
Fertility by Age in Woodbridge
Average fertility rate in Woodbridge is 82.0 births per 1,000 women. Women in the age bracket of 20 to 34 years have the highest fertility rate with 118.0 births per 1,000 women. Women in the age bracket of 20 to 34 years acount for 68.0% of all women with births.
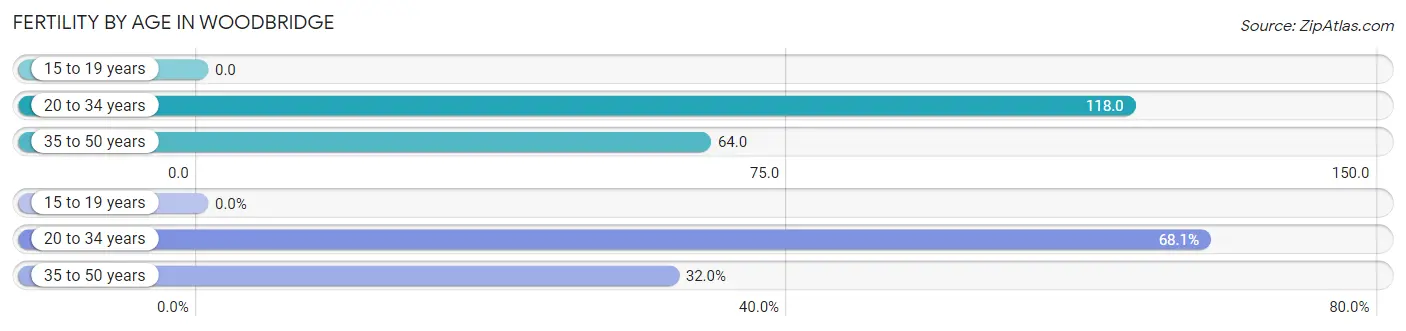
| Age Bracket | Women with Births | Births / 1,000 Women |
| 15 to 19 years | 0 (0.0%) | 0.0 |
| 20 to 34 years | 641 (68.0%) | 118.0 |
| 35 to 50 years | 301 (32.0%) | 64.0 |
| Total | 942 (100.0%) | 82.0 |
Fertility by Age by Marriage Status in Woodbridge
71.0% of women with births (942) in Woodbridge are married. The highest percentage of unmarried women with births falls into 35 to 50 years age bracket with 58.8% of them unmarried at the time of birth, while the lowest percentage of unmarried women with births belong to 20 to 34 years age bracket with 15.0% of them unmarried.
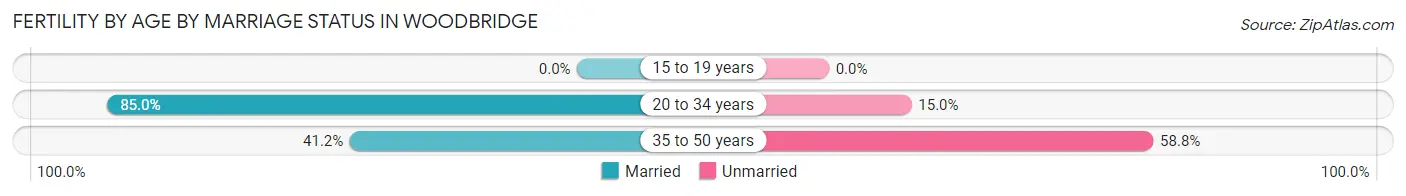
| Age Bracket | Married | Unmarried |
| 15 to 19 years | 0 (0.0%) | 0 (0.0%) |
| 20 to 34 years | 545 (85.0%) | 96 (15.0%) |
| 35 to 50 years | 124 (41.2%) | 177 (58.8%) |
| Total | 669 (71.0%) | 273 (29.0%) |
Fertility by Education in Woodbridge
Average fertility rate in Woodbridge is 82.0 births per 1,000 women. Women with the education attainment of college or associate's degree have the highest fertility rate of 170.0 births per 1,000 women, while women with the education attainment of bachelor's degree have the lowest fertility at 16.0 births per 1,000 women. Women with the education attainment of college or associate's degree represent 52.8% of all women with births.
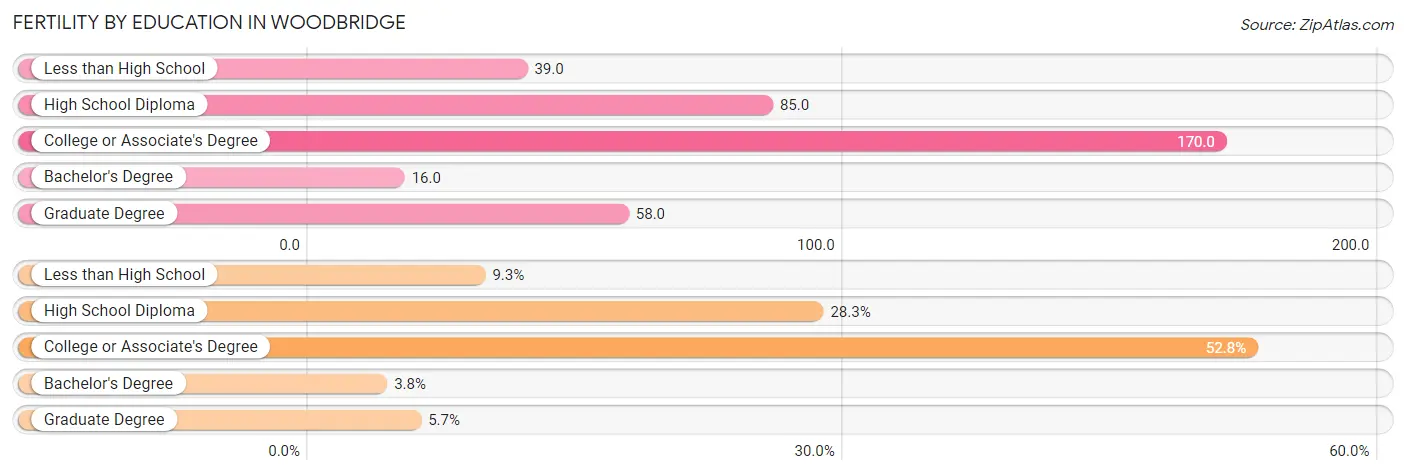
| Educational Attainment | Women with Births | Births / 1,000 Women |
| Less than High School | 88 (9.3%) | 39.0 |
| High School Diploma | 267 (28.3%) | 85.0 |
| College or Associate's Degree | 497 (52.8%) | 170.0 |
| Bachelor's Degree | 36 (3.8%) | 16.0 |
| Graduate Degree | 54 (5.7%) | 58.0 |
| Total | 942 (100.0%) | 82.0 |
Fertility by Education by Marriage Status in Woodbridge
29.0% of women with births in Woodbridge are unmarried. Women with the educational attainment of less than high school are most likely to be married with 100.0% of them married at childbirth, while women with the educational attainment of high school diploma are least likely to be married with 36.7% of them unmarried at childbirth.
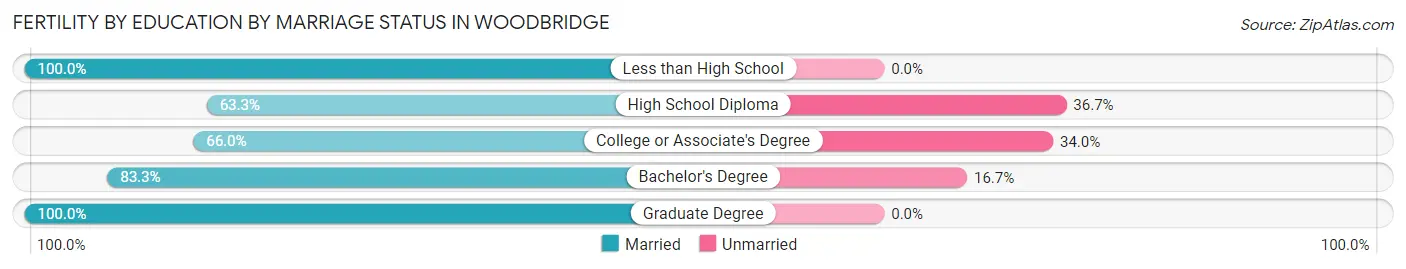
| Educational Attainment | Married | Unmarried |
| Less than High School | 88 (100.0%) | 0 (0.0%) |
| High School Diploma | 169 (63.3%) | 98 (36.7%) |
| College or Associate's Degree | 328 (66.0%) | 169 (34.0%) |
| Bachelor's Degree | 30 (83.3%) | 6 (16.7%) |
| Graduate Degree | 54 (100.0%) | 0 (0.0%) |
| Total | 669 (71.0%) | 273 (29.0%) |
Employment Characteristics in Woodbridge
Employment by Class of Employer in Woodbridge
Among the 23,094 employed individuals in Woodbridge, private company employees (15,128 | 65.5%), federal government employees (2,566 | 11.1%), and not-for-profit organizations (1,580 | 6.8%) make up the most common classes of employment.
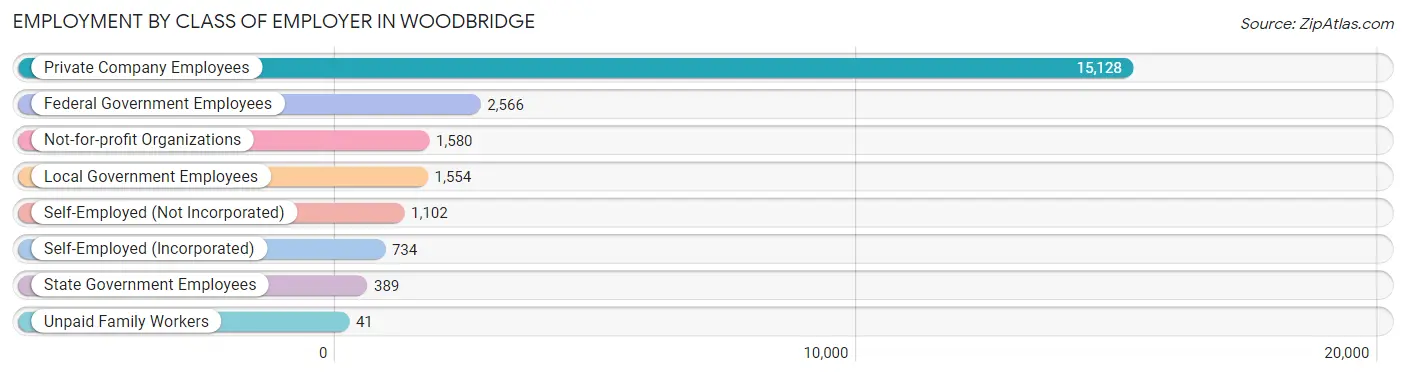
| Employer Class | # Employees | % Employees |
| Private Company Employees | 15,128 | 65.5% |
| Self-Employed (Incorporated) | 734 | 3.2% |
| Self-Employed (Not Incorporated) | 1,102 | 4.8% |
| Not-for-profit Organizations | 1,580 | 6.8% |
| Local Government Employees | 1,554 | 6.7% |
| State Government Employees | 389 | 1.7% |
| Federal Government Employees | 2,566 | 11.1% |
| Unpaid Family Workers | 41 | 0.2% |
| Total | 23,094 | 100.0% |
Employment Status by Age in Woodbridge
According to the labor force statistics for Woodbridge, out of the total population over 16 years of age (33,133), 76.4% or 25,314 individuals are in the labor force, with 7.4% or 1,873 of them unemployed. The age group with the highest labor force participation rate is 30 to 34 years, with 93.3% or 3,043 individuals in the labor force. Within the labor force, the 16 to 19 years age range has the highest percentage of unemployed individuals, with 39.7% or 337 of them being unemployed.
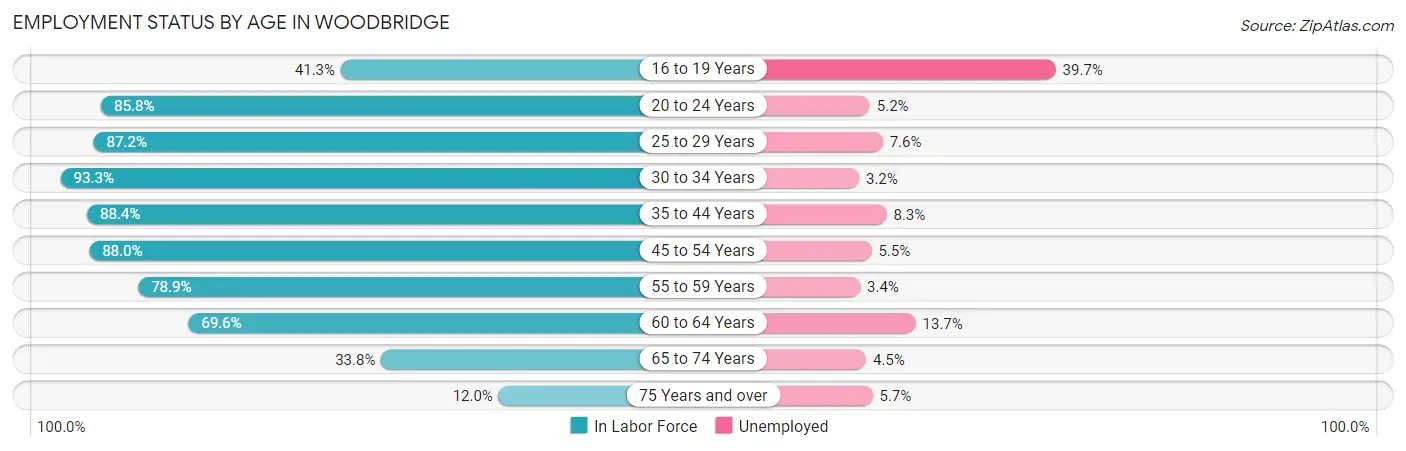
| Age Bracket | In Labor Force | Unemployed |
| 16 to 19 Years | 849 (41.3%) | 337 (39.7%) |
| 20 to 24 Years | 3,393 (85.8%) | 176 (5.2%) |
| 25 to 29 Years | 2,759 (87.2%) | 210 (7.6%) |
| 30 to 34 Years | 3,043 (93.3%) | 97 (3.2%) |
| 35 to 44 Years | 5,504 (88.4%) | 457 (8.3%) |
| 45 to 54 Years | 5,425 (88.0%) | 298 (5.5%) |
| 55 to 59 Years | 1,950 (78.9%) | 66 (3.4%) |
| 60 to 64 Years | 1,309 (69.6%) | 179 (13.7%) |
| 65 to 74 Years | 943 (33.8%) | 42 (4.5%) |
| 75 Years and over | 140 (12.0%) | 8 (5.7%) |
| Total | 25,314 (76.4%) | 1,873 (7.4%) |
Employment Status by Educational Attainment in Woodbridge
According to labor force statistics for Woodbridge, 86.3% of individuals (19,995) out of the total population between 25 and 64 years of age (23,169) are in the labor force, with 6.6% or 1,320 of them being unemployed. The group with the highest labor force participation rate are those with the educational attainment of college / associate degree, with 90.9% or 5,171 individuals in the labor force. Within the labor force, individuals with less than high school education have the highest percentage of unemployment, with 14.0% or 366 of them being unemployed.
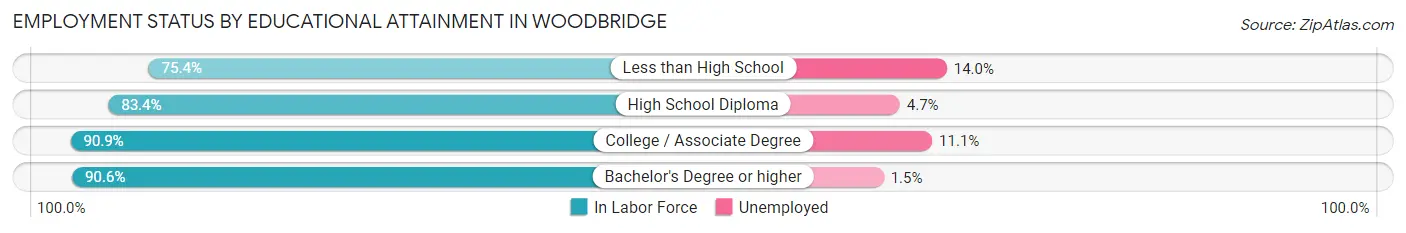
| Educational Attainment | In Labor Force | Unemployed |
| Less than High School | 2,613 (75.4%) | 485 (14.0%) |
| High School Diploma | 5,630 (83.4%) | 317 (4.7%) |
| College / Associate Degree | 5,171 (90.9%) | 631 (11.1%) |
| Bachelor's Degree or higher | 6,582 (90.6%) | 109 (1.5%) |
| Total | 19,995 (86.3%) | 1,529 (6.6%) |
Employment Occupations by Sex in Woodbridge
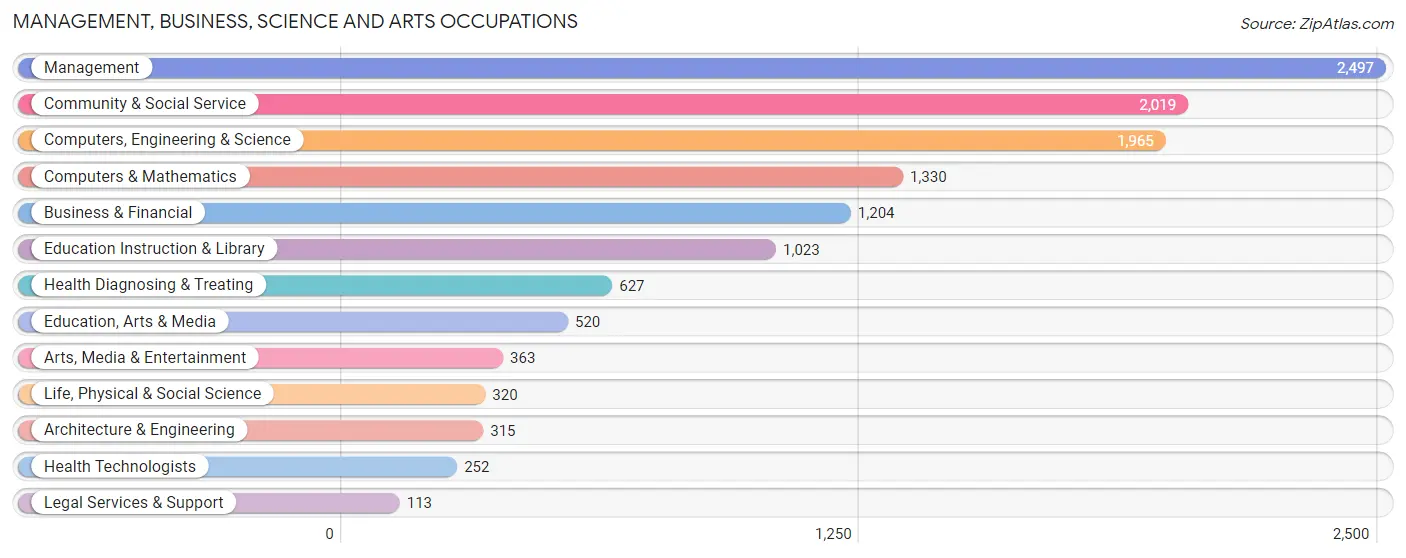
Management, Business, Science and Arts Occupations
The most common Management, Business, Science and Arts occupations in Woodbridge are Management (2,497 | 10.8%), Community & Social Service (2,019 | 8.7%), Computers, Engineering & Science (1,965 | 8.5%), Computers & Mathematics (1,330 | 5.7%), and Business & Financial (1,204 | 5.2%).
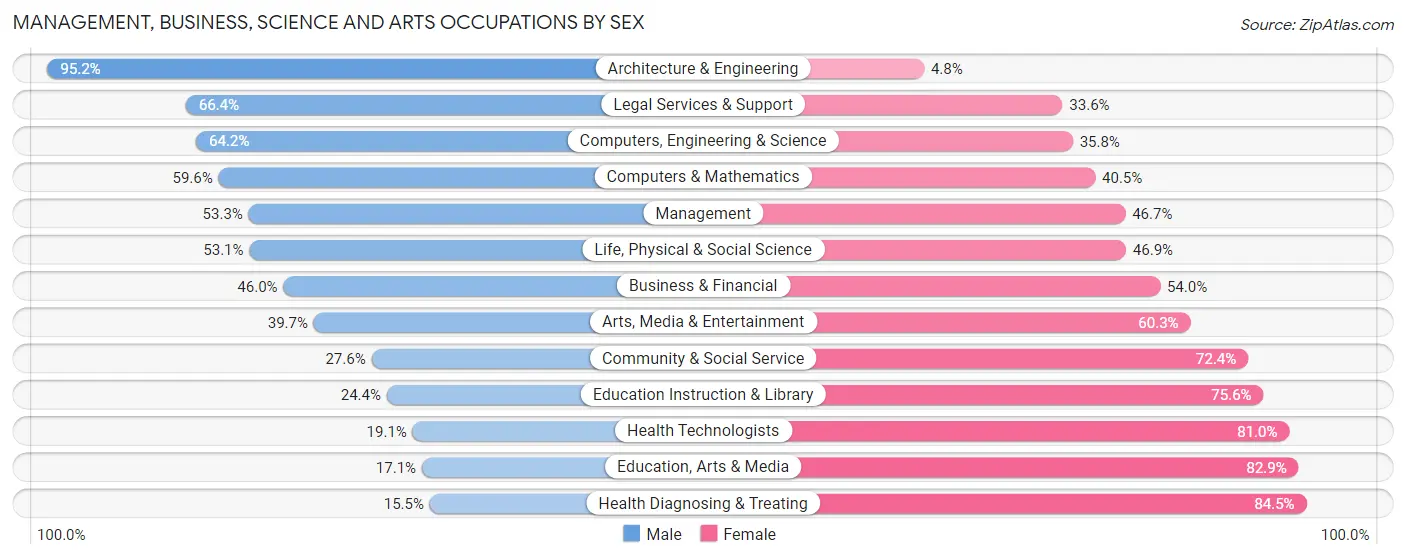
Management, Business, Science and Arts Occupations by Sex
Within the Management, Business, Science and Arts occupations in Woodbridge, the most male-oriented occupations are Architecture & Engineering (95.2%), Legal Services & Support (66.4%), and Computers, Engineering & Science (64.2%), while the most female-oriented occupations are Health Diagnosing & Treating (84.5%), Education, Arts & Media (82.9%), and Health Technologists (80.9%).
| Occupation | Male | Female |
| Management | 1,330 (53.3%) | 1,167 (46.7%) |
| Business & Financial | 554 (46.0%) | 650 (54.0%) |
| Computers, Engineering & Science | 1,262 (64.2%) | 703 (35.8%) |
| Computers & Mathematics | 792 (59.6%) | 538 (40.5%) |
| Architecture & Engineering | 300 (95.2%) | 15 (4.8%) |
| Life, Physical & Social Science | 170 (53.1%) | 150 (46.9%) |
| Community & Social Service | 558 (27.6%) | 1,461 (72.4%) |
| Education, Arts & Media | 89 (17.1%) | 431 (82.9%) |
| Legal Services & Support | 75 (66.4%) | 38 (33.6%) |
| Education Instruction & Library | 250 (24.4%) | 773 (75.6%) |
| Arts, Media & Entertainment | 144 (39.7%) | 219 (60.3%) |
| Health Diagnosing & Treating | 97 (15.5%) | 530 (84.5%) |
| Health Technologists | 48 (19.1%) | 204 (80.9%) |
| Total (Category) | 3,801 (45.7%) | 4,511 (54.3%) |
| Total (Overall) | 12,516 (54.0%) | 10,653 (46.0%) |
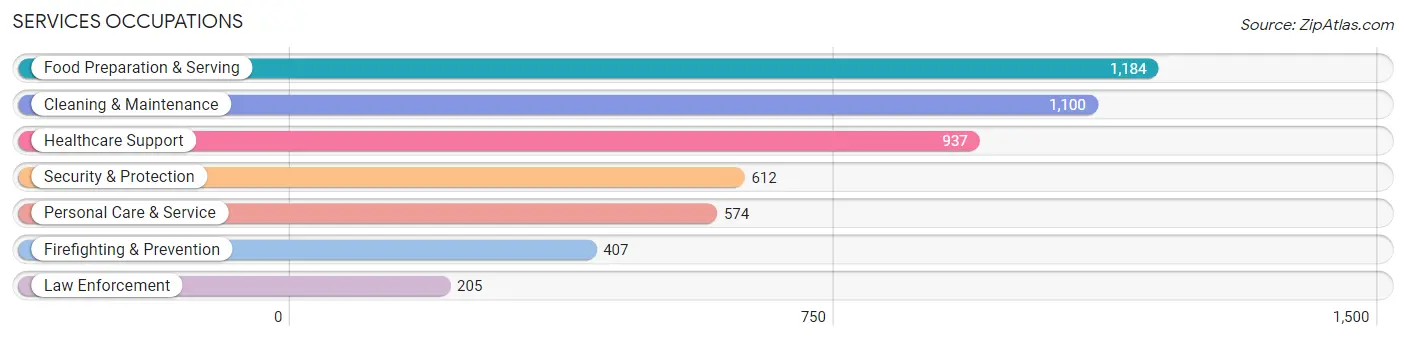
Services Occupations
The most common Services occupations in Woodbridge are Food Preparation & Serving (1,184 | 5.1%), Cleaning & Maintenance (1,100 | 4.8%), Healthcare Support (937 | 4.0%), Security & Protection (612 | 2.6%), and Personal Care & Service (574 | 2.5%).
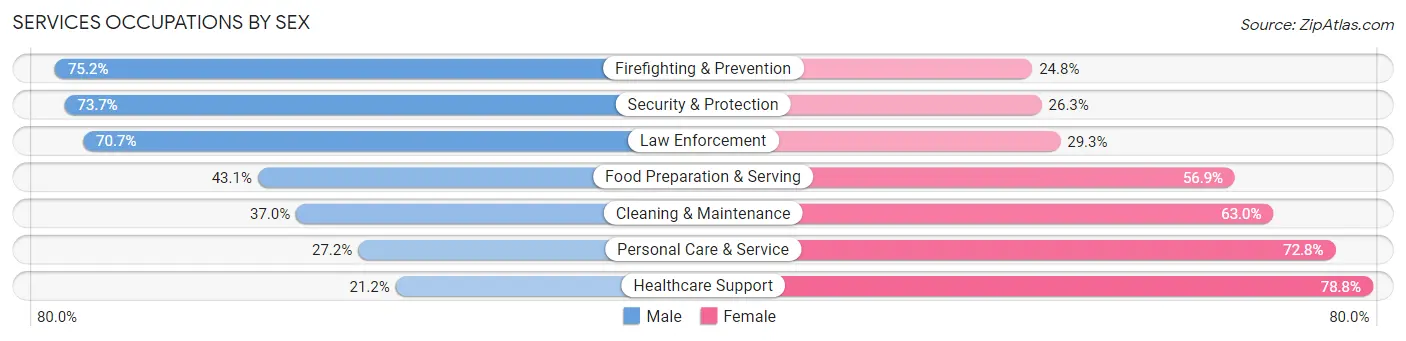
Services Occupations by Sex
Within the Services occupations in Woodbridge, the most male-oriented occupations are Firefighting & Prevention (75.2%), Security & Protection (73.7%), and Law Enforcement (70.7%), while the most female-oriented occupations are Healthcare Support (78.8%), Personal Care & Service (72.8%), and Cleaning & Maintenance (63.0%).
| Occupation | Male | Female |
| Healthcare Support | 199 (21.2%) | 738 (78.8%) |
| Security & Protection | 451 (73.7%) | 161 (26.3%) |
| Firefighting & Prevention | 306 (75.2%) | 101 (24.8%) |
| Law Enforcement | 145 (70.7%) | 60 (29.3%) |
| Food Preparation & Serving | 510 (43.1%) | 674 (56.9%) |
| Cleaning & Maintenance | 407 (37.0%) | 693 (63.0%) |
| Personal Care & Service | 156 (27.2%) | 418 (72.8%) |
| Total (Category) | 1,723 (39.1%) | 2,684 (60.9%) |
| Total (Overall) | 12,516 (54.0%) | 10,653 (46.0%) |
Sales and Office Occupations
The most common Sales and Office occupations in Woodbridge are Office & Administration (2,128 | 9.2%), and Sales & Related (2,097 | 9.0%).

Sales and Office Occupations by Sex

| Occupation | Male | Female |
| Sales & Related | 1,243 (59.3%) | 854 (40.7%) |
| Office & Administration | 404 (19.0%) | 1,724 (81.0%) |
| Total (Category) | 1,647 (39.0%) | 2,578 (61.0%) |
| Total (Overall) | 12,516 (54.0%) | 10,653 (46.0%) |
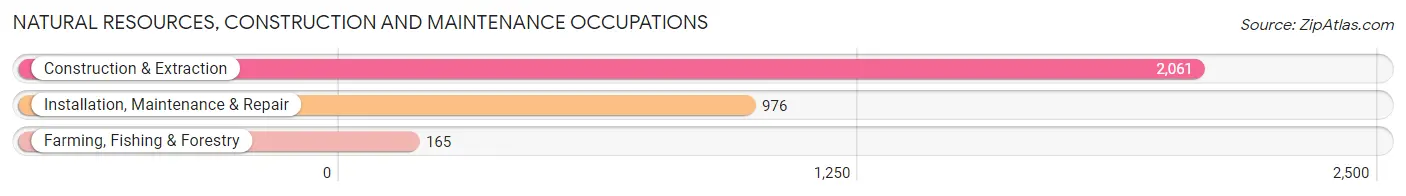
Natural Resources, Construction and Maintenance Occupations
The most common Natural Resources, Construction and Maintenance occupations in Woodbridge are Construction & Extraction (2,061 | 8.9%), Installation, Maintenance & Repair (976 | 4.2%), and Farming, Fishing & Forestry (165 | 0.7%).
Natural Resources, Construction and Maintenance Occupations by Sex
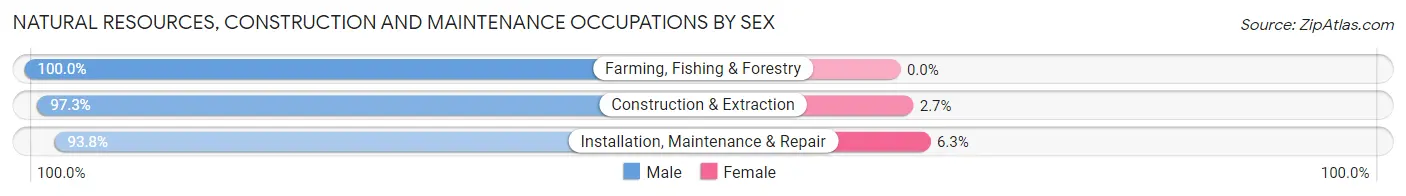
| Occupation | Male | Female |
| Farming, Fishing & Forestry | 165 (100.0%) | 0 (0.0%) |
| Construction & Extraction | 2,006 (97.3%) | 55 (2.7%) |
| Installation, Maintenance & Repair | 915 (93.8%) | 61 (6.2%) |
| Total (Category) | 3,086 (96.4%) | 116 (3.6%) |
| Total (Overall) | 12,516 (54.0%) | 10,653 (46.0%) |
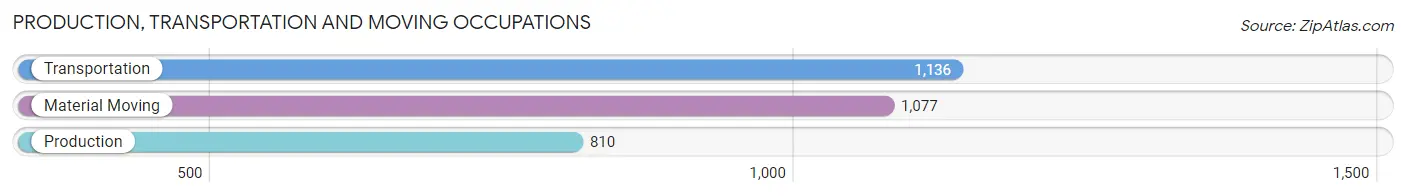
Production, Transportation and Moving Occupations
The most common Production, Transportation and Moving occupations in Woodbridge are Transportation (1,136 | 4.9%), Material Moving (1,077 | 4.6%), and Production (810 | 3.5%).
Production, Transportation and Moving Occupations by Sex
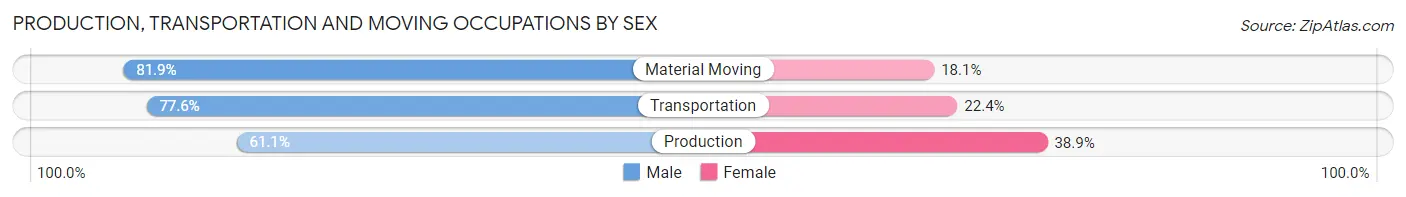
| Occupation | Male | Female |
| Production | 495 (61.1%) | 315 (38.9%) |
| Transportation | 882 (77.6%) | 254 (22.4%) |
| Material Moving | 882 (81.9%) | 195 (18.1%) |
| Total (Category) | 2,259 (74.7%) | 764 (25.3%) |
| Total (Overall) | 12,516 (54.0%) | 10,653 (46.0%) |
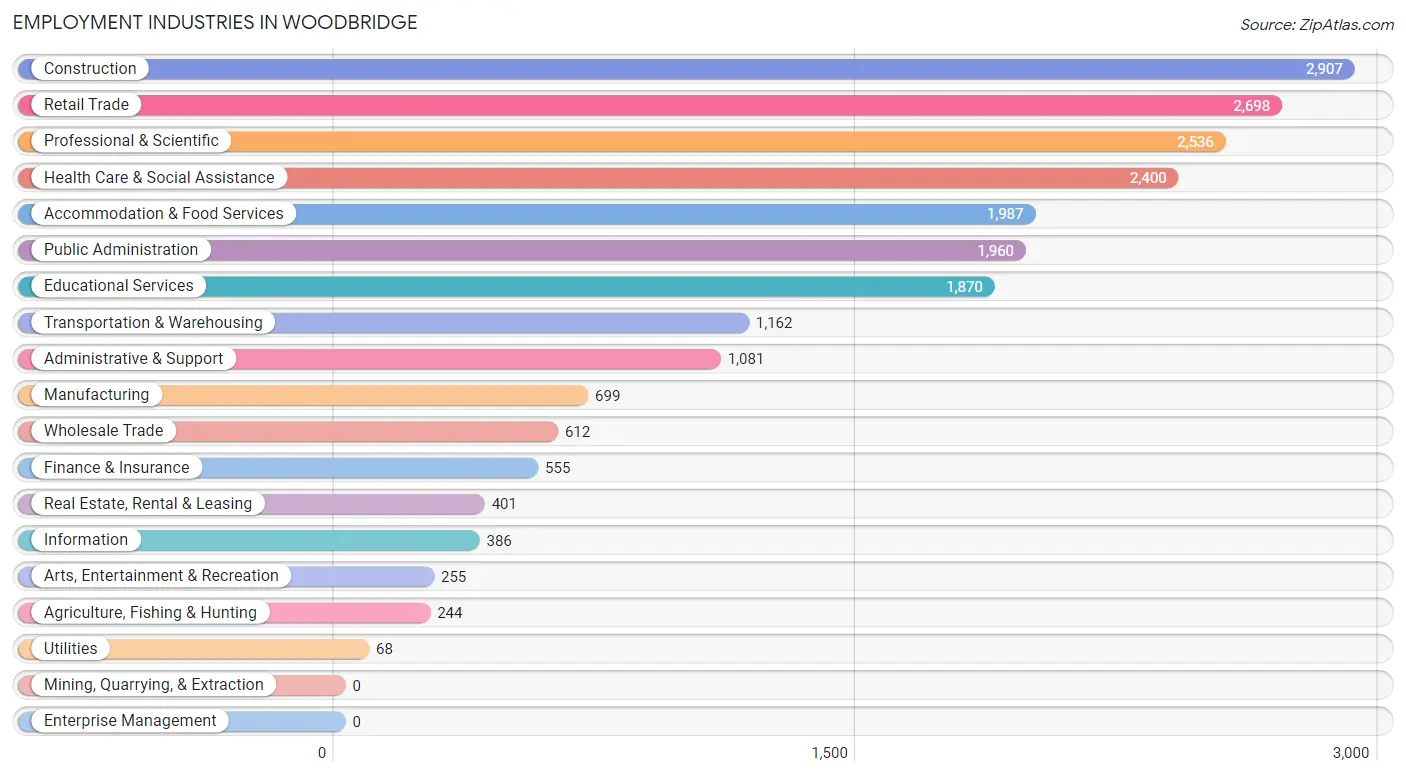
Employment Industries by Sex in Woodbridge
Employment Industries in Woodbridge
The major employment industries in Woodbridge include Construction (2,907 | 12.6%), Retail Trade (2,698 | 11.6%), Professional & Scientific (2,536 | 11.0%), Health Care & Social Assistance (2,400 | 10.4%), and Accommodation & Food Services (1,987 | 8.6%).
Employment Industries by Sex in Woodbridge
The Woodbridge industries that see more men than women are Agriculture, Fishing & Hunting (100.0%), Utilities (100.0%), and Construction (94.0%), whereas the industries that tend to have a higher number of women are Educational Services (83.6%), Health Care & Social Assistance (74.5%), and Information (73.3%).
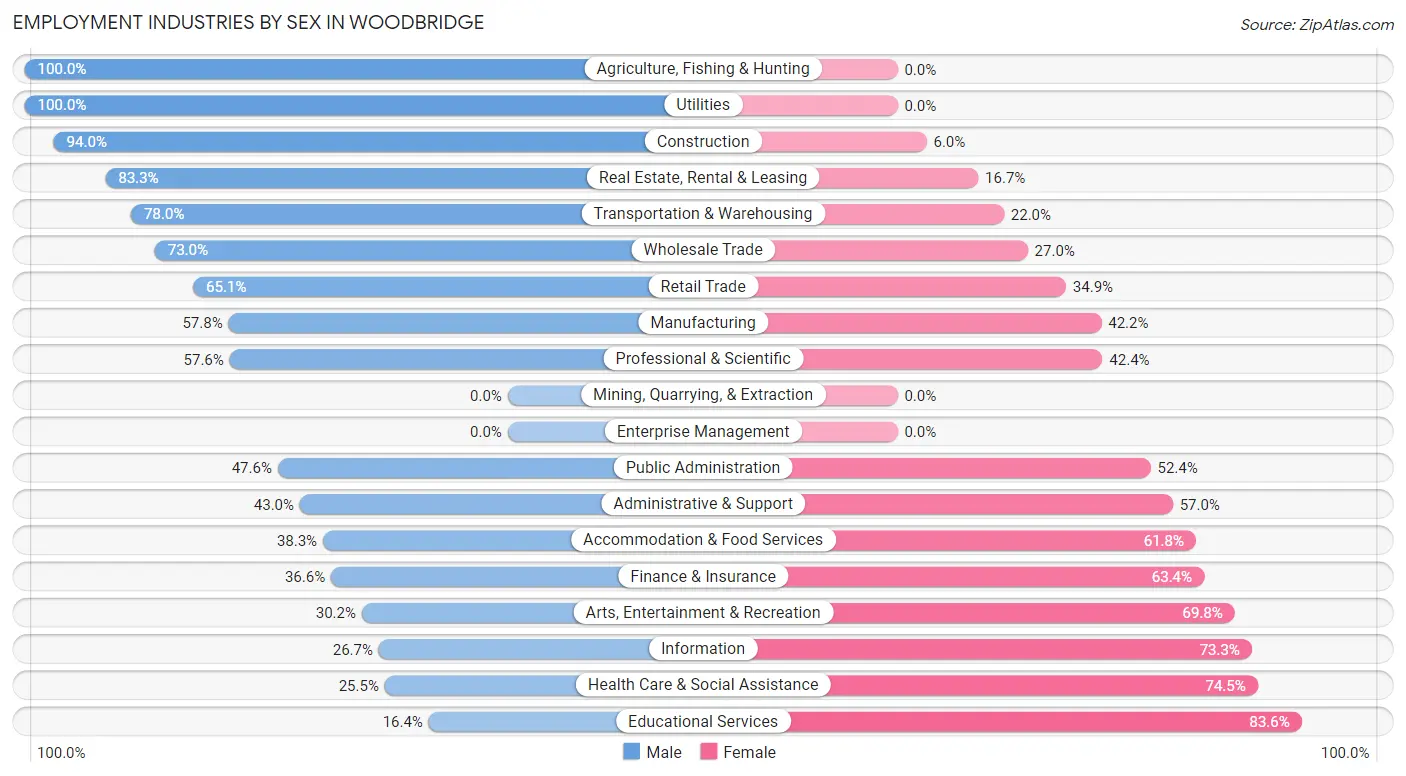
| Industry | Male | Female |
| Agriculture, Fishing & Hunting | 244 (100.0%) | 0 (0.0%) |
| Mining, Quarrying, & Extraction | 0 (0.0%) | 0 (0.0%) |
| Construction | 2,732 (94.0%) | 175 (6.0%) |
| Manufacturing | 404 (57.8%) | 295 (42.2%) |
| Wholesale Trade | 447 (73.0%) | 165 (27.0%) |
| Retail Trade | 1,757 (65.1%) | 941 (34.9%) |
| Transportation & Warehousing | 906 (78.0%) | 256 (22.0%) |
| Utilities | 68 (100.0%) | 0 (0.0%) |
| Information | 103 (26.7%) | 283 (73.3%) |
| Finance & Insurance | 203 (36.6%) | 352 (63.4%) |
| Real Estate, Rental & Leasing | 334 (83.3%) | 67 (16.7%) |
| Professional & Scientific | 1,460 (57.6%) | 1,076 (42.4%) |
| Enterprise Management | 0 (0.0%) | 0 (0.0%) |
| Administrative & Support | 465 (43.0%) | 616 (57.0%) |
| Educational Services | 306 (16.4%) | 1,564 (83.6%) |
| Health Care & Social Assistance | 611 (25.5%) | 1,789 (74.5%) |
| Arts, Entertainment & Recreation | 77 (30.2%) | 178 (69.8%) |
| Accommodation & Food Services | 760 (38.3%) | 1,227 (61.8%) |
| Public Administration | 933 (47.6%) | 1,027 (52.4%) |
| Total | 12,516 (54.0%) | 10,653 (46.0%) |
Education in Woodbridge
School Enrollment in Woodbridge
The most common levels of schooling among the 11,322 students in Woodbridge are elementary school (2,955 | 26.1%), high school (2,338 | 20.6%), and middle school (2,139 | 18.9%).
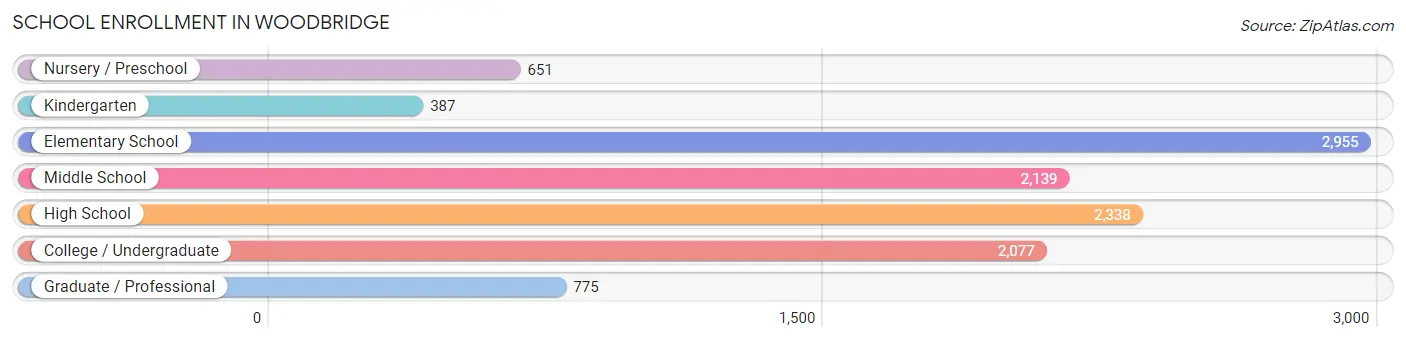
| School Level | # Students | % Students |
| Nursery / Preschool | 651 | 5.8% |
| Kindergarten | 387 | 3.4% |
| Elementary School | 2,955 | 26.1% |
| Middle School | 2,139 | 18.9% |
| High School | 2,338 | 20.6% |
| College / Undergraduate | 2,077 | 18.3% |
| Graduate / Professional | 775 | 6.9% |
| Total | 11,322 | 100.0% |
School Enrollment by Age by Funding Source in Woodbridge
Out of a total of 11,322 students who are enrolled in schools in Woodbridge, 1,279 (11.3%) attend a private institution, while the remaining 10,043 (88.7%) are enrolled in public schools. The age group of 35 years and over has the highest likelihood of being enrolled in private schools, with 211 (40.8% in the age bracket) enrolled. Conversely, the age group of 10 to 14 year olds has the lowest likelihood of being enrolled in a private school, with 2,471 (99.2% in the age bracket) attending a public institution.
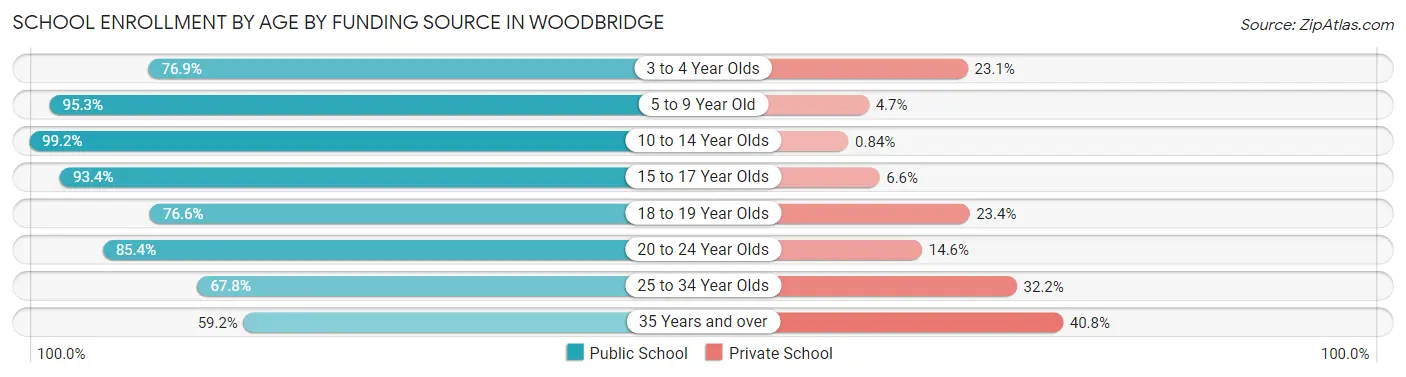
| Age Bracket | Public School | Private School |
| 3 to 4 Year Olds | 453 (76.9%) | 136 (23.1%) |
| 5 to 9 Year Old | 3,103 (95.3%) | 152 (4.7%) |
| 10 to 14 Year Olds | 2,471 (99.2%) | 21 (0.8%) |
| 15 to 17 Year Olds | 1,506 (93.4%) | 107 (6.6%) |
| 18 to 19 Year Olds | 560 (76.6%) | 171 (23.4%) |
| 20 to 24 Year Olds | 980 (85.4%) | 167 (14.6%) |
| 25 to 34 Year Olds | 663 (67.8%) | 315 (32.2%) |
| 35 Years and over | 306 (59.2%) | 211 (40.8%) |
| Total | 10,043 (88.7%) | 1,279 (11.3%) |
Educational Attainment by Field of Study in Woodbridge
Business (1,567 | 17.2%), arts & humanities (866 | 9.5%), education (788 | 8.6%), engineering (775 | 8.5%), and social sciences (704 | 7.7%) are the most common fields of study among 9,113 individuals in Woodbridge who have obtained a bachelor's degree or higher.
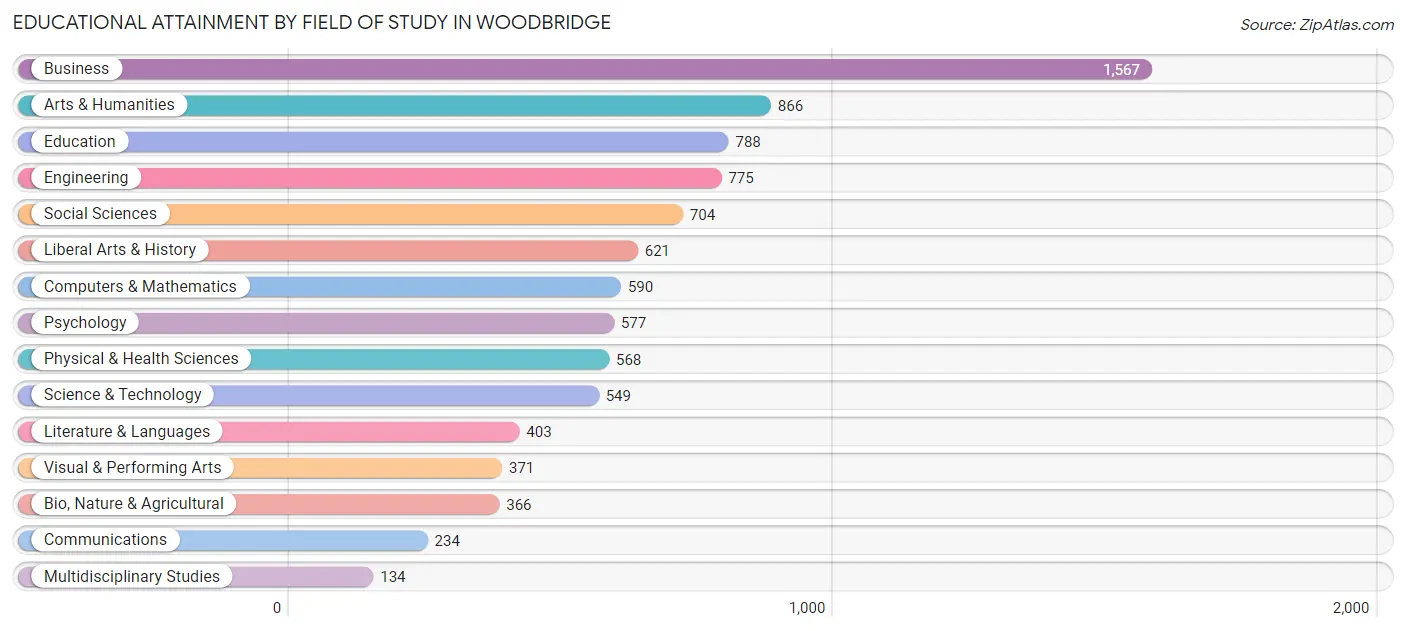
| Field of Study | # Graduates | % Graduates |
| Computers & Mathematics | 590 | 6.5% |
| Bio, Nature & Agricultural | 366 | 4.0% |
| Physical & Health Sciences | 568 | 6.2% |
| Psychology | 577 | 6.3% |
| Social Sciences | 704 | 7.7% |
| Engineering | 775 | 8.5% |
| Multidisciplinary Studies | 134 | 1.5% |
| Science & Technology | 549 | 6.0% |
| Business | 1,567 | 17.2% |
| Education | 788 | 8.6% |
| Literature & Languages | 403 | 4.4% |
| Liberal Arts & History | 621 | 6.8% |
| Visual & Performing Arts | 371 | 4.1% |
| Communications | 234 | 2.6% |
| Arts & Humanities | 866 | 9.5% |
| Total | 9,113 | 100.0% |
Transportation & Commute in Woodbridge
Vehicle Availability by Sex in Woodbridge
The most prevalent vehicle ownership categories in Woodbridge are males with 2 vehicles (4,429, accounting for 35.0%) and females with 2 vehicles (3,250, making up 42.5%).
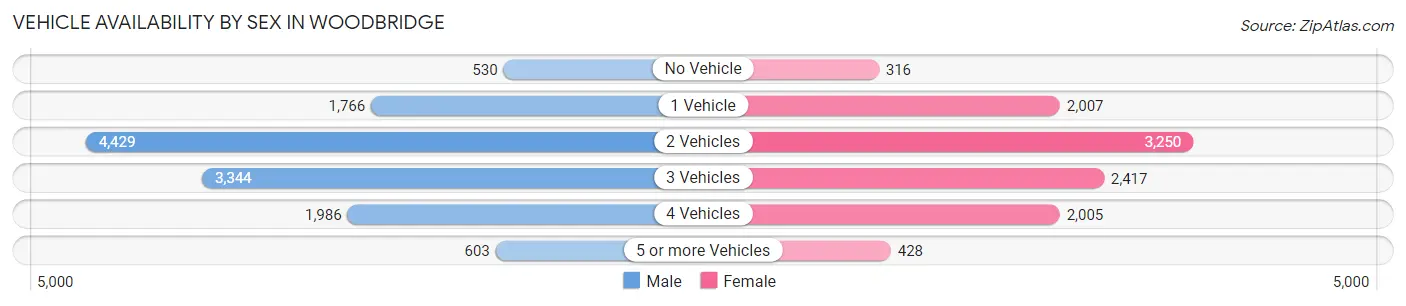
| Vehicles Available | Male | Female |
| No Vehicle | 530 (4.2%) | 316 (3.0%) |
| 1 Vehicle | 1,766 (14.0%) | 2,007 (19.3%) |
| 2 Vehicles | 4,429 (35.0%) | 3,250 (31.2%) |
| 3 Vehicles | 3,344 (26.4%) | 2,417 (23.2%) |
| 4 Vehicles | 1,986 (15.7%) | 2,005 (19.2%) |
| 5 or more Vehicles | 603 (4.8%) | 428 (4.1%) |
| Total | 12,658 (100.0%) | 10,423 (100.0%) |
Commute Time in Woodbridge
The most frequently occuring commute durations in Woodbridge are 45 to 59 minutes (4,055 commuters, 19.8%), 30 to 34 minutes (3,909 commuters, 19.1%), and 60 to 89 minutes (2,673 commuters, 13.0%).

| Commute Time | # Commuters | % Commuters |
| Less than 5 Minutes | 154 | 0.7% |
| 5 to 9 Minutes | 666 | 3.3% |
| 10 to 14 Minutes | 1,468 | 7.2% |
| 15 to 19 Minutes | 2,519 | 12.3% |
| 20 to 24 Minutes | 1,455 | 7.1% |
| 25 to 29 Minutes | 557 | 2.7% |
| 30 to 34 Minutes | 3,909 | 19.1% |
| 35 to 39 Minutes | 906 | 4.4% |
| 40 to 44 Minutes | 1,147 | 5.6% |
| 45 to 59 Minutes | 4,055 | 19.8% |
| 60 to 89 Minutes | 2,673 | 13.0% |
| 90 or more Minutes | 988 | 4.8% |
Commute Time by Sex in Woodbridge
The most common commute times in Woodbridge are 45 to 59 minutes (2,453 commuters, 21.4%) for males and 30 to 34 minutes (2,166 commuters, 24.0%) for females.
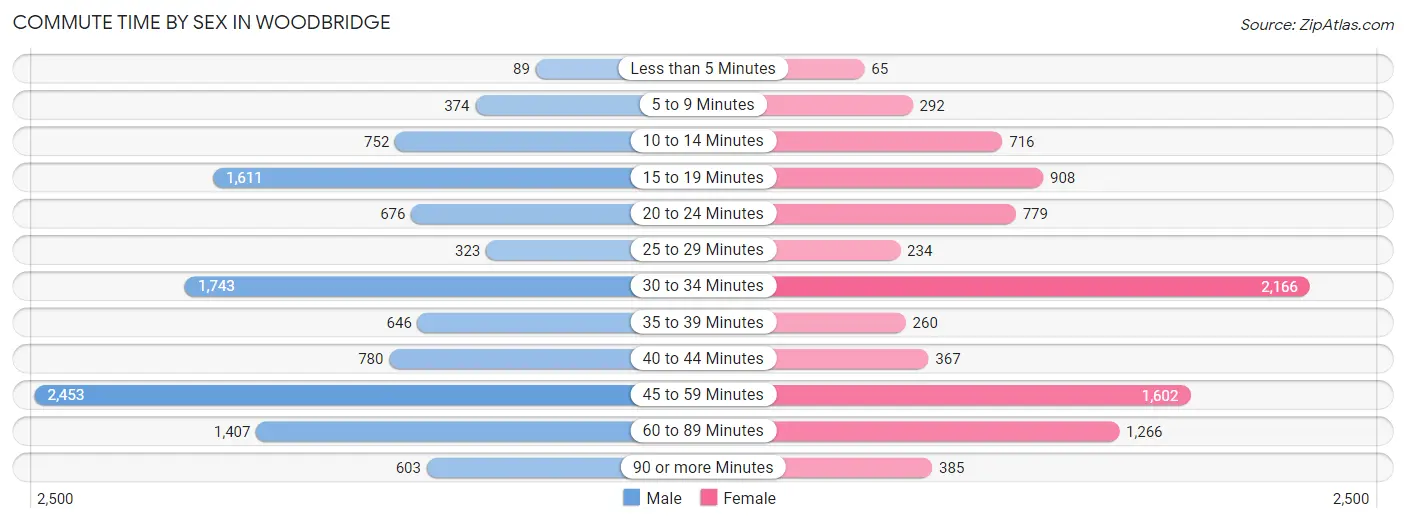
| Commute Time | Male | Female |
| Less than 5 Minutes | 89 (0.8%) | 65 (0.7%) |
| 5 to 9 Minutes | 374 (3.3%) | 292 (3.2%) |
| 10 to 14 Minutes | 752 (6.6%) | 716 (7.9%) |
| 15 to 19 Minutes | 1,611 (14.1%) | 908 (10.0%) |
| 20 to 24 Minutes | 676 (5.9%) | 779 (8.6%) |
| 25 to 29 Minutes | 323 (2.8%) | 234 (2.6%) |
| 30 to 34 Minutes | 1,743 (15.2%) | 2,166 (24.0%) |
| 35 to 39 Minutes | 646 (5.6%) | 260 (2.9%) |
| 40 to 44 Minutes | 780 (6.8%) | 367 (4.1%) |
| 45 to 59 Minutes | 2,453 (21.4%) | 1,602 (17.7%) |
| 60 to 89 Minutes | 1,407 (12.3%) | 1,266 (14.0%) |
| 90 or more Minutes | 603 (5.3%) | 385 (4.3%) |
Time of Departure to Work by Sex in Woodbridge
The most frequent times of departure to work in Woodbridge are 6:00 AM to 6:29 AM (1,403, 12.2%) for males and 7:00 AM to 7:29 AM (1,267, 14.0%) for females.
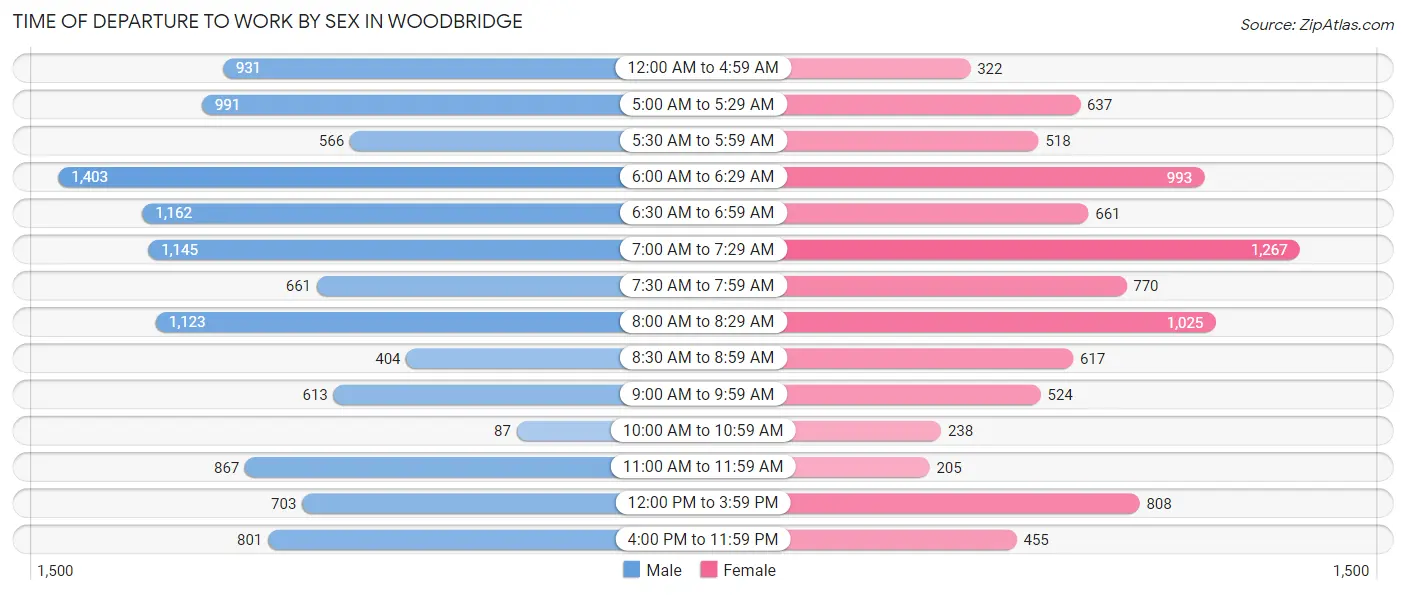
| Time of Departure | Male | Female |
| 12:00 AM to 4:59 AM | 931 (8.1%) | 322 (3.6%) |
| 5:00 AM to 5:29 AM | 991 (8.6%) | 637 (7.0%) |
| 5:30 AM to 5:59 AM | 566 (4.9%) | 518 (5.7%) |
| 6:00 AM to 6:29 AM | 1,403 (12.2%) | 993 (11.0%) |
| 6:30 AM to 6:59 AM | 1,162 (10.1%) | 661 (7.3%) |
| 7:00 AM to 7:29 AM | 1,145 (10.0%) | 1,267 (14.0%) |
| 7:30 AM to 7:59 AM | 661 (5.8%) | 770 (8.5%) |
| 8:00 AM to 8:29 AM | 1,123 (9.8%) | 1,025 (11.3%) |
| 8:30 AM to 8:59 AM | 404 (3.5%) | 617 (6.8%) |
| 9:00 AM to 9:59 AM | 613 (5.3%) | 524 (5.8%) |
| 10:00 AM to 10:59 AM | 87 (0.8%) | 238 (2.6%) |
| 11:00 AM to 11:59 AM | 867 (7.6%) | 205 (2.3%) |
| 12:00 PM to 3:59 PM | 703 (6.1%) | 808 (8.9%) |
| 4:00 PM to 11:59 PM | 801 (7.0%) | 455 (5.0%) |
| Total | 11,457 (100.0%) | 9,040 (100.0%) |
Housing Occupancy in Woodbridge
Occupancy by Ownership in Woodbridge
Of the total 13,655 dwellings in Woodbridge, owner-occupied units account for 8,199 (60.0%), while renter-occupied units make up 5,456 (40.0%).
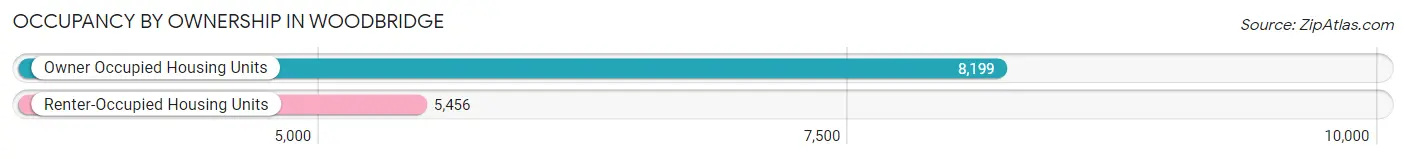
| Occupancy | # Housing Units | % Housing Units |
| Owner Occupied Housing Units | 8,199 | 60.0% |
| Renter-Occupied Housing Units | 5,456 | 40.0% |
| Total Occupied Housing Units | 13,655 | 100.0% |
Occupancy by Household Size in Woodbridge
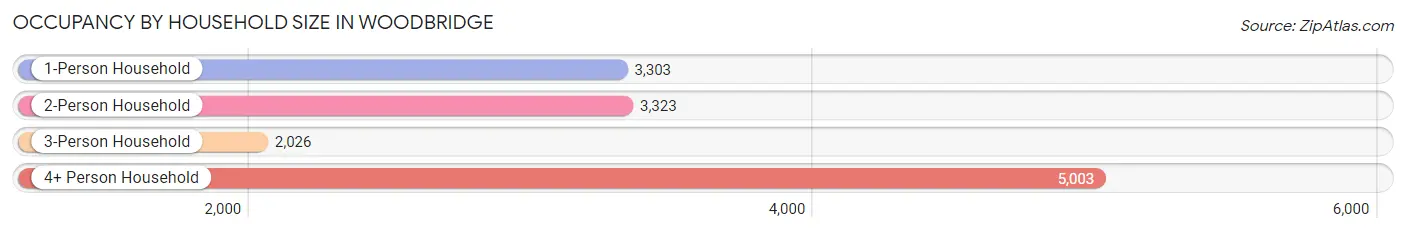
| Household Size | # Housing Units | % Housing Units |
| 1-Person Household | 3,303 | 24.2% |
| 2-Person Household | 3,323 | 24.3% |
| 3-Person Household | 2,026 | 14.8% |
| 4+ Person Household | 5,003 | 36.6% |
| Total Housing Units | 13,655 | 100.0% |
Occupancy by Ownership by Household Size in Woodbridge
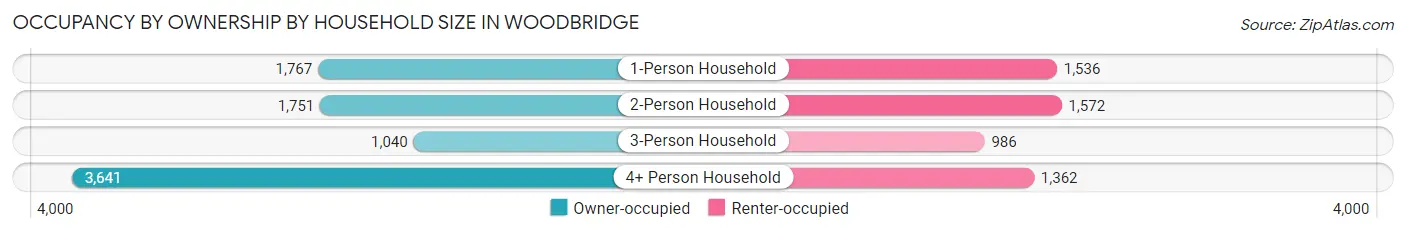
| Household Size | Owner-occupied | Renter-occupied |
| 1-Person Household | 1,767 (53.5%) | 1,536 (46.5%) |
| 2-Person Household | 1,751 (52.7%) | 1,572 (47.3%) |
| 3-Person Household | 1,040 (51.3%) | 986 (48.7%) |
| 4+ Person Household | 3,641 (72.8%) | 1,362 (27.2%) |
| Total Housing Units | 8,199 (60.0%) | 5,456 (40.0%) |
Occupancy by Educational Attainment in Woodbridge
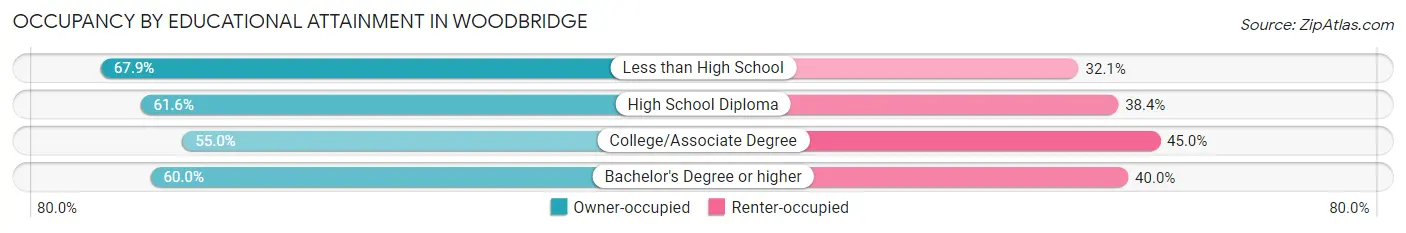
| Household Size | Owner-occupied | Renter-occupied |
| Less than High School | 1,091 (67.9%) | 516 (32.1%) |
| High School Diploma | 2,096 (61.6%) | 1,306 (38.4%) |
| College/Associate Degree | 1,929 (55.0%) | 1,581 (45.0%) |
| Bachelor's Degree or higher | 3,083 (60.0%) | 2,053 (40.0%) |
Occupancy by Age of Householder in Woodbridge
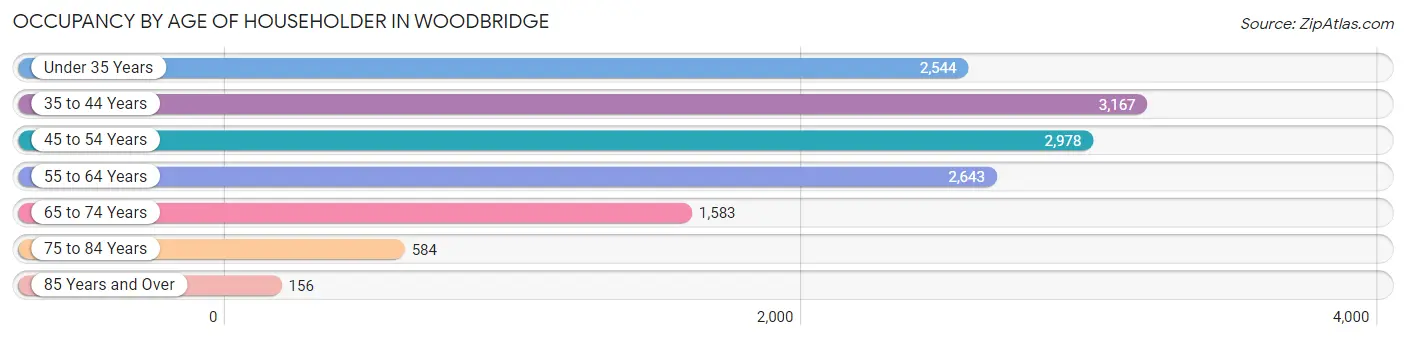
| Age Bracket | # Households | % Households |
| Under 35 Years | 2,544 | 18.6% |
| 35 to 44 Years | 3,167 | 23.2% |
| 45 to 54 Years | 2,978 | 21.8% |
| 55 to 64 Years | 2,643 | 19.4% |
| 65 to 74 Years | 1,583 | 11.6% |
| 75 to 84 Years | 584 | 4.3% |
| 85 Years and Over | 156 | 1.1% |
| Total | 13,655 | 100.0% |
Housing Finances in Woodbridge
Median Income by Occupancy in Woodbridge
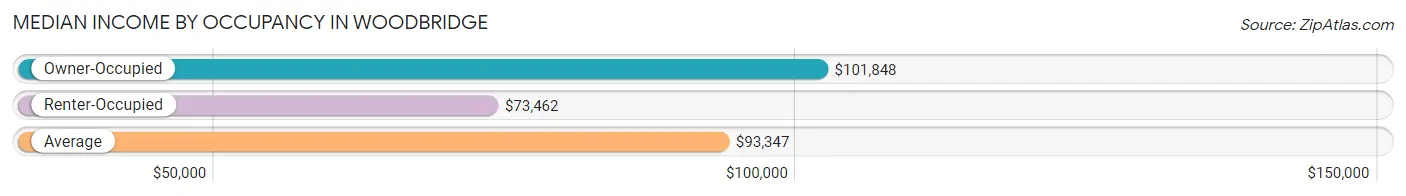
| Occupancy Type | # Households | Median Income |
| Owner-Occupied | 8,199 (60.0%) | $101,848 |
| Renter-Occupied | 5,456 (40.0%) | $73,462 |
| Average | 13,655 (100.0%) | $93,347 |
Occupancy by Householder Income Bracket in Woodbridge
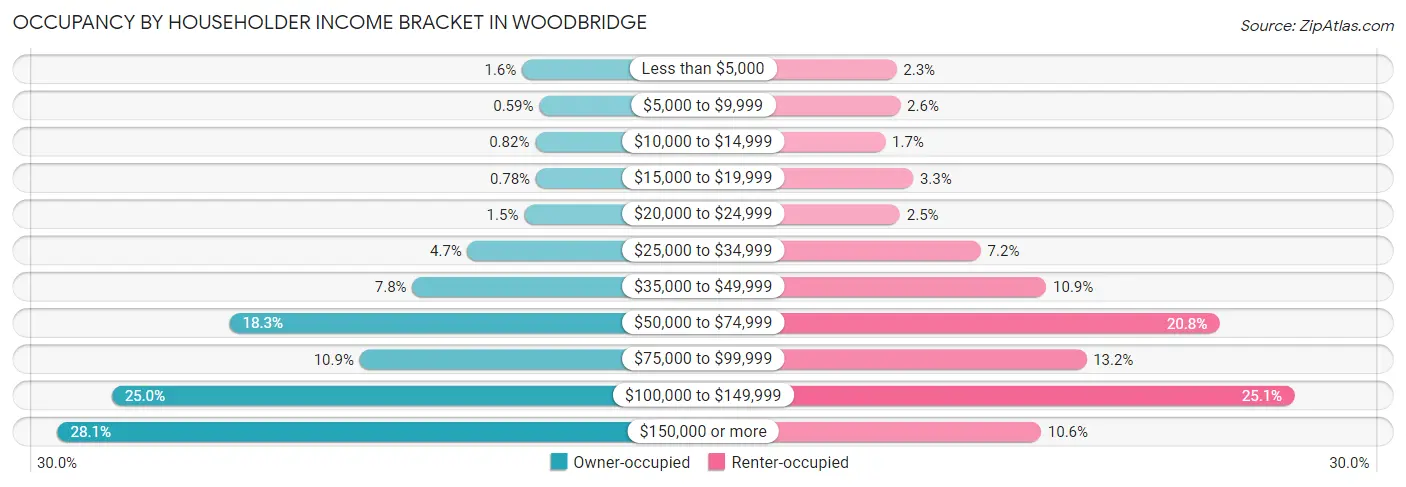
| Income Bracket | Owner-occupied | Renter-occupied |
| Less than $5,000 | 129 (1.6%) | 127 (2.3%) |
| $5,000 to $9,999 | 48 (0.6%) | 139 (2.5%) |
| $10,000 to $14,999 | 67 (0.8%) | 92 (1.7%) |
| $15,000 to $19,999 | 64 (0.8%) | 179 (3.3%) |
| $20,000 to $24,999 | 119 (1.5%) | 138 (2.5%) |
| $25,000 to $34,999 | 384 (4.7%) | 390 (7.1%) |
| $35,000 to $49,999 | 643 (7.8%) | 594 (10.9%) |
| $50,000 to $74,999 | 1,499 (18.3%) | 1,133 (20.8%) |
| $75,000 to $99,999 | 890 (10.8%) | 719 (13.2%) |
| $100,000 to $149,999 | 2,051 (25.0%) | 1,367 (25.1%) |
| $150,000 or more | 2,305 (28.1%) | 578 (10.6%) |
| Total | 8,199 (100.0%) | 5,456 (100.0%) |
Monthly Housing Cost Tiers in Woodbridge
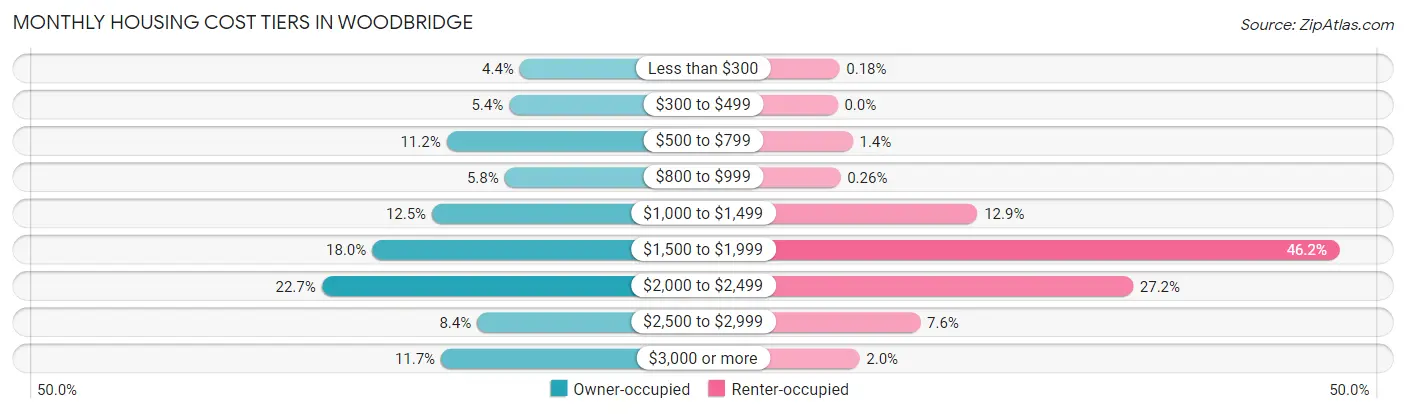
| Monthly Cost | Owner-occupied | Renter-occupied |
| Less than $300 | 362 (4.4%) | 10 (0.2%) |
| $300 to $499 | 443 (5.4%) | 0 (0.0%) |
| $500 to $799 | 915 (11.2%) | 76 (1.4%) |
| $800 to $999 | 477 (5.8%) | 14 (0.3%) |
| $1,000 to $1,499 | 1,025 (12.5%) | 702 (12.9%) |
| $1,500 to $1,999 | 1,477 (18.0%) | 2,518 (46.2%) |
| $2,000 to $2,499 | 1,858 (22.7%) | 1,484 (27.2%) |
| $2,500 to $2,999 | 685 (8.4%) | 415 (7.6%) |
| $3,000 or more | 957 (11.7%) | 110 (2.0%) |
| Total | 8,199 (100.0%) | 5,456 (100.0%) |
Physical Housing Characteristics in Woodbridge
Housing Structures in Woodbridge
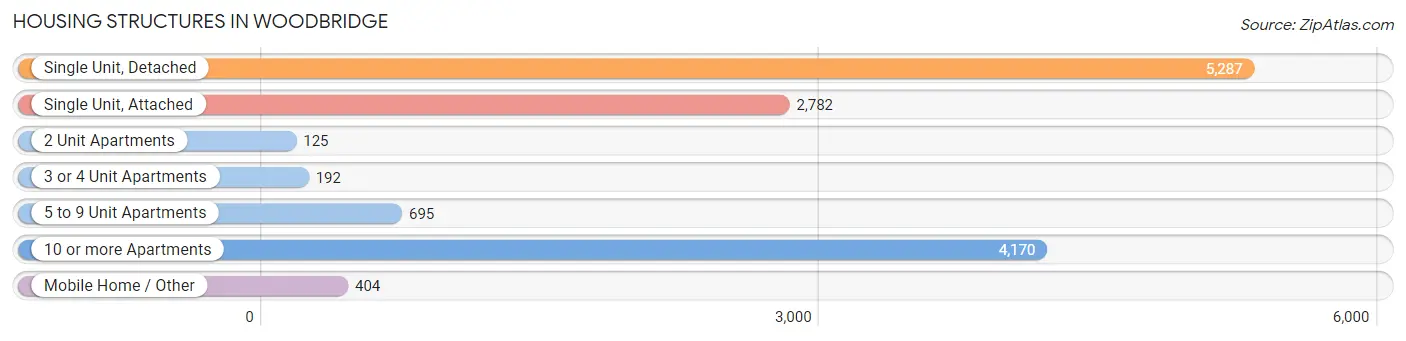
| Structure Type | # Housing Units | % Housing Units |
| Single Unit, Detached | 5,287 | 38.7% |
| Single Unit, Attached | 2,782 | 20.4% |
| 2 Unit Apartments | 125 | 0.9% |
| 3 or 4 Unit Apartments | 192 | 1.4% |
| 5 to 9 Unit Apartments | 695 | 5.1% |
| 10 or more Apartments | 4,170 | 30.5% |
| Mobile Home / Other | 404 | 3.0% |
| Total | 13,655 | 100.0% |
Housing Structures by Occupancy in Woodbridge
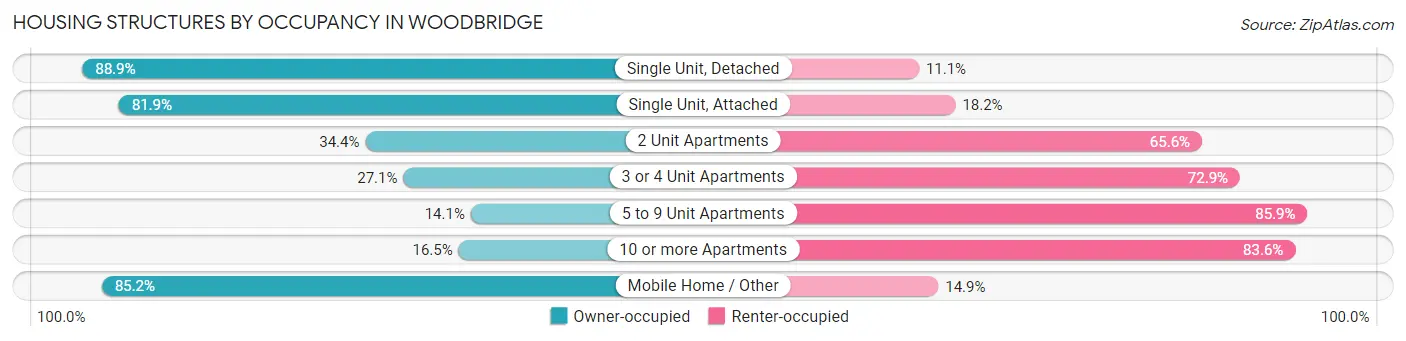
| Structure Type | Owner-occupied | Renter-occupied |
| Single Unit, Detached | 4,699 (88.9%) | 588 (11.1%) |
| Single Unit, Attached | 2,277 (81.9%) | 505 (18.1%) |
| 2 Unit Apartments | 43 (34.4%) | 82 (65.6%) |
| 3 or 4 Unit Apartments | 52 (27.1%) | 140 (72.9%) |
| 5 to 9 Unit Apartments | 98 (14.1%) | 597 (85.9%) |
| 10 or more Apartments | 686 (16.5%) | 3,484 (83.6%) |
| Mobile Home / Other | 344 (85.2%) | 60 (14.8%) |
| Total | 8,199 (60.0%) | 5,456 (40.0%) |
Housing Structures by Number of Rooms in Woodbridge
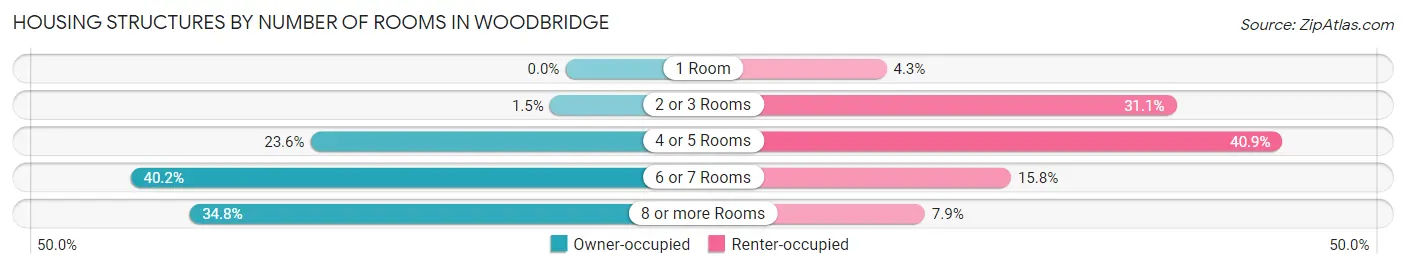
| Number of Rooms | Owner-occupied | Renter-occupied |
| 1 Room | 0 (0.0%) | 235 (4.3%) |
| 2 or 3 Rooms | 119 (1.5%) | 1,697 (31.1%) |
| 4 or 5 Rooms | 1,933 (23.6%) | 2,232 (40.9%) |
| 6 or 7 Rooms | 3,296 (40.2%) | 863 (15.8%) |
| 8 or more Rooms | 2,851 (34.8%) | 429 (7.9%) |
| Total | 8,199 (100.0%) | 5,456 (100.0%) |
Housing Structure by Heating Type in Woodbridge
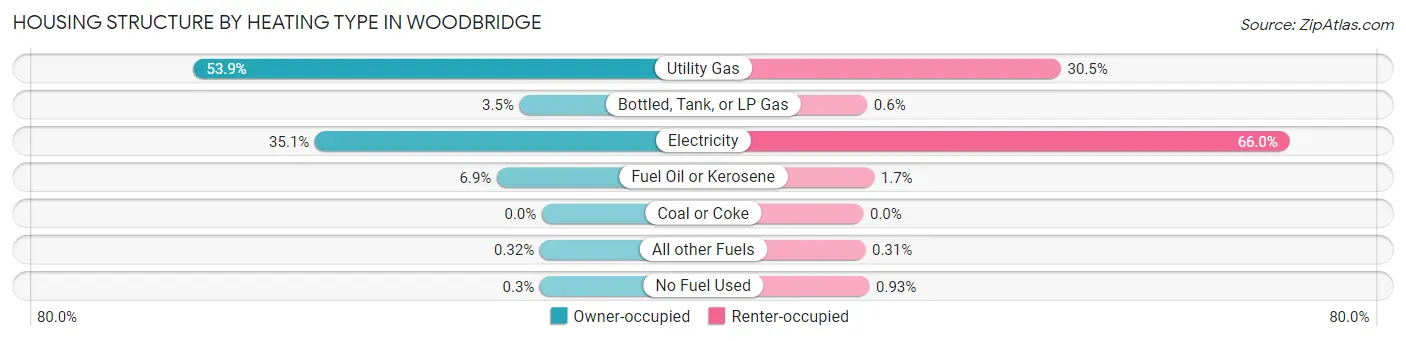
| Heating Type | Owner-occupied | Renter-occupied |
| Utility Gas | 4,419 (53.9%) | 1,666 (30.5%) |
| Bottled, Tank, or LP Gas | 284 (3.5%) | 33 (0.6%) |
| Electricity | 2,876 (35.1%) | 3,598 (65.9%) |
| Fuel Oil or Kerosene | 569 (6.9%) | 91 (1.7%) |
| Coal or Coke | 0 (0.0%) | 0 (0.0%) |
| All other Fuels | 26 (0.3%) | 17 (0.3%) |
| No Fuel Used | 25 (0.3%) | 51 (0.9%) |
| Total | 8,199 (100.0%) | 5,456 (100.0%) |
Household Vehicle Usage in Woodbridge
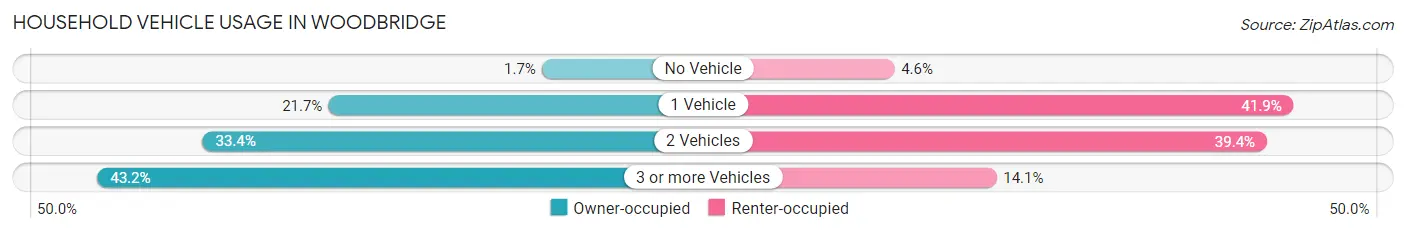
| Vehicles per Household | Owner-occupied | Renter-occupied |
| No Vehicle | 142 (1.7%) | 251 (4.6%) |
| 1 Vehicle | 1,776 (21.7%) | 2,285 (41.9%) |
| 2 Vehicles | 2,738 (33.4%) | 2,149 (39.4%) |
| 3 or more Vehicles | 3,543 (43.2%) | 771 (14.1%) |
| Total | 8,199 (100.0%) | 5,456 (100.0%) |
Real Estate & Mortgages in Woodbridge
Real Estate and Mortgage Overview in Woodbridge
| Characteristic | Without Mortgage | With Mortgage |
| Housing Units | 2,516 | 5,683 |
| Median Property Value | $366,700 | $365,500 |
| Median Household Income | $93,846 | $1,896 |
| Monthly Housing Costs | $675 | $957 |
| Real Estate Taxes | $3,717 | $457 |
Property Value by Mortgage Status in Woodbridge
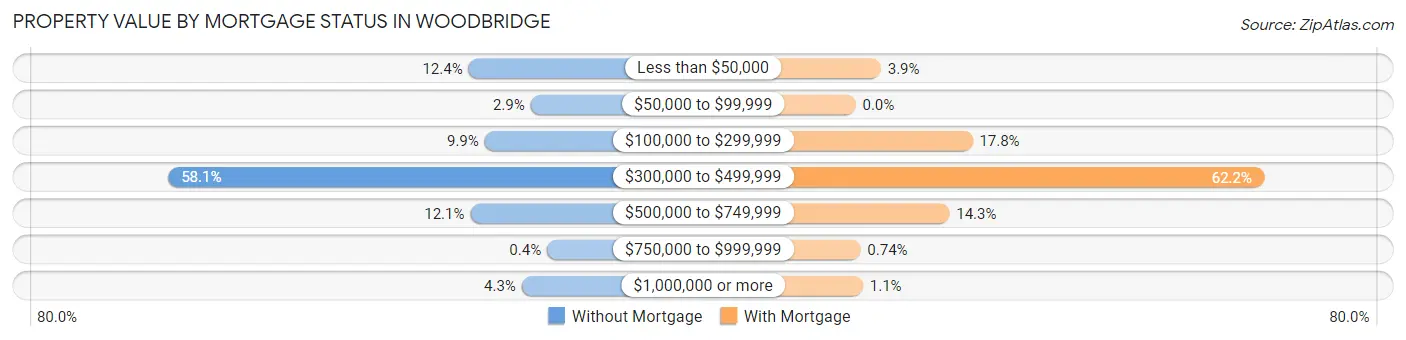
| Property Value | Without Mortgage | With Mortgage |
| Less than $50,000 | 311 (12.4%) | 219 (3.8%) |
| $50,000 to $99,999 | 73 (2.9%) | 0 (0.0%) |
| $100,000 to $299,999 | 249 (9.9%) | 1,012 (17.8%) |
| $300,000 to $499,999 | 1,462 (58.1%) | 3,535 (62.2%) |
| $500,000 to $749,999 | 304 (12.1%) | 812 (14.3%) |
| $750,000 to $999,999 | 10 (0.4%) | 42 (0.7%) |
| $1,000,000 or more | 107 (4.3%) | 63 (1.1%) |
| Total | 2,516 (100.0%) | 5,683 (100.0%) |
Household Income by Mortgage Status in Woodbridge
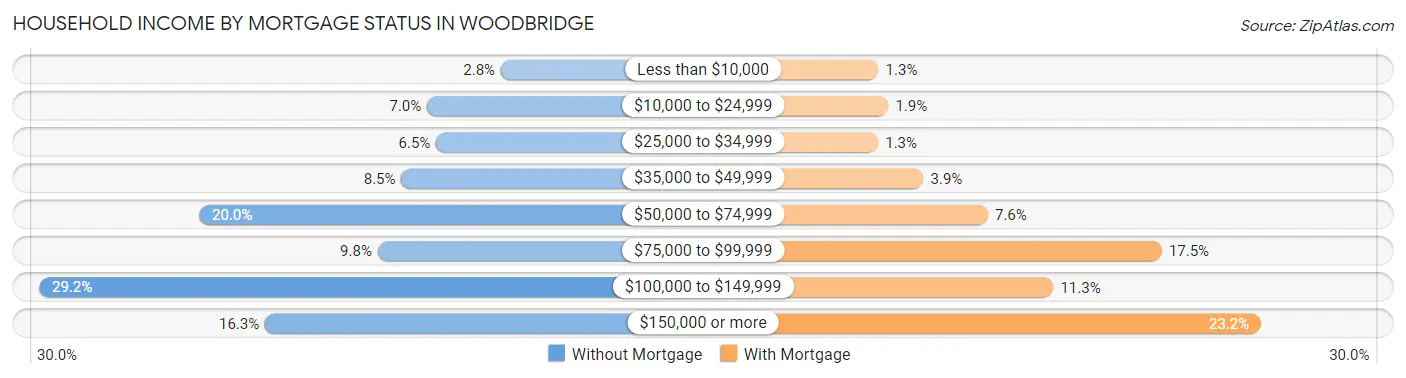
| Household Income | Without Mortgage | With Mortgage |
| Less than $10,000 | 70 (2.8%) | 75 (1.3%) |
| $10,000 to $24,999 | 176 (7.0%) | 107 (1.9%) |
| $25,000 to $34,999 | 163 (6.5%) | 74 (1.3%) |
| $35,000 to $49,999 | 213 (8.5%) | 221 (3.9%) |
| $50,000 to $74,999 | 504 (20.0%) | 430 (7.6%) |
| $75,000 to $99,999 | 247 (9.8%) | 995 (17.5%) |
| $100,000 to $149,999 | 734 (29.2%) | 643 (11.3%) |
| $150,000 or more | 409 (16.3%) | 1,317 (23.2%) |
| Total | 2,516 (100.0%) | 5,683 (100.0%) |
Property Value to Household Income Ratio in Woodbridge
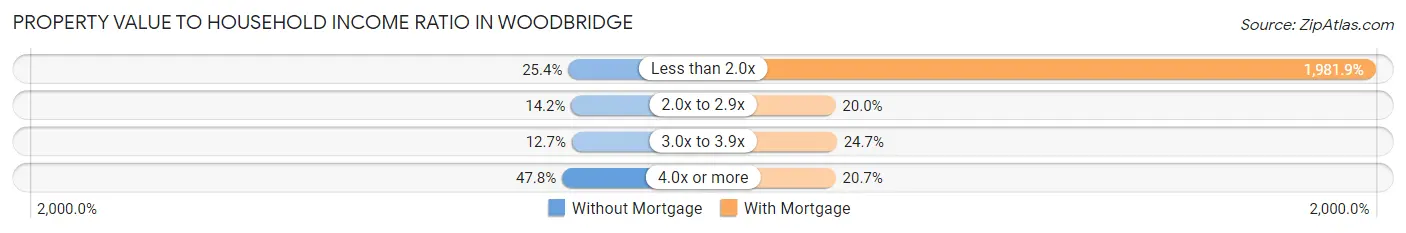
| Value-to-Income Ratio | Without Mortgage | With Mortgage |
| Less than 2.0x | 639 (25.4%) | 112,633 (1,981.9%) |
| 2.0x to 2.9x | 356 (14.1%) | 1,136 (20.0%) |
| 3.0x to 3.9x | 319 (12.7%) | 1,406 (24.7%) |
| 4.0x or more | 1,202 (47.8%) | 1,177 (20.7%) |
| Total | 2,516 (100.0%) | 5,683 (100.0%) |
Real Estate Taxes by Mortgage Status in Woodbridge
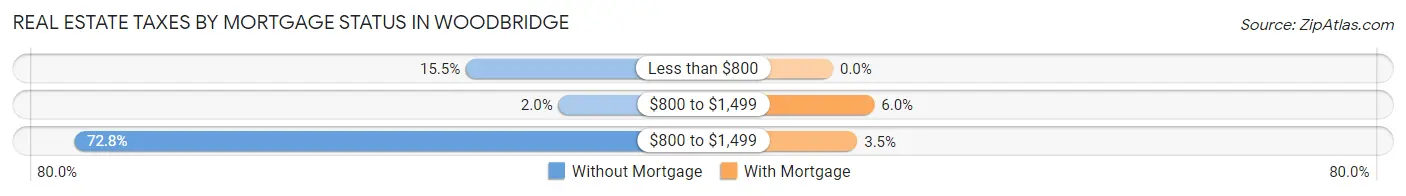
| Property Taxes | Without Mortgage | With Mortgage |
| Less than $800 | 390 (15.5%) | 0 (0.0%) |
| $800 to $1,499 | 50 (2.0%) | 343 (6.0%) |
| $800 to $1,499 | 1,831 (72.8%) | 201 (3.5%) |
| Total | 2,516 (100.0%) | 5,683 (100.0%) |
Health & Disability in Woodbridge
Health Insurance Coverage by Age in Woodbridge
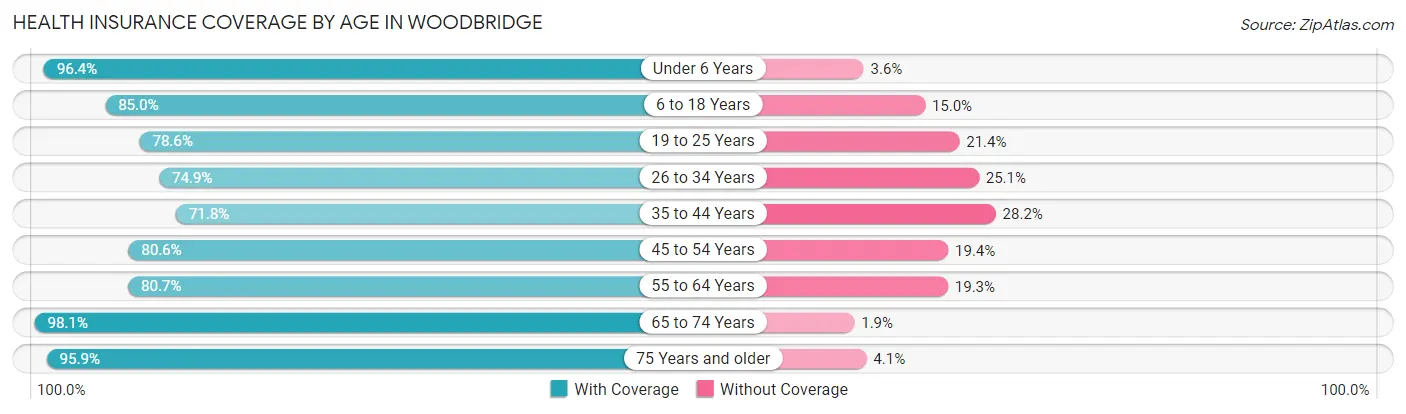
| Age Bracket | With Coverage | Without Coverage |
| Under 6 Years | 3,077 (96.4%) | 115 (3.6%) |
| 6 to 18 Years | 6,637 (85.0%) | 1,175 (15.0%) |
| 19 to 25 Years | 4,390 (78.6%) | 1,198 (21.4%) |
| 26 to 34 Years | 3,838 (74.9%) | 1,285 (25.1%) |
| 35 to 44 Years | 4,427 (71.8%) | 1,741 (28.2%) |
| 45 to 54 Years | 4,945 (80.6%) | 1,187 (19.4%) |
| 55 to 64 Years | 3,509 (80.7%) | 840 (19.3%) |
| 65 to 74 Years | 2,737 (98.1%) | 52 (1.9%) |
| 75 Years and older | 1,117 (95.9%) | 48 (4.1%) |
| Total | 34,677 (81.9%) | 7,641 (18.1%) |
Health Insurance Coverage by Citizenship Status in Woodbridge
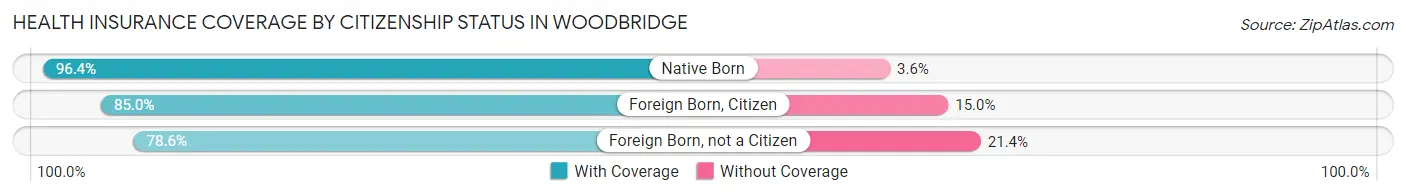
| Citizenship Status | With Coverage | Without Coverage |
| Native Born | 3,077 (96.4%) | 115 (3.6%) |
| Foreign Born, Citizen | 6,637 (85.0%) | 1,175 (15.0%) |
| Foreign Born, not a Citizen | 4,390 (78.6%) | 1,198 (21.4%) |
Health Insurance Coverage by Household Income in Woodbridge
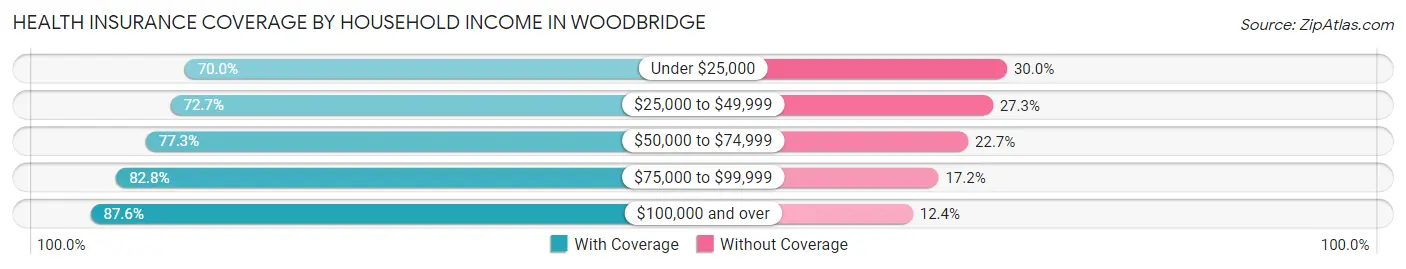
| Household Income | With Coverage | Without Coverage |
| Under $25,000 | 1,763 (70.0%) | 756 (30.0%) |
| $25,000 to $49,999 | 3,867 (72.7%) | 1,455 (27.3%) |
| $50,000 to $74,999 | 6,731 (77.3%) | 1,980 (22.7%) |
| $75,000 to $99,999 | 4,508 (82.8%) | 935 (17.2%) |
| $100,000 and over | 17,782 (87.6%) | 2,508 (12.4%) |
Public vs Private Health Insurance Coverage by Age in Woodbridge
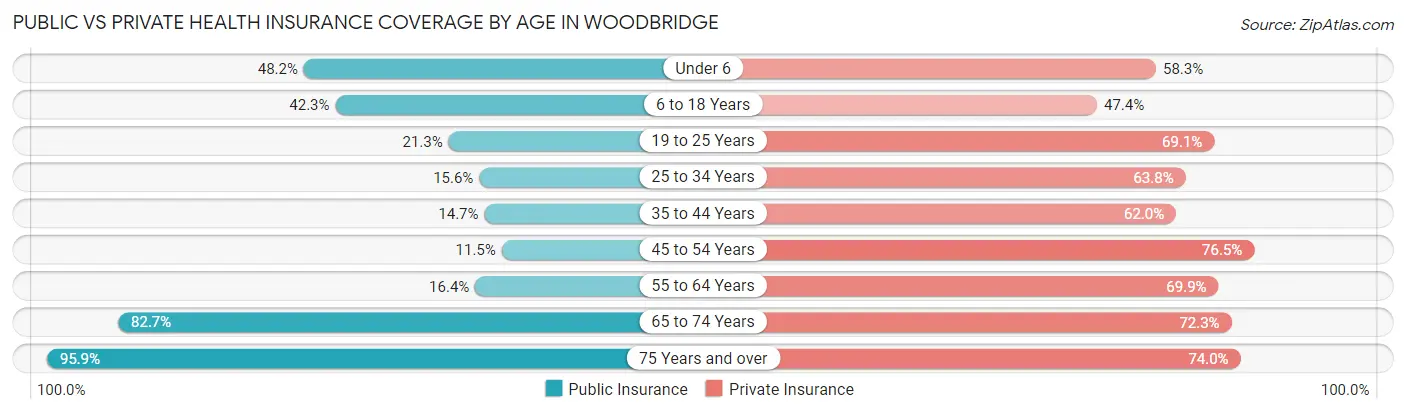
| Age Bracket | Public Insurance | Private Insurance |
| Under 6 | 1,538 (48.2%) | 1,862 (58.3%) |
| 6 to 18 Years | 3,306 (42.3%) | 3,701 (47.4%) |
| 19 to 25 Years | 1,191 (21.3%) | 3,862 (69.1%) |
| 25 to 34 Years | 800 (15.6%) | 3,268 (63.8%) |
| 35 to 44 Years | 904 (14.7%) | 3,826 (62.0%) |
| 45 to 54 Years | 703 (11.5%) | 4,693 (76.5%) |
| 55 to 64 Years | 712 (16.4%) | 3,040 (69.9%) |
| 65 to 74 Years | 2,306 (82.7%) | 2,017 (72.3%) |
| 75 Years and over | 1,117 (95.9%) | 862 (74.0%) |
| Total | 12,577 (29.7%) | 27,131 (64.1%) |
Disability Status by Sex by Age in Woodbridge
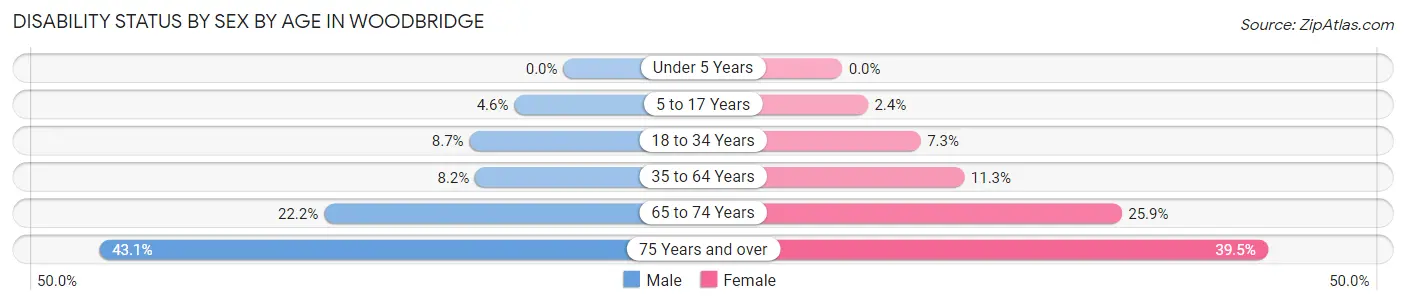
| Age Bracket | Male | Female |
| Under 5 Years | 0 (0.0%) | 0 (0.0%) |
| 5 to 17 Years | 143 (4.5%) | 107 (2.4%) |
| 18 to 34 Years | 486 (8.7%) | 413 (7.3%) |
| 35 to 64 Years | 712 (8.2%) | 902 (11.3%) |
| 65 to 74 Years | 295 (22.2%) | 379 (25.9%) |
| 75 Years and over | 202 (43.1%) | 275 (39.5%) |
Disability Class by Sex by Age in Woodbridge
Disability Class: Hearing Difficulty
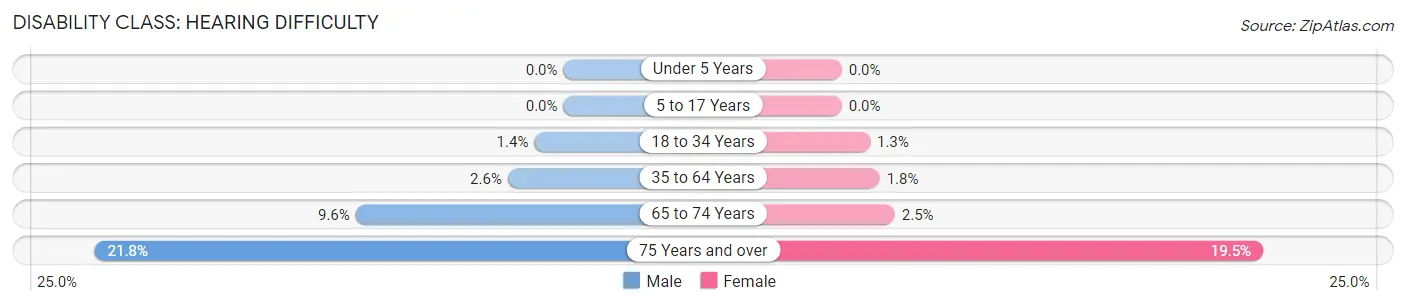
| Age Bracket | Male | Female |
| Under 5 Years | 0 (0.0%) | 0 (0.0%) |
| 5 to 17 Years | 0 (0.0%) | 0 (0.0%) |
| 18 to 34 Years | 75 (1.3%) | 74 (1.3%) |
| 35 to 64 Years | 224 (2.6%) | 140 (1.8%) |
| 65 to 74 Years | 128 (9.6%) | 36 (2.5%) |
| 75 Years and over | 102 (21.7%) | 136 (19.5%) |
Disability Class: Vision Difficulty
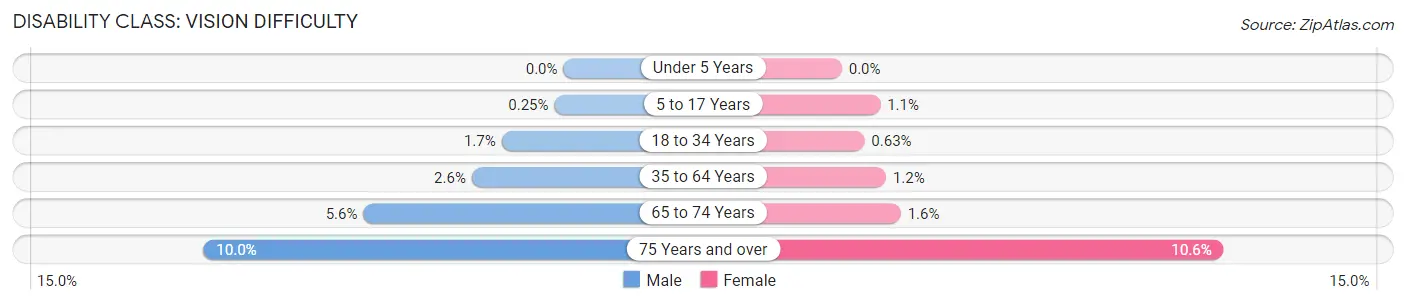
| Age Bracket | Male | Female |
| Under 5 Years | 0 (0.0%) | 0 (0.0%) |
| 5 to 17 Years | 8 (0.3%) | 48 (1.1%) |
| 18 to 34 Years | 96 (1.7%) | 36 (0.6%) |
| 35 to 64 Years | 222 (2.5%) | 98 (1.2%) |
| 65 to 74 Years | 74 (5.6%) | 24 (1.6%) |
| 75 Years and over | 47 (10.0%) | 74 (10.6%) |
Disability Class: Cognitive Difficulty
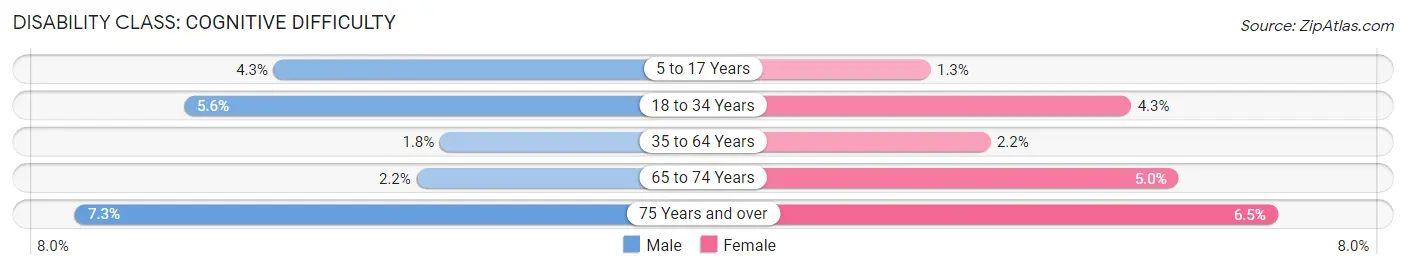
| Age Bracket | Male | Female |
| 5 to 17 Years | 135 (4.3%) | 59 (1.3%) |
| 18 to 34 Years | 314 (5.6%) | 243 (4.3%) |
| 35 to 64 Years | 159 (1.8%) | 175 (2.2%) |
| 65 to 74 Years | 29 (2.2%) | 73 (5.0%) |
| 75 Years and over | 34 (7.2%) | 45 (6.5%) |
Disability Class: Ambulatory Difficulty
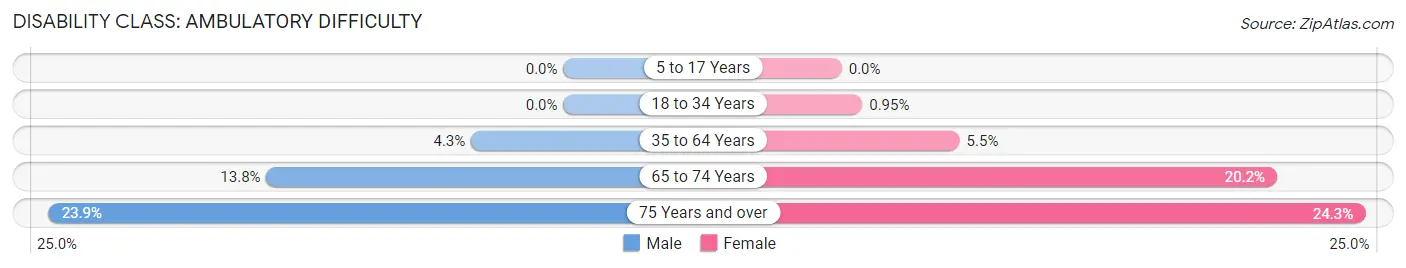
| Age Bracket | Male | Female |
| 5 to 17 Years | 0 (0.0%) | 0 (0.0%) |
| 18 to 34 Years | 0 (0.0%) | 54 (0.9%) |
| 35 to 64 Years | 372 (4.3%) | 435 (5.5%) |
| 65 to 74 Years | 183 (13.8%) | 295 (20.2%) |
| 75 Years and over | 112 (23.9%) | 169 (24.3%) |
Disability Class: Self-Care Difficulty
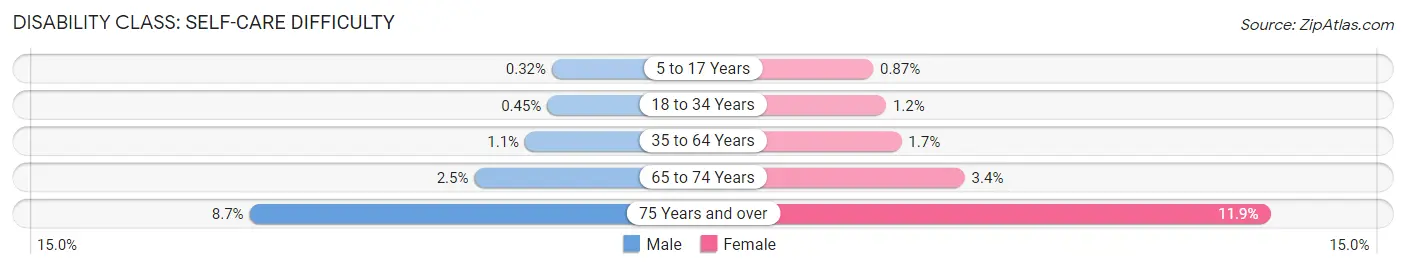
| Age Bracket | Male | Female |
| 5 to 17 Years | 10 (0.3%) | 39 (0.9%) |
| 18 to 34 Years | 25 (0.4%) | 70 (1.2%) |
| 35 to 64 Years | 93 (1.1%) | 132 (1.7%) |
| 65 to 74 Years | 33 (2.5%) | 50 (3.4%) |
| 75 Years and over | 41 (8.7%) | 83 (11.9%) |
Technology Access in Woodbridge
Computing Device Access in Woodbridge
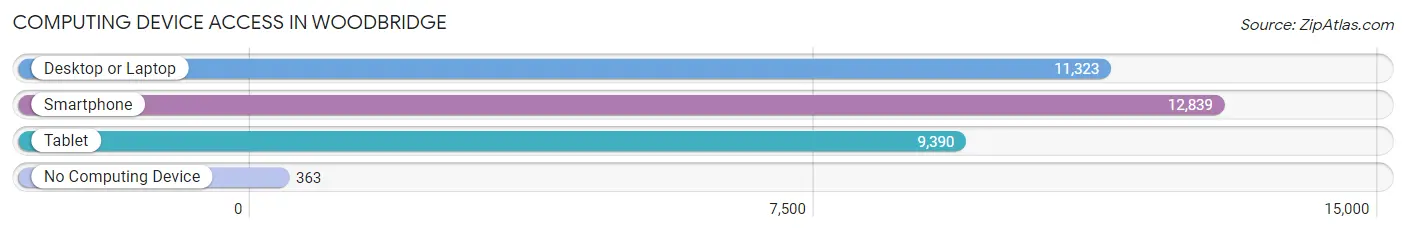
| Device Type | # Households | % Households |
| Desktop or Laptop | 11,323 | 82.9% |
| Smartphone | 12,839 | 94.0% |
| Tablet | 9,390 | 68.8% |
| No Computing Device | 363 | 2.7% |
| Total | 13,655 | 100.0% |
Internet Access in Woodbridge
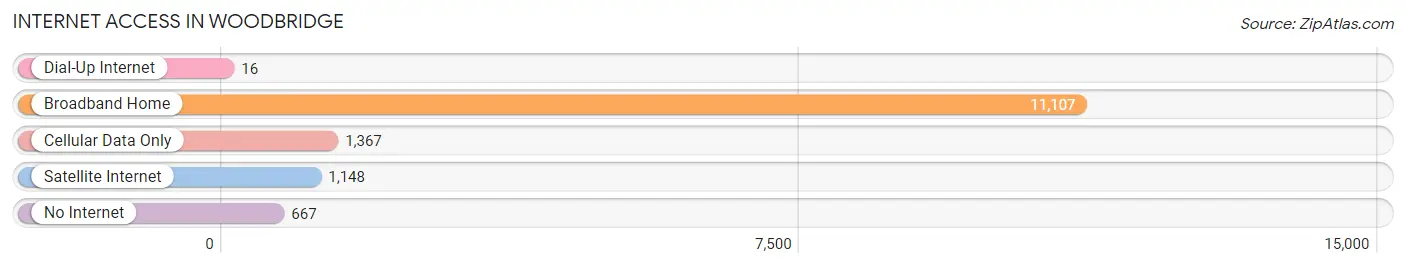
| Internet Type | # Households | % Households |
| Dial-Up Internet | 16 | 0.1% |
| Broadband Home | 11,107 | 81.3% |
| Cellular Data Only | 1,367 | 10.0% |
| Satellite Internet | 1,148 | 8.4% |
| No Internet | 667 | 4.9% |
| Total | 13,655 | 100.0% |
Woodbridge Summary
Woodbridge is a census-designated place (CDP) located in Prince William County, Virginia, United States. It is located approximately 20 miles south of Washington, D.C. and is part of the Washington metropolitan area. As of the 2010 census, the population of Woodbridge was estimated to be around 71,000.
History
The area that is now Woodbridge was first settled in the early 1700s by English colonists. The area was originally known as Marumsco, and was part of the larger Prince William County. In 1795, the area was officially incorporated as the Town of Occoquan. The town was renamed Woodbridge in 1820, after the nearby Occoquan River.
In the late 19th century, the area began to experience rapid growth due to the construction of the Washington and Old Dominion Railroad. This allowed for easy access to Washington, D.C. and other nearby cities. The population of Woodbridge continued to grow throughout the 20th century, and by the 2000 census, the population had reached over 50,000.
Geography
Woodbridge is located in Prince William County, Virginia, approximately 20 miles south of Washington, D.C. It is bordered by the Occoquan River to the north, the Potomac River to the east, and the Quantico Creek to the south. The total area of Woodbridge is approximately 24 square miles.
The climate in Woodbridge is classified as humid subtropical, with hot, humid summers and mild winters. The average annual temperature is around 60 degrees Fahrenheit, with an average high of around 80 degrees in the summer and an average low of around 40 degrees in the winter.
Economy
Woodbridge is home to a variety of businesses and industries. The largest employers in the area include the Department of Defense, the Prince William County Public Schools, and the Potomac Mills Mall. Other major employers include the Potomac Hospital, the Prince William County Government, and the Potomac and Rappahannock Transportation Commission.
The median household income in Woodbridge is around $80,000, and the median home value is around $300,000. The unemployment rate in Woodbridge is around 3.5%, which is lower than the national average.
Demographics
As of the 2010 census, the population of Woodbridge was estimated to be around 71,000. The racial makeup of the city is approximately 57% White, 22% African American, 13% Hispanic or Latino, and 8% Asian. The median age in Woodbridge is around 35 years old.
Woodbridge is home to a variety of religious denominations, including Christianity, Islam, Judaism, and Buddhism. The largest religious group in Woodbridge is Christianity, with around 60% of the population identifying as Christian.
Conclusion
Woodbridge is a census-designated place located in Prince William County, Virginia. It is part of the Washington metropolitan area and is approximately 20 miles south of Washington, D.C. The area was first settled in the early 1700s and was officially incorporated as the Town of Occoquan in 1795. The population of Woodbridge has grown steadily over the years, and as of the 2010 census, the population was estimated to be around 71,000. Woodbridge is home to a variety of businesses and industries, and the median household income is around $80,000. The racial makeup of the city is approximately 57% White, 22% African American, 13% Hispanic or Latino, and 8% Asian. Christianity is the largest religious group in Woodbridge, with around 60% of the population identifying as Christian.
Common Questions
What is Per Capita Income in Woodbridge?
Per Capita income in Woodbridge is $40,321.
What is the Median Family Income in Woodbridge?
Median Family Income in Woodbridge is $99,318.
What is the Median Household income in Woodbridge?
Median Household Income in Woodbridge is $93,347.
What is Income or Wage Gap in Woodbridge?
Income or Wage Gap in Woodbridge is 23.3%.
Women in Woodbridge earn 76.7 cents for every dollar earned by a man.
What is Family Income Deficit in Woodbridge?
Family Income Deficit in Woodbridge is $12,463.
Families that are below poverty line in Woodbridge earn $12,463 less on average than the poverty threshold level.
What is Inequality or Gini Index in Woodbridge?
Inequality or Gini Index in Woodbridge is 0.45.
What is the Total Population of Woodbridge?
Total Population of Woodbridge is 42,619.
What is the Total Male Population of Woodbridge?
Total Male Population of Woodbridge is 20,782.
What is the Total Female Population of Woodbridge?
Total Female Population of Woodbridge is 21,837.
What is the Ratio of Males per 100 Females in Woodbridge?
There are 95.17 Males per 100 Females in Woodbridge.
What is the Ratio of Females per 100 Males in Woodbridge?
There are 105.08 Females per 100 Males in Woodbridge.
What is the Median Population Age in Woodbridge?
Median Population Age in Woodbridge is 34.2 Years.
What is the Average Family Size in Woodbridge
Average Family Size in Woodbridge is 3.7 People.
What is the Average Household Size in Woodbridge
Average Household Size in Woodbridge is 3.1 People.
How Large is the Labor Force in Woodbridge?
There are 25,314 People in the Labor Forcein in Woodbridge.
What is the Percentage of People in the Labor Force in Woodbridge?
76.4% of People are in the Labor Force in Woodbridge.
What is the Unemployment Rate in Woodbridge?
Unemployment Rate in Woodbridge is 7.4%.