Manassas Park, VA Map & Demographics
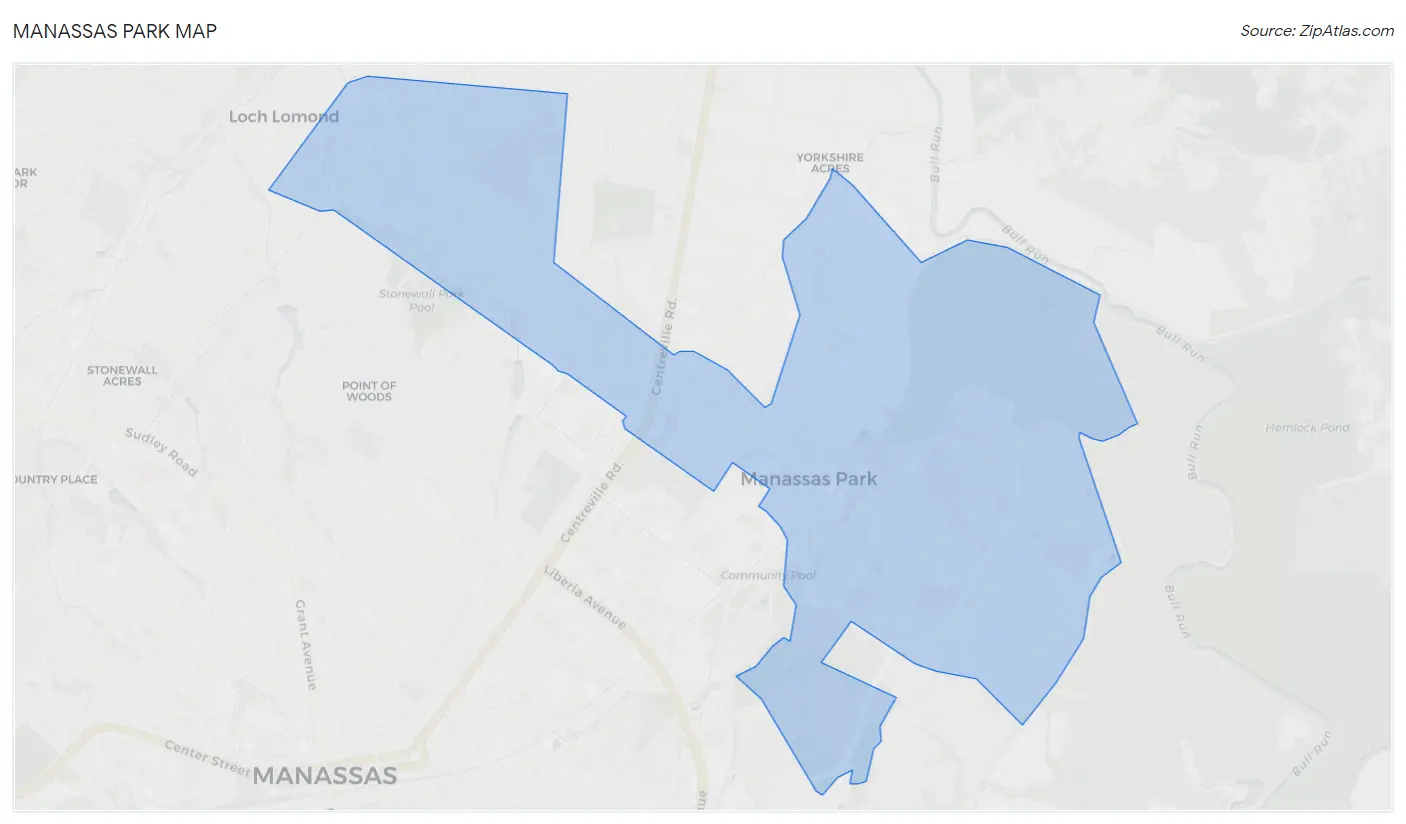
Manassas Park Map
Manassas Park Overview
$41,595
PER CAPITA INCOME
$97,174
AVG FAMILY INCOME
$91,673
AVG HOUSEHOLD INCOME
33.5%
WAGE / INCOME GAP [ % ]
66.5¢/ $1
WAGE / INCOME GAP [ $ ]
0.38
INEQUALITY / GINI INDEX
17,123
TOTAL POPULATION
8,685
MALE POPULATION
8,438
FEMALE POPULATION
102.93
MALES / 100 FEMALES
97.16
FEMALES / 100 MALES
35.8
MEDIAN AGE
3.9
AVG FAMILY SIZE
3.3
AVG HOUSEHOLD SIZE
10,289
LABOR FORCE [ PEOPLE ]
76.7%
PERCENT IN LABOR FORCE
3.2%
UNEMPLOYMENT RATE
Income in Manassas Park
Income Overview in Manassas Park
Per Capita Income in Manassas Park is $41,595, while median incomes of families and households are $97,174 and $91,673 respectively.
| Characteristic | Number | Measure |
| Per Capita Income | 17,123 | $41,595 |
| Median Family Income | 3,606 | $97,174 |
| Mean Family Income | 3,606 | $121,823 |
| Median Household Income | 5,221 | $91,673 |
| Mean Household Income | 5,221 | $116,336 |
| Income Deficit | 3,606 | $0 |
| Wage / Income Gap (%) | 17,123 | 33.49% |
| Wage / Income Gap ($) | 17,123 | 66.51¢ per $1 |
| Gini / Inequality Index | 17,123 | 0.38 |
Earnings by Sex in Manassas Park
Average Earnings in Manassas Park are $52,550, $58,011 for men and $38,585 for women, a difference of 33.5%.
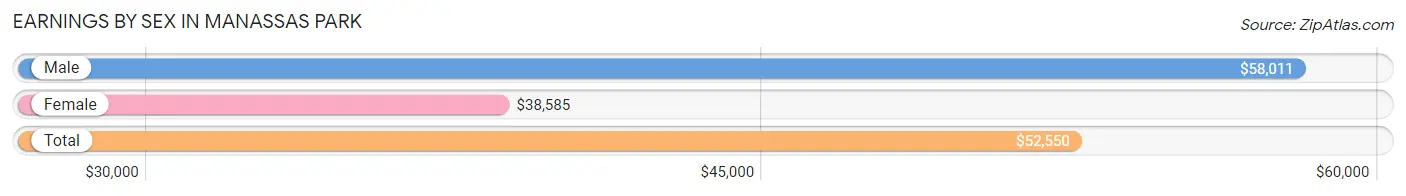
| Sex | Number | Average Earnings |
| Male | 5,918 (56.5%) | $58,011 |
| Female | 4,565 (43.5%) | $38,585 |
| Total | 10,483 (100.0%) | $52,550 |
Earnings by Sex by Income Bracket in Manassas Park
The most common earnings brackets in Manassas Park are $100,000+ for men (1,419 | 24.0%) and $100,000+ for women (519 | 11.4%).
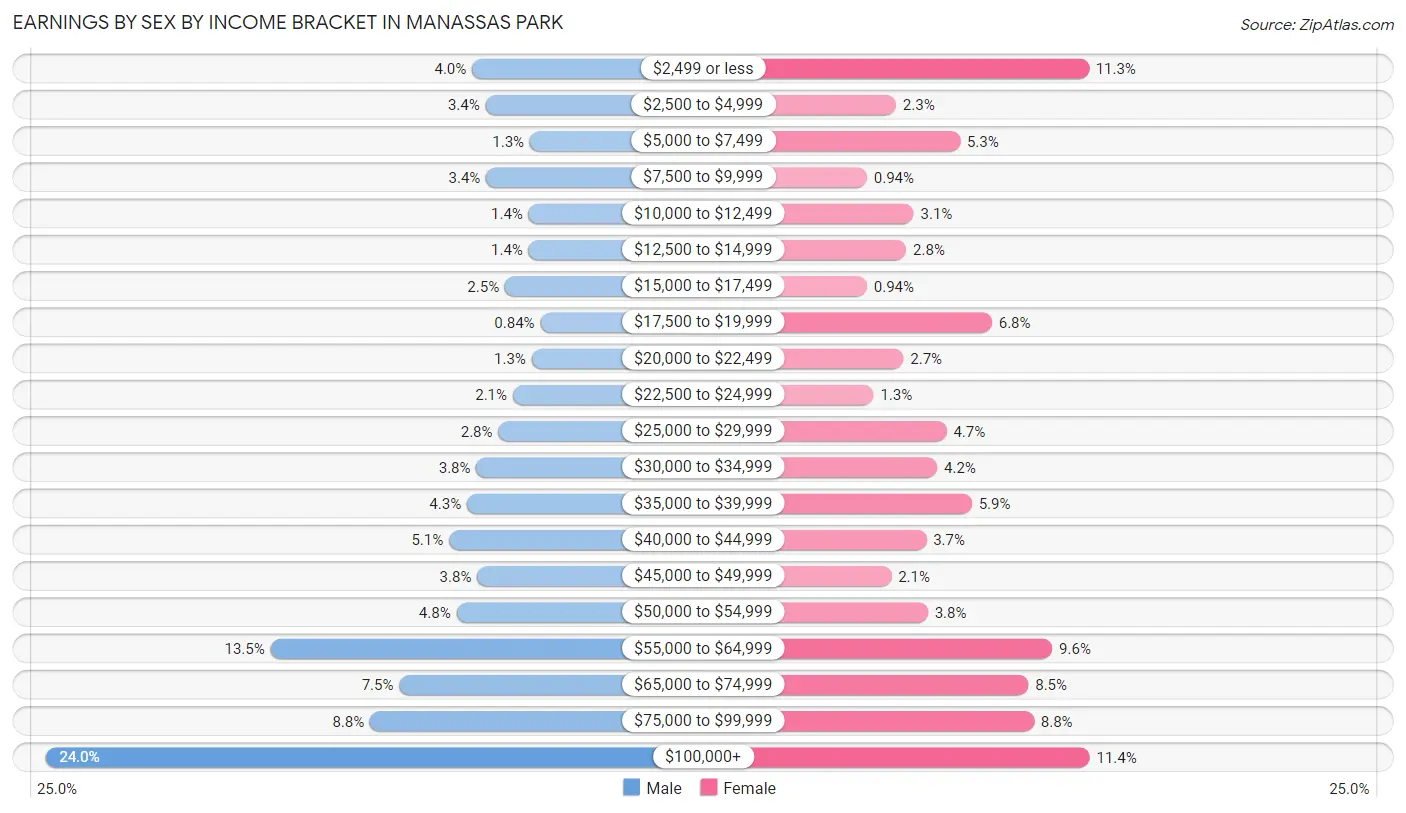
| Income | Male | Female |
| $2,499 or less | 239 (4.0%) | 517 (11.3%) |
| $2,500 to $4,999 | 202 (3.4%) | 105 (2.3%) |
| $5,000 to $7,499 | 79 (1.3%) | 242 (5.3%) |
| $7,500 to $9,999 | 200 (3.4%) | 43 (0.9%) |
| $10,000 to $12,499 | 82 (1.4%) | 143 (3.1%) |
| $12,500 to $14,999 | 82 (1.4%) | 127 (2.8%) |
| $15,000 to $17,499 | 148 (2.5%) | 43 (0.9%) |
| $17,500 to $19,999 | 50 (0.8%) | 310 (6.8%) |
| $20,000 to $22,499 | 74 (1.3%) | 121 (2.6%) |
| $22,500 to $24,999 | 126 (2.1%) | 57 (1.3%) |
| $25,000 to $29,999 | 166 (2.8%) | 213 (4.7%) |
| $30,000 to $34,999 | 227 (3.8%) | 193 (4.2%) |
| $35,000 to $39,999 | 253 (4.3%) | 267 (5.9%) |
| $40,000 to $44,999 | 303 (5.1%) | 170 (3.7%) |
| $45,000 to $49,999 | 225 (3.8%) | 95 (2.1%) |
| $50,000 to $54,999 | 282 (4.8%) | 173 (3.8%) |
| $55,000 to $64,999 | 798 (13.5%) | 439 (9.6%) |
| $65,000 to $74,999 | 441 (7.4%) | 388 (8.5%) |
| $75,000 to $99,999 | 522 (8.8%) | 400 (8.8%) |
| $100,000+ | 1,419 (24.0%) | 519 (11.4%) |
| Total | 5,918 (100.0%) | 4,565 (100.0%) |
Earnings by Sex by Educational Attainment in Manassas Park
Average earnings in Manassas Park are $60,806 for men and $51,875 for women, a difference of 14.7%. Men with an educational attainment of graduate degree enjoy the highest average annual earnings of $109,735, while those with high school diploma education earn the least with $54,202. Women with an educational attainment of bachelor's degree earn the most with the average annual earnings of $62,412, while those with less than high school education have the smallest earnings of $20,543.
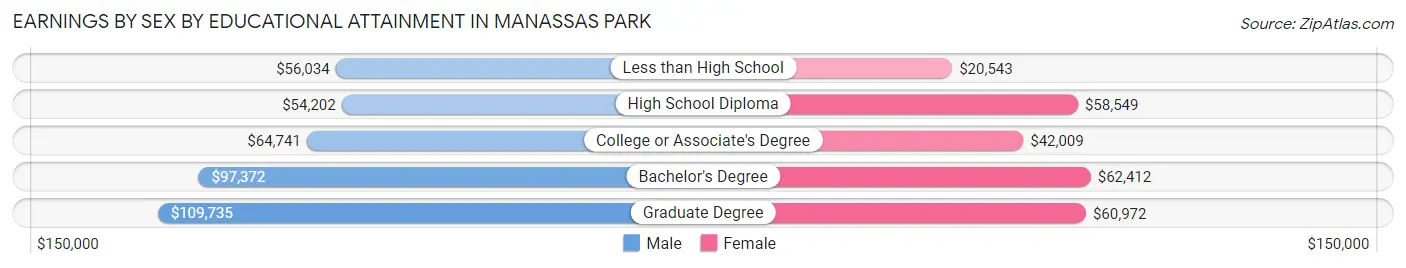
| Educational Attainment | Male Income | Female Income |
| Less than High School | $56,034 | $20,543 |
| High School Diploma | $54,202 | $58,549 |
| College or Associate's Degree | $64,741 | $42,009 |
| Bachelor's Degree | $97,372 | $62,412 |
| Graduate Degree | $109,735 | $60,972 |
| Total | $60,806 | $51,875 |
Family Income in Manassas Park
Family Income Brackets in Manassas Park
According to the Manassas Park family income data, there are 833 families falling into the $50,000 to $74,999 income range, which is the most common income bracket and makes up 23.1% of all families. Conversely, the $10,000 to $14,999 income bracket is the least frequent group with only 7 families (0.2%) belonging to this category.
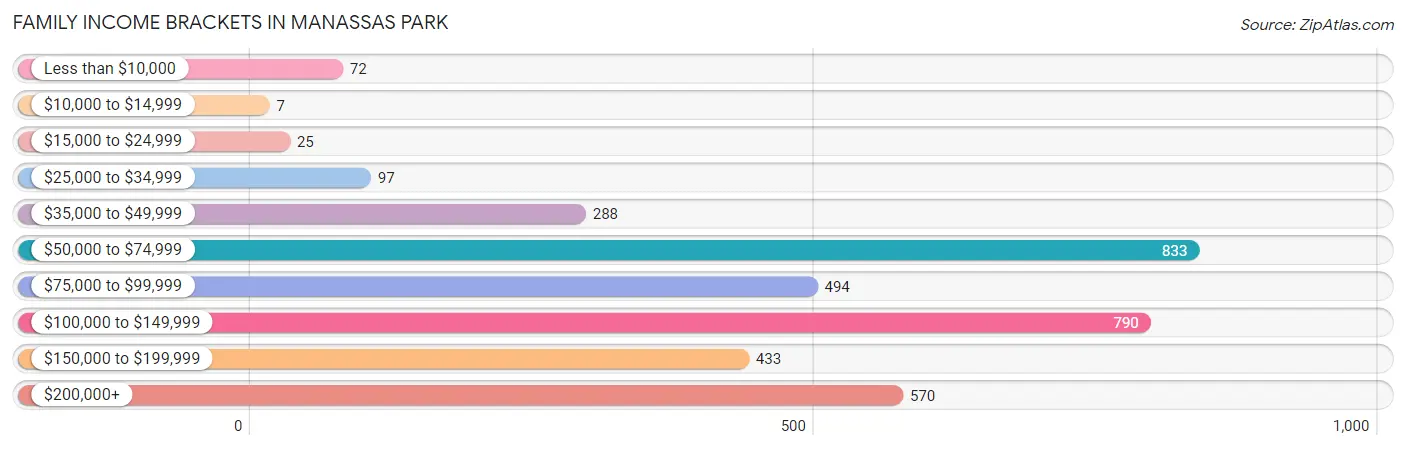
| Income Bracket | # Families | % Families |
| Less than $10,000 | 72 | 2.0% |
| $10,000 to $14,999 | 7 | 0.2% |
| $15,000 to $24,999 | 25 | 0.7% |
| $25,000 to $34,999 | 97 | 2.7% |
| $35,000 to $49,999 | 288 | 8.0% |
| $50,000 to $74,999 | 833 | 23.1% |
| $75,000 to $99,999 | 494 | 13.7% |
| $100,000 to $149,999 | 790 | 21.9% |
| $150,000 to $199,999 | 433 | 12.0% |
| $200,000+ | 570 | 15.8% |
Family Income by Famaliy Size in Manassas Park
2-person families (1,326 | 36.8%) account for the highest median family income in Manassas Park with $128,450 per family, while 2-person families (1,326 | 36.8%) have the highest median income of $64,225 per family member.
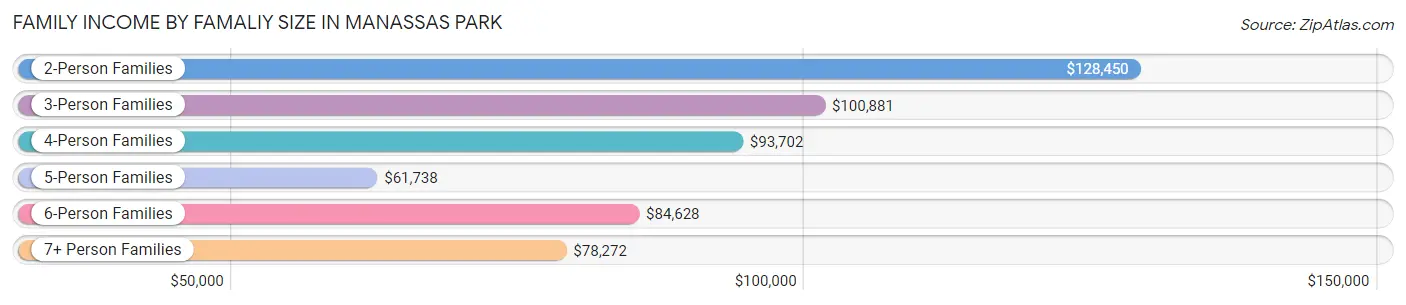
| Income Bracket | # Families | Median Income |
| 2-Person Families | 1,326 (36.8%) | $128,450 |
| 3-Person Families | 721 (20.0%) | $100,881 |
| 4-Person Families | 413 (11.5%) | $93,702 |
| 5-Person Families | 730 (20.2%) | $61,738 |
| 6-Person Families | 214 (5.9%) | $84,628 |
| 7+ Person Families | 202 (5.6%) | $78,272 |
| Total | 3,606 (100.0%) | $97,174 |
Family Income by Number of Earners in Manassas Park
The median family income in Manassas Park is $97,174, with families comprising 2 earners (1,588) having the highest median family income of $118,547, while families with no earners (136) have the lowest median family income of $63,286, accounting for 44.0% and 3.8% of families, respectively.
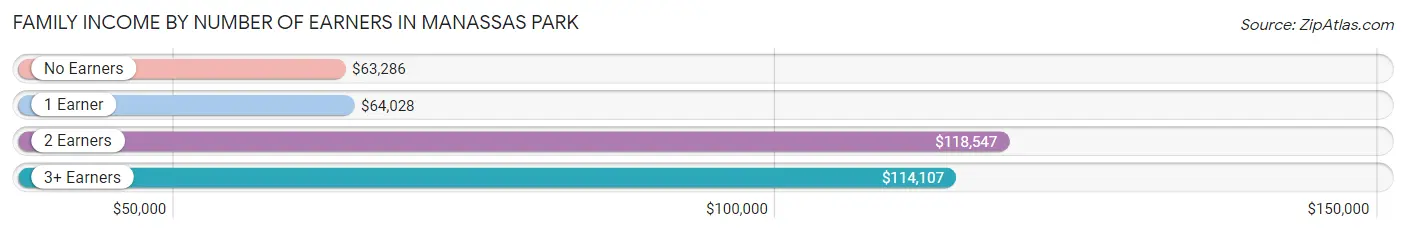
| Number of Earners | # Families | Median Income |
| No Earners | 136 (3.8%) | $63,286 |
| 1 Earner | 1,065 (29.5%) | $64,028 |
| 2 Earners | 1,588 (44.0%) | $118,547 |
| 3+ Earners | 817 (22.7%) | $114,107 |
| Total | 3,606 (100.0%) | $97,174 |
Household Income in Manassas Park
Household Income Brackets in Manassas Park
With 1,310 households falling in the category, the $50,000 to $74,999 income range is the most frequent in Manassas Park, accounting for 25.1% of all households. In contrast, only 37 households (0.7%) fall into the less than $10,000 income bracket, making it the least populous group.
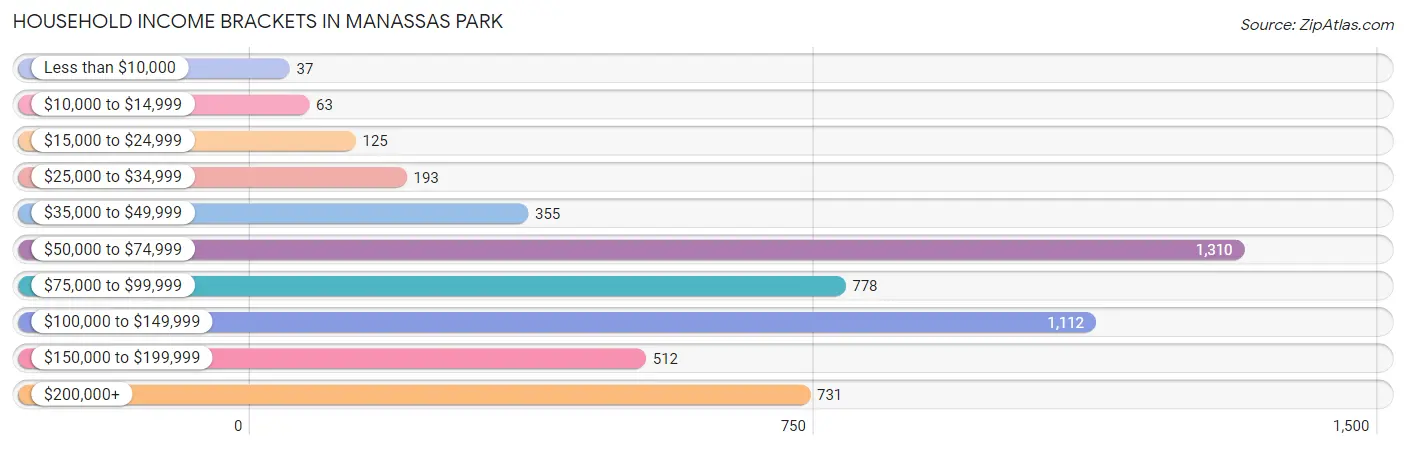
| Income Bracket | # Households | % Households |
| Less than $10,000 | 37 | 0.7% |
| $10,000 to $14,999 | 63 | 1.2% |
| $15,000 to $24,999 | 125 | 2.4% |
| $25,000 to $34,999 | 193 | 3.7% |
| $35,000 to $49,999 | 355 | 6.8% |
| $50,000 to $74,999 | 1,310 | 25.1% |
| $75,000 to $99,999 | 778 | 14.9% |
| $100,000 to $149,999 | 1,112 | 21.3% |
| $150,000 to $199,999 | 512 | 9.8% |
| $200,000+ | 731 | 14.0% |
Household Income by Householder Age in Manassas Park
The median household income in Manassas Park is $91,673, with the highest median household income of $107,021 found in the 45 to 64 years age bracket for the primary householder. A total of 1,995 households (38.2%) fall into this category. Meanwhile, the 15 to 24 years age bracket for the primary householder has the lowest median household income of $0, with 123 households (2.4%) in this group.
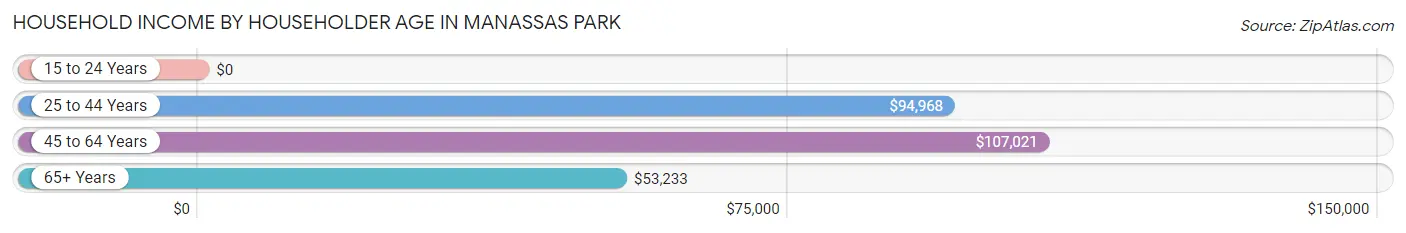
| Income Bracket | # Households | Median Income |
| 15 to 24 Years | 123 (2.4%) | $0 |
| 25 to 44 Years | 2,369 (45.4%) | $94,968 |
| 45 to 64 Years | 1,995 (38.2%) | $107,021 |
| 65+ Years | 734 (14.1%) | $53,233 |
| Total | 5,221 (100.0%) | $91,673 |
Poverty in Manassas Park
Income Below Poverty by Sex and Age in Manassas Park
With 6.3% poverty level for males and 3.8% for females among the residents of Manassas Park, 6 to 11 year old males and 16 and 17 year old females are the most vulnerable to poverty, with 117 males (17.7%) and 94 females (37.6%) in their respective age groups living below the poverty level.
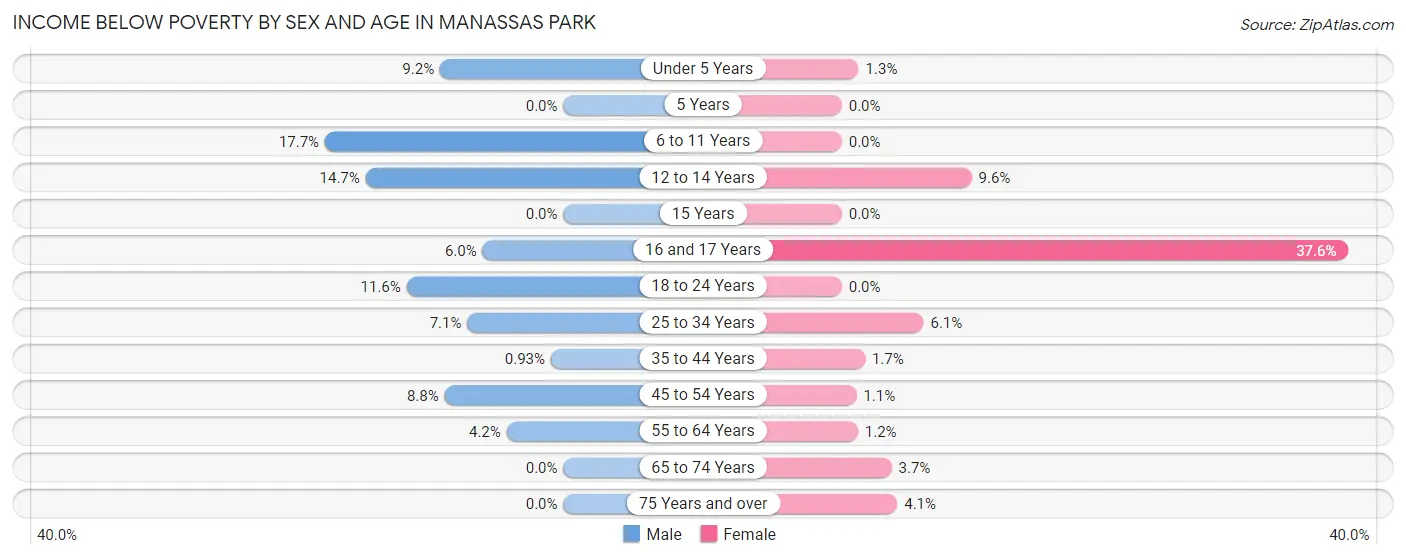
| Age Bracket | Male | Female |
| Under 5 Years | 46 (9.2%) | 8 (1.3%) |
| 5 Years | 0 (0.0%) | 0 (0.0%) |
| 6 to 11 Years | 117 (17.7%) | 0 (0.0%) |
| 12 to 14 Years | 43 (14.7%) | 53 (9.6%) |
| 15 Years | 0 (0.0%) | 0 (0.0%) |
| 16 and 17 Years | 12 (6.0%) | 94 (37.6%) |
| 18 to 24 Years | 81 (11.6%) | 0 (0.0%) |
| 25 to 34 Years | 82 (7.1%) | 87 (6.1%) |
| 35 to 44 Years | 18 (0.9%) | 22 (1.7%) |
| 45 to 54 Years | 113 (8.8%) | 10 (1.1%) |
| 55 to 64 Years | 33 (4.2%) | 11 (1.2%) |
| 65 to 74 Years | 0 (0.0%) | 23 (3.7%) |
| 75 Years and over | 0 (0.0%) | 10 (4.1%) |
| Total | 545 (6.3%) | 318 (3.8%) |
Income Above Poverty by Sex and Age in Manassas Park
According to the poverty statistics in Manassas Park, males aged 5 years and females aged 5 years are the age groups that are most secure financially, with 100.0% of males and 100.0% of females in these age groups living above the poverty line.
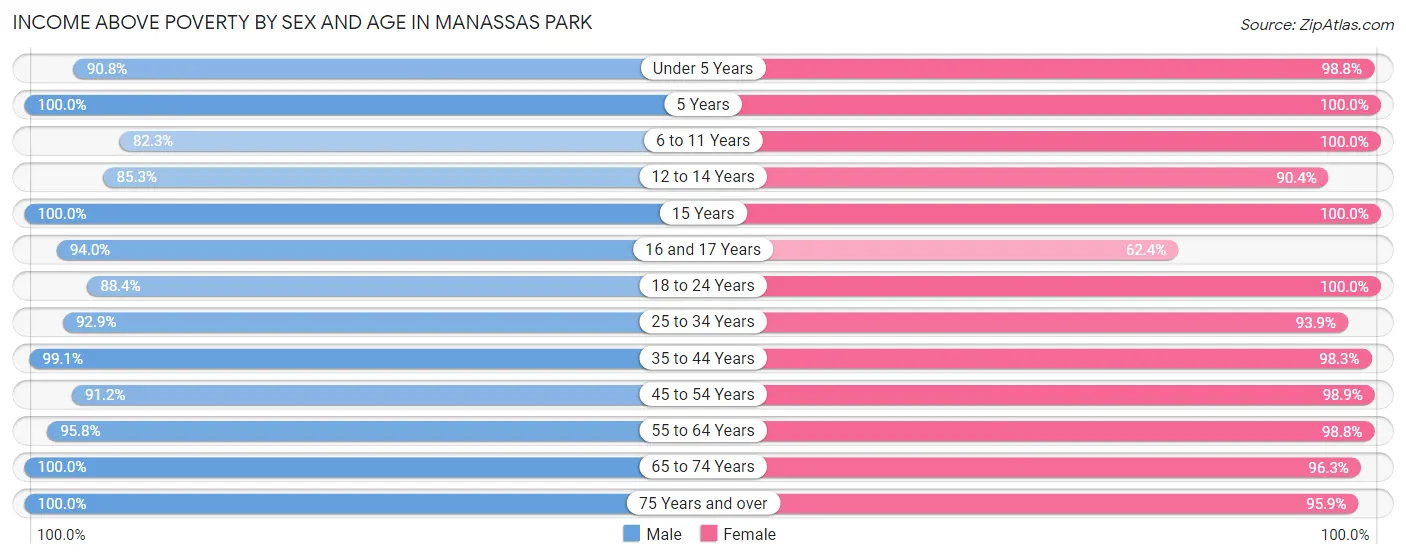
| Age Bracket | Male | Female |
| Under 5 Years | 456 (90.8%) | 634 (98.8%) |
| 5 Years | 132 (100.0%) | 8 (100.0%) |
| 6 to 11 Years | 544 (82.3%) | 643 (100.0%) |
| 12 to 14 Years | 250 (85.3%) | 497 (90.4%) |
| 15 Years | 166 (100.0%) | 40 (100.0%) |
| 16 and 17 Years | 188 (94.0%) | 156 (62.4%) |
| 18 to 24 Years | 615 (88.4%) | 887 (100.0%) |
| 25 to 34 Years | 1,068 (92.9%) | 1,346 (93.9%) |
| 35 to 44 Years | 1,916 (99.1%) | 1,260 (98.3%) |
| 45 to 54 Years | 1,168 (91.2%) | 904 (98.9%) |
| 55 to 64 Years | 751 (95.8%) | 913 (98.8%) |
| 65 to 74 Years | 442 (100.0%) | 599 (96.3%) |
| 75 Years and over | 372 (100.0%) | 233 (95.9%) |
| Total | 8,068 (93.7%) | 8,120 (96.2%) |
Income Below Poverty Among Married-Couple Families in Manassas Park
The poverty statistics for married-couple families in Manassas Park show that 0.4% or 10 of the total 2,525 families live below the poverty line. Families with 1 or 2 children have the highest poverty rate of 1.3%, comprising of 10 families. On the other hand, families with no children have the lowest poverty rate of 0.0%, which includes 0 families.
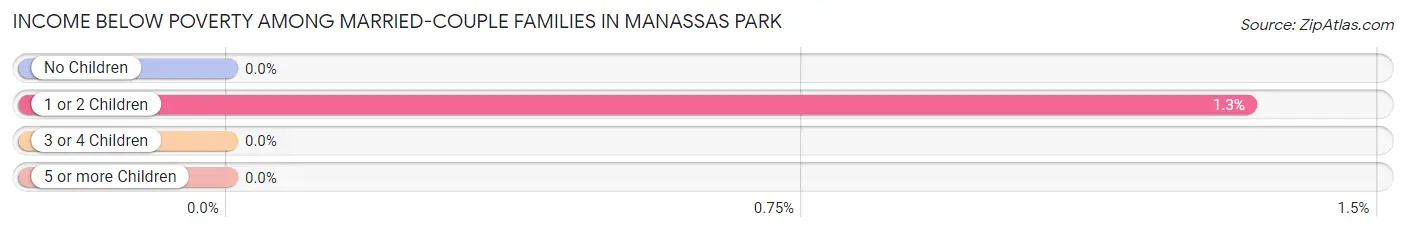
| Children | Above Poverty | Below Poverty |
| No Children | 1,143 (100.0%) | 0 (0.0%) |
| 1 or 2 Children | 740 (98.7%) | 10 (1.3%) |
| 3 or 4 Children | 545 (100.0%) | 0 (0.0%) |
| 5 or more Children | 87 (100.0%) | 0 (0.0%) |
| Total | 2,515 (99.6%) | 10 (0.4%) |
Income Below Poverty Among Single-Parent Households in Manassas Park
According to the poverty data in Manassas Park, 8.0% or 26 single-father households and 6.7% or 51 single-mother households are living below the poverty line. Among single-father households, those with 1 or 2 children have the highest poverty rate, with 26 households (17.4%) experiencing poverty. Likewise, among single-mother households, those with 5 or more children have the highest poverty rate, with 23 households (100.0%) falling below the poverty line.
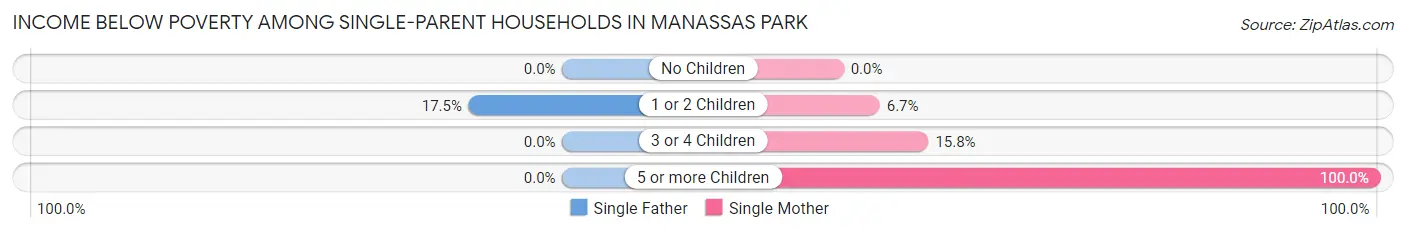
| Children | Single Father | Single Mother |
| No Children | 0 (0.0%) | 0 (0.0%) |
| 1 or 2 Children | 26 (17.4%) | 22 (6.7%) |
| 3 or 4 Children | 0 (0.0%) | 6 (15.8%) |
| 5 or more Children | 0 (0.0%) | 23 (100.0%) |
| Total | 26 (8.0%) | 51 (6.7%) |
Income Below Poverty Among Married-Couple vs Single-Parent Households in Manassas Park
The poverty data for Manassas Park shows that 10 of the married-couple family households (0.4%) and 77 of the single-parent households (7.1%) are living below the poverty level. Within the married-couple family households, those with 1 or 2 children have the highest poverty rate, with 10 households (1.3%) falling below the poverty line. Among the single-parent households, those with 5 or more children have the highest poverty rate, with 23 household (100.0%) living below poverty.
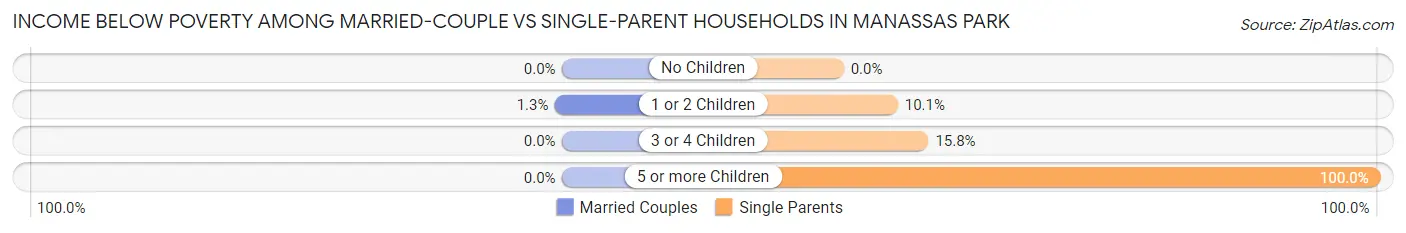
| Children | Married-Couple Families | Single-Parent Households |
| No Children | 0 (0.0%) | 0 (0.0%) |
| 1 or 2 Children | 10 (1.3%) | 48 (10.1%) |
| 3 or 4 Children | 0 (0.0%) | 6 (15.8%) |
| 5 or more Children | 0 (0.0%) | 23 (100.0%) |
| Total | 10 (0.4%) | 77 (7.1%) |
Race in Manassas Park
The most populous races in Manassas Park are White / Caucasian (7,774 | 45.4%), Hispanic or Latino (7,175 | 41.9%), and Black / African American (2,514 | 14.7%).
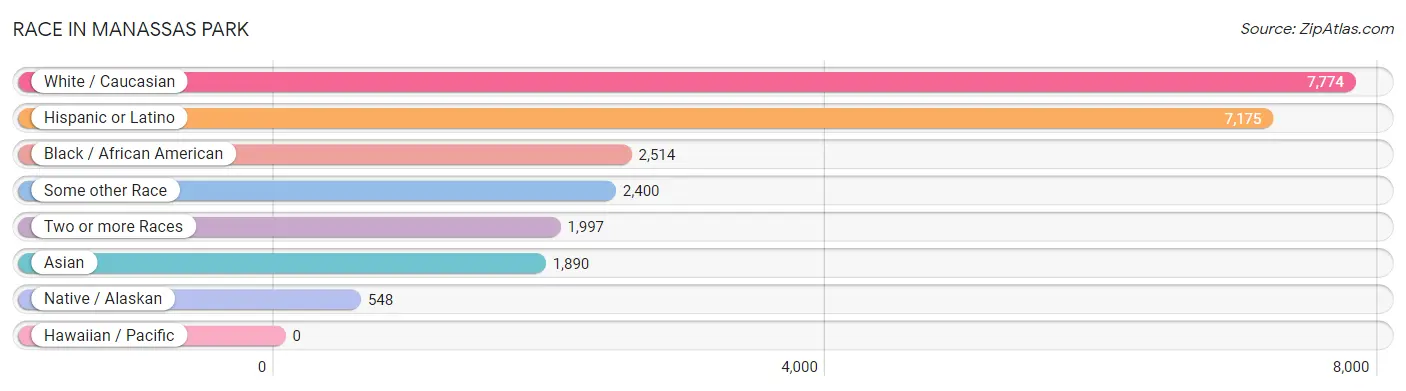
| Race | # Population | % Population |
| Asian | 1,890 | 11.0% |
| Black / African American | 2,514 | 14.7% |
| Hawaiian / Pacific | 0 | 0.0% |
| Hispanic or Latino | 7,175 | 41.9% |
| Native / Alaskan | 548 | 3.2% |
| White / Caucasian | 7,774 | 45.4% |
| Two or more Races | 1,997 | 11.7% |
| Some other Race | 2,400 | 14.0% |
| Total | 17,123 | 100.0% |
Ancestry in Manassas Park
The most populous ancestries reported in Manassas Park are Central American (5,255 | 30.7%), Salvadoran (3,274 | 19.1%), German (1,187 | 6.9%), Guatemalan (1,061 | 6.2%), and Irish (973 | 5.7%), together accounting for 68.6% of all Manassas Park residents.
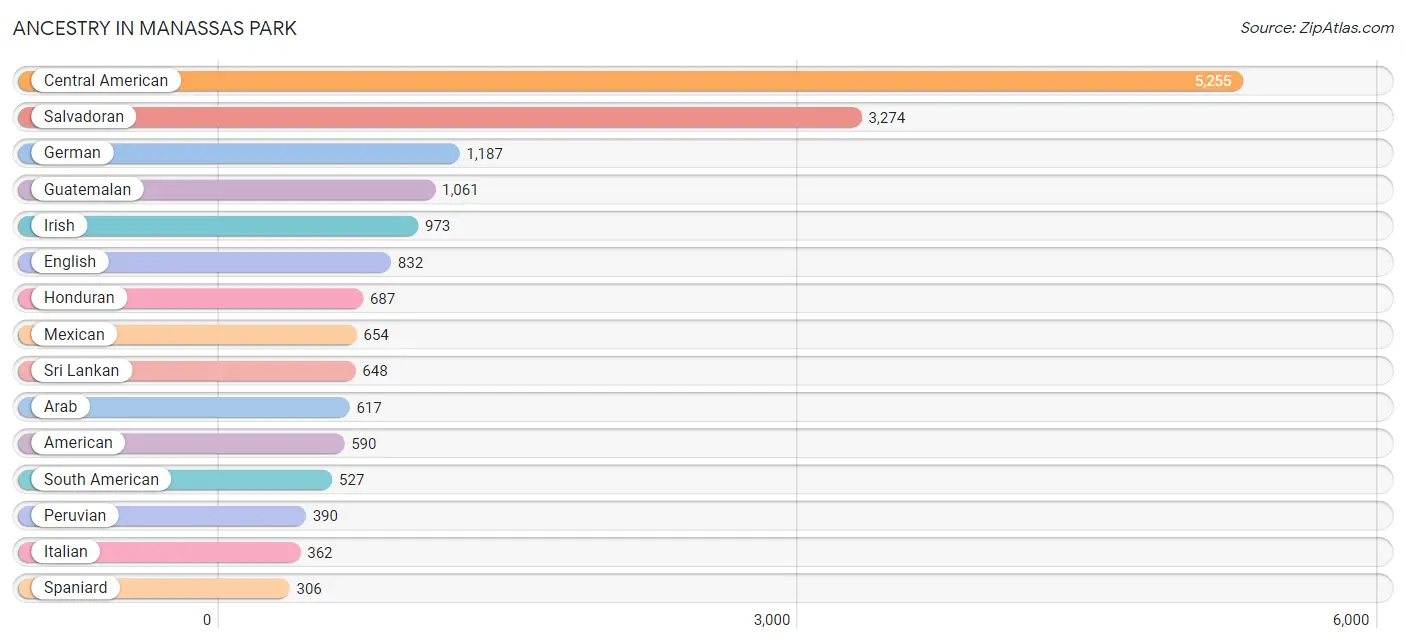
| Ancestry | # Population | % Population |
| Afghan | 101 | 0.6% |
| African | 177 | 1.0% |
| Albanian | 9 | 0.1% |
| American | 590 | 3.5% |
| Arab | 617 | 3.6% |
| Bhutanese | 61 | 0.4% |
| Bolivian | 67 | 0.4% |
| Brazilian | 15 | 0.1% |
| British | 39 | 0.2% |
| Burmese | 128 | 0.7% |
| Central American | 5,255 | 30.7% |
| Central American Indian | 278 | 1.6% |
| Colombian | 56 | 0.3% |
| Cuban | 72 | 0.4% |
| Czech | 10 | 0.1% |
| Dominican | 10 | 0.1% |
| Dutch | 176 | 1.0% |
| Eastern European | 12 | 0.1% |
| Ecuadorian | 10 | 0.1% |
| English | 832 | 4.9% |
| European | 185 | 1.1% |
| Finnish | 20 | 0.1% |
| French | 109 | 0.6% |
| French Canadian | 103 | 0.6% |
| German | 1,187 | 6.9% |
| Guamanian / Chamorro | 18 | 0.1% |
| Guatemalan | 1,061 | 6.2% |
| Honduran | 687 | 4.0% |
| Hungarian | 43 | 0.3% |
| Indian (Asian) | 29 | 0.2% |
| Iranian | 29 | 0.2% |
| Irish | 973 | 5.7% |
| Italian | 362 | 2.1% |
| Jamaican | 45 | 0.3% |
| Japanese | 111 | 0.6% |
| Korean | 258 | 1.5% |
| Latvian | 6 | 0.0% |
| Lebanese | 5 | 0.0% |
| Mexican | 654 | 3.8% |
| Moroccan | 23 | 0.1% |
| Nicaraguan | 233 | 1.4% |
| Nigerian | 28 | 0.2% |
| Norwegian | 13 | 0.1% |
| Pennsylvania German | 21 | 0.1% |
| Peruvian | 390 | 2.3% |
| Polish | 8 | 0.1% |
| Portuguese | 152 | 0.9% |
| Puerto Rican | 71 | 0.4% |
| Russian | 39 | 0.2% |
| Salvadoran | 3,274 | 19.1% |
| Scotch-Irish | 45 | 0.3% |
| Scottish | 155 | 0.9% |
| Slovak | 19 | 0.1% |
| South American | 527 | 3.1% |
| Spaniard | 306 | 1.8% |
| Spanish | 55 | 0.3% |
| Sri Lankan | 648 | 3.8% |
| Subsaharan African | 241 | 1.4% |
| Swedish | 128 | 0.7% |
| Swiss | 12 | 0.1% |
| Thai | 303 | 1.8% |
| Ukrainian | 13 | 0.1% |
| Venezuelan | 4 | 0.0% |
| Vietnamese | 81 | 0.5% |
| Welsh | 158 | 0.9% |
| Zimbabwean | 36 | 0.2% | View All 66 Rows |
Immigrants in Manassas Park
The most numerous immigrant groups reported in Manassas Park came from Latin America (3,992 | 23.3%), Central America (3,388 | 19.8%), Asia (1,791 | 10.5%), El Salvador (1,179 | 6.9%), and Guatemala (1,132 | 6.6%), together accounting for 67.1% of all Manassas Park residents.
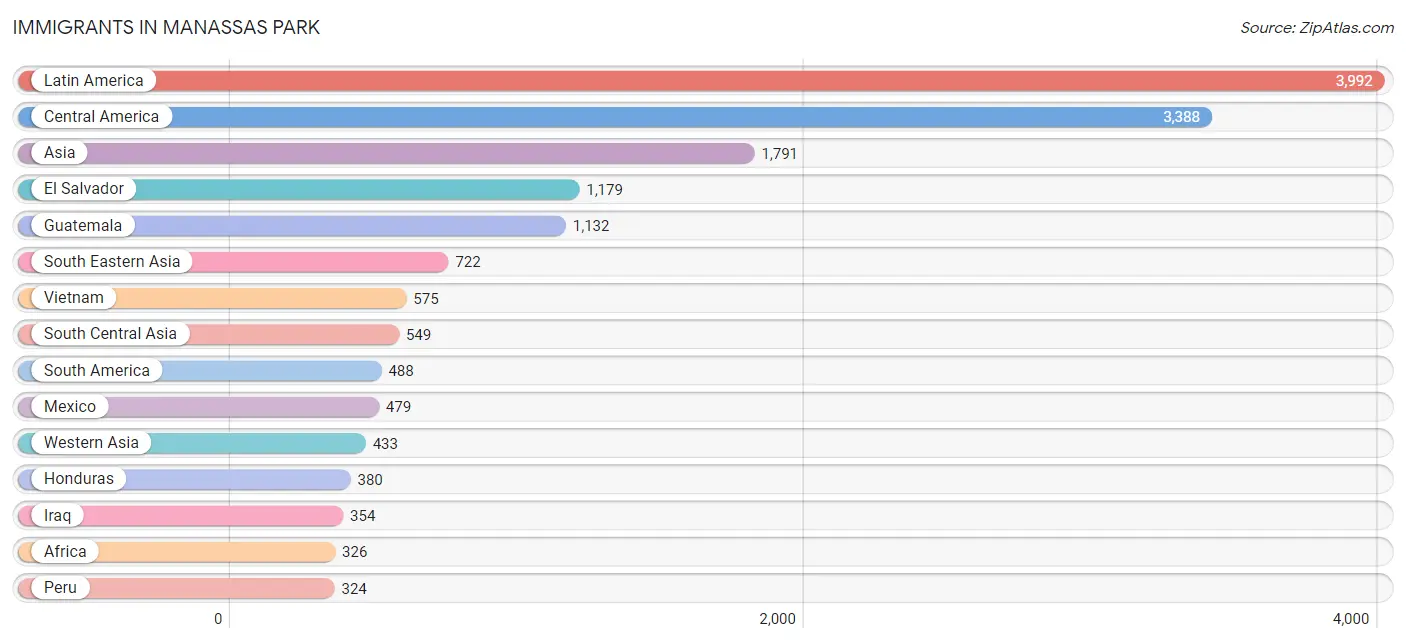
| Immigration Origin | # Population | % Population |
| Afghanistan | 49 | 0.3% |
| Africa | 326 | 1.9% |
| Asia | 1,791 | 10.5% |
| Bangladesh | 172 | 1.0% |
| Bolivia | 10 | 0.1% |
| Brazil | 53 | 0.3% |
| Cambodia | 74 | 0.4% |
| Cameroon | 194 | 1.1% |
| Caribbean | 116 | 0.7% |
| Central America | 3,388 | 19.8% |
| China | 13 | 0.1% |
| Colombia | 56 | 0.3% |
| Cuba | 72 | 0.4% |
| Eastern Africa | 36 | 0.2% |
| Eastern Asia | 87 | 0.5% |
| Eastern Europe | 18 | 0.1% |
| Ecuador | 10 | 0.1% |
| El Salvador | 1,179 | 6.9% |
| Europe | 149 | 0.9% |
| Guatemala | 1,132 | 6.6% |
| Guyana | 31 | 0.2% |
| Honduras | 380 | 2.2% |
| India | 158 | 0.9% |
| Iran | 29 | 0.2% |
| Iraq | 354 | 2.1% |
| Italy | 17 | 0.1% |
| Korea | 74 | 0.4% |
| Kuwait | 79 | 0.5% |
| Latin America | 3,992 | 23.3% |
| Mexico | 479 | 2.8% |
| Middle Africa | 194 | 1.1% |
| Morocco | 37 | 0.2% |
| Nicaragua | 190 | 1.1% |
| Nigeria | 59 | 0.3% |
| Northern Africa | 37 | 0.2% |
| Pakistan | 141 | 0.8% |
| Panama | 28 | 0.2% |
| Peru | 324 | 1.9% |
| Philippines | 73 | 0.4% |
| Portugal | 114 | 0.7% |
| Russia | 14 | 0.1% |
| South America | 488 | 2.9% |
| South Central Asia | 549 | 3.2% |
| South Eastern Asia | 722 | 4.2% |
| Southern Europe | 131 | 0.8% |
| Trinidad and Tobago | 44 | 0.3% |
| Ukraine | 4 | 0.0% |
| Venezuela | 4 | 0.0% |
| Vietnam | 575 | 3.4% |
| Western Africa | 59 | 0.3% |
| Western Asia | 433 | 2.5% |
| Zimbabwe | 36 | 0.2% | View All 52 Rows |
Sex and Age in Manassas Park
Sex and Age in Manassas Park
The most populous age groups in Manassas Park are 35 to 39 Years (1,167 | 13.4%) for men and 35 to 39 Years (774 | 9.2%) for women.
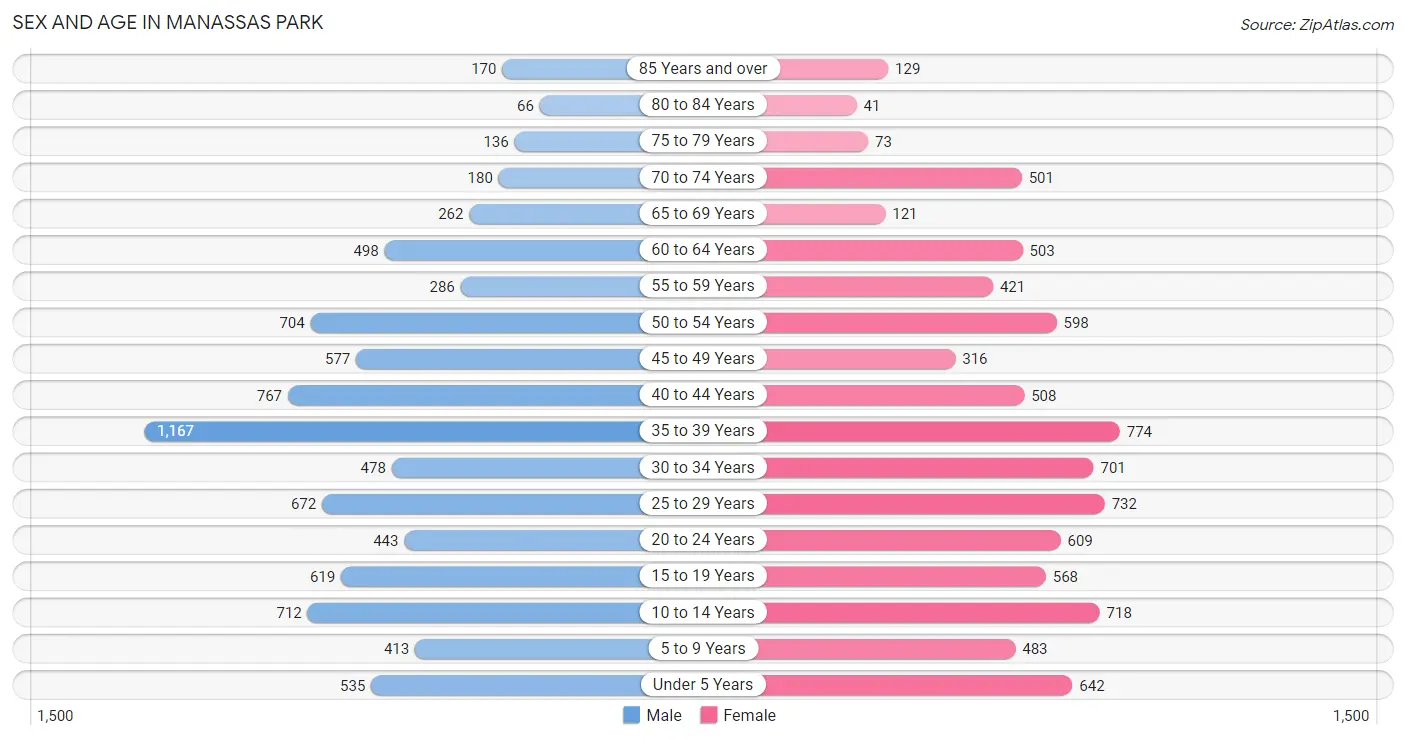
| Age Bracket | Male | Female |
| Under 5 Years | 535 (6.2%) | 642 (7.6%) |
| 5 to 9 Years | 413 (4.8%) | 483 (5.7%) |
| 10 to 14 Years | 712 (8.2%) | 718 (8.5%) |
| 15 to 19 Years | 619 (7.1%) | 568 (6.7%) |
| 20 to 24 Years | 443 (5.1%) | 609 (7.2%) |
| 25 to 29 Years | 672 (7.7%) | 732 (8.7%) |
| 30 to 34 Years | 478 (5.5%) | 701 (8.3%) |
| 35 to 39 Years | 1,167 (13.4%) | 774 (9.2%) |
| 40 to 44 Years | 767 (8.8%) | 508 (6.0%) |
| 45 to 49 Years | 577 (6.6%) | 316 (3.7%) |
| 50 to 54 Years | 704 (8.1%) | 598 (7.1%) |
| 55 to 59 Years | 286 (3.3%) | 421 (5.0%) |
| 60 to 64 Years | 498 (5.7%) | 503 (6.0%) |
| 65 to 69 Years | 262 (3.0%) | 121 (1.4%) |
| 70 to 74 Years | 180 (2.1%) | 501 (5.9%) |
| 75 to 79 Years | 136 (1.6%) | 73 (0.9%) |
| 80 to 84 Years | 66 (0.8%) | 41 (0.5%) |
| 85 Years and over | 170 (2.0%) | 129 (1.5%) |
| Total | 8,685 (100.0%) | 8,438 (100.0%) |
Families and Households in Manassas Park
Median Family Size in Manassas Park
The median family size in Manassas Park is 3.94 persons per family, with single female/mother families (757 | 21.0%) accounting for the largest median family size of 4.66 persons per family. On the other hand, single male/father families (324 | 9.0%) represent the smallest median family size with 3.14 persons per family.
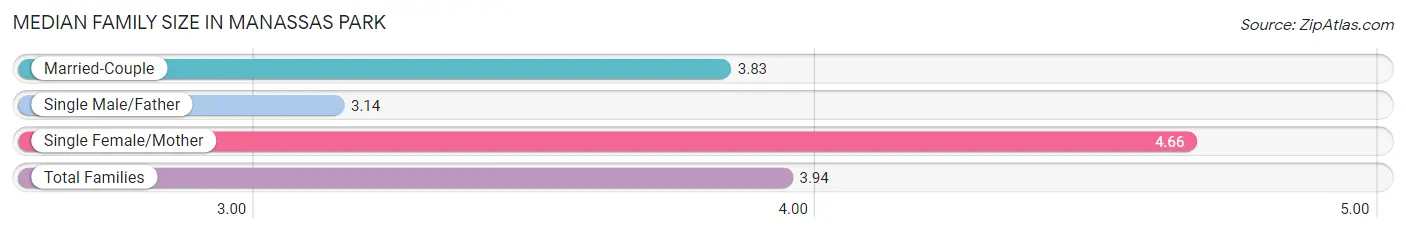
| Family Type | # Families | Family Size |
| Married-Couple | 2,525 (70.0%) | 3.83 |
| Single Male/Father | 324 (9.0%) | 3.14 |
| Single Female/Mother | 757 (21.0%) | 4.66 |
| Total Families | 3,606 (100.0%) | 3.94 |
Median Household Size in Manassas Park
The median household size in Manassas Park is 3.28 persons per household, with single female/mother households (757 | 14.5%) accounting for the largest median household size of 5.47 persons per household. non-family households (1,615 | 30.9%) represent the smallest median household size with 1.14 persons per household.
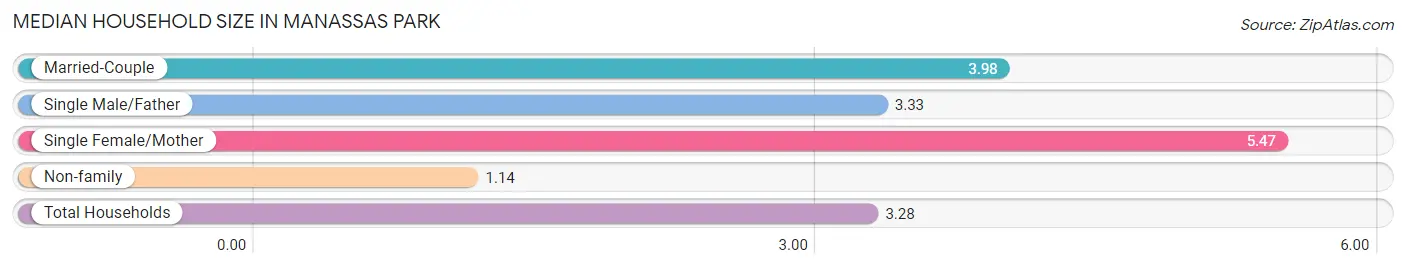
| Household Type | # Households | Household Size |
| Married-Couple | 2,525 (48.4%) | 3.98 |
| Single Male/Father | 324 (6.2%) | 3.33 |
| Single Female/Mother | 757 (14.5%) | 5.47 |
| Non-family | 1,615 (30.9%) | 1.14 |
| Total Households | 5,221 (100.0%) | 3.28 |
Household Size by Marriage Status in Manassas Park
Out of a total of 5,221 households in Manassas Park, 3,606 (69.1%) are family households, while 1,615 (30.9%) are nonfamily households. The most numerous type of family households are 2-person households, comprising 1,154, and the most common type of nonfamily households are 1-person households, comprising 1,454.
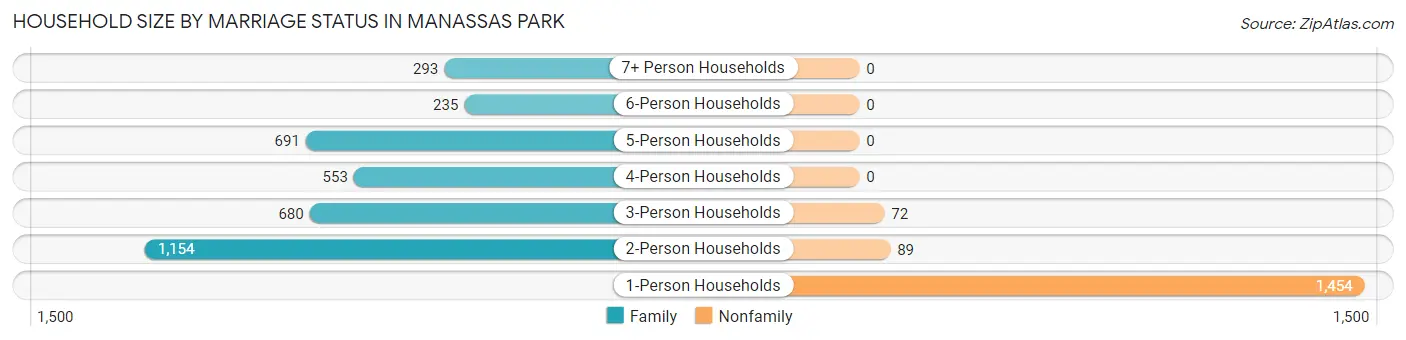
| Household Size | Family Households | Nonfamily Households |
| 1-Person Households | - | 1,454 (27.9%) |
| 2-Person Households | 1,154 (22.1%) | 89 (1.7%) |
| 3-Person Households | 680 (13.0%) | 72 (1.4%) |
| 4-Person Households | 553 (10.6%) | 0 (0.0%) |
| 5-Person Households | 691 (13.2%) | 0 (0.0%) |
| 6-Person Households | 235 (4.5%) | 0 (0.0%) |
| 7+ Person Households | 293 (5.6%) | 0 (0.0%) |
| Total | 3,606 (69.1%) | 1,615 (30.9%) |
Female Fertility in Manassas Park
Fertility by Age in Manassas Park
Average fertility rate in Manassas Park is 18.0 births per 1,000 women. Women in the age bracket of 20 to 34 years have the highest fertility rate with 39.0 births per 1,000 women. Women in the age bracket of 20 to 34 years acount for 100.0% of all women with births.
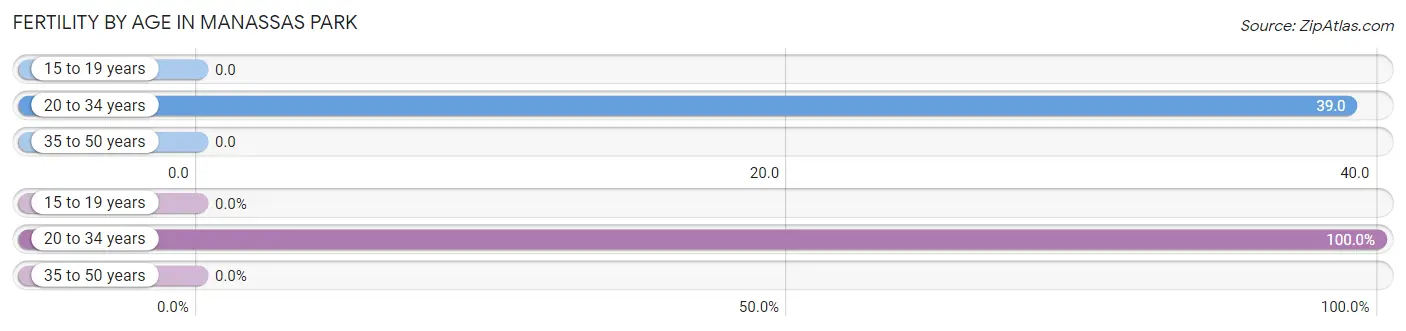
| Age Bracket | Women with Births | Births / 1,000 Women |
| 15 to 19 years | 0 (0.0%) | 0.0 |
| 20 to 34 years | 79 (100.0%) | 39.0 |
| 35 to 50 years | 0 (0.0%) | 0.0 |
| Total | 79 (100.0%) | 18.0 |
Fertility by Age by Marriage Status in Manassas Park
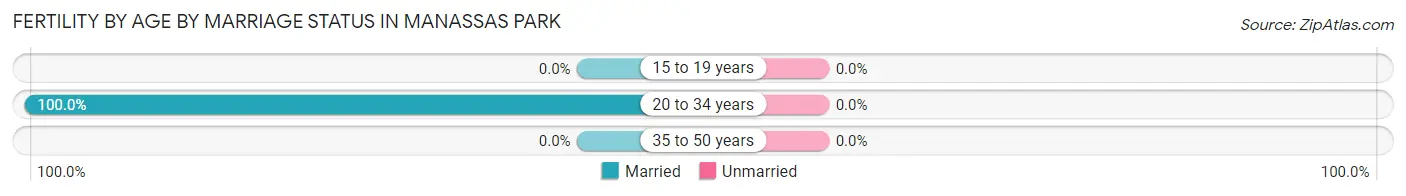
| Age Bracket | Married | Unmarried |
| 15 to 19 years | 0 (0.0%) | 0 (0.0%) |
| 20 to 34 years | 79 (100.0%) | 0 (0.0%) |
| 35 to 50 years | 0 (0.0%) | 0 (0.0%) |
| Total | 79 (100.0%) | 0 (0.0%) |
Fertility by Education in Manassas Park
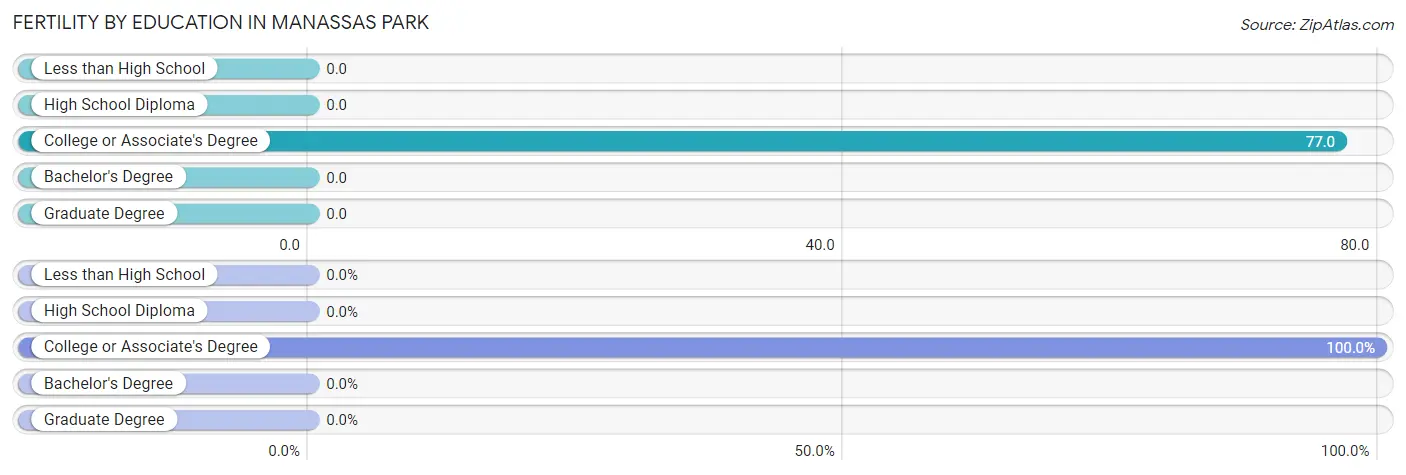
| Educational Attainment | Women with Births | Births / 1,000 Women |
| Less than High School | 0 (0.0%) | 0.0 |
| High School Diploma | 0 (0.0%) | 0.0 |
| College or Associate's Degree | 79 (100.0%) | 77.0 |
| Bachelor's Degree | 0 (0.0%) | 0.0 |
| Graduate Degree | 0 (0.0%) | 0.0 |
| Total | 79 (100.0%) | 18.0 |
Fertility by Education by Marriage Status in Manassas Park
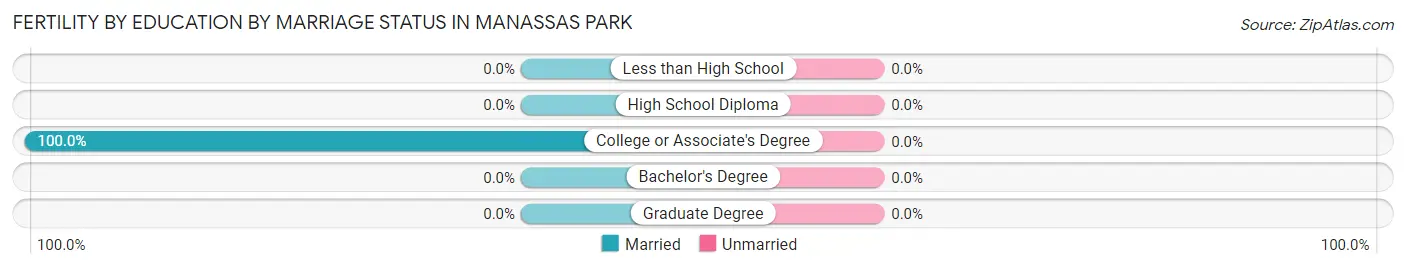
| Educational Attainment | Married | Unmarried |
| Less than High School | 0 (0.0%) | 0 (0.0%) |
| High School Diploma | 0 (0.0%) | 0 (0.0%) |
| College or Associate's Degree | 79 (100.0%) | 0 (0.0%) |
| Bachelor's Degree | 0 (0.0%) | 0 (0.0%) |
| Graduate Degree | 0 (0.0%) | 0 (0.0%) |
| Total | 79 (100.0%) | 0 (0.0%) |
Employment Characteristics in Manassas Park
Employment by Class of Employer in Manassas Park
Among the 9,756 employed individuals in Manassas Park, private company employees (7,118 | 73.0%), federal government employees (961 | 9.9%), and local government employees (545 | 5.6%) make up the most common classes of employment.
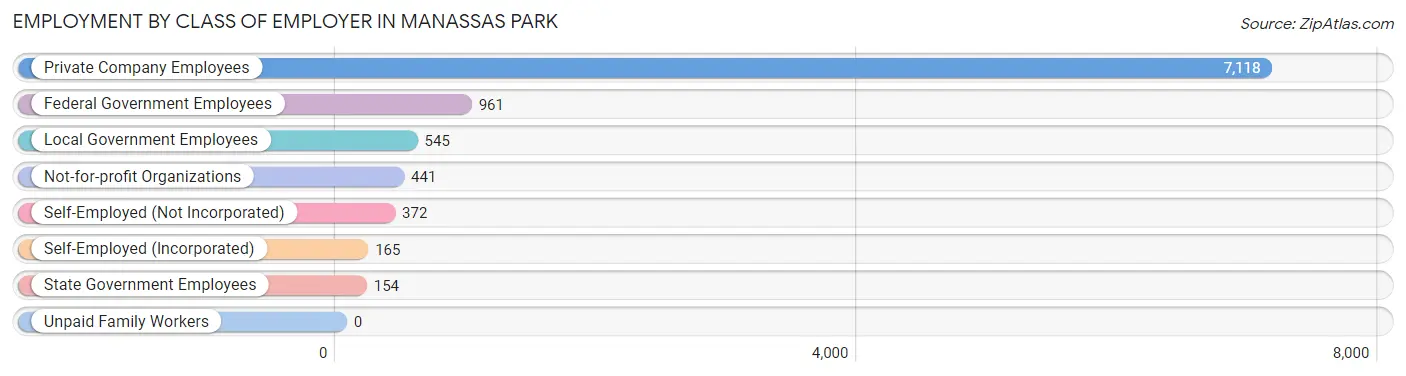
| Employer Class | # Employees | % Employees |
| Private Company Employees | 7,118 | 73.0% |
| Self-Employed (Incorporated) | 165 | 1.7% |
| Self-Employed (Not Incorporated) | 372 | 3.8% |
| Not-for-profit Organizations | 441 | 4.5% |
| Local Government Employees | 545 | 5.6% |
| State Government Employees | 154 | 1.6% |
| Federal Government Employees | 961 | 9.9% |
| Unpaid Family Workers | 0 | 0.0% |
| Total | 9,756 | 100.0% |
Employment Status by Age in Manassas Park
According to the labor force statistics for Manassas Park, out of the total population over 16 years of age (13,414), 76.7% or 10,289 individuals are in the labor force, with 3.2% or 329 of them unemployed. The age group with the highest labor force participation rate is 20 to 24 years, with 94.6% or 995 individuals in the labor force. Within the labor force, the 16 to 19 years age range has the highest percentage of unemployed individuals, with 13.7% or 66 of them being unemployed.
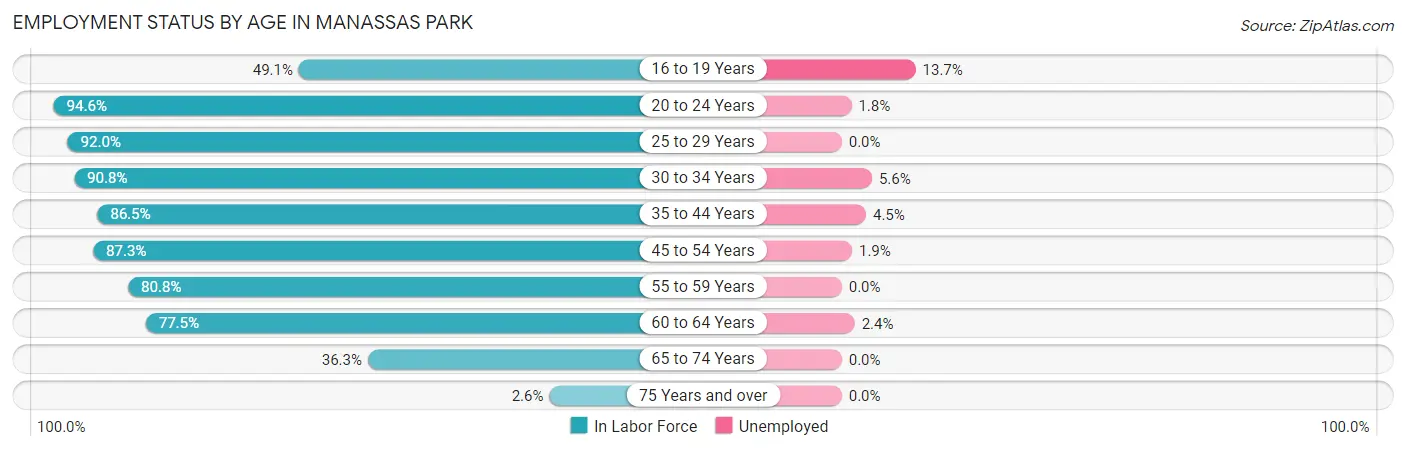
| Age Bracket | In Labor Force | Unemployed |
| 16 to 19 Years | 482 (49.1%) | 66 (13.7%) |
| 20 to 24 Years | 995 (94.6%) | 18 (1.8%) |
| 25 to 29 Years | 1,292 (92.0%) | 0 (0.0%) |
| 30 to 34 Years | 1,071 (90.8%) | 60 (5.6%) |
| 35 to 44 Years | 2,782 (86.5%) | 125 (4.5%) |
| 45 to 54 Years | 1,916 (87.3%) | 36 (1.9%) |
| 55 to 59 Years | 571 (80.8%) | 0 (0.0%) |
| 60 to 64 Years | 776 (77.5%) | 19 (2.4%) |
| 65 to 74 Years | 386 (36.3%) | 0 (0.0%) |
| 75 Years and over | 16 (2.6%) | 0 (0.0%) |
| Total | 10,289 (76.7%) | 329 (3.2%) |
Employment Status by Educational Attainment in Manassas Park
According to labor force statistics for Manassas Park, 86.7% of individuals (8,412) out of the total population between 25 and 64 years of age (9,702) are in the labor force, with 2.9% or 244 of them being unemployed. The group with the highest labor force participation rate are those with the educational attainment of bachelor's degree or higher, with 91.1% or 2,313 individuals in the labor force. Within the labor force, individuals with college / associate degree education have the highest percentage of unemployment, with 4.9% or 95 of them being unemployed.
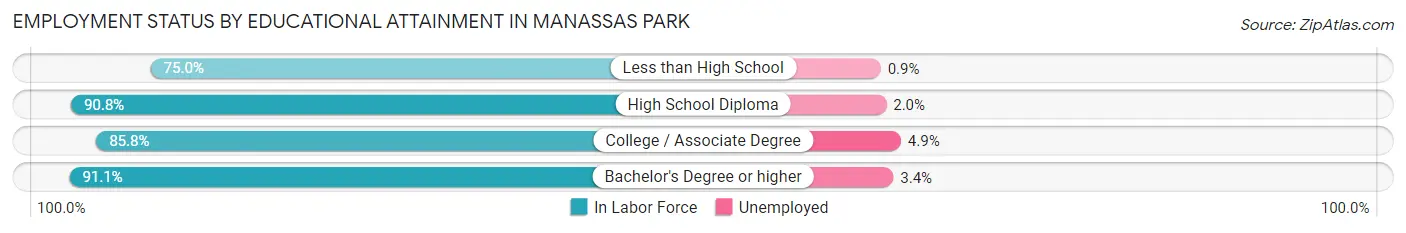
| Educational Attainment | In Labor Force | Unemployed |
| Less than High School | 1,406 (75.0%) | 17 (0.9%) |
| High School Diploma | 2,760 (90.8%) | 61 (2.0%) |
| College / Associate Degree | 1,929 (85.8%) | 110 (4.9%) |
| Bachelor's Degree or higher | 2,313 (91.1%) | 86 (3.4%) |
| Total | 8,412 (86.7%) | 281 (2.9%) |
Employment Occupations by Sex in Manassas Park
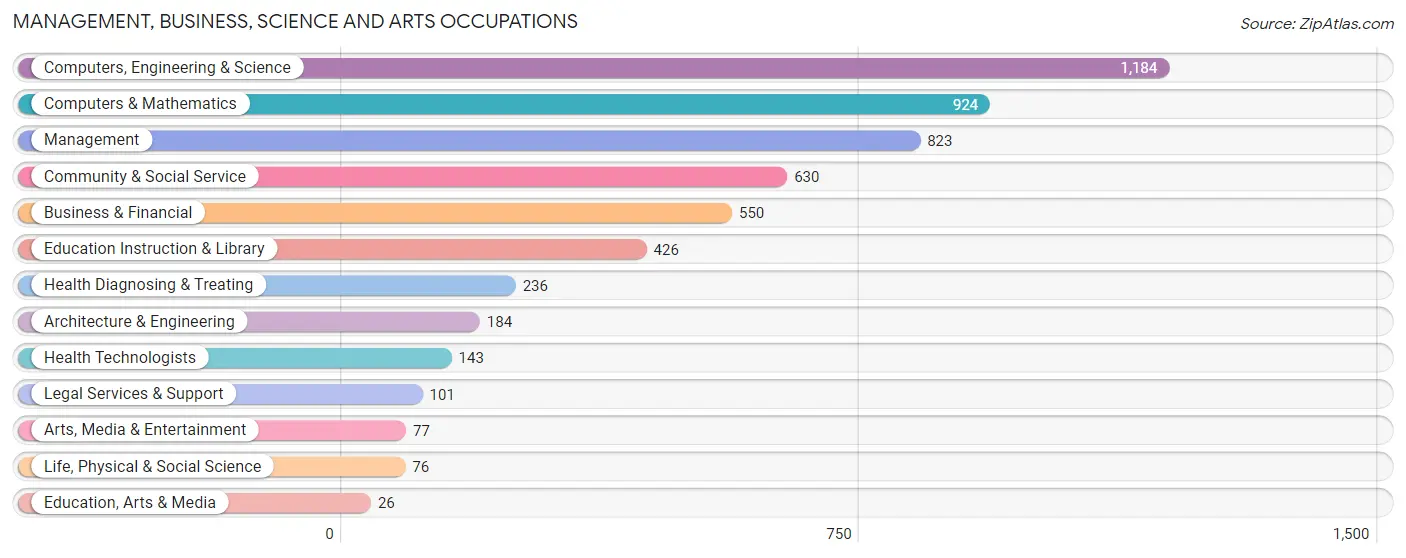
Management, Business, Science and Arts Occupations
The most common Management, Business, Science and Arts occupations in Manassas Park are Computers, Engineering & Science (1,184 | 11.9%), Computers & Mathematics (924 | 9.3%), Management (823 | 8.3%), Community & Social Service (630 | 6.3%), and Business & Financial (550 | 5.5%).
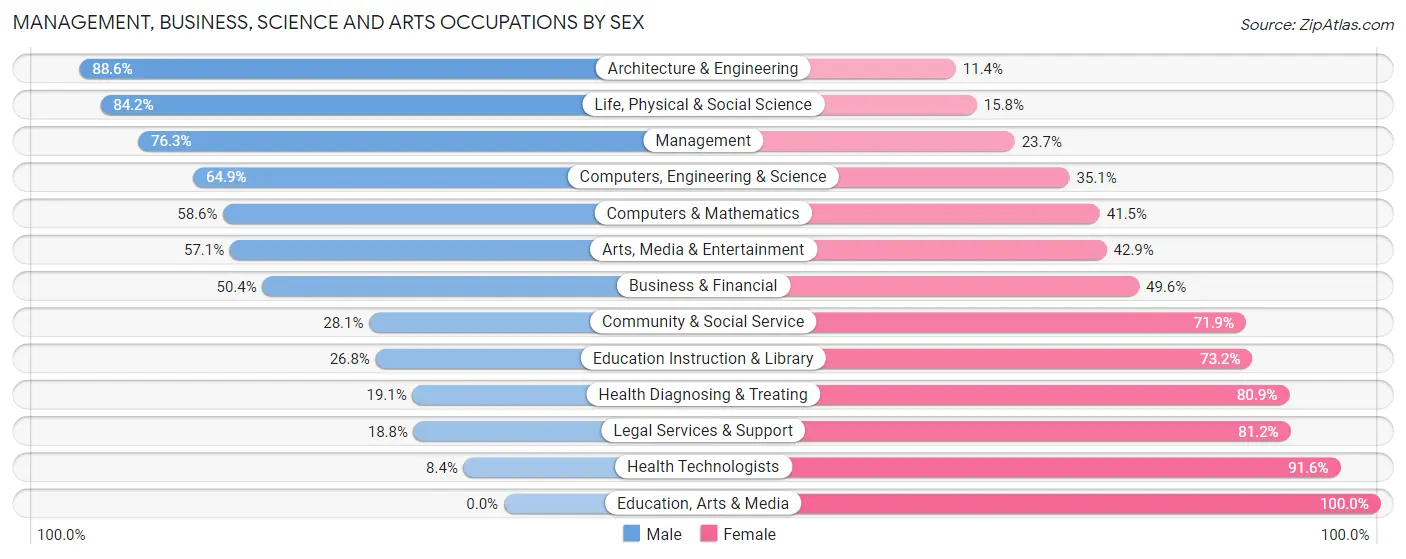
Management, Business, Science and Arts Occupations by Sex
Within the Management, Business, Science and Arts occupations in Manassas Park, the most male-oriented occupations are Architecture & Engineering (88.6%), Life, Physical & Social Science (84.2%), and Management (76.3%), while the most female-oriented occupations are Education, Arts & Media (100.0%), Health Technologists (91.6%), and Legal Services & Support (81.2%).
| Occupation | Male | Female |
| Management | 628 (76.3%) | 195 (23.7%) |
| Business & Financial | 277 (50.4%) | 273 (49.6%) |
| Computers, Engineering & Science | 768 (64.9%) | 416 (35.1%) |
| Computers & Mathematics | 541 (58.6%) | 383 (41.4%) |
| Architecture & Engineering | 163 (88.6%) | 21 (11.4%) |
| Life, Physical & Social Science | 64 (84.2%) | 12 (15.8%) |
| Community & Social Service | 177 (28.1%) | 453 (71.9%) |
| Education, Arts & Media | 0 (0.0%) | 26 (100.0%) |
| Legal Services & Support | 19 (18.8%) | 82 (81.2%) |
| Education Instruction & Library | 114 (26.8%) | 312 (73.2%) |
| Arts, Media & Entertainment | 44 (57.1%) | 33 (42.9%) |
| Health Diagnosing & Treating | 45 (19.1%) | 191 (80.9%) |
| Health Technologists | 12 (8.4%) | 131 (91.6%) |
| Total (Category) | 1,895 (55.4%) | 1,528 (44.6%) |
| Total (Overall) | 5,577 (56.0%) | 4,387 (44.0%) |
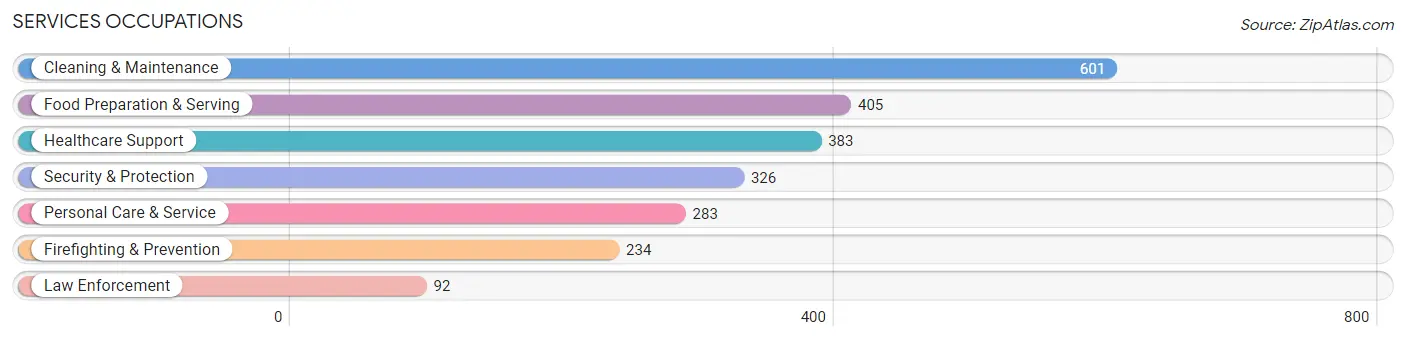
Services Occupations
The most common Services occupations in Manassas Park are Cleaning & Maintenance (601 | 6.0%), Food Preparation & Serving (405 | 4.1%), Healthcare Support (383 | 3.8%), Security & Protection (326 | 3.3%), and Personal Care & Service (283 | 2.8%).
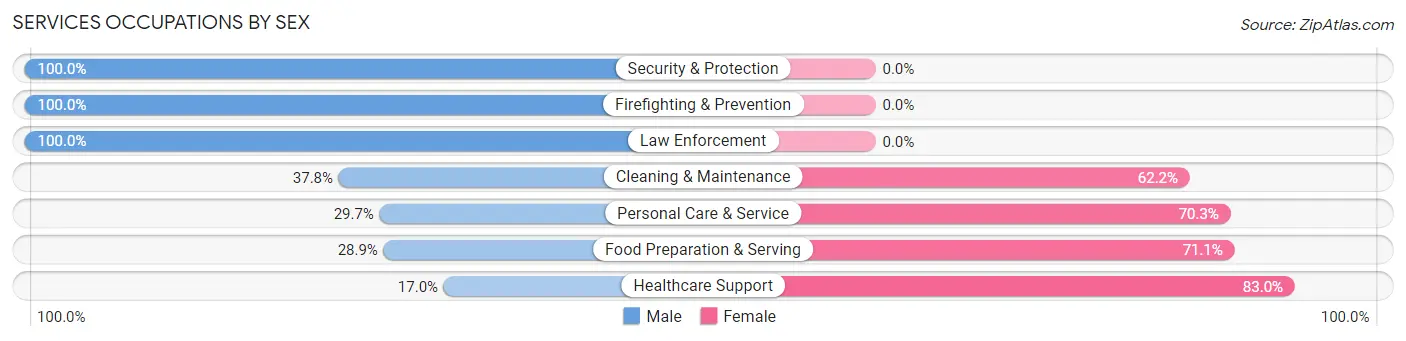
Services Occupations by Sex
Within the Services occupations in Manassas Park, the most male-oriented occupations are Security & Protection (100.0%), Firefighting & Prevention (100.0%), and Law Enforcement (100.0%), while the most female-oriented occupations are Healthcare Support (83.0%), Food Preparation & Serving (71.1%), and Personal Care & Service (70.3%).
| Occupation | Male | Female |
| Healthcare Support | 65 (17.0%) | 318 (83.0%) |
| Security & Protection | 326 (100.0%) | 0 (0.0%) |
| Firefighting & Prevention | 234 (100.0%) | 0 (0.0%) |
| Law Enforcement | 92 (100.0%) | 0 (0.0%) |
| Food Preparation & Serving | 117 (28.9%) | 288 (71.1%) |
| Cleaning & Maintenance | 227 (37.8%) | 374 (62.2%) |
| Personal Care & Service | 84 (29.7%) | 199 (70.3%) |
| Total (Category) | 819 (41.0%) | 1,179 (59.0%) |
| Total (Overall) | 5,577 (56.0%) | 4,387 (44.0%) |
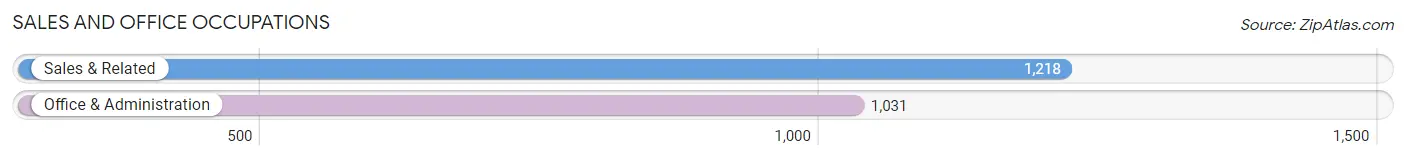
Sales and Office Occupations
The most common Sales and Office occupations in Manassas Park are Sales & Related (1,218 | 12.2%), and Office & Administration (1,031 | 10.3%).
Sales and Office Occupations by Sex
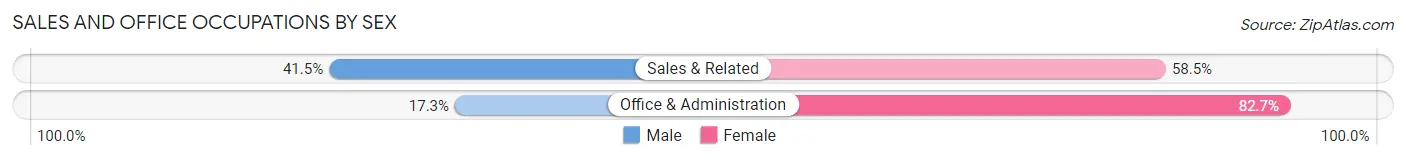
| Occupation | Male | Female |
| Sales & Related | 505 (41.5%) | 713 (58.5%) |
| Office & Administration | 178 (17.3%) | 853 (82.7%) |
| Total (Category) | 683 (30.4%) | 1,566 (69.6%) |
| Total (Overall) | 5,577 (56.0%) | 4,387 (44.0%) |
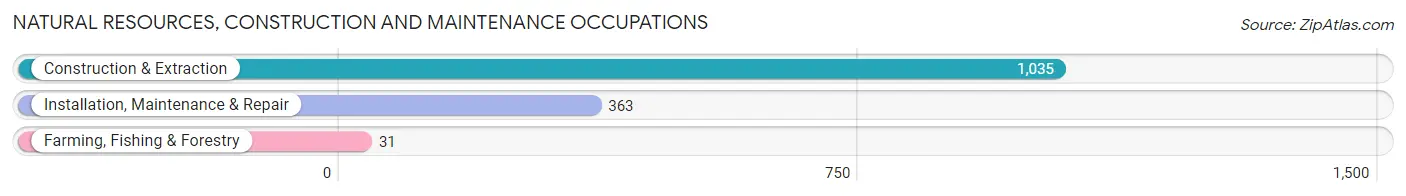
Natural Resources, Construction and Maintenance Occupations
The most common Natural Resources, Construction and Maintenance occupations in Manassas Park are Construction & Extraction (1,035 | 10.4%), Installation, Maintenance & Repair (363 | 3.6%), and Farming, Fishing & Forestry (31 | 0.3%).
Natural Resources, Construction and Maintenance Occupations by Sex
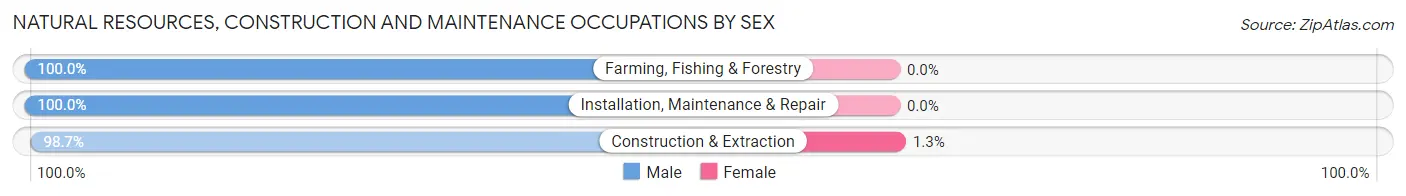
| Occupation | Male | Female |
| Farming, Fishing & Forestry | 31 (100.0%) | 0 (0.0%) |
| Construction & Extraction | 1,022 (98.7%) | 13 (1.3%) |
| Installation, Maintenance & Repair | 363 (100.0%) | 0 (0.0%) |
| Total (Category) | 1,416 (99.1%) | 13 (0.9%) |
| Total (Overall) | 5,577 (56.0%) | 4,387 (44.0%) |
Production, Transportation and Moving Occupations
The most common Production, Transportation and Moving occupations in Manassas Park are Transportation (312 | 3.1%), Material Moving (312 | 3.1%), and Production (241 | 2.4%).
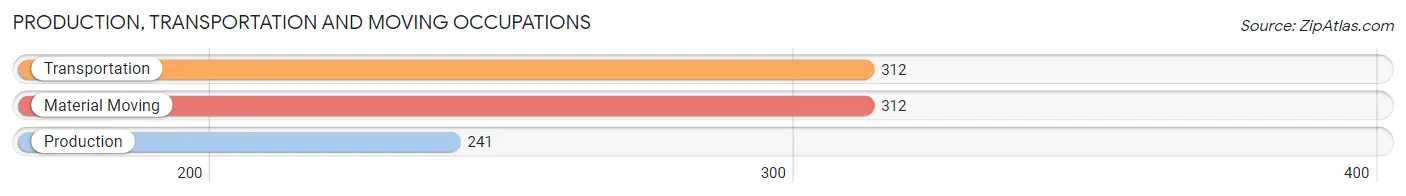
Production, Transportation and Moving Occupations by Sex
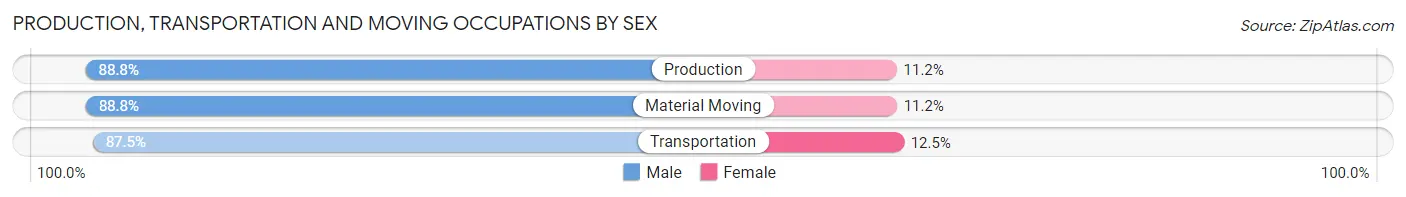
| Occupation | Male | Female |
| Production | 214 (88.8%) | 27 (11.2%) |
| Transportation | 273 (87.5%) | 39 (12.5%) |
| Material Moving | 277 (88.8%) | 35 (11.2%) |
| Total (Category) | 764 (88.3%) | 101 (11.7%) |
| Total (Overall) | 5,577 (56.0%) | 4,387 (44.0%) |
Employment Industries by Sex in Manassas Park
Employment Industries in Manassas Park
The major employment industries in Manassas Park include Construction (1,478 | 14.8%), Professional & Scientific (1,219 | 12.2%), Public Administration (1,064 | 10.7%), Health Care & Social Assistance (1,043 | 10.5%), and Retail Trade (1,034 | 10.4%).
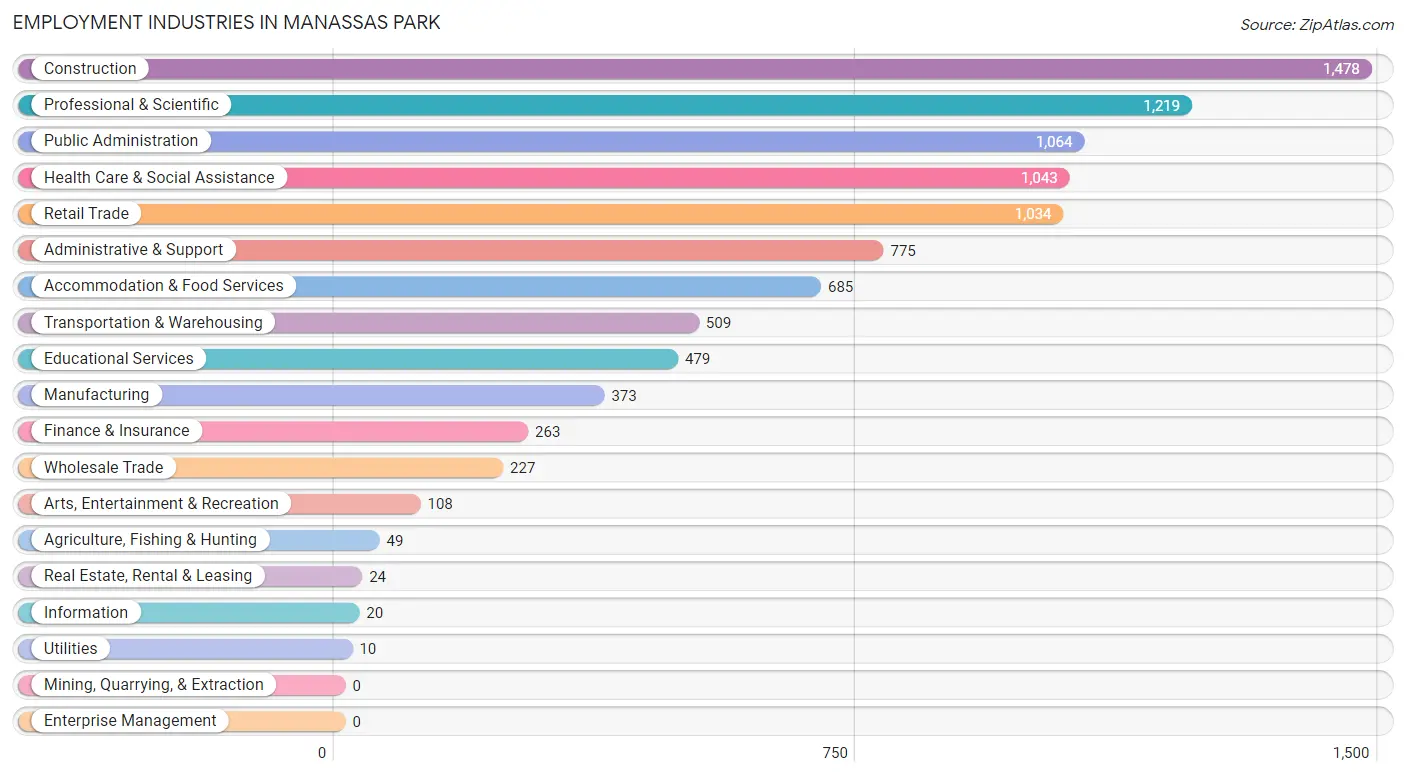
Employment Industries by Sex in Manassas Park
The Manassas Park industries that see more men than women are Agriculture, Fishing & Hunting (100.0%), Utilities (100.0%), and Information (100.0%), whereas the industries that tend to have a higher number of women are Accommodation & Food Services (77.8%), Health Care & Social Assistance (75.2%), and Educational Services (68.5%).
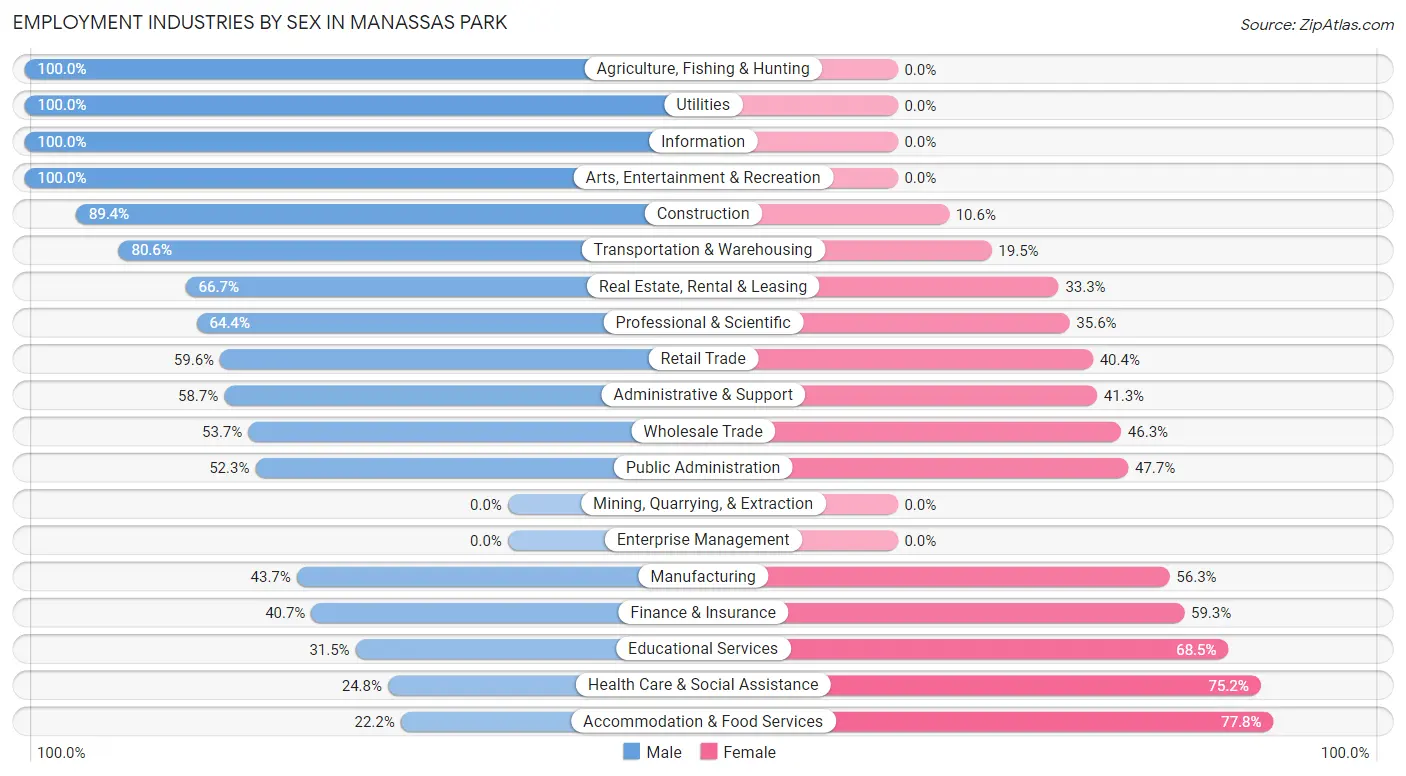
| Industry | Male | Female |
| Agriculture, Fishing & Hunting | 49 (100.0%) | 0 (0.0%) |
| Mining, Quarrying, & Extraction | 0 (0.0%) | 0 (0.0%) |
| Construction | 1,321 (89.4%) | 157 (10.6%) |
| Manufacturing | 163 (43.7%) | 210 (56.3%) |
| Wholesale Trade | 122 (53.7%) | 105 (46.3%) |
| Retail Trade | 616 (59.6%) | 418 (40.4%) |
| Transportation & Warehousing | 410 (80.5%) | 99 (19.5%) |
| Utilities | 10 (100.0%) | 0 (0.0%) |
| Information | 20 (100.0%) | 0 (0.0%) |
| Finance & Insurance | 107 (40.7%) | 156 (59.3%) |
| Real Estate, Rental & Leasing | 16 (66.7%) | 8 (33.3%) |
| Professional & Scientific | 785 (64.4%) | 434 (35.6%) |
| Enterprise Management | 0 (0.0%) | 0 (0.0%) |
| Administrative & Support | 455 (58.7%) | 320 (41.3%) |
| Educational Services | 151 (31.5%) | 328 (68.5%) |
| Health Care & Social Assistance | 259 (24.8%) | 784 (75.2%) |
| Arts, Entertainment & Recreation | 108 (100.0%) | 0 (0.0%) |
| Accommodation & Food Services | 152 (22.2%) | 533 (77.8%) |
| Public Administration | 556 (52.3%) | 508 (47.7%) |
| Total | 5,577 (56.0%) | 4,387 (44.0%) |
Education in Manassas Park
School Enrollment in Manassas Park
The most common levels of schooling among the 4,371 students in Manassas Park are middle school (1,212 | 27.7%), college / undergraduate (987 | 22.6%), and high school (945 | 21.6%).
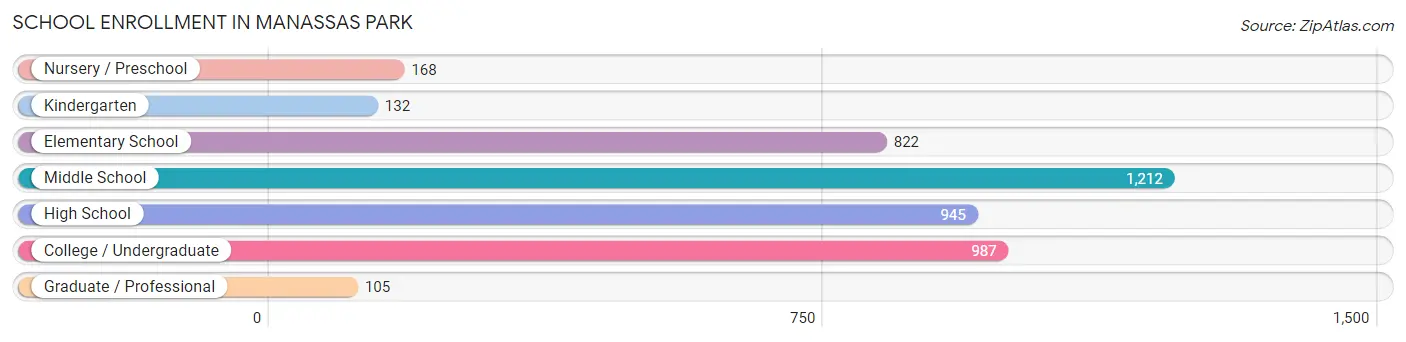
| School Level | # Students | % Students |
| Nursery / Preschool | 168 | 3.8% |
| Kindergarten | 132 | 3.0% |
| Elementary School | 822 | 18.8% |
| Middle School | 1,212 | 27.7% |
| High School | 945 | 21.6% |
| College / Undergraduate | 987 | 22.6% |
| Graduate / Professional | 105 | 2.4% |
| Total | 4,371 | 100.0% |
School Enrollment by Age by Funding Source in Manassas Park
Out of a total of 4,371 students who are enrolled in schools in Manassas Park, 577 (13.2%) attend a private institution, while the remaining 3,794 (86.8%) are enrolled in public schools. The age group of 3 to 4 year olds has the highest likelihood of being enrolled in private schools, with 153 (82.3% in the age bracket) enrolled. Conversely, the age group of 18 to 19 year olds has the lowest likelihood of being enrolled in a private school, with 310 (100.0% in the age bracket) attending a public institution.
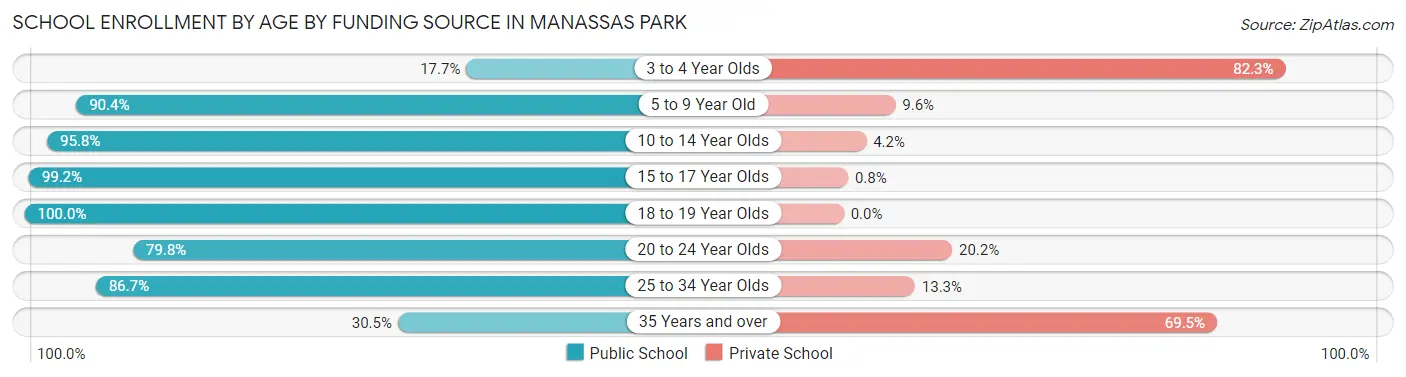
| Age Bracket | Public School | Private School |
| 3 to 4 Year Olds | 33 (17.7%) | 153 (82.3%) |
| 5 to 9 Year Old | 742 (90.4%) | 79 (9.6%) |
| 10 to 14 Year Olds | 1,322 (95.8%) | 58 (4.2%) |
| 15 to 17 Year Olds | 622 (99.2%) | 5 (0.8%) |
| 18 to 19 Year Olds | 310 (100.0%) | 0 (0.0%) |
| 20 to 24 Year Olds | 182 (79.8%) | 46 (20.2%) |
| 25 to 34 Year Olds | 517 (86.7%) | 79 (13.3%) |
| 35 Years and over | 68 (30.5%) | 155 (69.5%) |
| Total | 3,794 (86.8%) | 577 (13.2%) |
Educational Attainment by Field of Study in Manassas Park
Business (614 | 19.8%), engineering (418 | 13.5%), computers & mathematics (395 | 12.7%), social sciences (263 | 8.5%), and education (223 | 7.2%) are the most common fields of study among 3,104 individuals in Manassas Park who have obtained a bachelor's degree or higher.
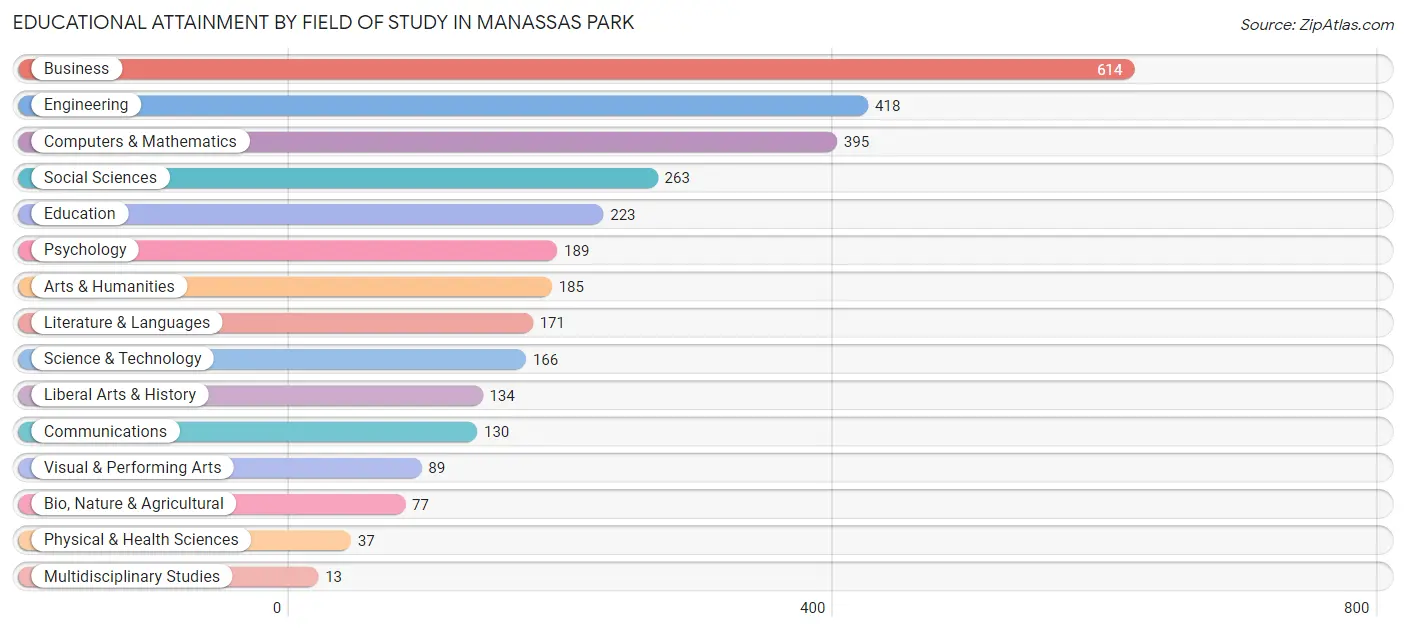
| Field of Study | # Graduates | % Graduates |
| Computers & Mathematics | 395 | 12.7% |
| Bio, Nature & Agricultural | 77 | 2.5% |
| Physical & Health Sciences | 37 | 1.2% |
| Psychology | 189 | 6.1% |
| Social Sciences | 263 | 8.5% |
| Engineering | 418 | 13.5% |
| Multidisciplinary Studies | 13 | 0.4% |
| Science & Technology | 166 | 5.3% |
| Business | 614 | 19.8% |
| Education | 223 | 7.2% |
| Literature & Languages | 171 | 5.5% |
| Liberal Arts & History | 134 | 4.3% |
| Visual & Performing Arts | 89 | 2.9% |
| Communications | 130 | 4.2% |
| Arts & Humanities | 185 | 6.0% |
| Total | 3,104 | 100.0% |
Transportation & Commute in Manassas Park
Vehicle Availability by Sex in Manassas Park
The most prevalent vehicle ownership categories in Manassas Park are males with 2 vehicles (2,188, accounting for 39.7%) and females with 2 vehicles (1,565, making up 51.5%).
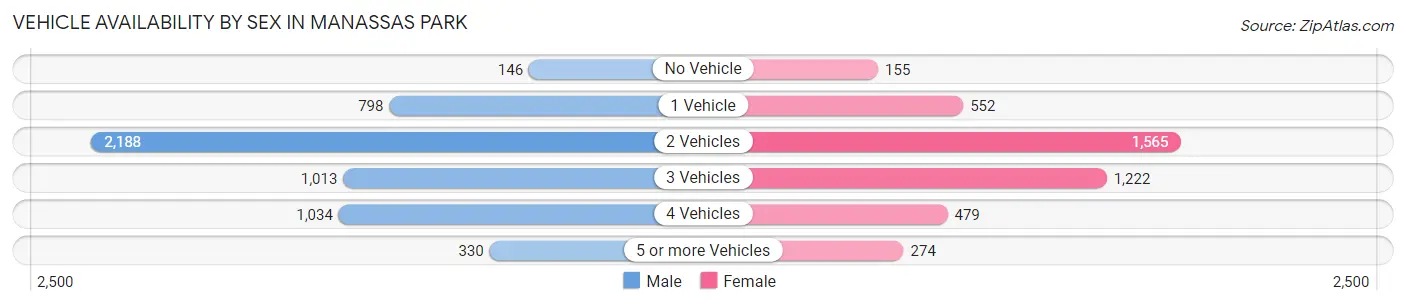
| Vehicles Available | Male | Female |
| No Vehicle | 146 (2.6%) | 155 (3.6%) |
| 1 Vehicle | 798 (14.5%) | 552 (13.0%) |
| 2 Vehicles | 2,188 (39.7%) | 1,565 (36.8%) |
| 3 Vehicles | 1,013 (18.4%) | 1,222 (28.8%) |
| 4 Vehicles | 1,034 (18.8%) | 479 (11.3%) |
| 5 or more Vehicles | 330 (6.0%) | 274 (6.5%) |
| Total | 5,509 (100.0%) | 4,247 (100.0%) |
Commute Time in Manassas Park
The most frequently occuring commute durations in Manassas Park are 60 to 89 minutes (1,518 commuters, 16.9%), 45 to 59 minutes (1,458 commuters, 16.2%), and 30 to 34 minutes (1,377 commuters, 15.3%).
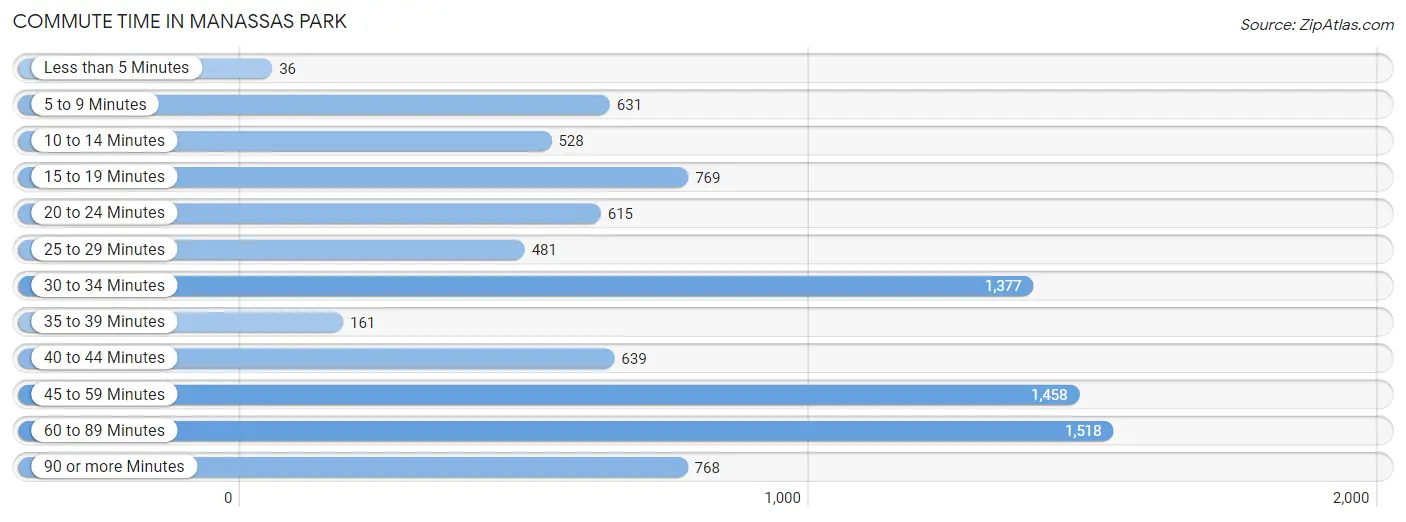
| Commute Time | # Commuters | % Commuters |
| Less than 5 Minutes | 36 | 0.4% |
| 5 to 9 Minutes | 631 | 7.0% |
| 10 to 14 Minutes | 528 | 5.9% |
| 15 to 19 Minutes | 769 | 8.6% |
| 20 to 24 Minutes | 615 | 6.9% |
| 25 to 29 Minutes | 481 | 5.4% |
| 30 to 34 Minutes | 1,377 | 15.3% |
| 35 to 39 Minutes | 161 | 1.8% |
| 40 to 44 Minutes | 639 | 7.1% |
| 45 to 59 Minutes | 1,458 | 16.2% |
| 60 to 89 Minutes | 1,518 | 16.9% |
| 90 or more Minutes | 768 | 8.6% |
Commute Time by Sex in Manassas Park
The most common commute times in Manassas Park are 60 to 89 minutes (998 commuters, 19.6%) for males and 30 to 34 minutes (615 commuters, 15.9%) for females.
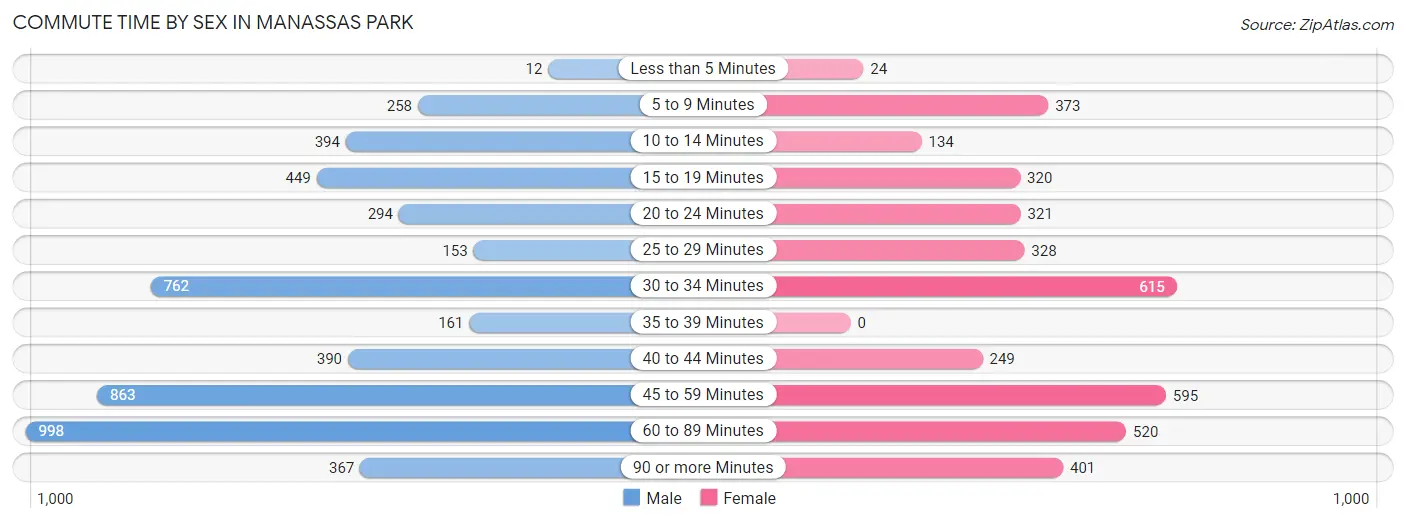
| Commute Time | Male | Female |
| Less than 5 Minutes | 12 (0.2%) | 24 (0.6%) |
| 5 to 9 Minutes | 258 (5.1%) | 373 (9.6%) |
| 10 to 14 Minutes | 394 (7.7%) | 134 (3.5%) |
| 15 to 19 Minutes | 449 (8.8%) | 320 (8.3%) |
| 20 to 24 Minutes | 294 (5.8%) | 321 (8.3%) |
| 25 to 29 Minutes | 153 (3.0%) | 328 (8.5%) |
| 30 to 34 Minutes | 762 (14.9%) | 615 (15.9%) |
| 35 to 39 Minutes | 161 (3.2%) | 0 (0.0%) |
| 40 to 44 Minutes | 390 (7.6%) | 249 (6.4%) |
| 45 to 59 Minutes | 863 (16.9%) | 595 (15.3%) |
| 60 to 89 Minutes | 998 (19.6%) | 520 (13.4%) |
| 90 or more Minutes | 367 (7.2%) | 401 (10.3%) |
Time of Departure to Work by Sex in Manassas Park
The most frequent times of departure to work in Manassas Park are 5:00 AM to 5:29 AM (708, 13.9%) for males and 7:30 AM to 7:59 AM (553, 14.2%) for females.
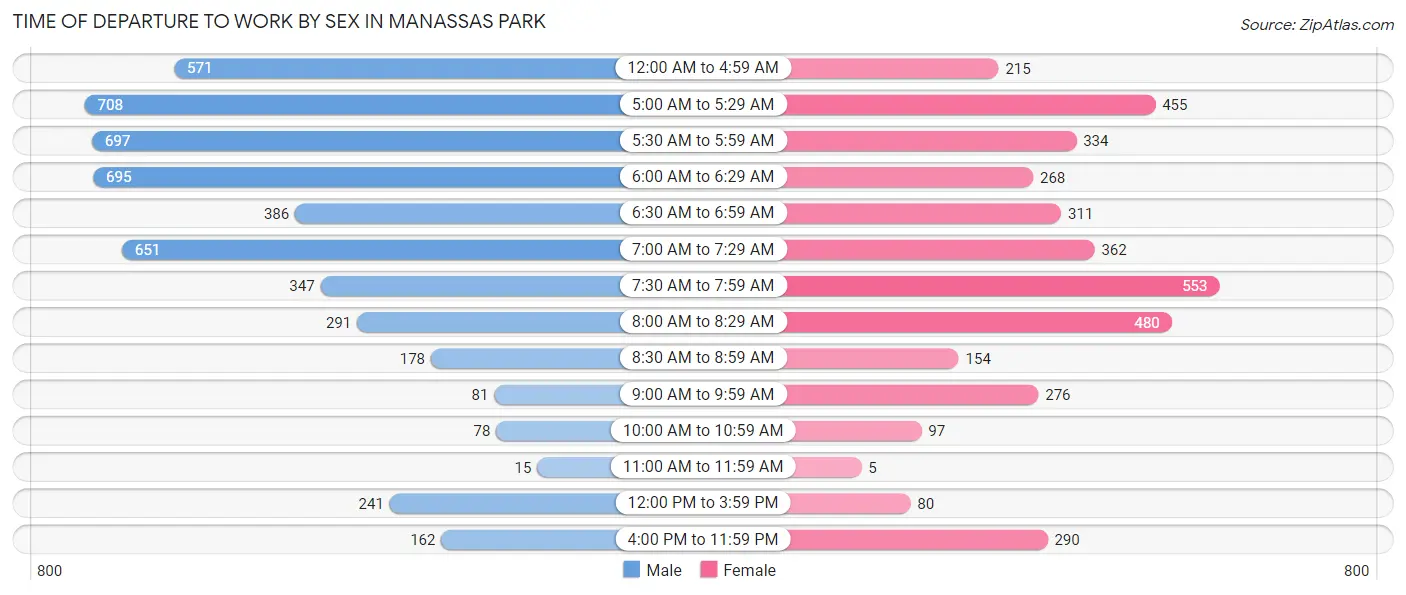
| Time of Departure | Male | Female |
| 12:00 AM to 4:59 AM | 571 (11.2%) | 215 (5.5%) |
| 5:00 AM to 5:29 AM | 708 (13.9%) | 455 (11.7%) |
| 5:30 AM to 5:59 AM | 697 (13.7%) | 334 (8.6%) |
| 6:00 AM to 6:29 AM | 695 (13.6%) | 268 (6.9%) |
| 6:30 AM to 6:59 AM | 386 (7.6%) | 311 (8.0%) |
| 7:00 AM to 7:29 AM | 651 (12.8%) | 362 (9.3%) |
| 7:30 AM to 7:59 AM | 347 (6.8%) | 553 (14.2%) |
| 8:00 AM to 8:29 AM | 291 (5.7%) | 480 (12.4%) |
| 8:30 AM to 8:59 AM | 178 (3.5%) | 154 (4.0%) |
| 9:00 AM to 9:59 AM | 81 (1.6%) | 276 (7.1%) |
| 10:00 AM to 10:59 AM | 78 (1.5%) | 97 (2.5%) |
| 11:00 AM to 11:59 AM | 15 (0.3%) | 5 (0.1%) |
| 12:00 PM to 3:59 PM | 241 (4.7%) | 80 (2.1%) |
| 4:00 PM to 11:59 PM | 162 (3.2%) | 290 (7.5%) |
| Total | 5,101 (100.0%) | 3,880 (100.0%) |
Housing Occupancy in Manassas Park
Occupancy by Ownership in Manassas Park
Of the total 5,221 dwellings in Manassas Park, owner-occupied units account for 3,311 (63.4%), while renter-occupied units make up 1,910 (36.6%).
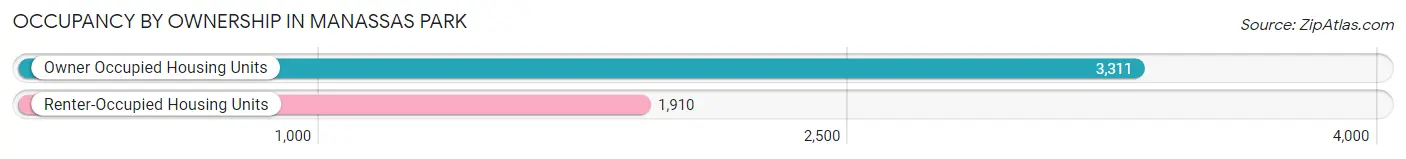
| Occupancy | # Housing Units | % Housing Units |
| Owner Occupied Housing Units | 3,311 | 63.4% |
| Renter-Occupied Housing Units | 1,910 | 36.6% |
| Total Occupied Housing Units | 5,221 | 100.0% |
Occupancy by Household Size in Manassas Park
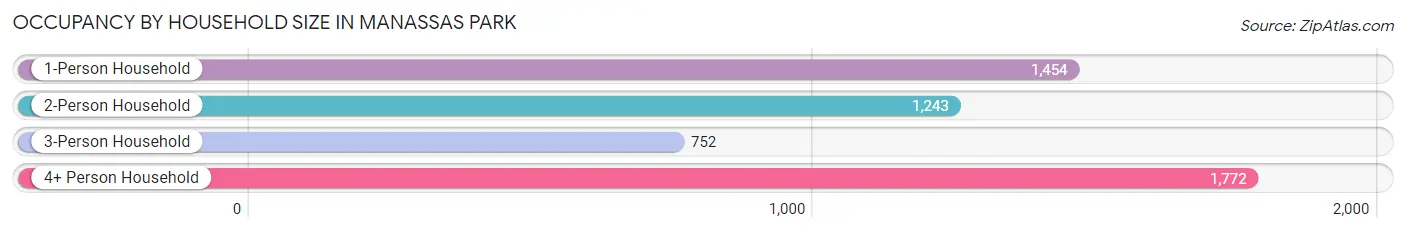
| Household Size | # Housing Units | % Housing Units |
| 1-Person Household | 1,454 | 27.9% |
| 2-Person Household | 1,243 | 23.8% |
| 3-Person Household | 752 | 14.4% |
| 4+ Person Household | 1,772 | 33.9% |
| Total Housing Units | 5,221 | 100.0% |
Occupancy by Ownership by Household Size in Manassas Park
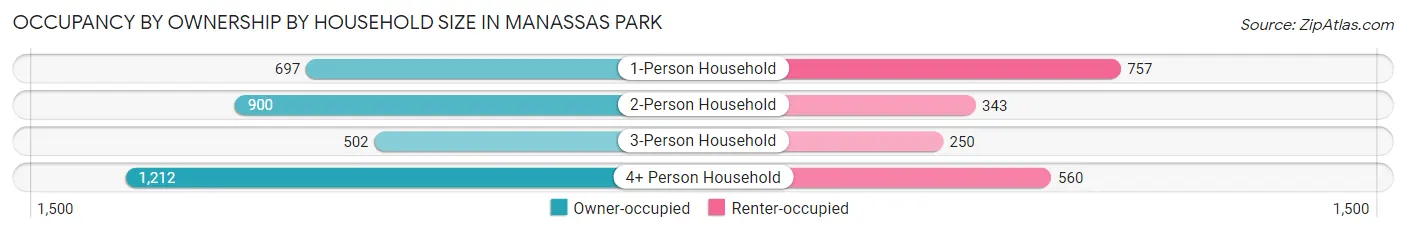
| Household Size | Owner-occupied | Renter-occupied |
| 1-Person Household | 697 (47.9%) | 757 (52.1%) |
| 2-Person Household | 900 (72.4%) | 343 (27.6%) |
| 3-Person Household | 502 (66.8%) | 250 (33.2%) |
| 4+ Person Household | 1,212 (68.4%) | 560 (31.6%) |
| Total Housing Units | 3,311 (63.4%) | 1,910 (36.6%) |
Occupancy by Educational Attainment in Manassas Park
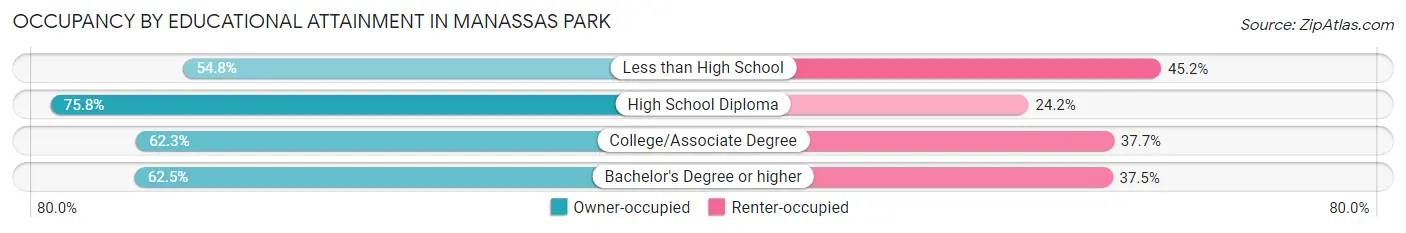
| Household Size | Owner-occupied | Renter-occupied |
| Less than High School | 559 (54.8%) | 461 (45.2%) |
| High School Diploma | 737 (75.8%) | 235 (24.2%) |
| College/Associate Degree | 925 (62.3%) | 560 (37.7%) |
| Bachelor's Degree or higher | 1,090 (62.5%) | 654 (37.5%) |
Occupancy by Age of Householder in Manassas Park
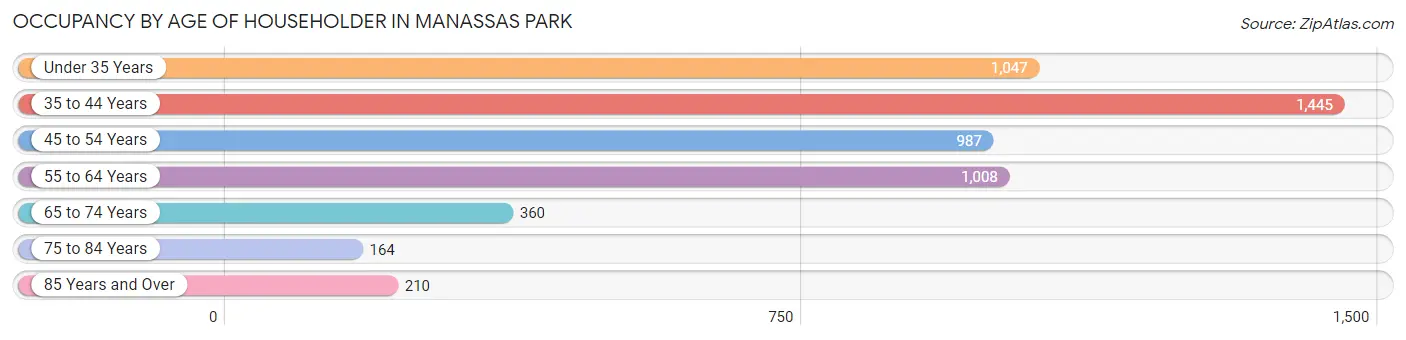
| Age Bracket | # Households | % Households |
| Under 35 Years | 1,047 | 20.1% |
| 35 to 44 Years | 1,445 | 27.7% |
| 45 to 54 Years | 987 | 18.9% |
| 55 to 64 Years | 1,008 | 19.3% |
| 65 to 74 Years | 360 | 6.9% |
| 75 to 84 Years | 164 | 3.1% |
| 85 Years and Over | 210 | 4.0% |
| Total | 5,221 | 100.0% |
Housing Finances in Manassas Park
Median Income by Occupancy in Manassas Park
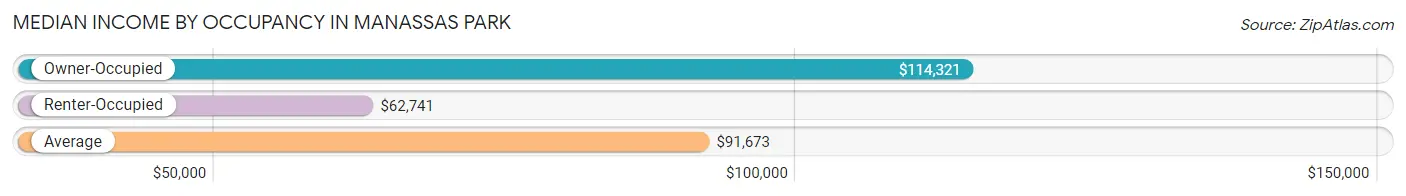
| Occupancy Type | # Households | Median Income |
| Owner-Occupied | 3,311 (63.4%) | $114,321 |
| Renter-Occupied | 1,910 (36.6%) | $62,741 |
| Average | 5,221 (100.0%) | $91,673 |
Occupancy by Householder Income Bracket in Manassas Park
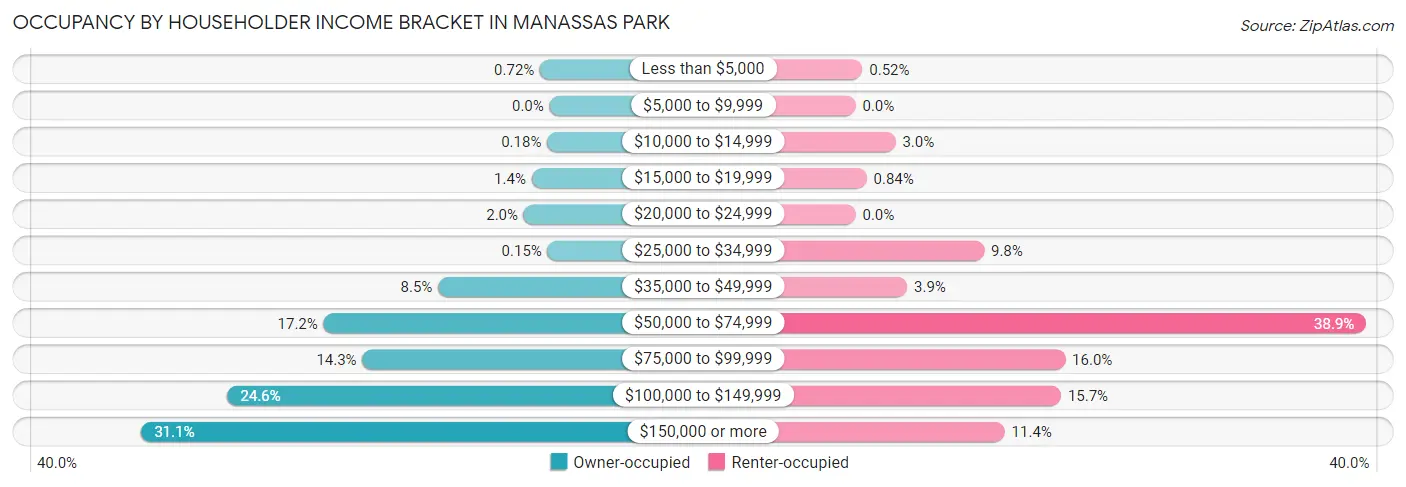
| Income Bracket | Owner-occupied | Renter-occupied |
| Less than $5,000 | 24 (0.7%) | 10 (0.5%) |
| $5,000 to $9,999 | 0 (0.0%) | 0 (0.0%) |
| $10,000 to $14,999 | 6 (0.2%) | 58 (3.0%) |
| $15,000 to $19,999 | 45 (1.4%) | 16 (0.8%) |
| $20,000 to $24,999 | 65 (2.0%) | 0 (0.0%) |
| $25,000 to $34,999 | 5 (0.2%) | 187 (9.8%) |
| $35,000 to $49,999 | 281 (8.5%) | 75 (3.9%) |
| $50,000 to $74,999 | 570 (17.2%) | 743 (38.9%) |
| $75,000 to $99,999 | 472 (14.3%) | 305 (16.0%) |
| $100,000 to $149,999 | 813 (24.5%) | 299 (15.7%) |
| $150,000 or more | 1,030 (31.1%) | 217 (11.4%) |
| Total | 3,311 (100.0%) | 1,910 (100.0%) |
Monthly Housing Cost Tiers in Manassas Park
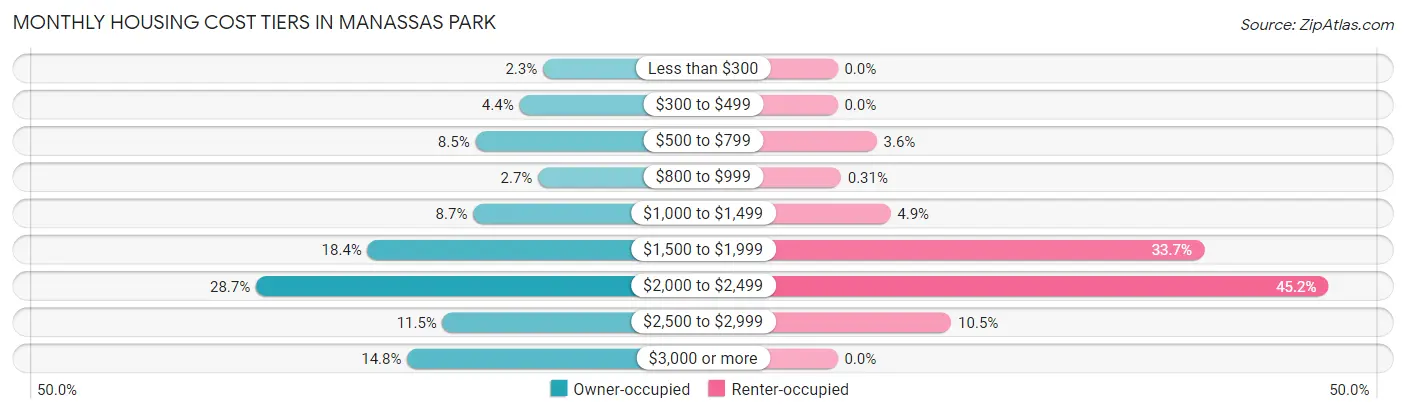
| Monthly Cost | Owner-occupied | Renter-occupied |
| Less than $300 | 75 (2.3%) | 0 (0.0%) |
| $300 to $499 | 147 (4.4%) | 0 (0.0%) |
| $500 to $799 | 281 (8.5%) | 69 (3.6%) |
| $800 to $999 | 90 (2.7%) | 6 (0.3%) |
| $1,000 to $1,499 | 288 (8.7%) | 93 (4.9%) |
| $1,500 to $1,999 | 610 (18.4%) | 644 (33.7%) |
| $2,000 to $2,499 | 950 (28.7%) | 863 (45.2%) |
| $2,500 to $2,999 | 381 (11.5%) | 200 (10.5%) |
| $3,000 or more | 489 (14.8%) | 0 (0.0%) |
| Total | 3,311 (100.0%) | 1,910 (100.0%) |
Physical Housing Characteristics in Manassas Park
Housing Structures in Manassas Park
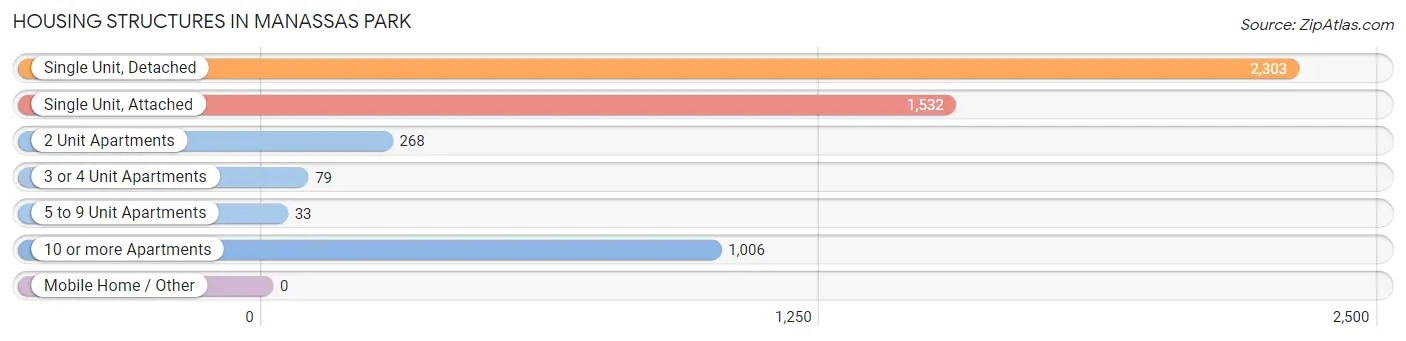
| Structure Type | # Housing Units | % Housing Units |
| Single Unit, Detached | 2,303 | 44.1% |
| Single Unit, Attached | 1,532 | 29.3% |
| 2 Unit Apartments | 268 | 5.1% |
| 3 or 4 Unit Apartments | 79 | 1.5% |
| 5 to 9 Unit Apartments | 33 | 0.6% |
| 10 or more Apartments | 1,006 | 19.3% |
| Mobile Home / Other | 0 | 0.0% |
| Total | 5,221 | 100.0% |
Housing Structures by Occupancy in Manassas Park
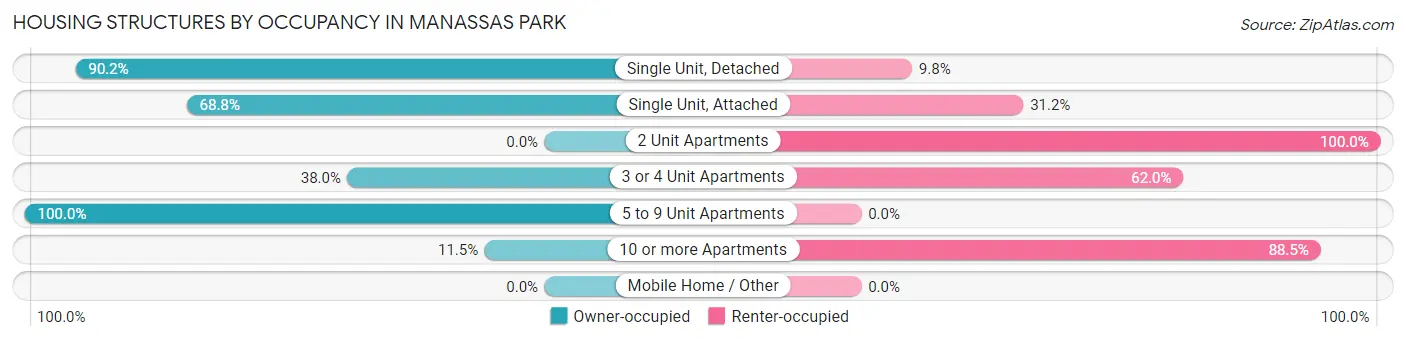
| Structure Type | Owner-occupied | Renter-occupied |
| Single Unit, Detached | 2,078 (90.2%) | 225 (9.8%) |
| Single Unit, Attached | 1,054 (68.8%) | 478 (31.2%) |
| 2 Unit Apartments | 0 (0.0%) | 268 (100.0%) |
| 3 or 4 Unit Apartments | 30 (38.0%) | 49 (62.0%) |
| 5 to 9 Unit Apartments | 33 (100.0%) | 0 (0.0%) |
| 10 or more Apartments | 116 (11.5%) | 890 (88.5%) |
| Mobile Home / Other | 0 (0.0%) | 0 (0.0%) |
| Total | 3,311 (63.4%) | 1,910 (36.6%) |
Housing Structures by Number of Rooms in Manassas Park
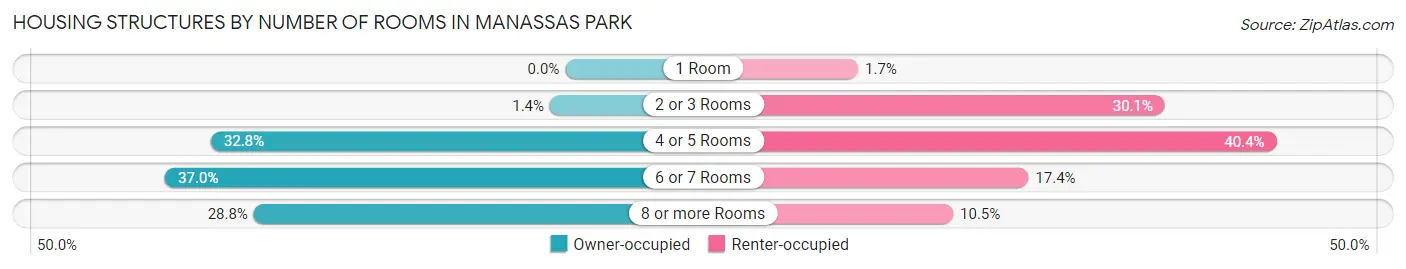
| Number of Rooms | Owner-occupied | Renter-occupied |
| 1 Room | 0 (0.0%) | 32 (1.7%) |
| 2 or 3 Rooms | 47 (1.4%) | 574 (30.0%) |
| 4 or 5 Rooms | 1,085 (32.8%) | 771 (40.4%) |
| 6 or 7 Rooms | 1,225 (37.0%) | 333 (17.4%) |
| 8 or more Rooms | 954 (28.8%) | 200 (10.5%) |
| Total | 3,311 (100.0%) | 1,910 (100.0%) |
Housing Structure by Heating Type in Manassas Park
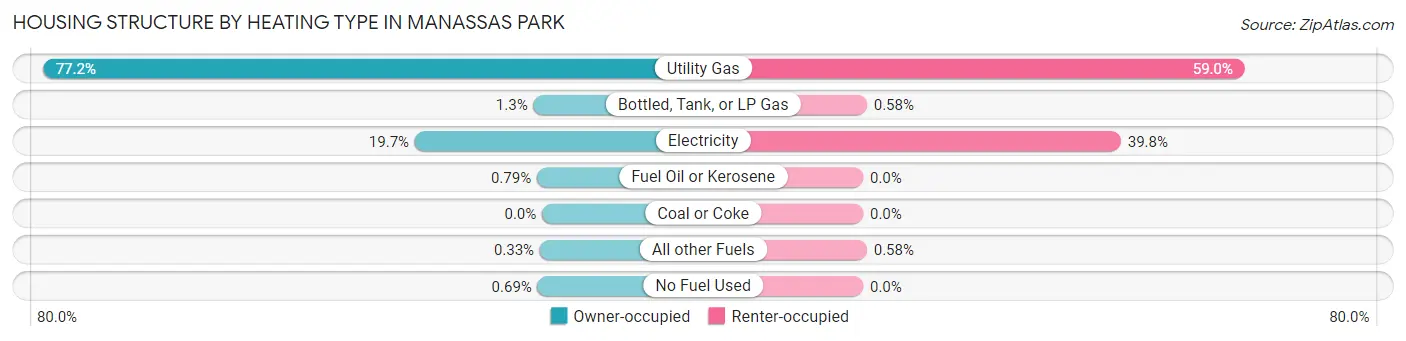
| Heating Type | Owner-occupied | Renter-occupied |
| Utility Gas | 2,556 (77.2%) | 1,127 (59.0%) |
| Bottled, Tank, or LP Gas | 44 (1.3%) | 11 (0.6%) |
| Electricity | 651 (19.7%) | 761 (39.8%) |
| Fuel Oil or Kerosene | 26 (0.8%) | 0 (0.0%) |
| Coal or Coke | 0 (0.0%) | 0 (0.0%) |
| All other Fuels | 11 (0.3%) | 11 (0.6%) |
| No Fuel Used | 23 (0.7%) | 0 (0.0%) |
| Total | 3,311 (100.0%) | 1,910 (100.0%) |
Household Vehicle Usage in Manassas Park
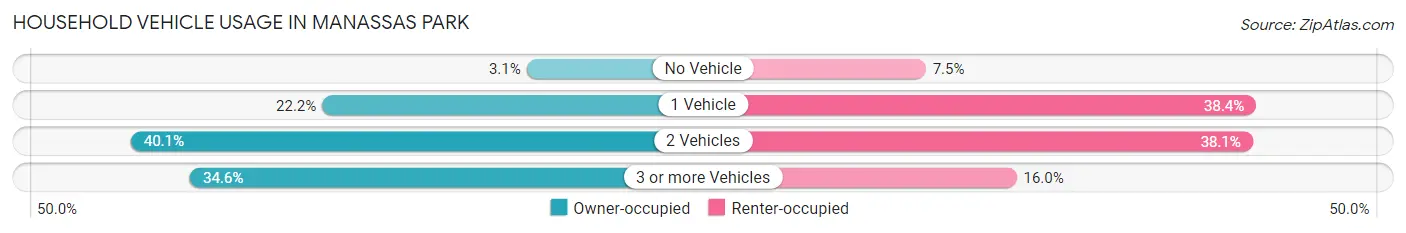
| Vehicles per Household | Owner-occupied | Renter-occupied |
| No Vehicle | 104 (3.1%) | 144 (7.5%) |
| 1 Vehicle | 736 (22.2%) | 733 (38.4%) |
| 2 Vehicles | 1,327 (40.1%) | 727 (38.1%) |
| 3 or more Vehicles | 1,144 (34.5%) | 306 (16.0%) |
| Total | 3,311 (100.0%) | 1,910 (100.0%) |
Real Estate & Mortgages in Manassas Park
Real Estate and Mortgage Overview in Manassas Park
| Characteristic | Without Mortgage | With Mortgage |
| Housing Units | 580 | 2,731 |
| Median Property Value | $317,600 | $379,700 |
| Median Household Income | $79,632 | $929 |
| Monthly Housing Costs | $704 | $489 |
| Real Estate Taxes | $2,888 | $83 |
Property Value by Mortgage Status in Manassas Park
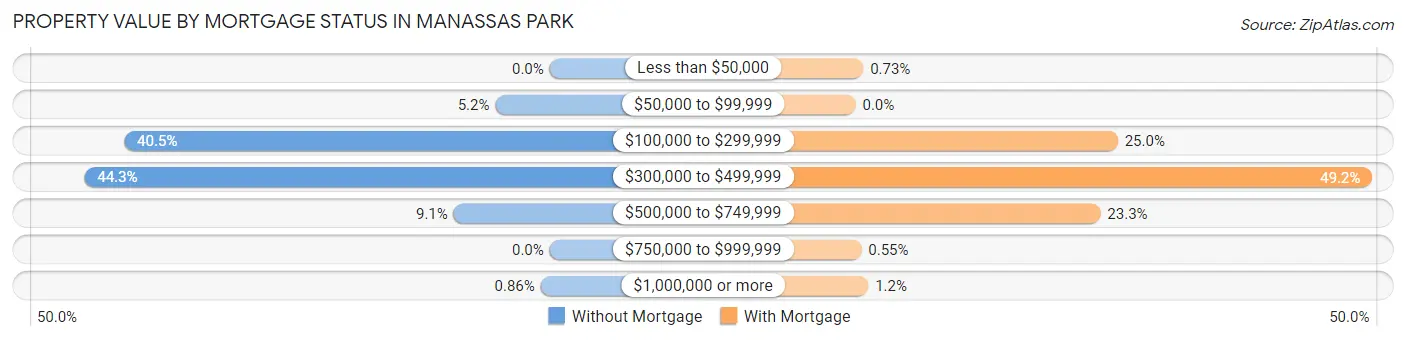
| Property Value | Without Mortgage | With Mortgage |
| Less than $50,000 | 0 (0.0%) | 20 (0.7%) |
| $50,000 to $99,999 | 30 (5.2%) | 0 (0.0%) |
| $100,000 to $299,999 | 235 (40.5%) | 682 (25.0%) |
| $300,000 to $499,999 | 257 (44.3%) | 1,344 (49.2%) |
| $500,000 to $749,999 | 53 (9.1%) | 637 (23.3%) |
| $750,000 to $999,999 | 0 (0.0%) | 15 (0.5%) |
| $1,000,000 or more | 5 (0.9%) | 33 (1.2%) |
| Total | 580 (100.0%) | 2,731 (100.0%) |
Household Income by Mortgage Status in Manassas Park
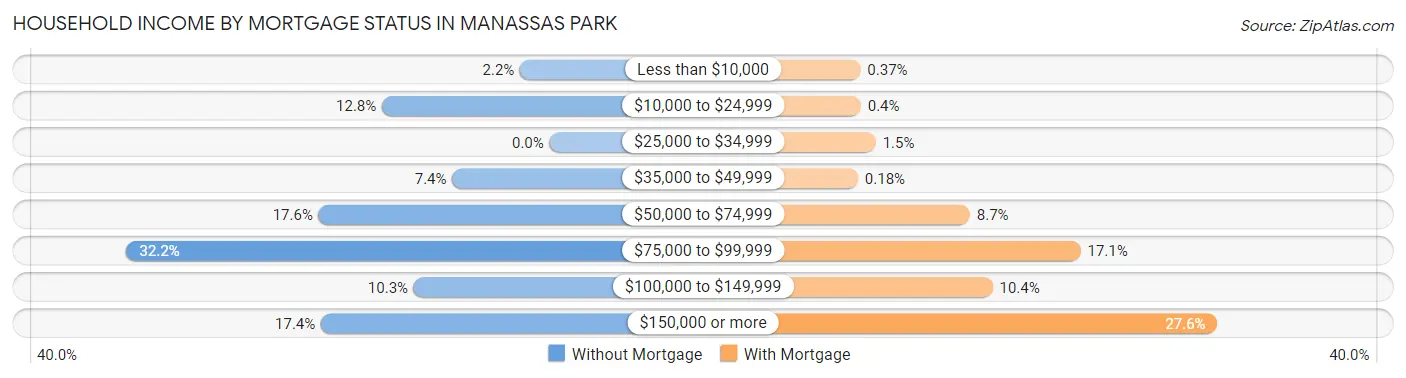
| Household Income | Without Mortgage | With Mortgage |
| Less than $10,000 | 13 (2.2%) | 10 (0.4%) |
| $10,000 to $24,999 | 74 (12.8%) | 11 (0.4%) |
| $25,000 to $34,999 | 0 (0.0%) | 42 (1.5%) |
| $35,000 to $49,999 | 43 (7.4%) | 5 (0.2%) |
| $50,000 to $74,999 | 102 (17.6%) | 238 (8.7%) |
| $75,000 to $99,999 | 187 (32.2%) | 468 (17.1%) |
| $100,000 to $149,999 | 60 (10.3%) | 285 (10.4%) |
| $150,000 or more | 101 (17.4%) | 753 (27.6%) |
| Total | 580 (100.0%) | 2,731 (100.0%) |
Property Value to Household Income Ratio in Manassas Park
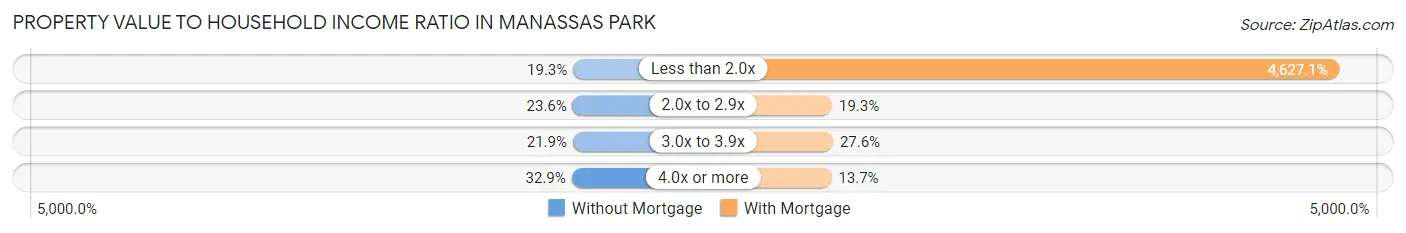
| Value-to-Income Ratio | Without Mortgage | With Mortgage |
| Less than 2.0x | 112 (19.3%) | 126,367 (4,627.1%) |
| 2.0x to 2.9x | 137 (23.6%) | 526 (19.3%) |
| 3.0x to 3.9x | 127 (21.9%) | 753 (27.6%) |
| 4.0x or more | 191 (32.9%) | 373 (13.7%) |
| Total | 580 (100.0%) | 2,731 (100.0%) |
Real Estate Taxes by Mortgage Status in Manassas Park
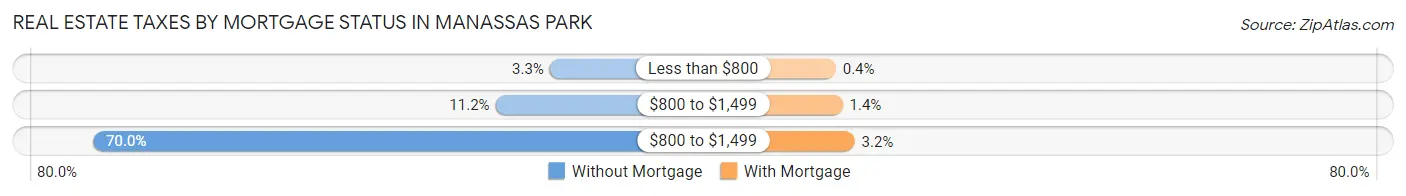
| Property Taxes | Without Mortgage | With Mortgage |
| Less than $800 | 19 (3.3%) | 11 (0.4%) |
| $800 to $1,499 | 65 (11.2%) | 38 (1.4%) |
| $800 to $1,499 | 406 (70.0%) | 86 (3.2%) |
| Total | 580 (100.0%) | 2,731 (100.0%) |
Health & Disability in Manassas Park
Health Insurance Coverage by Age in Manassas Park
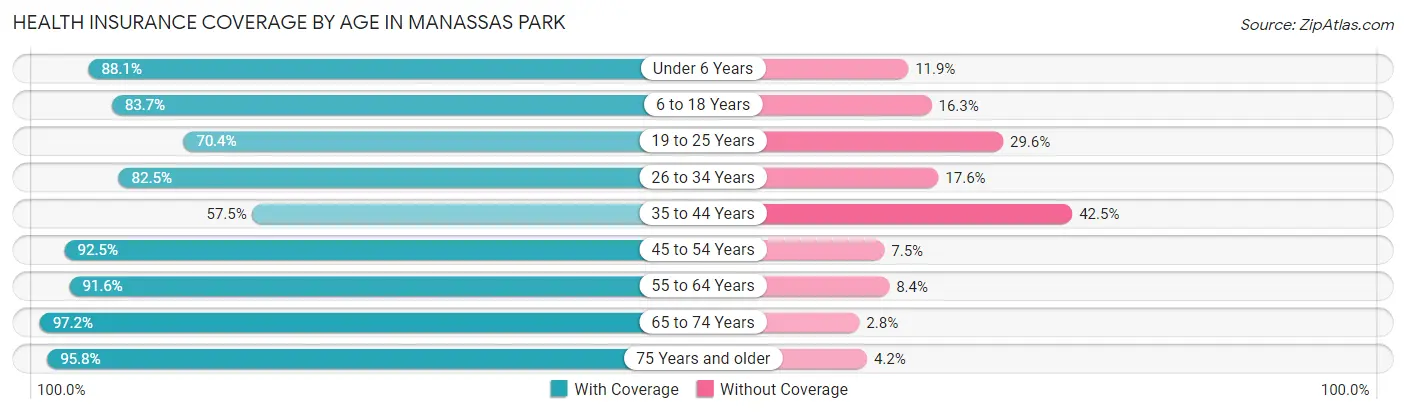
| Age Bracket | With Coverage | Without Coverage |
| Under 6 Years | 1,160 (88.1%) | 157 (11.9%) |
| 6 to 18 Years | 2,598 (83.7%) | 505 (16.3%) |
| 19 to 25 Years | 1,189 (70.4%) | 500 (29.6%) |
| 26 to 34 Years | 1,827 (82.5%) | 389 (17.5%) |
| 35 to 44 Years | 1,849 (57.5%) | 1,367 (42.5%) |
| 45 to 54 Years | 2,031 (92.5%) | 164 (7.5%) |
| 55 to 64 Years | 1,565 (91.6%) | 143 (8.4%) |
| 65 to 74 Years | 1,034 (97.2%) | 30 (2.8%) |
| 75 Years and older | 589 (95.8%) | 26 (4.2%) |
| Total | 13,842 (80.8%) | 3,281 (19.2%) |
Health Insurance Coverage by Citizenship Status in Manassas Park
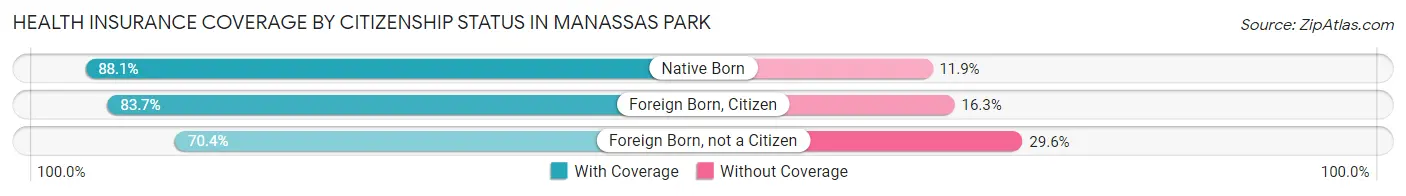
| Citizenship Status | With Coverage | Without Coverage |
| Native Born | 1,160 (88.1%) | 157 (11.9%) |
| Foreign Born, Citizen | 2,598 (83.7%) | 505 (16.3%) |
| Foreign Born, not a Citizen | 1,189 (70.4%) | 500 (29.6%) |
Health Insurance Coverage by Household Income in Manassas Park
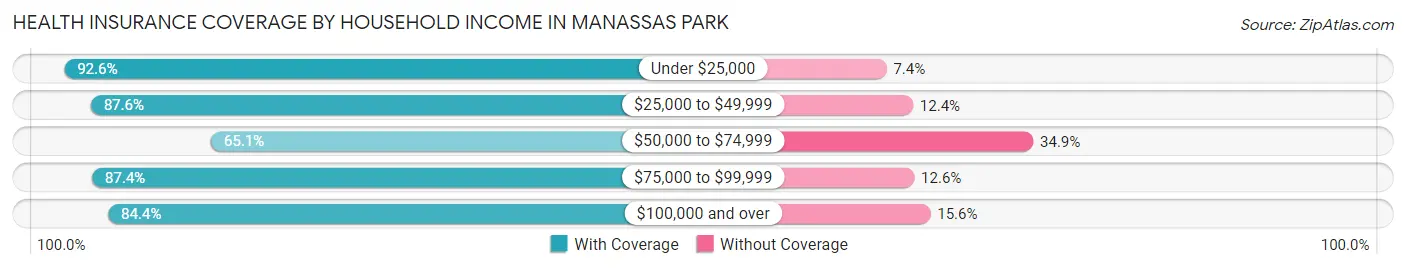
| Household Income | With Coverage | Without Coverage |
| Under $25,000 | 349 (92.6%) | 28 (7.4%) |
| $25,000 to $49,999 | 1,534 (87.6%) | 217 (12.4%) |
| $50,000 to $74,999 | 2,633 (65.1%) | 1,412 (34.9%) |
| $75,000 to $99,999 | 2,549 (87.4%) | 368 (12.6%) |
| $100,000 and over | 6,777 (84.4%) | 1,256 (15.6%) |
Public vs Private Health Insurance Coverage by Age in Manassas Park
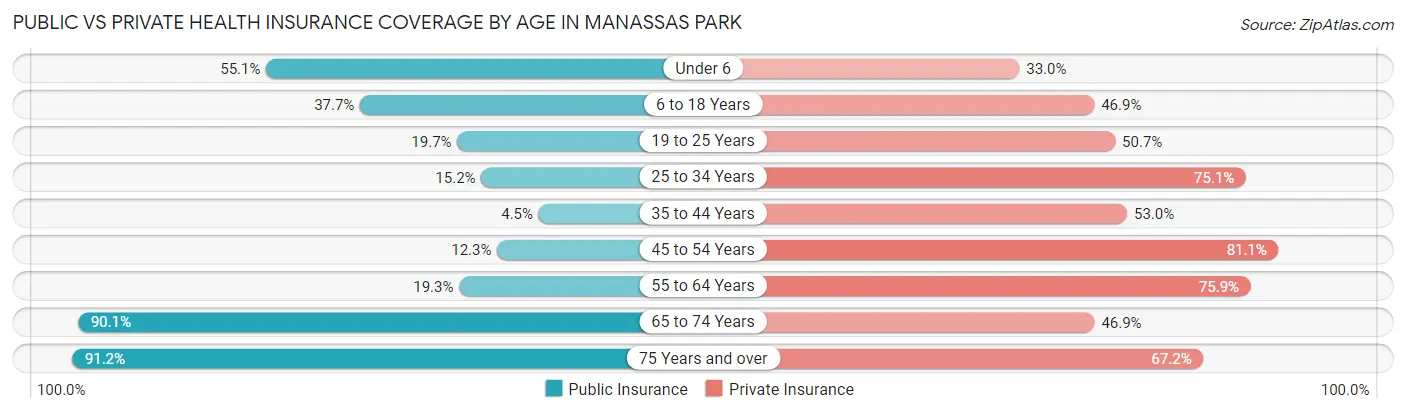
| Age Bracket | Public Insurance | Private Insurance |
| Under 6 | 726 (55.1%) | 434 (33.0%) |
| 6 to 18 Years | 1,170 (37.7%) | 1,454 (46.9%) |
| 19 to 25 Years | 332 (19.7%) | 857 (50.7%) |
| 25 to 34 Years | 337 (15.2%) | 1,663 (75.0%) |
| 35 to 44 Years | 146 (4.5%) | 1,703 (52.9%) |
| 45 to 54 Years | 269 (12.3%) | 1,780 (81.1%) |
| 55 to 64 Years | 330 (19.3%) | 1,297 (75.9%) |
| 65 to 74 Years | 959 (90.1%) | 499 (46.9%) |
| 75 Years and over | 561 (91.2%) | 413 (67.1%) |
| Total | 4,830 (28.2%) | 10,100 (59.0%) |
Disability Status by Sex by Age in Manassas Park
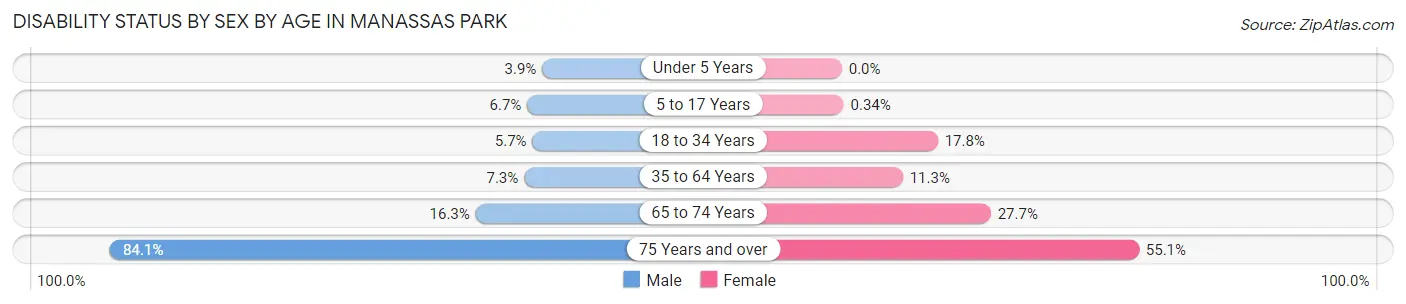
| Age Bracket | Male | Female |
| Under 5 Years | 21 (3.9%) | 0 (0.0%) |
| 5 to 17 Years | 100 (6.7%) | 5 (0.3%) |
| 18 to 34 Years | 106 (5.7%) | 413 (17.8%) |
| 35 to 64 Years | 291 (7.3%) | 353 (11.3%) |
| 65 to 74 Years | 72 (16.3%) | 172 (27.7%) |
| 75 Years and over | 313 (84.1%) | 134 (55.1%) |
Disability Class by Sex by Age in Manassas Park
Disability Class: Hearing Difficulty
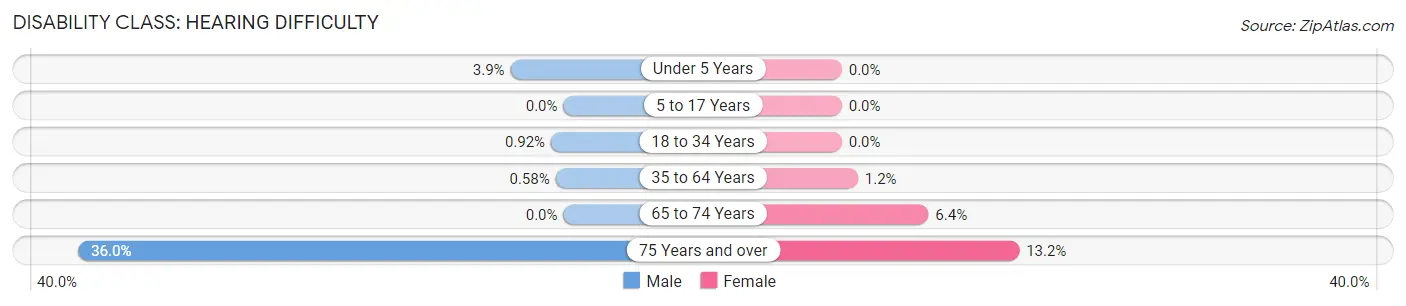
| Age Bracket | Male | Female |
| Under 5 Years | 21 (3.9%) | 0 (0.0%) |
| 5 to 17 Years | 0 (0.0%) | 0 (0.0%) |
| 18 to 34 Years | 17 (0.9%) | 0 (0.0%) |
| 35 to 64 Years | 23 (0.6%) | 37 (1.2%) |
| 65 to 74 Years | 0 (0.0%) | 40 (6.4%) |
| 75 Years and over | 134 (36.0%) | 32 (13.2%) |
Disability Class: Vision Difficulty
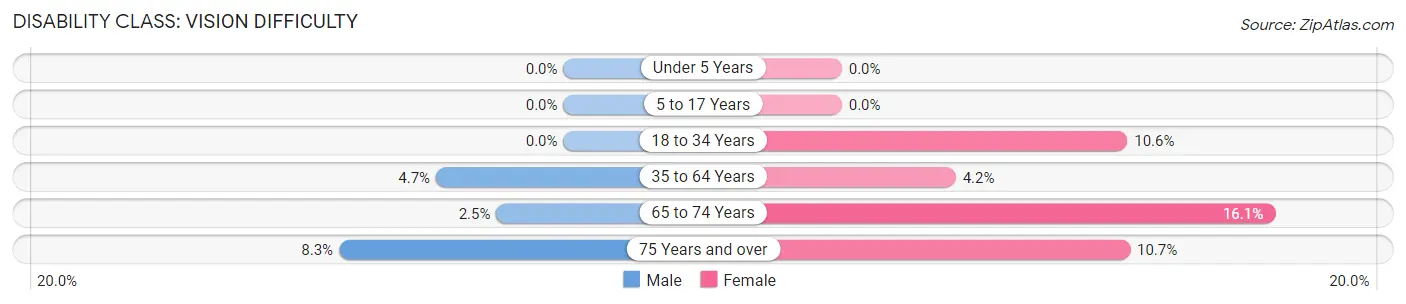
| Age Bracket | Male | Female |
| Under 5 Years | 0 (0.0%) | 0 (0.0%) |
| 5 to 17 Years | 0 (0.0%) | 0 (0.0%) |
| 18 to 34 Years | 0 (0.0%) | 246 (10.6%) |
| 35 to 64 Years | 189 (4.7%) | 132 (4.2%) |
| 65 to 74 Years | 11 (2.5%) | 100 (16.1%) |
| 75 Years and over | 31 (8.3%) | 26 (10.7%) |
Disability Class: Cognitive Difficulty
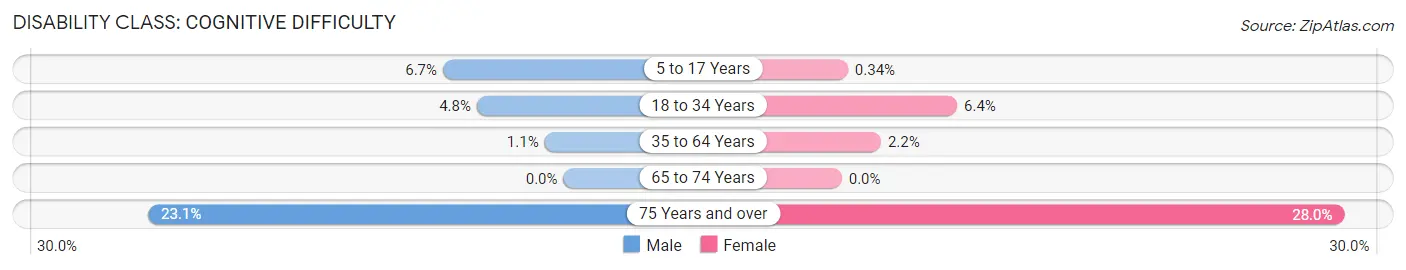
| Age Bracket | Male | Female |
| 5 to 17 Years | 100 (6.7%) | 5 (0.3%) |
| 18 to 34 Years | 89 (4.8%) | 149 (6.4%) |
| 35 to 64 Years | 42 (1.1%) | 68 (2.2%) |
| 65 to 74 Years | 0 (0.0%) | 0 (0.0%) |
| 75 Years and over | 86 (23.1%) | 68 (28.0%) |
Disability Class: Ambulatory Difficulty
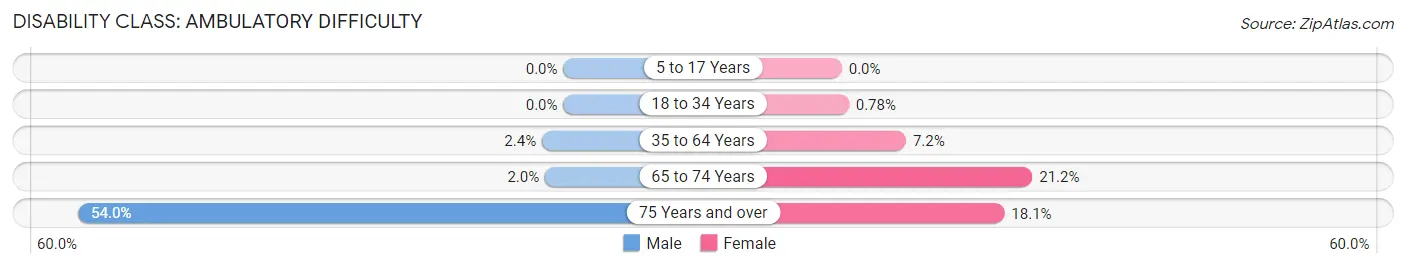
| Age Bracket | Male | Female |
| 5 to 17 Years | 0 (0.0%) | 0 (0.0%) |
| 18 to 34 Years | 0 (0.0%) | 18 (0.8%) |
| 35 to 64 Years | 95 (2.4%) | 223 (7.1%) |
| 65 to 74 Years | 9 (2.0%) | 132 (21.2%) |
| 75 Years and over | 201 (54.0%) | 44 (18.1%) |
Disability Class: Self-Care Difficulty
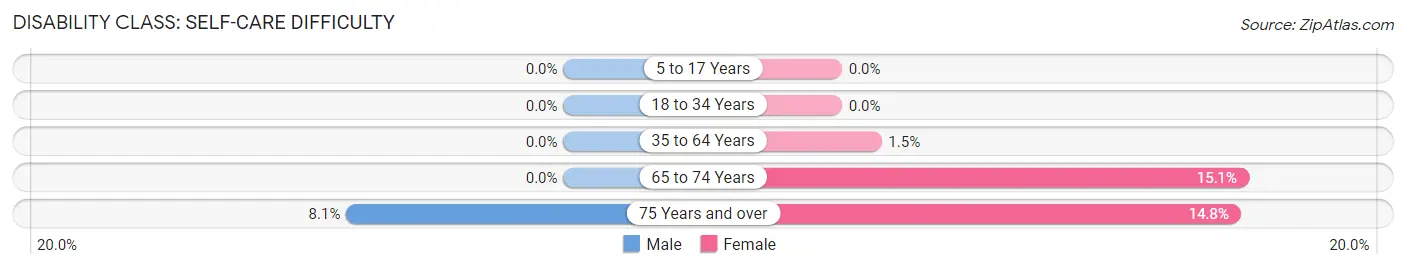
| Age Bracket | Male | Female |
| 5 to 17 Years | 0 (0.0%) | 0 (0.0%) |
| 18 to 34 Years | 0 (0.0%) | 0 (0.0%) |
| 35 to 64 Years | 0 (0.0%) | 46 (1.5%) |
| 65 to 74 Years | 0 (0.0%) | 94 (15.1%) |
| 75 Years and over | 30 (8.1%) | 36 (14.8%) |
Technology Access in Manassas Park
Computing Device Access in Manassas Park
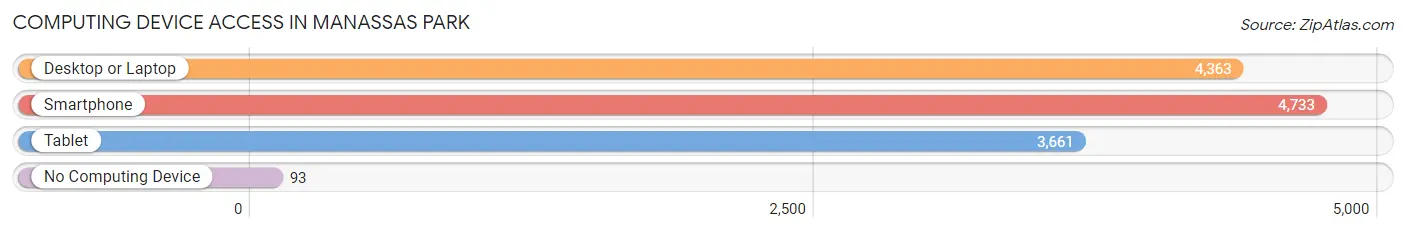
| Device Type | # Households | % Households |
| Desktop or Laptop | 4,363 | 83.6% |
| Smartphone | 4,733 | 90.6% |
| Tablet | 3,661 | 70.1% |
| No Computing Device | 93 | 1.8% |
| Total | 5,221 | 100.0% |
Internet Access in Manassas Park
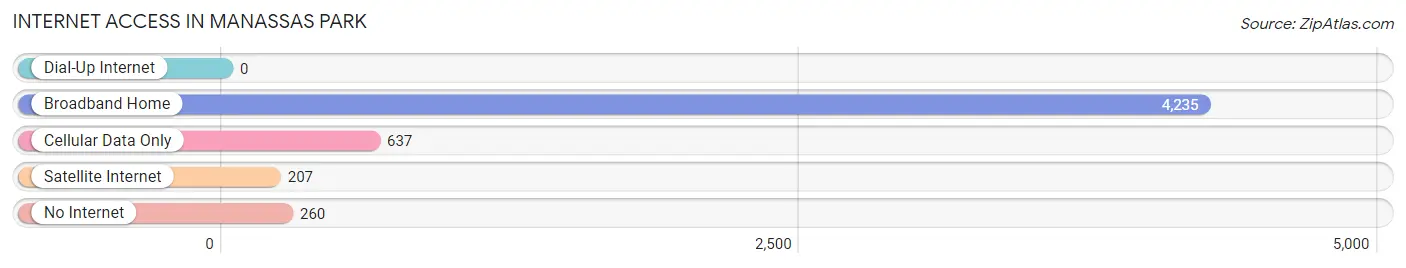
| Internet Type | # Households | % Households |
| Dial-Up Internet | 0 | 0.0% |
| Broadband Home | 4,235 | 81.1% |
| Cellular Data Only | 637 | 12.2% |
| Satellite Internet | 207 | 4.0% |
| No Internet | 260 | 5.0% |
| Total | 5,221 | 100.0% |
Manassas Park Summary
Manassas Park, Virginia is a city located in Prince William County, Virginia, United States. The city is situated approximately 25 miles southwest of Washington, D.C. and is part of the Washington metropolitan area. As of the 2010 census, the population of Manassas Park was 14,273.
History
The area that is now Manassas Park was first settled in the early 1700s by the Manassas family. The family owned a large plantation and the area was known as Manassas Plains. In 1852, the Orange and Alexandria Railroad was built through the area, connecting Manassas to Washington, D.C. and other cities in the region. This led to the development of the area and the establishment of the town of Manassas Park in 1873.
In the late 19th century, Manassas Park became a popular summer resort for Washington, D.C. residents. The town was incorporated in 1975 and has since grown to become a thriving city.
Geography
Manassas Park is located at 38°46'N 77°27'W (38.77, -77.45). According to the United States Census Bureau, the city has a total area of 2.7 square miles, all of which is land.
The city is located in the Piedmont region of Virginia and is situated at the northern end of the Manassas Gap Railroad. The city is bordered by the city of Manassas to the north, Prince William County to the east, and the city of Manassas Park to the south and west.
Economy
Manassas Park is home to a variety of businesses and industries. The city is home to several large employers, including the Manassas Park City Schools, the Manassas Park Community Center, and the Manassas Park Shopping Center. The city is also home to several small businesses, including restaurants, retail stores, and professional services.
The city is served by the Manassas Regional Airport, which provides air service to the Washington, D.C. metropolitan area. The airport is also home to several corporate and private aircraft.
Demographics
As of the 2010 census, there were 14,273 people, 5,717 households, and 3,845 families residing in the city. The population density was 5,269.3 people per square mile. The racial makeup of the city was 68.2% White, 17.3% African American, 0.5% Native American, 5.2% Asian, 0.1% Pacific Islander, 5.2% from other races, and 3.5% from two or more races. Hispanic or Latino of any race were 11.7% of the population.
The median income for a household in the city was $63,945, and the median income for a family was $76,945. The per capita income for the city was $30,945. About 5.2% of families and 7.2% of the population were below the poverty line, including 8.2% of those under age 18 and 5.2% of those age 65 or over.
Manassas Park is served by the Manassas Park City Schools, which includes four elementary schools, one middle school, and one high school. The city is also home to several private schools, including the Manassas Park Christian Academy and the Manassas Park Montessori School.
Common Questions
What is Per Capita Income in Manassas Park?
Per Capita income in Manassas Park is $41,595.
What is the Median Family Income in Manassas Park?
Median Family Income in Manassas Park is $97,174.
What is the Median Household income in Manassas Park?
Median Household Income in Manassas Park is $91,673.
What is Income or Wage Gap in Manassas Park?
Income or Wage Gap in Manassas Park is 33.5%.
Women in Manassas Park earn 66.5 cents for every dollar earned by a man.
What is Inequality or Gini Index in Manassas Park?
Inequality or Gini Index in Manassas Park is 0.38.
What is the Total Population of Manassas Park?
Total Population of Manassas Park is 17,123.
What is the Total Male Population of Manassas Park?
Total Male Population of Manassas Park is 8,685.
What is the Total Female Population of Manassas Park?
Total Female Population of Manassas Park is 8,438.
What is the Ratio of Males per 100 Females in Manassas Park?
There are 102.93 Males per 100 Females in Manassas Park.
What is the Ratio of Females per 100 Males in Manassas Park?
There are 97.16 Females per 100 Males in Manassas Park.
What is the Median Population Age in Manassas Park?
Median Population Age in Manassas Park is 35.8 Years.
What is the Average Family Size in Manassas Park
Average Family Size in Manassas Park is 3.9 People.
What is the Average Household Size in Manassas Park
Average Household Size in Manassas Park is 3.3 People.
How Large is the Labor Force in Manassas Park?
There are 10,289 People in the Labor Forcein in Manassas Park.
What is the Percentage of People in the Labor Force in Manassas Park?
76.7% of People are in the Labor Force in Manassas Park.
What is the Unemployment Rate in Manassas Park?
Unemployment Rate in Manassas Park is 3.2%.