Windsor, VA Map & Demographics
Windsor Map
Windsor Overview
$31,519
PER CAPITA INCOME
$72,500
AVG FAMILY INCOME
$60,603
AVG HOUSEHOLD INCOME
57.3%
WAGE / INCOME GAP [ % ]
42.7¢/ $1
WAGE / INCOME GAP [ $ ]
0.42
INEQUALITY / GINI INDEX
2,765
TOTAL POPULATION
1,349
MALE POPULATION
1,416
FEMALE POPULATION
95.27
MALES / 100 FEMALES
104.97
FEMALES / 100 MALES
43.1
MEDIAN AGE
3.0
AVG FAMILY SIZE
2.5
AVG HOUSEHOLD SIZE
1,262
LABOR FORCE [ PEOPLE ]
59.1%
PERCENT IN LABOR FORCE
4.8%
UNEMPLOYMENT RATE
Windsor Zip Codes
Windsor Area Codes
Income in Windsor
Income Overview in Windsor
Per Capita Income in Windsor is $31,519, while median incomes of families and households are $72,500 and $60,603 respectively.
| Characteristic | Number | Measure |
| Per Capita Income | 2,765 | $31,519 |
| Median Family Income | 700 | $72,500 |
| Mean Family Income | 700 | $95,167 |
| Median Household Income | 1,076 | $60,603 |
| Mean Household Income | 1,076 | $76,747 |
| Income Deficit | 700 | $0 |
| Wage / Income Gap (%) | 2,765 | 57.27% |
| Wage / Income Gap ($) | 2,765 | 42.73¢ per $1 |
| Gini / Inequality Index | 2,765 | 0.42 |
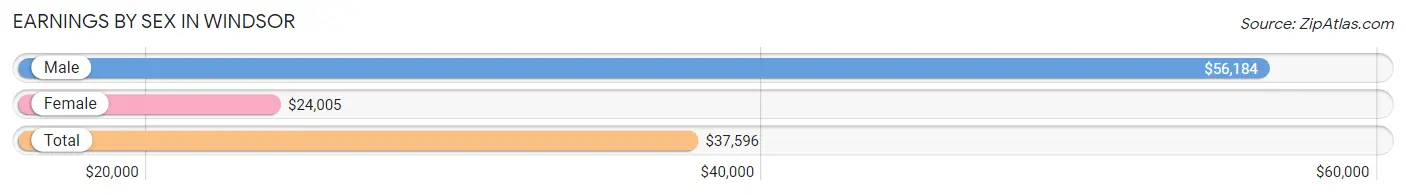
Earnings by Sex in Windsor
Average Earnings in Windsor are $37,596, $56,184 for men and $24,005 for women, a difference of 57.3%.
| Sex | Number | Average Earnings |
| Male | 738 (57.0%) | $56,184 |
| Female | 557 (43.0%) | $24,005 |
| Total | 1,295 (100.0%) | $37,596 |
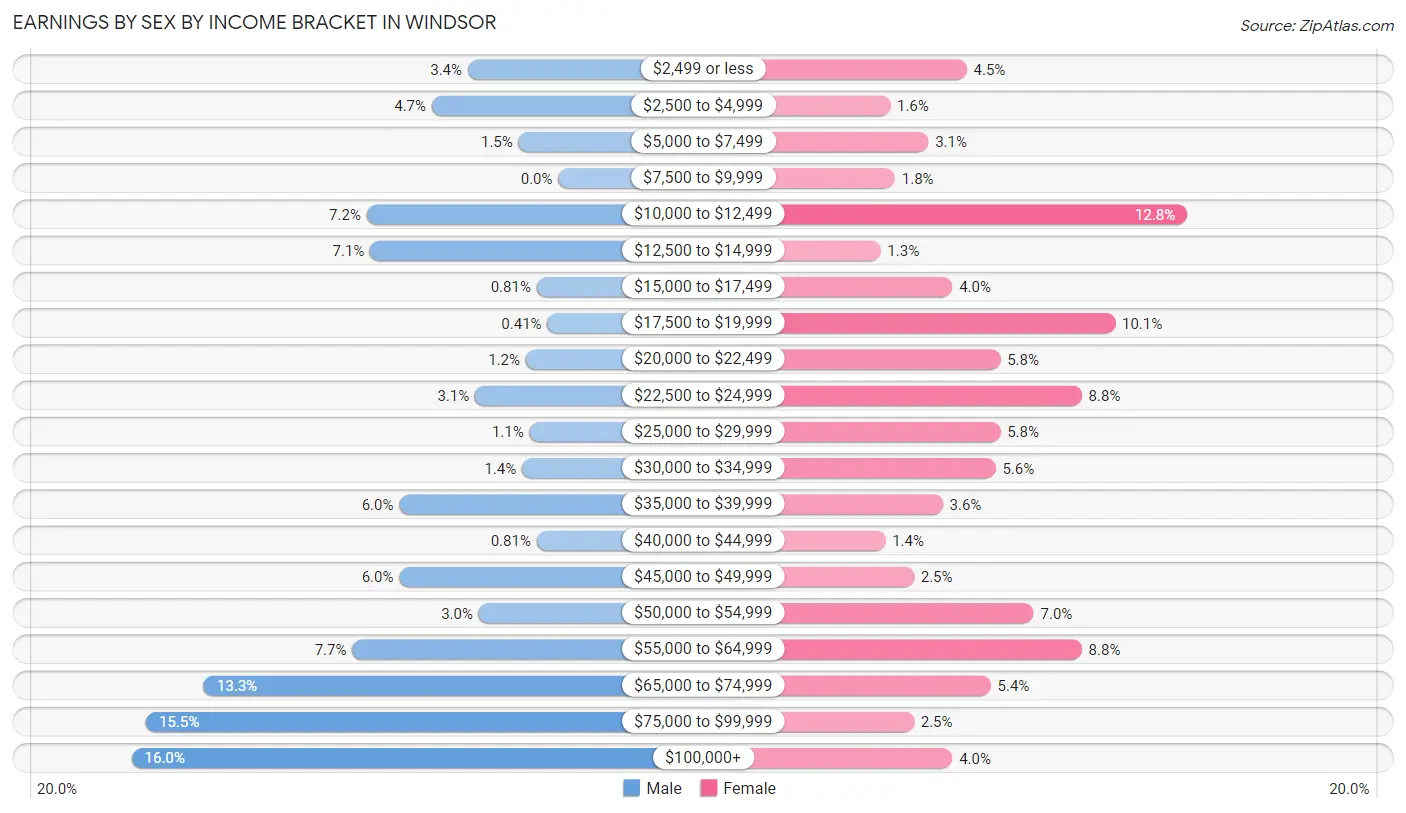
Earnings by Sex by Income Bracket in Windsor
The most common earnings brackets in Windsor are $100,000+ for men (118 | 16.0%) and $10,000 to $12,499 for women (71 | 12.8%).
| Income | Male | Female |
| $2,499 or less | 25 (3.4%) | 25 (4.5%) |
| $2,500 to $4,999 | 35 (4.7%) | 9 (1.6%) |
| $5,000 to $7,499 | 11 (1.5%) | 17 (3.0%) |
| $7,500 to $9,999 | 0 (0.0%) | 10 (1.8%) |
| $10,000 to $12,499 | 53 (7.2%) | 71 (12.8%) |
| $12,500 to $14,999 | 52 (7.0%) | 7 (1.3%) |
| $15,000 to $17,499 | 6 (0.8%) | 22 (4.0%) |
| $17,500 to $19,999 | 3 (0.4%) | 56 (10.1%) |
| $20,000 to $22,499 | 9 (1.2%) | 32 (5.8%) |
| $22,500 to $24,999 | 23 (3.1%) | 49 (8.8%) |
| $25,000 to $29,999 | 8 (1.1%) | 32 (5.8%) |
| $30,000 to $34,999 | 10 (1.4%) | 31 (5.6%) |
| $35,000 to $39,999 | 44 (6.0%) | 20 (3.6%) |
| $40,000 to $44,999 | 6 (0.8%) | 8 (1.4%) |
| $45,000 to $49,999 | 44 (6.0%) | 14 (2.5%) |
| $50,000 to $54,999 | 22 (3.0%) | 39 (7.0%) |
| $55,000 to $64,999 | 57 (7.7%) | 49 (8.8%) |
| $65,000 to $74,999 | 98 (13.3%) | 30 (5.4%) |
| $75,000 to $99,999 | 114 (15.4%) | 14 (2.5%) |
| $100,000+ | 118 (16.0%) | 22 (4.0%) |
| Total | 738 (100.0%) | 557 (100.0%) |
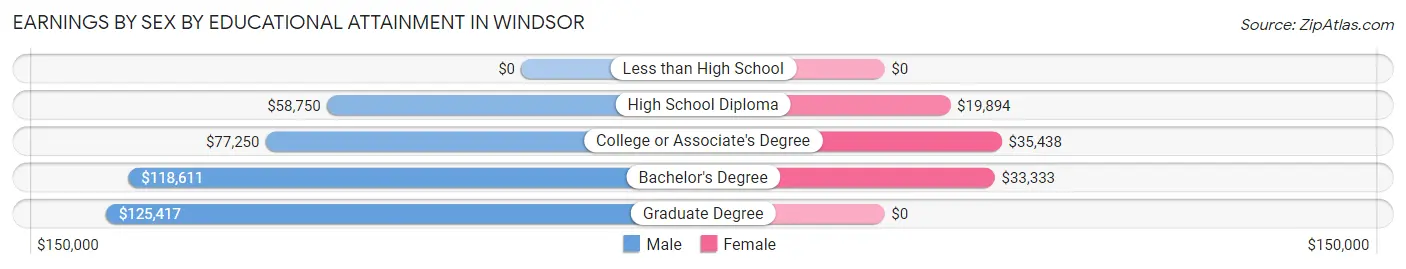
Earnings by Sex by Educational Attainment in Windsor
Average earnings in Windsor are $65,956 for men and $25,750 for women, a difference of 61.0%. Men with an educational attainment of graduate degree enjoy the highest average annual earnings of $125,417, while those with high school diploma education earn the least with $58,750. Women with an educational attainment of college or associate's degree earn the most with the average annual earnings of $35,438, while those with high school diploma education have the smallest earnings of $19,894.
| Educational Attainment | Male Income | Female Income |
| Less than High School | - | - |
| High School Diploma | $58,750 | $19,894 |
| College or Associate's Degree | $77,250 | $35,438 |
| Bachelor's Degree | $118,611 | $33,333 |
| Graduate Degree | $125,417 | $0 |
| Total | $65,956 | $25,750 |
Family Income in Windsor
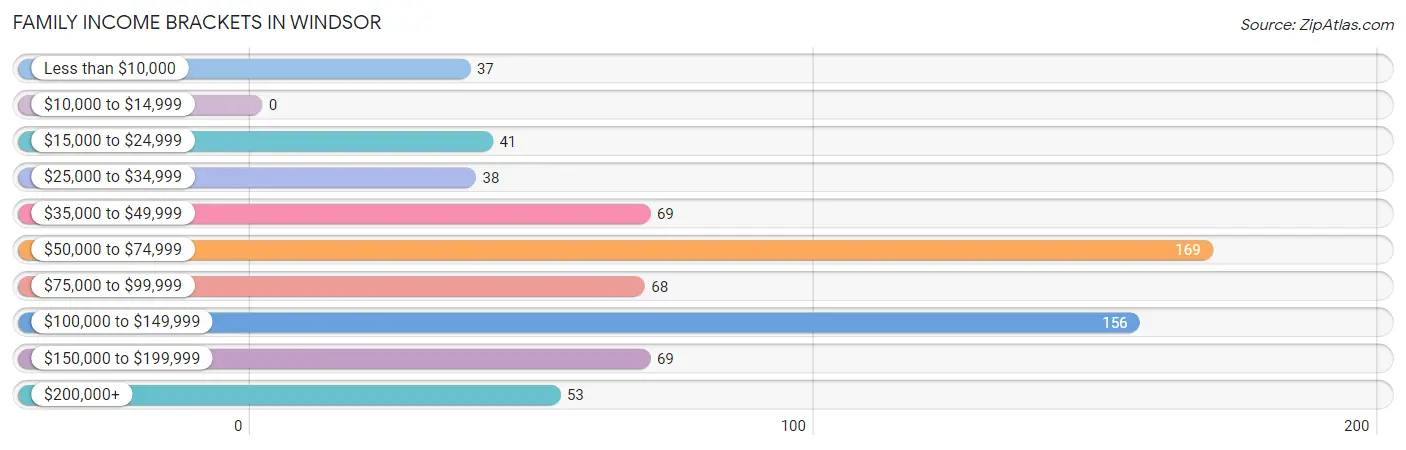
Family Income Brackets in Windsor
According to the Windsor family income data, there are 169 families falling into the $50,000 to $74,999 income range, which is the most common income bracket and makes up 24.1% of all families.
| Income Bracket | # Families | % Families |
| Less than $10,000 | 37 | 5.3% |
| $10,000 to $14,999 | 0 | 0.0% |
| $15,000 to $24,999 | 41 | 5.9% |
| $25,000 to $34,999 | 38 | 5.4% |
| $35,000 to $49,999 | 69 | 9.9% |
| $50,000 to $74,999 | 169 | 24.1% |
| $75,000 to $99,999 | 68 | 9.7% |
| $100,000 to $149,999 | 156 | 22.3% |
| $150,000 to $199,999 | 69 | 9.9% |
| $200,000+ | 53 | 7.6% |
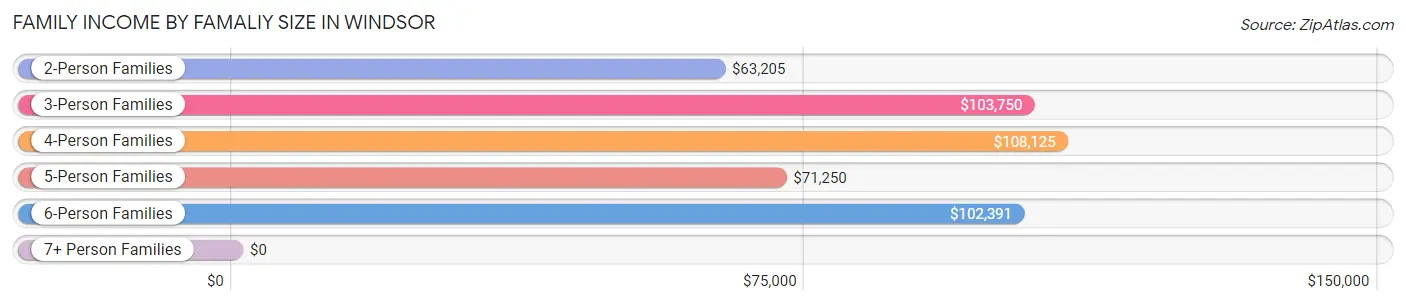
Family Income by Famaliy Size in Windsor
4-person families (84 | 12.0%) account for the highest median family income in Windsor with $108,125 per family, while 3-person families (133 | 19.0%) have the highest median income of $34,583 per family member.
| Income Bracket | # Families | Median Income |
| 2-Person Families | 358 (51.1%) | $63,205 |
| 3-Person Families | 133 (19.0%) | $103,750 |
| 4-Person Families | 84 (12.0%) | $108,125 |
| 5-Person Families | 73 (10.4%) | $71,250 |
| 6-Person Families | 52 (7.4%) | $102,391 |
| 7+ Person Families | 0 (0.0%) | $0 |
| Total | 700 (100.0%) | $72,500 |
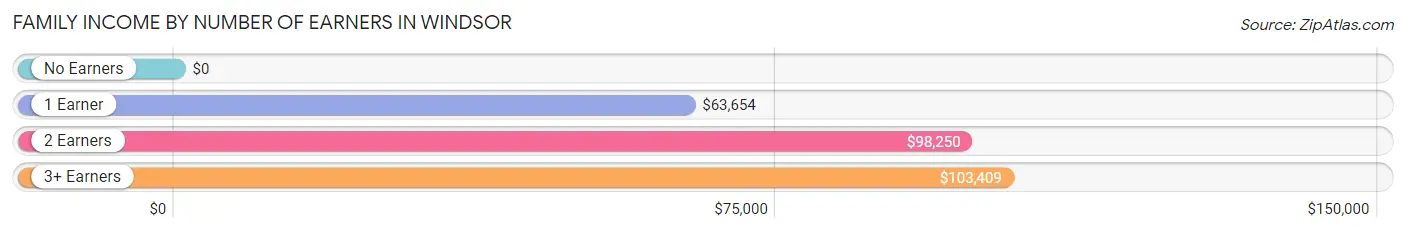
Family Income by Number of Earners in Windsor
| Number of Earners | # Families | Median Income |
| No Earners | 77 (11.0%) | $0 |
| 1 Earner | 290 (41.4%) | $63,654 |
| 2 Earners | 267 (38.1%) | $98,250 |
| 3+ Earners | 66 (9.4%) | $103,409 |
| Total | 700 (100.0%) | $72,500 |
Household Income in Windsor
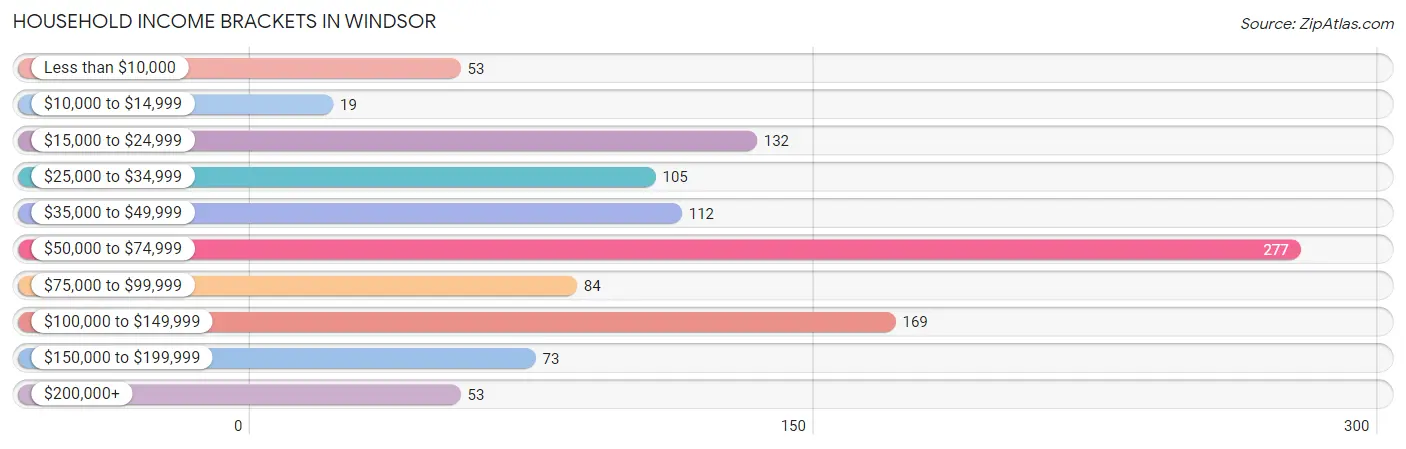
Household Income Brackets in Windsor
With 277 households falling in the category, the $50,000 to $74,999 income range is the most frequent in Windsor, accounting for 25.7% of all households. In contrast, only 19 households (1.8%) fall into the $10,000 to $14,999 income bracket, making it the least populous group.
| Income Bracket | # Households | % Households |
| Less than $10,000 | 53 | 4.9% |
| $10,000 to $14,999 | 19 | 1.8% |
| $15,000 to $24,999 | 132 | 12.3% |
| $25,000 to $34,999 | 105 | 9.8% |
| $35,000 to $49,999 | 112 | 10.4% |
| $50,000 to $74,999 | 277 | 25.7% |
| $75,000 to $99,999 | 84 | 7.8% |
| $100,000 to $149,999 | 169 | 15.7% |
| $150,000 to $199,999 | 73 | 6.8% |
| $200,000+ | 53 | 4.9% |
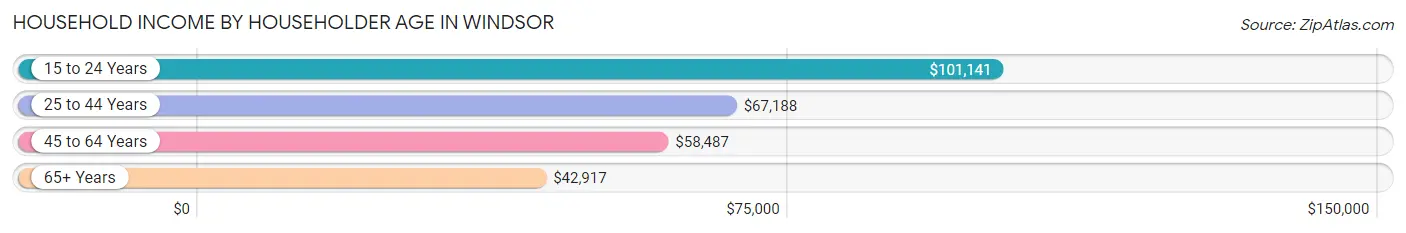
Household Income by Householder Age in Windsor
The median household income in Windsor is $60,603, with the highest median household income of $101,141 found in the 15 to 24 years age bracket for the primary householder. A total of 41 households (3.8%) fall into this category. Meanwhile, the 65+ years age bracket for the primary householder has the lowest median household income of $42,917, with 313 households (29.1%) in this group.
| Income Bracket | # Households | Median Income |
| 15 to 24 Years | 41 (3.8%) | $101,141 |
| 25 to 44 Years | 353 (32.8%) | $67,188 |
| 45 to 64 Years | 369 (34.3%) | $58,487 |
| 65+ Years | 313 (29.1%) | $42,917 |
| Total | 1,076 (100.0%) | $60,603 |
Poverty in Windsor
Income Below Poverty by Sex and Age in Windsor
With 16.2% poverty level for males and 13.6% for females among the residents of Windsor, 5 year old males and 25 to 34 year old females are the most vulnerable to poverty, with 34 males (70.8%) and 71 females (38.4%) in their respective age groups living below the poverty level.
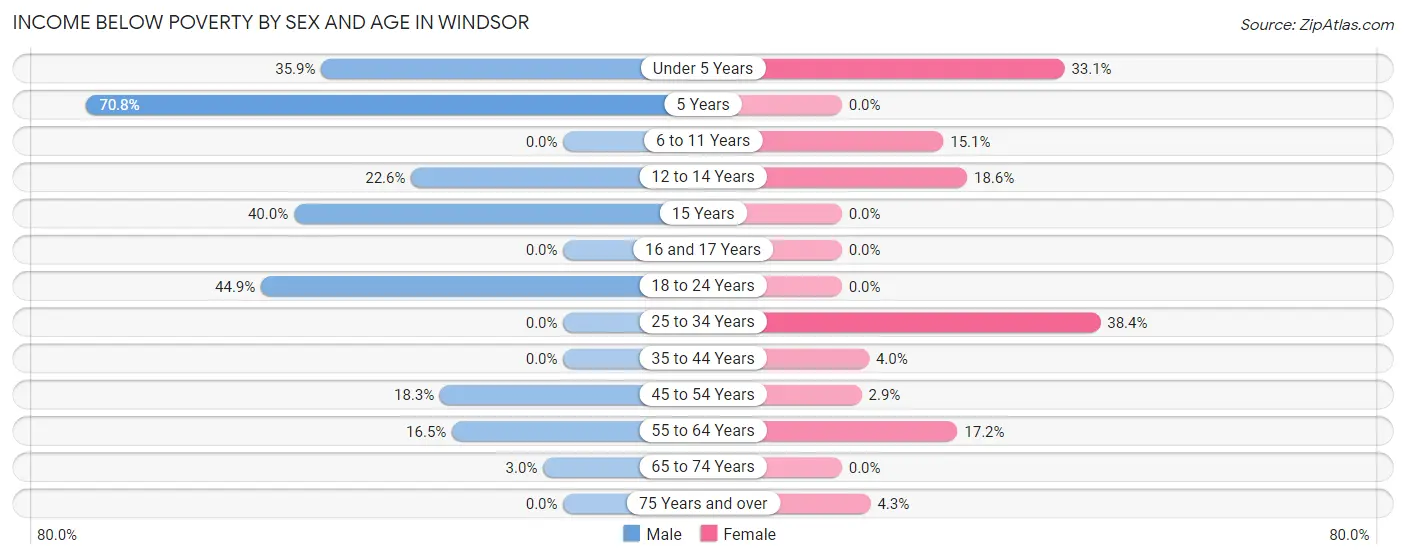
| Age Bracket | Male | Female |
| Under 5 Years | 46 (35.9%) | 40 (33.1%) |
| 5 Years | 34 (70.8%) | 0 (0.0%) |
| 6 to 11 Years | 0 (0.0%) | 11 (15.1%) |
| 12 to 14 Years | 7 (22.6%) | 8 (18.6%) |
| 15 Years | 2 (40.0%) | 0 (0.0%) |
| 16 and 17 Years | 0 (0.0%) | 0 (0.0%) |
| 18 to 24 Years | 57 (44.9%) | 0 (0.0%) |
| 25 to 34 Years | 0 (0.0%) | 71 (38.4%) |
| 35 to 44 Years | 0 (0.0%) | 6 (4.0%) |
| 45 to 54 Years | 26 (18.3%) | 5 (2.9%) |
| 55 to 64 Years | 35 (16.5%) | 35 (17.2%) |
| 65 to 74 Years | 5 (3.0%) | 0 (0.0%) |
| 75 Years and over | 0 (0.0%) | 4 (4.3%) |
| Total | 212 (16.2%) | 180 (13.6%) |
Income Above Poverty by Sex and Age in Windsor
According to the poverty statistics in Windsor, males aged 6 to 11 years and females aged 5 years are the age groups that are most secure financially, with 100.0% of males and 100.0% of females in these age groups living above the poverty line.
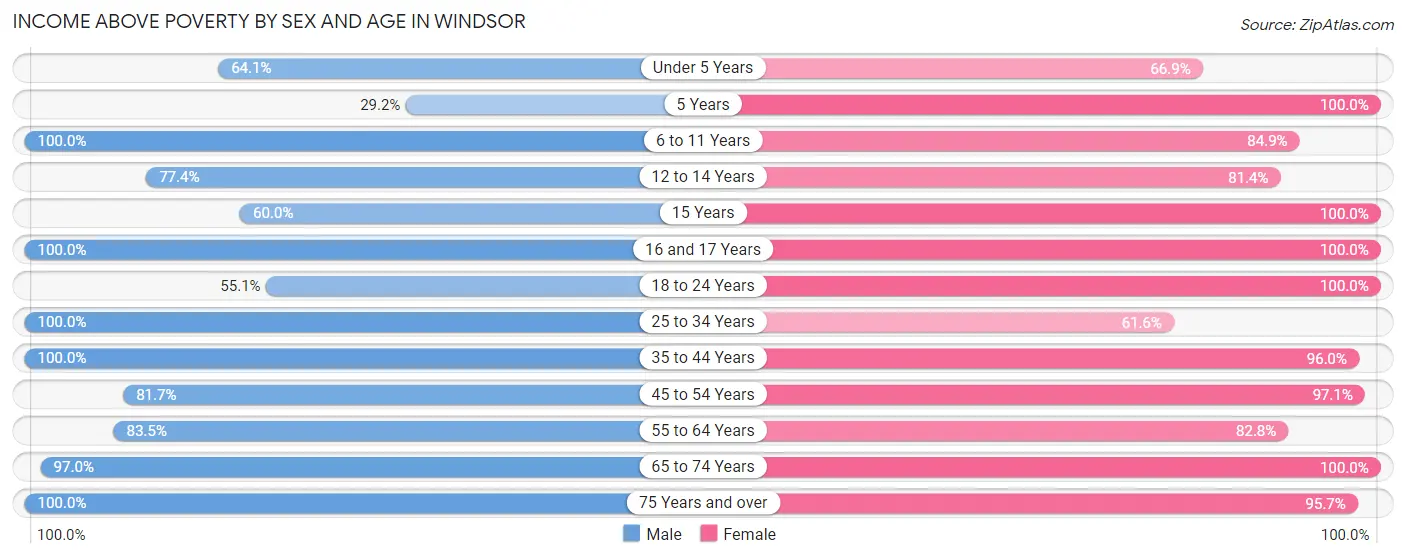
| Age Bracket | Male | Female |
| Under 5 Years | 82 (64.1%) | 81 (66.9%) |
| 5 Years | 14 (29.2%) | 13 (100.0%) |
| 6 to 11 Years | 146 (100.0%) | 62 (84.9%) |
| 12 to 14 Years | 24 (77.4%) | 35 (81.4%) |
| 15 Years | 3 (60.0%) | 5 (100.0%) |
| 16 and 17 Years | 8 (100.0%) | 6 (100.0%) |
| 18 to 24 Years | 70 (55.1%) | 109 (100.0%) |
| 25 to 34 Years | 82 (100.0%) | 114 (61.6%) |
| 35 to 44 Years | 167 (100.0%) | 143 (96.0%) |
| 45 to 54 Years | 116 (81.7%) | 165 (97.1%) |
| 55 to 64 Years | 177 (83.5%) | 169 (82.8%) |
| 65 to 74 Years | 162 (97.0%) | 148 (100.0%) |
| 75 Years and over | 44 (100.0%) | 90 (95.7%) |
| Total | 1,095 (83.8%) | 1,140 (86.4%) |
Income Below Poverty Among Married-Couple Families in Windsor
The poverty statistics for married-couple families in Windsor show that 5.2% or 26 of the total 504 families live below the poverty line. Families with 3 or 4 children have the highest poverty rate of 30.6%, comprising of 22 families. On the other hand, families with 1 or 2 children have the lowest poverty rate of 0.0%, which includes 0 families.
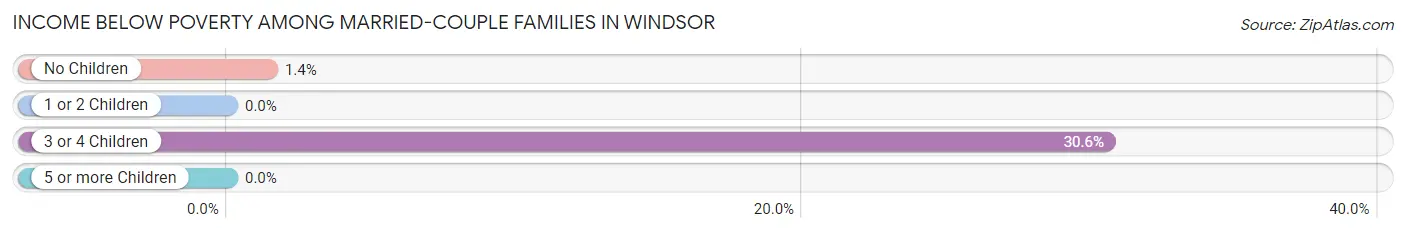
| Children | Above Poverty | Below Poverty |
| No Children | 283 (98.6%) | 4 (1.4%) |
| 1 or 2 Children | 145 (100.0%) | 0 (0.0%) |
| 3 or 4 Children | 50 (69.4%) | 22 (30.6%) |
| 5 or more Children | 0 (0.0%) | 0 (0.0%) |
| Total | 478 (94.8%) | 26 (5.2%) |
Income Below Poverty Among Single-Parent Households in Windsor
According to the poverty data in Windsor, 5.6% or 3 single-father households and 33.1% or 47 single-mother households are living below the poverty line. Among single-father households, those with 1 or 2 children have the highest poverty rate, with 3 households (11.5%) experiencing poverty. Likewise, among single-mother households, those with 5 or more children have the highest poverty rate, with 4 households (100.0%) falling below the poverty line.
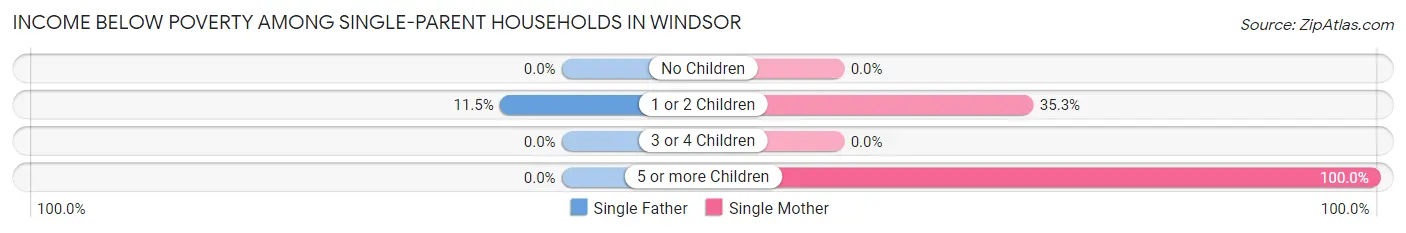
| Children | Single Father | Single Mother |
| No Children | 0 (0.0%) | 0 (0.0%) |
| 1 or 2 Children | 3 (11.5%) | 43 (35.2%) |
| 3 or 4 Children | 0 (0.0%) | 0 (0.0%) |
| 5 or more Children | 0 (0.0%) | 4 (100.0%) |
| Total | 3 (5.6%) | 47 (33.1%) |
Income Below Poverty Among Married-Couple vs Single-Parent Households in Windsor
The poverty data for Windsor shows that 26 of the married-couple family households (5.2%) and 50 of the single-parent households (25.5%) are living below the poverty level. Within the married-couple family households, those with 3 or 4 children have the highest poverty rate, with 22 households (30.6%) falling below the poverty line. Among the single-parent households, those with 5 or more children have the highest poverty rate, with 4 household (100.0%) living below poverty.
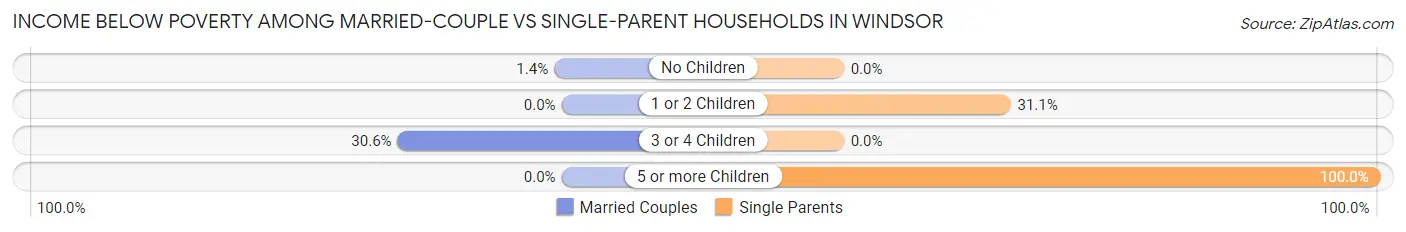
| Children | Married-Couple Families | Single-Parent Households |
| No Children | 4 (1.4%) | 0 (0.0%) |
| 1 or 2 Children | 0 (0.0%) | 46 (31.1%) |
| 3 or 4 Children | 22 (30.6%) | 0 (0.0%) |
| 5 or more Children | 0 (0.0%) | 4 (100.0%) |
| Total | 26 (5.2%) | 50 (25.5%) |
Race in Windsor
The most populous races in Windsor are White / Caucasian (1,969 | 71.2%), Black / African American (446 | 16.1%), and Hispanic or Latino (203 | 7.3%).
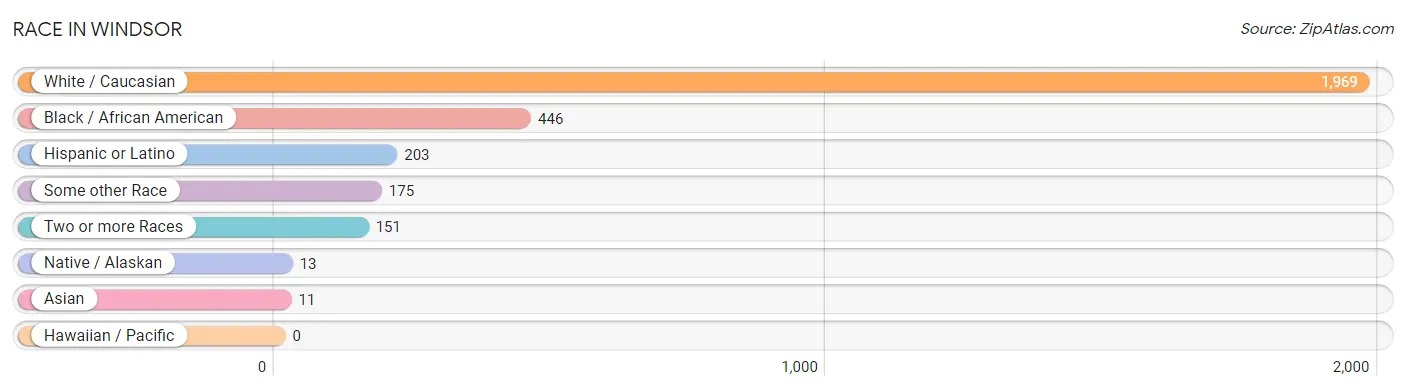
| Race | # Population | % Population |
| Asian | 11 | 0.4% |
| Black / African American | 446 | 16.1% |
| Hawaiian / Pacific | 0 | 0.0% |
| Hispanic or Latino | 203 | 7.3% |
| Native / Alaskan | 13 | 0.5% |
| White / Caucasian | 1,969 | 71.2% |
| Two or more Races | 151 | 5.5% |
| Some other Race | 175 | 6.3% |
| Total | 2,765 | 100.0% |
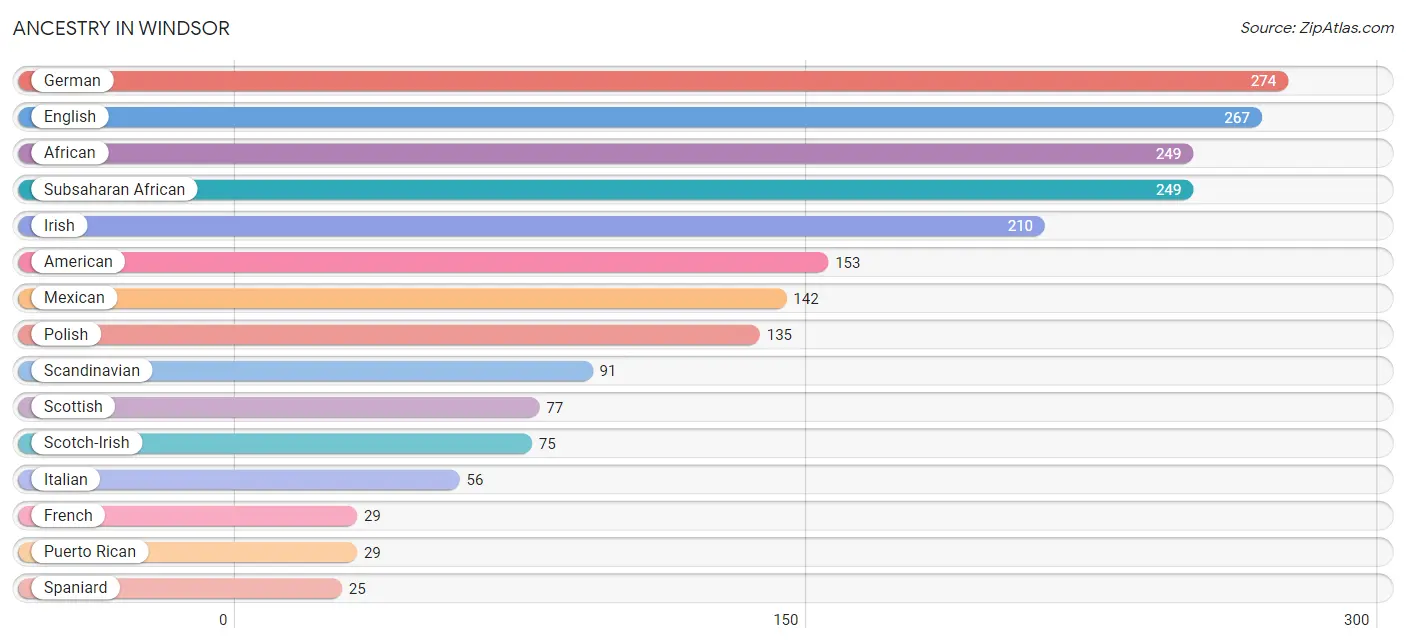
Ancestry in Windsor
The most populous ancestries reported in Windsor are German (274 | 9.9%), English (267 | 9.7%), African (249 | 9.0%), Subsaharan African (249 | 9.0%), and Irish (210 | 7.6%), together accounting for 45.2% of all Windsor residents.
| Ancestry | # Population | % Population |
| African | 249 | 9.0% |
| American | 153 | 5.5% |
| British | 11 | 0.4% |
| Cherokee | 24 | 0.9% |
| Danish | 11 | 0.4% |
| Dutch | 8 | 0.3% |
| English | 267 | 9.7% |
| European | 16 | 0.6% |
| French | 29 | 1.1% |
| French American Indian | 4 | 0.1% |
| French Canadian | 4 | 0.1% |
| German | 274 | 9.9% |
| Hungarian | 6 | 0.2% |
| Indian (Asian) | 11 | 0.4% |
| Irish | 210 | 7.6% |
| Italian | 56 | 2.0% |
| Jamaican | 19 | 0.7% |
| Mexican | 142 | 5.1% |
| Peruvian | 4 | 0.1% |
| Polish | 135 | 4.9% |
| Puerto Rican | 29 | 1.1% |
| Russian | 6 | 0.2% |
| Scandinavian | 91 | 3.3% |
| Scotch-Irish | 75 | 2.7% |
| Scottish | 77 | 2.8% |
| South American | 4 | 0.1% |
| Spaniard | 25 | 0.9% |
| Subsaharan African | 249 | 9.0% |
| Swedish | 15 | 0.5% |
| Ukrainian | 4 | 0.1% |
| Welsh | 10 | 0.4% |
| West Indian | 2 | 0.1% | View All 32 Rows |
Immigrants in Windsor
The most numerous immigrant groups reported in Windsor came from Latin America (91 | 3.3%), Central America (80 | 2.9%), Mexico (80 | 2.9%), Caribbean (7 | 0.3%), and Jamaica (7 | 0.3%), together accounting for 9.6% of all Windsor residents.
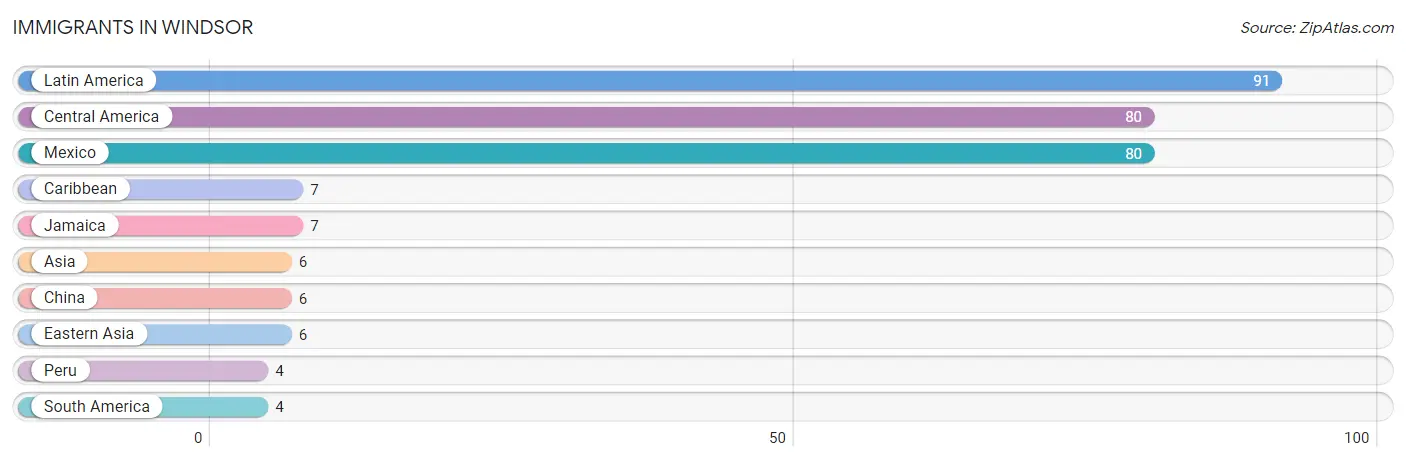
| Immigration Origin | # Population | % Population |
| Asia | 6 | 0.2% |
| Caribbean | 7 | 0.3% |
| Central America | 80 | 2.9% |
| China | 6 | 0.2% |
| Eastern Asia | 6 | 0.2% |
| Jamaica | 7 | 0.3% |
| Latin America | 91 | 3.3% |
| Mexico | 80 | 2.9% |
| Peru | 4 | 0.1% |
| South America | 4 | 0.1% | View All 10 Rows |
Sex and Age in Windsor
Sex and Age in Windsor
The most populous age groups in Windsor are 5 to 9 Years (143 | 10.6%) for men and 60 to 64 Years (130 | 9.2%) for women.
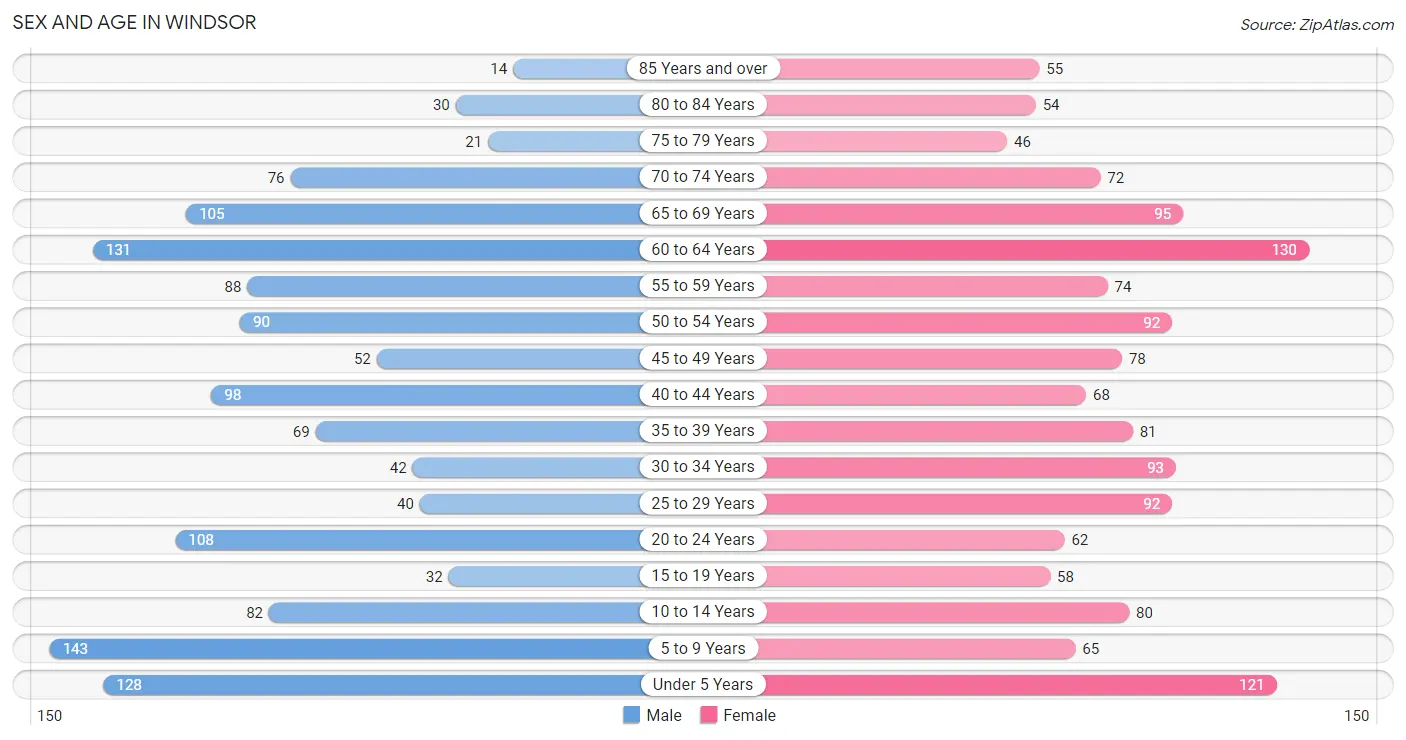
| Age Bracket | Male | Female |
| Under 5 Years | 128 (9.5%) | 121 (8.6%) |
| 5 to 9 Years | 143 (10.6%) | 65 (4.6%) |
| 10 to 14 Years | 82 (6.1%) | 80 (5.7%) |
| 15 to 19 Years | 32 (2.4%) | 58 (4.1%) |
| 20 to 24 Years | 108 (8.0%) | 62 (4.4%) |
| 25 to 29 Years | 40 (3.0%) | 92 (6.5%) |
| 30 to 34 Years | 42 (3.1%) | 93 (6.6%) |
| 35 to 39 Years | 69 (5.1%) | 81 (5.7%) |
| 40 to 44 Years | 98 (7.3%) | 68 (4.8%) |
| 45 to 49 Years | 52 (3.8%) | 78 (5.5%) |
| 50 to 54 Years | 90 (6.7%) | 92 (6.5%) |
| 55 to 59 Years | 88 (6.5%) | 74 (5.2%) |
| 60 to 64 Years | 131 (9.7%) | 130 (9.2%) |
| 65 to 69 Years | 105 (7.8%) | 95 (6.7%) |
| 70 to 74 Years | 76 (5.6%) | 72 (5.1%) |
| 75 to 79 Years | 21 (1.6%) | 46 (3.3%) |
| 80 to 84 Years | 30 (2.2%) | 54 (3.8%) |
| 85 Years and over | 14 (1.0%) | 55 (3.9%) |
| Total | 1,349 (100.0%) | 1,416 (100.0%) |
Families and Households in Windsor
Median Family Size in Windsor
The median family size in Windsor is 3.04 persons per family, with single male/father families (54 | 7.7%) accounting for the largest median family size of 3.41 persons per family. On the other hand, single female/mother families (142 | 20.3%) represent the smallest median family size with 2.80 persons per family.
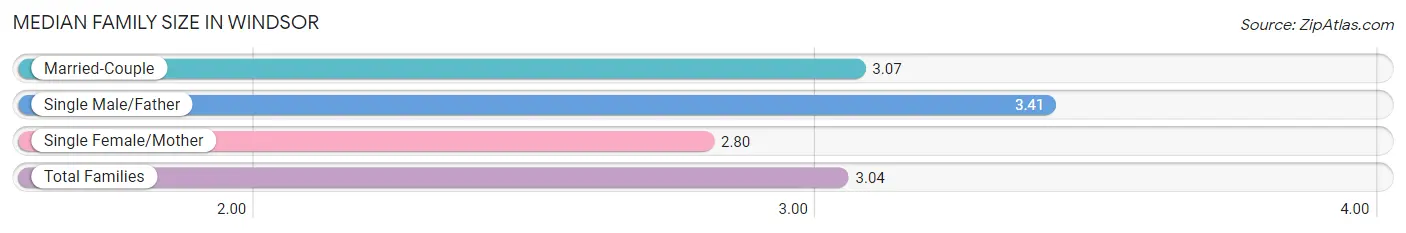
| Family Type | # Families | Family Size |
| Married-Couple | 504 (72.0%) | 3.07 |
| Single Male/Father | 54 (7.7%) | 3.41 |
| Single Female/Mother | 142 (20.3%) | 2.80 |
| Total Families | 700 (100.0%) | 3.04 |
Median Household Size in Windsor
The median household size in Windsor is 2.46 persons per household, with single male/father households (54 | 5.0%) accounting for the largest median household size of 3.5 persons per household. non-family households (376 | 34.9%) represent the smallest median household size with 1.23 persons per household.
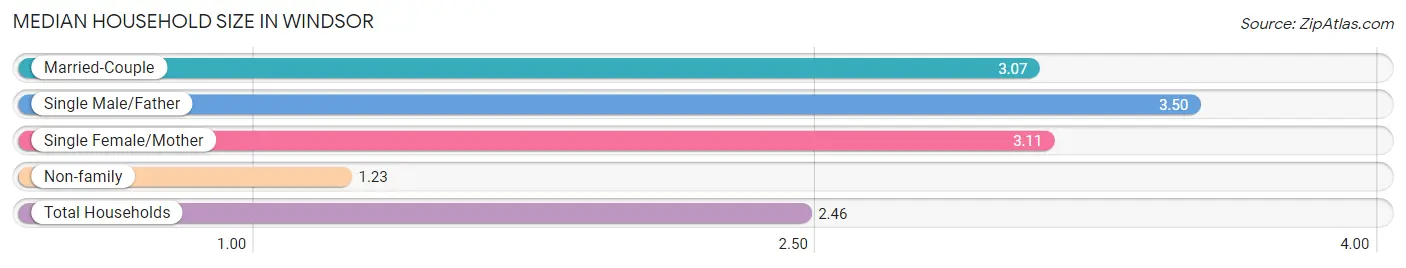
| Household Type | # Households | Household Size |
| Married-Couple | 504 (46.8%) | 3.07 |
| Single Male/Father | 54 (5.0%) | 3.50 |
| Single Female/Mother | 142 (13.2%) | 3.11 |
| Non-family | 376 (34.9%) | 1.23 |
| Total Households | 1,076 (100.0%) | 2.46 |
Household Size by Marriage Status in Windsor
Out of a total of 1,076 households in Windsor, 700 (65.1%) are family households, while 376 (34.9%) are nonfamily households. The most numerous type of family households are 2-person households, comprising 338, and the most common type of nonfamily households are 1-person households, comprising 291.
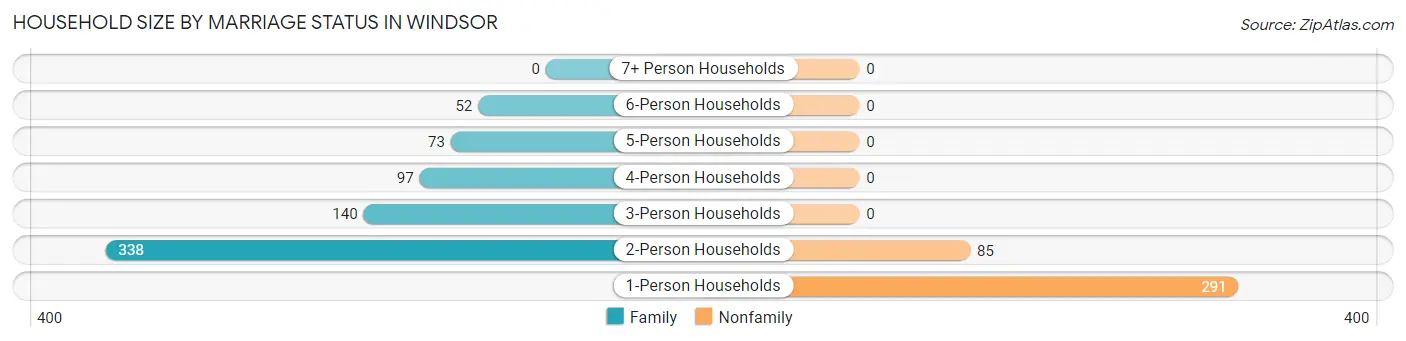
| Household Size | Family Households | Nonfamily Households |
| 1-Person Households | - | 291 (27.0%) |
| 2-Person Households | 338 (31.4%) | 85 (7.9%) |
| 3-Person Households | 140 (13.0%) | 0 (0.0%) |
| 4-Person Households | 97 (9.0%) | 0 (0.0%) |
| 5-Person Households | 73 (6.8%) | 0 (0.0%) |
| 6-Person Households | 52 (4.8%) | 0 (0.0%) |
| 7+ Person Households | 0 (0.0%) | 0 (0.0%) |
| Total | 700 (65.1%) | 376 (34.9%) |
Female Fertility in Windsor
Fertility by Age in Windsor
Average fertility rate in Windsor is 48.0 births per 1,000 women. Women in the age bracket of 20 to 34 years have the highest fertility rate with 105.0 births per 1,000 women. Women in the age bracket of 20 to 34 years acount for 100.0% of all women with births.
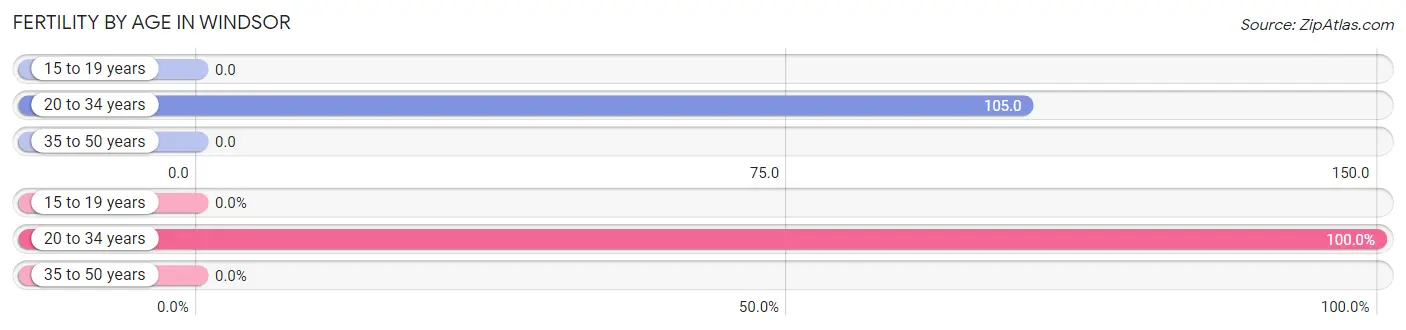
| Age Bracket | Women with Births | Births / 1,000 Women |
| 15 to 19 years | 0 (0.0%) | 0.0 |
| 20 to 34 years | 26 (100.0%) | 105.0 |
| 35 to 50 years | 0 (0.0%) | 0.0 |
| Total | 26 (100.0%) | 48.0 |
Fertility by Age by Marriage Status in Windsor
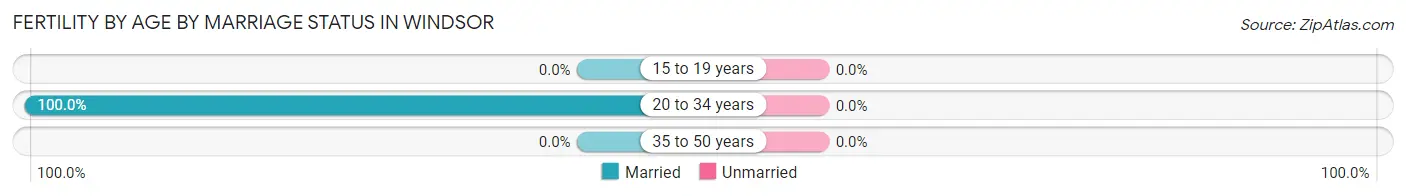
| Age Bracket | Married | Unmarried |
| 15 to 19 years | 0 (0.0%) | 0 (0.0%) |
| 20 to 34 years | 26 (100.0%) | 0 (0.0%) |
| 35 to 50 years | 0 (0.0%) | 0 (0.0%) |
| Total | 26 (100.0%) | 0 (0.0%) |
Fertility by Education in Windsor
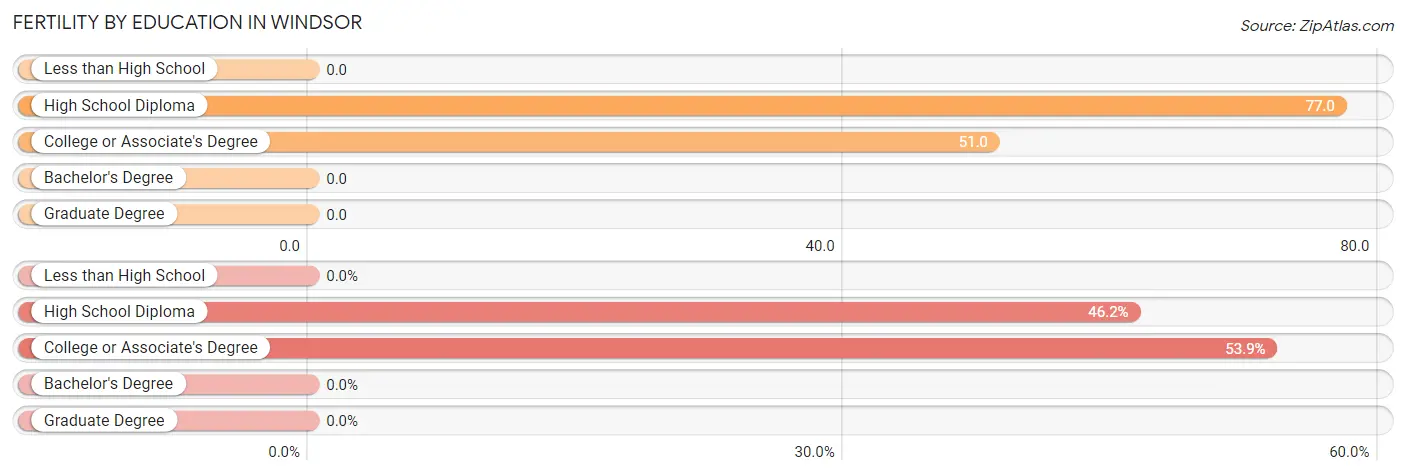
| Educational Attainment | Women with Births | Births / 1,000 Women |
| Less than High School | 0 (0.0%) | 0.0 |
| High School Diploma | 12 (46.2%) | 77.0 |
| College or Associate's Degree | 14 (53.8%) | 51.0 |
| Bachelor's Degree | 0 (0.0%) | 0.0 |
| Graduate Degree | 0 (0.0%) | 0.0 |
| Total | 26 (100.0%) | 48.0 |
Fertility by Education by Marriage Status in Windsor
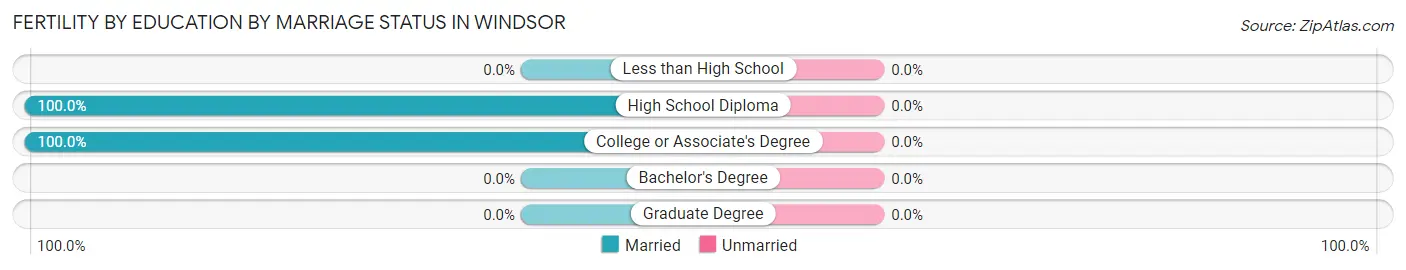
| Educational Attainment | Married | Unmarried |
| Less than High School | 0 (0.0%) | 0 (0.0%) |
| High School Diploma | 12 (100.0%) | 0 (0.0%) |
| College or Associate's Degree | 14 (100.0%) | 0 (0.0%) |
| Bachelor's Degree | 0 (0.0%) | 0 (0.0%) |
| Graduate Degree | 0 (0.0%) | 0 (0.0%) |
| Total | 26 (100.0%) | 0 (0.0%) |
Employment Characteristics in Windsor
Employment by Class of Employer in Windsor
Among the 1,169 employed individuals in Windsor, private company employees (745 | 63.7%), local government employees (167 | 14.3%), and federal government employees (70 | 6.0%) make up the most common classes of employment.
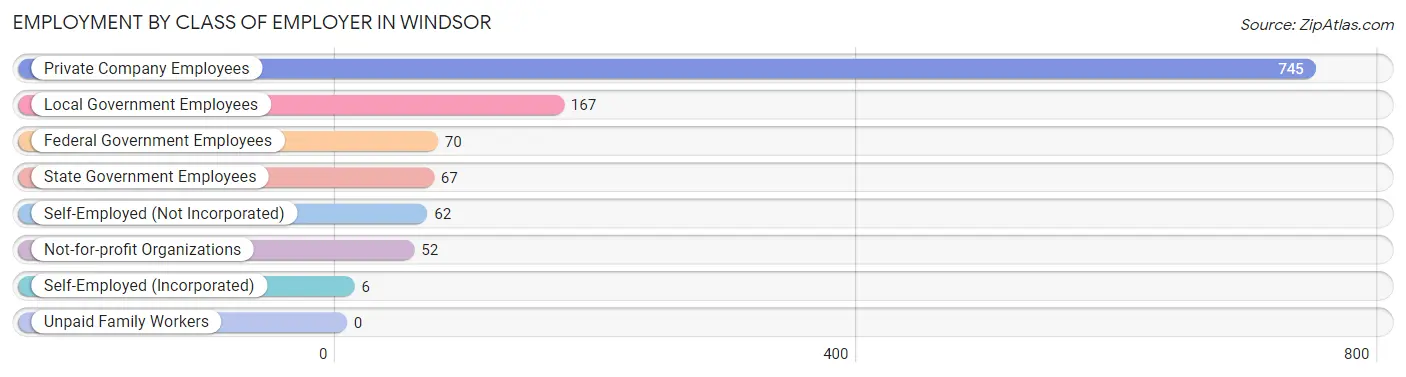
| Employer Class | # Employees | % Employees |
| Private Company Employees | 745 | 63.7% |
| Self-Employed (Incorporated) | 6 | 0.5% |
| Self-Employed (Not Incorporated) | 62 | 5.3% |
| Not-for-profit Organizations | 52 | 4.4% |
| Local Government Employees | 167 | 14.3% |
| State Government Employees | 67 | 5.7% |
| Federal Government Employees | 70 | 6.0% |
| Unpaid Family Workers | 0 | 0.0% |
| Total | 1,169 | 100.0% |
Employment Status by Age in Windsor
According to the labor force statistics for Windsor, out of the total population over 16 years of age (2,136), 59.1% or 1,262 individuals are in the labor force, with 4.8% or 61 of them unemployed. The age group with the highest labor force participation rate is 30 to 34 years, with 100.0% or 135 individuals in the labor force. Within the labor force, the 30 to 34 years age range has the highest percentage of unemployed individuals, with 21.8% or 29 of them being unemployed.
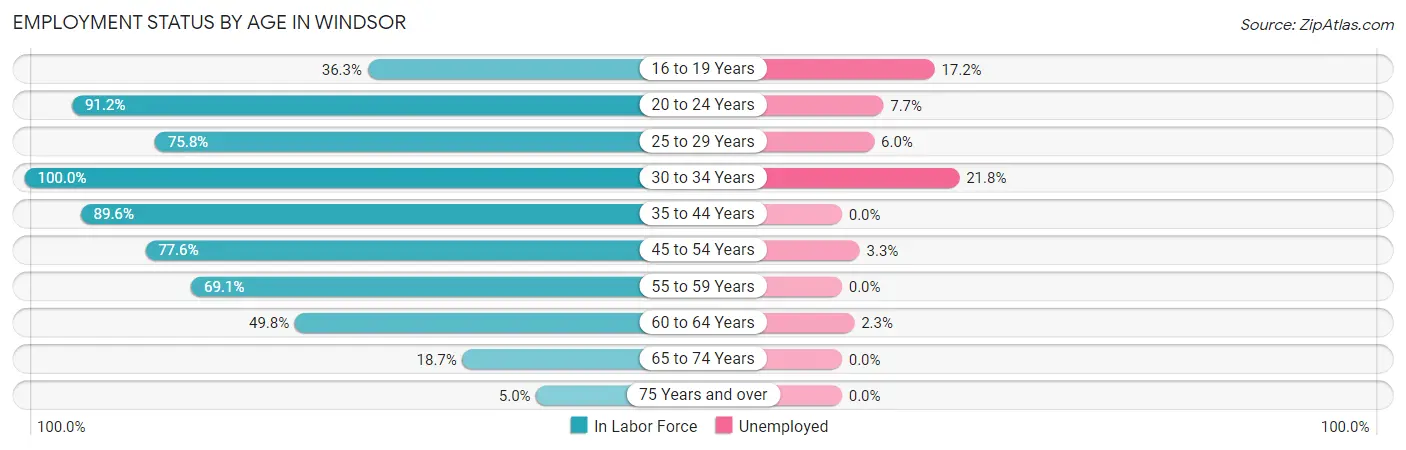
| Age Bracket | In Labor Force | Unemployed |
| 16 to 19 Years | 29 (36.3%) | 5 (17.2%) |
| 20 to 24 Years | 155 (91.2%) | 12 (7.7%) |
| 25 to 29 Years | 100 (75.8%) | 6 (6.0%) |
| 30 to 34 Years | 135 (100.0%) | 29 (21.8%) |
| 35 to 44 Years | 283 (89.6%) | 0 (0.0%) |
| 45 to 54 Years | 242 (77.6%) | 8 (3.3%) |
| 55 to 59 Years | 112 (69.1%) | 0 (0.0%) |
| 60 to 64 Years | 130 (49.8%) | 3 (2.3%) |
| 65 to 74 Years | 65 (18.7%) | 0 (0.0%) |
| 75 Years and over | 11 (5.0%) | 0 (0.0%) |
| Total | 1,262 (59.1%) | 61 (4.8%) |
Employment Status by Educational Attainment in Windsor
According to labor force statistics for Windsor, 76.0% of individuals (1,002) out of the total population between 25 and 64 years of age (1,318) are in the labor force, with 4.4% or 44 of them being unemployed. The group with the highest labor force participation rate are those with the educational attainment of bachelor's degree or higher, with 81.1% or 150 individuals in the labor force. Within the labor force, individuals with college / associate degree education have the highest percentage of unemployment, with 6.6% or 26 of them being unemployed.
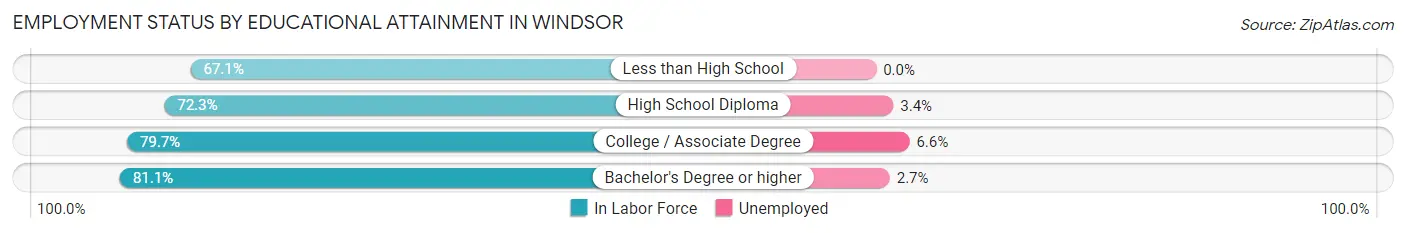
| Educational Attainment | In Labor Force | Unemployed |
| Less than High School | 51 (67.1%) | 0 (0.0%) |
| High School Diploma | 401 (72.3%) | 19 (3.4%) |
| College / Associate Degree | 400 (79.7%) | 33 (6.6%) |
| Bachelor's Degree or higher | 150 (81.1%) | 5 (2.7%) |
| Total | 1,002 (76.0%) | 58 (4.4%) |
Employment Occupations by Sex in Windsor
Management, Business, Science and Arts Occupations
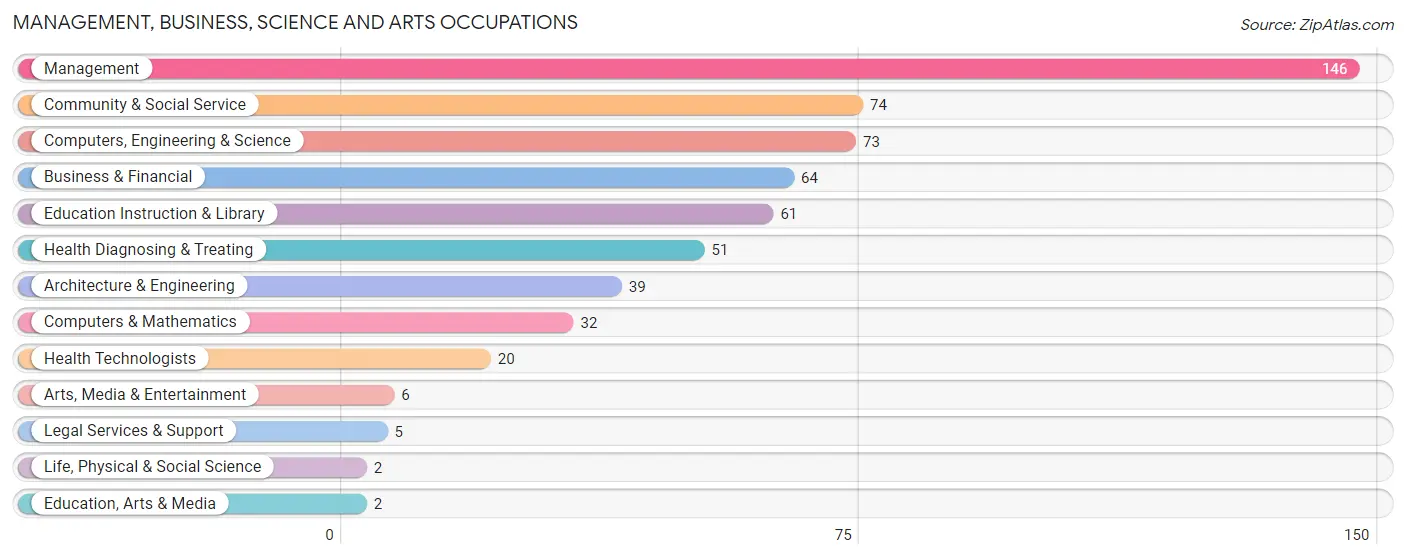
The most common Management, Business, Science and Arts occupations in Windsor are Management (146 | 12.4%), Community & Social Service (74 | 6.3%), Computers, Engineering & Science (73 | 6.2%), Business & Financial (64 | 5.4%), and Education Instruction & Library (61 | 5.2%).
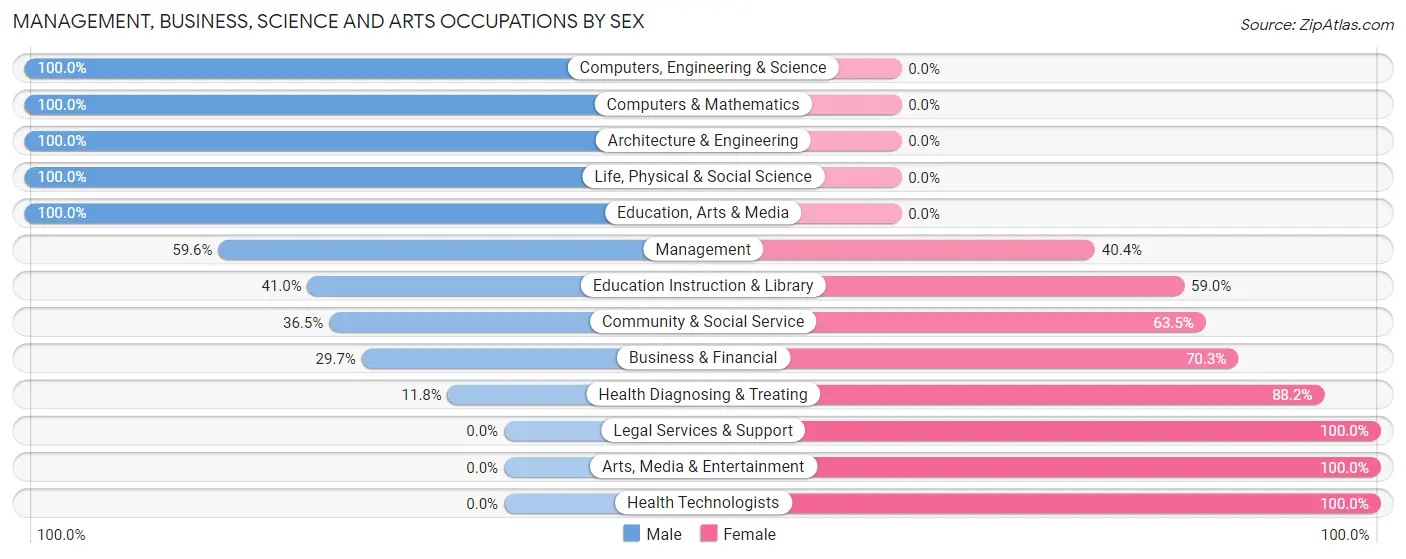
Management, Business, Science and Arts Occupations by Sex
Within the Management, Business, Science and Arts occupations in Windsor, the most male-oriented occupations are Computers, Engineering & Science (100.0%), Computers & Mathematics (100.0%), and Architecture & Engineering (100.0%), while the most female-oriented occupations are Legal Services & Support (100.0%), Arts, Media & Entertainment (100.0%), and Health Technologists (100.0%).
| Occupation | Male | Female |
| Management | 87 (59.6%) | 59 (40.4%) |
| Business & Financial | 19 (29.7%) | 45 (70.3%) |
| Computers, Engineering & Science | 73 (100.0%) | 0 (0.0%) |
| Computers & Mathematics | 32 (100.0%) | 0 (0.0%) |
| Architecture & Engineering | 39 (100.0%) | 0 (0.0%) |
| Life, Physical & Social Science | 2 (100.0%) | 0 (0.0%) |
| Community & Social Service | 27 (36.5%) | 47 (63.5%) |
| Education, Arts & Media | 2 (100.0%) | 0 (0.0%) |
| Legal Services & Support | 0 (0.0%) | 5 (100.0%) |
| Education Instruction & Library | 25 (41.0%) | 36 (59.0%) |
| Arts, Media & Entertainment | 0 (0.0%) | 6 (100.0%) |
| Health Diagnosing & Treating | 6 (11.8%) | 45 (88.2%) |
| Health Technologists | 0 (0.0%) | 20 (100.0%) |
| Total (Category) | 212 (52.0%) | 196 (48.0%) |
| Total (Overall) | 654 (55.4%) | 527 (44.6%) |
Services Occupations
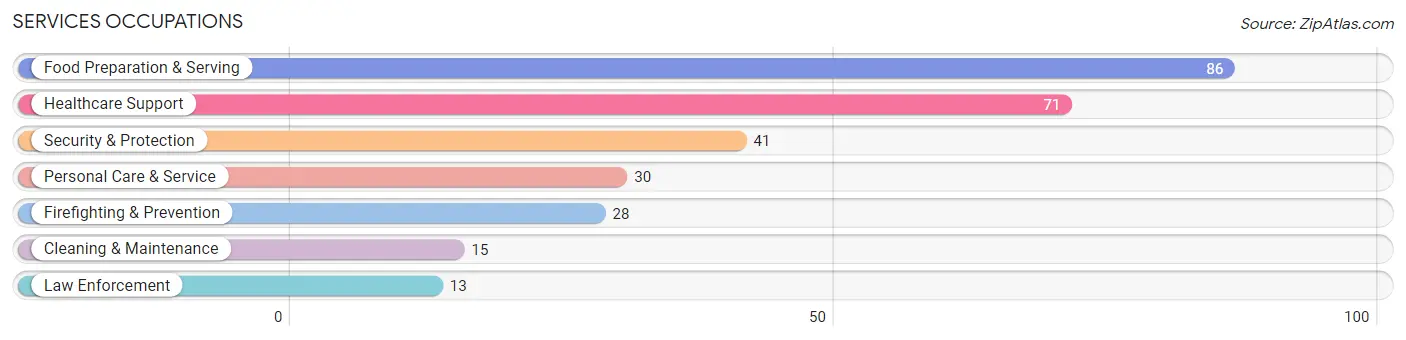
The most common Services occupations in Windsor are Food Preparation & Serving (86 | 7.3%), Healthcare Support (71 | 6.0%), Security & Protection (41 | 3.5%), Personal Care & Service (30 | 2.5%), and Firefighting & Prevention (28 | 2.4%).
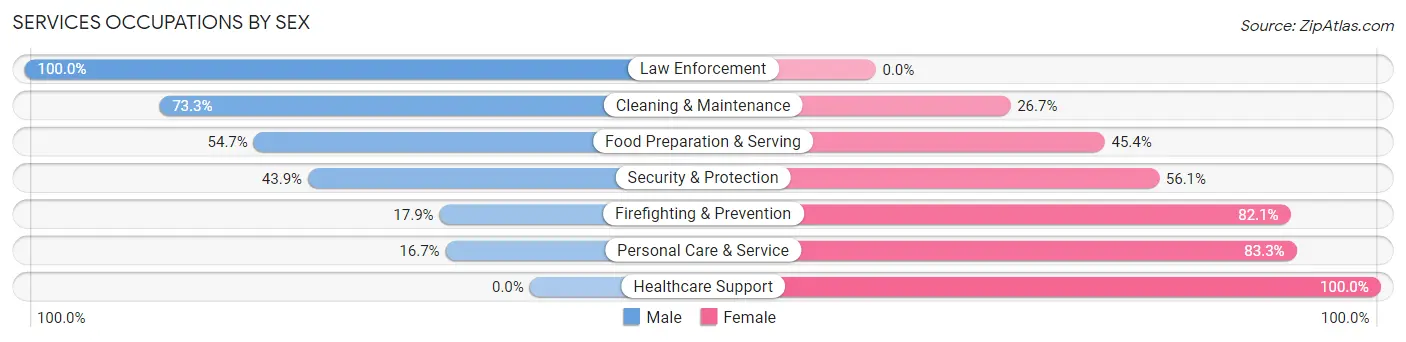
Services Occupations by Sex
Within the Services occupations in Windsor, the most male-oriented occupations are Law Enforcement (100.0%), Cleaning & Maintenance (73.3%), and Food Preparation & Serving (54.6%), while the most female-oriented occupations are Healthcare Support (100.0%), Personal Care & Service (83.3%), and Firefighting & Prevention (82.1%).
| Occupation | Male | Female |
| Healthcare Support | 0 (0.0%) | 71 (100.0%) |
| Security & Protection | 18 (43.9%) | 23 (56.1%) |
| Firefighting & Prevention | 5 (17.9%) | 23 (82.1%) |
| Law Enforcement | 13 (100.0%) | 0 (0.0%) |
| Food Preparation & Serving | 47 (54.6%) | 39 (45.4%) |
| Cleaning & Maintenance | 11 (73.3%) | 4 (26.7%) |
| Personal Care & Service | 5 (16.7%) | 25 (83.3%) |
| Total (Category) | 81 (33.3%) | 162 (66.7%) |
| Total (Overall) | 654 (55.4%) | 527 (44.6%) |
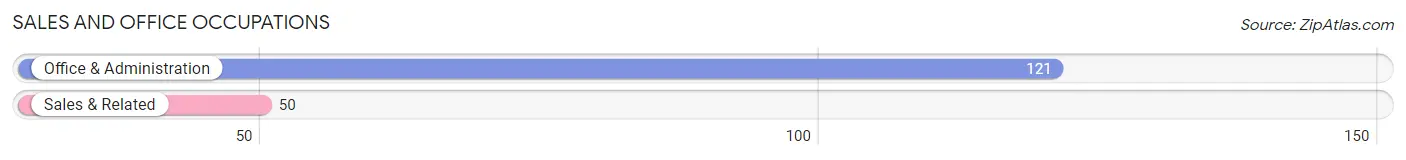
Sales and Office Occupations
The most common Sales and Office occupations in Windsor are Office & Administration (121 | 10.2%), and Sales & Related (50 | 4.2%).
Sales and Office Occupations by Sex
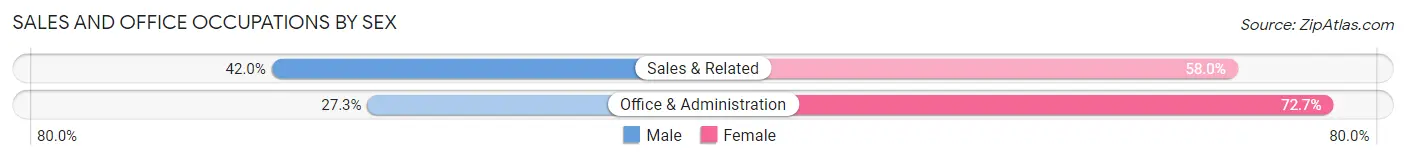
| Occupation | Male | Female |
| Sales & Related | 21 (42.0%) | 29 (58.0%) |
| Office & Administration | 33 (27.3%) | 88 (72.7%) |
| Total (Category) | 54 (31.6%) | 117 (68.4%) |
| Total (Overall) | 654 (55.4%) | 527 (44.6%) |
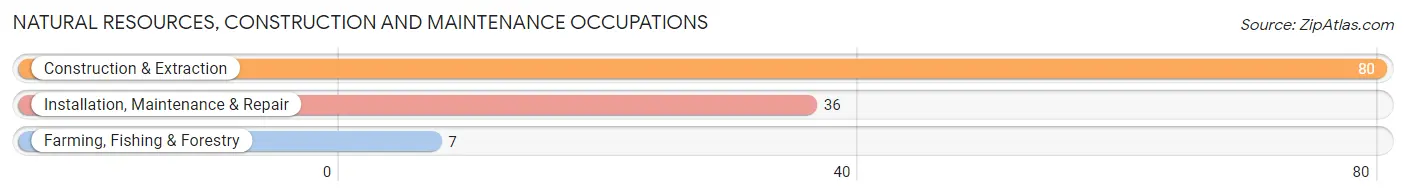
Natural Resources, Construction and Maintenance Occupations
The most common Natural Resources, Construction and Maintenance occupations in Windsor are Construction & Extraction (80 | 6.8%), Installation, Maintenance & Repair (36 | 3.0%), and Farming, Fishing & Forestry (7 | 0.6%).
Natural Resources, Construction and Maintenance Occupations by Sex
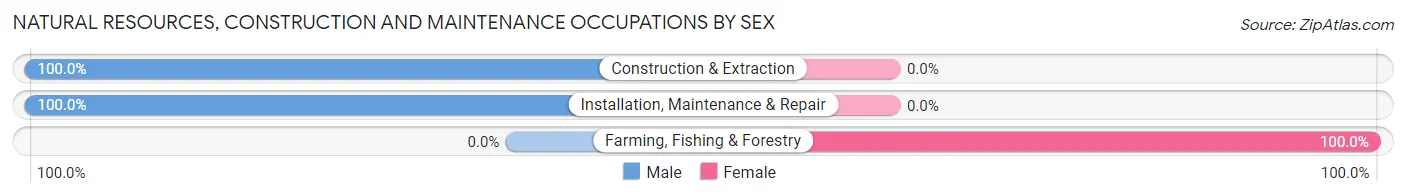
| Occupation | Male | Female |
| Farming, Fishing & Forestry | 0 (0.0%) | 7 (100.0%) |
| Construction & Extraction | 80 (100.0%) | 0 (0.0%) |
| Installation, Maintenance & Repair | 36 (100.0%) | 0 (0.0%) |
| Total (Category) | 116 (94.3%) | 7 (5.7%) |
| Total (Overall) | 654 (55.4%) | 527 (44.6%) |
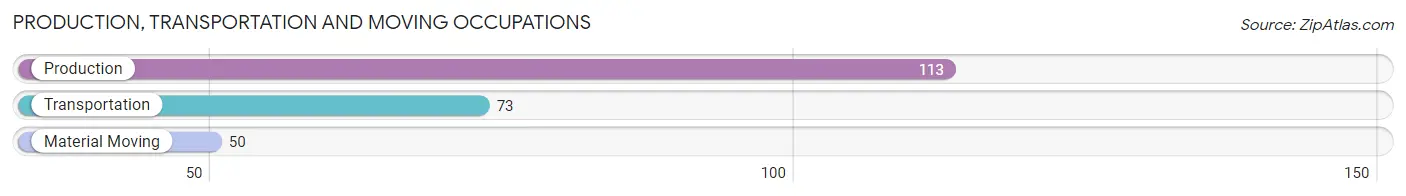
Production, Transportation and Moving Occupations
The most common Production, Transportation and Moving occupations in Windsor are Production (113 | 9.6%), Transportation (73 | 6.2%), and Material Moving (50 | 4.2%).
Production, Transportation and Moving Occupations by Sex
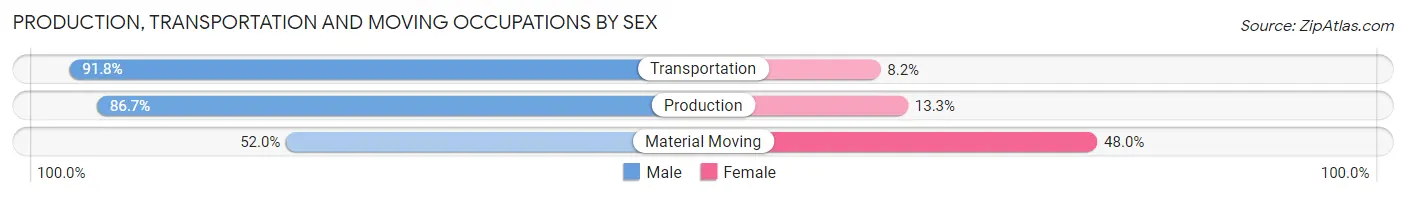
| Occupation | Male | Female |
| Production | 98 (86.7%) | 15 (13.3%) |
| Transportation | 67 (91.8%) | 6 (8.2%) |
| Material Moving | 26 (52.0%) | 24 (48.0%) |
| Total (Category) | 191 (80.9%) | 45 (19.1%) |
| Total (Overall) | 654 (55.4%) | 527 (44.6%) |
Employment Industries by Sex in Windsor
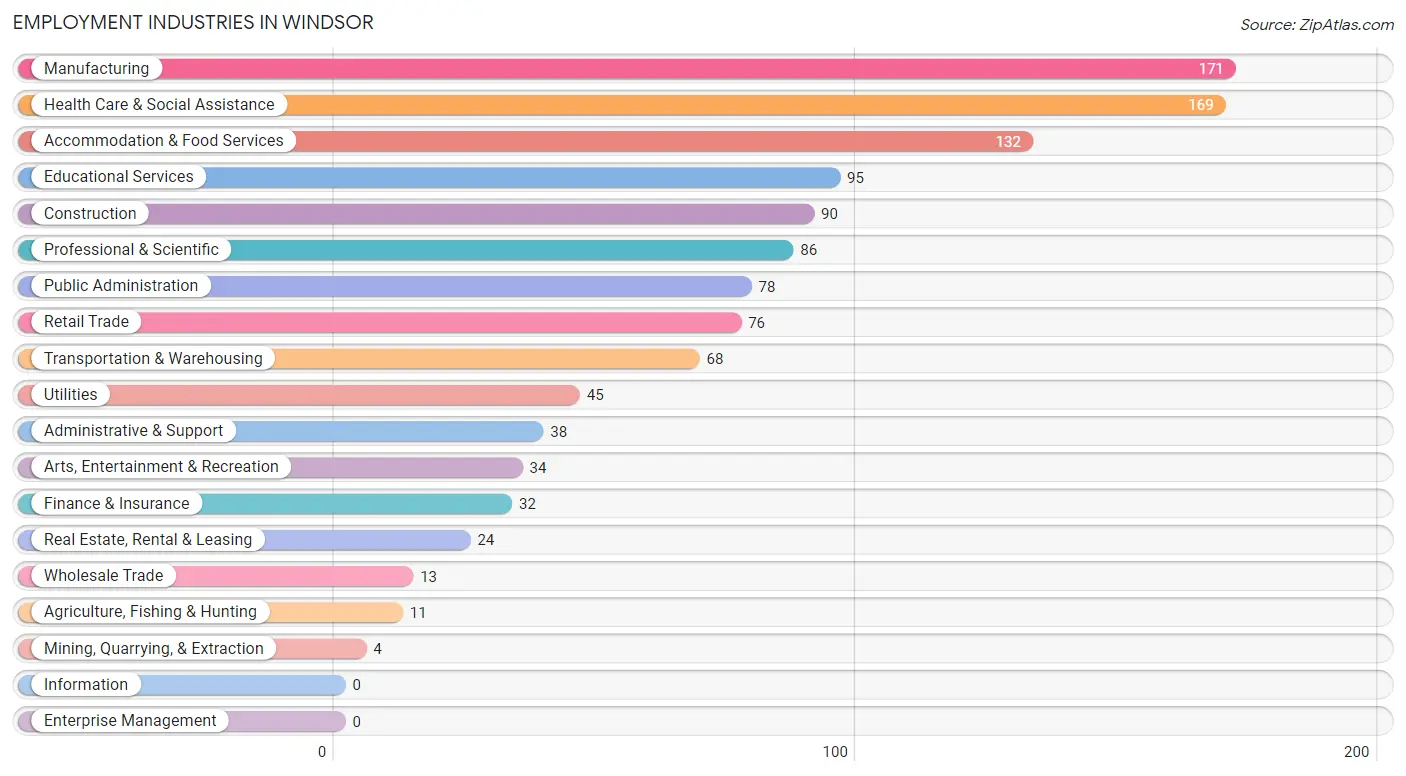
Employment Industries in Windsor
The major employment industries in Windsor include Manufacturing (171 | 14.5%), Health Care & Social Assistance (169 | 14.3%), Accommodation & Food Services (132 | 11.2%), Educational Services (95 | 8.0%), and Construction (90 | 7.6%).
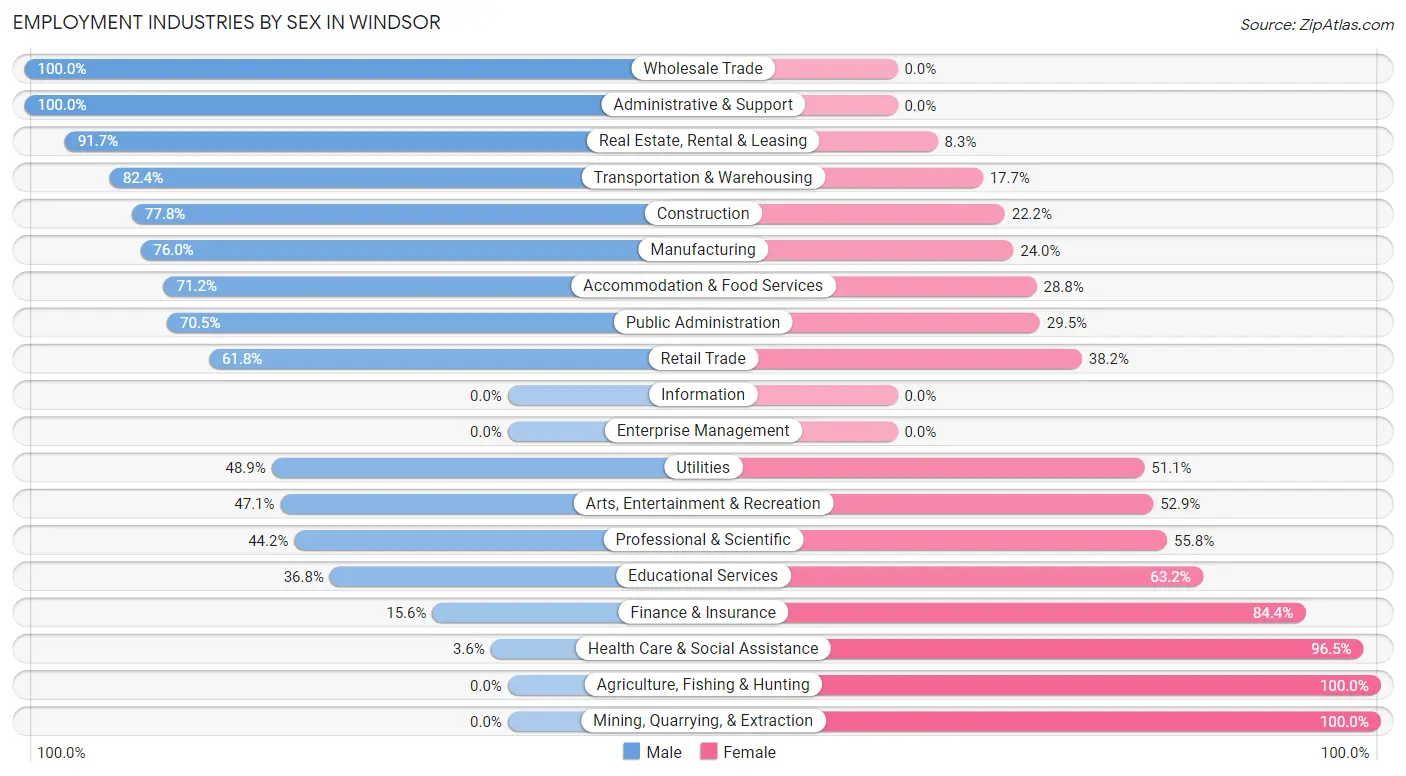
Employment Industries by Sex in Windsor
The Windsor industries that see more men than women are Wholesale Trade (100.0%), Administrative & Support (100.0%), and Real Estate, Rental & Leasing (91.7%), whereas the industries that tend to have a higher number of women are Agriculture, Fishing & Hunting (100.0%), Mining, Quarrying, & Extraction (100.0%), and Health Care & Social Assistance (96.5%).
| Industry | Male | Female |
| Agriculture, Fishing & Hunting | 0 (0.0%) | 11 (100.0%) |
| Mining, Quarrying, & Extraction | 0 (0.0%) | 4 (100.0%) |
| Construction | 70 (77.8%) | 20 (22.2%) |
| Manufacturing | 130 (76.0%) | 41 (24.0%) |
| Wholesale Trade | 13 (100.0%) | 0 (0.0%) |
| Retail Trade | 47 (61.8%) | 29 (38.2%) |
| Transportation & Warehousing | 56 (82.4%) | 12 (17.6%) |
| Utilities | 22 (48.9%) | 23 (51.1%) |
| Information | 0 (0.0%) | 0 (0.0%) |
| Finance & Insurance | 5 (15.6%) | 27 (84.4%) |
| Real Estate, Rental & Leasing | 22 (91.7%) | 2 (8.3%) |
| Professional & Scientific | 38 (44.2%) | 48 (55.8%) |
| Enterprise Management | 0 (0.0%) | 0 (0.0%) |
| Administrative & Support | 38 (100.0%) | 0 (0.0%) |
| Educational Services | 35 (36.8%) | 60 (63.2%) |
| Health Care & Social Assistance | 6 (3.5%) | 163 (96.5%) |
| Arts, Entertainment & Recreation | 16 (47.1%) | 18 (52.9%) |
| Accommodation & Food Services | 94 (71.2%) | 38 (28.8%) |
| Public Administration | 55 (70.5%) | 23 (29.5%) |
| Total | 654 (55.4%) | 527 (44.6%) |
Education in Windsor
School Enrollment in Windsor
The most common levels of schooling among the 550 students in Windsor are elementary school (141 | 25.6%), middle school (116 | 21.1%), and college / undergraduate (88 | 16.0%).
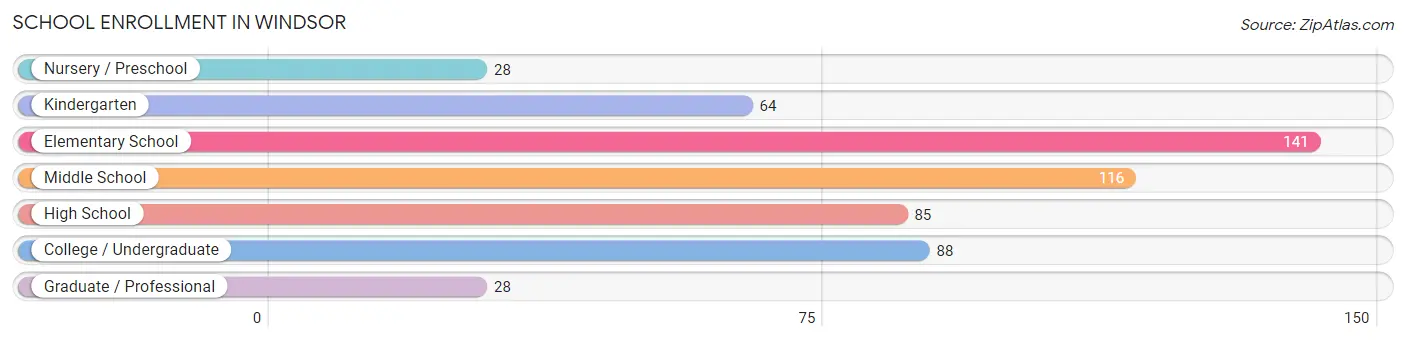
| School Level | # Students | % Students |
| Nursery / Preschool | 28 | 5.1% |
| Kindergarten | 64 | 11.6% |
| Elementary School | 141 | 25.6% |
| Middle School | 116 | 21.1% |
| High School | 85 | 15.4% |
| College / Undergraduate | 88 | 16.0% |
| Graduate / Professional | 28 | 5.1% |
| Total | 550 | 100.0% |
School Enrollment by Age by Funding Source in Windsor
Out of a total of 550 students who are enrolled in schools in Windsor, 93 (16.9%) attend a private institution, while the remaining 457 (83.1%) are enrolled in public schools. The age group of 18 to 19 year olds has the highest likelihood of being enrolled in private schools, with 22 (37.9% in the age bracket) enrolled. Conversely, the age group of 3 to 4 year olds has the lowest likelihood of being enrolled in a private school, with 15 (100.0% in the age bracket) attending a public institution.
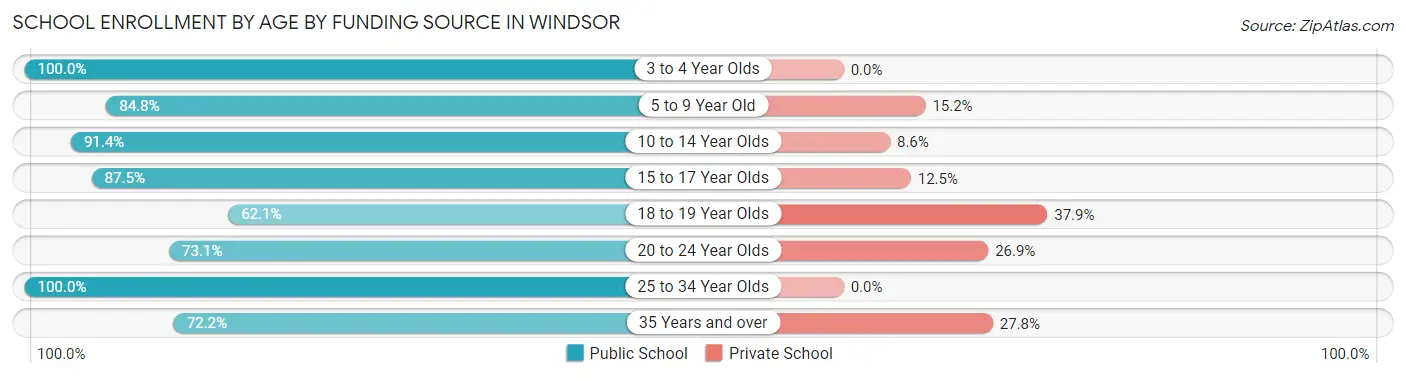
| Age Bracket | Public School | Private School |
| 3 to 4 Year Olds | 15 (100.0%) | 0 (0.0%) |
| 5 to 9 Year Old | 167 (84.8%) | 30 (15.2%) |
| 10 to 14 Year Olds | 148 (91.4%) | 14 (8.6%) |
| 15 to 17 Year Olds | 21 (87.5%) | 3 (12.5%) |
| 18 to 19 Year Olds | 36 (62.1%) | 22 (37.9%) |
| 20 to 24 Year Olds | 38 (73.1%) | 14 (26.9%) |
| 25 to 34 Year Olds | 6 (100.0%) | 0 (0.0%) |
| 35 Years and over | 26 (72.2%) | 10 (27.8%) |
| Total | 457 (83.1%) | 93 (16.9%) |
Educational Attainment by Field of Study in Windsor
Business (75 | 24.1%), psychology (39 | 12.5%), science & technology (38 | 12.2%), social sciences (37 | 11.9%), and literature & languages (30 | 9.7%) are the most common fields of study among 311 individuals in Windsor who have obtained a bachelor's degree or higher.
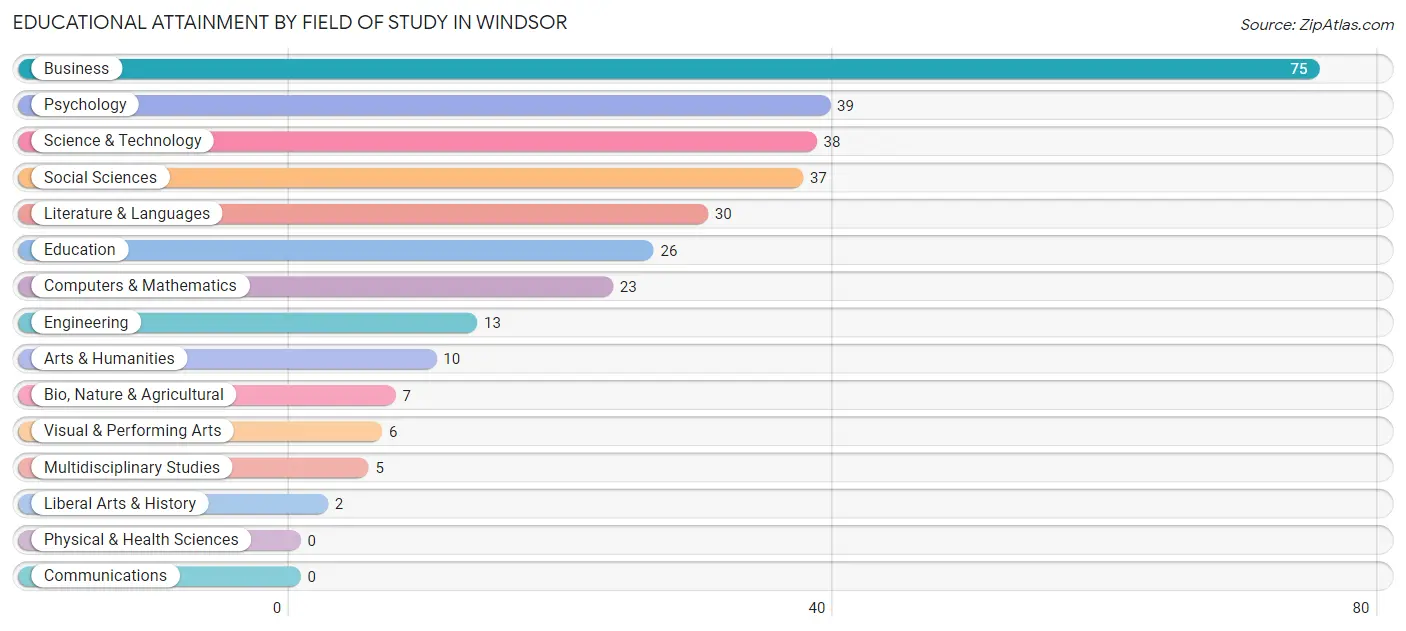
| Field of Study | # Graduates | % Graduates |
| Computers & Mathematics | 23 | 7.4% |
| Bio, Nature & Agricultural | 7 | 2.2% |
| Physical & Health Sciences | 0 | 0.0% |
| Psychology | 39 | 12.5% |
| Social Sciences | 37 | 11.9% |
| Engineering | 13 | 4.2% |
| Multidisciplinary Studies | 5 | 1.6% |
| Science & Technology | 38 | 12.2% |
| Business | 75 | 24.1% |
| Education | 26 | 8.4% |
| Literature & Languages | 30 | 9.7% |
| Liberal Arts & History | 2 | 0.6% |
| Visual & Performing Arts | 6 | 1.9% |
| Communications | 0 | 0.0% |
| Arts & Humanities | 10 | 3.2% |
| Total | 311 | 100.0% |
Transportation & Commute in Windsor
Vehicle Availability by Sex in Windsor
The most prevalent vehicle ownership categories in Windsor are males with 2 vehicles (210, accounting for 32.5%) and females with 2 vehicles (147, making up 40.2%).
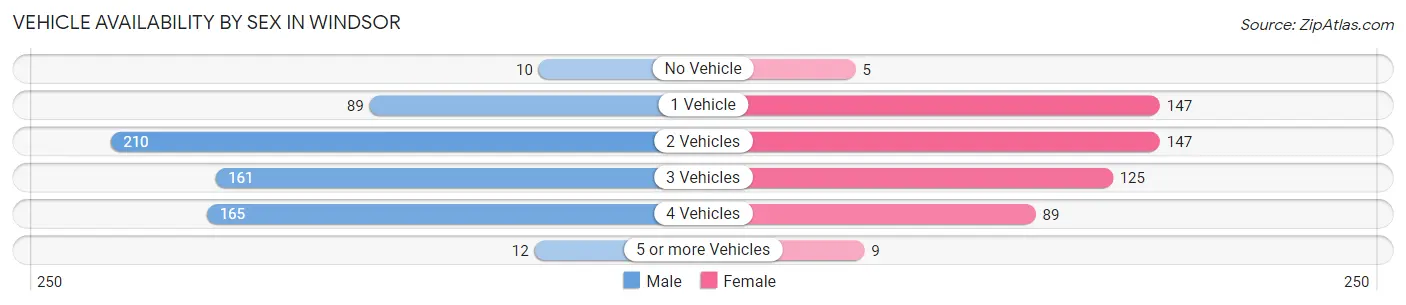
| Vehicles Available | Male | Female |
| No Vehicle | 10 (1.5%) | 5 (1.0%) |
| 1 Vehicle | 89 (13.8%) | 147 (28.2%) |
| 2 Vehicles | 210 (32.5%) | 147 (28.2%) |
| 3 Vehicles | 161 (24.9%) | 125 (23.9%) |
| 4 Vehicles | 165 (25.5%) | 89 (17.1%) |
| 5 or more Vehicles | 12 (1.8%) | 9 (1.7%) |
| Total | 647 (100.0%) | 522 (100.0%) |
Commute Time in Windsor
The most frequently occuring commute durations in Windsor are 45 to 59 minutes (219 commuters, 19.4%), 15 to 19 minutes (160 commuters, 14.2%), and 5 to 9 minutes (139 commuters, 12.3%).
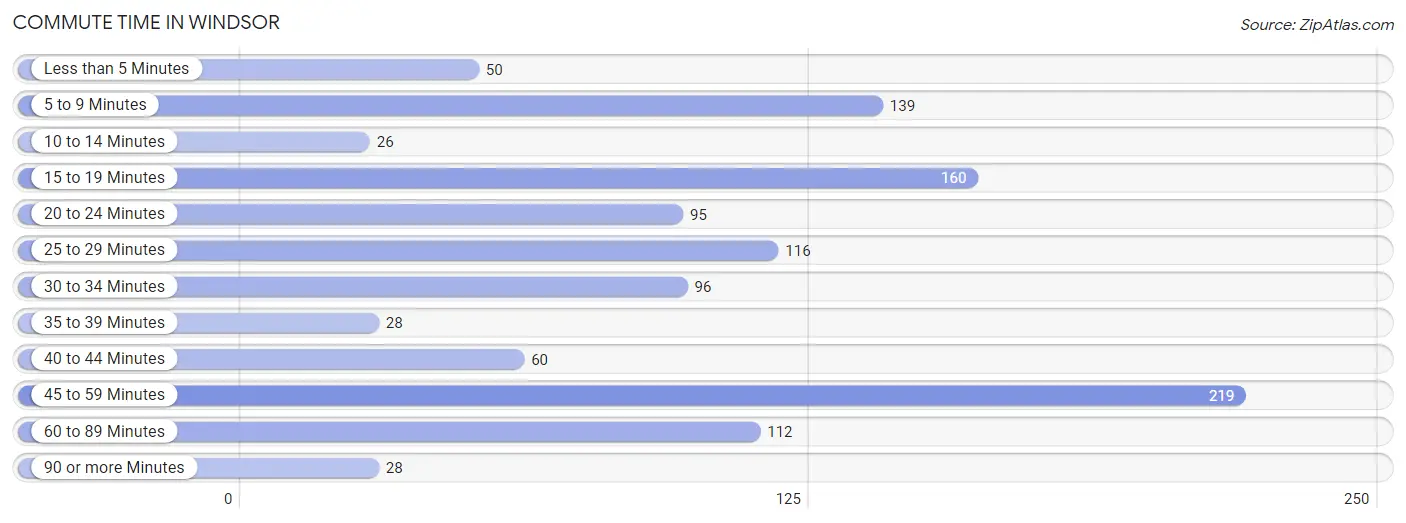
| Commute Time | # Commuters | % Commuters |
| Less than 5 Minutes | 50 | 4.4% |
| 5 to 9 Minutes | 139 | 12.3% |
| 10 to 14 Minutes | 26 | 2.3% |
| 15 to 19 Minutes | 160 | 14.2% |
| 20 to 24 Minutes | 95 | 8.4% |
| 25 to 29 Minutes | 116 | 10.3% |
| 30 to 34 Minutes | 96 | 8.5% |
| 35 to 39 Minutes | 28 | 2.5% |
| 40 to 44 Minutes | 60 | 5.3% |
| 45 to 59 Minutes | 219 | 19.4% |
| 60 to 89 Minutes | 112 | 9.9% |
| 90 or more Minutes | 28 | 2.5% |
Commute Time by Sex in Windsor
The most common commute times in Windsor are 45 to 59 minutes (121 commuters, 19.2%) for males and 45 to 59 minutes (98 commuters, 19.6%) for females.
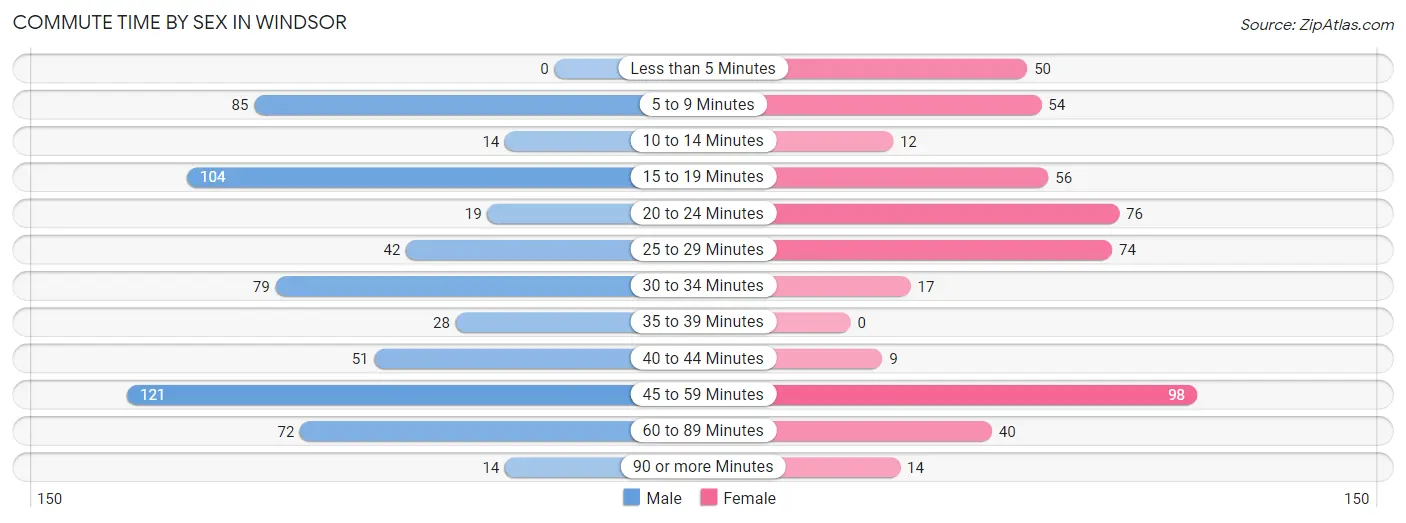
| Commute Time | Male | Female |
| Less than 5 Minutes | 0 (0.0%) | 50 (10.0%) |
| 5 to 9 Minutes | 85 (13.5%) | 54 (10.8%) |
| 10 to 14 Minutes | 14 (2.2%) | 12 (2.4%) |
| 15 to 19 Minutes | 104 (16.5%) | 56 (11.2%) |
| 20 to 24 Minutes | 19 (3.0%) | 76 (15.2%) |
| 25 to 29 Minutes | 42 (6.7%) | 74 (14.8%) |
| 30 to 34 Minutes | 79 (12.6%) | 17 (3.4%) |
| 35 to 39 Minutes | 28 (4.4%) | 0 (0.0%) |
| 40 to 44 Minutes | 51 (8.1%) | 9 (1.8%) |
| 45 to 59 Minutes | 121 (19.2%) | 98 (19.6%) |
| 60 to 89 Minutes | 72 (11.5%) | 40 (8.0%) |
| 90 or more Minutes | 14 (2.2%) | 14 (2.8%) |
Time of Departure to Work by Sex in Windsor
The most frequent times of departure to work in Windsor are 5:30 AM to 5:59 AM (99, 15.7%) for males and 7:00 AM to 7:29 AM (118, 23.6%) for females.
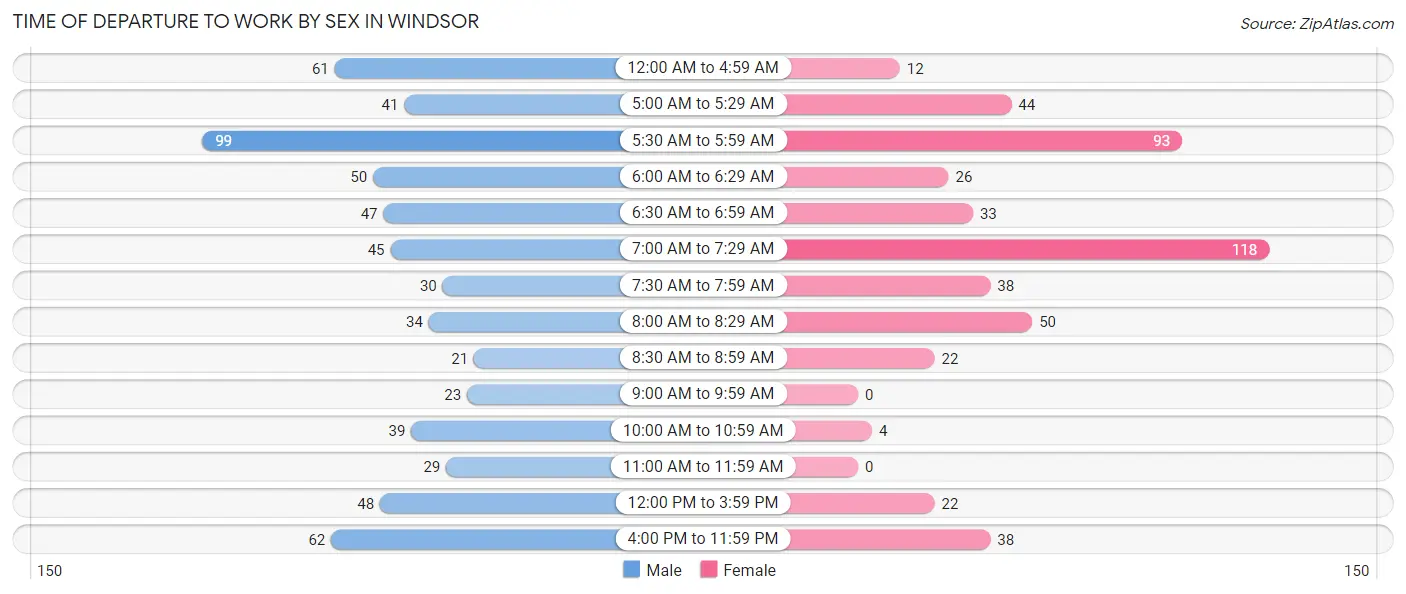
| Time of Departure | Male | Female |
| 12:00 AM to 4:59 AM | 61 (9.7%) | 12 (2.4%) |
| 5:00 AM to 5:29 AM | 41 (6.5%) | 44 (8.8%) |
| 5:30 AM to 5:59 AM | 99 (15.7%) | 93 (18.6%) |
| 6:00 AM to 6:29 AM | 50 (8.0%) | 26 (5.2%) |
| 6:30 AM to 6:59 AM | 47 (7.5%) | 33 (6.6%) |
| 7:00 AM to 7:29 AM | 45 (7.1%) | 118 (23.6%) |
| 7:30 AM to 7:59 AM | 30 (4.8%) | 38 (7.6%) |
| 8:00 AM to 8:29 AM | 34 (5.4%) | 50 (10.0%) |
| 8:30 AM to 8:59 AM | 21 (3.3%) | 22 (4.4%) |
| 9:00 AM to 9:59 AM | 23 (3.7%) | 0 (0.0%) |
| 10:00 AM to 10:59 AM | 39 (6.2%) | 4 (0.8%) |
| 11:00 AM to 11:59 AM | 29 (4.6%) | 0 (0.0%) |
| 12:00 PM to 3:59 PM | 48 (7.6%) | 22 (4.4%) |
| 4:00 PM to 11:59 PM | 62 (9.9%) | 38 (7.6%) |
| Total | 629 (100.0%) | 500 (100.0%) |
Housing Occupancy in Windsor
Occupancy by Ownership in Windsor
Of the total 1,076 dwellings in Windsor, owner-occupied units account for 904 (84.0%), while renter-occupied units make up 172 (16.0%).
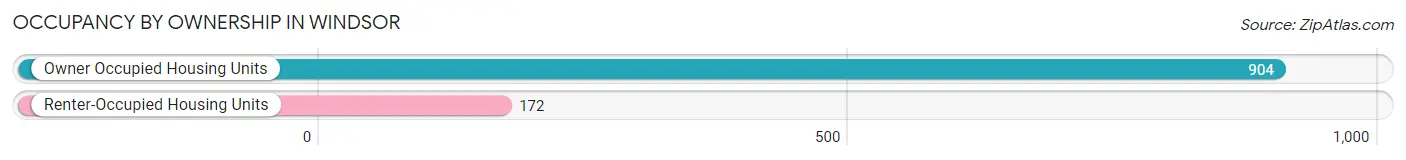
| Occupancy | # Housing Units | % Housing Units |
| Owner Occupied Housing Units | 904 | 84.0% |
| Renter-Occupied Housing Units | 172 | 16.0% |
| Total Occupied Housing Units | 1,076 | 100.0% |
Occupancy by Household Size in Windsor
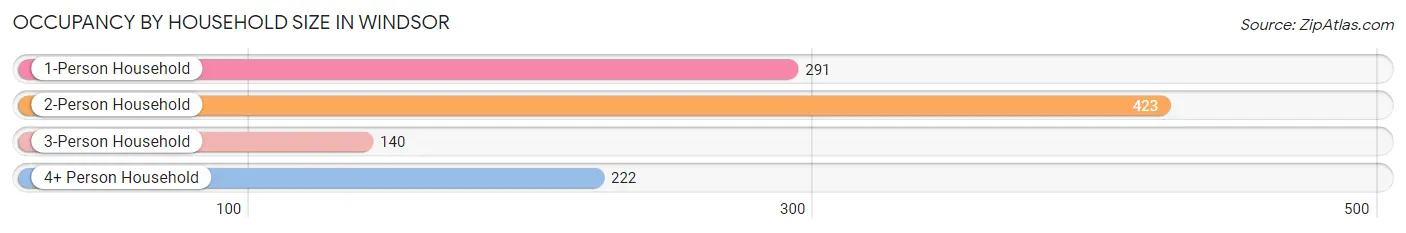
| Household Size | # Housing Units | % Housing Units |
| 1-Person Household | 291 | 27.0% |
| 2-Person Household | 423 | 39.3% |
| 3-Person Household | 140 | 13.0% |
| 4+ Person Household | 222 | 20.6% |
| Total Housing Units | 1,076 | 100.0% |
Occupancy by Ownership by Household Size in Windsor
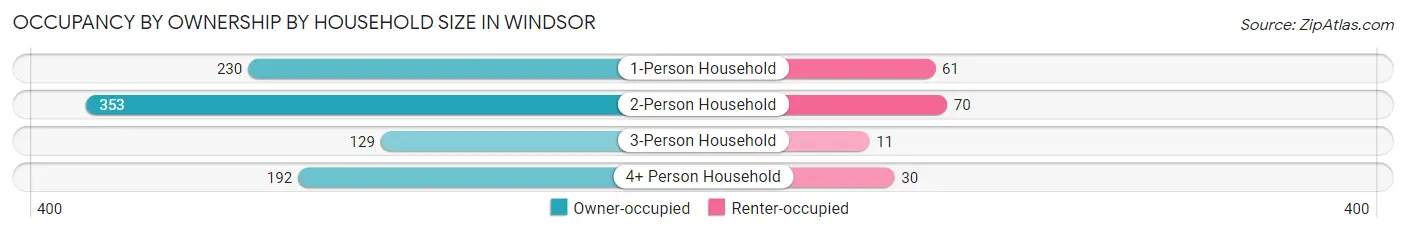
| Household Size | Owner-occupied | Renter-occupied |
| 1-Person Household | 230 (79.0%) | 61 (21.0%) |
| 2-Person Household | 353 (83.5%) | 70 (16.6%) |
| 3-Person Household | 129 (92.1%) | 11 (7.9%) |
| 4+ Person Household | 192 (86.5%) | 30 (13.5%) |
| Total Housing Units | 904 (84.0%) | 172 (16.0%) |
Occupancy by Educational Attainment in Windsor
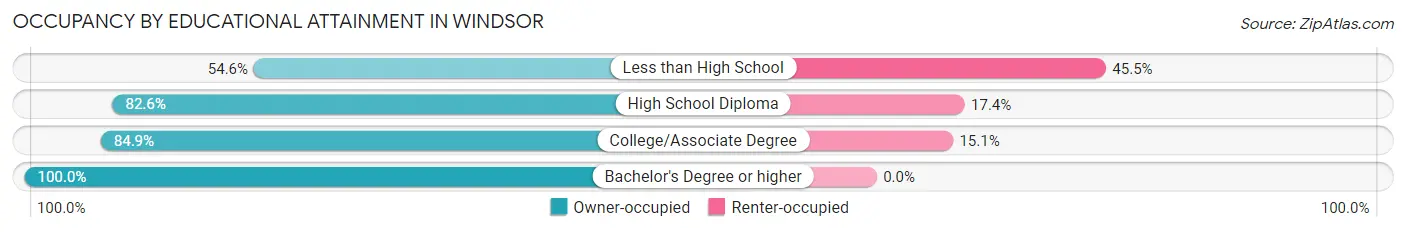
| Household Size | Owner-occupied | Renter-occupied |
| Less than High School | 48 (54.5%) | 40 (45.5%) |
| High School Diploma | 284 (82.6%) | 60 (17.4%) |
| College/Associate Degree | 404 (84.9%) | 72 (15.1%) |
| Bachelor's Degree or higher | 168 (100.0%) | 0 (0.0%) |
Occupancy by Age of Householder in Windsor
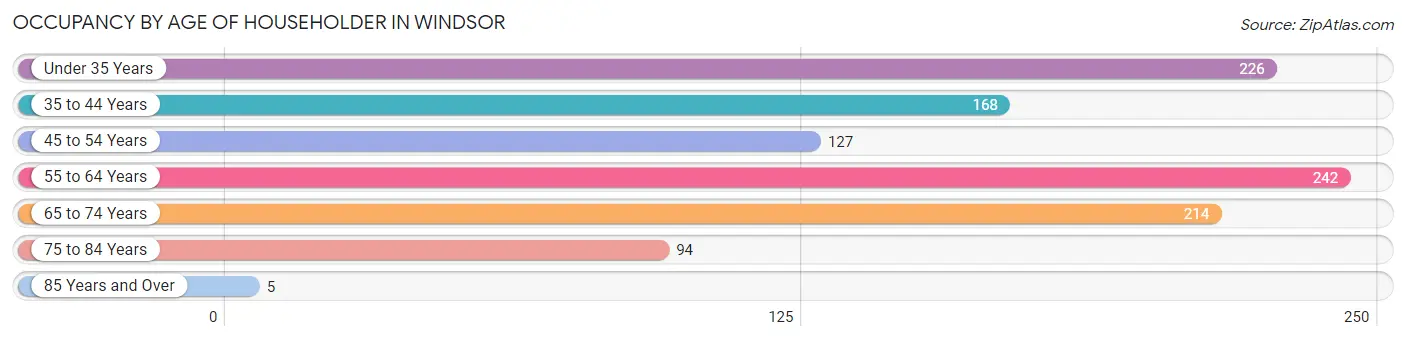
| Age Bracket | # Households | % Households |
| Under 35 Years | 226 | 21.0% |
| 35 to 44 Years | 168 | 15.6% |
| 45 to 54 Years | 127 | 11.8% |
| 55 to 64 Years | 242 | 22.5% |
| 65 to 74 Years | 214 | 19.9% |
| 75 to 84 Years | 94 | 8.7% |
| 85 Years and Over | 5 | 0.5% |
| Total | 1,076 | 100.0% |
Housing Finances in Windsor
Median Income by Occupancy in Windsor
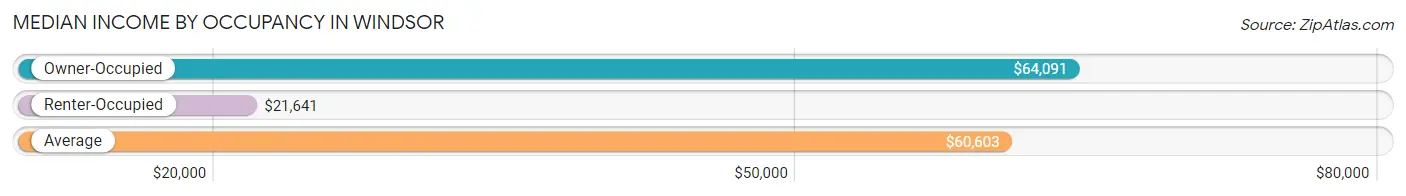
| Occupancy Type | # Households | Median Income |
| Owner-Occupied | 904 (84.0%) | $64,091 |
| Renter-Occupied | 172 (16.0%) | $21,641 |
| Average | 1,076 (100.0%) | $60,603 |
Occupancy by Householder Income Bracket in Windsor
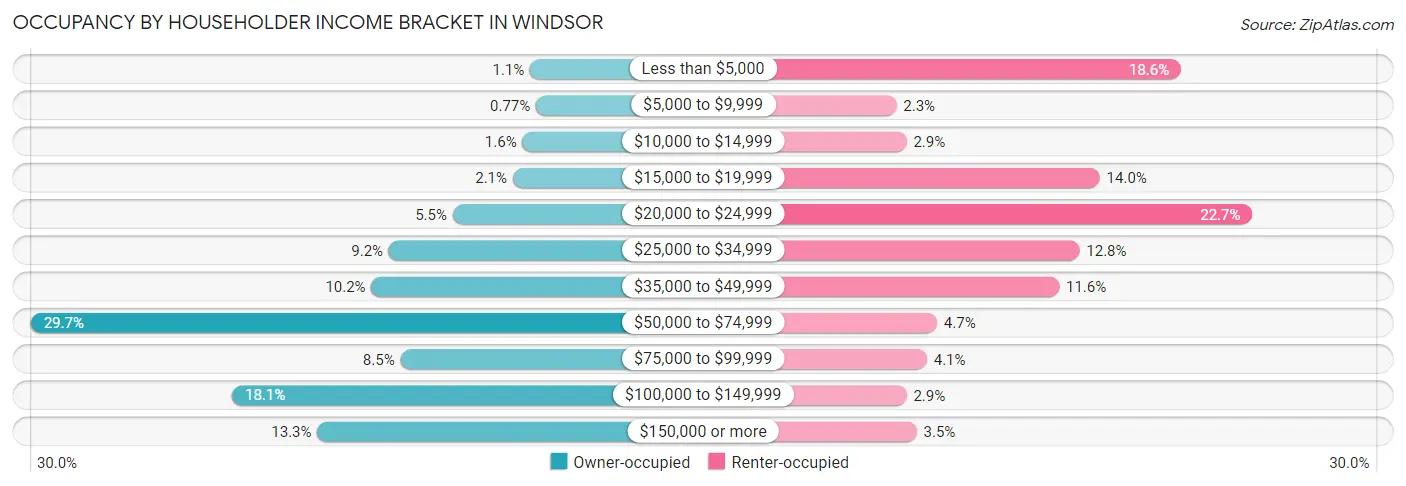
| Income Bracket | Owner-occupied | Renter-occupied |
| Less than $5,000 | 10 (1.1%) | 32 (18.6%) |
| $5,000 to $9,999 | 7 (0.8%) | 4 (2.3%) |
| $10,000 to $14,999 | 14 (1.5%) | 5 (2.9%) |
| $15,000 to $19,999 | 19 (2.1%) | 24 (14.0%) |
| $20,000 to $24,999 | 50 (5.5%) | 39 (22.7%) |
| $25,000 to $34,999 | 83 (9.2%) | 22 (12.8%) |
| $35,000 to $49,999 | 92 (10.2%) | 20 (11.6%) |
| $50,000 to $74,999 | 268 (29.6%) | 8 (4.6%) |
| $75,000 to $99,999 | 77 (8.5%) | 7 (4.1%) |
| $100,000 to $149,999 | 164 (18.1%) | 5 (2.9%) |
| $150,000 or more | 120 (13.3%) | 6 (3.5%) |
| Total | 904 (100.0%) | 172 (100.0%) |
Monthly Housing Cost Tiers in Windsor
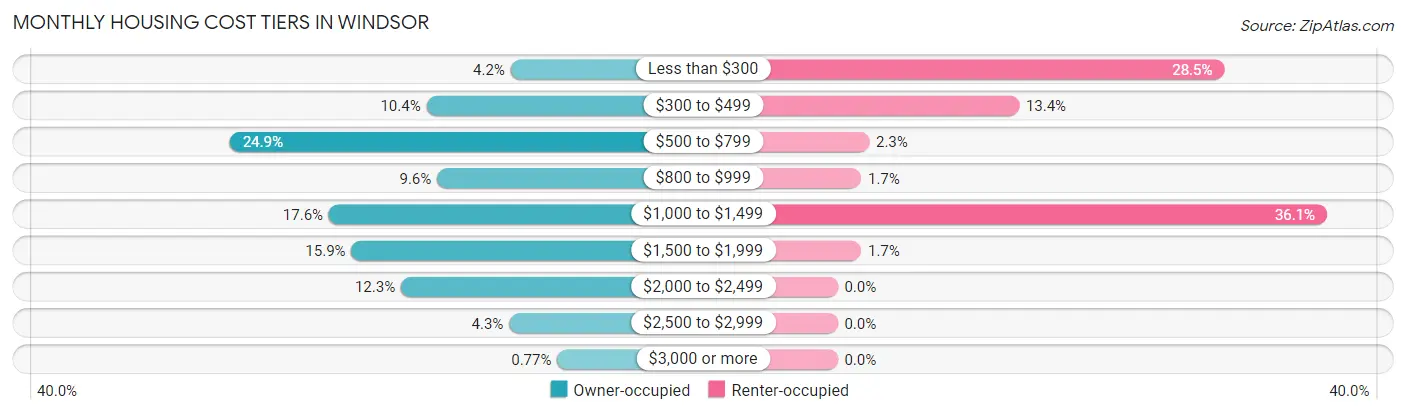
| Monthly Cost | Owner-occupied | Renter-occupied |
| Less than $300 | 38 (4.2%) | 49 (28.5%) |
| $300 to $499 | 94 (10.4%) | 23 (13.4%) |
| $500 to $799 | 225 (24.9%) | 4 (2.3%) |
| $800 to $999 | 87 (9.6%) | 3 (1.7%) |
| $1,000 to $1,499 | 159 (17.6%) | 62 (36.0%) |
| $1,500 to $1,999 | 144 (15.9%) | 3 (1.7%) |
| $2,000 to $2,499 | 111 (12.3%) | 0 (0.0%) |
| $2,500 to $2,999 | 39 (4.3%) | 0 (0.0%) |
| $3,000 or more | 7 (0.8%) | 0 (0.0%) |
| Total | 904 (100.0%) | 172 (100.0%) |
Physical Housing Characteristics in Windsor
Housing Structures in Windsor
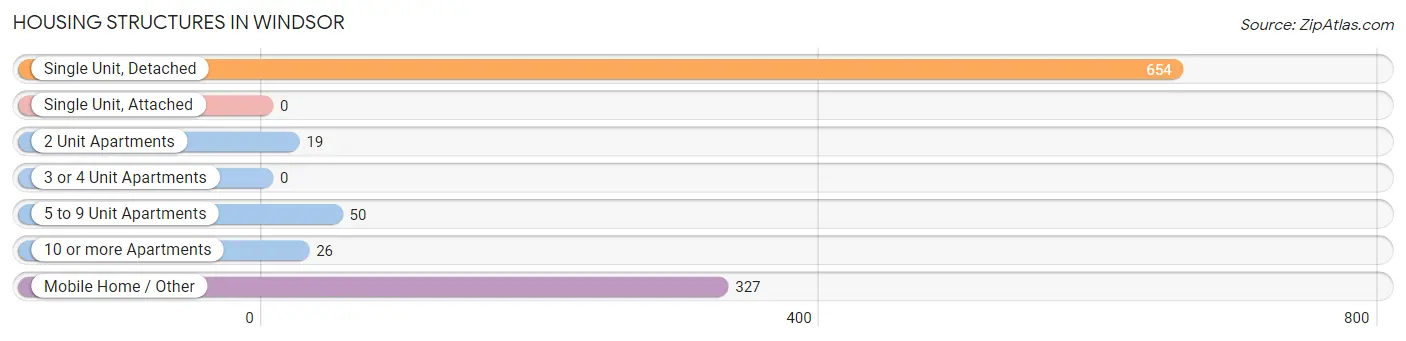
| Structure Type | # Housing Units | % Housing Units |
| Single Unit, Detached | 654 | 60.8% |
| Single Unit, Attached | 0 | 0.0% |
| 2 Unit Apartments | 19 | 1.8% |
| 3 or 4 Unit Apartments | 0 | 0.0% |
| 5 to 9 Unit Apartments | 50 | 4.6% |
| 10 or more Apartments | 26 | 2.4% |
| Mobile Home / Other | 327 | 30.4% |
| Total | 1,076 | 100.0% |
Housing Structures by Occupancy in Windsor
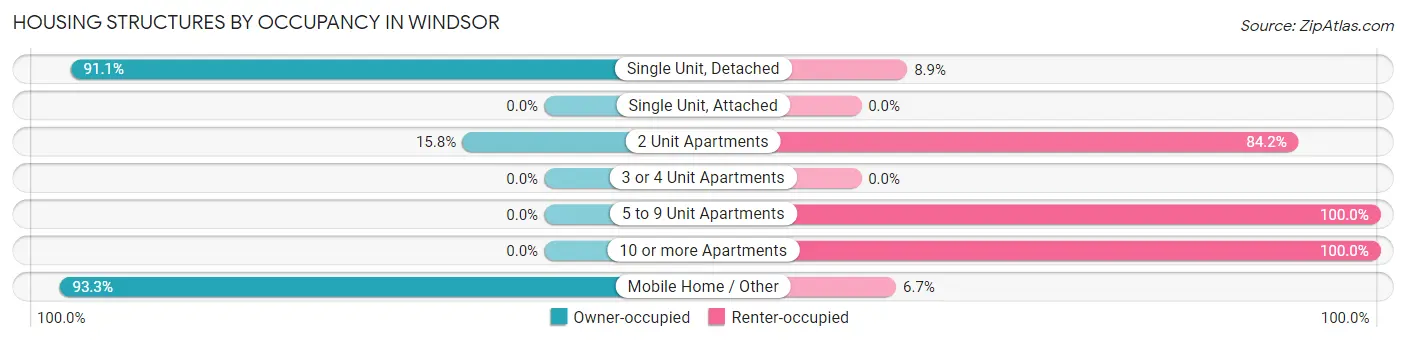
| Structure Type | Owner-occupied | Renter-occupied |
| Single Unit, Detached | 596 (91.1%) | 58 (8.9%) |
| Single Unit, Attached | 0 (0.0%) | 0 (0.0%) |
| 2 Unit Apartments | 3 (15.8%) | 16 (84.2%) |
| 3 or 4 Unit Apartments | 0 (0.0%) | 0 (0.0%) |
| 5 to 9 Unit Apartments | 0 (0.0%) | 50 (100.0%) |
| 10 or more Apartments | 0 (0.0%) | 26 (100.0%) |
| Mobile Home / Other | 305 (93.3%) | 22 (6.7%) |
| Total | 904 (84.0%) | 172 (16.0%) |
Housing Structures by Number of Rooms in Windsor
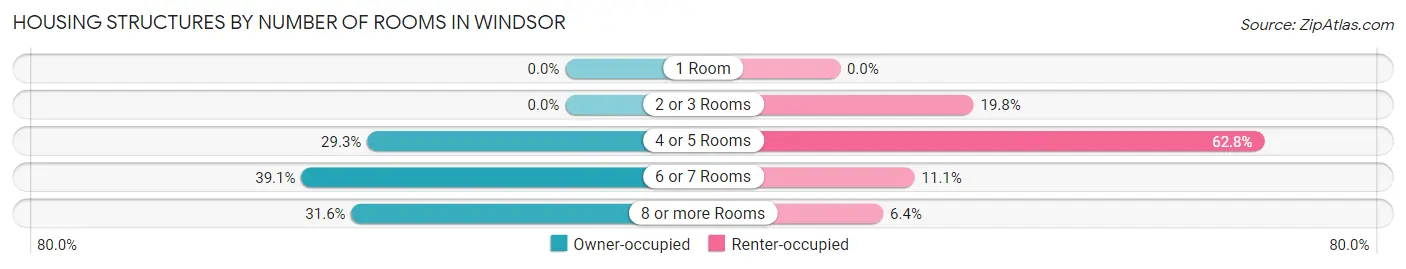
| Number of Rooms | Owner-occupied | Renter-occupied |
| 1 Room | 0 (0.0%) | 0 (0.0%) |
| 2 or 3 Rooms | 0 (0.0%) | 34 (19.8%) |
| 4 or 5 Rooms | 265 (29.3%) | 108 (62.8%) |
| 6 or 7 Rooms | 353 (39.1%) | 19 (11.1%) |
| 8 or more Rooms | 286 (31.6%) | 11 (6.4%) |
| Total | 904 (100.0%) | 172 (100.0%) |
Housing Structure by Heating Type in Windsor
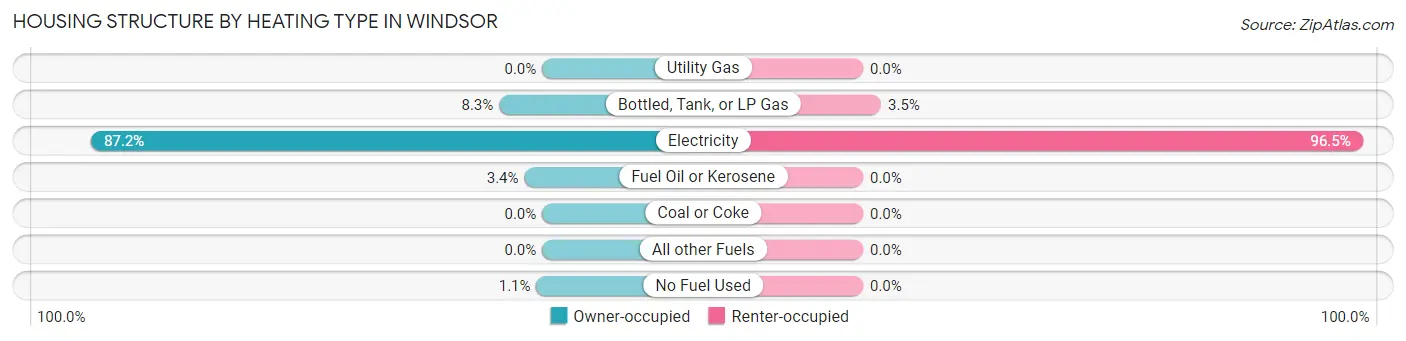
| Heating Type | Owner-occupied | Renter-occupied |
| Utility Gas | 0 (0.0%) | 0 (0.0%) |
| Bottled, Tank, or LP Gas | 75 (8.3%) | 6 (3.5%) |
| Electricity | 788 (87.2%) | 166 (96.5%) |
| Fuel Oil or Kerosene | 31 (3.4%) | 0 (0.0%) |
| Coal or Coke | 0 (0.0%) | 0 (0.0%) |
| All other Fuels | 0 (0.0%) | 0 (0.0%) |
| No Fuel Used | 10 (1.1%) | 0 (0.0%) |
| Total | 904 (100.0%) | 172 (100.0%) |
Household Vehicle Usage in Windsor
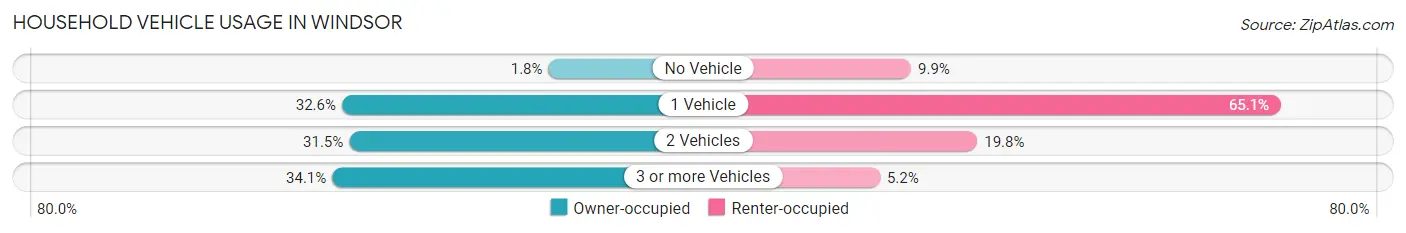
| Vehicles per Household | Owner-occupied | Renter-occupied |
| No Vehicle | 16 (1.8%) | 17 (9.9%) |
| 1 Vehicle | 295 (32.6%) | 112 (65.1%) |
| 2 Vehicles | 285 (31.5%) | 34 (19.8%) |
| 3 or more Vehicles | 308 (34.1%) | 9 (5.2%) |
| Total | 904 (100.0%) | 172 (100.0%) |
Real Estate & Mortgages in Windsor
Real Estate and Mortgage Overview in Windsor
| Characteristic | Without Mortgage | With Mortgage |
| Housing Units | 411 | 493 |
| Median Property Value | - | - |
| Median Household Income | $52,688 | $102 |
| Monthly Housing Costs | $630 | $7 |
| Real Estate Taxes | $1,793 | $43 |
Property Value by Mortgage Status in Windsor
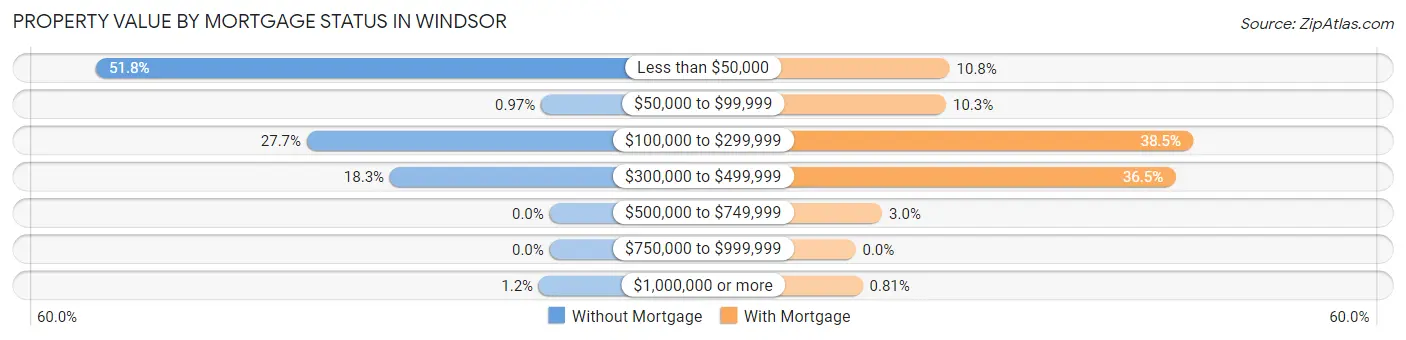
| Property Value | Without Mortgage | With Mortgage |
| Less than $50,000 | 213 (51.8%) | 53 (10.7%) |
| $50,000 to $99,999 | 4 (1.0%) | 51 (10.3%) |
| $100,000 to $299,999 | 114 (27.7%) | 190 (38.5%) |
| $300,000 to $499,999 | 75 (18.2%) | 180 (36.5%) |
| $500,000 to $749,999 | 0 (0.0%) | 15 (3.0%) |
| $750,000 to $999,999 | 0 (0.0%) | 0 (0.0%) |
| $1,000,000 or more | 5 (1.2%) | 4 (0.8%) |
| Total | 411 (100.0%) | 493 (100.0%) |
Household Income by Mortgage Status in Windsor
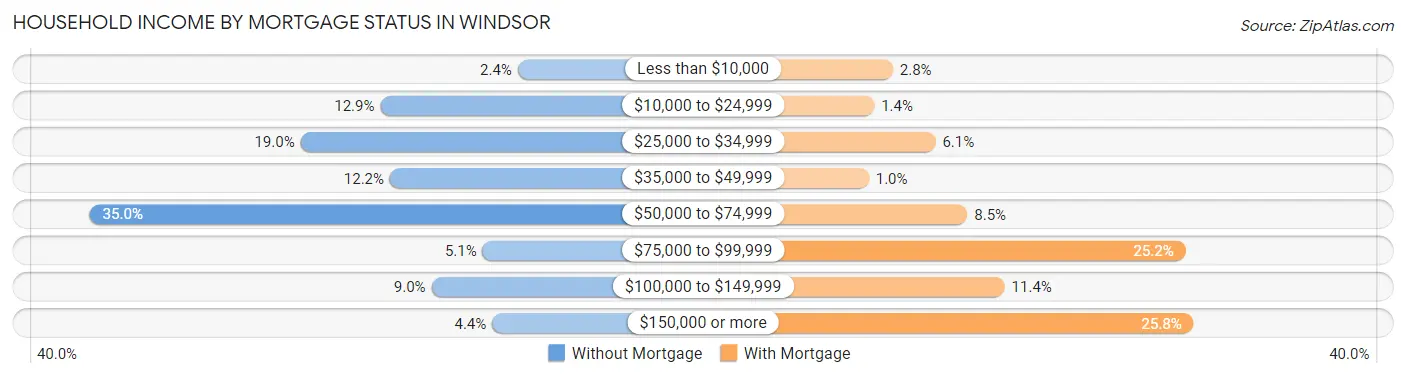
| Household Income | Without Mortgage | With Mortgage |
| Less than $10,000 | 10 (2.4%) | 14 (2.8%) |
| $10,000 to $24,999 | 53 (12.9%) | 7 (1.4%) |
| $25,000 to $34,999 | 78 (19.0%) | 30 (6.1%) |
| $35,000 to $49,999 | 50 (12.2%) | 5 (1.0%) |
| $50,000 to $74,999 | 144 (35.0%) | 42 (8.5%) |
| $75,000 to $99,999 | 21 (5.1%) | 124 (25.2%) |
| $100,000 to $149,999 | 37 (9.0%) | 56 (11.4%) |
| $150,000 or more | 18 (4.4%) | 127 (25.8%) |
| Total | 411 (100.0%) | 493 (100.0%) |
Property Value to Household Income Ratio in Windsor
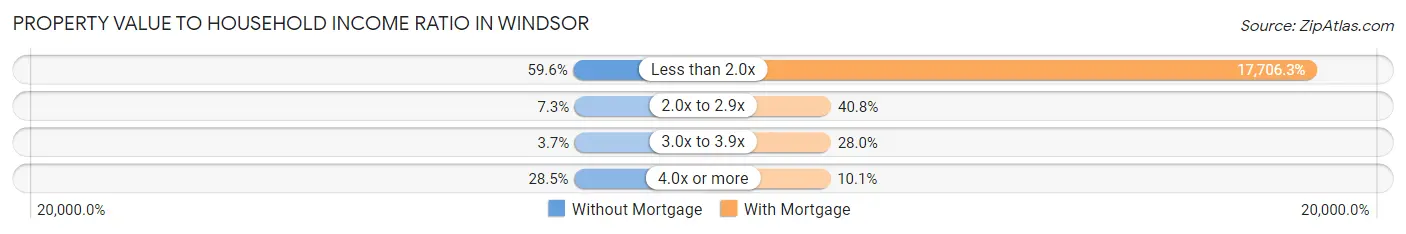
| Value-to-Income Ratio | Without Mortgage | With Mortgage |
| Less than 2.0x | 245 (59.6%) | 87,292 (17,706.3%) |
| 2.0x to 2.9x | 30 (7.3%) | 201 (40.8%) |
| 3.0x to 3.9x | 15 (3.6%) | 138 (28.0%) |
| 4.0x or more | 117 (28.5%) | 50 (10.1%) |
| Total | 411 (100.0%) | 493 (100.0%) |
Real Estate Taxes by Mortgage Status in Windsor
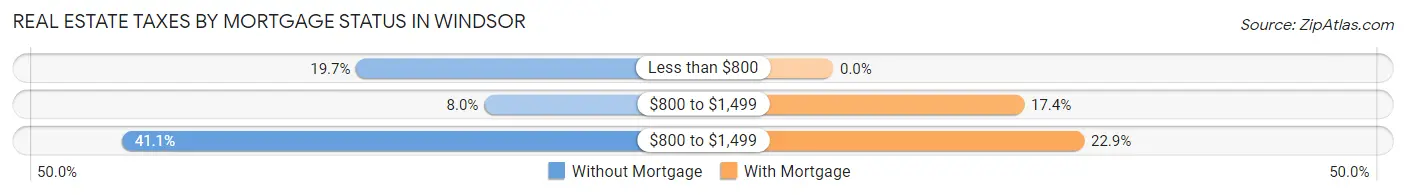
| Property Taxes | Without Mortgage | With Mortgage |
| Less than $800 | 81 (19.7%) | 0 (0.0%) |
| $800 to $1,499 | 33 (8.0%) | 86 (17.4%) |
| $800 to $1,499 | 169 (41.1%) | 113 (22.9%) |
| Total | 411 (100.0%) | 493 (100.0%) |
Health & Disability in Windsor
Health Insurance Coverage by Age in Windsor
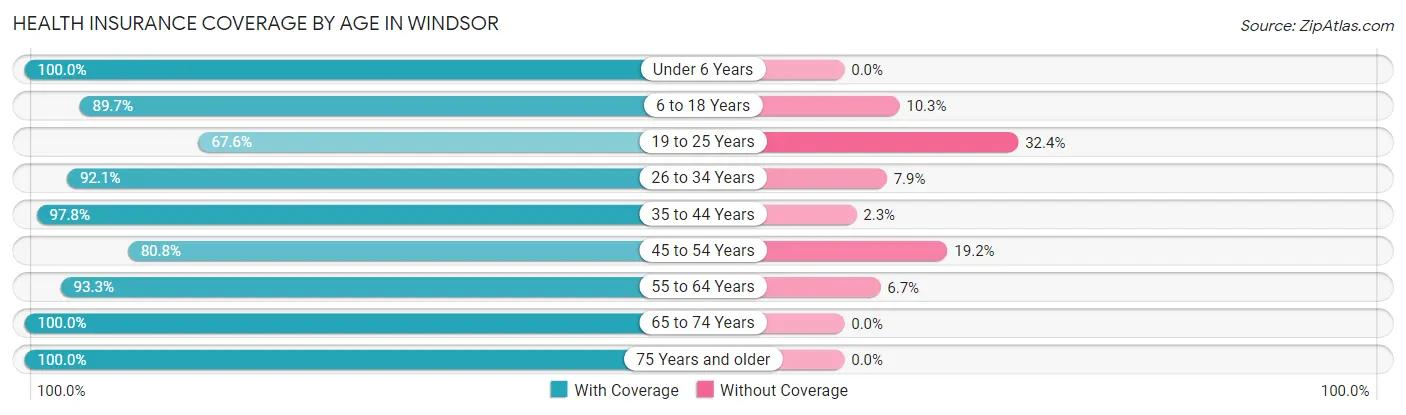
| Age Bracket | With Coverage | Without Coverage |
| Under 6 Years | 310 (100.0%) | 0 (0.0%) |
| 6 to 18 Years | 341 (89.7%) | 39 (10.3%) |
| 19 to 25 Years | 152 (67.6%) | 73 (32.4%) |
| 26 to 34 Years | 198 (92.1%) | 17 (7.9%) |
| 35 to 44 Years | 304 (97.8%) | 7 (2.2%) |
| 45 to 54 Years | 252 (80.8%) | 60 (19.2%) |
| 55 to 64 Years | 388 (93.3%) | 28 (6.7%) |
| 65 to 74 Years | 315 (100.0%) | 0 (0.0%) |
| 75 Years and older | 138 (100.0%) | 0 (0.0%) |
| Total | 2,398 (91.5%) | 224 (8.5%) |
Health Insurance Coverage by Citizenship Status in Windsor
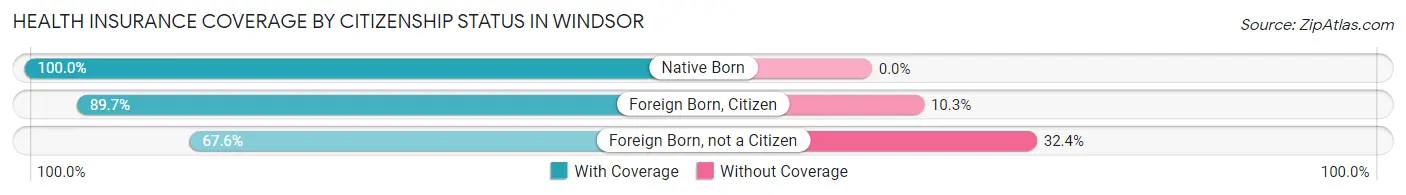
| Citizenship Status | With Coverage | Without Coverage |
| Native Born | 310 (100.0%) | 0 (0.0%) |
| Foreign Born, Citizen | 341 (89.7%) | 39 (10.3%) |
| Foreign Born, not a Citizen | 152 (67.6%) | 73 (32.4%) |
Health Insurance Coverage by Household Income in Windsor
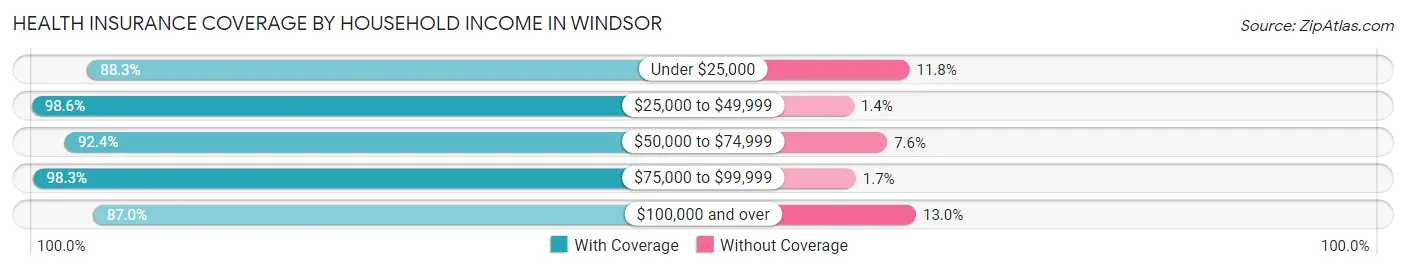
| Household Income | With Coverage | Without Coverage |
| Under $25,000 | 308 (88.2%) | 41 (11.7%) |
| $25,000 to $49,999 | 434 (98.6%) | 6 (1.4%) |
| $50,000 to $74,999 | 586 (92.4%) | 48 (7.6%) |
| $75,000 to $99,999 | 231 (98.3%) | 4 (1.7%) |
| $100,000 and over | 839 (87.0%) | 125 (13.0%) |
Public vs Private Health Insurance Coverage by Age in Windsor
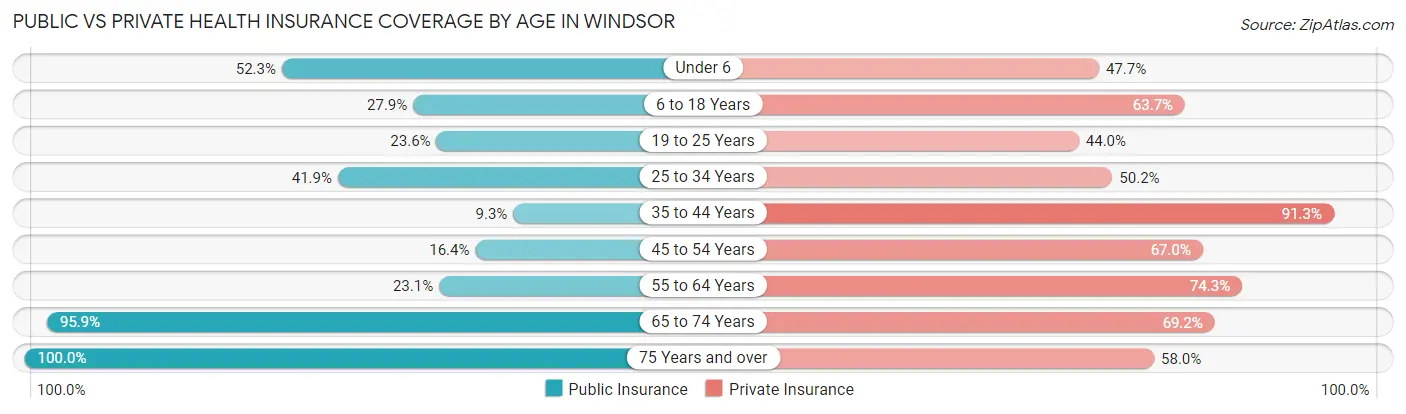
| Age Bracket | Public Insurance | Private Insurance |
| Under 6 | 162 (52.3%) | 148 (47.7%) |
| 6 to 18 Years | 106 (27.9%) | 242 (63.7%) |
| 19 to 25 Years | 53 (23.6%) | 99 (44.0%) |
| 25 to 34 Years | 90 (41.9%) | 108 (50.2%) |
| 35 to 44 Years | 29 (9.3%) | 284 (91.3%) |
| 45 to 54 Years | 51 (16.4%) | 209 (67.0%) |
| 55 to 64 Years | 96 (23.1%) | 309 (74.3%) |
| 65 to 74 Years | 302 (95.9%) | 218 (69.2%) |
| 75 Years and over | 138 (100.0%) | 80 (58.0%) |
| Total | 1,027 (39.2%) | 1,697 (64.7%) |
Disability Status by Sex by Age in Windsor
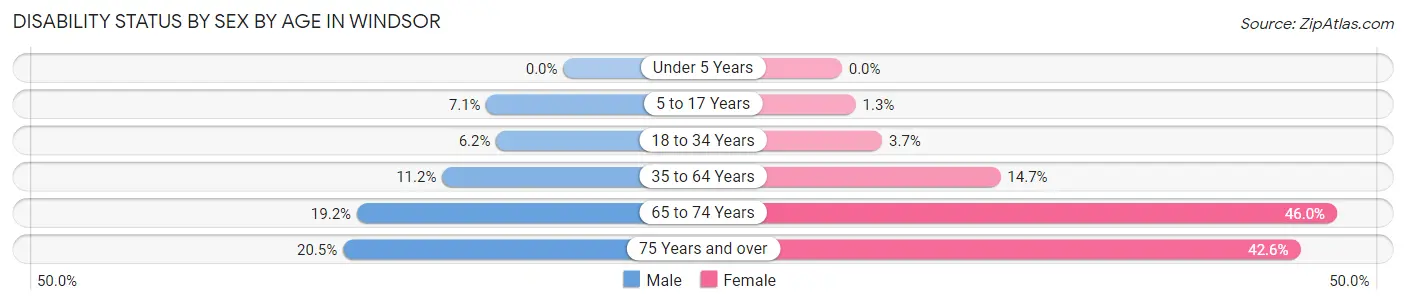
| Age Bracket | Male | Female |
| Under 5 Years | 0 (0.0%) | 0 (0.0%) |
| 5 to 17 Years | 17 (7.1%) | 2 (1.3%) |
| 18 to 34 Years | 12 (6.2%) | 11 (3.7%) |
| 35 to 64 Years | 58 (11.2%) | 77 (14.7%) |
| 65 to 74 Years | 32 (19.2%) | 68 (46.0%) |
| 75 Years and over | 9 (20.4%) | 40 (42.5%) |
Disability Class by Sex by Age in Windsor
Disability Class: Hearing Difficulty
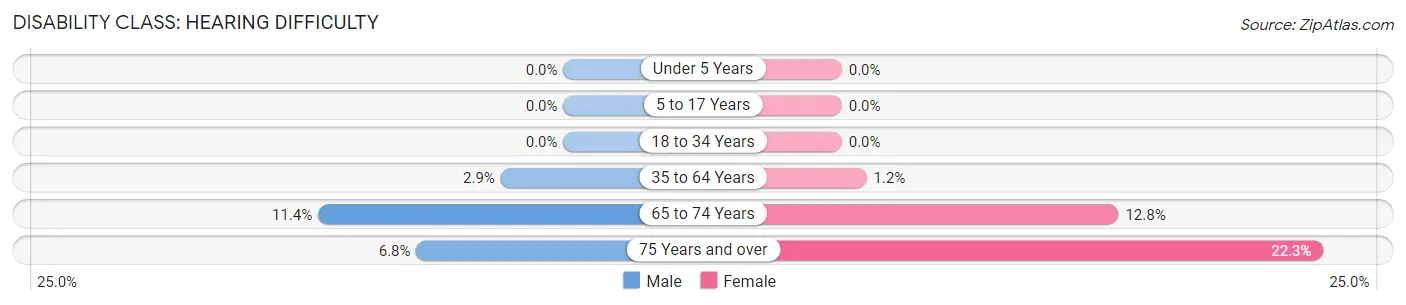
| Age Bracket | Male | Female |
| Under 5 Years | 0 (0.0%) | 0 (0.0%) |
| 5 to 17 Years | 0 (0.0%) | 0 (0.0%) |
| 18 to 34 Years | 0 (0.0%) | 0 (0.0%) |
| 35 to 64 Years | 15 (2.9%) | 6 (1.1%) |
| 65 to 74 Years | 19 (11.4%) | 19 (12.8%) |
| 75 Years and over | 3 (6.8%) | 21 (22.3%) |
Disability Class: Vision Difficulty
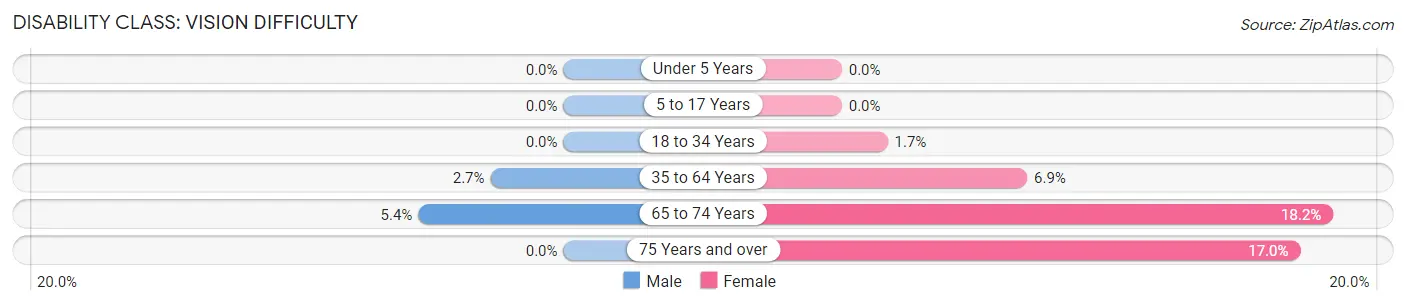
| Age Bracket | Male | Female |
| Under 5 Years | 0 (0.0%) | 0 (0.0%) |
| 5 to 17 Years | 0 (0.0%) | 0 (0.0%) |
| 18 to 34 Years | 0 (0.0%) | 5 (1.7%) |
| 35 to 64 Years | 14 (2.7%) | 36 (6.9%) |
| 65 to 74 Years | 9 (5.4%) | 27 (18.2%) |
| 75 Years and over | 0 (0.0%) | 16 (17.0%) |
Disability Class: Cognitive Difficulty
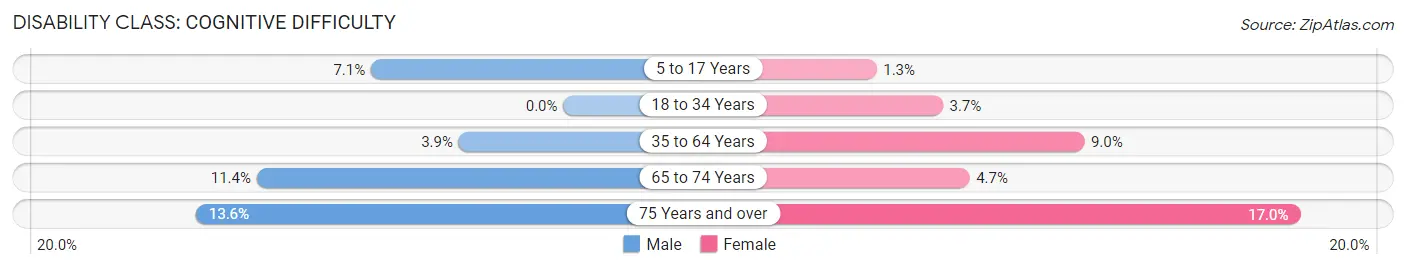
| Age Bracket | Male | Female |
| 5 to 17 Years | 17 (7.1%) | 2 (1.3%) |
| 18 to 34 Years | 0 (0.0%) | 11 (3.7%) |
| 35 to 64 Years | 20 (3.9%) | 47 (9.0%) |
| 65 to 74 Years | 19 (11.4%) | 7 (4.7%) |
| 75 Years and over | 6 (13.6%) | 16 (17.0%) |
Disability Class: Ambulatory Difficulty
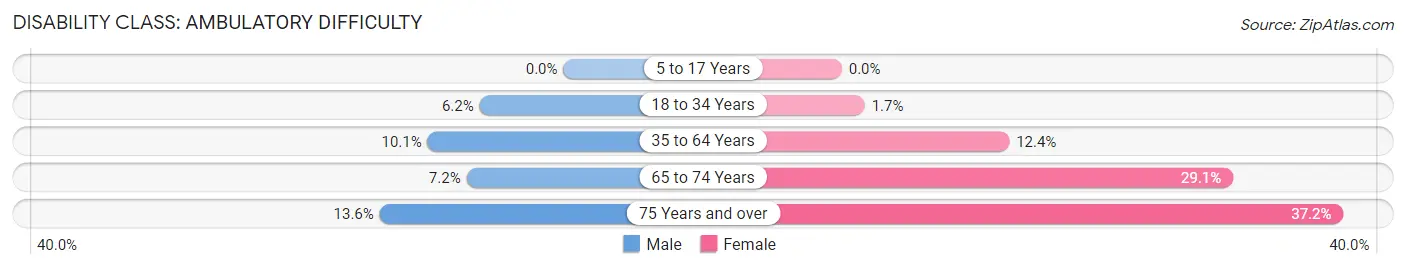
| Age Bracket | Male | Female |
| 5 to 17 Years | 0 (0.0%) | 0 (0.0%) |
| 18 to 34 Years | 12 (6.2%) | 5 (1.7%) |
| 35 to 64 Years | 52 (10.1%) | 65 (12.4%) |
| 65 to 74 Years | 12 (7.2%) | 43 (29.0%) |
| 75 Years and over | 6 (13.6%) | 35 (37.2%) |
Disability Class: Self-Care Difficulty
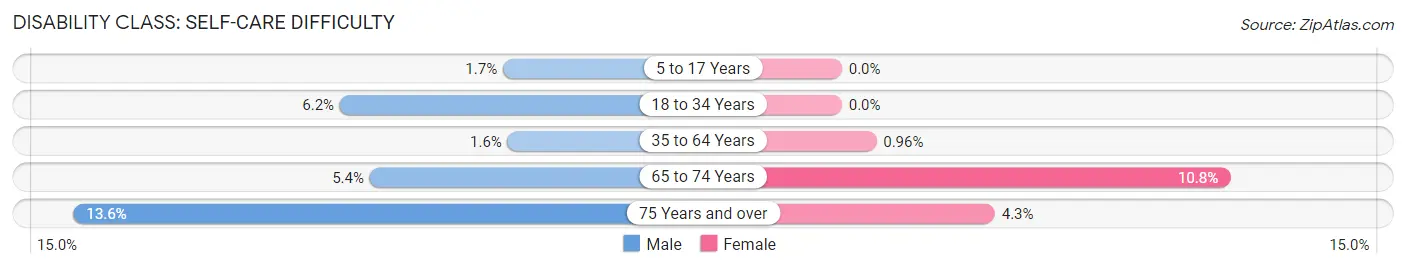
| Age Bracket | Male | Female |
| 5 to 17 Years | 4 (1.7%) | 0 (0.0%) |
| 18 to 34 Years | 12 (6.2%) | 0 (0.0%) |
| 35 to 64 Years | 8 (1.5%) | 5 (1.0%) |
| 65 to 74 Years | 9 (5.4%) | 16 (10.8%) |
| 75 Years and over | 6 (13.6%) | 4 (4.3%) |
Technology Access in Windsor
Computing Device Access in Windsor
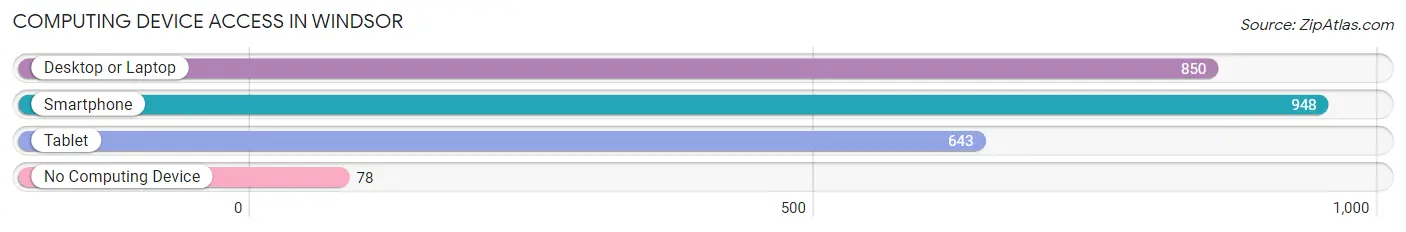
| Device Type | # Households | % Households |
| Desktop or Laptop | 850 | 79.0% |
| Smartphone | 948 | 88.1% |
| Tablet | 643 | 59.8% |
| No Computing Device | 78 | 7.2% |
| Total | 1,076 | 100.0% |
Internet Access in Windsor
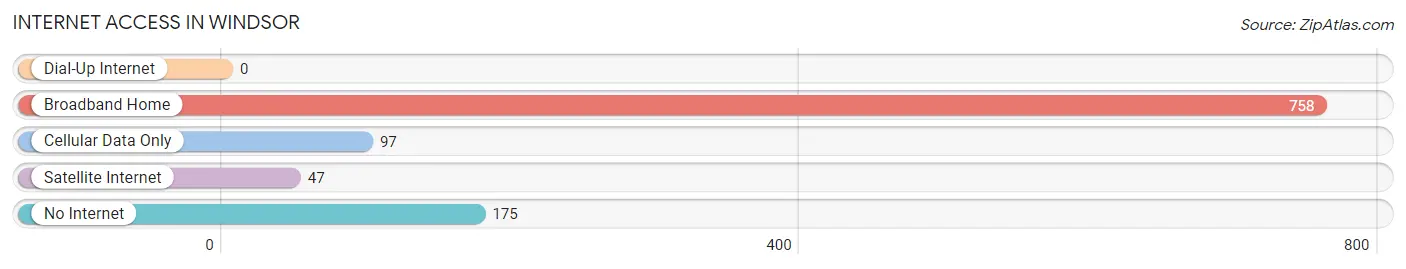
| Internet Type | # Households | % Households |
| Dial-Up Internet | 0 | 0.0% |
| Broadband Home | 758 | 70.5% |
| Cellular Data Only | 97 | 9.0% |
| Satellite Internet | 47 | 4.4% |
| No Internet | 175 | 16.3% |
| Total | 1,076 | 100.0% |
Windsor Summary
Windsor, Virginia is a small town located in Isle of Wight County in the southeastern part of the state. It is situated on the banks of the Pagan River, which is a tributary of the James River. The town is located about 30 miles south of Norfolk and about 50 miles west of Virginia Beach. The population of Windsor was estimated to be 1,845 in 2019.
History
The area that is now Windsor was first settled in the early 1700s by English colonists. The town was originally known as “Windsor’s Point” and was named after the English town of Windsor. The town was officially incorporated in 1752 and was the first town in Isle of Wight County.
During the American Revolution, Windsor was a major port for the British Navy. The town was also the site of a major battle between the British and American forces in 1781. The British were defeated and the town was burned to the ground.
In the 19th century, Windsor was an important port for the export of tobacco and other agricultural products. The town was also a major center for shipbuilding and the manufacture of naval supplies.
Geography
Windsor is located in the southeastern part of Virginia, about 30 miles south of Norfolk and 50 miles west of Virginia Beach. The town is situated on the banks of the Pagan River, which is a tributary of the James River. The town is surrounded by farmland and is located in a rural area.
The climate in Windsor is humid subtropical, with hot, humid summers and mild winters. The average annual temperature is around 60 degrees Fahrenheit. The average annual precipitation is around 45 inches.
Economy
The economy of Windsor is largely based on agriculture and tourism. The town is home to several farms that produce a variety of crops, including corn, soybeans, wheat, and hay. The town is also home to several wineries and vineyards, which attract tourists from all over the region.
The town is also home to several small businesses, including restaurants, shops, and other services. The town is also home to a small industrial park, which is home to several manufacturing companies.
Demographics
The population of Windsor was estimated to be 1,845 in 2019. The town is predominantly white, with about 87% of the population identifying as white. The remaining 13% of the population is made up of African Americans, Hispanics, and other races.
The median household income in Windsor is around $45,000, which is slightly lower than the national average. The town has a poverty rate of around 15%, which is slightly higher than the national average.
Windsor is a small town with a rich history and a vibrant economy. The town is home to several farms, wineries, and other businesses, which provide employment opportunities for the local population. The town is also home to a diverse population, which adds to the town’s unique culture and charm.
Common Questions
What is Per Capita Income in Windsor?
Per Capita income in Windsor is $31,519.
What is the Median Family Income in Windsor?
Median Family Income in Windsor is $72,500.
What is the Median Household income in Windsor?
Median Household Income in Windsor is $60,603.
What is Income or Wage Gap in Windsor?
Income or Wage Gap in Windsor is 57.3%.
Women in Windsor earn 42.7 cents for every dollar earned by a man.
What is Inequality or Gini Index in Windsor?
Inequality or Gini Index in Windsor is 0.42.
What is the Total Population of Windsor?
Total Population of Windsor is 2,765.
What is the Total Male Population of Windsor?
Total Male Population of Windsor is 1,349.
What is the Total Female Population of Windsor?
Total Female Population of Windsor is 1,416.
What is the Ratio of Males per 100 Females in Windsor?
There are 95.27 Males per 100 Females in Windsor.
What is the Ratio of Females per 100 Males in Windsor?
There are 104.97 Females per 100 Males in Windsor.
What is the Median Population Age in Windsor?
Median Population Age in Windsor is 43.1 Years.
What is the Average Family Size in Windsor
Average Family Size in Windsor is 3.0 People.
What is the Average Household Size in Windsor
Average Household Size in Windsor is 2.5 People.
How Large is the Labor Force in Windsor?
There are 1,262 People in the Labor Forcein in Windsor.
What is the Percentage of People in the Labor Force in Windsor?
59.1% of People are in the Labor Force in Windsor.
What is the Unemployment Rate in Windsor?
Unemployment Rate in Windsor is 4.8%.