Stuarts Draft, VA Map & Demographics
Stuarts Draft Map
Stuarts Draft Overview
$35,850
PER CAPITA INCOME
$90,977
AVG FAMILY INCOME
$75,100
AVG HOUSEHOLD INCOME
31.0%
WAGE / INCOME GAP [ % ]
69.0¢/ $1
WAGE / INCOME GAP [ $ ]
0.39
INEQUALITY / GINI INDEX
11,554
TOTAL POPULATION
5,658
MALE POPULATION
5,896
FEMALE POPULATION
95.96
MALES / 100 FEMALES
104.21
FEMALES / 100 MALES
43.3
MEDIAN AGE
3.0
AVG FAMILY SIZE
2.5
AVG HOUSEHOLD SIZE
6,193
LABOR FORCE [ PEOPLE ]
65.4%
PERCENT IN LABOR FORCE
3.4%
UNEMPLOYMENT RATE
Stuarts Draft Zip Codes
Stuarts Draft Area Codes
Income in Stuarts Draft
Income Overview in Stuarts Draft
Per Capita Income in Stuarts Draft is $35,850, while median incomes of families and households are $90,977 and $75,100 respectively.
| Characteristic | Number | Measure |
| Per Capita Income | 11,554 | $35,850 |
| Median Family Income | 3,131 | $90,977 |
| Mean Family Income | 3,131 | $104,902 |
| Median Household Income | 4,710 | $75,100 |
| Mean Household Income | 4,710 | $87,305 |
| Income Deficit | 3,131 | $0 |
| Wage / Income Gap (%) | 11,554 | 31.04% |
| Wage / Income Gap ($) | 11,554 | 68.96¢ per $1 |
| Gini / Inequality Index | 11,554 | 0.39 |
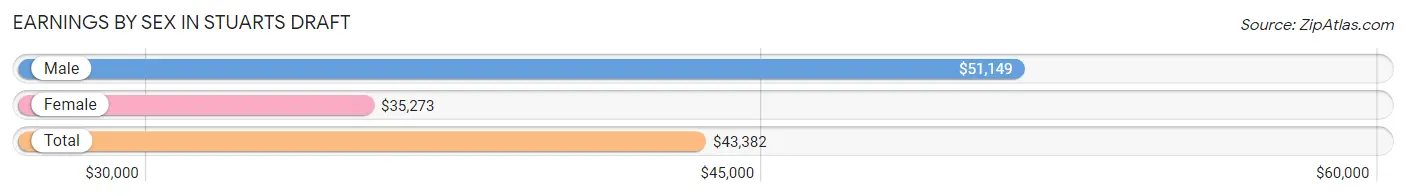
Earnings by Sex in Stuarts Draft
Average Earnings in Stuarts Draft are $43,382, $51,149 for men and $35,273 for women, a difference of 31.0%.
| Sex | Number | Average Earnings |
| Male | 3,158 (49.8%) | $51,149 |
| Female | 3,178 (50.2%) | $35,273 |
| Total | 6,336 (100.0%) | $43,382 |
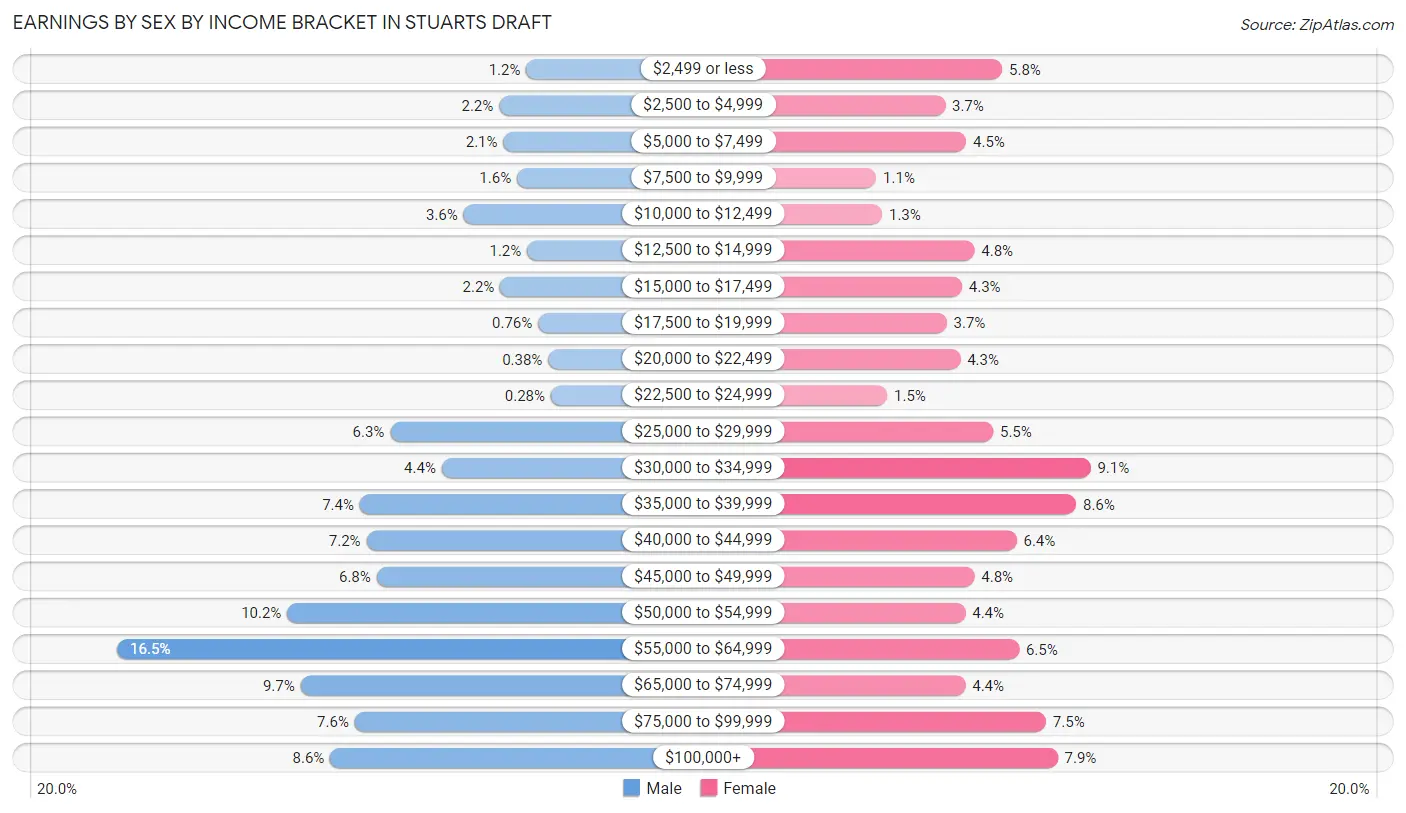
Earnings by Sex by Income Bracket in Stuarts Draft
The most common earnings brackets in Stuarts Draft are $55,000 to $64,999 for men (522 | 16.5%) and $30,000 to $34,999 for women (290 | 9.1%).
| Income | Male | Female |
| $2,499 or less | 38 (1.2%) | 185 (5.8%) |
| $2,500 to $4,999 | 70 (2.2%) | 117 (3.7%) |
| $5,000 to $7,499 | 65 (2.1%) | 142 (4.5%) |
| $7,500 to $9,999 | 49 (1.5%) | 35 (1.1%) |
| $10,000 to $12,499 | 112 (3.5%) | 42 (1.3%) |
| $12,500 to $14,999 | 37 (1.2%) | 152 (4.8%) |
| $15,000 to $17,499 | 69 (2.2%) | 137 (4.3%) |
| $17,500 to $19,999 | 24 (0.8%) | 119 (3.7%) |
| $20,000 to $22,499 | 12 (0.4%) | 135 (4.3%) |
| $22,500 to $24,999 | 9 (0.3%) | 48 (1.5%) |
| $25,000 to $29,999 | 199 (6.3%) | 174 (5.5%) |
| $30,000 to $34,999 | 138 (4.4%) | 290 (9.1%) |
| $35,000 to $39,999 | 235 (7.4%) | 273 (8.6%) |
| $40,000 to $44,999 | 227 (7.2%) | 202 (6.4%) |
| $45,000 to $49,999 | 215 (6.8%) | 152 (4.8%) |
| $50,000 to $54,999 | 321 (10.2%) | 141 (4.4%) |
| $55,000 to $64,999 | 522 (16.5%) | 205 (6.5%) |
| $65,000 to $74,999 | 305 (9.7%) | 141 (4.4%) |
| $75,000 to $99,999 | 241 (7.6%) | 237 (7.5%) |
| $100,000+ | 270 (8.6%) | 251 (7.9%) |
| Total | 3,158 (100.0%) | 3,178 (100.0%) |
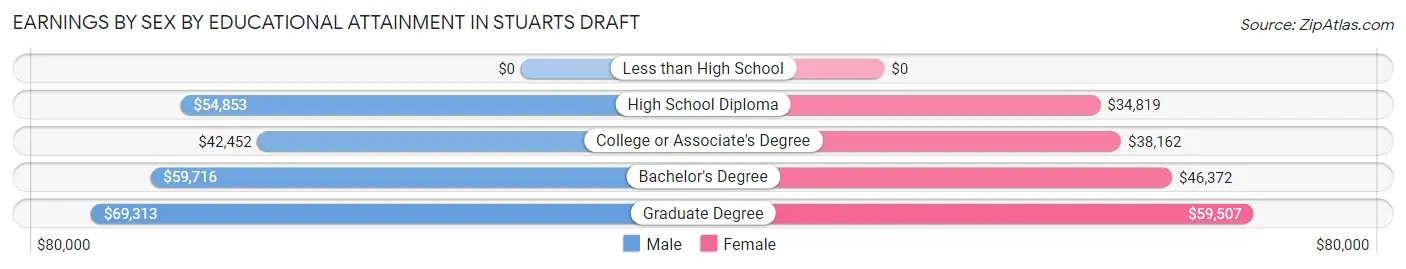
Earnings by Sex by Educational Attainment in Stuarts Draft
Average earnings in Stuarts Draft are $53,614 for men and $38,031 for women, a difference of 29.1%. Men with an educational attainment of graduate degree enjoy the highest average annual earnings of $69,313, while those with college or associate's degree education earn the least with $42,452. Women with an educational attainment of graduate degree earn the most with the average annual earnings of $59,507, while those with high school diploma education have the smallest earnings of $34,819.
| Educational Attainment | Male Income | Female Income |
| Less than High School | - | - |
| High School Diploma | $54,853 | $34,819 |
| College or Associate's Degree | $42,452 | $38,162 |
| Bachelor's Degree | $59,716 | $46,372 |
| Graduate Degree | $69,313 | $59,507 |
| Total | $53,614 | $38,031 |
Family Income in Stuarts Draft
Family Income Brackets in Stuarts Draft
According to the Stuarts Draft family income data, there are 814 families falling into the $100,000 to $149,999 income range, which is the most common income bracket and makes up 26.0% of all families. Conversely, the $25,000 to $34,999 income bracket is the least frequent group with only 19 families (0.6%) belonging to this category.
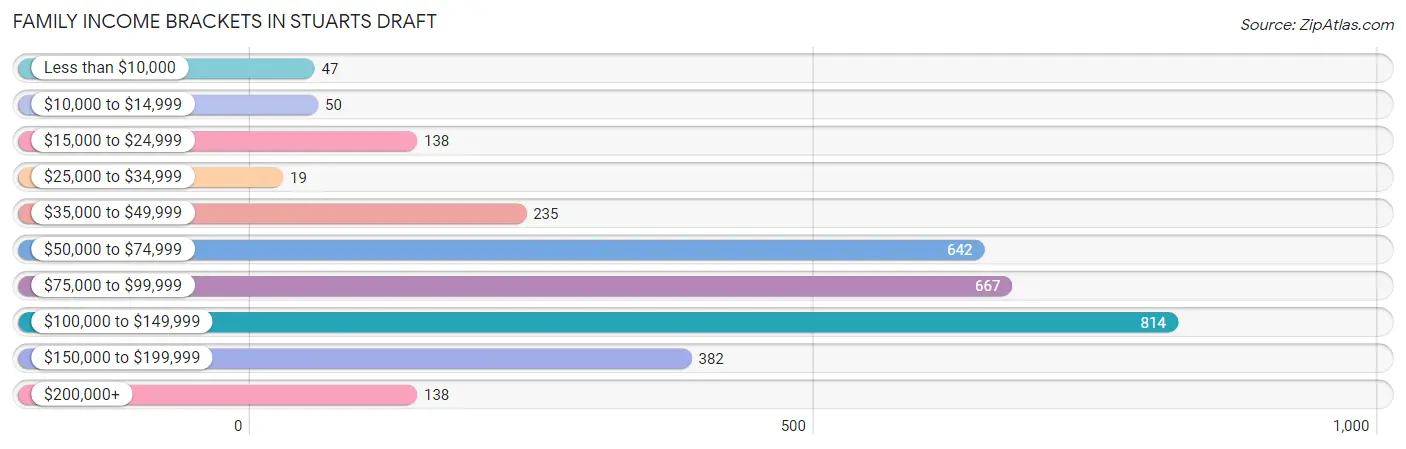
| Income Bracket | # Families | % Families |
| Less than $10,000 | 47 | 1.5% |
| $10,000 to $14,999 | 50 | 1.6% |
| $15,000 to $24,999 | 138 | 4.4% |
| $25,000 to $34,999 | 19 | 0.6% |
| $35,000 to $49,999 | 235 | 7.5% |
| $50,000 to $74,999 | 642 | 20.5% |
| $75,000 to $99,999 | 667 | 21.3% |
| $100,000 to $149,999 | 814 | 26.0% |
| $150,000 to $199,999 | 382 | 12.2% |
| $200,000+ | 138 | 4.4% |
Family Income by Famaliy Size in Stuarts Draft
5-person families (384 | 12.3%) account for the highest median family income in Stuarts Draft with $112,857 per family, while 2-person families (1,510 | 48.2%) have the highest median income of $39,916 per family member.
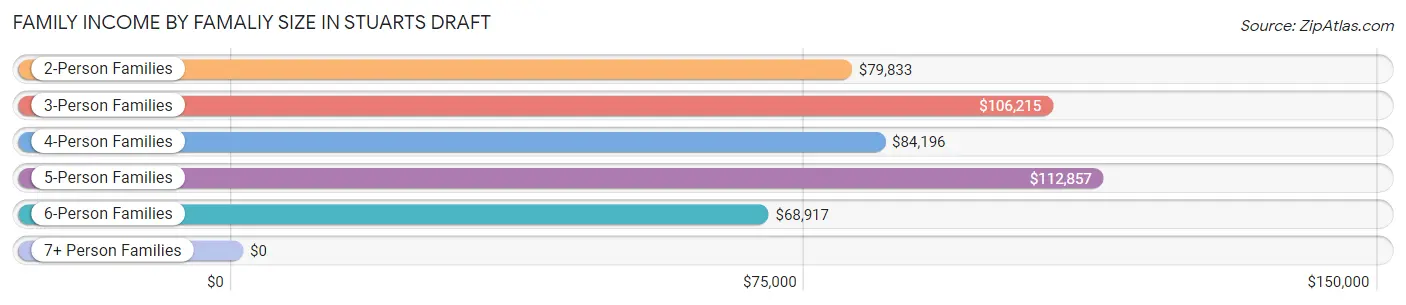
| Income Bracket | # Families | Median Income |
| 2-Person Families | 1,510 (48.2%) | $79,833 |
| 3-Person Families | 771 (24.6%) | $106,215 |
| 4-Person Families | 325 (10.4%) | $84,196 |
| 5-Person Families | 384 (12.3%) | $112,857 |
| 6-Person Families | 103 (3.3%) | $68,917 |
| 7+ Person Families | 38 (1.2%) | $0 |
| Total | 3,131 (100.0%) | $90,977 |
Family Income by Number of Earners in Stuarts Draft
The median family income in Stuarts Draft is $90,977, with families comprising 3+ earners (459) having the highest median family income of $131,172, while families with 1 earner (873) have the lowest median family income of $68,277, accounting for 14.7% and 27.9% of families, respectively.
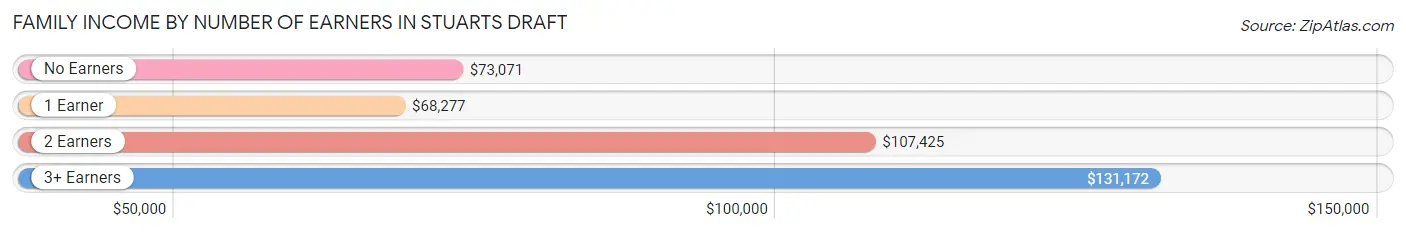
| Number of Earners | # Families | Median Income |
| No Earners | 397 (12.7%) | $73,071 |
| 1 Earner | 873 (27.9%) | $68,277 |
| 2 Earners | 1,402 (44.8%) | $107,425 |
| 3+ Earners | 459 (14.7%) | $131,172 |
| Total | 3,131 (100.0%) | $90,977 |
Household Income in Stuarts Draft
Household Income Brackets in Stuarts Draft
With 989 households falling in the category, the $100,000 to $149,999 income range is the most frequent in Stuarts Draft, accounting for 21.0% of all households. In contrast, only 165 households (3.5%) fall into the $10,000 to $14,999 income bracket, making it the least populous group.
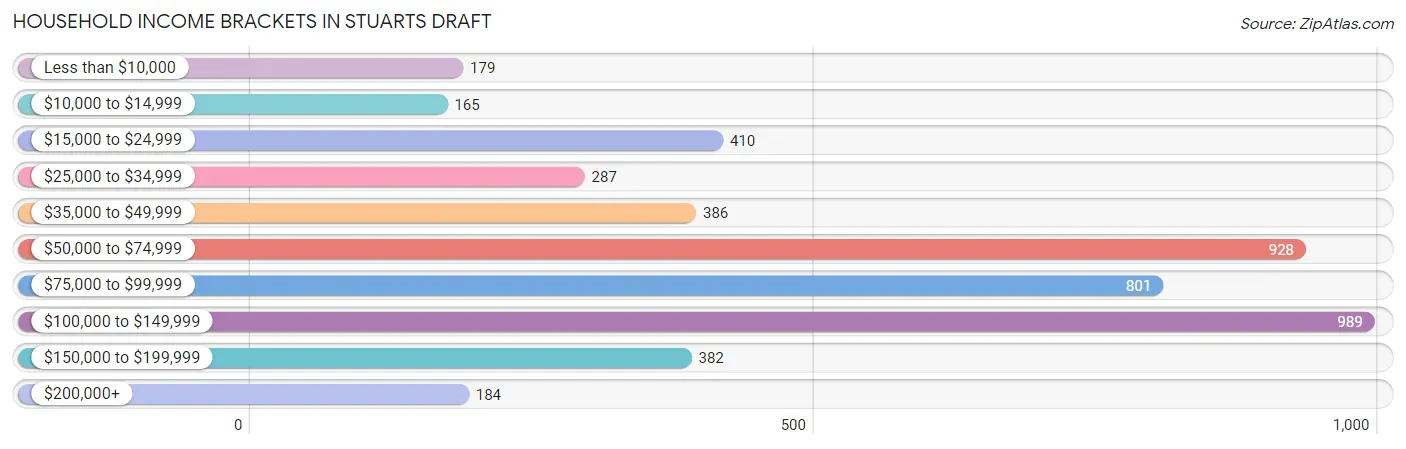
| Income Bracket | # Households | % Households |
| Less than $10,000 | 179 | 3.8% |
| $10,000 to $14,999 | 165 | 3.5% |
| $15,000 to $24,999 | 410 | 8.7% |
| $25,000 to $34,999 | 287 | 6.1% |
| $35,000 to $49,999 | 386 | 8.2% |
| $50,000 to $74,999 | 928 | 19.7% |
| $75,000 to $99,999 | 801 | 17.0% |
| $100,000 to $149,999 | 989 | 21.0% |
| $150,000 to $199,999 | 382 | 8.1% |
| $200,000+ | 184 | 3.9% |
Household Income by Householder Age in Stuarts Draft
The median household income in Stuarts Draft is $75,100, with the highest median household income of $97,083 found in the 45 to 64 years age bracket for the primary householder. A total of 1,795 households (38.1%) fall into this category. Meanwhile, the 15 to 24 years age bracket for the primary householder has the lowest median household income of $0, with 94 households (2.0%) in this group.
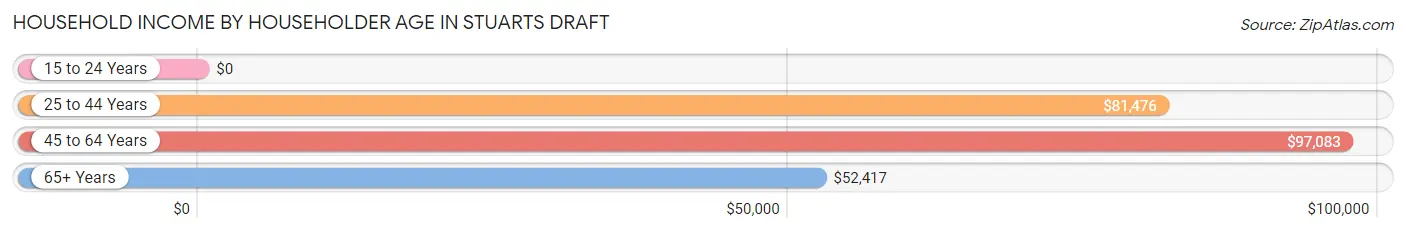
| Income Bracket | # Households | Median Income |
| 15 to 24 Years | 94 (2.0%) | $0 |
| 25 to 44 Years | 1,191 (25.3%) | $81,476 |
| 45 to 64 Years | 1,795 (38.1%) | $97,083 |
| 65+ Years | 1,630 (34.6%) | $52,417 |
| Total | 4,710 (100.0%) | $75,100 |
Poverty in Stuarts Draft
Income Below Poverty by Sex and Age in Stuarts Draft
With 7.2% poverty level for males and 11.2% for females among the residents of Stuarts Draft, 5 year old males and 5 year old females are the most vulnerable to poverty, with 33 males (47.1%) and 29 females (47.5%) in their respective age groups living below the poverty level.
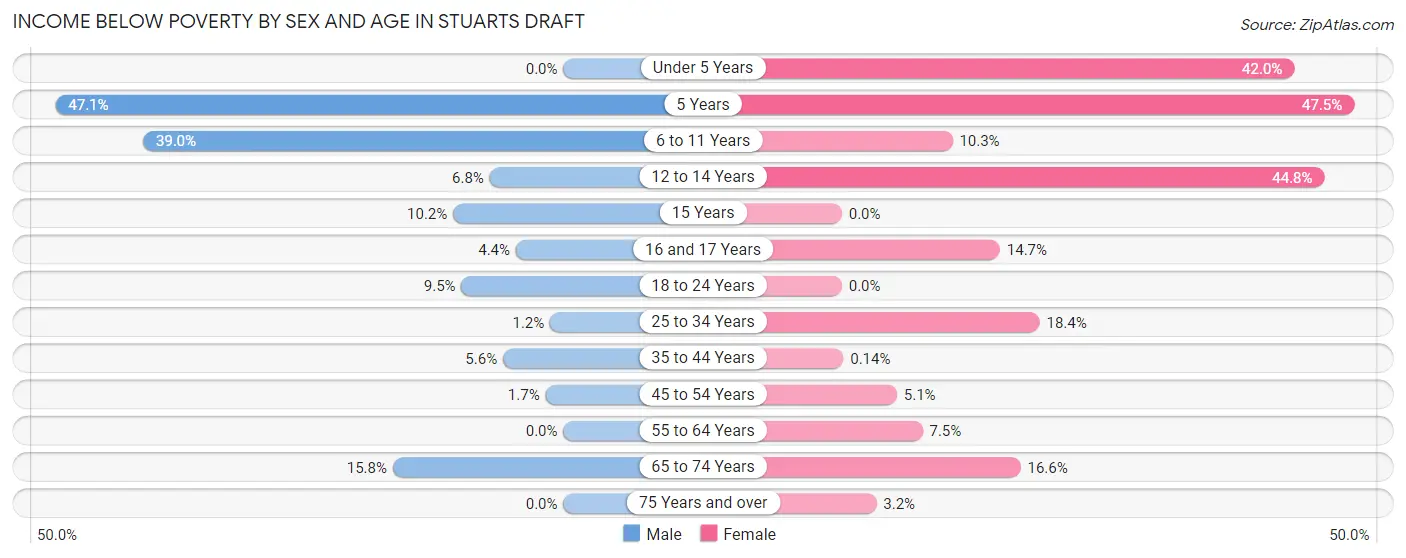
| Age Bracket | Male | Female |
| Under 5 Years | 0 (0.0%) | 89 (42.0%) |
| 5 Years | 33 (47.1%) | 29 (47.5%) |
| 6 to 11 Years | 160 (39.0%) | 38 (10.3%) |
| 12 to 14 Years | 24 (6.8%) | 90 (44.8%) |
| 15 Years | 9 (10.2%) | 0 (0.0%) |
| 16 and 17 Years | 16 (4.4%) | 27 (14.7%) |
| 18 to 24 Years | 30 (9.5%) | 0 (0.0%) |
| 25 to 34 Years | 8 (1.2%) | 131 (18.3%) |
| 35 to 44 Years | 39 (5.6%) | 1 (0.1%) |
| 45 to 54 Years | 13 (1.7%) | 38 (5.1%) |
| 55 to 64 Years | 0 (0.0%) | 77 (7.5%) |
| 65 to 74 Years | 76 (15.8%) | 113 (16.6%) |
| 75 Years and over | 0 (0.0%) | 20 (3.2%) |
| Total | 408 (7.2%) | 653 (11.2%) |
Income Above Poverty by Sex and Age in Stuarts Draft
According to the poverty statistics in Stuarts Draft, males aged under 5 years and females aged 15 years are the age groups that are most secure financially, with 100.0% of males and 100.0% of females in these age groups living above the poverty line.
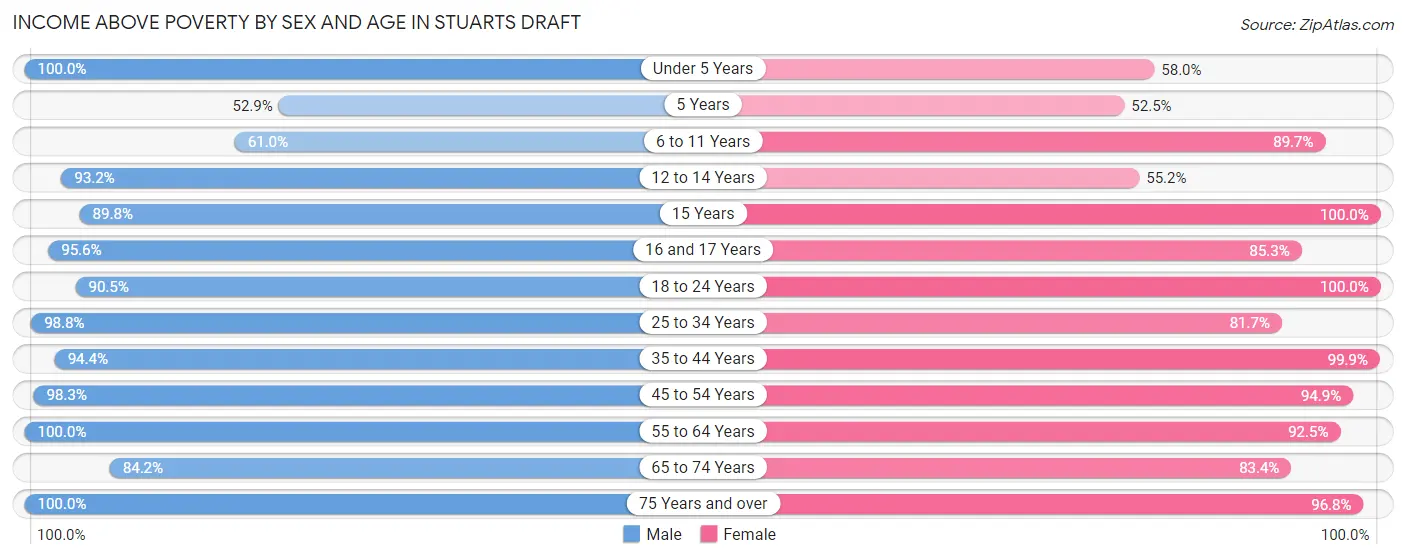
| Age Bracket | Male | Female |
| Under 5 Years | 221 (100.0%) | 123 (58.0%) |
| 5 Years | 37 (52.9%) | 32 (52.5%) |
| 6 to 11 Years | 250 (61.0%) | 332 (89.7%) |
| 12 to 14 Years | 327 (93.2%) | 111 (55.2%) |
| 15 Years | 79 (89.8%) | 36 (100.0%) |
| 16 and 17 Years | 347 (95.6%) | 157 (85.3%) |
| 18 to 24 Years | 287 (90.5%) | 271 (100.0%) |
| 25 to 34 Years | 641 (98.8%) | 583 (81.7%) |
| 35 to 44 Years | 658 (94.4%) | 725 (99.9%) |
| 45 to 54 Years | 772 (98.3%) | 706 (94.9%) |
| 55 to 64 Years | 789 (100.0%) | 951 (92.5%) |
| 65 to 74 Years | 404 (84.2%) | 568 (83.4%) |
| 75 Years and over | 418 (100.0%) | 604 (96.8%) |
| Total | 5,230 (92.8%) | 5,199 (88.8%) |
Income Below Poverty Among Married-Couple Families in Stuarts Draft
The poverty statistics for married-couple families in Stuarts Draft show that 1.2% or 29 of the total 2,450 families live below the poverty line. Families with 1 or 2 children have the highest poverty rate of 1.8%, comprising of 13 families. On the other hand, families with 3 or 4 children have the lowest poverty rate of 0.0%, which includes 0 families.
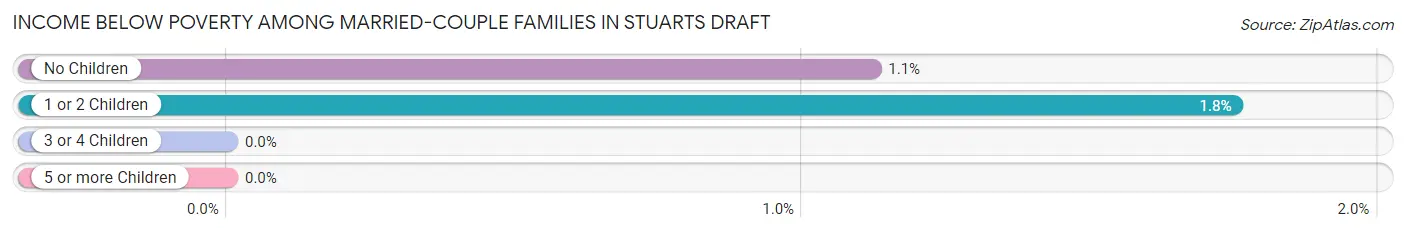
| Children | Above Poverty | Below Poverty |
| No Children | 1,412 (98.9%) | 16 (1.1%) |
| 1 or 2 Children | 731 (98.3%) | 13 (1.8%) |
| 3 or 4 Children | 278 (100.0%) | 0 (0.0%) |
| 5 or more Children | 0 (0.0%) | 0 (0.0%) |
| Total | 2,421 (98.8%) | 29 (1.2%) |
Income Below Poverty Among Single-Parent Households in Stuarts Draft
According to the poverty data in Stuarts Draft, 4.9% or 8 single-father households and 26.8% or 139 single-mother households are living below the poverty line. Among single-father households, those with 1 or 2 children have the highest poverty rate, with 8 households (13.3%) experiencing poverty. Likewise, among single-mother households, those with 3 or 4 children have the highest poverty rate, with 91 households (100.0%) falling below the poverty line.
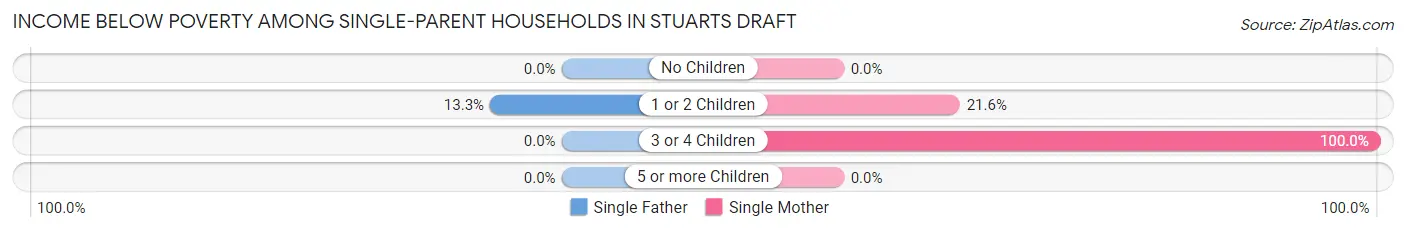
| Children | Single Father | Single Mother |
| No Children | 0 (0.0%) | 0 (0.0%) |
| 1 or 2 Children | 8 (13.3%) | 48 (21.6%) |
| 3 or 4 Children | 0 (0.0%) | 91 (100.0%) |
| 5 or more Children | 0 (0.0%) | 0 (0.0%) |
| Total | 8 (4.9%) | 139 (26.8%) |
Income Below Poverty Among Married-Couple vs Single-Parent Households in Stuarts Draft
The poverty data for Stuarts Draft shows that 29 of the married-couple family households (1.2%) and 147 of the single-parent households (21.6%) are living below the poverty level. Within the married-couple family households, those with 1 or 2 children have the highest poverty rate, with 13 households (1.8%) falling below the poverty line. Among the single-parent households, those with 3 or 4 children have the highest poverty rate, with 91 household (83.5%) living below poverty.
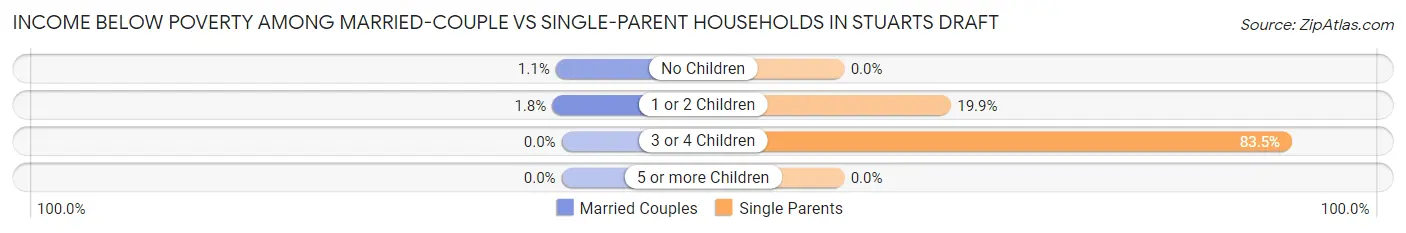
| Children | Married-Couple Families | Single-Parent Households |
| No Children | 16 (1.1%) | 0 (0.0%) |
| 1 or 2 Children | 13 (1.8%) | 56 (19.9%) |
| 3 or 4 Children | 0 (0.0%) | 91 (83.5%) |
| 5 or more Children | 0 (0.0%) | 0 (0.0%) |
| Total | 29 (1.2%) | 147 (21.6%) |
Race in Stuarts Draft
The most populous races in Stuarts Draft are White / Caucasian (10,596 | 91.7%), Black / African American (629 | 5.4%), and Two or more Races (231 | 2.0%).
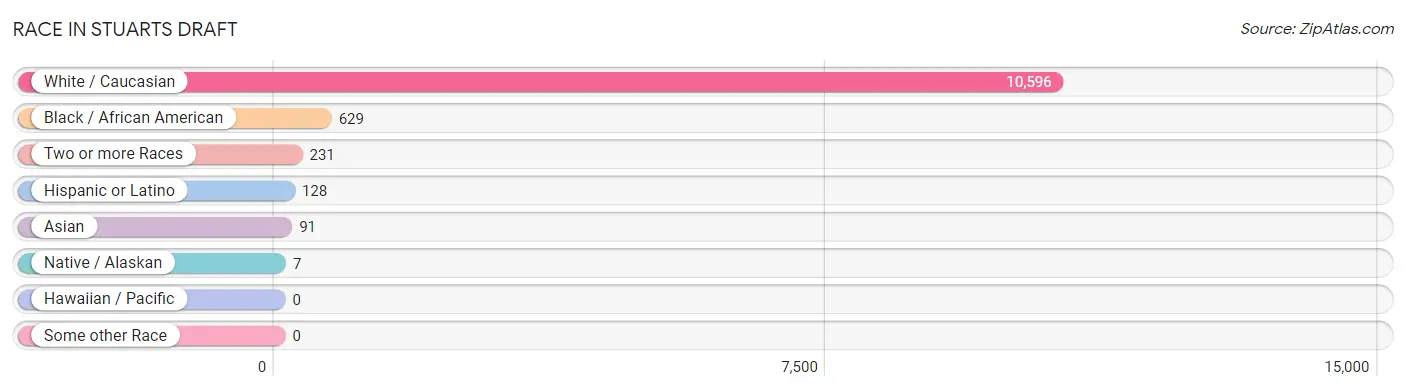
| Race | # Population | % Population |
| Asian | 91 | 0.8% |
| Black / African American | 629 | 5.4% |
| Hawaiian / Pacific | 0 | 0.0% |
| Hispanic or Latino | 128 | 1.1% |
| Native / Alaskan | 7 | 0.1% |
| White / Caucasian | 10,596 | 91.7% |
| Two or more Races | 231 | 2.0% |
| Some other Race | 0 | 0.0% |
| Total | 11,554 | 100.0% |
Ancestry in Stuarts Draft
The most populous ancestries reported in Stuarts Draft are German (1,976 | 17.1%), English (1,468 | 12.7%), American (1,327 | 11.5%), Irish (1,040 | 9.0%), and European (259 | 2.2%), together accounting for 52.5% of all Stuarts Draft residents.
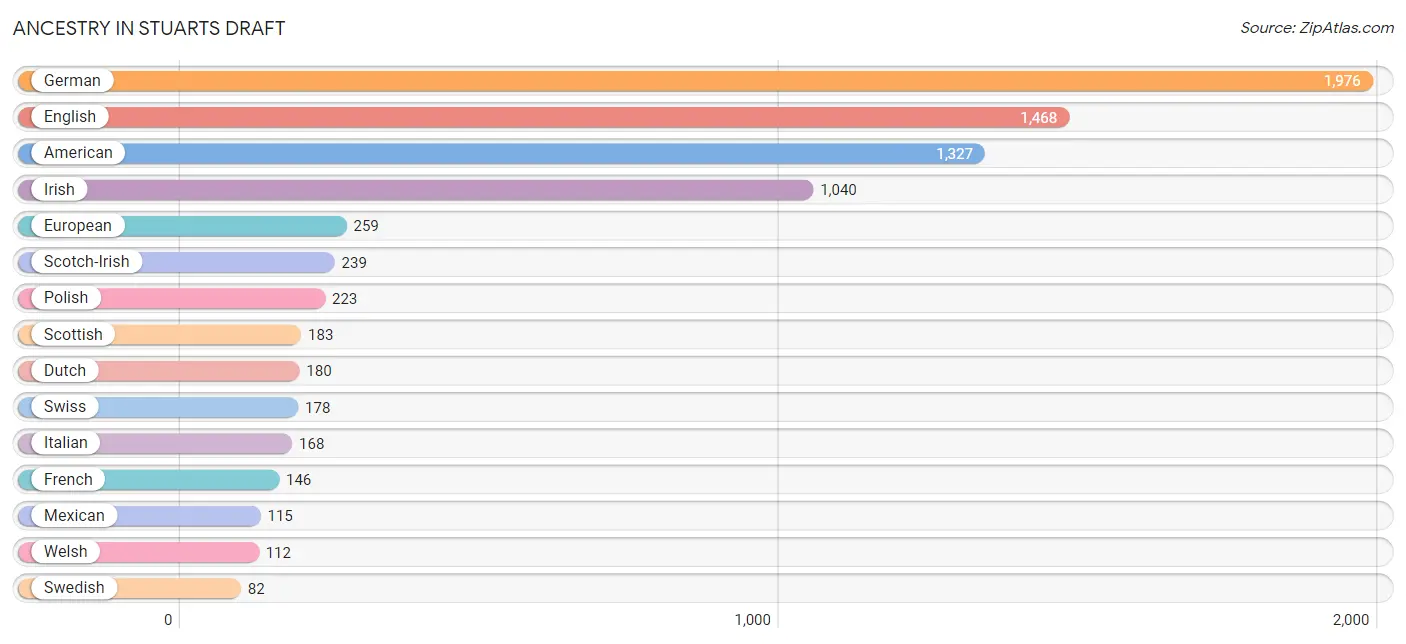
| Ancestry | # Population | % Population |
| American | 1,327 | 11.5% |
| British | 12 | 0.1% |
| Burmese | 1 | 0.0% |
| Dutch | 180 | 1.6% |
| Eastern European | 8 | 0.1% |
| English | 1,468 | 12.7% |
| European | 259 | 2.2% |
| French | 146 | 1.3% |
| German | 1,976 | 17.1% |
| Hungarian | 6 | 0.1% |
| Indian (Asian) | 52 | 0.4% |
| Irish | 1,040 | 9.0% |
| Italian | 168 | 1.5% |
| Jamaican | 26 | 0.2% |
| Korean | 31 | 0.3% |
| Latvian | 32 | 0.3% |
| Mexican | 115 | 1.0% |
| Northern European | 29 | 0.3% |
| Norwegian | 10 | 0.1% |
| Polish | 223 | 1.9% |
| Russian | 10 | 0.1% |
| Scandinavian | 14 | 0.1% |
| Scotch-Irish | 239 | 2.1% |
| Scottish | 183 | 1.6% |
| Sioux | 6 | 0.1% |
| South African | 8 | 0.1% |
| Spaniard | 13 | 0.1% |
| Subsaharan African | 8 | 0.1% |
| Swedish | 82 | 0.7% |
| Swiss | 178 | 1.5% |
| Thai | 65 | 0.6% |
| Ukrainian | 14 | 0.1% |
| Welsh | 112 | 1.0% | View All 33 Rows |
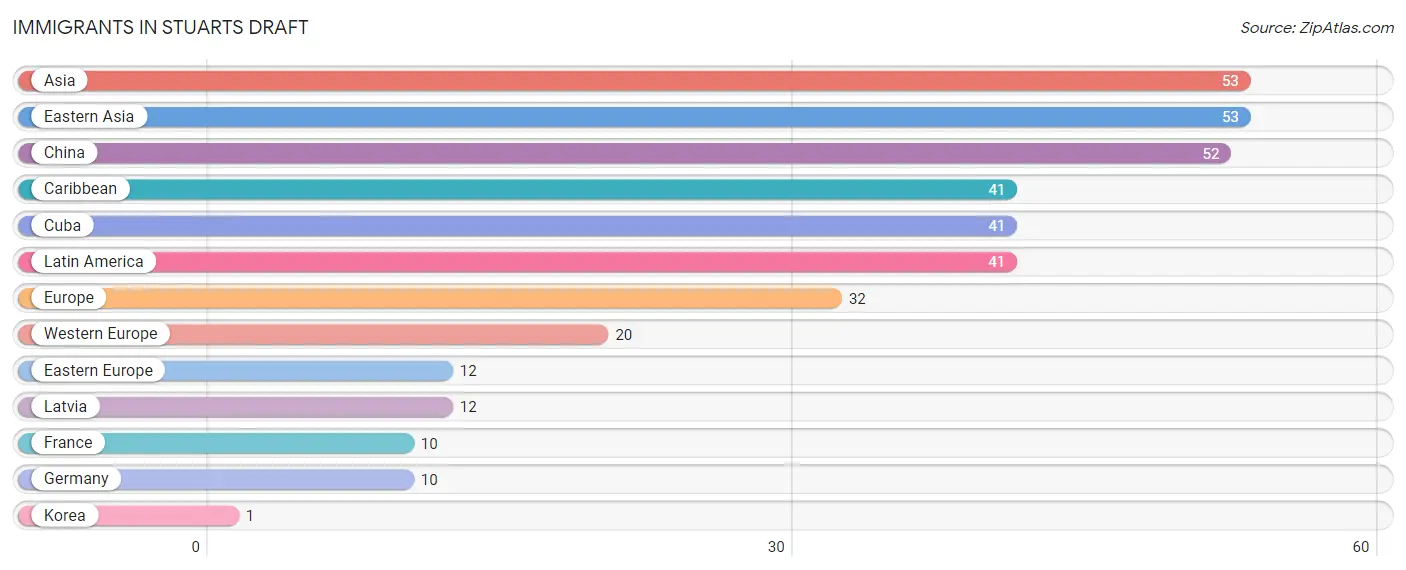
Immigrants in Stuarts Draft
The most numerous immigrant groups reported in Stuarts Draft came from Asia (53 | 0.5%), Eastern Asia (53 | 0.5%), China (52 | 0.4%), Caribbean (41 | 0.4%), and Cuba (41 | 0.4%), together accounting for 2.1% of all Stuarts Draft residents.
| Immigration Origin | # Population | % Population |
| Asia | 53 | 0.5% |
| Caribbean | 41 | 0.4% |
| China | 52 | 0.4% |
| Cuba | 41 | 0.4% |
| Eastern Asia | 53 | 0.5% |
| Eastern Europe | 12 | 0.1% |
| Europe | 32 | 0.3% |
| France | 10 | 0.1% |
| Germany | 10 | 0.1% |
| Korea | 1 | 0.0% |
| Latin America | 41 | 0.4% |
| Latvia | 12 | 0.1% |
| Western Europe | 20 | 0.2% | View All 13 Rows |
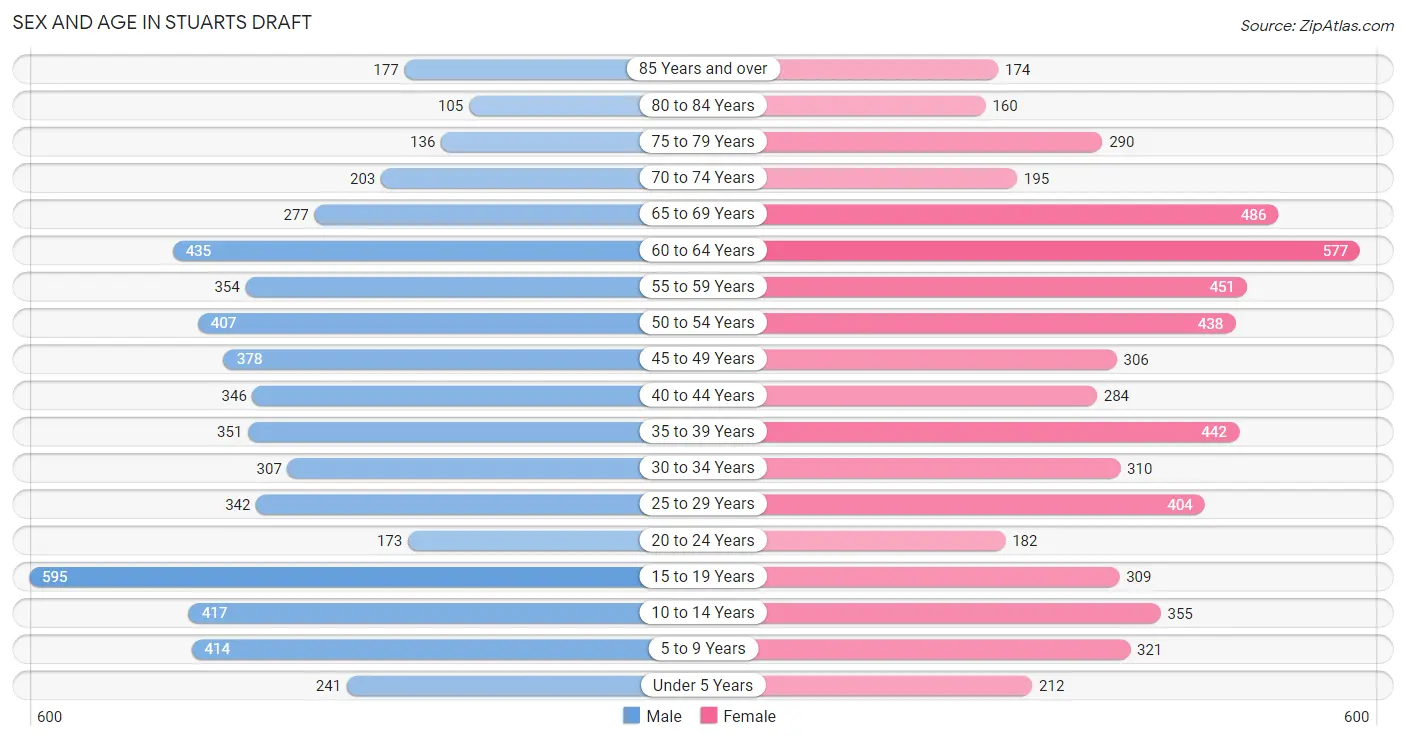
Sex and Age in Stuarts Draft
Sex and Age in Stuarts Draft
The most populous age groups in Stuarts Draft are 15 to 19 Years (595 | 10.5%) for men and 60 to 64 Years (577 | 9.8%) for women.
| Age Bracket | Male | Female |
| Under 5 Years | 241 (4.3%) | 212 (3.6%) |
| 5 to 9 Years | 414 (7.3%) | 321 (5.4%) |
| 10 to 14 Years | 417 (7.4%) | 355 (6.0%) |
| 15 to 19 Years | 595 (10.5%) | 309 (5.2%) |
| 20 to 24 Years | 173 (3.1%) | 182 (3.1%) |
| 25 to 29 Years | 342 (6.0%) | 404 (6.9%) |
| 30 to 34 Years | 307 (5.4%) | 310 (5.3%) |
| 35 to 39 Years | 351 (6.2%) | 442 (7.5%) |
| 40 to 44 Years | 346 (6.1%) | 284 (4.8%) |
| 45 to 49 Years | 378 (6.7%) | 306 (5.2%) |
| 50 to 54 Years | 407 (7.2%) | 438 (7.4%) |
| 55 to 59 Years | 354 (6.3%) | 451 (7.6%) |
| 60 to 64 Years | 435 (7.7%) | 577 (9.8%) |
| 65 to 69 Years | 277 (4.9%) | 486 (8.2%) |
| 70 to 74 Years | 203 (3.6%) | 195 (3.3%) |
| 75 to 79 Years | 136 (2.4%) | 290 (4.9%) |
| 80 to 84 Years | 105 (1.9%) | 160 (2.7%) |
| 85 Years and over | 177 (3.1%) | 174 (2.9%) |
| Total | 5,658 (100.0%) | 5,896 (100.0%) |
Families and Households in Stuarts Draft
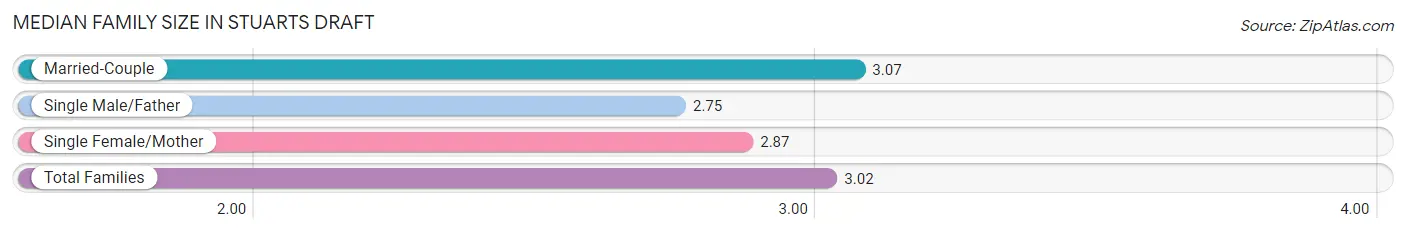
Median Family Size in Stuarts Draft
The median family size in Stuarts Draft is 3.02 persons per family, with married-couple families (2,450 | 78.2%) accounting for the largest median family size of 3.07 persons per family. On the other hand, single male/father families (162 | 5.2%) represent the smallest median family size with 2.75 persons per family.
| Family Type | # Families | Family Size |
| Married-Couple | 2,450 (78.2%) | 3.07 |
| Single Male/Father | 162 (5.2%) | 2.75 |
| Single Female/Mother | 519 (16.6%) | 2.87 |
| Total Families | 3,131 (100.0%) | 3.02 |
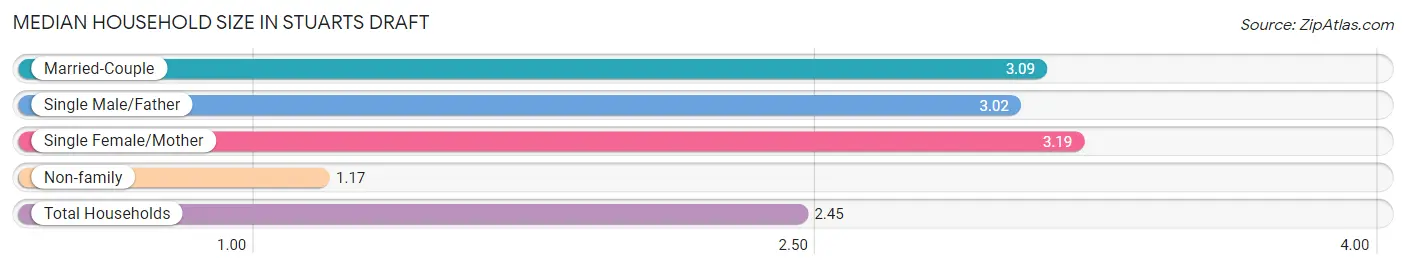
Median Household Size in Stuarts Draft
The median household size in Stuarts Draft is 2.45 persons per household, with single female/mother households (519 | 11.0%) accounting for the largest median household size of 3.19 persons per household. non-family households (1,579 | 33.5%) represent the smallest median household size with 1.17 persons per household.
| Household Type | # Households | Household Size |
| Married-Couple | 2,450 (52.0%) | 3.09 |
| Single Male/Father | 162 (3.4%) | 3.02 |
| Single Female/Mother | 519 (11.0%) | 3.19 |
| Non-family | 1,579 (33.5%) | 1.17 |
| Total Households | 4,710 (100.0%) | 2.45 |
Household Size by Marriage Status in Stuarts Draft
Out of a total of 4,710 households in Stuarts Draft, 3,131 (66.5%) are family households, while 1,579 (33.5%) are nonfamily households. The most numerous type of family households are 2-person households, comprising 1,379, and the most common type of nonfamily households are 1-person households, comprising 1,323.
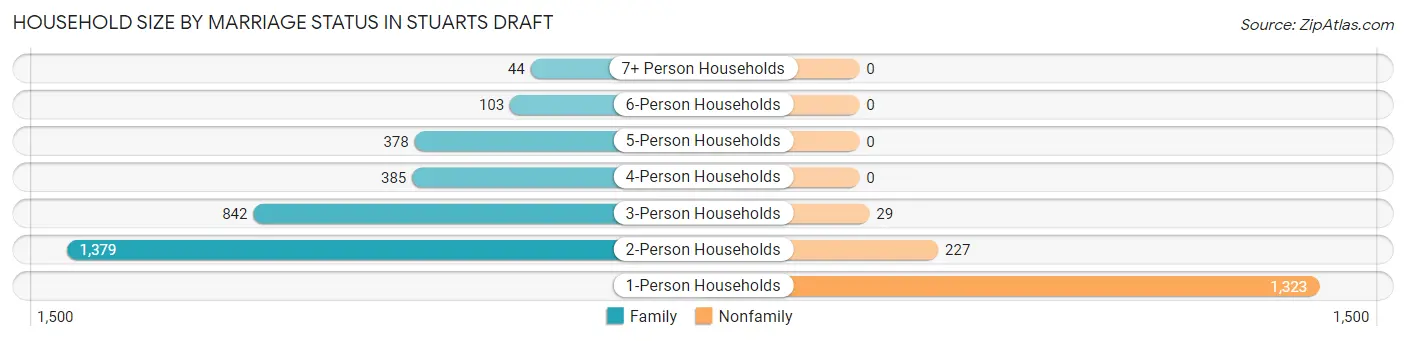
| Household Size | Family Households | Nonfamily Households |
| 1-Person Households | - | 1,323 (28.1%) |
| 2-Person Households | 1,379 (29.3%) | 227 (4.8%) |
| 3-Person Households | 842 (17.9%) | 29 (0.6%) |
| 4-Person Households | 385 (8.2%) | 0 (0.0%) |
| 5-Person Households | 378 (8.0%) | 0 (0.0%) |
| 6-Person Households | 103 (2.2%) | 0 (0.0%) |
| 7+ Person Households | 44 (0.9%) | 0 (0.0%) |
| Total | 3,131 (66.5%) | 1,579 (33.5%) |
Female Fertility in Stuarts Draft
Fertility by Age in Stuarts Draft
Average fertility rate in Stuarts Draft is 53.0 births per 1,000 women. Women in the age bracket of 20 to 34 years have the highest fertility rate with 106.0 births per 1,000 women. Women in the age bracket of 20 to 34 years acount for 77.9% of all women with births.
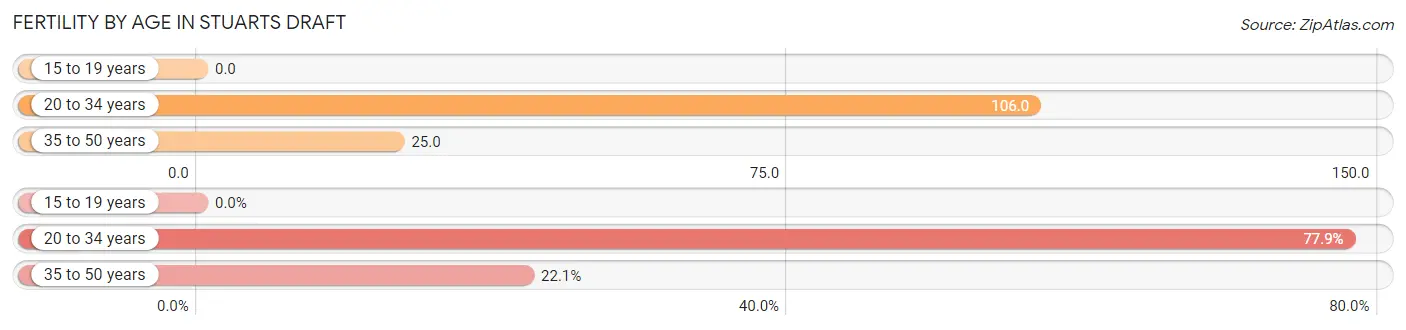
| Age Bracket | Women with Births | Births / 1,000 Women |
| 15 to 19 years | 0 (0.0%) | 0.0 |
| 20 to 34 years | 95 (77.9%) | 106.0 |
| 35 to 50 years | 27 (22.1%) | 25.0 |
| Total | 122 (100.0%) | 53.0 |
Fertility by Age by Marriage Status in Stuarts Draft
65.6% of women with births (122) in Stuarts Draft are married. The highest percentage of unmarried women with births falls into 20 to 34 years age bracket with 44.2% of them unmarried at the time of birth, while the lowest percentage of unmarried women with births belong to 35 to 50 years age bracket with 0.0% of them unmarried.
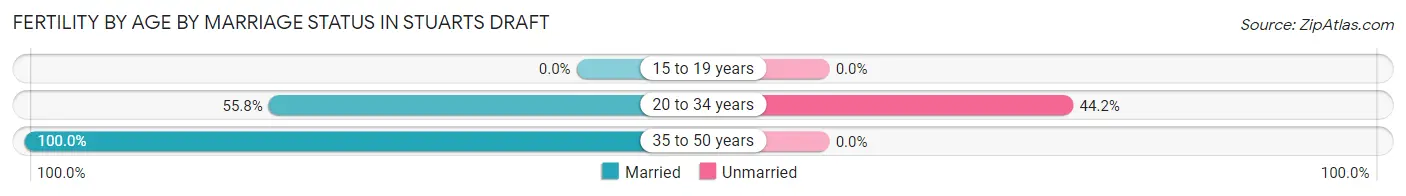
| Age Bracket | Married | Unmarried |
| 15 to 19 years | 0 (0.0%) | 0 (0.0%) |
| 20 to 34 years | 53 (55.8%) | 42 (44.2%) |
| 35 to 50 years | 27 (100.0%) | 0 (0.0%) |
| Total | 80 (65.6%) | 42 (34.4%) |
Fertility by Education in Stuarts Draft
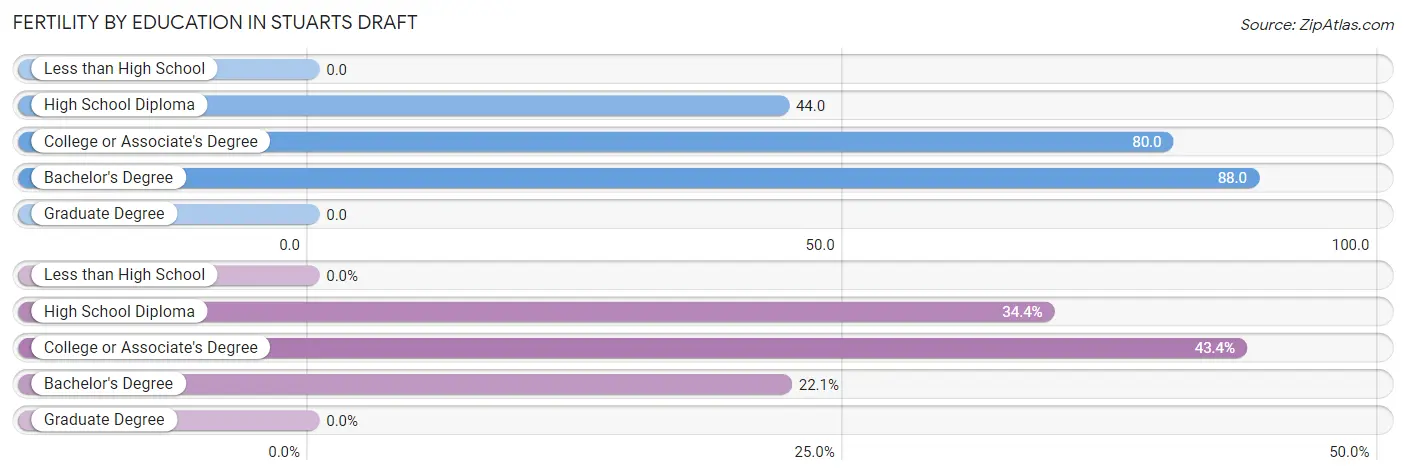
| Educational Attainment | Women with Births | Births / 1,000 Women |
| Less than High School | 0 (0.0%) | 0.0 |
| High School Diploma | 42 (34.4%) | 44.0 |
| College or Associate's Degree | 53 (43.4%) | 80.0 |
| Bachelor's Degree | 27 (22.1%) | 88.0 |
| Graduate Degree | 0 (0.0%) | 0.0 |
| Total | 122 (100.0%) | 53.0 |
Fertility by Education by Marriage Status in Stuarts Draft
34.4% of women with births in Stuarts Draft are unmarried. Women with the educational attainment of college or associate's degree are most likely to be married with 100.0% of them married at childbirth, while women with the educational attainment of high school diploma are least likely to be married with 100.0% of them unmarried at childbirth.
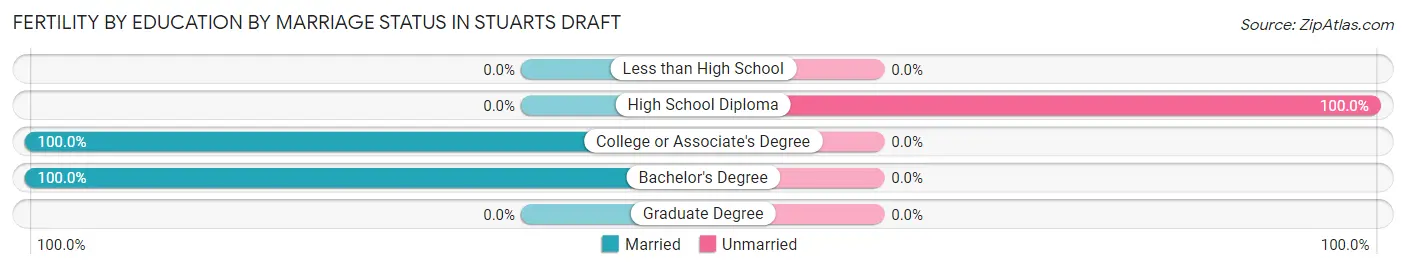
| Educational Attainment | Married | Unmarried |
| Less than High School | 0 (0.0%) | 0 (0.0%) |
| High School Diploma | 0 (0.0%) | 42 (100.0%) |
| College or Associate's Degree | 53 (100.0%) | 0 (0.0%) |
| Bachelor's Degree | 27 (100.0%) | 0 (0.0%) |
| Graduate Degree | 0 (0.0%) | 0 (0.0%) |
| Total | 80 (65.6%) | 42 (34.4%) |
Employment Characteristics in Stuarts Draft
Employment by Class of Employer in Stuarts Draft
Among the 5,897 employed individuals in Stuarts Draft, private company employees (4,220 | 71.6%), not-for-profit organizations (594 | 10.1%), and local government employees (373 | 6.3%) make up the most common classes of employment.
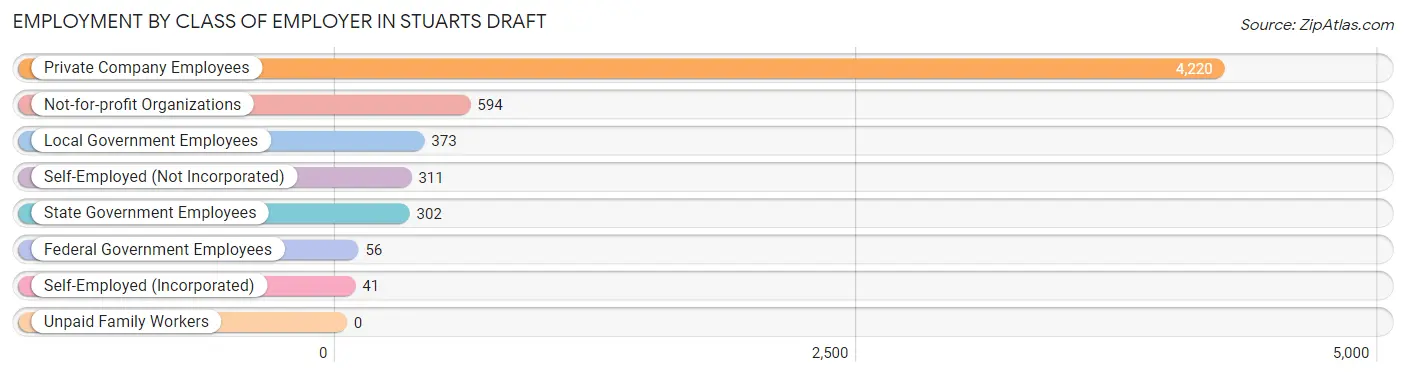
| Employer Class | # Employees | % Employees |
| Private Company Employees | 4,220 | 71.6% |
| Self-Employed (Incorporated) | 41 | 0.7% |
| Self-Employed (Not Incorporated) | 311 | 5.3% |
| Not-for-profit Organizations | 594 | 10.1% |
| Local Government Employees | 373 | 6.3% |
| State Government Employees | 302 | 5.1% |
| Federal Government Employees | 56 | 0.9% |
| Unpaid Family Workers | 0 | 0.0% |
| Total | 5,897 | 100.0% |
Employment Status by Age in Stuarts Draft
According to the labor force statistics for Stuarts Draft, out of the total population over 16 years of age (9,470), 65.4% or 6,193 individuals are in the labor force, with 3.4% or 211 of them unemployed. The age group with the highest labor force participation rate is 25 to 29 years, with 100.0% or 746 individuals in the labor force. Within the labor force, the 16 to 19 years age range has the highest percentage of unemployed individuals, with 22.3% or 71 of them being unemployed.
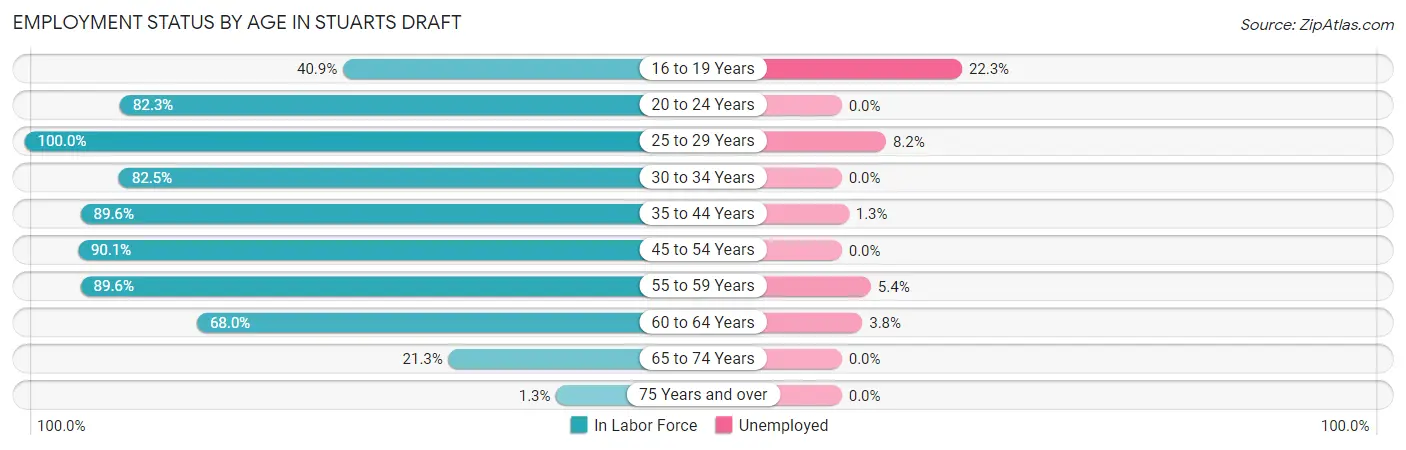
| Age Bracket | In Labor Force | Unemployed |
| 16 to 19 Years | 319 (40.9%) | 71 (22.3%) |
| 20 to 24 Years | 292 (82.3%) | 0 (0.0%) |
| 25 to 29 Years | 746 (100.0%) | 61 (8.2%) |
| 30 to 34 Years | 509 (82.5%) | 0 (0.0%) |
| 35 to 44 Years | 1,275 (89.6%) | 17 (1.3%) |
| 45 to 54 Years | 1,378 (90.1%) | 0 (0.0%) |
| 55 to 59 Years | 721 (89.6%) | 39 (5.4%) |
| 60 to 64 Years | 688 (68.0%) | 26 (3.8%) |
| 65 to 74 Years | 247 (21.3%) | 0 (0.0%) |
| 75 Years and over | 14 (1.3%) | 0 (0.0%) |
| Total | 6,193 (65.4%) | 211 (3.4%) |
Employment Status by Educational Attainment in Stuarts Draft
According to labor force statistics for Stuarts Draft, 86.7% of individuals (5,316) out of the total population between 25 and 64 years of age (6,132) are in the labor force, with 2.7% or 144 of them being unemployed. The group with the highest labor force participation rate are those with the educational attainment of bachelor's degree or higher, with 95.0% or 1,133 individuals in the labor force. Within the labor force, individuals with high school diploma education have the highest percentage of unemployment, with 4.2% or 98 of them being unemployed.
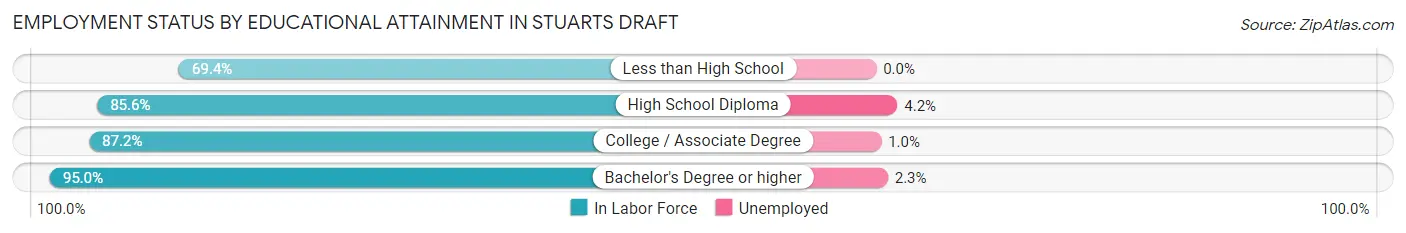
| Educational Attainment | In Labor Force | Unemployed |
| Less than High School | 301 (69.4%) | 0 (0.0%) |
| High School Diploma | 2,324 (85.6%) | 114 (4.2%) |
| College / Associate Degree | 1,561 (87.2%) | 18 (1.0%) |
| Bachelor's Degree or higher | 1,133 (95.0%) | 27 (2.3%) |
| Total | 5,316 (86.7%) | 166 (2.7%) |
Employment Occupations by Sex in Stuarts Draft
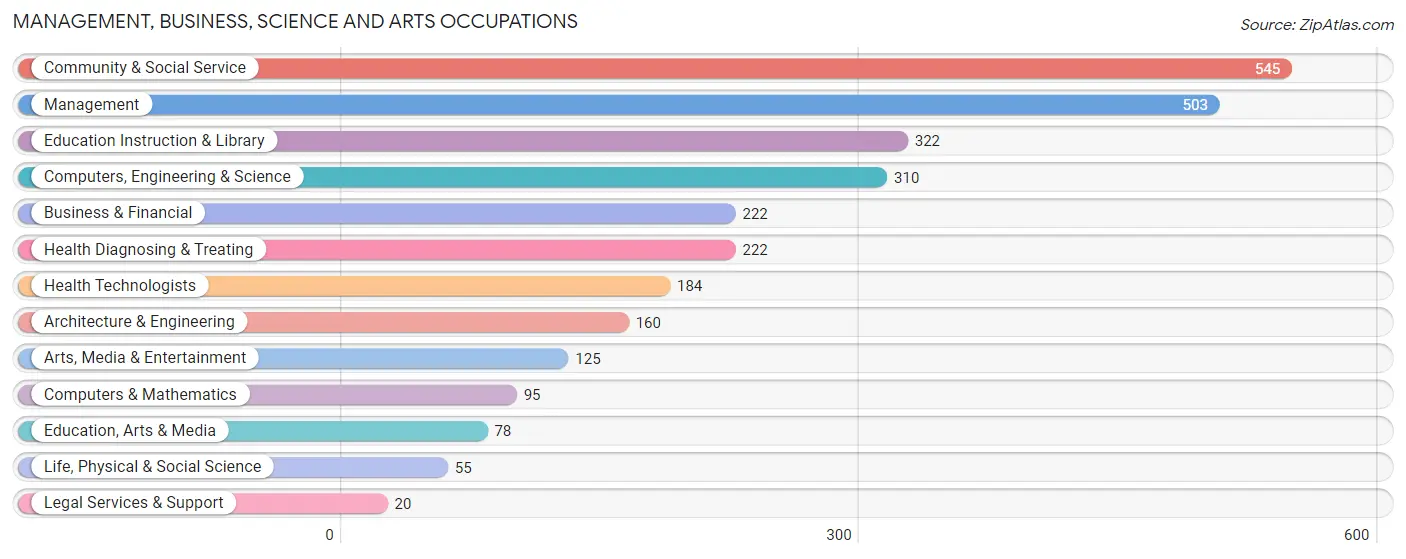
Management, Business, Science and Arts Occupations
The most common Management, Business, Science and Arts occupations in Stuarts Draft are Community & Social Service (545 | 9.2%), Management (503 | 8.5%), Education Instruction & Library (322 | 5.4%), Computers, Engineering & Science (310 | 5.2%), and Business & Financial (222 | 3.7%).
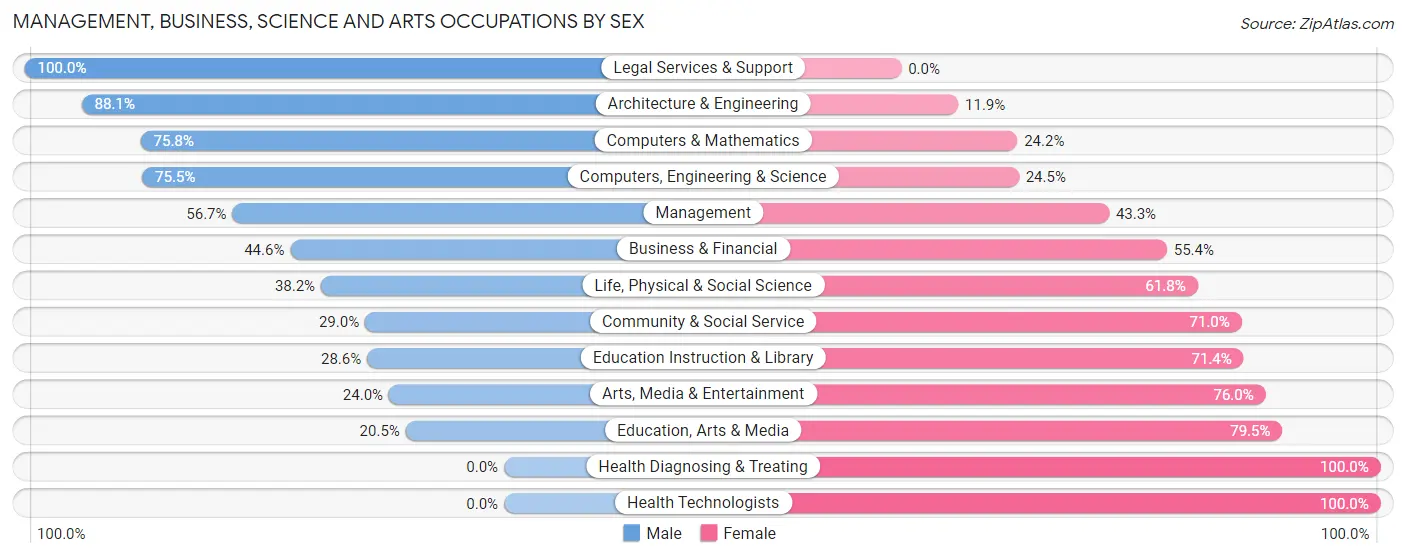
Management, Business, Science and Arts Occupations by Sex
Within the Management, Business, Science and Arts occupations in Stuarts Draft, the most male-oriented occupations are Legal Services & Support (100.0%), Architecture & Engineering (88.1%), and Computers & Mathematics (75.8%), while the most female-oriented occupations are Health Diagnosing & Treating (100.0%), Health Technologists (100.0%), and Education, Arts & Media (79.5%).
| Occupation | Male | Female |
| Management | 285 (56.7%) | 218 (43.3%) |
| Business & Financial | 99 (44.6%) | 123 (55.4%) |
| Computers, Engineering & Science | 234 (75.5%) | 76 (24.5%) |
| Computers & Mathematics | 72 (75.8%) | 23 (24.2%) |
| Architecture & Engineering | 141 (88.1%) | 19 (11.9%) |
| Life, Physical & Social Science | 21 (38.2%) | 34 (61.8%) |
| Community & Social Service | 158 (29.0%) | 387 (71.0%) |
| Education, Arts & Media | 16 (20.5%) | 62 (79.5%) |
| Legal Services & Support | 20 (100.0%) | 0 (0.0%) |
| Education Instruction & Library | 92 (28.6%) | 230 (71.4%) |
| Arts, Media & Entertainment | 30 (24.0%) | 95 (76.0%) |
| Health Diagnosing & Treating | 0 (0.0%) | 222 (100.0%) |
| Health Technologists | 0 (0.0%) | 184 (100.0%) |
| Total (Category) | 776 (43.1%) | 1,026 (56.9%) |
| Total (Overall) | 3,031 (51.0%) | 2,907 (49.0%) |
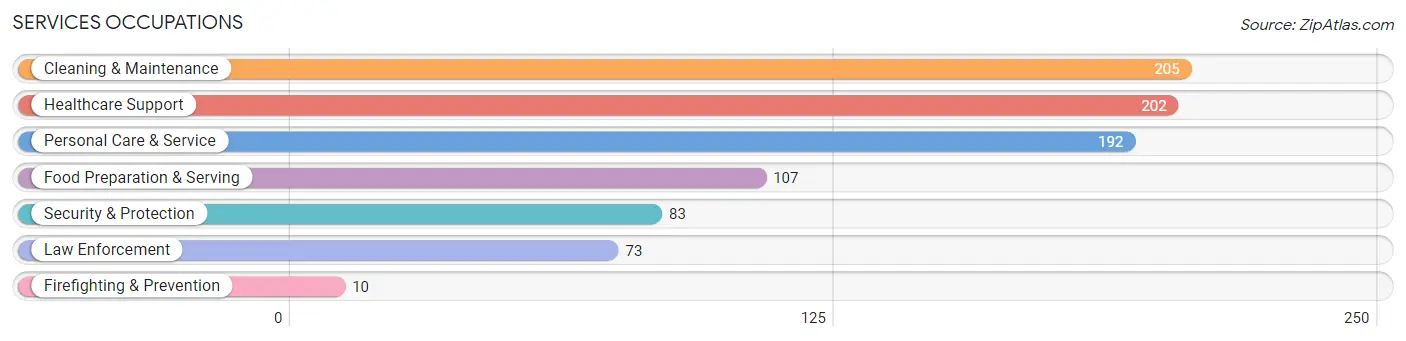
Services Occupations
The most common Services occupations in Stuarts Draft are Cleaning & Maintenance (205 | 3.5%), Healthcare Support (202 | 3.4%), Personal Care & Service (192 | 3.2%), Food Preparation & Serving (107 | 1.8%), and Security & Protection (83 | 1.4%).
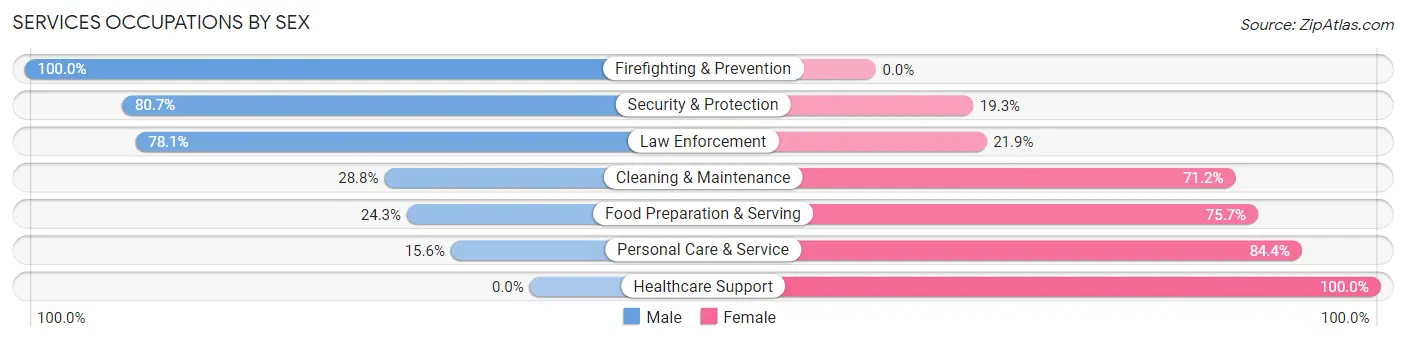
Services Occupations by Sex
Within the Services occupations in Stuarts Draft, the most male-oriented occupations are Firefighting & Prevention (100.0%), Security & Protection (80.7%), and Law Enforcement (78.1%), while the most female-oriented occupations are Healthcare Support (100.0%), Personal Care & Service (84.4%), and Food Preparation & Serving (75.7%).
| Occupation | Male | Female |
| Healthcare Support | 0 (0.0%) | 202 (100.0%) |
| Security & Protection | 67 (80.7%) | 16 (19.3%) |
| Firefighting & Prevention | 10 (100.0%) | 0 (0.0%) |
| Law Enforcement | 57 (78.1%) | 16 (21.9%) |
| Food Preparation & Serving | 26 (24.3%) | 81 (75.7%) |
| Cleaning & Maintenance | 59 (28.8%) | 146 (71.2%) |
| Personal Care & Service | 30 (15.6%) | 162 (84.4%) |
| Total (Category) | 182 (23.1%) | 607 (76.9%) |
| Total (Overall) | 3,031 (51.0%) | 2,907 (49.0%) |
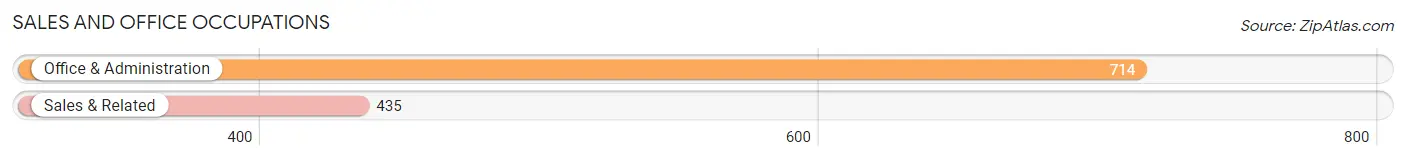
Sales and Office Occupations
The most common Sales and Office occupations in Stuarts Draft are Office & Administration (714 | 12.0%), and Sales & Related (435 | 7.3%).
Sales and Office Occupations by Sex
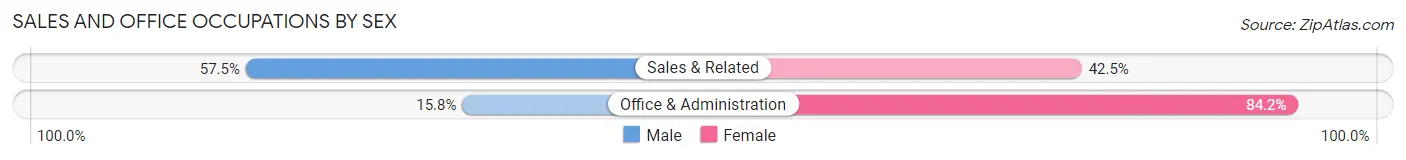
| Occupation | Male | Female |
| Sales & Related | 250 (57.5%) | 185 (42.5%) |
| Office & Administration | 113 (15.8%) | 601 (84.2%) |
| Total (Category) | 363 (31.6%) | 786 (68.4%) |
| Total (Overall) | 3,031 (51.0%) | 2,907 (49.0%) |
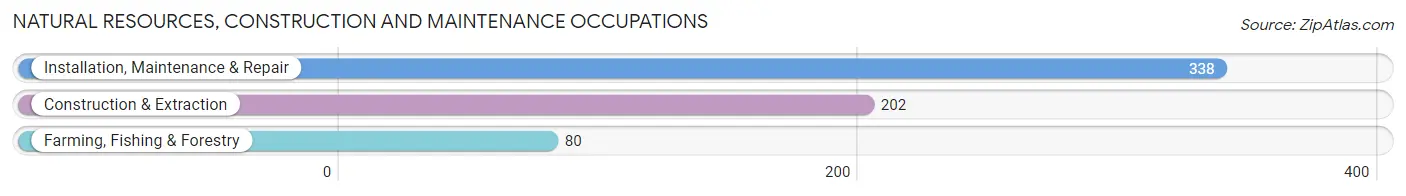
Natural Resources, Construction and Maintenance Occupations
The most common Natural Resources, Construction and Maintenance occupations in Stuarts Draft are Installation, Maintenance & Repair (338 | 5.7%), Construction & Extraction (202 | 3.4%), and Farming, Fishing & Forestry (80 | 1.3%).
Natural Resources, Construction and Maintenance Occupations by Sex
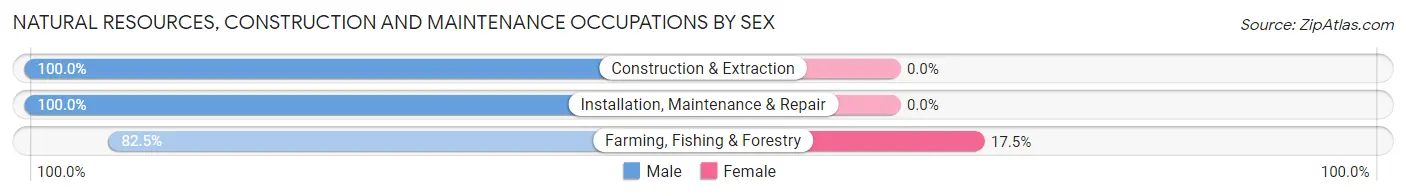
| Occupation | Male | Female |
| Farming, Fishing & Forestry | 66 (82.5%) | 14 (17.5%) |
| Construction & Extraction | 202 (100.0%) | 0 (0.0%) |
| Installation, Maintenance & Repair | 338 (100.0%) | 0 (0.0%) |
| Total (Category) | 606 (97.7%) | 14 (2.3%) |
| Total (Overall) | 3,031 (51.0%) | 2,907 (49.0%) |
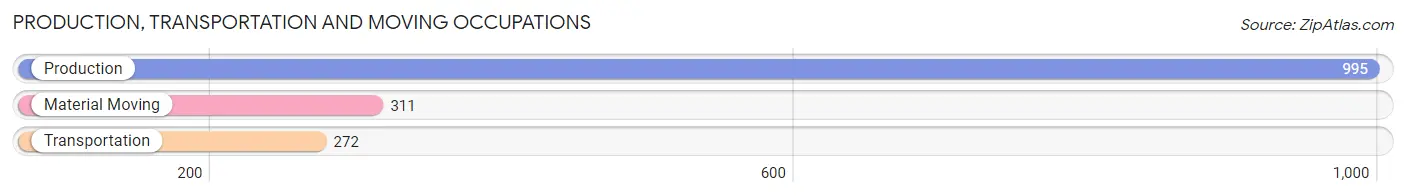
Production, Transportation and Moving Occupations
The most common Production, Transportation and Moving occupations in Stuarts Draft are Production (995 | 16.8%), Material Moving (311 | 5.2%), and Transportation (272 | 4.6%).
Production, Transportation and Moving Occupations by Sex
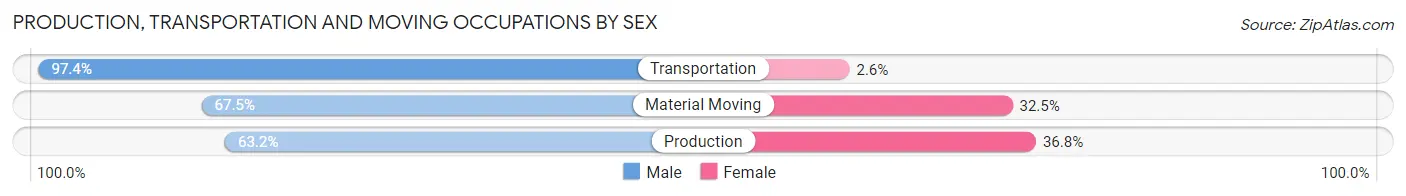
| Occupation | Male | Female |
| Production | 629 (63.2%) | 366 (36.8%) |
| Transportation | 265 (97.4%) | 7 (2.6%) |
| Material Moving | 210 (67.5%) | 101 (32.5%) |
| Total (Category) | 1,104 (70.0%) | 474 (30.0%) |
| Total (Overall) | 3,031 (51.0%) | 2,907 (49.0%) |
Employment Industries by Sex in Stuarts Draft
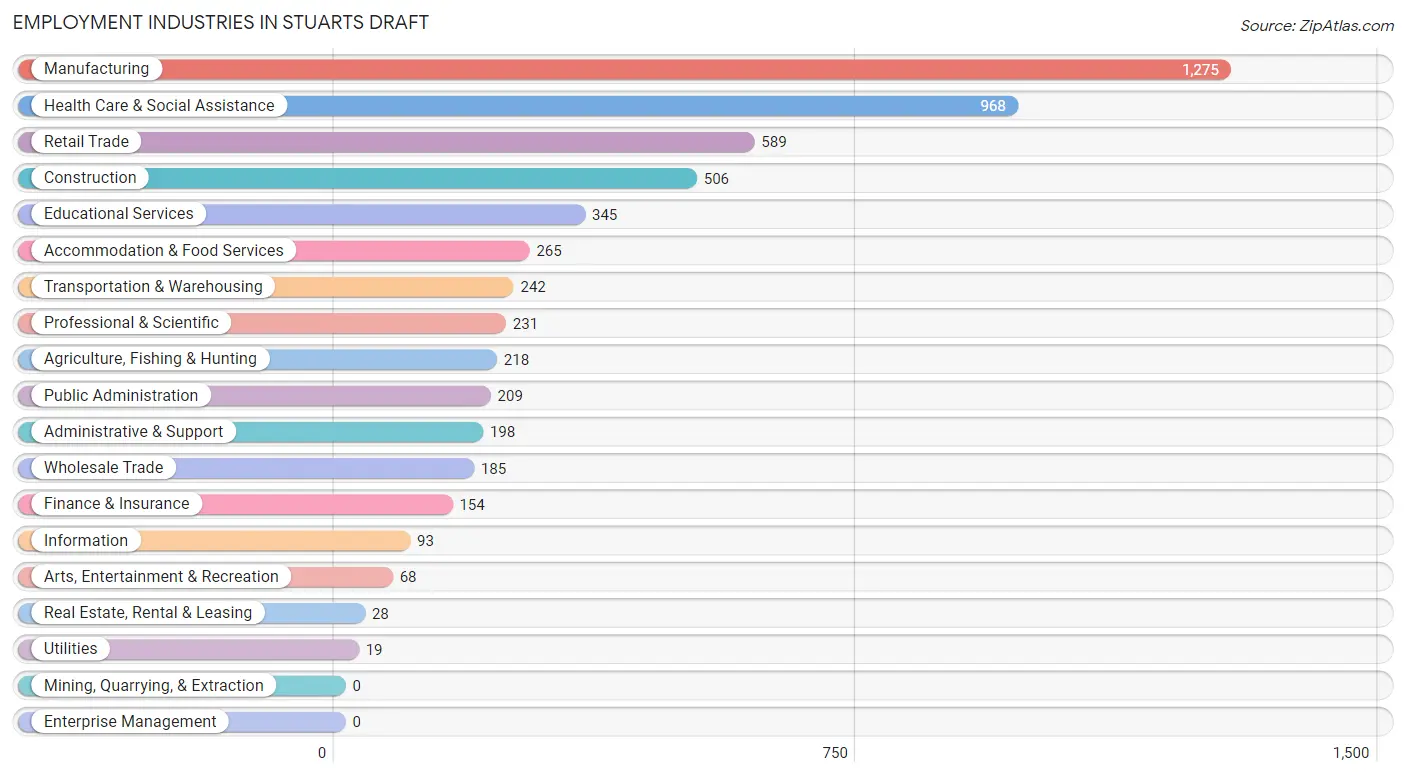
Employment Industries in Stuarts Draft
The major employment industries in Stuarts Draft include Manufacturing (1,275 | 21.5%), Health Care & Social Assistance (968 | 16.3%), Retail Trade (589 | 9.9%), Construction (506 | 8.5%), and Educational Services (345 | 5.8%).
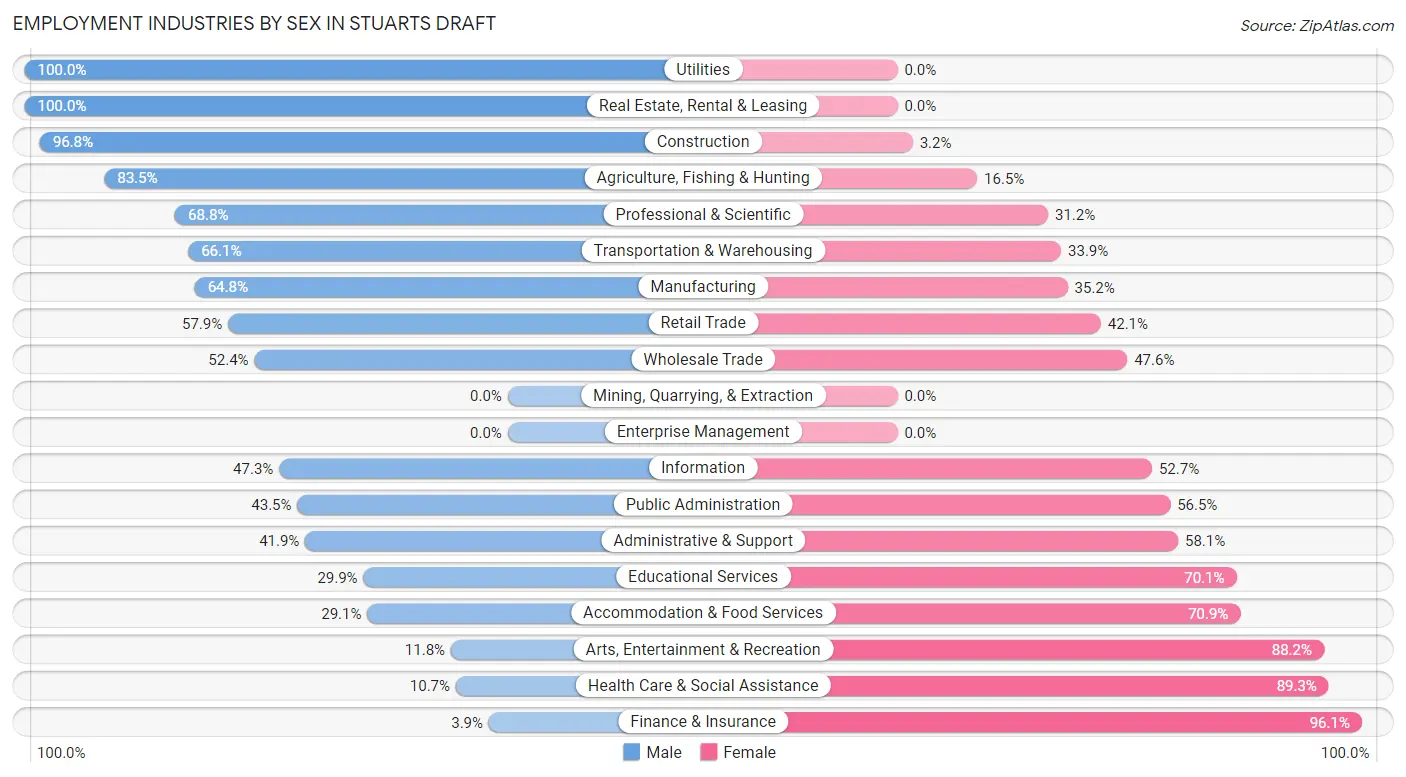
Employment Industries by Sex in Stuarts Draft
The Stuarts Draft industries that see more men than women are Utilities (100.0%), Real Estate, Rental & Leasing (100.0%), and Construction (96.8%), whereas the industries that tend to have a higher number of women are Finance & Insurance (96.1%), Health Care & Social Assistance (89.3%), and Arts, Entertainment & Recreation (88.2%).
| Industry | Male | Female |
| Agriculture, Fishing & Hunting | 182 (83.5%) | 36 (16.5%) |
| Mining, Quarrying, & Extraction | 0 (0.0%) | 0 (0.0%) |
| Construction | 490 (96.8%) | 16 (3.2%) |
| Manufacturing | 826 (64.8%) | 449 (35.2%) |
| Wholesale Trade | 97 (52.4%) | 88 (47.6%) |
| Retail Trade | 341 (57.9%) | 248 (42.1%) |
| Transportation & Warehousing | 160 (66.1%) | 82 (33.9%) |
| Utilities | 19 (100.0%) | 0 (0.0%) |
| Information | 44 (47.3%) | 49 (52.7%) |
| Finance & Insurance | 6 (3.9%) | 148 (96.1%) |
| Real Estate, Rental & Leasing | 28 (100.0%) | 0 (0.0%) |
| Professional & Scientific | 159 (68.8%) | 72 (31.2%) |
| Enterprise Management | 0 (0.0%) | 0 (0.0%) |
| Administrative & Support | 83 (41.9%) | 115 (58.1%) |
| Educational Services | 103 (29.9%) | 242 (70.1%) |
| Health Care & Social Assistance | 104 (10.7%) | 864 (89.3%) |
| Arts, Entertainment & Recreation | 8 (11.8%) | 60 (88.2%) |
| Accommodation & Food Services | 77 (29.1%) | 188 (70.9%) |
| Public Administration | 91 (43.5%) | 118 (56.5%) |
| Total | 3,031 (51.0%) | 2,907 (49.0%) |
Education in Stuarts Draft
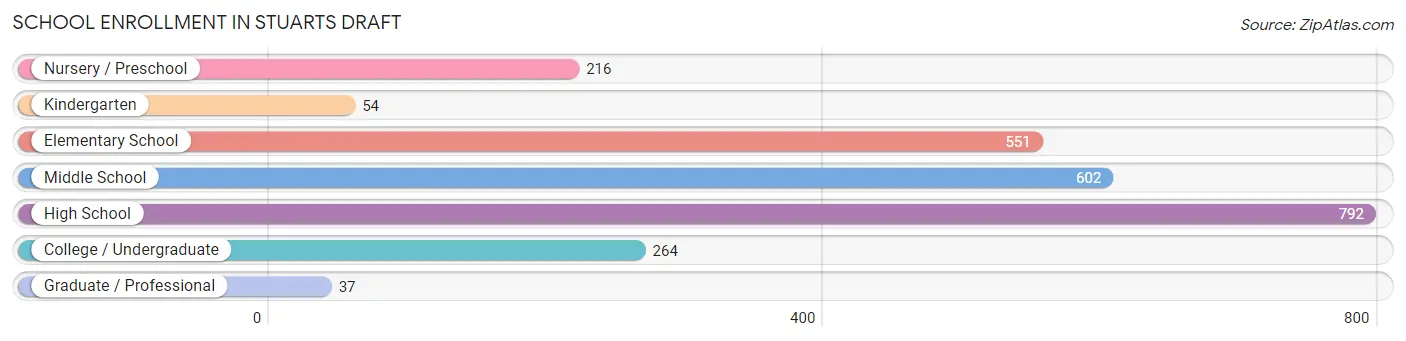
School Enrollment in Stuarts Draft
The most common levels of schooling among the 2,516 students in Stuarts Draft are high school (792 | 31.5%), middle school (602 | 23.9%), and elementary school (551 | 21.9%).
| School Level | # Students | % Students |
| Nursery / Preschool | 216 | 8.6% |
| Kindergarten | 54 | 2.1% |
| Elementary School | 551 | 21.9% |
| Middle School | 602 | 23.9% |
| High School | 792 | 31.5% |
| College / Undergraduate | 264 | 10.5% |
| Graduate / Professional | 37 | 1.5% |
| Total | 2,516 | 100.0% |
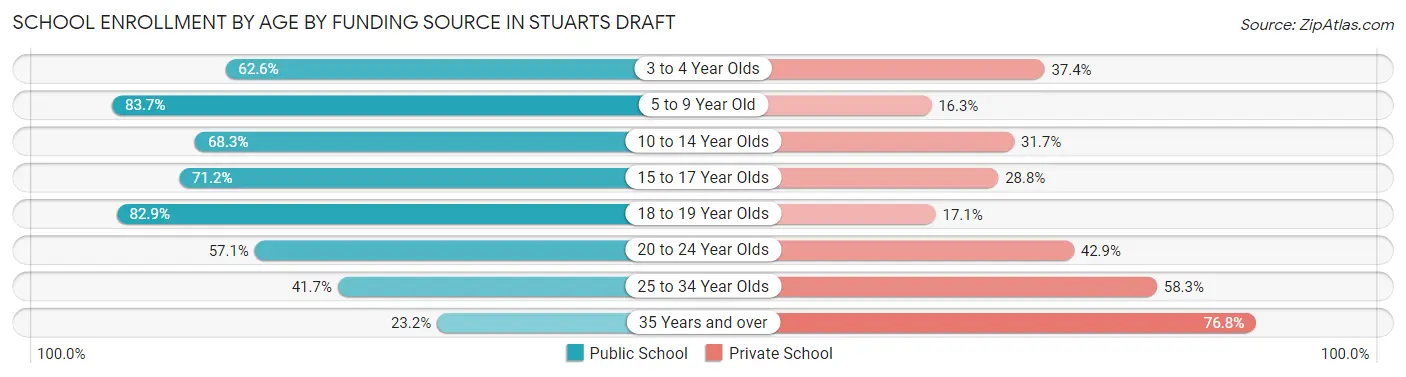
School Enrollment by Age by Funding Source in Stuarts Draft
Out of a total of 2,516 students who are enrolled in schools in Stuarts Draft, 727 (28.9%) attend a private institution, while the remaining 1,789 (71.1%) are enrolled in public schools. The age group of 35 years and over has the highest likelihood of being enrolled in private schools, with 53 (76.8% in the age bracket) enrolled. Conversely, the age group of 5 to 9 year old has the lowest likelihood of being enrolled in a private school, with 575 (83.7% in the age bracket) attending a public institution.
| Age Bracket | Public School | Private School |
| 3 to 4 Year Olds | 82 (62.6%) | 49 (37.4%) |
| 5 to 9 Year Old | 575 (83.7%) | 112 (16.3%) |
| 10 to 14 Year Olds | 527 (68.3%) | 245 (31.7%) |
| 15 to 17 Year Olds | 438 (71.2%) | 177 (28.8%) |
| 18 to 19 Year Olds | 92 (82.9%) | 19 (17.1%) |
| 20 to 24 Year Olds | 20 (57.1%) | 15 (42.9%) |
| 25 to 34 Year Olds | 40 (41.7%) | 56 (58.3%) |
| 35 Years and over | 16 (23.2%) | 53 (76.8%) |
| Total | 1,789 (71.1%) | 727 (28.9%) |
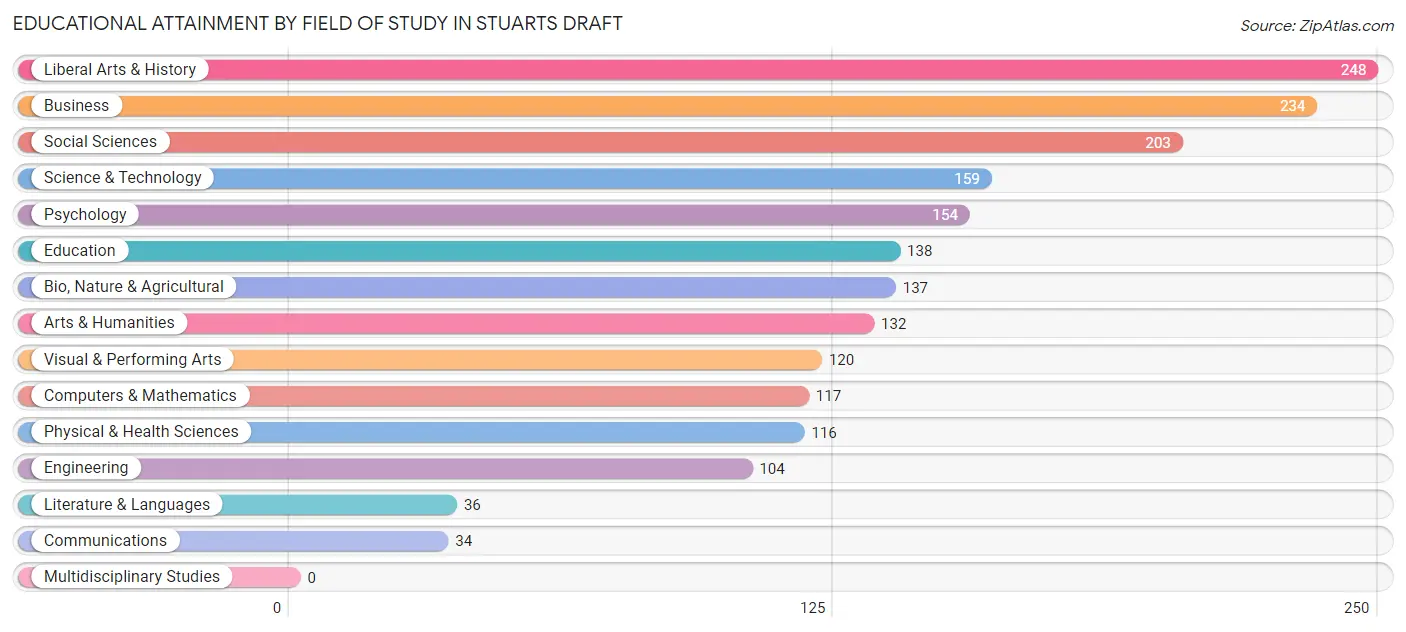
Educational Attainment by Field of Study in Stuarts Draft
Liberal arts & history (248 | 12.8%), business (234 | 12.1%), social sciences (203 | 10.5%), science & technology (159 | 8.2%), and psychology (154 | 8.0%) are the most common fields of study among 1,932 individuals in Stuarts Draft who have obtained a bachelor's degree or higher.
| Field of Study | # Graduates | % Graduates |
| Computers & Mathematics | 117 | 6.1% |
| Bio, Nature & Agricultural | 137 | 7.1% |
| Physical & Health Sciences | 116 | 6.0% |
| Psychology | 154 | 8.0% |
| Social Sciences | 203 | 10.5% |
| Engineering | 104 | 5.4% |
| Multidisciplinary Studies | 0 | 0.0% |
| Science & Technology | 159 | 8.2% |
| Business | 234 | 12.1% |
| Education | 138 | 7.1% |
| Literature & Languages | 36 | 1.9% |
| Liberal Arts & History | 248 | 12.8% |
| Visual & Performing Arts | 120 | 6.2% |
| Communications | 34 | 1.8% |
| Arts & Humanities | 132 | 6.8% |
| Total | 1,932 | 100.0% |
Transportation & Commute in Stuarts Draft
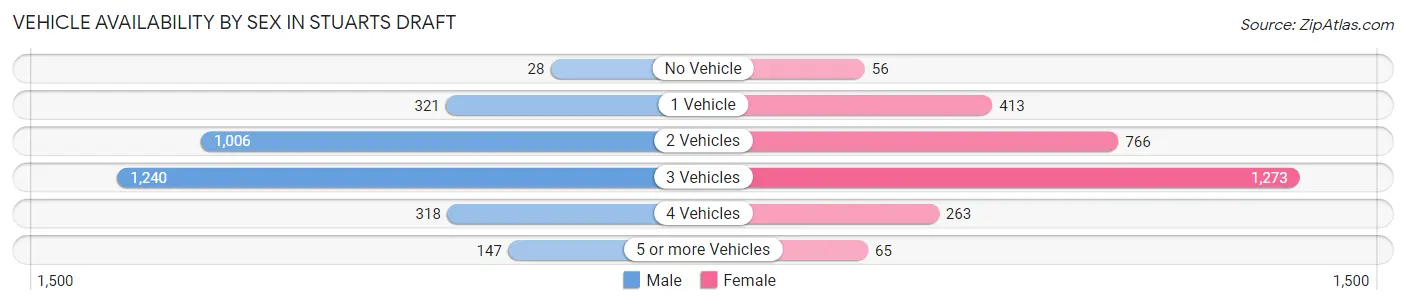
Vehicle Availability by Sex in Stuarts Draft
The most prevalent vehicle ownership categories in Stuarts Draft are males with 3 vehicles (1,240, accounting for 40.5%) and females with 3 vehicles (1,273, making up 43.7%).
| Vehicles Available | Male | Female |
| No Vehicle | 28 (0.9%) | 56 (2.0%) |
| 1 Vehicle | 321 (10.5%) | 413 (14.6%) |
| 2 Vehicles | 1,006 (32.9%) | 766 (27.0%) |
| 3 Vehicles | 1,240 (40.5%) | 1,273 (44.9%) |
| 4 Vehicles | 318 (10.4%) | 263 (9.3%) |
| 5 or more Vehicles | 147 (4.8%) | 65 (2.3%) |
| Total | 3,060 (100.0%) | 2,836 (100.0%) |
Commute Time in Stuarts Draft
The most frequently occuring commute durations in Stuarts Draft are 5 to 9 minutes (1,120 commuters, 20.1%), 10 to 14 minutes (946 commuters, 17.0%), and 15 to 19 minutes (945 commuters, 17.0%).
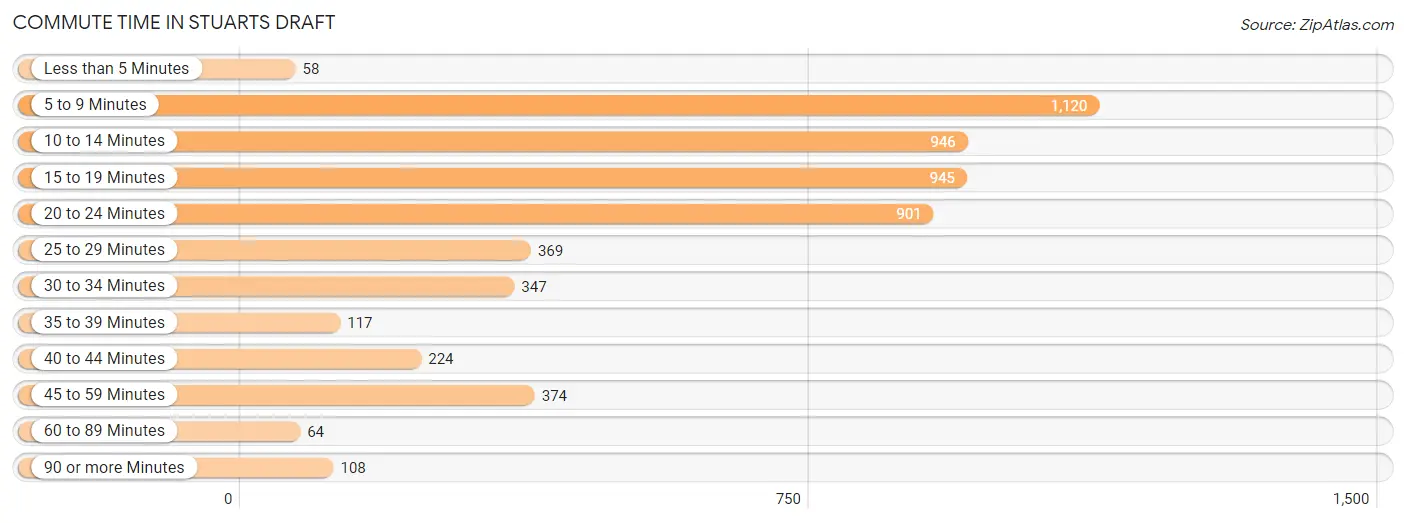
| Commute Time | # Commuters | % Commuters |
| Less than 5 Minutes | 58 | 1.0% |
| 5 to 9 Minutes | 1,120 | 20.1% |
| 10 to 14 Minutes | 946 | 17.0% |
| 15 to 19 Minutes | 945 | 17.0% |
| 20 to 24 Minutes | 901 | 16.2% |
| 25 to 29 Minutes | 369 | 6.6% |
| 30 to 34 Minutes | 347 | 6.2% |
| 35 to 39 Minutes | 117 | 2.1% |
| 40 to 44 Minutes | 224 | 4.0% |
| 45 to 59 Minutes | 374 | 6.7% |
| 60 to 89 Minutes | 64 | 1.1% |
| 90 or more Minutes | 108 | 1.9% |
Commute Time by Sex in Stuarts Draft
The most common commute times in Stuarts Draft are 10 to 14 minutes (559 commuters, 18.9%) for males and 5 to 9 minutes (562 commuters, 21.6%) for females.
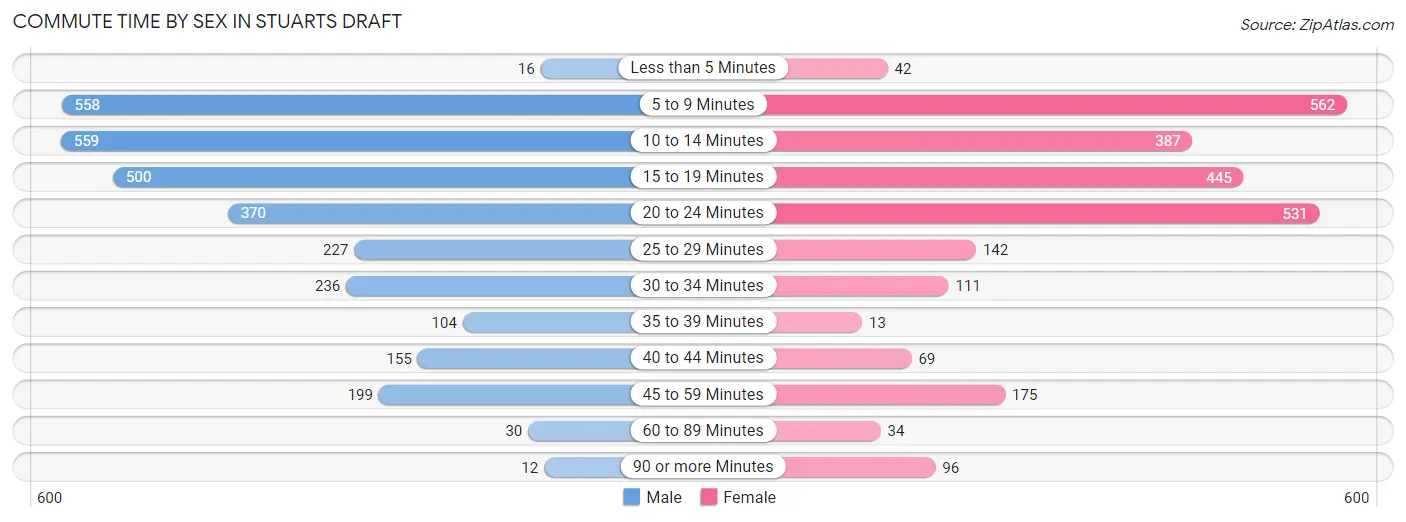
| Commute Time | Male | Female |
| Less than 5 Minutes | 16 (0.5%) | 42 (1.6%) |
| 5 to 9 Minutes | 558 (18.8%) | 562 (21.6%) |
| 10 to 14 Minutes | 559 (18.9%) | 387 (14.8%) |
| 15 to 19 Minutes | 500 (16.9%) | 445 (17.1%) |
| 20 to 24 Minutes | 370 (12.5%) | 531 (20.4%) |
| 25 to 29 Minutes | 227 (7.6%) | 142 (5.4%) |
| 30 to 34 Minutes | 236 (8.0%) | 111 (4.3%) |
| 35 to 39 Minutes | 104 (3.5%) | 13 (0.5%) |
| 40 to 44 Minutes | 155 (5.2%) | 69 (2.6%) |
| 45 to 59 Minutes | 199 (6.7%) | 175 (6.7%) |
| 60 to 89 Minutes | 30 (1.0%) | 34 (1.3%) |
| 90 or more Minutes | 12 (0.4%) | 96 (3.7%) |
Time of Departure to Work by Sex in Stuarts Draft
The most frequent times of departure to work in Stuarts Draft are 4:00 PM to 11:59 PM (440, 14.8%) for males and 8:00 AM to 8:29 AM (479, 18.4%) for females.
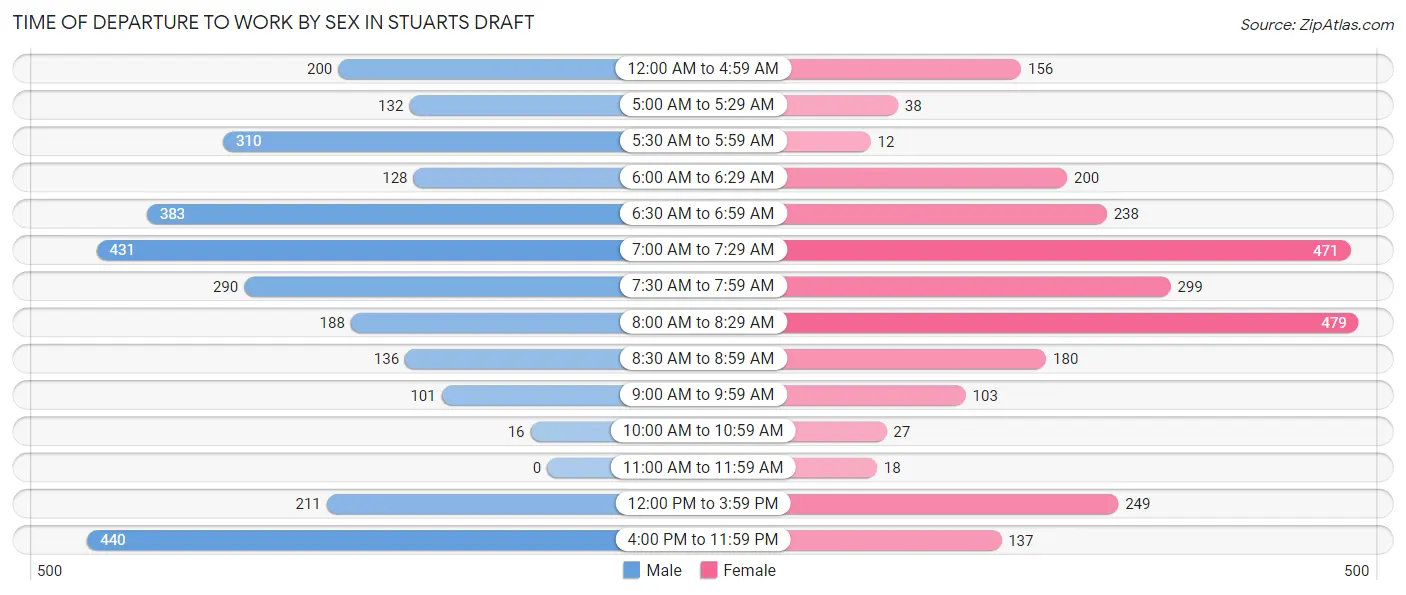
| Time of Departure | Male | Female |
| 12:00 AM to 4:59 AM | 200 (6.7%) | 156 (6.0%) |
| 5:00 AM to 5:29 AM | 132 (4.4%) | 38 (1.5%) |
| 5:30 AM to 5:59 AM | 310 (10.4%) | 12 (0.5%) |
| 6:00 AM to 6:29 AM | 128 (4.3%) | 200 (7.7%) |
| 6:30 AM to 6:59 AM | 383 (12.9%) | 238 (9.1%) |
| 7:00 AM to 7:29 AM | 431 (14.5%) | 471 (18.1%) |
| 7:30 AM to 7:59 AM | 290 (9.8%) | 299 (11.5%) |
| 8:00 AM to 8:29 AM | 188 (6.3%) | 479 (18.4%) |
| 8:30 AM to 8:59 AM | 136 (4.6%) | 180 (6.9%) |
| 9:00 AM to 9:59 AM | 101 (3.4%) | 103 (4.0%) |
| 10:00 AM to 10:59 AM | 16 (0.5%) | 27 (1.0%) |
| 11:00 AM to 11:59 AM | 0 (0.0%) | 18 (0.7%) |
| 12:00 PM to 3:59 PM | 211 (7.1%) | 249 (9.6%) |
| 4:00 PM to 11:59 PM | 440 (14.8%) | 137 (5.3%) |
| Total | 2,966 (100.0%) | 2,607 (100.0%) |
Housing Occupancy in Stuarts Draft
Occupancy by Ownership in Stuarts Draft
Of the total 4,710 dwellings in Stuarts Draft, owner-occupied units account for 3,383 (71.8%), while renter-occupied units make up 1,327 (28.2%).
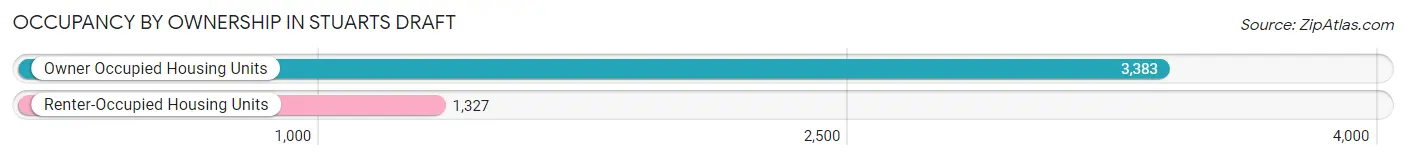
| Occupancy | # Housing Units | % Housing Units |
| Owner Occupied Housing Units | 3,383 | 71.8% |
| Renter-Occupied Housing Units | 1,327 | 28.2% |
| Total Occupied Housing Units | 4,710 | 100.0% |
Occupancy by Household Size in Stuarts Draft
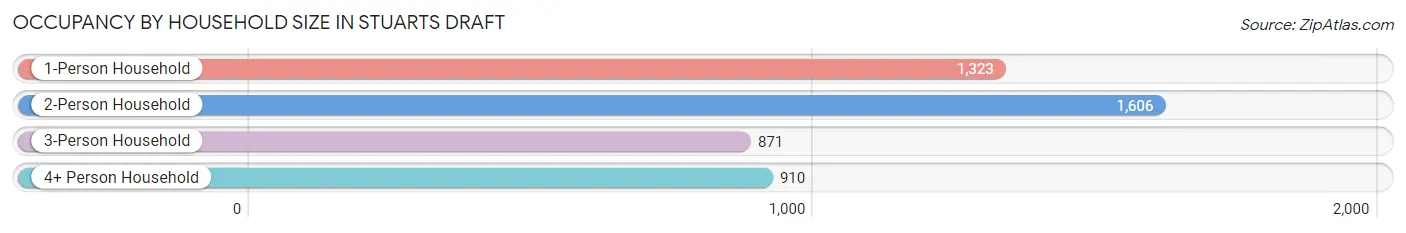
| Household Size | # Housing Units | % Housing Units |
| 1-Person Household | 1,323 | 28.1% |
| 2-Person Household | 1,606 | 34.1% |
| 3-Person Household | 871 | 18.5% |
| 4+ Person Household | 910 | 19.3% |
| Total Housing Units | 4,710 | 100.0% |
Occupancy by Ownership by Household Size in Stuarts Draft
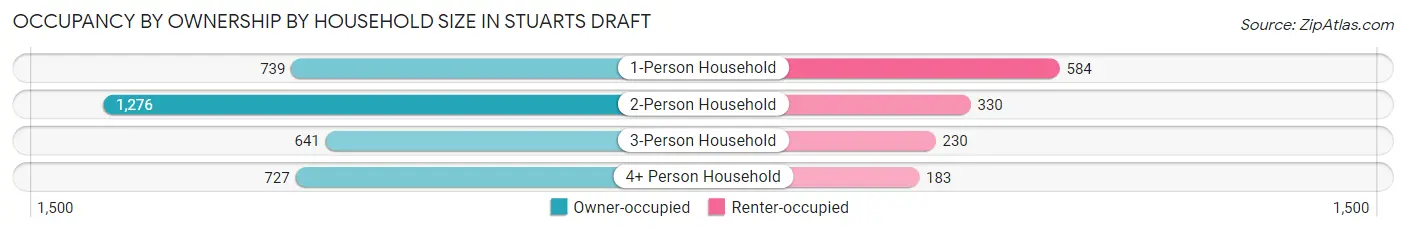
| Household Size | Owner-occupied | Renter-occupied |
| 1-Person Household | 739 (55.9%) | 584 (44.1%) |
| 2-Person Household | 1,276 (79.4%) | 330 (20.5%) |
| 3-Person Household | 641 (73.6%) | 230 (26.4%) |
| 4+ Person Household | 727 (79.9%) | 183 (20.1%) |
| Total Housing Units | 3,383 (71.8%) | 1,327 (28.2%) |
Occupancy by Educational Attainment in Stuarts Draft
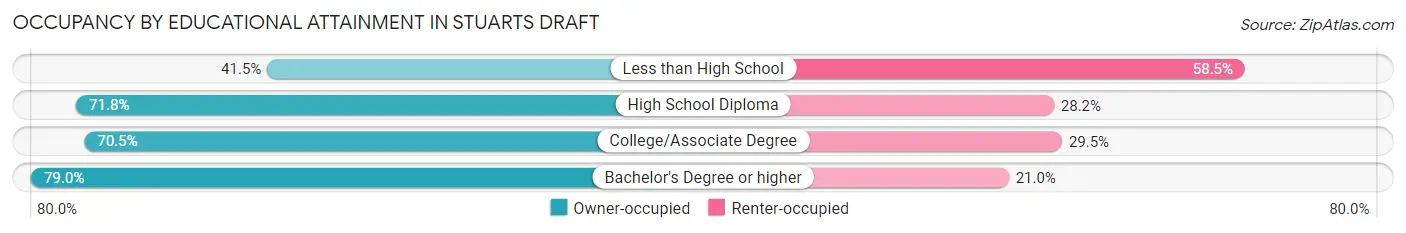
| Household Size | Owner-occupied | Renter-occupied |
| Less than High School | 98 (41.5%) | 138 (58.5%) |
| High School Diploma | 1,272 (71.8%) | 499 (28.2%) |
| College/Associate Degree | 1,017 (70.5%) | 425 (29.5%) |
| Bachelor's Degree or higher | 996 (79.0%) | 265 (21.0%) |
Occupancy by Age of Householder in Stuarts Draft
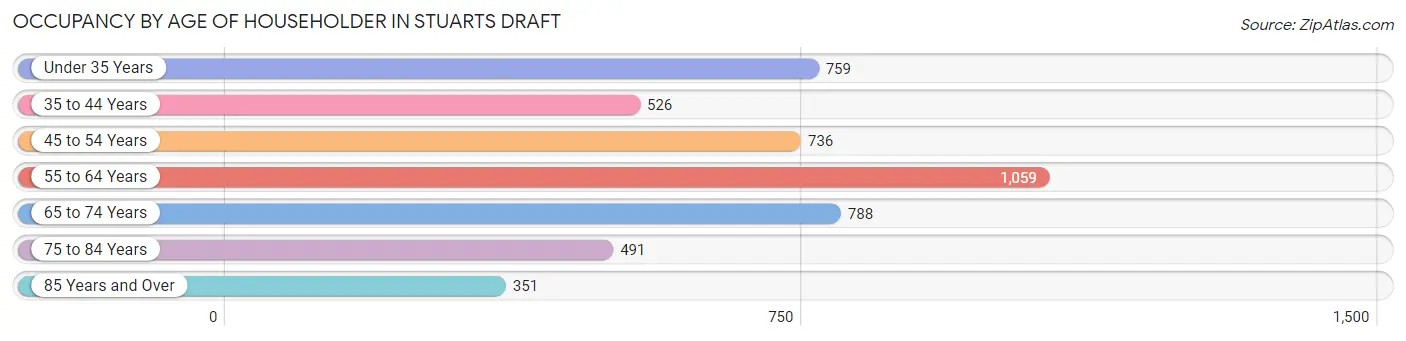
| Age Bracket | # Households | % Households |
| Under 35 Years | 759 | 16.1% |
| 35 to 44 Years | 526 | 11.2% |
| 45 to 54 Years | 736 | 15.6% |
| 55 to 64 Years | 1,059 | 22.5% |
| 65 to 74 Years | 788 | 16.7% |
| 75 to 84 Years | 491 | 10.4% |
| 85 Years and Over | 351 | 7.4% |
| Total | 4,710 | 100.0% |
Housing Finances in Stuarts Draft
Median Income by Occupancy in Stuarts Draft
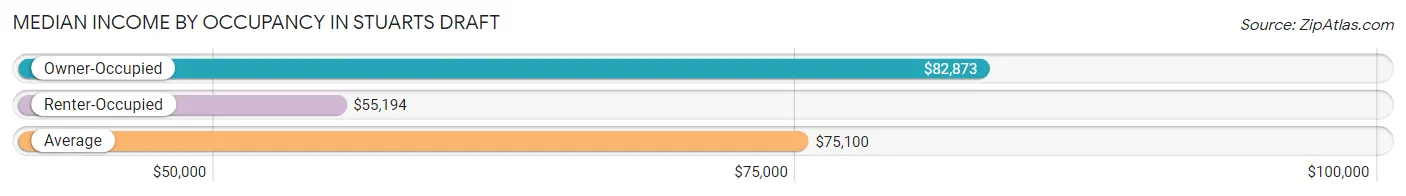
| Occupancy Type | # Households | Median Income |
| Owner-Occupied | 3,383 (71.8%) | $82,873 |
| Renter-Occupied | 1,327 (28.2%) | $55,194 |
| Average | 4,710 (100.0%) | $75,100 |
Occupancy by Householder Income Bracket in Stuarts Draft
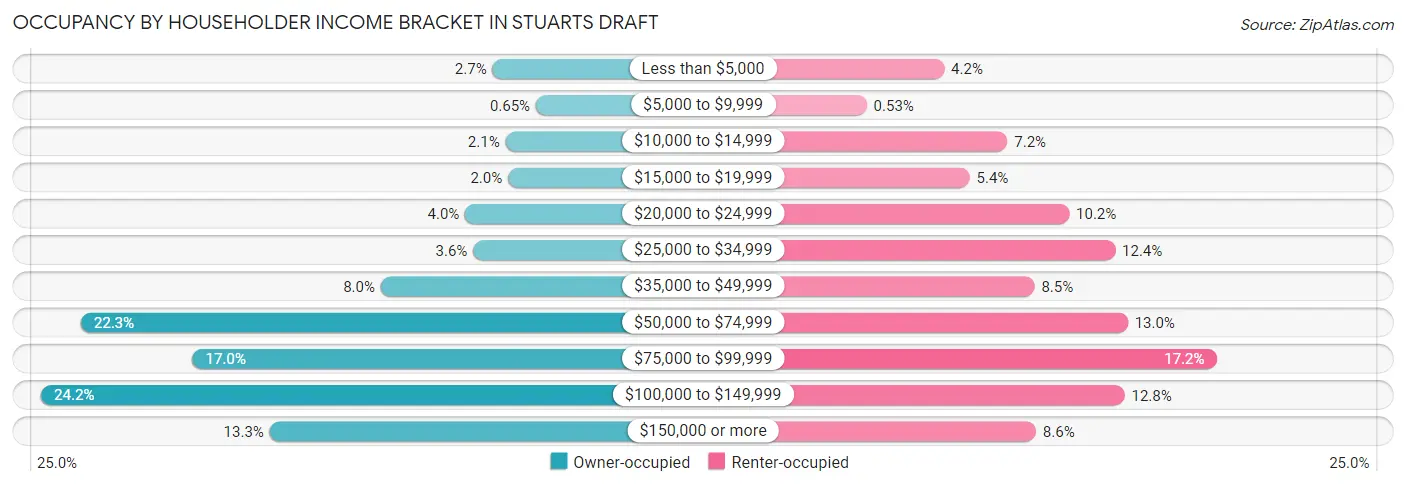
| Income Bracket | Owner-occupied | Renter-occupied |
| Less than $5,000 | 92 (2.7%) | 56 (4.2%) |
| $5,000 to $9,999 | 22 (0.6%) | 7 (0.5%) |
| $10,000 to $14,999 | 71 (2.1%) | 96 (7.2%) |
| $15,000 to $19,999 | 67 (2.0%) | 72 (5.4%) |
| $20,000 to $24,999 | 136 (4.0%) | 135 (10.2%) |
| $25,000 to $34,999 | 123 (3.6%) | 164 (12.4%) |
| $35,000 to $49,999 | 272 (8.0%) | 113 (8.5%) |
| $50,000 to $74,999 | 755 (22.3%) | 172 (13.0%) |
| $75,000 to $99,999 | 575 (17.0%) | 228 (17.2%) |
| $100,000 to $149,999 | 819 (24.2%) | 170 (12.8%) |
| $150,000 or more | 451 (13.3%) | 114 (8.6%) |
| Total | 3,383 (100.0%) | 1,327 (100.0%) |
Monthly Housing Cost Tiers in Stuarts Draft
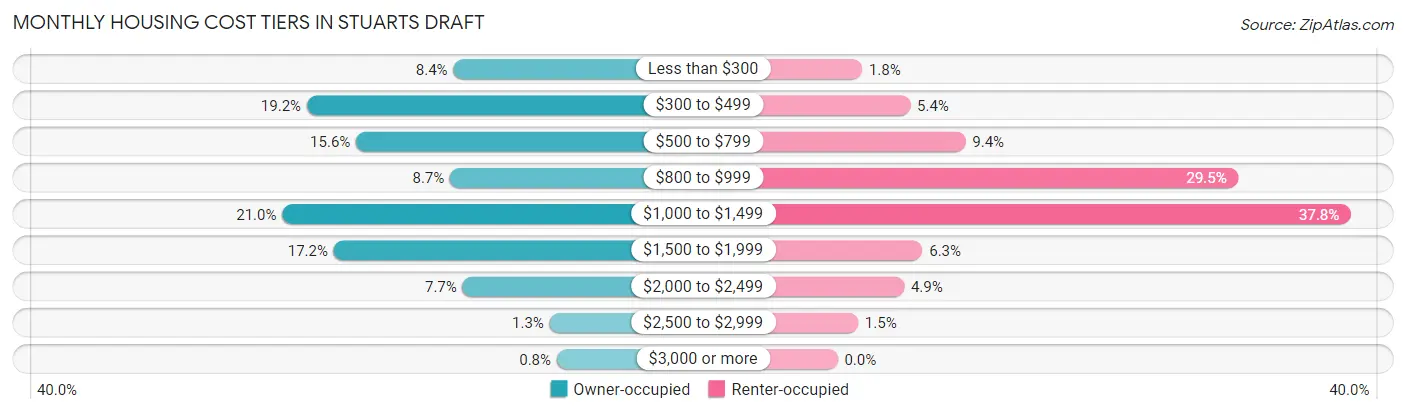
| Monthly Cost | Owner-occupied | Renter-occupied |
| Less than $300 | 285 (8.4%) | 24 (1.8%) |
| $300 to $499 | 650 (19.2%) | 71 (5.3%) |
| $500 to $799 | 527 (15.6%) | 125 (9.4%) |
| $800 to $999 | 293 (8.7%) | 392 (29.5%) |
| $1,000 to $1,499 | 711 (21.0%) | 502 (37.8%) |
| $1,500 to $1,999 | 583 (17.2%) | 83 (6.2%) |
| $2,000 to $2,499 | 262 (7.7%) | 65 (4.9%) |
| $2,500 to $2,999 | 45 (1.3%) | 20 (1.5%) |
| $3,000 or more | 27 (0.8%) | 0 (0.0%) |
| Total | 3,383 (100.0%) | 1,327 (100.0%) |
Physical Housing Characteristics in Stuarts Draft
Housing Structures in Stuarts Draft
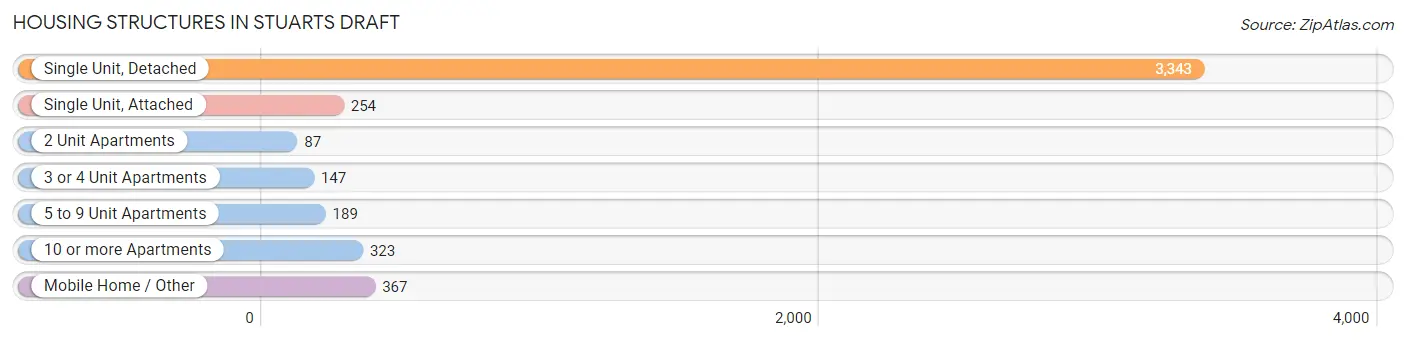
| Structure Type | # Housing Units | % Housing Units |
| Single Unit, Detached | 3,343 | 71.0% |
| Single Unit, Attached | 254 | 5.4% |
| 2 Unit Apartments | 87 | 1.8% |
| 3 or 4 Unit Apartments | 147 | 3.1% |
| 5 to 9 Unit Apartments | 189 | 4.0% |
| 10 or more Apartments | 323 | 6.9% |
| Mobile Home / Other | 367 | 7.8% |
| Total | 4,710 | 100.0% |
Housing Structures by Occupancy in Stuarts Draft
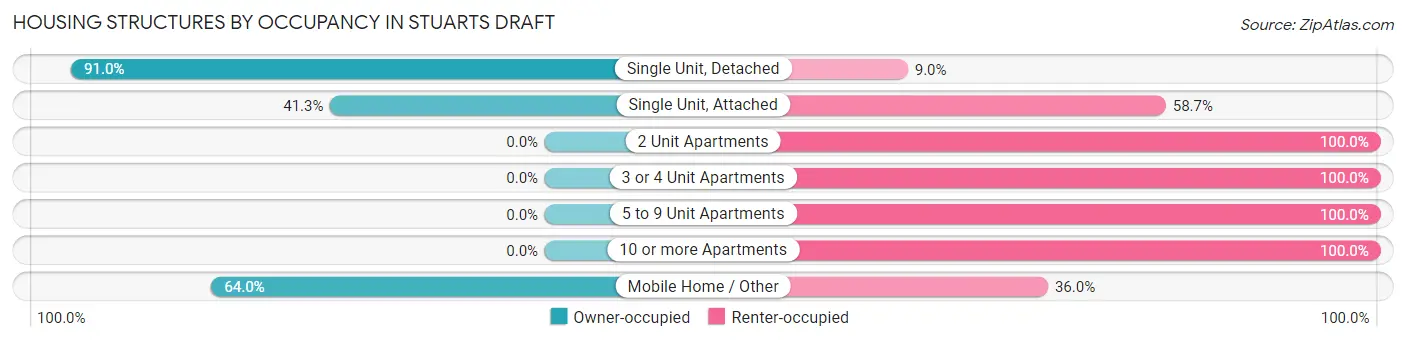
| Structure Type | Owner-occupied | Renter-occupied |
| Single Unit, Detached | 3,043 (91.0%) | 300 (9.0%) |
| Single Unit, Attached | 105 (41.3%) | 149 (58.7%) |
| 2 Unit Apartments | 0 (0.0%) | 87 (100.0%) |
| 3 or 4 Unit Apartments | 0 (0.0%) | 147 (100.0%) |
| 5 to 9 Unit Apartments | 0 (0.0%) | 189 (100.0%) |
| 10 or more Apartments | 0 (0.0%) | 323 (100.0%) |
| Mobile Home / Other | 235 (64.0%) | 132 (36.0%) |
| Total | 3,383 (71.8%) | 1,327 (28.2%) |
Housing Structures by Number of Rooms in Stuarts Draft
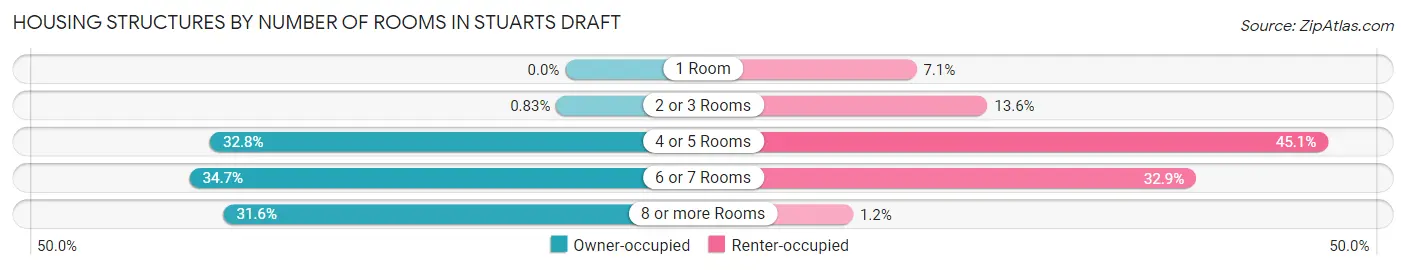
| Number of Rooms | Owner-occupied | Renter-occupied |
| 1 Room | 0 (0.0%) | 94 (7.1%) |
| 2 or 3 Rooms | 28 (0.8%) | 181 (13.6%) |
| 4 or 5 Rooms | 1,111 (32.8%) | 599 (45.1%) |
| 6 or 7 Rooms | 1,175 (34.7%) | 437 (32.9%) |
| 8 or more Rooms | 1,069 (31.6%) | 16 (1.2%) |
| Total | 3,383 (100.0%) | 1,327 (100.0%) |
Housing Structure by Heating Type in Stuarts Draft
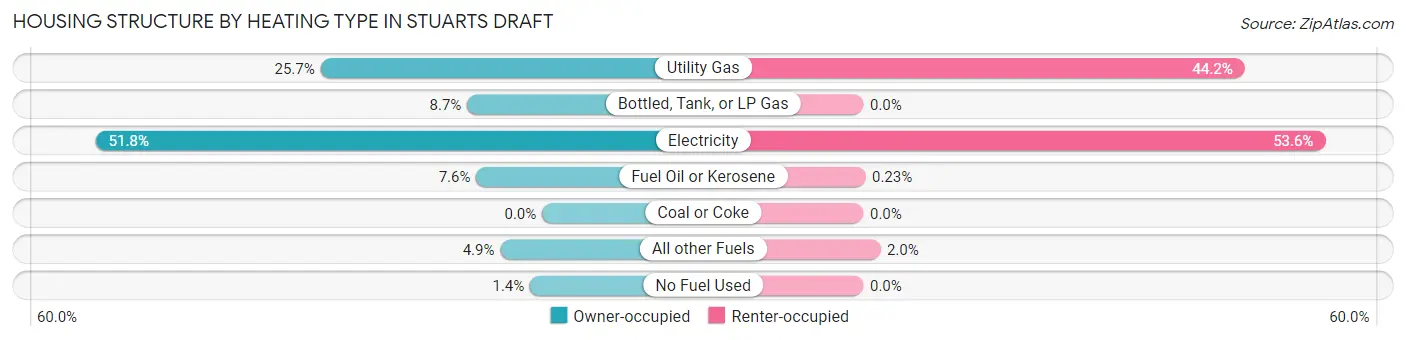
| Heating Type | Owner-occupied | Renter-occupied |
| Utility Gas | 869 (25.7%) | 587 (44.2%) |
| Bottled, Tank, or LP Gas | 294 (8.7%) | 0 (0.0%) |
| Electricity | 1,751 (51.8%) | 711 (53.6%) |
| Fuel Oil or Kerosene | 258 (7.6%) | 3 (0.2%) |
| Coal or Coke | 0 (0.0%) | 0 (0.0%) |
| All other Fuels | 164 (4.9%) | 26 (2.0%) |
| No Fuel Used | 47 (1.4%) | 0 (0.0%) |
| Total | 3,383 (100.0%) | 1,327 (100.0%) |
Household Vehicle Usage in Stuarts Draft
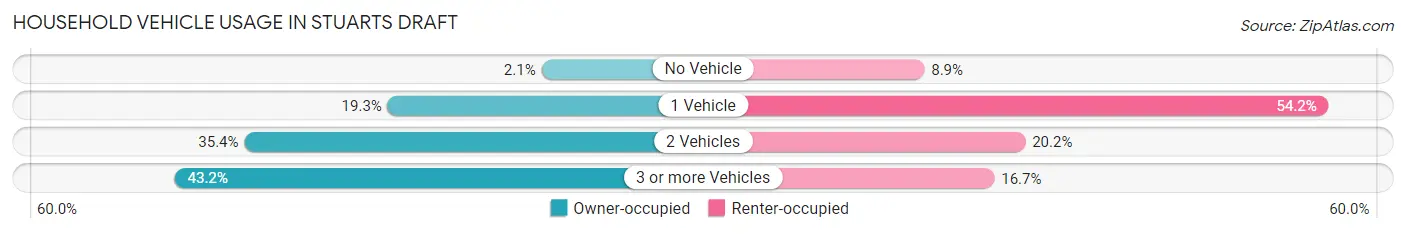
| Vehicles per Household | Owner-occupied | Renter-occupied |
| No Vehicle | 71 (2.1%) | 118 (8.9%) |
| 1 Vehicle | 654 (19.3%) | 719 (54.2%) |
| 2 Vehicles | 1,197 (35.4%) | 268 (20.2%) |
| 3 or more Vehicles | 1,461 (43.2%) | 222 (16.7%) |
| Total | 3,383 (100.0%) | 1,327 (100.0%) |
Real Estate & Mortgages in Stuarts Draft
Real Estate and Mortgage Overview in Stuarts Draft
| Characteristic | Without Mortgage | With Mortgage |
| Housing Units | 1,342 | 2,041 |
| Median Property Value | $228,200 | $249,000 |
| Median Household Income | $62,564 | $305 |
| Monthly Housing Costs | $386 | $27 |
| Real Estate Taxes | $1,195 | $6 |
Property Value by Mortgage Status in Stuarts Draft
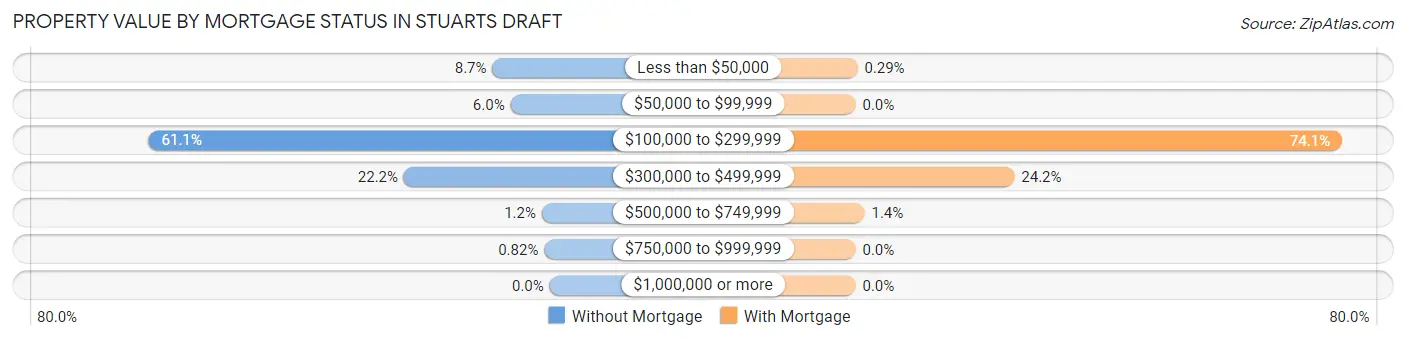
| Property Value | Without Mortgage | With Mortgage |
| Less than $50,000 | 117 (8.7%) | 6 (0.3%) |
| $50,000 to $99,999 | 80 (6.0%) | 0 (0.0%) |
| $100,000 to $299,999 | 820 (61.1%) | 1,513 (74.1%) |
| $300,000 to $499,999 | 298 (22.2%) | 494 (24.2%) |
| $500,000 to $749,999 | 16 (1.2%) | 28 (1.4%) |
| $750,000 to $999,999 | 11 (0.8%) | 0 (0.0%) |
| $1,000,000 or more | 0 (0.0%) | 0 (0.0%) |
| Total | 1,342 (100.0%) | 2,041 (100.0%) |
Household Income by Mortgage Status in Stuarts Draft
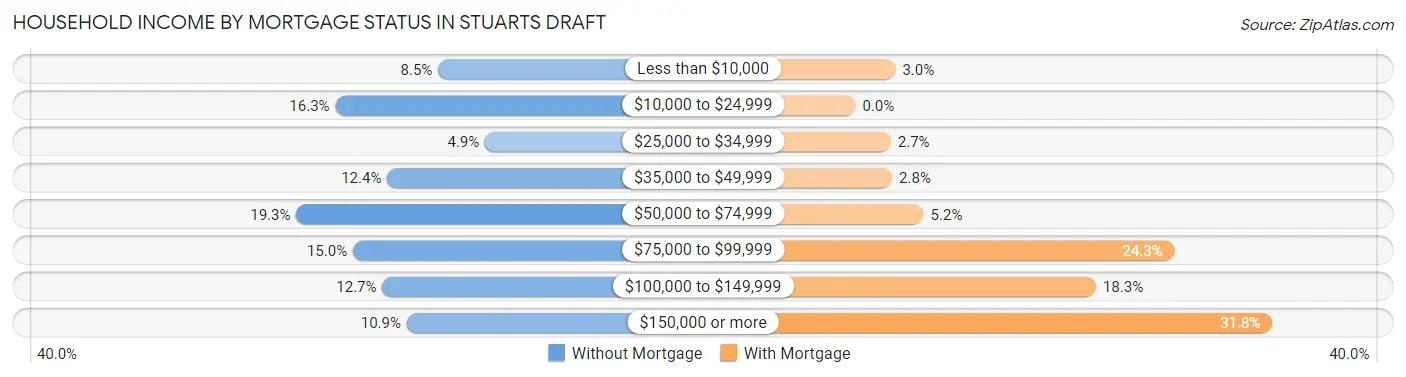
| Household Income | Without Mortgage | With Mortgage |
| Less than $10,000 | 114 (8.5%) | 62 (3.0%) |
| $10,000 to $24,999 | 219 (16.3%) | 0 (0.0%) |
| $25,000 to $34,999 | 66 (4.9%) | 55 (2.7%) |
| $35,000 to $49,999 | 166 (12.4%) | 57 (2.8%) |
| $50,000 to $74,999 | 259 (19.3%) | 106 (5.2%) |
| $75,000 to $99,999 | 201 (15.0%) | 496 (24.3%) |
| $100,000 to $149,999 | 171 (12.7%) | 374 (18.3%) |
| $150,000 or more | 146 (10.9%) | 648 (31.8%) |
| Total | 1,342 (100.0%) | 2,041 (100.0%) |
Property Value to Household Income Ratio in Stuarts Draft
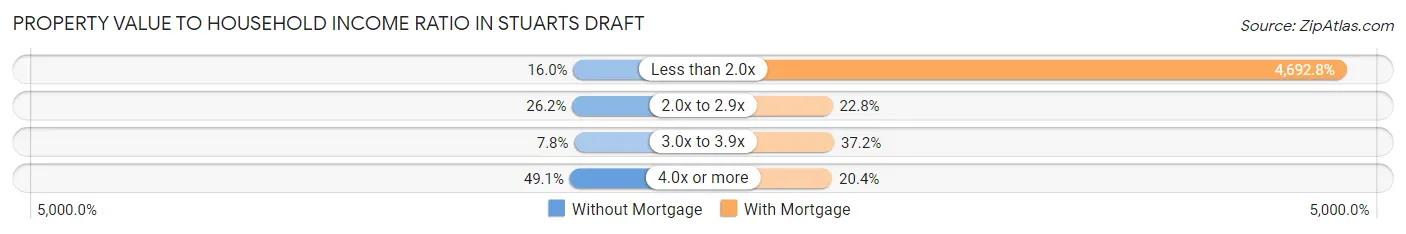
| Value-to-Income Ratio | Without Mortgage | With Mortgage |
| Less than 2.0x | 215 (16.0%) | 95,779 (4,692.8%) |
| 2.0x to 2.9x | 352 (26.2%) | 465 (22.8%) |
| 3.0x to 3.9x | 104 (7.7%) | 759 (37.2%) |
| 4.0x or more | 659 (49.1%) | 417 (20.4%) |
| Total | 1,342 (100.0%) | 2,041 (100.0%) |
Real Estate Taxes by Mortgage Status in Stuarts Draft
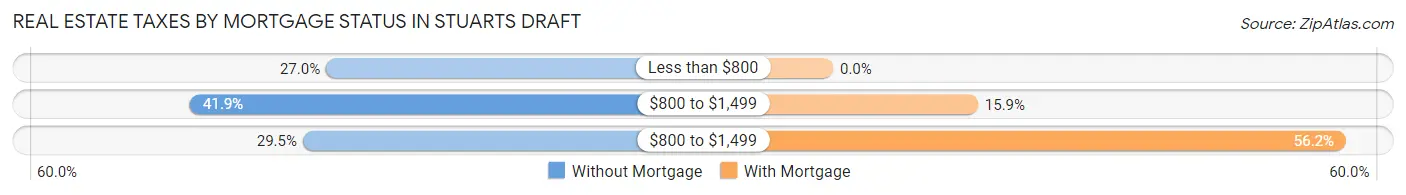
| Property Taxes | Without Mortgage | With Mortgage |
| Less than $800 | 362 (27.0%) | 0 (0.0%) |
| $800 to $1,499 | 562 (41.9%) | 324 (15.9%) |
| $800 to $1,499 | 396 (29.5%) | 1,147 (56.2%) |
| Total | 1,342 (100.0%) | 2,041 (100.0%) |
Health & Disability in Stuarts Draft
Health Insurance Coverage by Age in Stuarts Draft
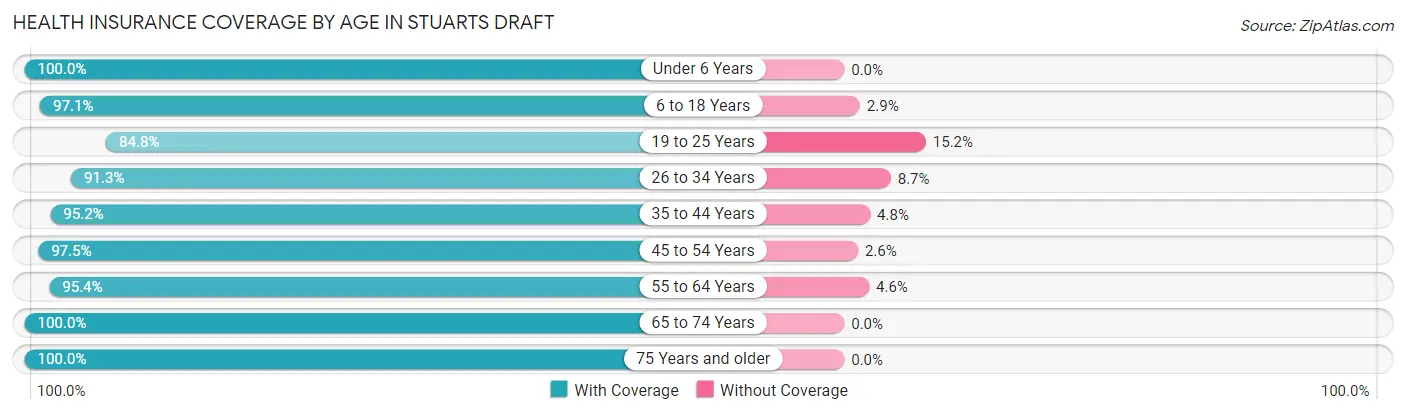
| Age Bracket | With Coverage | Without Coverage |
| Under 6 Years | 584 (100.0%) | 0 (0.0%) |
| 6 to 18 Years | 2,100 (97.1%) | 63 (2.9%) |
| 19 to 25 Years | 496 (84.8%) | 89 (15.2%) |
| 26 to 34 Years | 1,116 (91.3%) | 106 (8.7%) |
| 35 to 44 Years | 1,343 (95.2%) | 68 (4.8%) |
| 45 to 54 Years | 1,490 (97.5%) | 39 (2.5%) |
| 55 to 64 Years | 1,733 (95.4%) | 84 (4.6%) |
| 65 to 74 Years | 1,161 (100.0%) | 0 (0.0%) |
| 75 Years and older | 1,042 (100.0%) | 0 (0.0%) |
| Total | 11,065 (96.1%) | 449 (3.9%) |
Health Insurance Coverage by Citizenship Status in Stuarts Draft
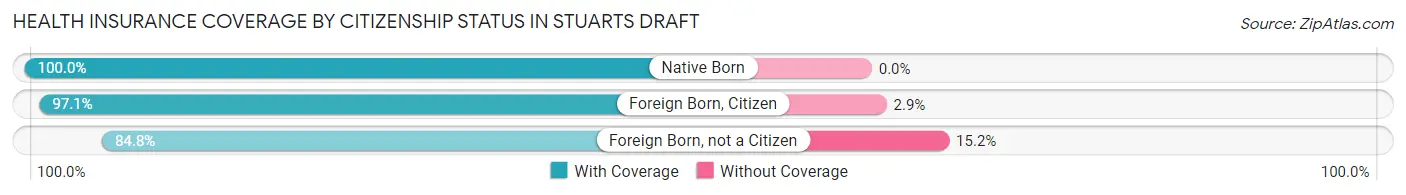
| Citizenship Status | With Coverage | Without Coverage |
| Native Born | 584 (100.0%) | 0 (0.0%) |
| Foreign Born, Citizen | 2,100 (97.1%) | 63 (2.9%) |
| Foreign Born, not a Citizen | 496 (84.8%) | 89 (15.2%) |
Health Insurance Coverage by Household Income in Stuarts Draft
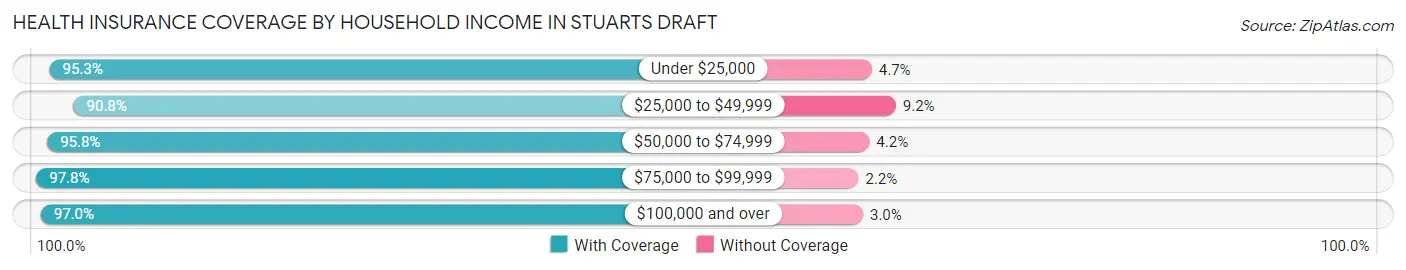
| Household Income | With Coverage | Without Coverage |
| Under $25,000 | 1,179 (95.3%) | 58 (4.7%) |
| $25,000 to $49,999 | 1,057 (90.8%) | 107 (9.2%) |
| $50,000 to $74,999 | 2,055 (95.8%) | 91 (4.2%) |
| $75,000 to $99,999 | 2,177 (97.8%) | 49 (2.2%) |
| $100,000 and over | 4,594 (97.0%) | 144 (3.0%) |
Public vs Private Health Insurance Coverage by Age in Stuarts Draft
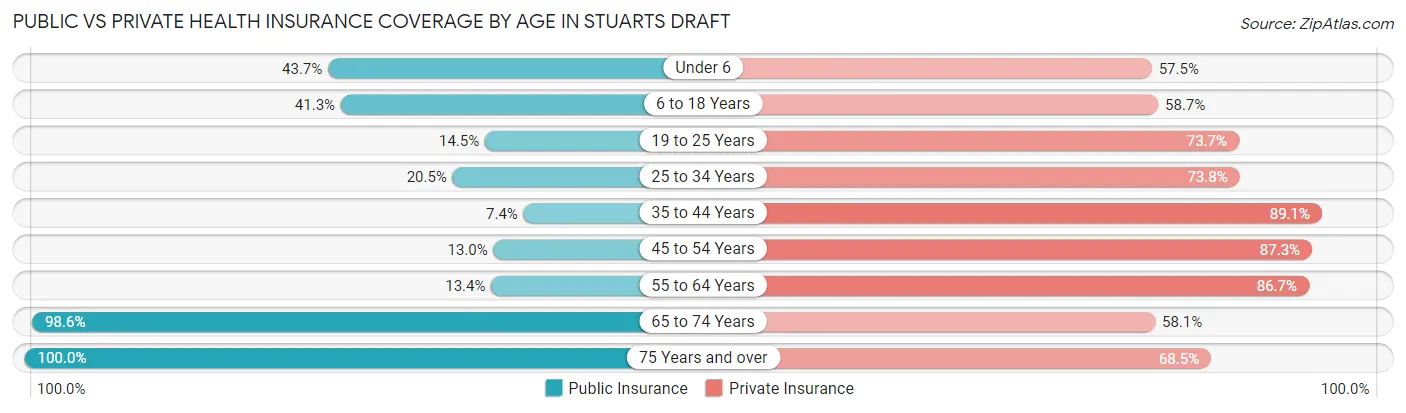
| Age Bracket | Public Insurance | Private Insurance |
| Under 6 | 255 (43.7%) | 336 (57.5%) |
| 6 to 18 Years | 893 (41.3%) | 1,270 (58.7%) |
| 19 to 25 Years | 85 (14.5%) | 431 (73.7%) |
| 25 to 34 Years | 251 (20.5%) | 902 (73.8%) |
| 35 to 44 Years | 104 (7.4%) | 1,257 (89.1%) |
| 45 to 54 Years | 198 (13.0%) | 1,334 (87.3%) |
| 55 to 64 Years | 243 (13.4%) | 1,575 (86.7%) |
| 65 to 74 Years | 1,145 (98.6%) | 675 (58.1%) |
| 75 Years and over | 1,042 (100.0%) | 714 (68.5%) |
| Total | 4,216 (36.6%) | 8,494 (73.8%) |
Disability Status by Sex by Age in Stuarts Draft
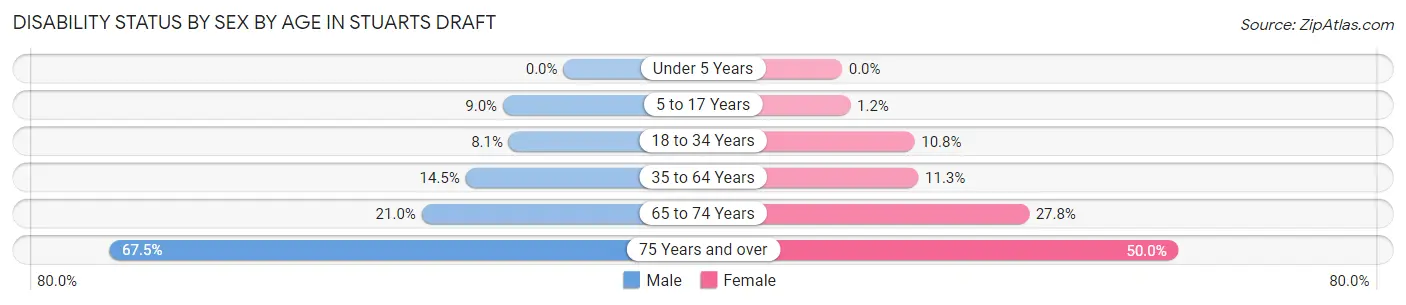
| Age Bracket | Male | Female |
| Under 5 Years | 0 (0.0%) | 0 (0.0%) |
| 5 to 17 Years | 115 (9.0%) | 11 (1.2%) |
| 18 to 34 Years | 76 (8.1%) | 106 (10.8%) |
| 35 to 64 Years | 329 (14.5%) | 282 (11.3%) |
| 65 to 74 Years | 101 (21.0%) | 189 (27.8%) |
| 75 Years and over | 282 (67.5%) | 312 (50.0%) |
Disability Class by Sex by Age in Stuarts Draft
Disability Class: Hearing Difficulty
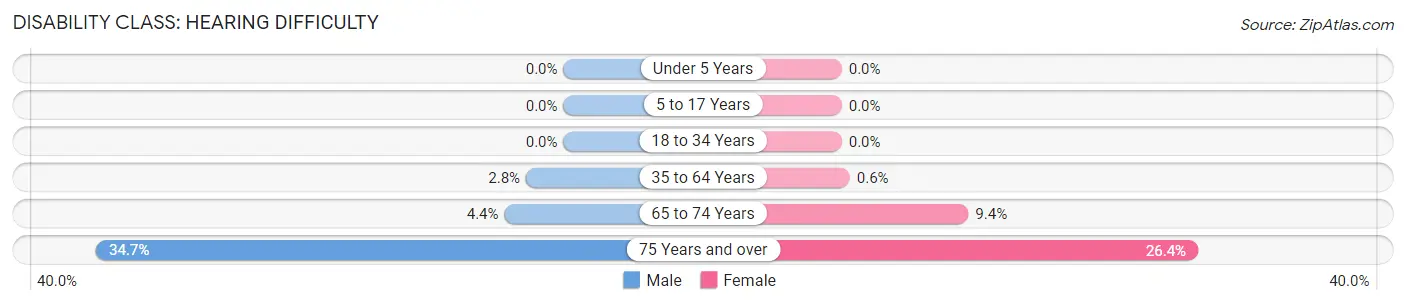
| Age Bracket | Male | Female |
| Under 5 Years | 0 (0.0%) | 0 (0.0%) |
| 5 to 17 Years | 0 (0.0%) | 0 (0.0%) |
| 18 to 34 Years | 0 (0.0%) | 0 (0.0%) |
| 35 to 64 Years | 63 (2.8%) | 15 (0.6%) |
| 65 to 74 Years | 21 (4.4%) | 64 (9.4%) |
| 75 Years and over | 145 (34.7%) | 165 (26.4%) |
Disability Class: Vision Difficulty
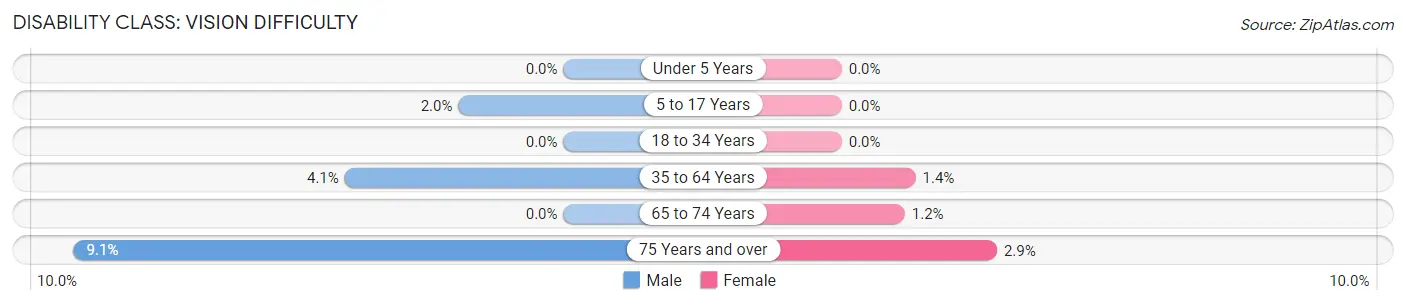
| Age Bracket | Male | Female |
| Under 5 Years | 0 (0.0%) | 0 (0.0%) |
| 5 to 17 Years | 25 (1.9%) | 0 (0.0%) |
| 18 to 34 Years | 0 (0.0%) | 0 (0.0%) |
| 35 to 64 Years | 92 (4.1%) | 34 (1.4%) |
| 65 to 74 Years | 0 (0.0%) | 8 (1.2%) |
| 75 Years and over | 38 (9.1%) | 18 (2.9%) |
Disability Class: Cognitive Difficulty
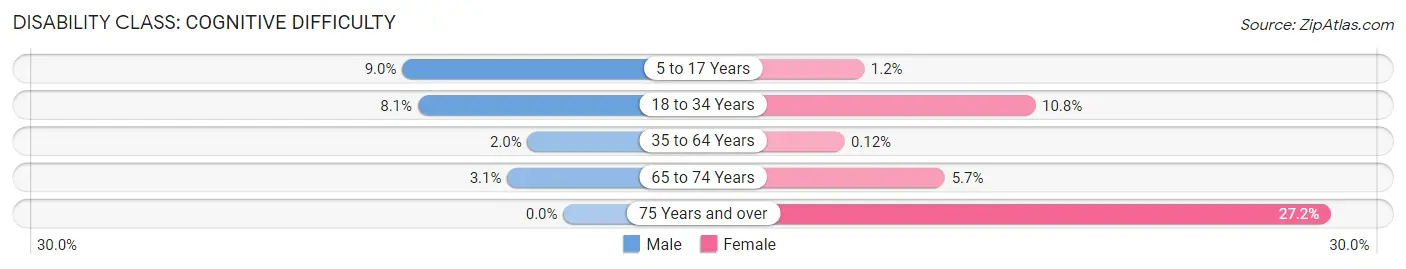
| Age Bracket | Male | Female |
| 5 to 17 Years | 115 (9.0%) | 11 (1.2%) |
| 18 to 34 Years | 76 (8.1%) | 106 (10.8%) |
| 35 to 64 Years | 45 (2.0%) | 3 (0.1%) |
| 65 to 74 Years | 15 (3.1%) | 39 (5.7%) |
| 75 Years and over | 0 (0.0%) | 170 (27.2%) |
Disability Class: Ambulatory Difficulty
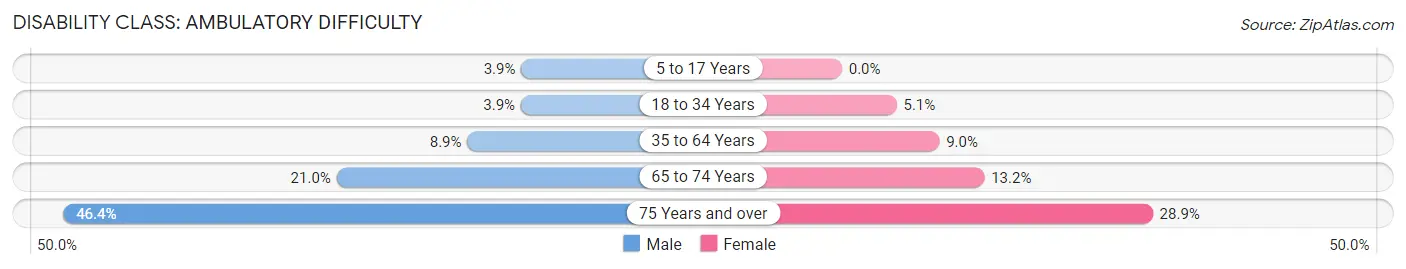
| Age Bracket | Male | Female |
| 5 to 17 Years | 50 (3.9%) | 0 (0.0%) |
| 18 to 34 Years | 37 (3.9%) | 50 (5.1%) |
| 35 to 64 Years | 202 (8.9%) | 225 (9.0%) |
| 65 to 74 Years | 101 (21.0%) | 90 (13.2%) |
| 75 Years and over | 194 (46.4%) | 180 (28.8%) |
Disability Class: Self-Care Difficulty
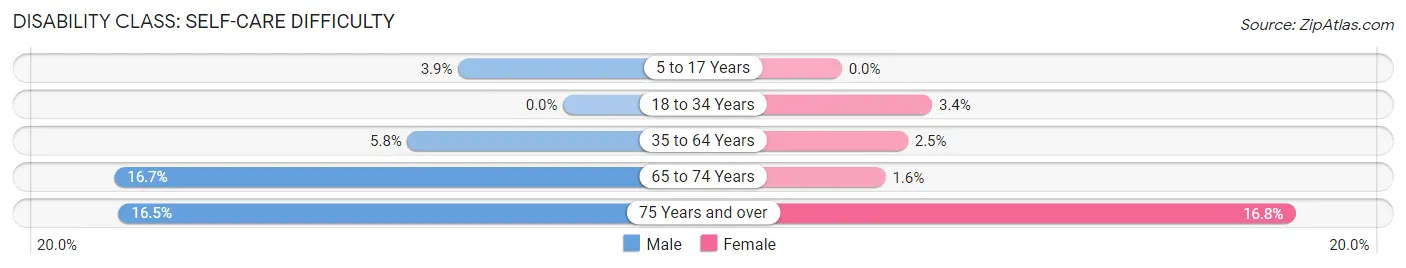
| Age Bracket | Male | Female |
| 5 to 17 Years | 50 (3.9%) | 0 (0.0%) |
| 18 to 34 Years | 0 (0.0%) | 33 (3.4%) |
| 35 to 64 Years | 131 (5.8%) | 61 (2.5%) |
| 65 to 74 Years | 80 (16.7%) | 11 (1.6%) |
| 75 Years and over | 69 (16.5%) | 105 (16.8%) |
Technology Access in Stuarts Draft
Computing Device Access in Stuarts Draft
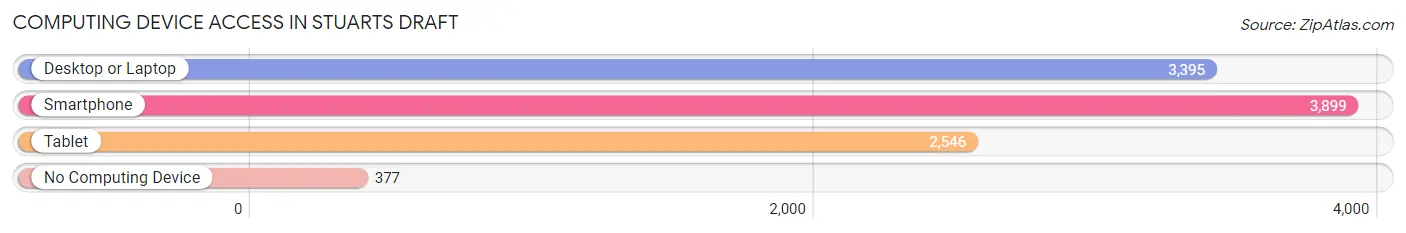
| Device Type | # Households | % Households |
| Desktop or Laptop | 3,395 | 72.1% |
| Smartphone | 3,899 | 82.8% |
| Tablet | 2,546 | 54.1% |
| No Computing Device | 377 | 8.0% |
| Total | 4,710 | 100.0% |
Internet Access in Stuarts Draft
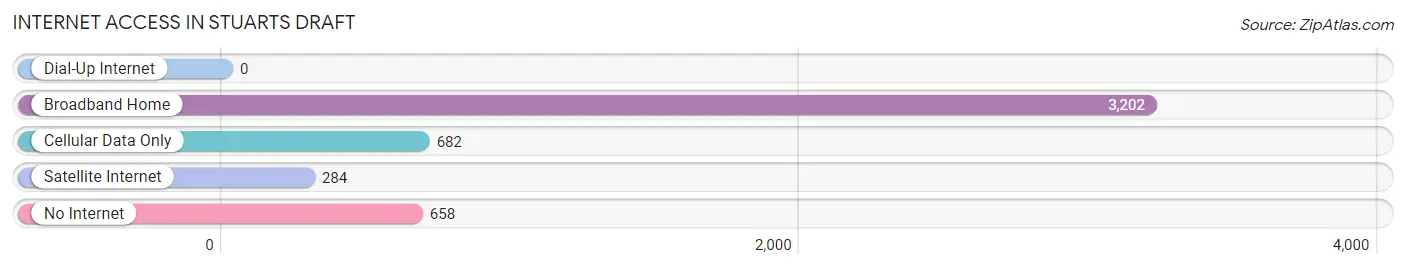
| Internet Type | # Households | % Households |
| Dial-Up Internet | 0 | 0.0% |
| Broadband Home | 3,202 | 68.0% |
| Cellular Data Only | 682 | 14.5% |
| Satellite Internet | 284 | 6.0% |
| No Internet | 658 | 14.0% |
| Total | 4,710 | 100.0% |
Stuarts Draft Summary
Stuarts Draft is an unincorporated community located in Augusta County, Virginia. It is situated in the Shenandoah Valley, approximately 10 miles west of Waynesboro and 20 miles east of Staunton. The population of Stuarts Draft was estimated to be 8,845 in 2019.
History
Stuarts Draft was first settled in the late 1700s by the Stuart family, who were of Scottish descent. The town was named after the family, and the area was known as the “Stuart’s Draft” until the spelling was changed to “Stuarts Draft” in the early 1800s.
The town was an important stop on the Valley Turnpike, which connected Staunton to Winchester. The turnpike was built in the early 1800s and was the main route for travelers and goods between the two cities.
The town was also an important stop on the Virginia Central Railroad, which connected Richmond to the Shenandoah Valley. The railroad was built in the 1850s and was a major factor in the growth of Stuarts Draft.
Geography
Stuarts Draft is located in the Shenandoah Valley, which is a geographic region in the western part of Virginia. The valley is bordered by the Blue Ridge Mountains to the east and the Allegheny Mountains to the west. The town is situated in the northern part of Augusta County, and is approximately 10 miles west of Waynesboro and 20 miles east of Staunton.
The town is located at the intersection of two major highways, Interstate 64 and U.S. Route 340. The town is also served by the Stuarts Draft Airport, which is located just outside of town.
The climate in Stuarts Draft is humid subtropical, with hot, humid summers and mild winters. The average annual temperature is around 57 degrees Fahrenheit, and the average annual precipitation is around 43 inches.
Economy
Stuarts Draft’s economy is largely based on agriculture and manufacturing. The town is home to several large agricultural operations, including poultry farms, dairy farms, and vegetable farms. The town is also home to several manufacturing companies, including a furniture factory, a plastics factory, and a paper mill.
The town is also home to several retail stores, restaurants, and other businesses. The town is served by several banks, and there are several medical facilities in the area.
Demographics
As of 2019, the population of Stuarts Draft was estimated to be 8,845. The population is predominantly white (90.3%), with small percentages of African American (4.2%), Hispanic (2.2%), and Asian (1.3%) residents. The median household income is $50,945, and the median home value is $179,400.
The town is served by the Augusta County Public Schools system, which includes four elementary schools, one middle school, and one high school. The town is also home to several private schools, including a Catholic school and a Christian school.
Conclusion
Stuarts Draft is an unincorporated community located in Augusta County, Virginia. It is situated in the Shenandoah Valley, approximately 10 miles west of Waynesboro and 20 miles east of Staunton. The population of Stuarts Draft was estimated to be 8,845 in 2019. The town’s economy is largely based on agriculture and manufacturing, and the population is predominantly white. The town is served by the Augusta County Public Schools system, and there are several private schools in the area.
Common Questions
What is Per Capita Income in Stuarts Draft?
Per Capita income in Stuarts Draft is $35,850.
What is the Median Family Income in Stuarts Draft?
Median Family Income in Stuarts Draft is $90,977.
What is the Median Household income in Stuarts Draft?
Median Household Income in Stuarts Draft is $75,100.
What is Income or Wage Gap in Stuarts Draft?
Income or Wage Gap in Stuarts Draft is 31.0%.
Women in Stuarts Draft earn 69.0 cents for every dollar earned by a man.
What is Inequality or Gini Index in Stuarts Draft?
Inequality or Gini Index in Stuarts Draft is 0.39.
What is the Total Population of Stuarts Draft?
Total Population of Stuarts Draft is 11,554.
What is the Total Male Population of Stuarts Draft?
Total Male Population of Stuarts Draft is 5,658.
What is the Total Female Population of Stuarts Draft?
Total Female Population of Stuarts Draft is 5,896.
What is the Ratio of Males per 100 Females in Stuarts Draft?
There are 95.96 Males per 100 Females in Stuarts Draft.
What is the Ratio of Females per 100 Males in Stuarts Draft?
There are 104.21 Females per 100 Males in Stuarts Draft.
What is the Median Population Age in Stuarts Draft?
Median Population Age in Stuarts Draft is 43.3 Years.
What is the Average Family Size in Stuarts Draft
Average Family Size in Stuarts Draft is 3.0 People.
What is the Average Household Size in Stuarts Draft
Average Household Size in Stuarts Draft is 2.5 People.
How Large is the Labor Force in Stuarts Draft?
There are 6,193 People in the Labor Forcein in Stuarts Draft.
What is the Percentage of People in the Labor Force in Stuarts Draft?
65.4% of People are in the Labor Force in Stuarts Draft.
What is the Unemployment Rate in Stuarts Draft?
Unemployment Rate in Stuarts Draft is 3.4%.