Mount Vernon, VA Map & Demographics
Mount Vernon Map
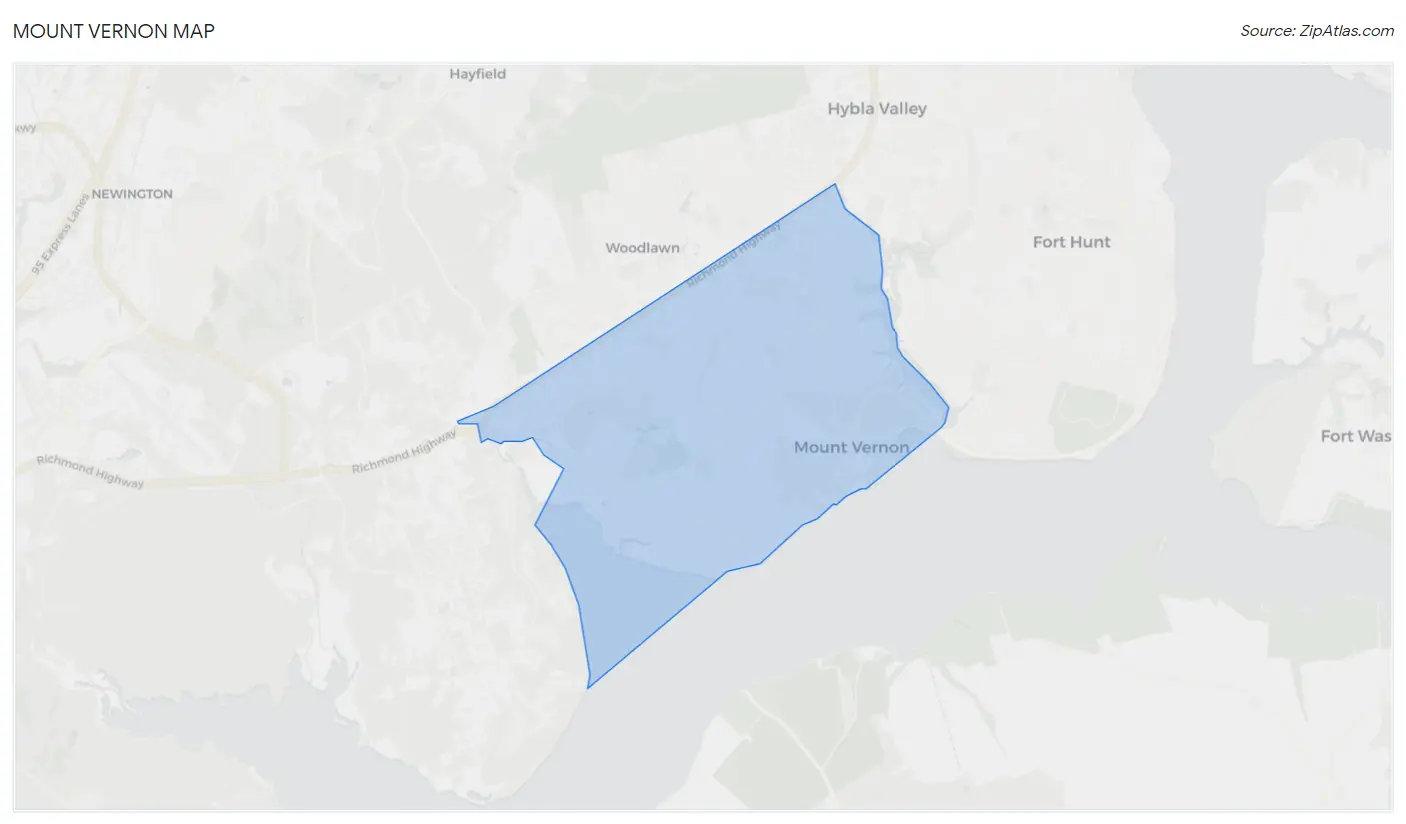
Mount Vernon Overview
$76,057
PER CAPITA INCOME
$197,500
AVG FAMILY INCOME
$160,096
AVG HOUSEHOLD INCOME
58.3%
WAGE / INCOME GAP [ % ]
41.7¢/ $1
WAGE / INCOME GAP [ $ ]
$15,444
FAMILY INCOME DEFICIT
0.47
INEQUALITY / GINI INDEX
13,299
TOTAL POPULATION
6,355
MALE POPULATION
6,944
FEMALE POPULATION
91.52
MALES / 100 FEMALES
109.27
FEMALES / 100 MALES
43.4
MEDIAN AGE
3.2
AVG FAMILY SIZE
2.8
AVG HOUSEHOLD SIZE
7,126
LABOR FORCE [ PEOPLE ]
69.4%
PERCENT IN LABOR FORCE
3.3%
UNEMPLOYMENT RATE
Mount Vernon Area Codes
Income in Mount Vernon
Income Overview in Mount Vernon
Per Capita Income in Mount Vernon is $76,057, while median incomes of families and households are $197,500 and $160,096 respectively.
| Characteristic | Number | Measure |
| Per Capita Income | 13,299 | $76,057 |
| Median Family Income | 3,562 | $197,500 |
| Mean Family Income | 3,562 | $237,201 |
| Median Household Income | 4,826 | $160,096 |
| Mean Household Income | 4,826 | $204,761 |
| Income Deficit | 3,562 | $15,444 |
| Wage / Income Gap (%) | 13,299 | 58.27% |
| Wage / Income Gap ($) | 13,299 | 41.73¢ per $1 |
| Gini / Inequality Index | 13,299 | 0.47 |
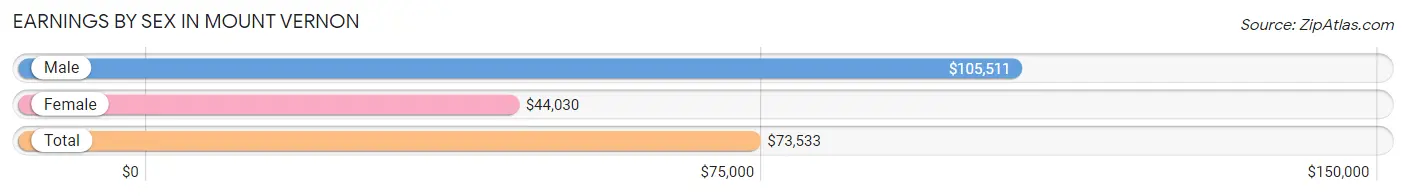
Earnings by Sex in Mount Vernon
Average Earnings in Mount Vernon are $73,533, $105,511 for men and $44,030 for women, a difference of 58.3%.
| Sex | Number | Average Earnings |
| Male | 3,911 (52.1%) | $105,511 |
| Female | 3,588 (47.8%) | $44,030 |
| Total | 7,499 (100.0%) | $73,533 |
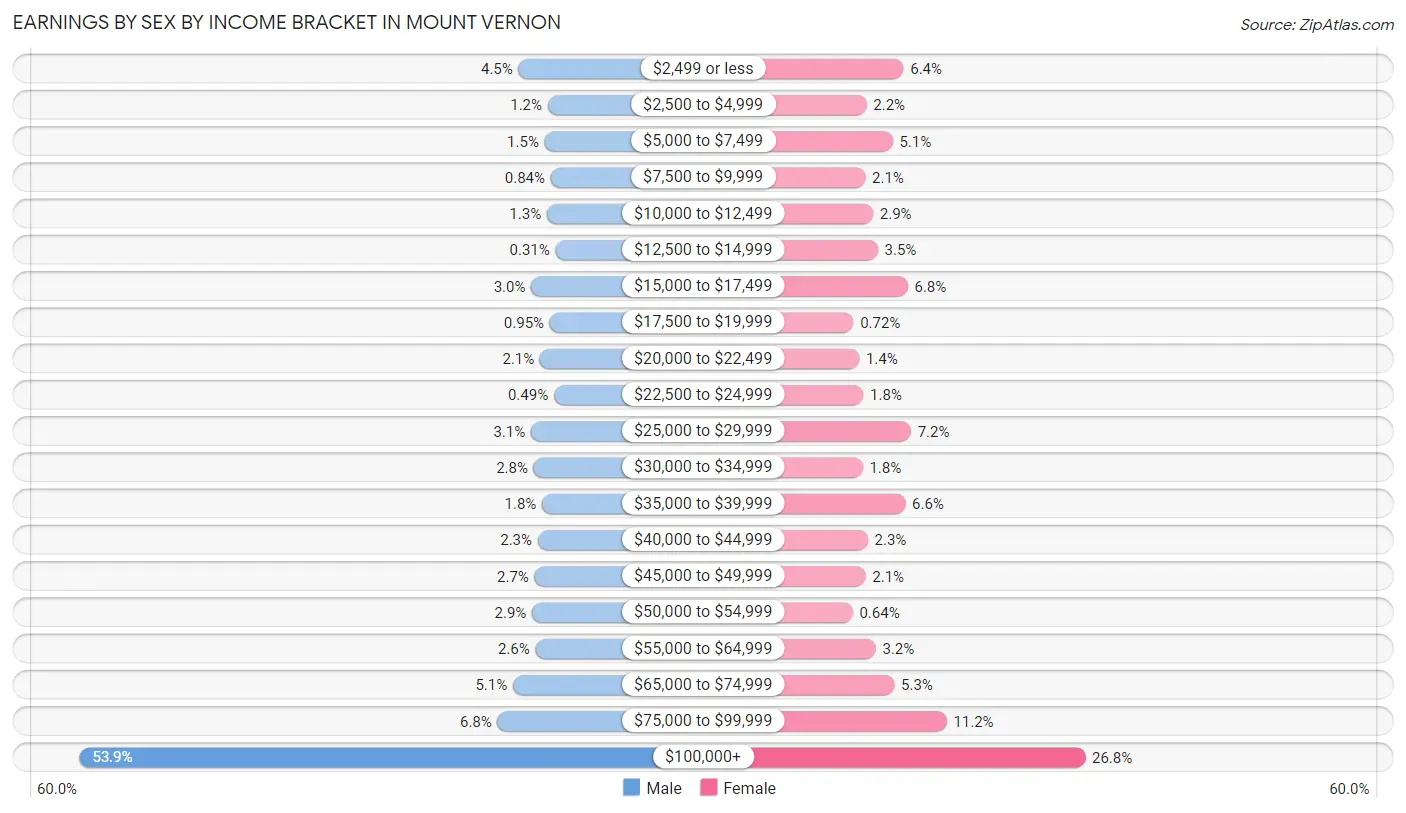
Earnings by Sex by Income Bracket in Mount Vernon
The most common earnings brackets in Mount Vernon are $100,000+ for men (2,106 | 53.8%) and $100,000+ for women (961 | 26.8%).
| Income | Male | Female |
| $2,499 or less | 175 (4.5%) | 228 (6.4%) |
| $2,500 to $4,999 | 46 (1.2%) | 79 (2.2%) |
| $5,000 to $7,499 | 60 (1.5%) | 184 (5.1%) |
| $7,500 to $9,999 | 33 (0.8%) | 74 (2.1%) |
| $10,000 to $12,499 | 50 (1.3%) | 105 (2.9%) |
| $12,500 to $14,999 | 12 (0.3%) | 124 (3.5%) |
| $15,000 to $17,499 | 119 (3.0%) | 245 (6.8%) |
| $17,500 to $19,999 | 37 (0.9%) | 26 (0.7%) |
| $20,000 to $22,499 | 80 (2.1%) | 49 (1.4%) |
| $22,500 to $24,999 | 19 (0.5%) | 66 (1.8%) |
| $25,000 to $29,999 | 120 (3.1%) | 258 (7.2%) |
| $30,000 to $34,999 | 108 (2.8%) | 63 (1.8%) |
| $35,000 to $39,999 | 71 (1.8%) | 235 (6.6%) |
| $40,000 to $44,999 | 90 (2.3%) | 84 (2.3%) |
| $45,000 to $49,999 | 104 (2.7%) | 75 (2.1%) |
| $50,000 to $54,999 | 115 (2.9%) | 23 (0.6%) |
| $55,000 to $64,999 | 100 (2.6%) | 116 (3.2%) |
| $65,000 to $74,999 | 199 (5.1%) | 191 (5.3%) |
| $75,000 to $99,999 | 267 (6.8%) | 402 (11.2%) |
| $100,000+ | 2,106 (53.8%) | 961 (26.8%) |
| Total | 3,911 (100.0%) | 3,588 (100.0%) |
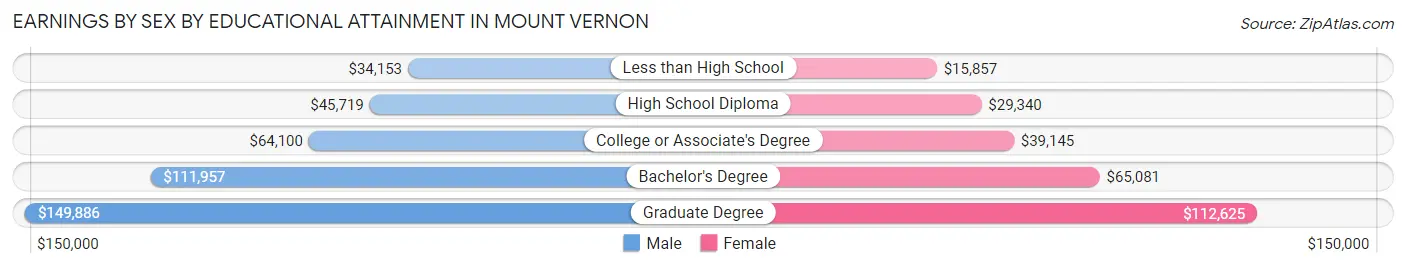
Earnings by Sex by Educational Attainment in Mount Vernon
Average earnings in Mount Vernon are $115,735 for men and $58,542 for women, a difference of 49.4%. Men with an educational attainment of graduate degree enjoy the highest average annual earnings of $149,886, while those with less than high school education earn the least with $34,153. Women with an educational attainment of graduate degree earn the most with the average annual earnings of $112,625, while those with less than high school education have the smallest earnings of $15,857.
| Educational Attainment | Male Income | Female Income |
| Less than High School | $34,153 | $15,857 |
| High School Diploma | $45,719 | $29,340 |
| College or Associate's Degree | $64,100 | $39,145 |
| Bachelor's Degree | $111,957 | $65,081 |
| Graduate Degree | $149,886 | $112,625 |
| Total | $115,735 | $58,542 |
Family Income in Mount Vernon
Family Income Brackets in Mount Vernon
According to the Mount Vernon family income data, there are 1,720 families falling into the $200,000+ income range, which is the most common income bracket and makes up 48.3% of all families. Conversely, the $10,000 to $14,999 income bracket is the least frequent group with only 18 families (0.5%) belonging to this category.
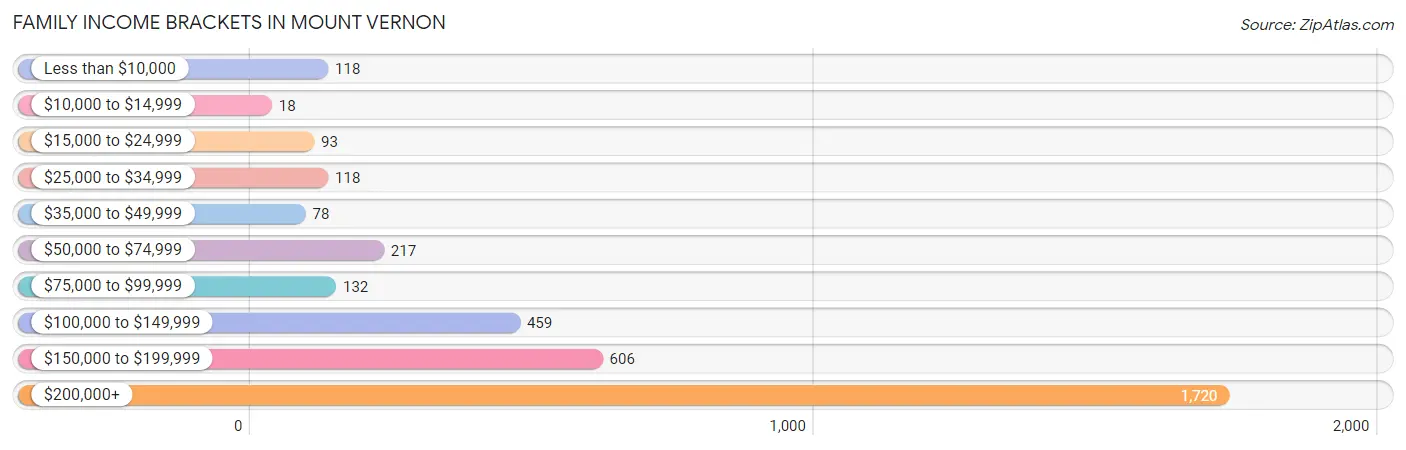
| Income Bracket | # Families | % Families |
| Less than $10,000 | 118 | 3.3% |
| $10,000 to $14,999 | 18 | 0.5% |
| $15,000 to $24,999 | 93 | 2.6% |
| $25,000 to $34,999 | 118 | 3.3% |
| $35,000 to $49,999 | 78 | 2.2% |
| $50,000 to $74,999 | 217 | 6.1% |
| $75,000 to $99,999 | 132 | 3.7% |
| $100,000 to $149,999 | 459 | 12.9% |
| $150,000 to $199,999 | 606 | 17.0% |
| $200,000+ | 1,720 | 48.3% |
Family Income by Famaliy Size in Mount Vernon
6-person families (53 | 1.5%) account for the highest median family income in Mount Vernon with $250,001 per family, while 2-person families (1,625 | 45.6%) have the highest median income of $95,975 per family member.
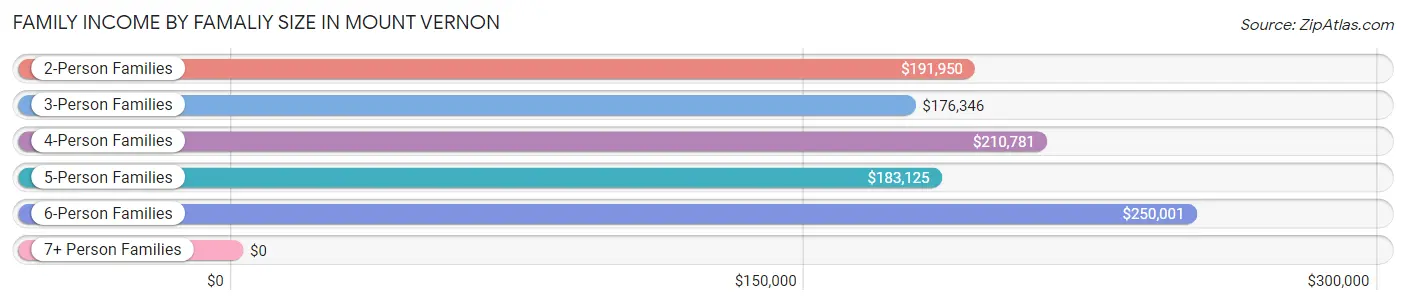
| Income Bracket | # Families | Median Income |
| 2-Person Families | 1,625 (45.6%) | $191,950 |
| 3-Person Families | 844 (23.7%) | $176,346 |
| 4-Person Families | 687 (19.3%) | $210,781 |
| 5-Person Families | 268 (7.5%) | $183,125 |
| 6-Person Families | 53 (1.5%) | $250,001 |
| 7+ Person Families | 85 (2.4%) | $0 |
| Total | 3,562 (100.0%) | $197,500 |
Family Income by Number of Earners in Mount Vernon
The median family income in Mount Vernon is $197,500, with families comprising 3+ earners (419) having the highest median family income of $250,001, while families with no earners (408) have the lowest median family income of $119,875, accounting for 11.8% and 11.5% of families, respectively.
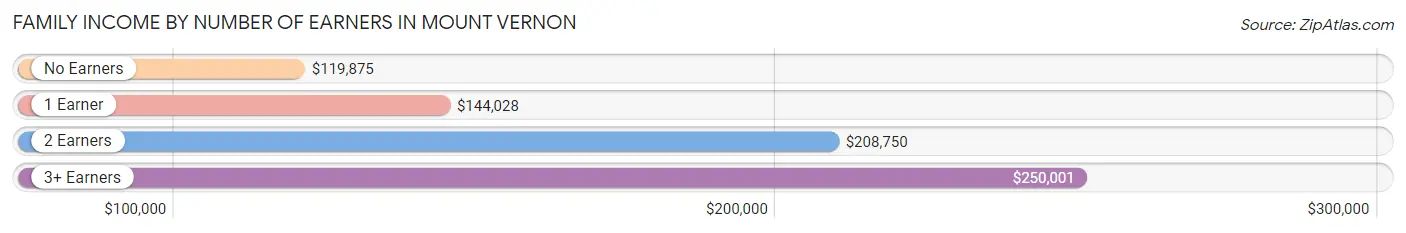
| Number of Earners | # Families | Median Income |
| No Earners | 408 (11.5%) | $119,875 |
| 1 Earner | 937 (26.3%) | $144,028 |
| 2 Earners | 1,798 (50.5%) | $208,750 |
| 3+ Earners | 419 (11.8%) | $250,001 |
| Total | 3,562 (100.0%) | $197,500 |
Household Income in Mount Vernon
Household Income Brackets in Mount Vernon
With 1,892 households falling in the category, the $200,000+ income range is the most frequent in Mount Vernon, accounting for 39.2% of all households. In contrast, only 19 households (0.4%) fall into the $10,000 to $14,999 income bracket, making it the least populous group.
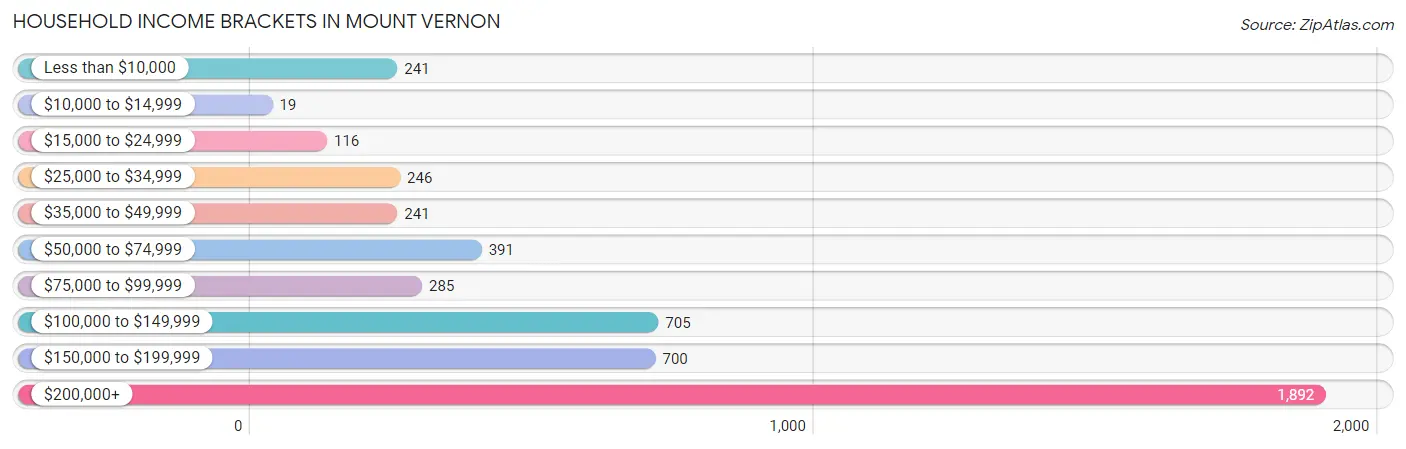
| Income Bracket | # Households | % Households |
| Less than $10,000 | 241 | 5.0% |
| $10,000 to $14,999 | 19 | 0.4% |
| $15,000 to $24,999 | 116 | 2.4% |
| $25,000 to $34,999 | 246 | 5.1% |
| $35,000 to $49,999 | 241 | 5.0% |
| $50,000 to $74,999 | 391 | 8.1% |
| $75,000 to $99,999 | 285 | 5.9% |
| $100,000 to $149,999 | 705 | 14.6% |
| $150,000 to $199,999 | 700 | 14.5% |
| $200,000+ | 1,892 | 39.2% |
Household Income by Householder Age in Mount Vernon
The median household income in Mount Vernon is $160,096, with the highest median household income of $185,399 found in the 45 to 64 years age bracket for the primary householder. A total of 1,971 households (40.8%) fall into this category. Meanwhile, the 15 to 24 years age bracket for the primary householder has the lowest median household income of $0, with 26 households (0.5%) in this group.
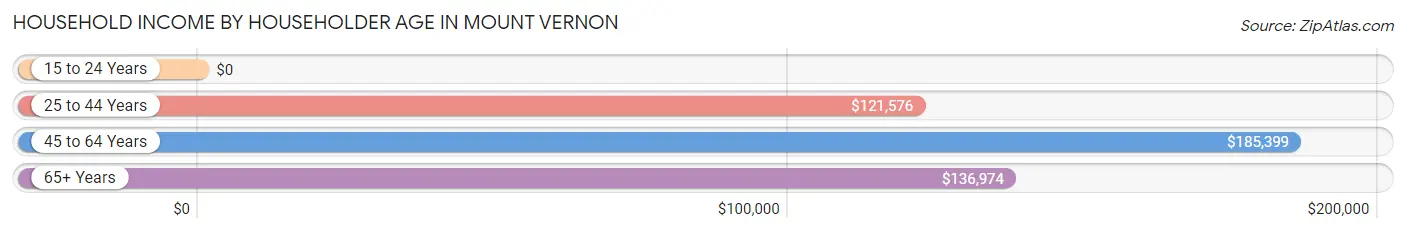
| Income Bracket | # Households | Median Income |
| 15 to 24 Years | 26 (0.5%) | $0 |
| 25 to 44 Years | 1,375 (28.5%) | $121,576 |
| 45 to 64 Years | 1,971 (40.8%) | $185,399 |
| 65+ Years | 1,454 (30.1%) | $136,974 |
| Total | 4,826 (100.0%) | $160,096 |
Poverty in Mount Vernon
Income Below Poverty by Sex and Age in Mount Vernon
With 7.4% poverty level for males and 10.8% for females among the residents of Mount Vernon, under 5 year old males and under 5 year old females are the most vulnerable to poverty, with 50 males (14.7%) and 162 females (23.7%) in their respective age groups living below the poverty level.
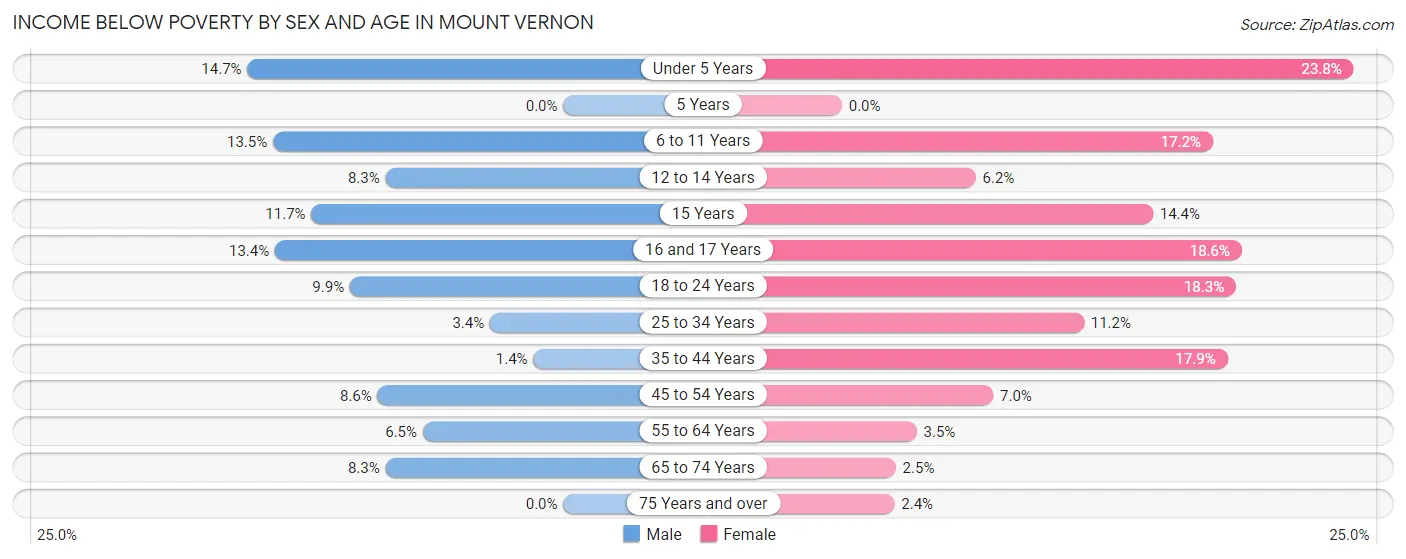
| Age Bracket | Male | Female |
| Under 5 Years | 50 (14.7%) | 162 (23.7%) |
| 5 Years | 0 (0.0%) | 0 (0.0%) |
| 6 to 11 Years | 106 (13.5%) | 99 (17.2%) |
| 12 to 14 Years | 17 (8.3%) | 9 (6.2%) |
| 15 Years | 9 (11.7%) | 14 (14.4%) |
| 16 and 17 Years | 21 (13.4%) | 31 (18.6%) |
| 18 to 24 Years | 31 (9.9%) | 64 (18.3%) |
| 25 to 34 Years | 20 (3.4%) | 71 (11.2%) |
| 35 to 44 Years | 11 (1.4%) | 150 (17.9%) |
| 45 to 54 Years | 91 (8.6%) | 83 (7.0%) |
| 55 to 64 Years | 60 (6.5%) | 32 (3.5%) |
| 65 to 74 Years | 52 (8.3%) | 18 (2.5%) |
| 75 Years and over | 0 (0.0%) | 14 (2.4%) |
| Total | 468 (7.4%) | 747 (10.8%) |
Income Above Poverty by Sex and Age in Mount Vernon
According to the poverty statistics in Mount Vernon, males aged 5 years and females aged 5 years are the age groups that are most secure financially, with 100.0% of males and 100.0% of females in these age groups living above the poverty line.
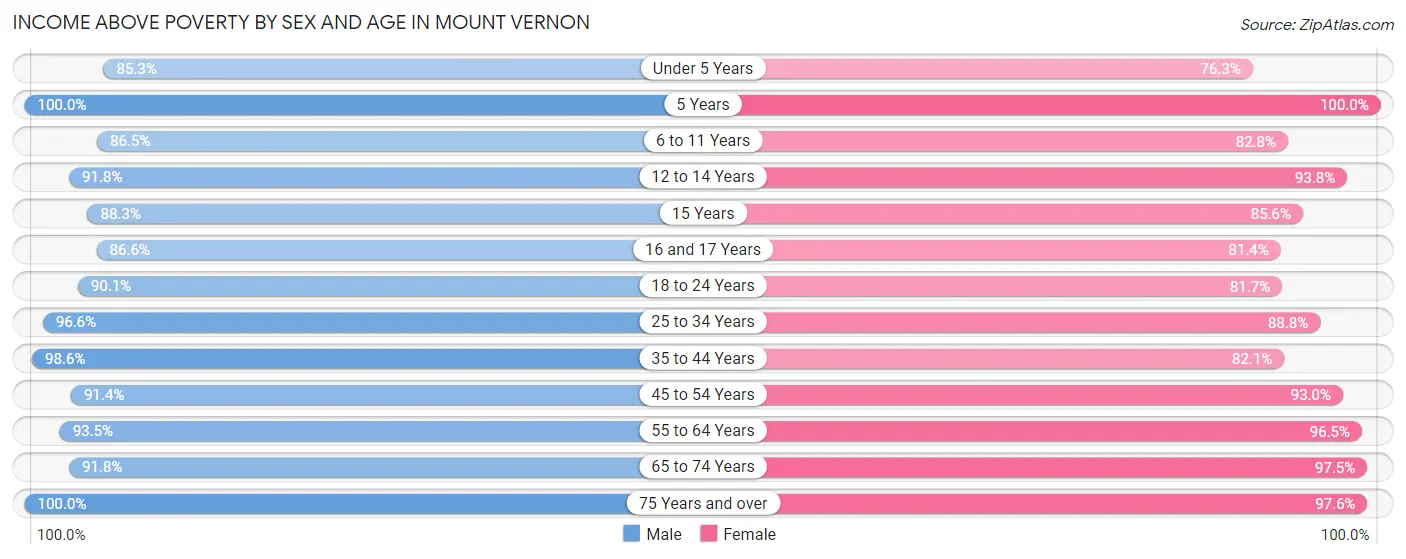
| Age Bracket | Male | Female |
| Under 5 Years | 291 (85.3%) | 520 (76.2%) |
| 5 Years | 77 (100.0%) | 44 (100.0%) |
| 6 to 11 Years | 681 (86.5%) | 476 (82.8%) |
| 12 to 14 Years | 189 (91.7%) | 136 (93.8%) |
| 15 Years | 68 (88.3%) | 83 (85.6%) |
| 16 and 17 Years | 136 (86.6%) | 136 (81.4%) |
| 18 to 24 Years | 282 (90.1%) | 286 (81.7%) |
| 25 to 34 Years | 569 (96.6%) | 561 (88.8%) |
| 35 to 44 Years | 779 (98.6%) | 688 (82.1%) |
| 45 to 54 Years | 965 (91.4%) | 1,100 (93.0%) |
| 55 to 64 Years | 860 (93.5%) | 891 (96.5%) |
| 65 to 74 Years | 578 (91.7%) | 703 (97.5%) |
| 75 Years and over | 412 (100.0%) | 560 (97.6%) |
| Total | 5,887 (92.6%) | 6,184 (89.2%) |
Income Below Poverty Among Married-Couple Families in Mount Vernon
The poverty statistics for married-couple families in Mount Vernon show that 3.8% or 113 of the total 2,961 families live below the poverty line. Families with 3 or 4 children have the highest poverty rate of 30.4%, comprising of 88 families. On the other hand, families with 1 or 2 children have the lowest poverty rate of 0.0%, which includes 0 families.
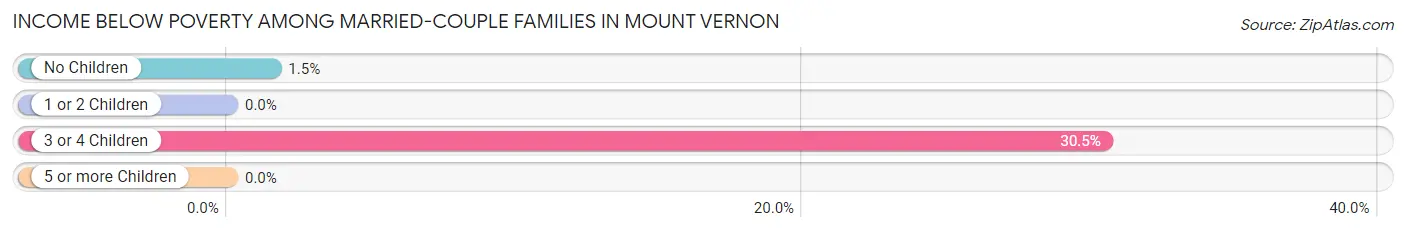
| Children | Above Poverty | Below Poverty |
| No Children | 1,630 (98.5%) | 25 (1.5%) |
| 1 or 2 Children | 983 (100.0%) | 0 (0.0%) |
| 3 or 4 Children | 201 (69.6%) | 88 (30.4%) |
| 5 or more Children | 34 (100.0%) | 0 (0.0%) |
| Total | 2,848 (96.2%) | 113 (3.8%) |
Income Below Poverty Among Single-Parent Households in Mount Vernon
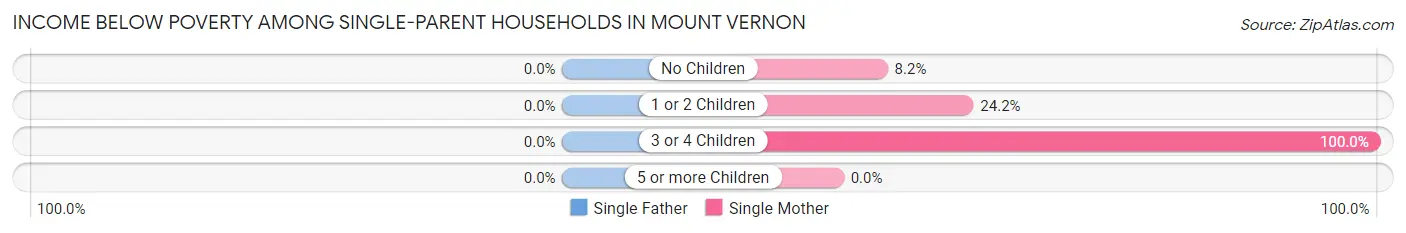
| Children | Single Father | Single Mother |
| No Children | 0 (0.0%) | 19 (8.2%) |
| 1 or 2 Children | 0 (0.0%) | 65 (24.2%) |
| 3 or 4 Children | 0 (0.0%) | 30 (100.0%) |
| 5 or more Children | 0 (0.0%) | 0 (0.0%) |
| Total | 0 (0.0%) | 114 (21.5%) |
Income Below Poverty Among Married-Couple vs Single-Parent Households in Mount Vernon
The poverty data for Mount Vernon shows that 113 of the married-couple family households (3.8%) and 114 of the single-parent households (19.0%) are living below the poverty level. Within the married-couple family households, those with 3 or 4 children have the highest poverty rate, with 88 households (30.4%) falling below the poverty line. Among the single-parent households, those with 3 or 4 children have the highest poverty rate, with 30 household (78.9%) living below poverty.
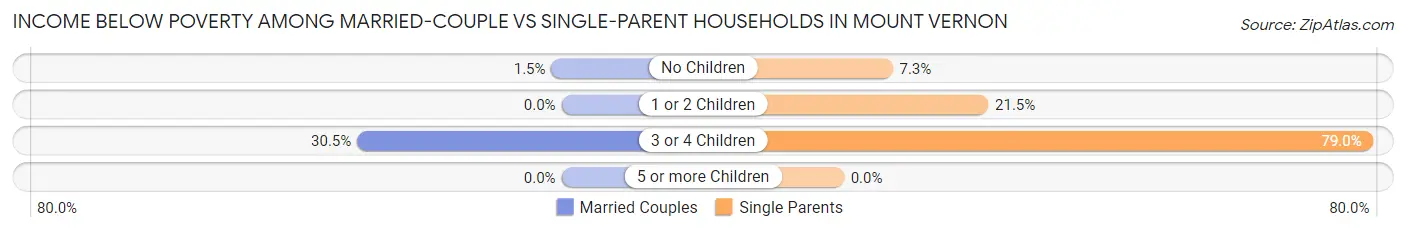
| Children | Married-Couple Families | Single-Parent Households |
| No Children | 25 (1.5%) | 19 (7.3%) |
| 1 or 2 Children | 0 (0.0%) | 65 (21.5%) |
| 3 or 4 Children | 88 (30.4%) | 30 (78.9%) |
| 5 or more Children | 0 (0.0%) | 0 (0.0%) |
| Total | 113 (3.8%) | 114 (19.0%) |
Race in Mount Vernon
The most populous races in Mount Vernon are White / Caucasian (8,266 | 62.2%), Hispanic or Latino (2,418 | 18.2%), and Black / African American (1,993 | 15.0%).
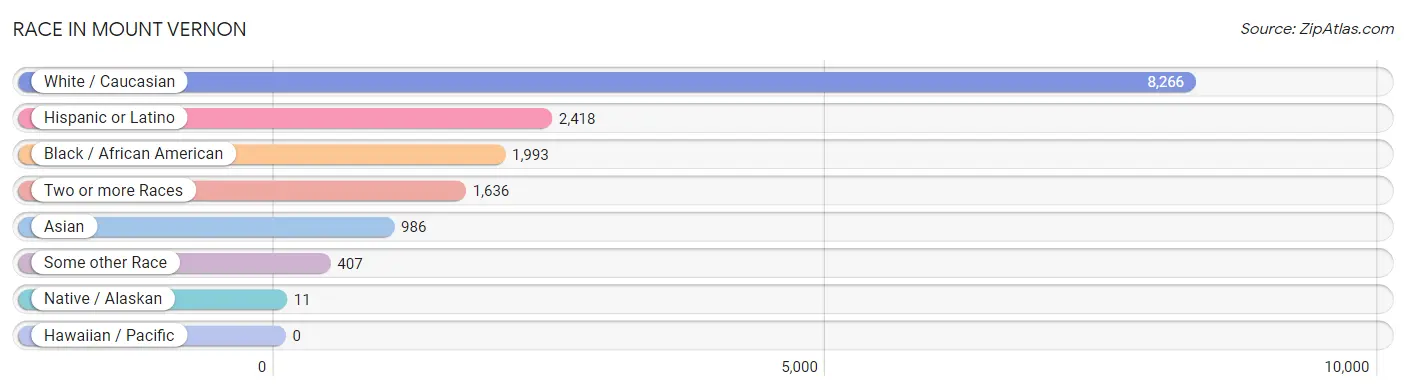
| Race | # Population | % Population |
| Asian | 986 | 7.4% |
| Black / African American | 1,993 | 15.0% |
| Hawaiian / Pacific | 0 | 0.0% |
| Hispanic or Latino | 2,418 | 18.2% |
| Native / Alaskan | 11 | 0.1% |
| White / Caucasian | 8,266 | 62.2% |
| Two or more Races | 1,636 | 12.3% |
| Some other Race | 407 | 3.1% |
| Total | 13,299 | 100.0% |
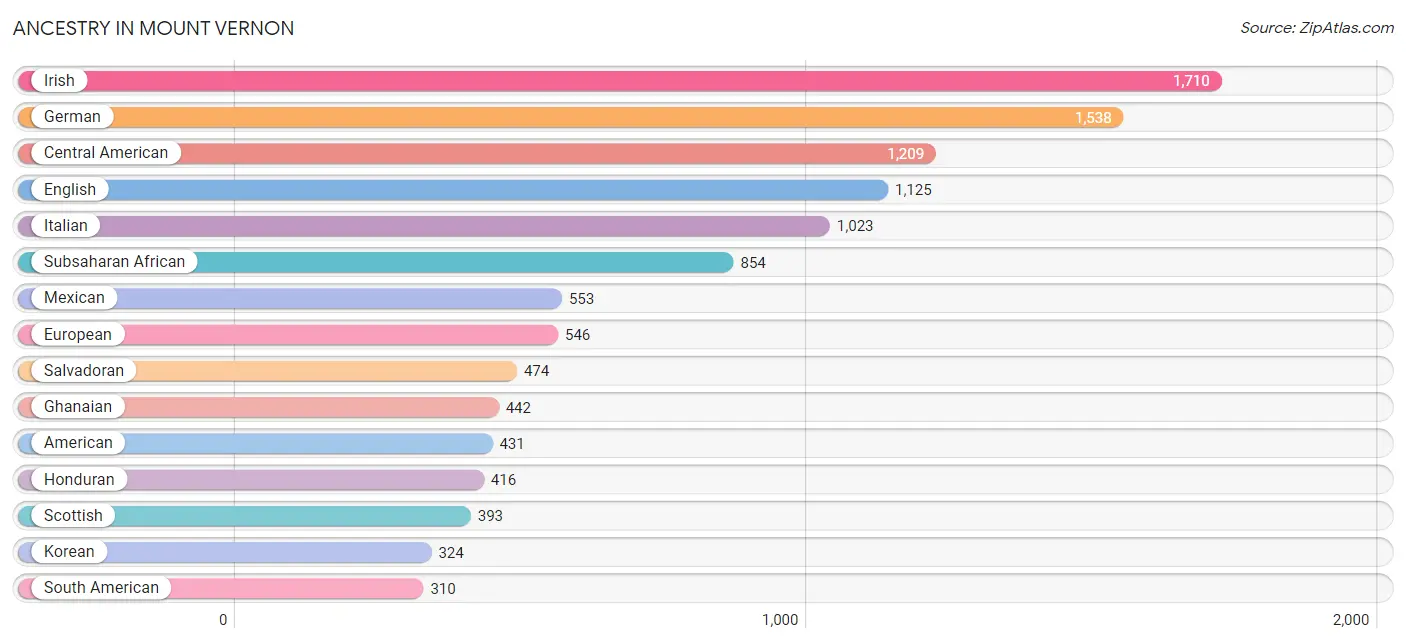
Ancestry in Mount Vernon
The most populous ancestries reported in Mount Vernon are Irish (1,710 | 12.9%), German (1,538 | 11.6%), Central American (1,209 | 9.1%), English (1,125 | 8.5%), and Italian (1,023 | 7.7%), together accounting for 49.7% of all Mount Vernon residents.
| Ancestry | # Population | % Population |
| African | 37 | 0.3% |
| American | 431 | 3.2% |
| Apache | 66 | 0.5% |
| Arab | 129 | 1.0% |
| Argentinean | 42 | 0.3% |
| Austrian | 31 | 0.2% |
| Bhutanese | 43 | 0.3% |
| Bolivian | 18 | 0.1% |
| British | 147 | 1.1% |
| British West Indian | 12 | 0.1% |
| Burmese | 253 | 1.9% |
| Central American | 1,209 | 9.1% |
| Central American Indian | 52 | 0.4% |
| Cherokee | 4 | 0.0% |
| Chilean | 17 | 0.1% |
| Choctaw | 8 | 0.1% |
| Colombian | 55 | 0.4% |
| Costa Rican | 35 | 0.3% |
| Czech | 45 | 0.3% |
| Danish | 122 | 0.9% |
| Dominican | 8 | 0.1% |
| Dutch | 115 | 0.9% |
| Eastern European | 44 | 0.3% |
| Ecuadorian | 26 | 0.2% |
| Egyptian | 7 | 0.1% |
| English | 1,125 | 8.5% |
| Ethiopian | 177 | 1.3% |
| European | 546 | 4.1% |
| Finnish | 34 | 0.3% |
| French | 186 | 1.4% |
| French Canadian | 47 | 0.4% |
| German | 1,538 | 11.6% |
| Ghanaian | 442 | 3.3% |
| Greek | 111 | 0.8% |
| Guamanian / Chamorro | 3 | 0.0% |
| Guatemalan | 153 | 1.1% |
| Guyanese | 8 | 0.1% |
| Haitian | 30 | 0.2% |
| Honduran | 416 | 3.1% |
| Hungarian | 39 | 0.3% |
| Indian (Asian) | 193 | 1.5% |
| Iranian | 19 | 0.1% |
| Irish | 1,710 | 12.9% |
| Israeli | 18 | 0.1% |
| Italian | 1,023 | 7.7% |
| Jamaican | 135 | 1.0% |
| Korean | 324 | 2.4% |
| Lebanese | 58 | 0.4% |
| Liberian | 76 | 0.6% |
| Lithuanian | 41 | 0.3% |
| Malaysian | 19 | 0.1% |
| Mexican | 553 | 4.2% |
| Moroccan | 43 | 0.3% |
| Native Hawaiian | 30 | 0.2% |
| Nicaraguan | 131 | 1.0% |
| Northern European | 103 | 0.8% |
| Norwegian | 239 | 1.8% |
| Okinawan | 9 | 0.1% |
| Pakistani | 29 | 0.2% |
| Paraguayan | 22 | 0.2% |
| Peruvian | 123 | 0.9% |
| Polish | 262 | 2.0% |
| Portuguese | 7 | 0.1% |
| Puerto Rican | 224 | 1.7% |
| Romanian | 38 | 0.3% |
| Russian | 22 | 0.2% |
| Salvadoran | 474 | 3.6% |
| Scandinavian | 16 | 0.1% |
| Scotch-Irish | 144 | 1.1% |
| Scottish | 393 | 3.0% |
| Slovak | 18 | 0.1% |
| Slovene | 8 | 0.1% |
| South American | 310 | 2.3% |
| South American Indian | 70 | 0.5% |
| Spaniard | 36 | 0.3% |
| Spanish | 43 | 0.3% |
| Sri Lankan | 104 | 0.8% |
| Subsaharan African | 854 | 6.4% |
| Swedish | 141 | 1.1% |
| Swiss | 28 | 0.2% |
| Syrian | 56 | 0.4% |
| Thai | 197 | 1.5% |
| Ukrainian | 9 | 0.1% |
| Uruguayan | 7 | 0.1% |
| Welsh | 187 | 1.4% |
| West Indian | 39 | 0.3% | View All 86 Rows |
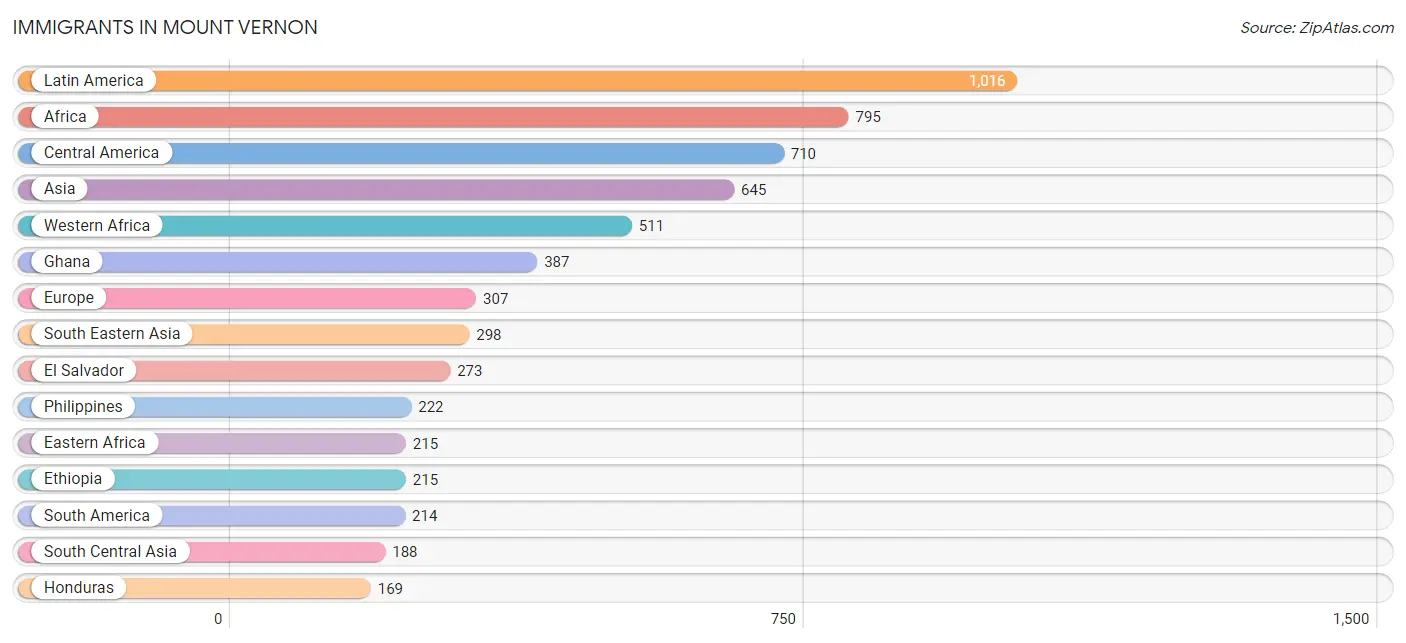
Immigrants in Mount Vernon
The most numerous immigrant groups reported in Mount Vernon came from Latin America (1,016 | 7.6%), Africa (795 | 6.0%), Central America (710 | 5.3%), Asia (645 | 4.9%), and Western Africa (511 | 3.8%), together accounting for 27.6% of all Mount Vernon residents.
| Immigration Origin | # Population | % Population |
| Africa | 795 | 6.0% |
| Argentina | 62 | 0.5% |
| Asia | 645 | 4.9% |
| Bangladesh | 85 | 0.6% |
| Bolivia | 9 | 0.1% |
| Brazil | 7 | 0.1% |
| Cameroon | 29 | 0.2% |
| Canada | 12 | 0.1% |
| Caribbean | 92 | 0.7% |
| Central America | 710 | 5.3% |
| Chile | 17 | 0.1% |
| China | 82 | 0.6% |
| Colombia | 41 | 0.3% |
| Costa Rica | 6 | 0.1% |
| Czechoslovakia | 7 | 0.1% |
| Dominican Republic | 8 | 0.1% |
| Eastern Africa | 215 | 1.6% |
| Eastern Asia | 134 | 1.0% |
| Eastern Europe | 78 | 0.6% |
| Ecuador | 18 | 0.1% |
| El Salvador | 273 | 2.1% |
| England | 18 | 0.1% |
| Ethiopia | 215 | 1.6% |
| Europe | 307 | 2.3% |
| France | 7 | 0.1% |
| Germany | 69 | 0.5% |
| Ghana | 387 | 2.9% |
| Greece | 36 | 0.3% |
| Guatemala | 76 | 0.6% |
| Guyana | 8 | 0.1% |
| Haiti | 18 | 0.1% |
| Honduras | 169 | 1.3% |
| India | 48 | 0.4% |
| Iran | 6 | 0.1% |
| Ireland | 17 | 0.1% |
| Jamaica | 58 | 0.4% |
| Japan | 8 | 0.1% |
| Korea | 44 | 0.3% |
| Latin America | 1,016 | 7.6% |
| Lebanon | 11 | 0.1% |
| Liberia | 33 | 0.3% |
| Lithuania | 20 | 0.2% |
| Mexico | 57 | 0.4% |
| Middle Africa | 29 | 0.2% |
| Morocco | 28 | 0.2% |
| Nepal | 14 | 0.1% |
| Nicaragua | 129 | 1.0% |
| Northern Africa | 28 | 0.2% |
| Northern Europe | 106 | 0.8% |
| Pakistan | 35 | 0.3% |
| Peru | 30 | 0.2% |
| Philippines | 222 | 1.7% |
| Poland | 11 | 0.1% |
| Romania | 32 | 0.2% |
| Russia | 8 | 0.1% |
| Singapore | 9 | 0.1% |
| South America | 214 | 1.6% |
| South Central Asia | 188 | 1.4% |
| South Eastern Asia | 298 | 2.2% |
| Southern Europe | 47 | 0.4% |
| Spain | 11 | 0.1% |
| Sweden | 9 | 0.1% |
| Syria | 14 | 0.1% |
| Thailand | 10 | 0.1% |
| Trinidad and Tobago | 8 | 0.1% |
| Vietnam | 57 | 0.4% |
| Western Africa | 511 | 3.8% |
| Western Asia | 25 | 0.2% |
| Western Europe | 76 | 0.6% | View All 69 Rows |
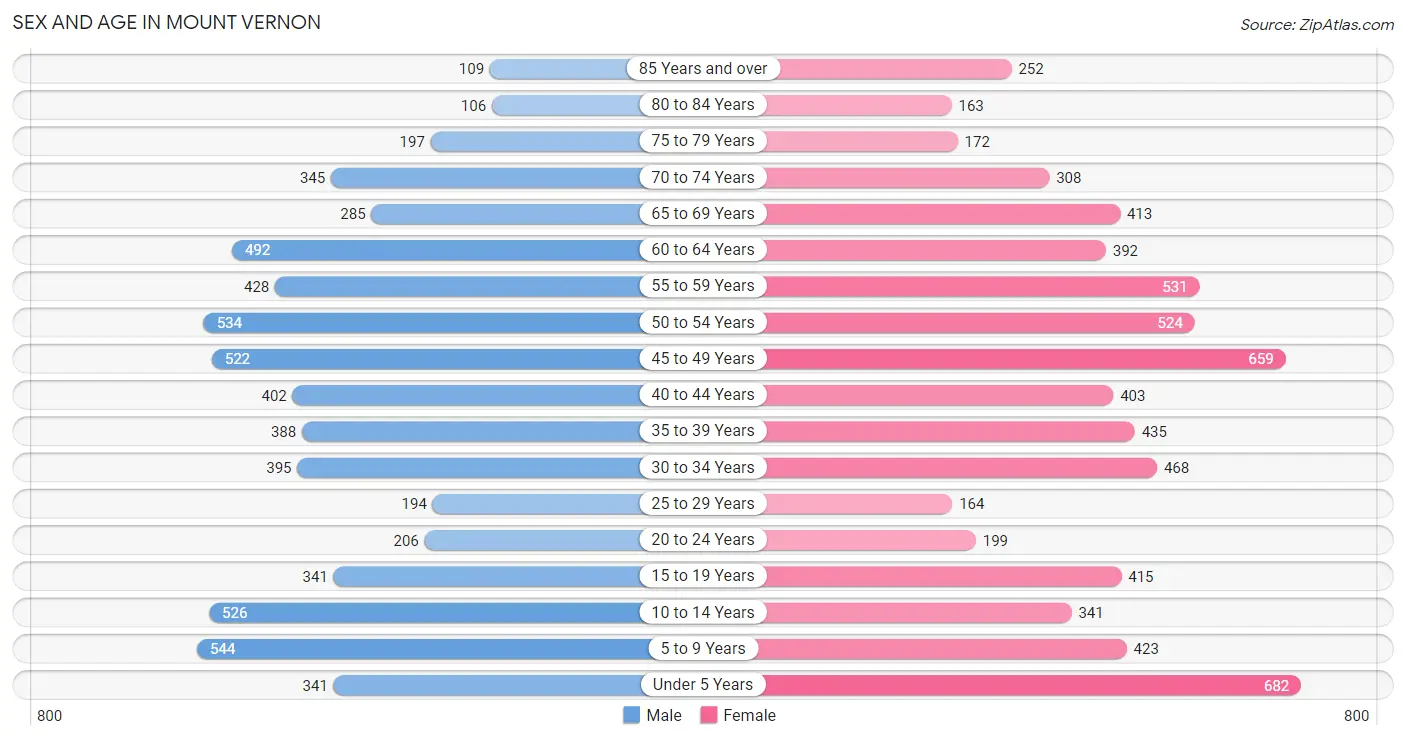
Sex and Age in Mount Vernon
Sex and Age in Mount Vernon
The most populous age groups in Mount Vernon are 5 to 9 Years (544 | 8.6%) for men and Under 5 Years (682 | 9.8%) for women.
| Age Bracket | Male | Female |
| Under 5 Years | 341 (5.4%) | 682 (9.8%) |
| 5 to 9 Years | 544 (8.6%) | 423 (6.1%) |
| 10 to 14 Years | 526 (8.3%) | 341 (4.9%) |
| 15 to 19 Years | 341 (5.4%) | 415 (6.0%) |
| 20 to 24 Years | 206 (3.2%) | 199 (2.9%) |
| 25 to 29 Years | 194 (3.0%) | 164 (2.4%) |
| 30 to 34 Years | 395 (6.2%) | 468 (6.7%) |
| 35 to 39 Years | 388 (6.1%) | 435 (6.3%) |
| 40 to 44 Years | 402 (6.3%) | 403 (5.8%) |
| 45 to 49 Years | 522 (8.2%) | 659 (9.5%) |
| 50 to 54 Years | 534 (8.4%) | 524 (7.5%) |
| 55 to 59 Years | 428 (6.7%) | 531 (7.6%) |
| 60 to 64 Years | 492 (7.7%) | 392 (5.7%) |
| 65 to 69 Years | 285 (4.5%) | 413 (5.9%) |
| 70 to 74 Years | 345 (5.4%) | 308 (4.4%) |
| 75 to 79 Years | 197 (3.1%) | 172 (2.5%) |
| 80 to 84 Years | 106 (1.7%) | 163 (2.4%) |
| 85 Years and over | 109 (1.7%) | 252 (3.6%) |
| Total | 6,355 (100.0%) | 6,944 (100.0%) |
Families and Households in Mount Vernon
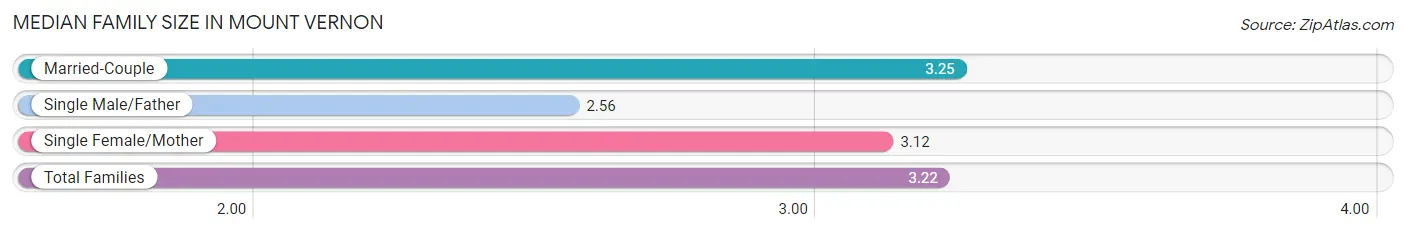
Median Family Size in Mount Vernon
The median family size in Mount Vernon is 3.22 persons per family, with married-couple families (2,961 | 83.1%) accounting for the largest median family size of 3.25 persons per family. On the other hand, single male/father families (70 | 2.0%) represent the smallest median family size with 2.56 persons per family.
| Family Type | # Families | Family Size |
| Married-Couple | 2,961 (83.1%) | 3.25 |
| Single Male/Father | 70 (2.0%) | 2.56 |
| Single Female/Mother | 531 (14.9%) | 3.12 |
| Total Families | 3,562 (100.0%) | 3.22 |
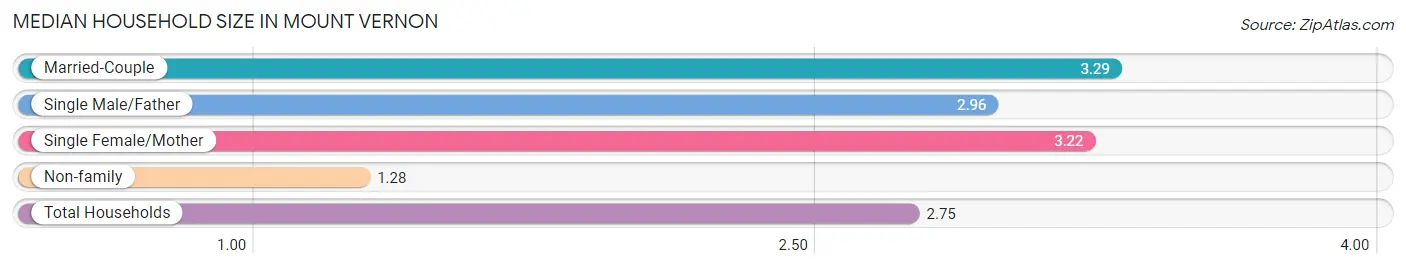
Median Household Size in Mount Vernon
The median household size in Mount Vernon is 2.75 persons per household, with married-couple households (2,961 | 61.4%) accounting for the largest median household size of 3.29 persons per household. non-family households (1,264 | 26.2%) represent the smallest median household size with 1.28 persons per household.
| Household Type | # Households | Household Size |
| Married-Couple | 2,961 (61.4%) | 3.29 |
| Single Male/Father | 70 (1.5%) | 2.96 |
| Single Female/Mother | 531 (11.0%) | 3.22 |
| Non-family | 1,264 (26.2%) | 1.28 |
| Total Households | 4,826 (100.0%) | 2.75 |
Household Size by Marriage Status in Mount Vernon
Out of a total of 4,826 households in Mount Vernon, 3,562 (73.8%) are family households, while 1,264 (26.2%) are nonfamily households. The most numerous type of family households are 2-person households, comprising 1,588, and the most common type of nonfamily households are 1-person households, comprising 996.
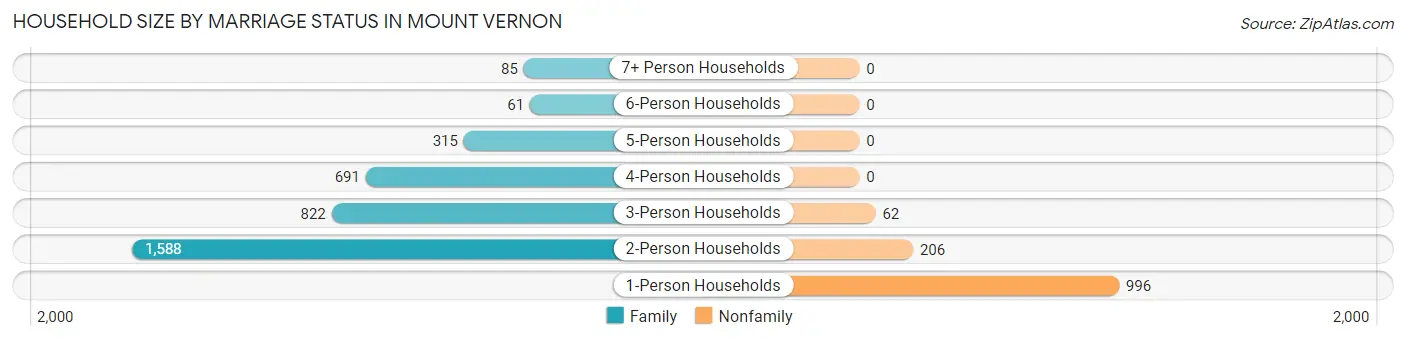
| Household Size | Family Households | Nonfamily Households |
| 1-Person Households | - | 996 (20.6%) |
| 2-Person Households | 1,588 (32.9%) | 206 (4.3%) |
| 3-Person Households | 822 (17.0%) | 62 (1.3%) |
| 4-Person Households | 691 (14.3%) | 0 (0.0%) |
| 5-Person Households | 315 (6.5%) | 0 (0.0%) |
| 6-Person Households | 61 (1.3%) | 0 (0.0%) |
| 7+ Person Households | 85 (1.8%) | 0 (0.0%) |
| Total | 3,562 (73.8%) | 1,264 (26.2%) |
Female Fertility in Mount Vernon
Fertility by Age in Mount Vernon
Average fertility rate in Mount Vernon is 79.0 births per 1,000 women. Women in the age bracket of 35 to 50 years have the highest fertility rate with 112.0 births per 1,000 women. Women in the age bracket of 35 to 50 years acount for 79.6% of all women with births.
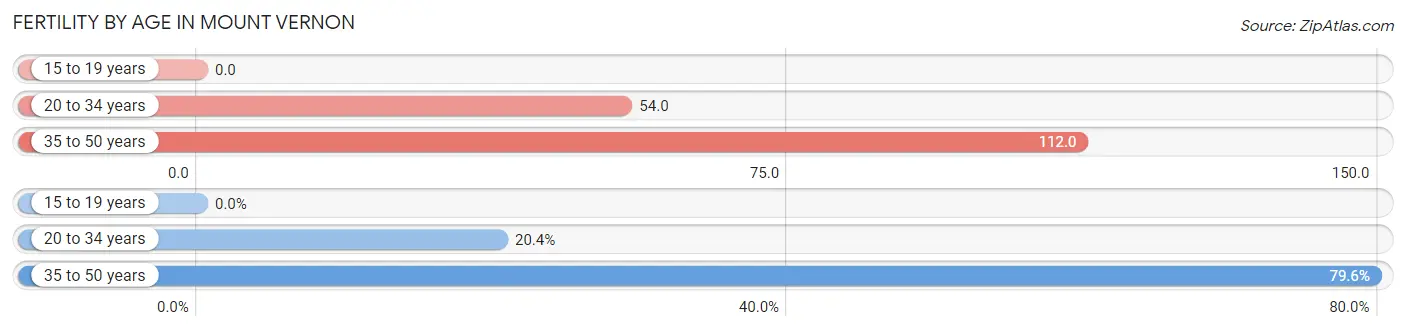
| Age Bracket | Women with Births | Births / 1,000 Women |
| 15 to 19 years | 0 (0.0%) | 0.0 |
| 20 to 34 years | 45 (20.4%) | 54.0 |
| 35 to 50 years | 176 (79.6%) | 112.0 |
| Total | 221 (100.0%) | 79.0 |
Fertility by Age by Marriage Status in Mount Vernon
78.3% of women with births (221) in Mount Vernon are married. The highest percentage of unmarried women with births falls into 35 to 50 years age bracket with 27.3% of them unmarried at the time of birth, while the lowest percentage of unmarried women with births belong to 20 to 34 years age bracket with 0.0% of them unmarried.
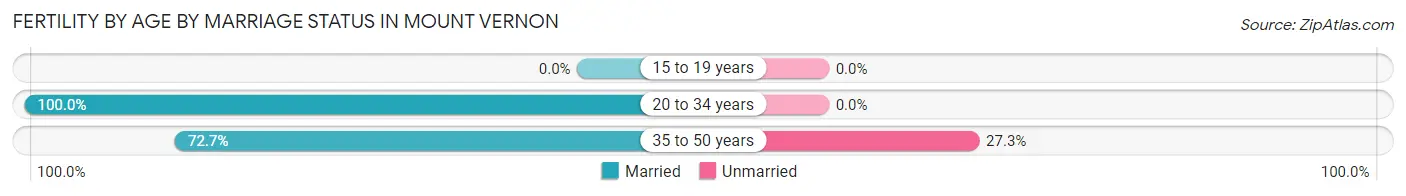
| Age Bracket | Married | Unmarried |
| 15 to 19 years | 0 (0.0%) | 0 (0.0%) |
| 20 to 34 years | 45 (100.0%) | 0 (0.0%) |
| 35 to 50 years | 128 (72.7%) | 48 (27.3%) |
| Total | 173 (78.3%) | 48 (21.7%) |
Fertility by Education in Mount Vernon
Average fertility rate in Mount Vernon is 79.0 births per 1,000 women. Women with the education attainment of college or associate's degree have the highest fertility rate of 193.0 births per 1,000 women, while women with the education attainment of bachelor's degree have the lowest fertility at 11.0 births per 1,000 women. Women with the education attainment of college or associate's degree represent 46.2% of all women with births.
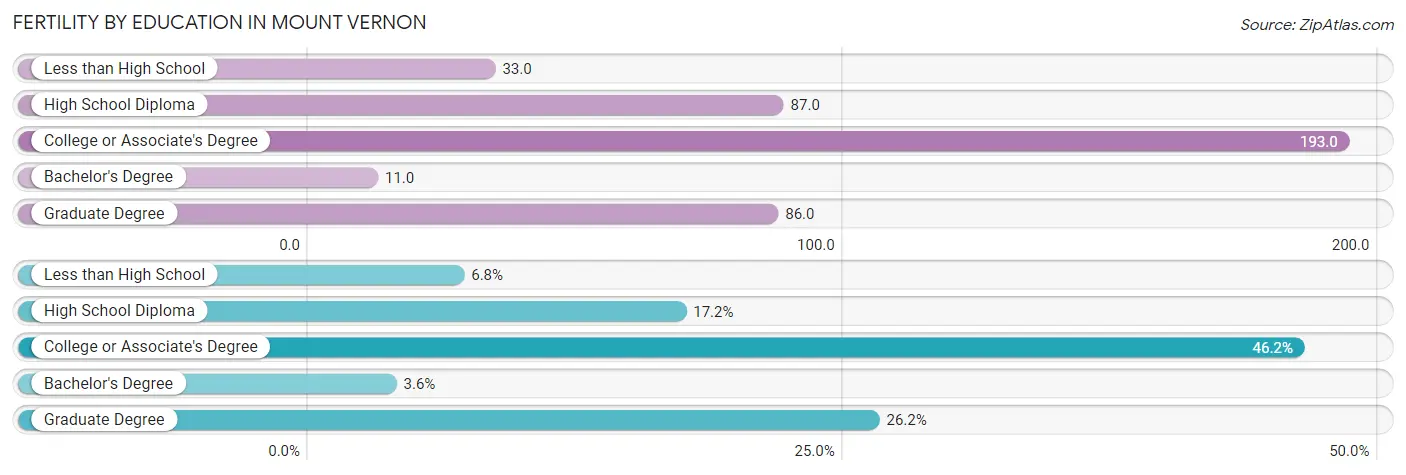
| Educational Attainment | Women with Births | Births / 1,000 Women |
| Less than High School | 15 (6.8%) | 33.0 |
| High School Diploma | 38 (17.2%) | 87.0 |
| College or Associate's Degree | 102 (46.2%) | 193.0 |
| Bachelor's Degree | 8 (3.6%) | 11.0 |
| Graduate Degree | 58 (26.2%) | 86.0 |
| Total | 221 (100.0%) | 79.0 |
Fertility by Education by Marriage Status in Mount Vernon
21.7% of women with births in Mount Vernon are unmarried. Women with the educational attainment of less than high school are most likely to be married with 100.0% of them married at childbirth, while women with the educational attainment of college or associate's degree are least likely to be married with 47.1% of them unmarried at childbirth.
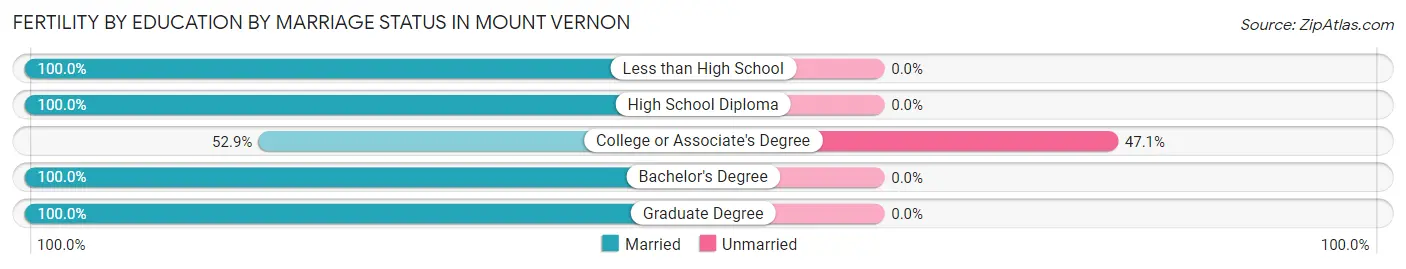
| Educational Attainment | Married | Unmarried |
| Less than High School | 15 (100.0%) | 0 (0.0%) |
| High School Diploma | 38 (100.0%) | 0 (0.0%) |
| College or Associate's Degree | 54 (52.9%) | 48 (47.1%) |
| Bachelor's Degree | 8 (100.0%) | 0 (0.0%) |
| Graduate Degree | 58 (100.0%) | 0 (0.0%) |
| Total | 173 (78.3%) | 48 (21.7%) |
Employment Characteristics in Mount Vernon
Employment by Class of Employer in Mount Vernon
Among the 6,706 employed individuals in Mount Vernon, private company employees (3,071 | 45.8%), federal government employees (1,513 | 22.6%), and self-employed (not incorporated) (678 | 10.1%) make up the most common classes of employment.
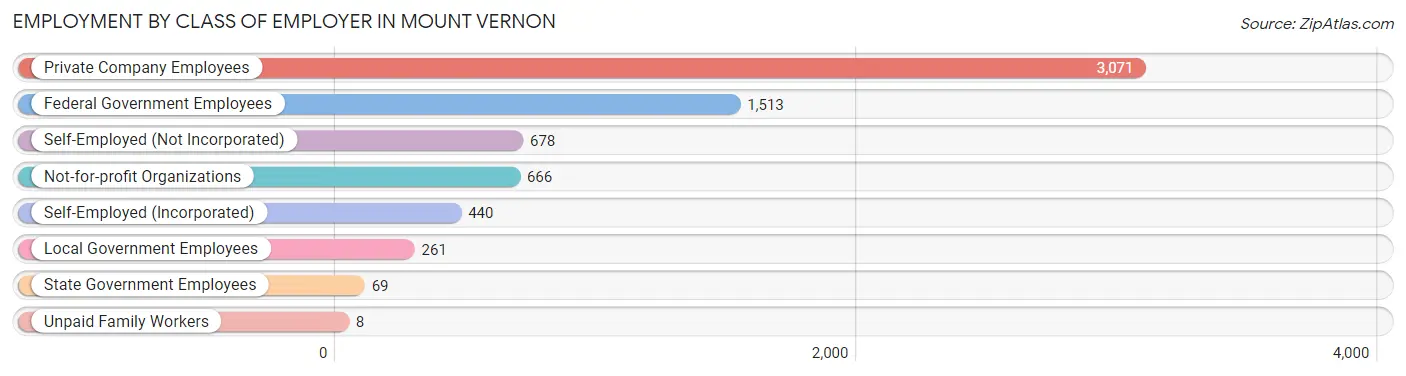
| Employer Class | # Employees | % Employees |
| Private Company Employees | 3,071 | 45.8% |
| Self-Employed (Incorporated) | 440 | 6.6% |
| Self-Employed (Not Incorporated) | 678 | 10.1% |
| Not-for-profit Organizations | 666 | 9.9% |
| Local Government Employees | 261 | 3.9% |
| State Government Employees | 69 | 1.0% |
| Federal Government Employees | 1,513 | 22.6% |
| Unpaid Family Workers | 8 | 0.1% |
| Total | 6,706 | 100.0% |
Employment Status by Age in Mount Vernon
According to the labor force statistics for Mount Vernon, out of the total population over 16 years of age (10,268), 69.4% or 7,126 individuals are in the labor force, with 3.3% or 235 of them unemployed. The age group with the highest labor force participation rate is 30 to 34 years, with 89.8% or 775 individuals in the labor force. Within the labor force, the 30 to 34 years age range has the highest percentage of unemployed individuals, with 13.2% or 102 of them being unemployed.
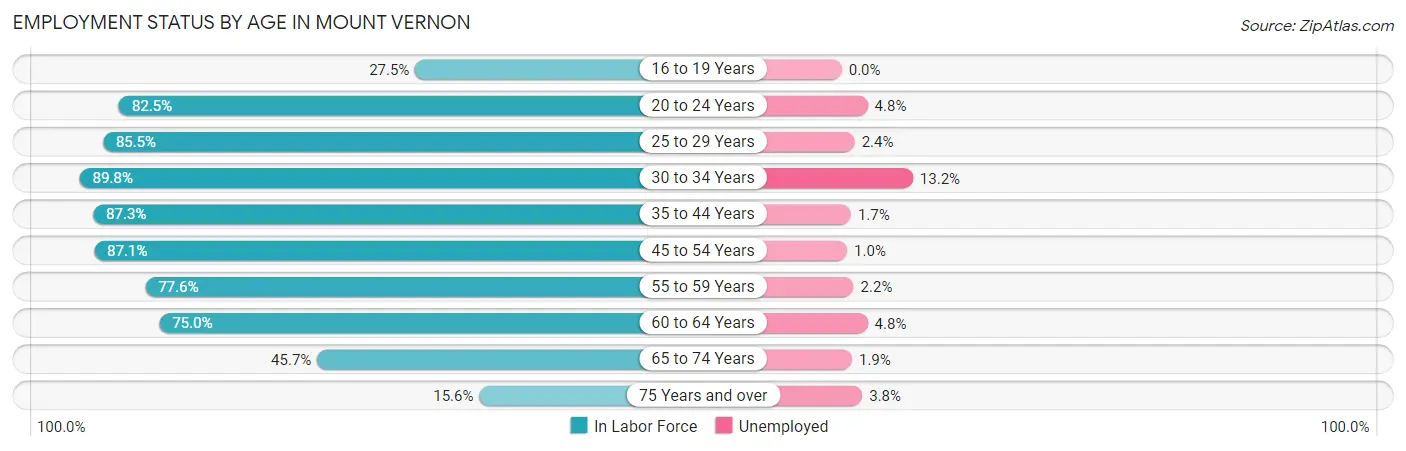
| Age Bracket | In Labor Force | Unemployed |
| 16 to 19 Years | 160 (27.5%) | 0 (0.0%) |
| 20 to 24 Years | 334 (82.5%) | 16 (4.8%) |
| 25 to 29 Years | 306 (85.5%) | 7 (2.4%) |
| 30 to 34 Years | 775 (89.8%) | 102 (13.2%) |
| 35 to 44 Years | 1,421 (87.3%) | 24 (1.7%) |
| 45 to 54 Years | 1,950 (87.1%) | 20 (1.0%) |
| 55 to 59 Years | 744 (77.6%) | 16 (2.2%) |
| 60 to 64 Years | 663 (75.0%) | 32 (4.8%) |
| 65 to 74 Years | 617 (45.7%) | 12 (1.9%) |
| 75 Years and over | 156 (15.6%) | 6 (3.8%) |
| Total | 7,126 (69.4%) | 235 (3.3%) |
Employment Status by Educational Attainment in Mount Vernon
According to labor force statistics for Mount Vernon, 84.5% of individuals (5,857) out of the total population between 25 and 64 years of age (6,931) are in the labor force, with 3.4% or 199 of them being unemployed. The group with the highest labor force participation rate are those with the educational attainment of less than high school, with 87.4% or 229 individuals in the labor force. Within the labor force, individuals with high school diploma education have the highest percentage of unemployment, with 14.8% or 122 of them being unemployed.
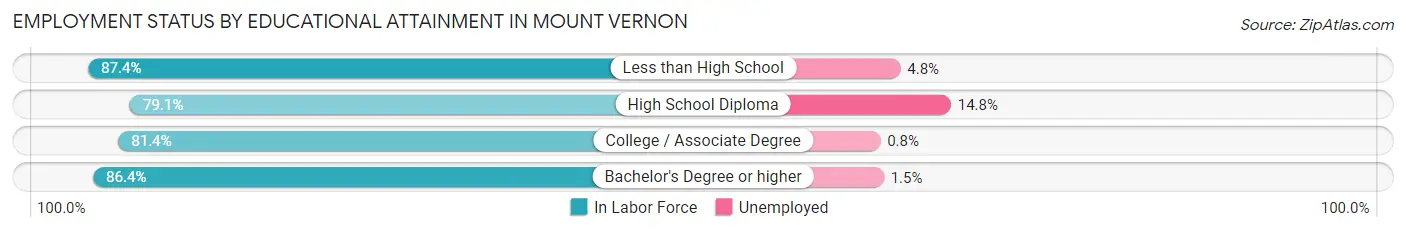
| Educational Attainment | In Labor Force | Unemployed |
| Less than High School | 229 (87.4%) | 13 (4.8%) |
| High School Diploma | 821 (79.1%) | 154 (14.8%) |
| College / Associate Degree | 932 (81.4%) | 9 (0.8%) |
| Bachelor's Degree or higher | 3,876 (86.4%) | 67 (1.5%) |
| Total | 5,857 (84.5%) | 236 (3.4%) |
Employment Occupations by Sex in Mount Vernon
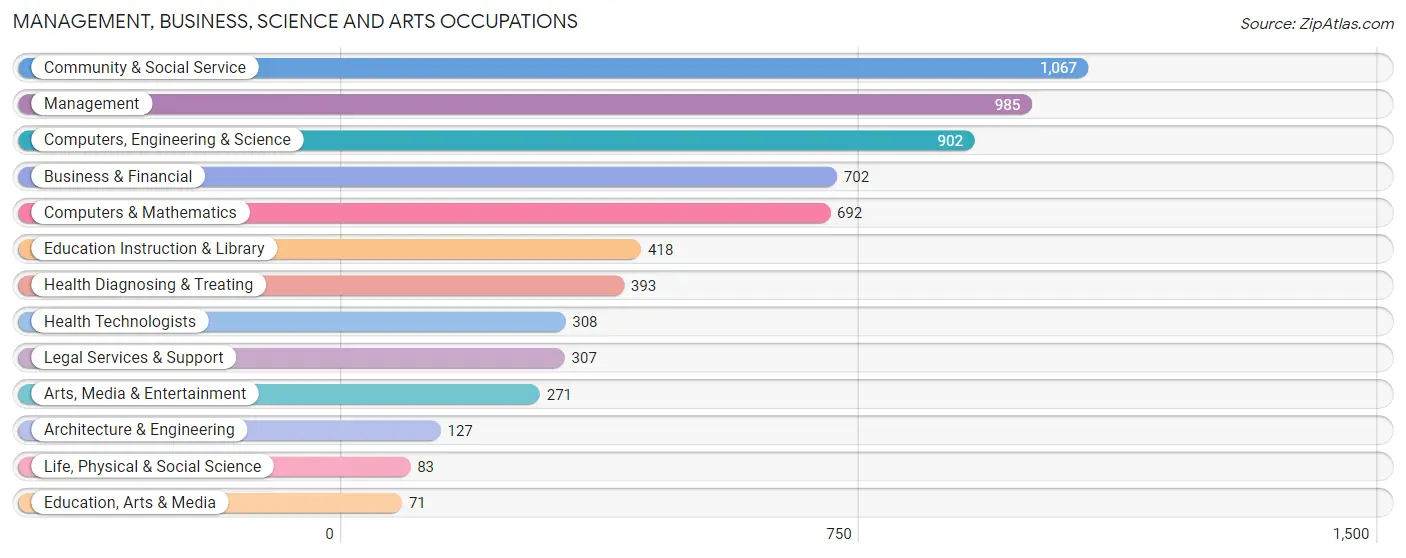
Management, Business, Science and Arts Occupations
The most common Management, Business, Science and Arts occupations in Mount Vernon are Community & Social Service (1,067 | 16.1%), Management (985 | 14.8%), Computers, Engineering & Science (902 | 13.6%), Business & Financial (702 | 10.6%), and Computers & Mathematics (692 | 10.4%).
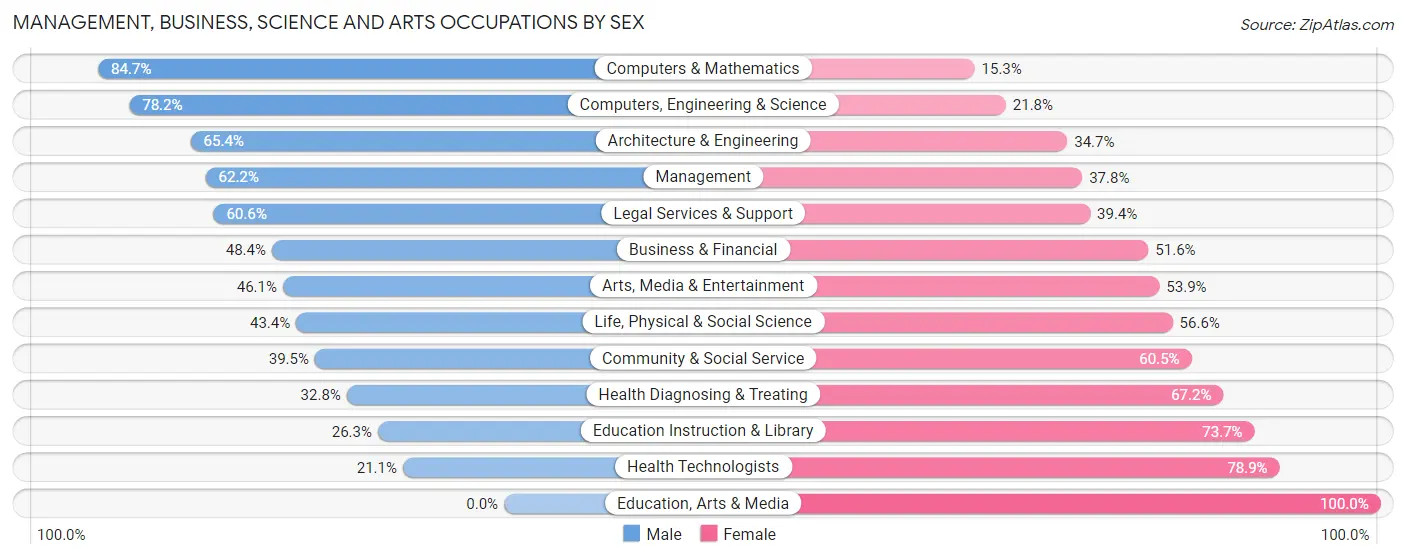
Management, Business, Science and Arts Occupations by Sex
Within the Management, Business, Science and Arts occupations in Mount Vernon, the most male-oriented occupations are Computers & Mathematics (84.7%), Computers, Engineering & Science (78.2%), and Architecture & Engineering (65.3%), while the most female-oriented occupations are Education, Arts & Media (100.0%), Health Technologists (78.9%), and Education Instruction & Library (73.7%).
| Occupation | Male | Female |
| Management | 613 (62.2%) | 372 (37.8%) |
| Business & Financial | 340 (48.4%) | 362 (51.6%) |
| Computers, Engineering & Science | 705 (78.2%) | 197 (21.8%) |
| Computers & Mathematics | 586 (84.7%) | 106 (15.3%) |
| Architecture & Engineering | 83 (65.3%) | 44 (34.6%) |
| Life, Physical & Social Science | 36 (43.4%) | 47 (56.6%) |
| Community & Social Service | 421 (39.5%) | 646 (60.5%) |
| Education, Arts & Media | 0 (0.0%) | 71 (100.0%) |
| Legal Services & Support | 186 (60.6%) | 121 (39.4%) |
| Education Instruction & Library | 110 (26.3%) | 308 (73.7%) |
| Arts, Media & Entertainment | 125 (46.1%) | 146 (53.9%) |
| Health Diagnosing & Treating | 129 (32.8%) | 264 (67.2%) |
| Health Technologists | 65 (21.1%) | 243 (78.9%) |
| Total (Category) | 2,208 (54.5%) | 1,841 (45.5%) |
| Total (Overall) | 3,509 (52.8%) | 3,136 (47.2%) |
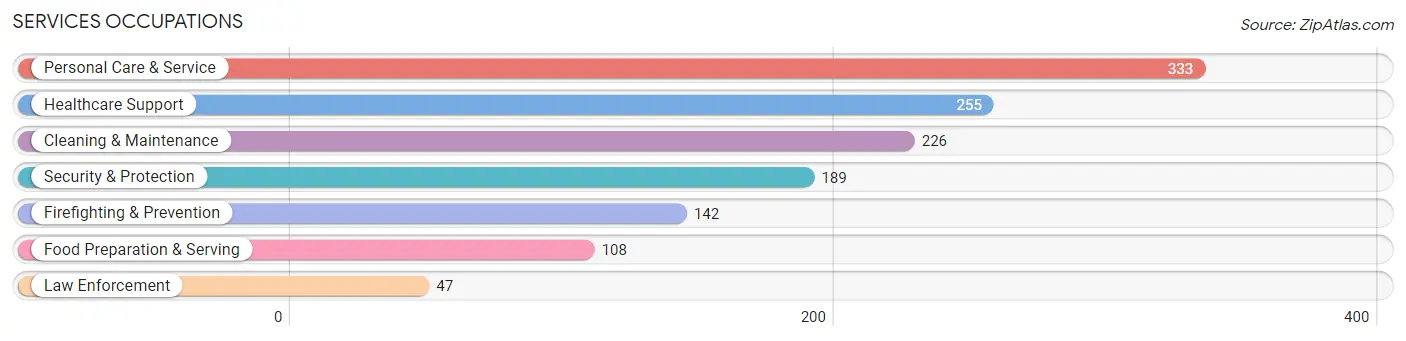
Services Occupations
The most common Services occupations in Mount Vernon are Personal Care & Service (333 | 5.0%), Healthcare Support (255 | 3.8%), Cleaning & Maintenance (226 | 3.4%), Security & Protection (189 | 2.8%), and Firefighting & Prevention (142 | 2.1%).
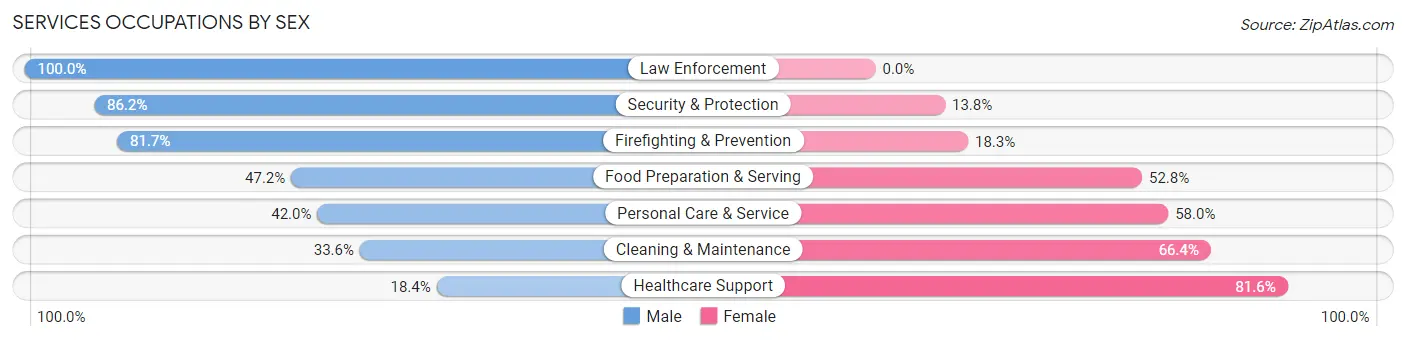
Services Occupations by Sex
Within the Services occupations in Mount Vernon, the most male-oriented occupations are Law Enforcement (100.0%), Security & Protection (86.2%), and Firefighting & Prevention (81.7%), while the most female-oriented occupations are Healthcare Support (81.6%), Cleaning & Maintenance (66.4%), and Personal Care & Service (58.0%).
| Occupation | Male | Female |
| Healthcare Support | 47 (18.4%) | 208 (81.6%) |
| Security & Protection | 163 (86.2%) | 26 (13.8%) |
| Firefighting & Prevention | 116 (81.7%) | 26 (18.3%) |
| Law Enforcement | 47 (100.0%) | 0 (0.0%) |
| Food Preparation & Serving | 51 (47.2%) | 57 (52.8%) |
| Cleaning & Maintenance | 76 (33.6%) | 150 (66.4%) |
| Personal Care & Service | 140 (42.0%) | 193 (58.0%) |
| Total (Category) | 477 (42.9%) | 634 (57.1%) |
| Total (Overall) | 3,509 (52.8%) | 3,136 (47.2%) |
Sales and Office Occupations
The most common Sales and Office occupations in Mount Vernon are Sales & Related (488 | 7.3%), and Office & Administration (441 | 6.6%).
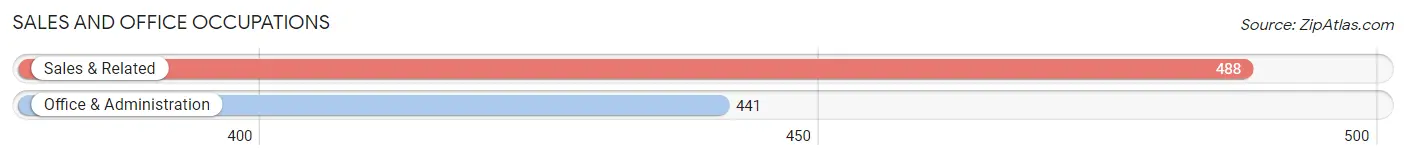
Sales and Office Occupations by Sex
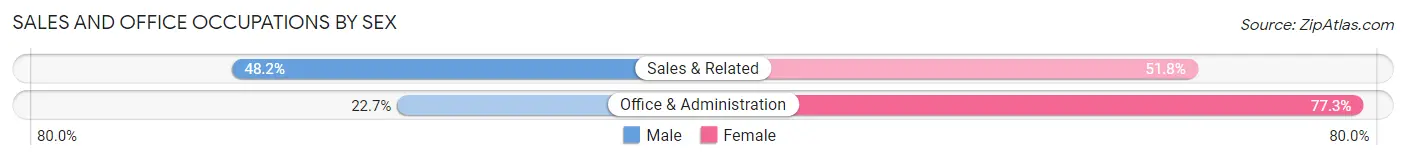
| Occupation | Male | Female |
| Sales & Related | 235 (48.2%) | 253 (51.8%) |
| Office & Administration | 100 (22.7%) | 341 (77.3%) |
| Total (Category) | 335 (36.1%) | 594 (63.9%) |
| Total (Overall) | 3,509 (52.8%) | 3,136 (47.2%) |
Natural Resources, Construction and Maintenance Occupations
The most common Natural Resources, Construction and Maintenance occupations in Mount Vernon are Construction & Extraction (158 | 2.4%), and Installation, Maintenance & Repair (59 | 0.9%).
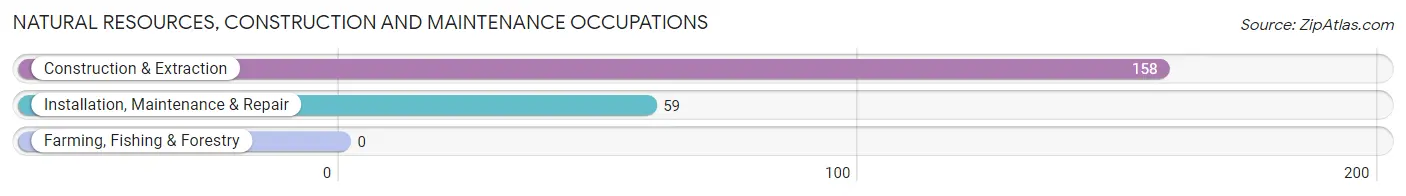
Natural Resources, Construction and Maintenance Occupations by Sex
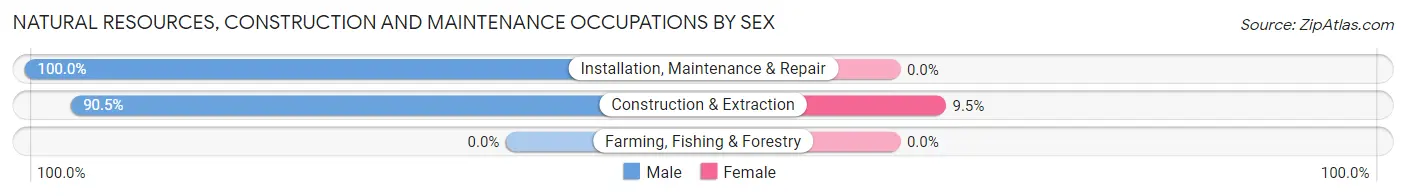
| Occupation | Male | Female |
| Farming, Fishing & Forestry | 0 (0.0%) | 0 (0.0%) |
| Construction & Extraction | 143 (90.5%) | 15 (9.5%) |
| Installation, Maintenance & Repair | 59 (100.0%) | 0 (0.0%) |
| Total (Category) | 202 (93.1%) | 15 (6.9%) |
| Total (Overall) | 3,509 (52.8%) | 3,136 (47.2%) |
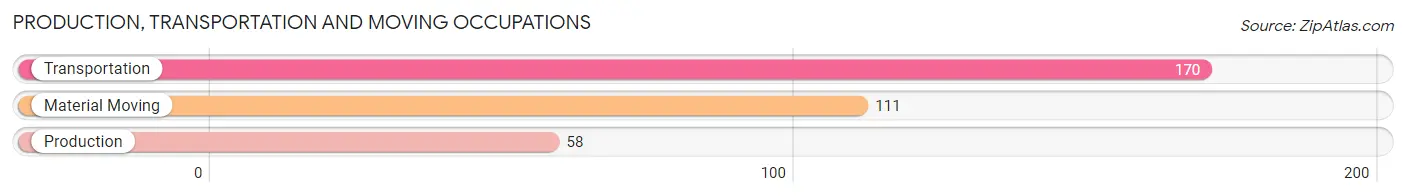
Production, Transportation and Moving Occupations
The most common Production, Transportation and Moving occupations in Mount Vernon are Transportation (170 | 2.6%), Material Moving (111 | 1.7%), and Production (58 | 0.9%).
Production, Transportation and Moving Occupations by Sex
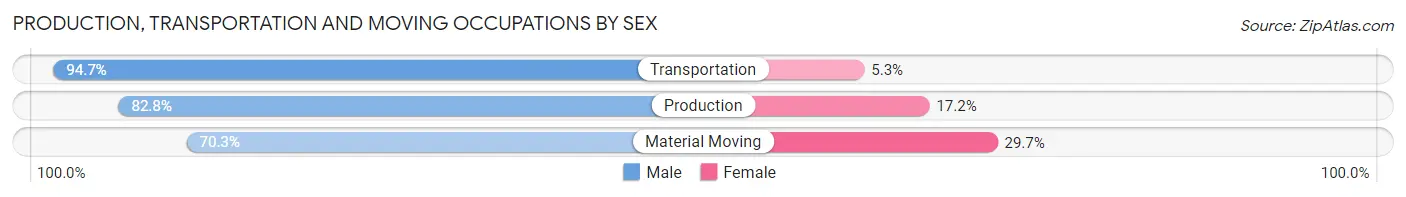
| Occupation | Male | Female |
| Production | 48 (82.8%) | 10 (17.2%) |
| Transportation | 161 (94.7%) | 9 (5.3%) |
| Material Moving | 78 (70.3%) | 33 (29.7%) |
| Total (Category) | 287 (84.7%) | 52 (15.3%) |
| Total (Overall) | 3,509 (52.8%) | 3,136 (47.2%) |
Employment Industries by Sex in Mount Vernon
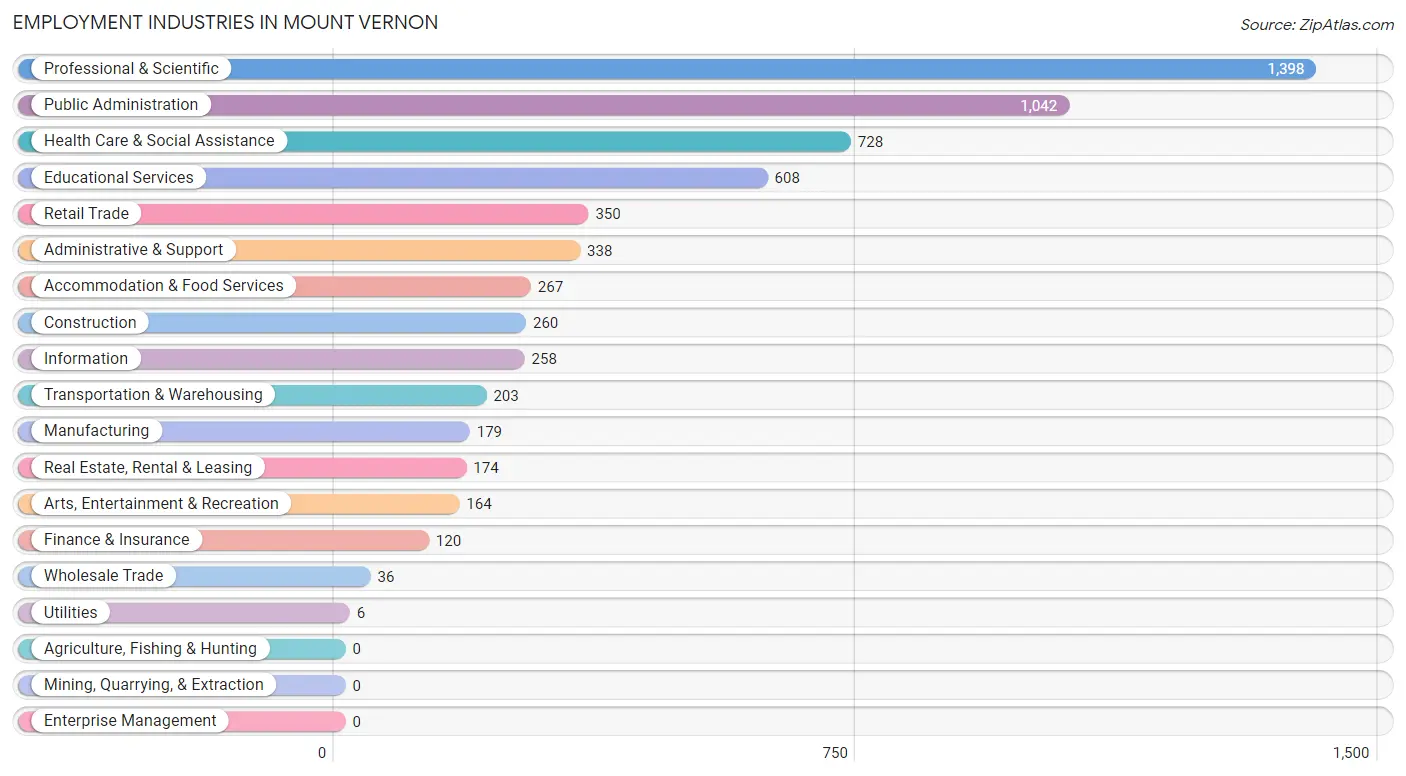
Employment Industries in Mount Vernon
The major employment industries in Mount Vernon include Professional & Scientific (1,398 | 21.0%), Public Administration (1,042 | 15.7%), Health Care & Social Assistance (728 | 11.0%), Educational Services (608 | 9.1%), and Retail Trade (350 | 5.3%).
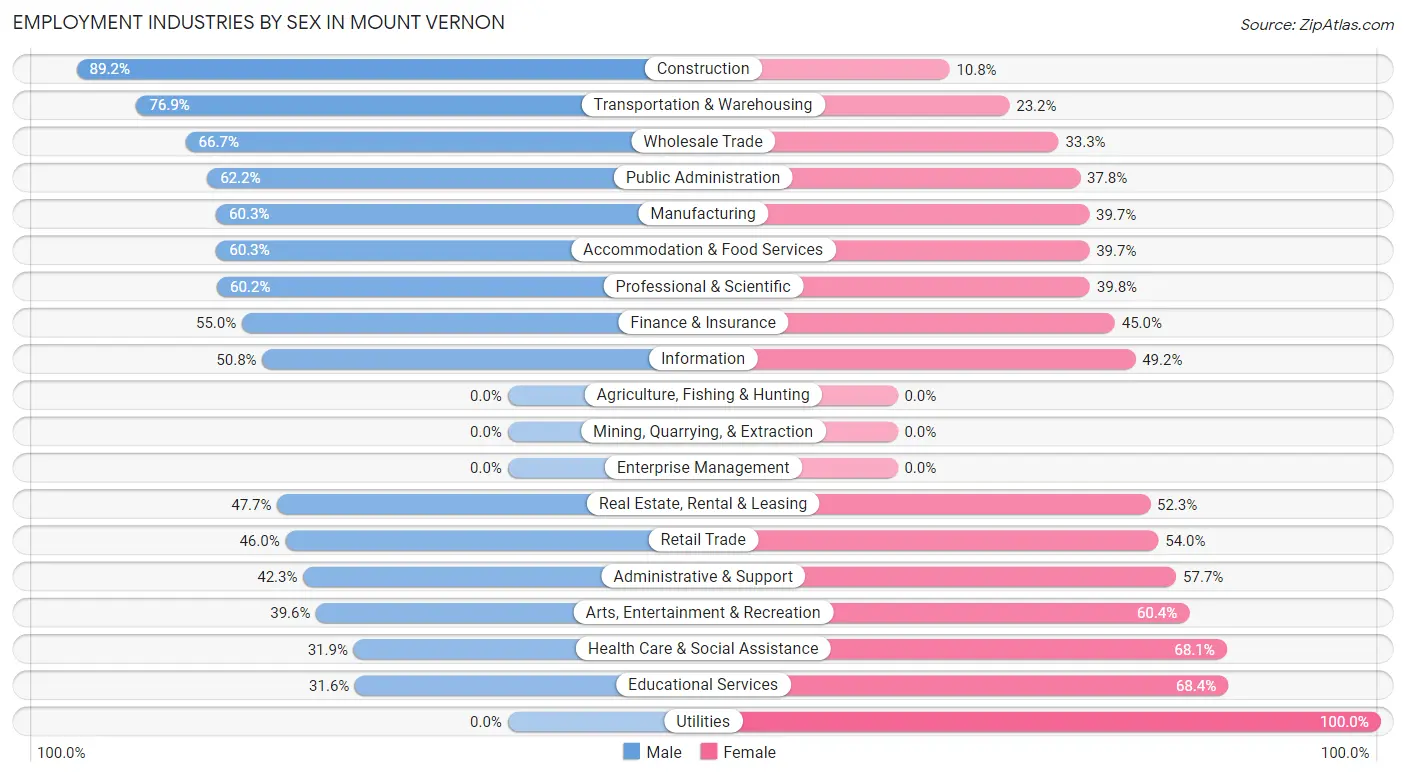
Employment Industries by Sex in Mount Vernon
The Mount Vernon industries that see more men than women are Construction (89.2%), Transportation & Warehousing (76.8%), and Wholesale Trade (66.7%), whereas the industries that tend to have a higher number of women are Utilities (100.0%), Educational Services (68.4%), and Health Care & Social Assistance (68.1%).
| Industry | Male | Female |
| Agriculture, Fishing & Hunting | 0 (0.0%) | 0 (0.0%) |
| Mining, Quarrying, & Extraction | 0 (0.0%) | 0 (0.0%) |
| Construction | 232 (89.2%) | 28 (10.8%) |
| Manufacturing | 108 (60.3%) | 71 (39.7%) |
| Wholesale Trade | 24 (66.7%) | 12 (33.3%) |
| Retail Trade | 161 (46.0%) | 189 (54.0%) |
| Transportation & Warehousing | 156 (76.8%) | 47 (23.2%) |
| Utilities | 0 (0.0%) | 6 (100.0%) |
| Information | 131 (50.8%) | 127 (49.2%) |
| Finance & Insurance | 66 (55.0%) | 54 (45.0%) |
| Real Estate, Rental & Leasing | 83 (47.7%) | 91 (52.3%) |
| Professional & Scientific | 841 (60.2%) | 557 (39.8%) |
| Enterprise Management | 0 (0.0%) | 0 (0.0%) |
| Administrative & Support | 143 (42.3%) | 195 (57.7%) |
| Educational Services | 192 (31.6%) | 416 (68.4%) |
| Health Care & Social Assistance | 232 (31.9%) | 496 (68.1%) |
| Arts, Entertainment & Recreation | 65 (39.6%) | 99 (60.4%) |
| Accommodation & Food Services | 161 (60.3%) | 106 (39.7%) |
| Public Administration | 648 (62.2%) | 394 (37.8%) |
| Total | 3,509 (52.8%) | 3,136 (47.2%) |
Education in Mount Vernon
School Enrollment in Mount Vernon
The most common levels of schooling among the 3,009 students in Mount Vernon are high school (743 | 24.7%), middle school (688 | 22.9%), and elementary school (685 | 22.8%).
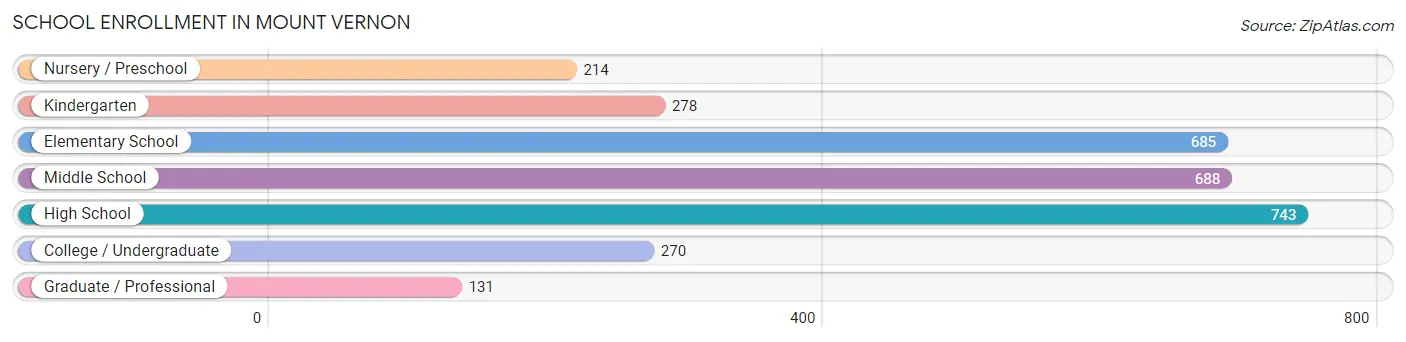
| School Level | # Students | % Students |
| Nursery / Preschool | 214 | 7.1% |
| Kindergarten | 278 | 9.2% |
| Elementary School | 685 | 22.8% |
| Middle School | 688 | 22.9% |
| High School | 743 | 24.7% |
| College / Undergraduate | 270 | 9.0% |
| Graduate / Professional | 131 | 4.3% |
| Total | 3,009 | 100.0% |
School Enrollment by Age by Funding Source in Mount Vernon
Out of a total of 3,009 students who are enrolled in schools in Mount Vernon, 1,026 (34.1%) attend a private institution, while the remaining 1,983 (65.9%) are enrolled in public schools. The age group of 3 to 4 year olds has the highest likelihood of being enrolled in private schools, with 180 (94.2% in the age bracket) enrolled. Conversely, the age group of 18 to 19 year olds has the lowest likelihood of being enrolled in a private school, with 219 (90.1% in the age bracket) attending a public institution.
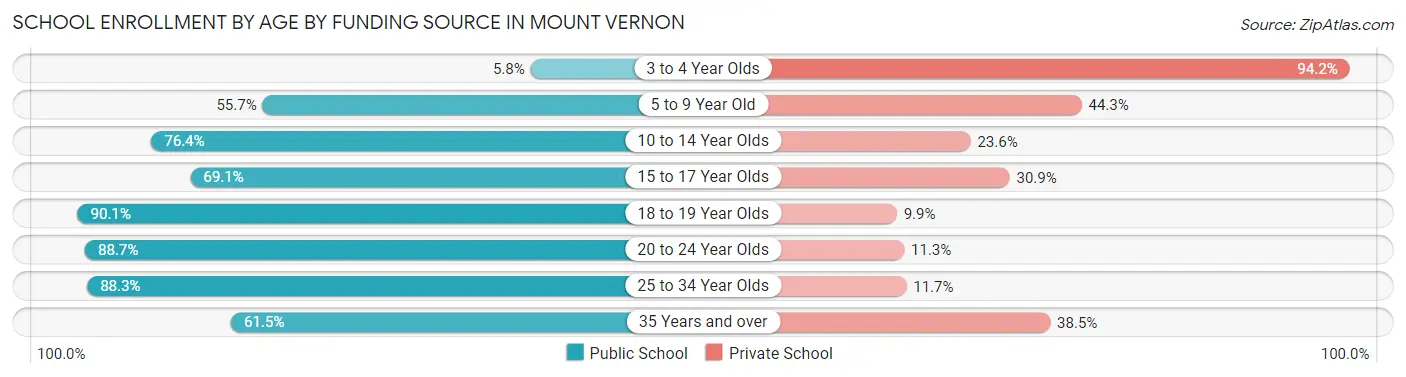
| Age Bracket | Public School | Private School |
| 3 to 4 Year Olds | 11 (5.8%) | 180 (94.2%) |
| 5 to 9 Year Old | 489 (55.7%) | 389 (44.3%) |
| 10 to 14 Year Olds | 650 (76.4%) | 201 (23.6%) |
| 15 to 17 Year Olds | 340 (69.1%) | 152 (30.9%) |
| 18 to 19 Year Olds | 219 (90.1%) | 24 (9.9%) |
| 20 to 24 Year Olds | 134 (88.7%) | 17 (11.3%) |
| 25 to 34 Year Olds | 53 (88.3%) | 7 (11.7%) |
| 35 Years and over | 88 (61.5%) | 55 (38.5%) |
| Total | 1,983 (65.9%) | 1,026 (34.1%) |
Educational Attainment by Field of Study in Mount Vernon
Social sciences (989 | 15.4%), business (956 | 14.9%), liberal arts & history (534 | 8.3%), engineering (507 | 7.9%), and bio, nature & agricultural (472 | 7.4%) are the most common fields of study among 6,409 individuals in Mount Vernon who have obtained a bachelor's degree or higher.
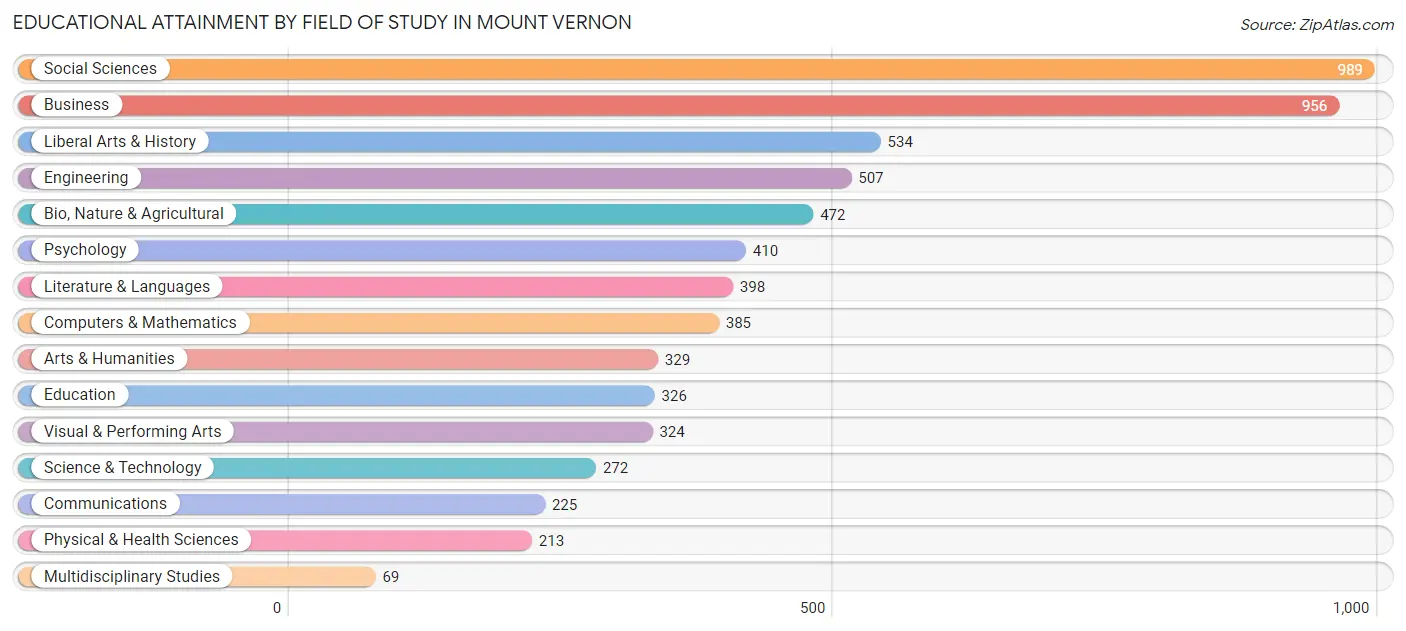
| Field of Study | # Graduates | % Graduates |
| Computers & Mathematics | 385 | 6.0% |
| Bio, Nature & Agricultural | 472 | 7.4% |
| Physical & Health Sciences | 213 | 3.3% |
| Psychology | 410 | 6.4% |
| Social Sciences | 989 | 15.4% |
| Engineering | 507 | 7.9% |
| Multidisciplinary Studies | 69 | 1.1% |
| Science & Technology | 272 | 4.2% |
| Business | 956 | 14.9% |
| Education | 326 | 5.1% |
| Literature & Languages | 398 | 6.2% |
| Liberal Arts & History | 534 | 8.3% |
| Visual & Performing Arts | 324 | 5.1% |
| Communications | 225 | 3.5% |
| Arts & Humanities | 329 | 5.1% |
| Total | 6,409 | 100.0% |
Transportation & Commute in Mount Vernon
Vehicle Availability by Sex in Mount Vernon
The most prevalent vehicle ownership categories in Mount Vernon are males with 2 vehicles (1,751, accounting for 48.0%) and females with 2 vehicles (1,391, making up 57.5%).
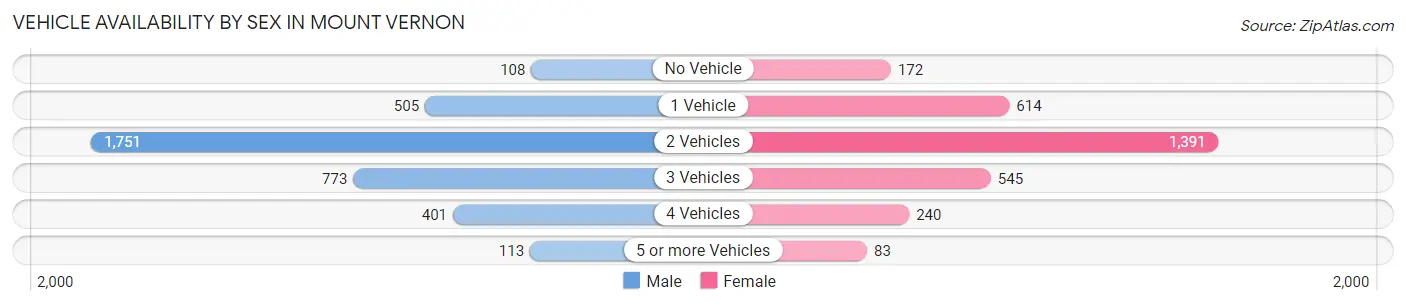
| Vehicles Available | Male | Female |
| No Vehicle | 108 (3.0%) | 172 (5.7%) |
| 1 Vehicle | 505 (13.8%) | 614 (20.2%) |
| 2 Vehicles | 1,751 (48.0%) | 1,391 (45.7%) |
| 3 Vehicles | 773 (21.2%) | 545 (17.9%) |
| 4 Vehicles | 401 (11.0%) | 240 (7.9%) |
| 5 or more Vehicles | 113 (3.1%) | 83 (2.7%) |
| Total | 3,651 (100.0%) | 3,045 (100.0%) |
Commute Time in Mount Vernon
The most frequently occuring commute durations in Mount Vernon are 30 to 34 minutes (990 commuters, 19.0%), 45 to 59 minutes (730 commuters, 14.0%), and 15 to 19 minutes (631 commuters, 12.1%).
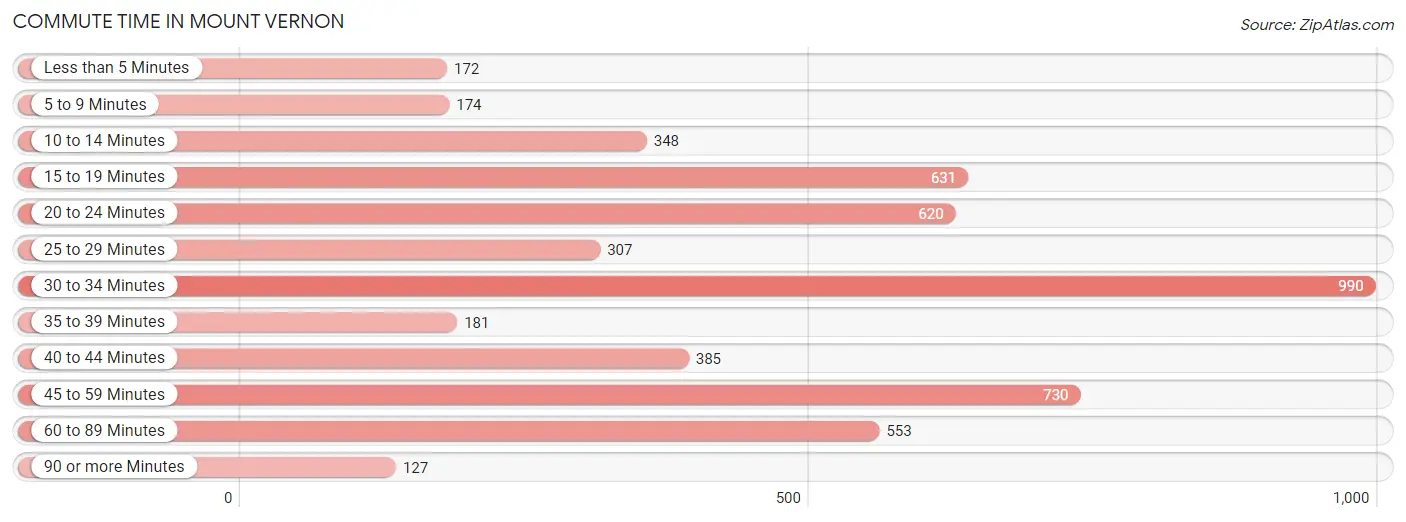
| Commute Time | # Commuters | % Commuters |
| Less than 5 Minutes | 172 | 3.3% |
| 5 to 9 Minutes | 174 | 3.3% |
| 10 to 14 Minutes | 348 | 6.7% |
| 15 to 19 Minutes | 631 | 12.1% |
| 20 to 24 Minutes | 620 | 11.9% |
| 25 to 29 Minutes | 307 | 5.9% |
| 30 to 34 Minutes | 990 | 19.0% |
| 35 to 39 Minutes | 181 | 3.5% |
| 40 to 44 Minutes | 385 | 7.4% |
| 45 to 59 Minutes | 730 | 14.0% |
| 60 to 89 Minutes | 553 | 10.6% |
| 90 or more Minutes | 127 | 2.4% |
Commute Time by Sex in Mount Vernon
The most common commute times in Mount Vernon are 30 to 34 minutes (477 commuters, 16.5%) for males and 30 to 34 minutes (513 commuters, 22.1%) for females.
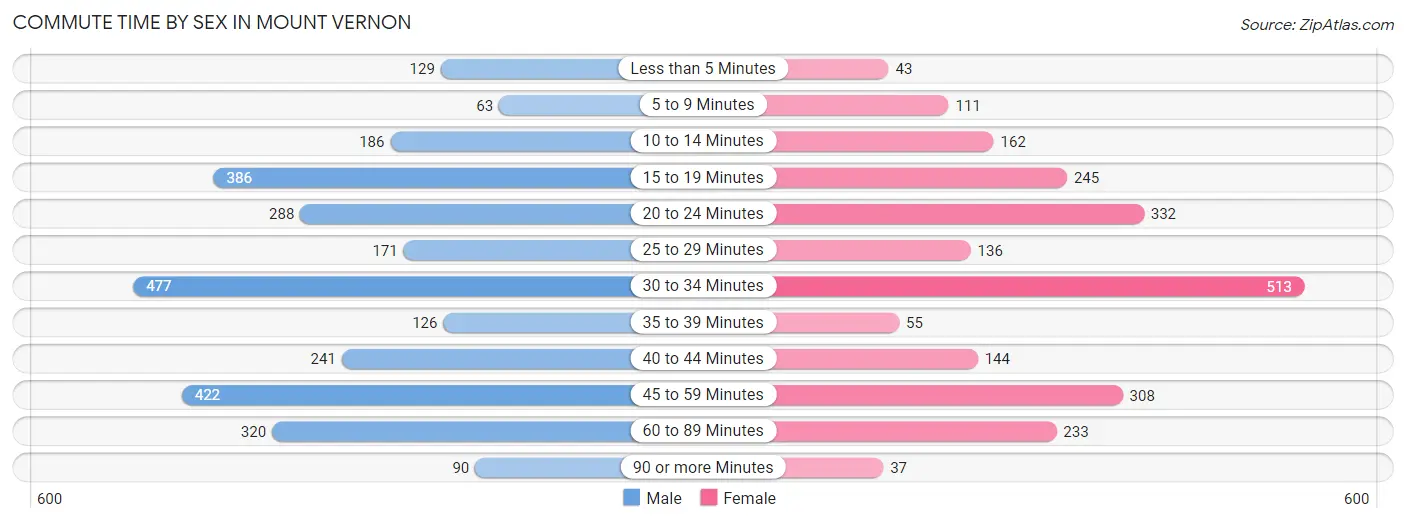
| Commute Time | Male | Female |
| Less than 5 Minutes | 129 (4.4%) | 43 (1.8%) |
| 5 to 9 Minutes | 63 (2.2%) | 111 (4.8%) |
| 10 to 14 Minutes | 186 (6.4%) | 162 (7.0%) |
| 15 to 19 Minutes | 386 (13.3%) | 245 (10.6%) |
| 20 to 24 Minutes | 288 (9.9%) | 332 (14.3%) |
| 25 to 29 Minutes | 171 (5.9%) | 136 (5.9%) |
| 30 to 34 Minutes | 477 (16.5%) | 513 (22.1%) |
| 35 to 39 Minutes | 126 (4.3%) | 55 (2.4%) |
| 40 to 44 Minutes | 241 (8.3%) | 144 (6.2%) |
| 45 to 59 Minutes | 422 (14.6%) | 308 (13.3%) |
| 60 to 89 Minutes | 320 (11.0%) | 233 (10.1%) |
| 90 or more Minutes | 90 (3.1%) | 37 (1.6%) |
Time of Departure to Work by Sex in Mount Vernon
The most frequent times of departure to work in Mount Vernon are 7:00 AM to 7:29 AM (427, 14.7%) for males and 7:00 AM to 7:29 AM (381, 16.4%) for females.
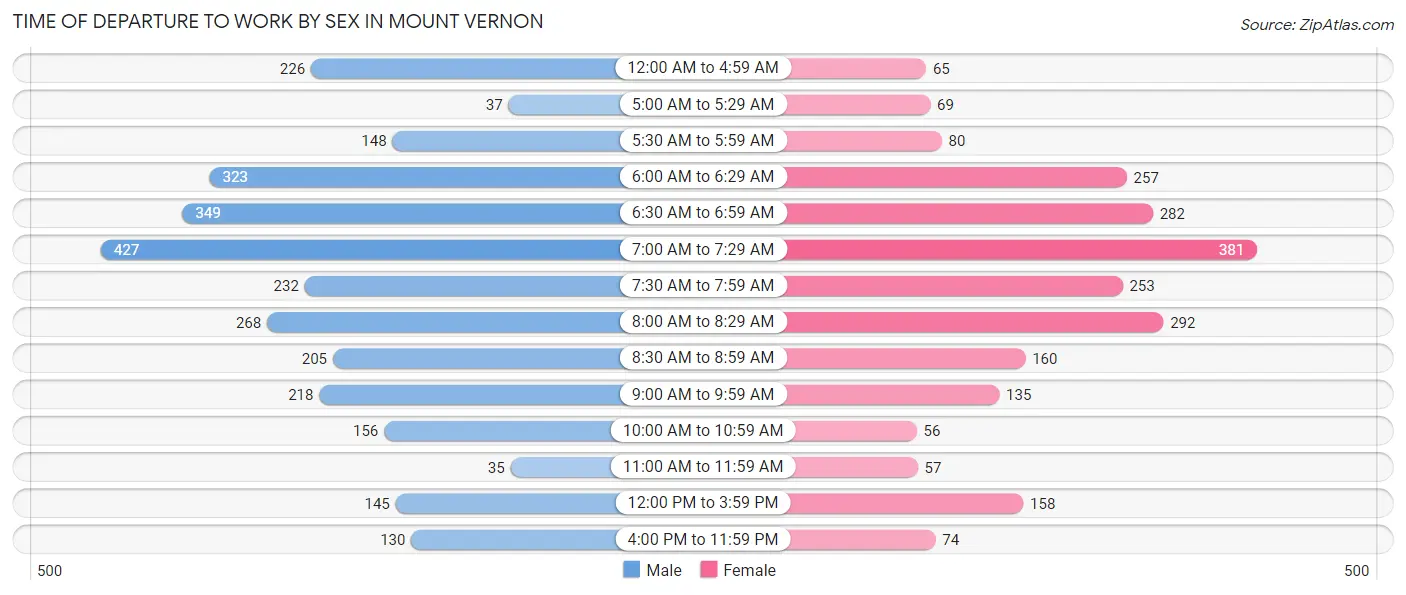
| Time of Departure | Male | Female |
| 12:00 AM to 4:59 AM | 226 (7.8%) | 65 (2.8%) |
| 5:00 AM to 5:29 AM | 37 (1.3%) | 69 (3.0%) |
| 5:30 AM to 5:59 AM | 148 (5.1%) | 80 (3.5%) |
| 6:00 AM to 6:29 AM | 323 (11.1%) | 257 (11.1%) |
| 6:30 AM to 6:59 AM | 349 (12.0%) | 282 (12.2%) |
| 7:00 AM to 7:29 AM | 427 (14.7%) | 381 (16.4%) |
| 7:30 AM to 7:59 AM | 232 (8.0%) | 253 (10.9%) |
| 8:00 AM to 8:29 AM | 268 (9.2%) | 292 (12.6%) |
| 8:30 AM to 8:59 AM | 205 (7.1%) | 160 (6.9%) |
| 9:00 AM to 9:59 AM | 218 (7.5%) | 135 (5.8%) |
| 10:00 AM to 10:59 AM | 156 (5.4%) | 56 (2.4%) |
| 11:00 AM to 11:59 AM | 35 (1.2%) | 57 (2.5%) |
| 12:00 PM to 3:59 PM | 145 (5.0%) | 158 (6.8%) |
| 4:00 PM to 11:59 PM | 130 (4.5%) | 74 (3.2%) |
| Total | 2,899 (100.0%) | 2,319 (100.0%) |
Housing Occupancy in Mount Vernon
Occupancy by Ownership in Mount Vernon
Of the total 4,826 dwellings in Mount Vernon, owner-occupied units account for 3,697 (76.6%), while renter-occupied units make up 1,129 (23.4%).
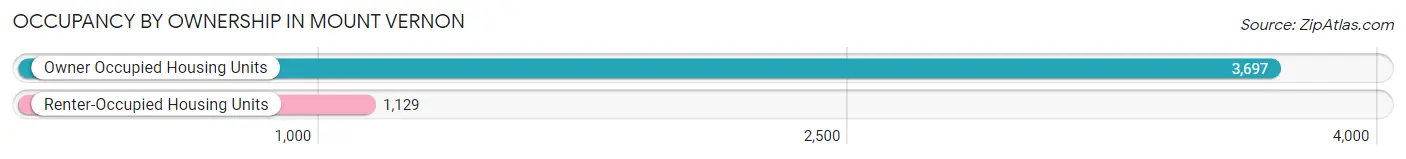
| Occupancy | # Housing Units | % Housing Units |
| Owner Occupied Housing Units | 3,697 | 76.6% |
| Renter-Occupied Housing Units | 1,129 | 23.4% |
| Total Occupied Housing Units | 4,826 | 100.0% |
Occupancy by Household Size in Mount Vernon
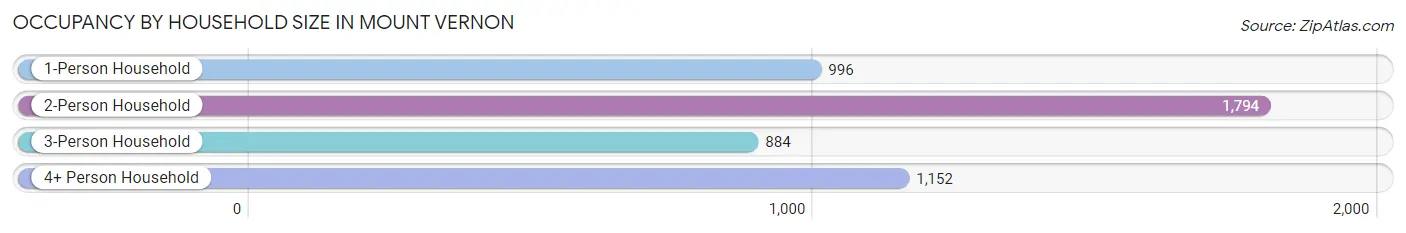
| Household Size | # Housing Units | % Housing Units |
| 1-Person Household | 996 | 20.6% |
| 2-Person Household | 1,794 | 37.2% |
| 3-Person Household | 884 | 18.3% |
| 4+ Person Household | 1,152 | 23.9% |
| Total Housing Units | 4,826 | 100.0% |
Occupancy by Ownership by Household Size in Mount Vernon
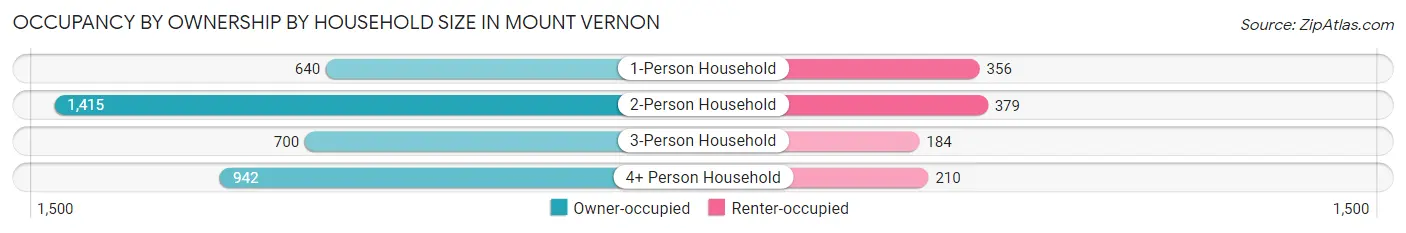
| Household Size | Owner-occupied | Renter-occupied |
| 1-Person Household | 640 (64.3%) | 356 (35.7%) |
| 2-Person Household | 1,415 (78.9%) | 379 (21.1%) |
| 3-Person Household | 700 (79.2%) | 184 (20.8%) |
| 4+ Person Household | 942 (81.8%) | 210 (18.2%) |
| Total Housing Units | 3,697 (76.6%) | 1,129 (23.4%) |
Occupancy by Educational Attainment in Mount Vernon
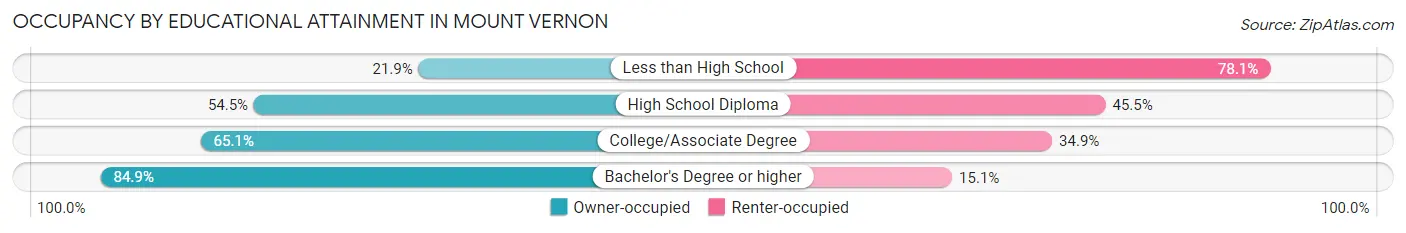
| Household Size | Owner-occupied | Renter-occupied |
| Less than High School | 23 (21.9%) | 82 (78.1%) |
| High School Diploma | 283 (54.5%) | 236 (45.5%) |
| College/Associate Degree | 584 (65.1%) | 313 (34.9%) |
| Bachelor's Degree or higher | 2,807 (84.9%) | 498 (15.1%) |
Occupancy by Age of Householder in Mount Vernon
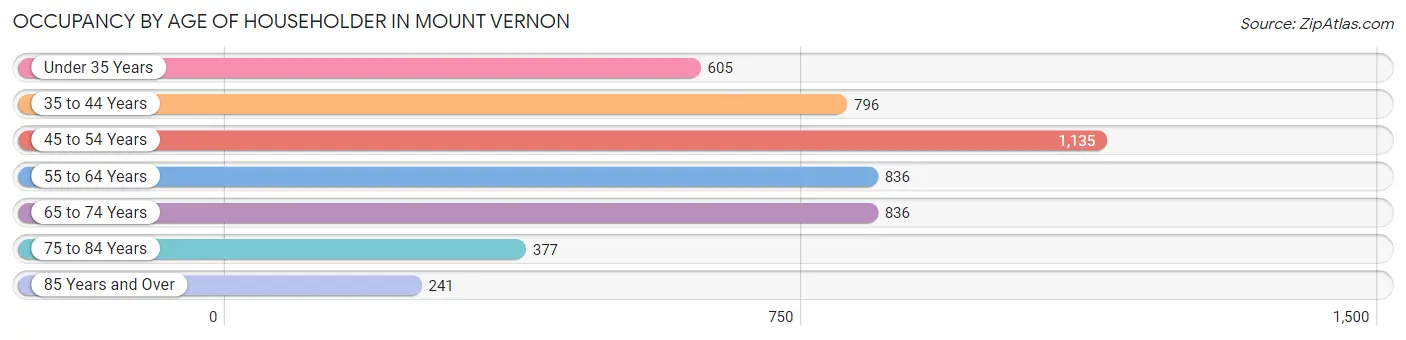
| Age Bracket | # Households | % Households |
| Under 35 Years | 605 | 12.5% |
| 35 to 44 Years | 796 | 16.5% |
| 45 to 54 Years | 1,135 | 23.5% |
| 55 to 64 Years | 836 | 17.3% |
| 65 to 74 Years | 836 | 17.3% |
| 75 to 84 Years | 377 | 7.8% |
| 85 Years and Over | 241 | 5.0% |
| Total | 4,826 | 100.0% |
Housing Finances in Mount Vernon
Median Income by Occupancy in Mount Vernon
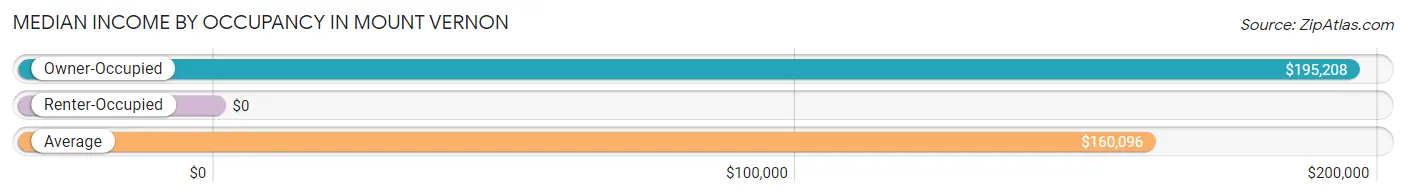
| Occupancy Type | # Households | Median Income |
| Owner-Occupied | 3,697 (76.6%) | $195,208 |
| Renter-Occupied | 1,129 (23.4%) | $0 |
| Average | 4,826 (100.0%) | $160,096 |
Occupancy by Householder Income Bracket in Mount Vernon
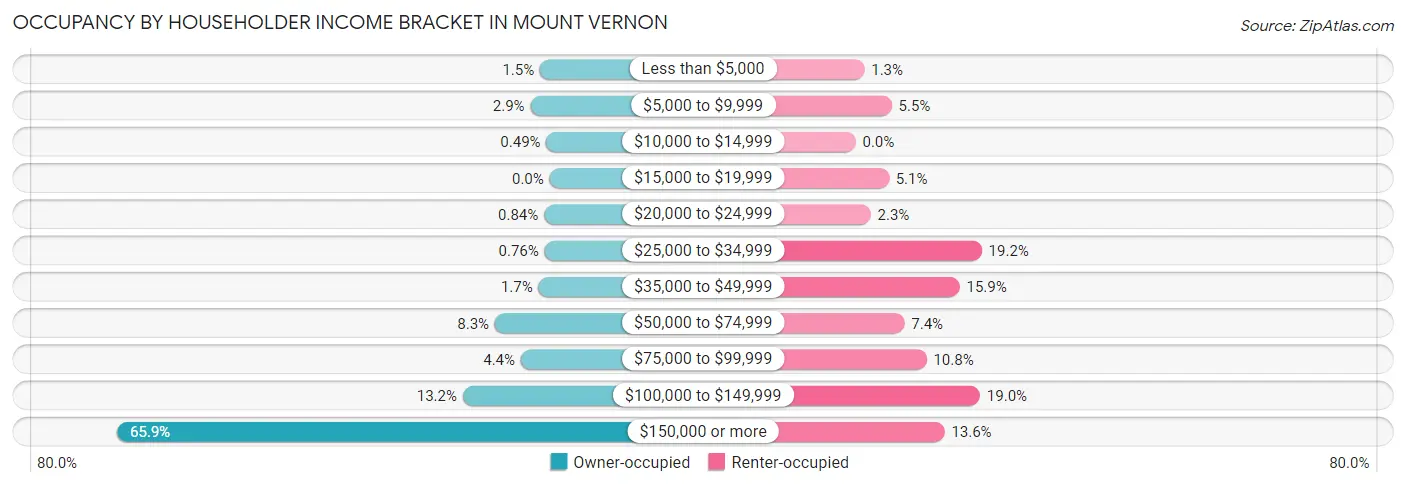
| Income Bracket | Owner-occupied | Renter-occupied |
| Less than $5,000 | 54 (1.5%) | 15 (1.3%) |
| $5,000 to $9,999 | 108 (2.9%) | 62 (5.5%) |
| $10,000 to $14,999 | 18 (0.5%) | 0 (0.0%) |
| $15,000 to $19,999 | 0 (0.0%) | 57 (5.1%) |
| $20,000 to $24,999 | 31 (0.8%) | 26 (2.3%) |
| $25,000 to $34,999 | 28 (0.8%) | 217 (19.2%) |
| $35,000 to $49,999 | 62 (1.7%) | 179 (15.9%) |
| $50,000 to $74,999 | 308 (8.3%) | 84 (7.4%) |
| $75,000 to $99,999 | 162 (4.4%) | 122 (10.8%) |
| $100,000 to $149,999 | 489 (13.2%) | 214 (19.0%) |
| $150,000 or more | 2,437 (65.9%) | 153 (13.6%) |
| Total | 3,697 (100.0%) | 1,129 (100.0%) |
Monthly Housing Cost Tiers in Mount Vernon
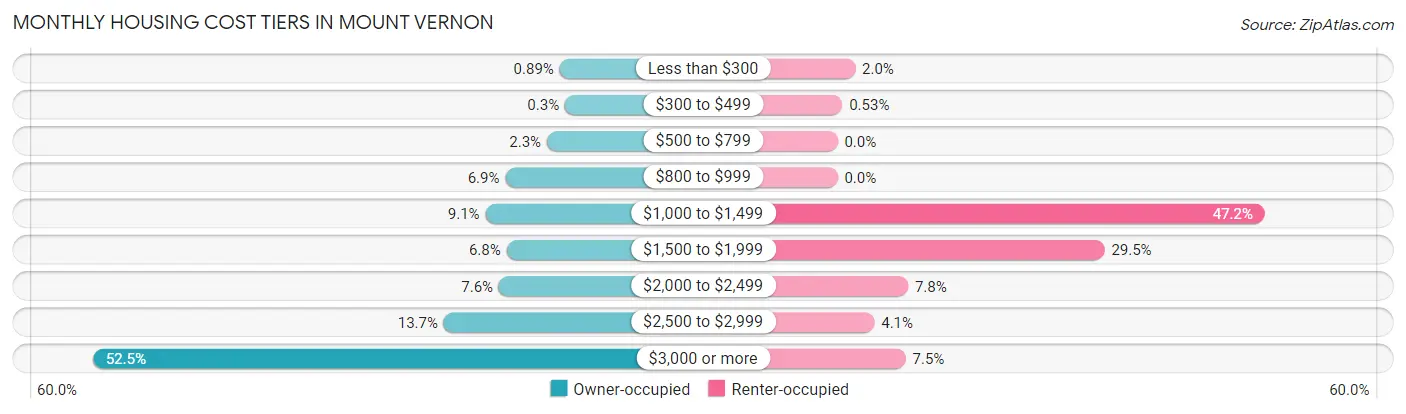
| Monthly Cost | Owner-occupied | Renter-occupied |
| Less than $300 | 33 (0.9%) | 22 (1.9%) |
| $300 to $499 | 11 (0.3%) | 6 (0.5%) |
| $500 to $799 | 85 (2.3%) | 0 (0.0%) |
| $800 to $999 | 255 (6.9%) | 0 (0.0%) |
| $1,000 to $1,499 | 336 (9.1%) | 533 (47.2%) |
| $1,500 to $1,999 | 250 (6.8%) | 333 (29.5%) |
| $2,000 to $2,499 | 281 (7.6%) | 88 (7.8%) |
| $2,500 to $2,999 | 506 (13.7%) | 46 (4.1%) |
| $3,000 or more | 1,940 (52.5%) | 85 (7.5%) |
| Total | 3,697 (100.0%) | 1,129 (100.0%) |
Physical Housing Characteristics in Mount Vernon
Housing Structures in Mount Vernon
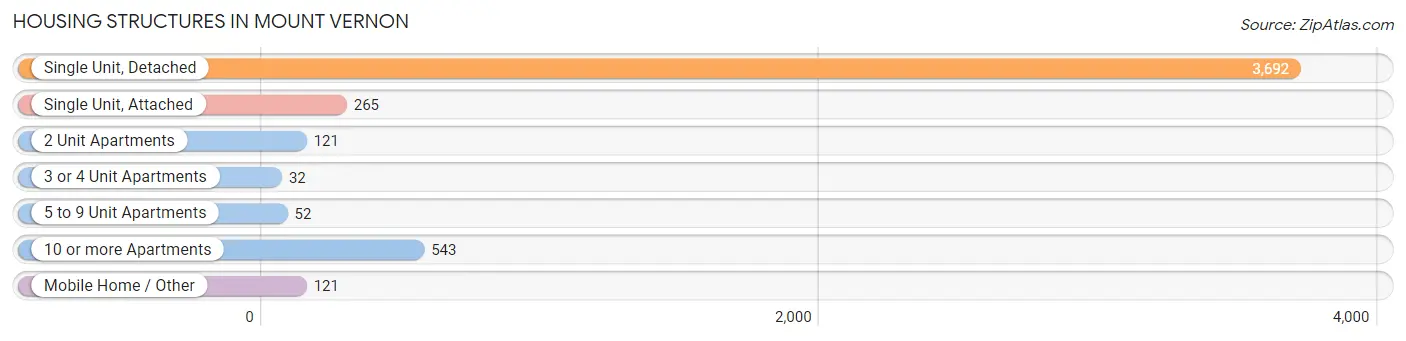
| Structure Type | # Housing Units | % Housing Units |
| Single Unit, Detached | 3,692 | 76.5% |
| Single Unit, Attached | 265 | 5.5% |
| 2 Unit Apartments | 121 | 2.5% |
| 3 or 4 Unit Apartments | 32 | 0.7% |
| 5 to 9 Unit Apartments | 52 | 1.1% |
| 10 or more Apartments | 543 | 11.3% |
| Mobile Home / Other | 121 | 2.5% |
| Total | 4,826 | 100.0% |
Housing Structures by Occupancy in Mount Vernon
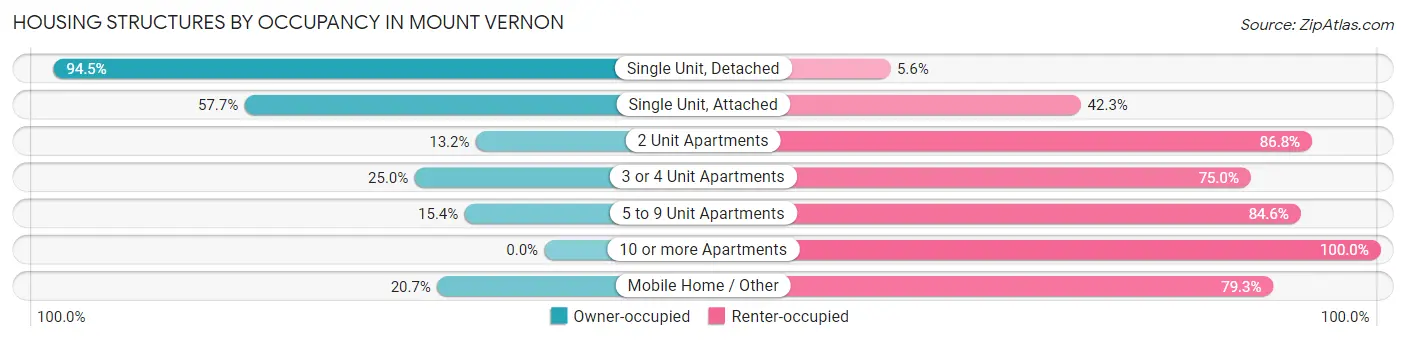
| Structure Type | Owner-occupied | Renter-occupied |
| Single Unit, Detached | 3,487 (94.5%) | 205 (5.6%) |
| Single Unit, Attached | 153 (57.7%) | 112 (42.3%) |
| 2 Unit Apartments | 16 (13.2%) | 105 (86.8%) |
| 3 or 4 Unit Apartments | 8 (25.0%) | 24 (75.0%) |
| 5 to 9 Unit Apartments | 8 (15.4%) | 44 (84.6%) |
| 10 or more Apartments | 0 (0.0%) | 543 (100.0%) |
| Mobile Home / Other | 25 (20.7%) | 96 (79.3%) |
| Total | 3,697 (76.6%) | 1,129 (23.4%) |
Housing Structures by Number of Rooms in Mount Vernon
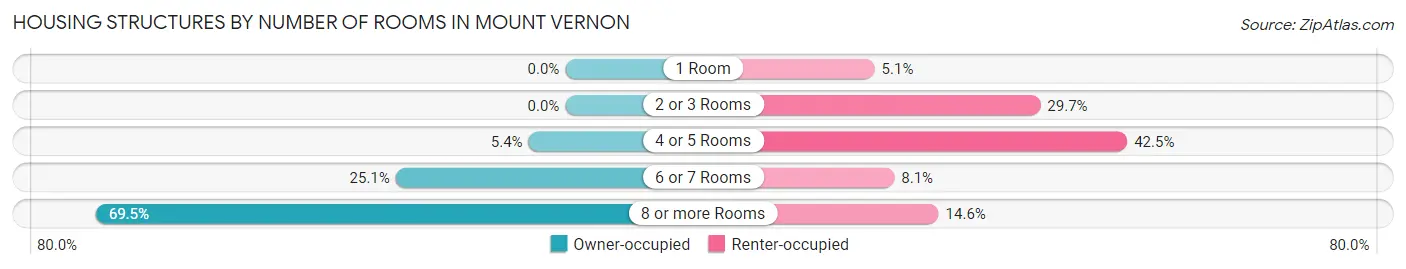
| Number of Rooms | Owner-occupied | Renter-occupied |
| 1 Room | 0 (0.0%) | 58 (5.1%) |
| 2 or 3 Rooms | 0 (0.0%) | 335 (29.7%) |
| 4 or 5 Rooms | 201 (5.4%) | 480 (42.5%) |
| 6 or 7 Rooms | 928 (25.1%) | 91 (8.1%) |
| 8 or more Rooms | 2,568 (69.5%) | 165 (14.6%) |
| Total | 3,697 (100.0%) | 1,129 (100.0%) |
Housing Structure by Heating Type in Mount Vernon
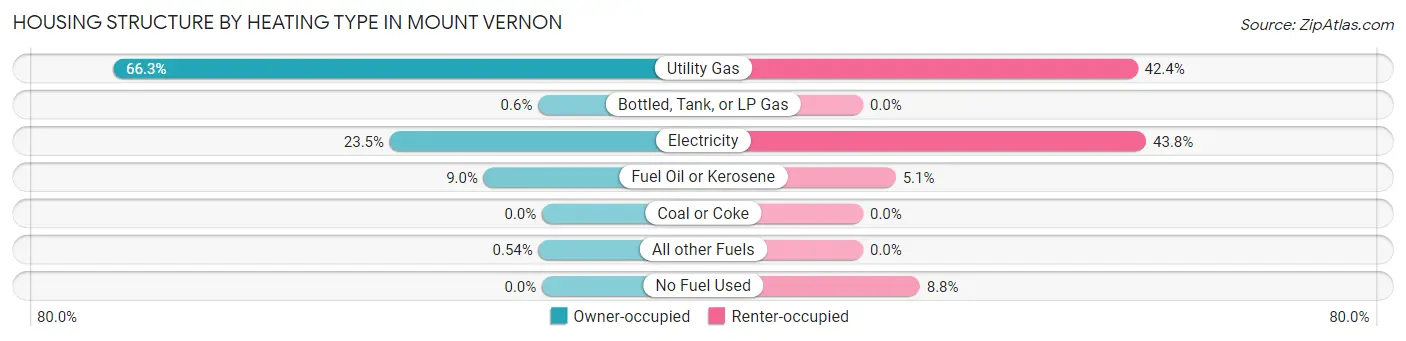
| Heating Type | Owner-occupied | Renter-occupied |
| Utility Gas | 2,452 (66.3%) | 479 (42.4%) |
| Bottled, Tank, or LP Gas | 22 (0.6%) | 0 (0.0%) |
| Electricity | 870 (23.5%) | 494 (43.8%) |
| Fuel Oil or Kerosene | 333 (9.0%) | 57 (5.1%) |
| Coal or Coke | 0 (0.0%) | 0 (0.0%) |
| All other Fuels | 20 (0.5%) | 0 (0.0%) |
| No Fuel Used | 0 (0.0%) | 99 (8.8%) |
| Total | 3,697 (100.0%) | 1,129 (100.0%) |
Household Vehicle Usage in Mount Vernon
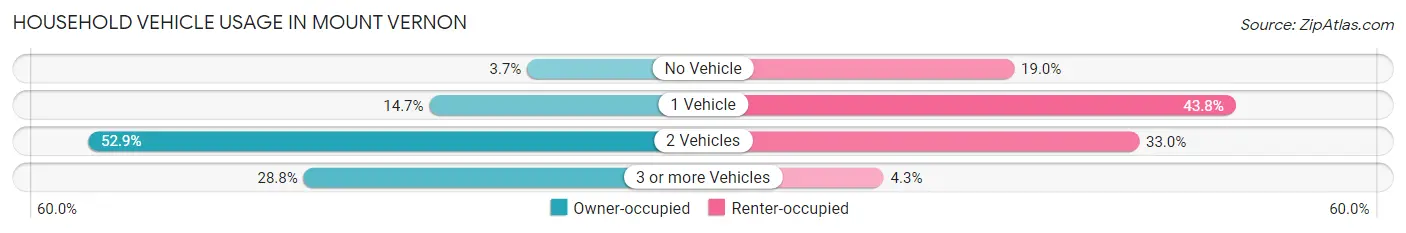
| Vehicles per Household | Owner-occupied | Renter-occupied |
| No Vehicle | 137 (3.7%) | 214 (19.0%) |
| 1 Vehicle | 542 (14.7%) | 494 (43.8%) |
| 2 Vehicles | 1,955 (52.9%) | 372 (33.0%) |
| 3 or more Vehicles | 1,063 (28.7%) | 49 (4.3%) |
| Total | 3,697 (100.0%) | 1,129 (100.0%) |
Real Estate & Mortgages in Mount Vernon
Real Estate and Mortgage Overview in Mount Vernon
| Characteristic | Without Mortgage | With Mortgage |
| Housing Units | 885 | 2,812 |
| Median Property Value | $784,100 | $708,400 |
| Median Household Income | $140,781 | $2,004 |
| Monthly Housing Costs | $1,098 | $1,940 |
| Real Estate Taxes | $8,385 | $93 |
Property Value by Mortgage Status in Mount Vernon
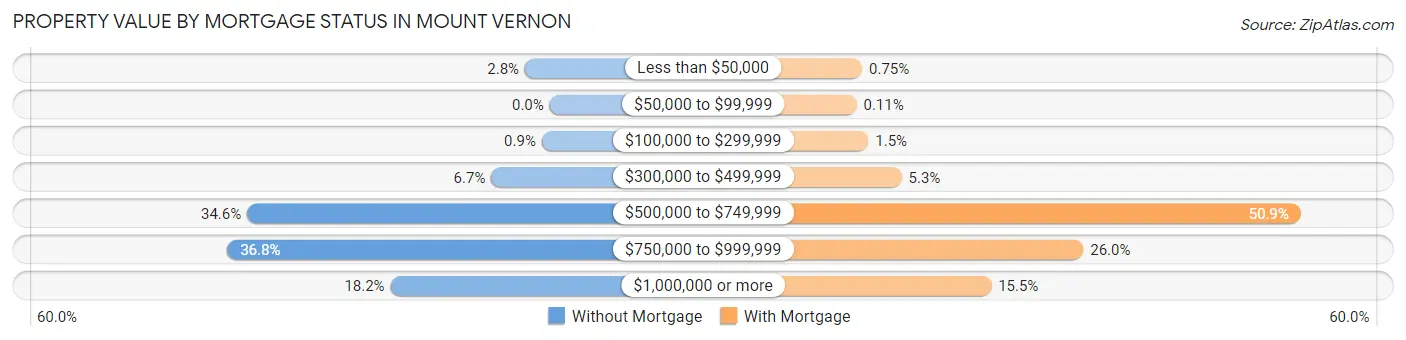
| Property Value | Without Mortgage | With Mortgage |
| Less than $50,000 | 25 (2.8%) | 21 (0.7%) |
| $50,000 to $99,999 | 0 (0.0%) | 3 (0.1%) |
| $100,000 to $299,999 | 8 (0.9%) | 41 (1.5%) |
| $300,000 to $499,999 | 59 (6.7%) | 148 (5.3%) |
| $500,000 to $749,999 | 306 (34.6%) | 1,431 (50.9%) |
| $750,000 to $999,999 | 326 (36.8%) | 732 (26.0%) |
| $1,000,000 or more | 161 (18.2%) | 436 (15.5%) |
| Total | 885 (100.0%) | 2,812 (100.0%) |
Household Income by Mortgage Status in Mount Vernon
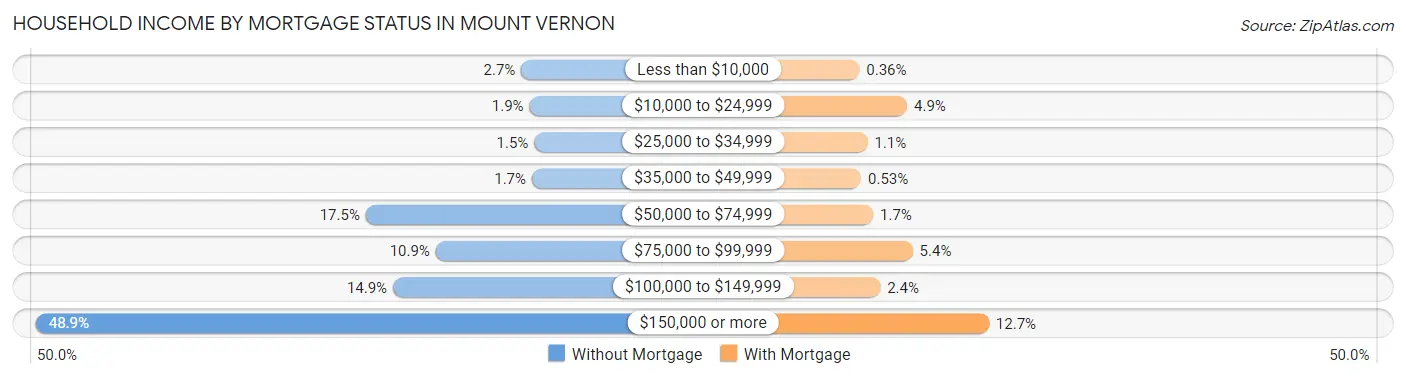
| Household Income | Without Mortgage | With Mortgage |
| Less than $10,000 | 24 (2.7%) | 10 (0.4%) |
| $10,000 to $24,999 | 17 (1.9%) | 138 (4.9%) |
| $25,000 to $34,999 | 13 (1.5%) | 32 (1.1%) |
| $35,000 to $49,999 | 15 (1.7%) | 15 (0.5%) |
| $50,000 to $74,999 | 155 (17.5%) | 47 (1.7%) |
| $75,000 to $99,999 | 96 (10.8%) | 153 (5.4%) |
| $100,000 to $149,999 | 132 (14.9%) | 66 (2.4%) |
| $150,000 or more | 433 (48.9%) | 357 (12.7%) |
| Total | 885 (100.0%) | 2,812 (100.0%) |
Property Value to Household Income Ratio in Mount Vernon
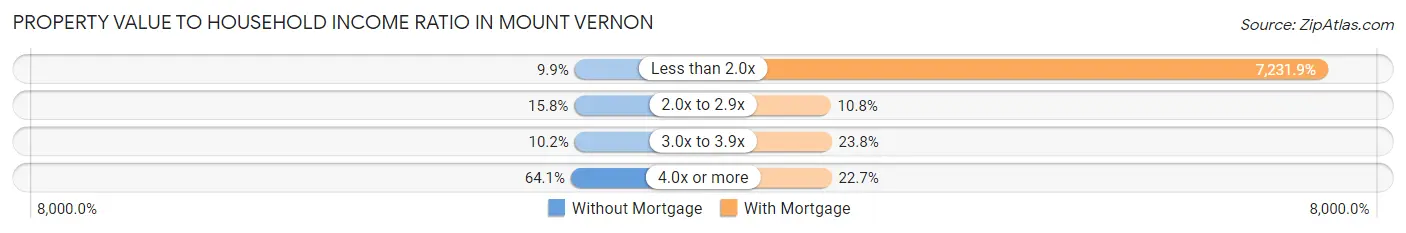
| Value-to-Income Ratio | Without Mortgage | With Mortgage |
| Less than 2.0x | 88 (9.9%) | 203,362 (7,231.9%) |
| 2.0x to 2.9x | 140 (15.8%) | 304 (10.8%) |
| 3.0x to 3.9x | 90 (10.2%) | 668 (23.8%) |
| 4.0x or more | 567 (64.1%) | 637 (22.7%) |
| Total | 885 (100.0%) | 2,812 (100.0%) |
Real Estate Taxes by Mortgage Status in Mount Vernon
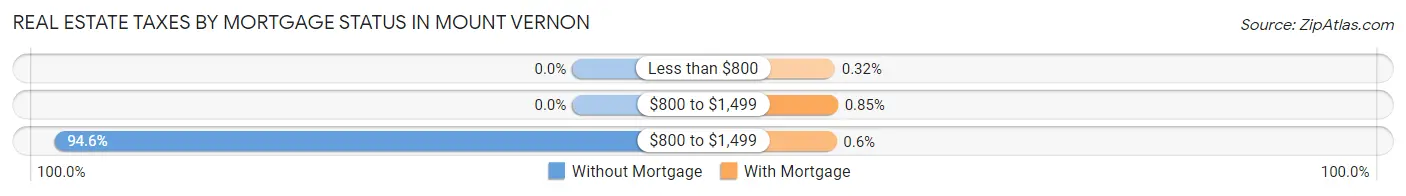
| Property Taxes | Without Mortgage | With Mortgage |
| Less than $800 | 0 (0.0%) | 9 (0.3%) |
| $800 to $1,499 | 0 (0.0%) | 24 (0.9%) |
| $800 to $1,499 | 837 (94.6%) | 17 (0.6%) |
| Total | 885 (100.0%) | 2,812 (100.0%) |
Health & Disability in Mount Vernon
Health Insurance Coverage by Age in Mount Vernon
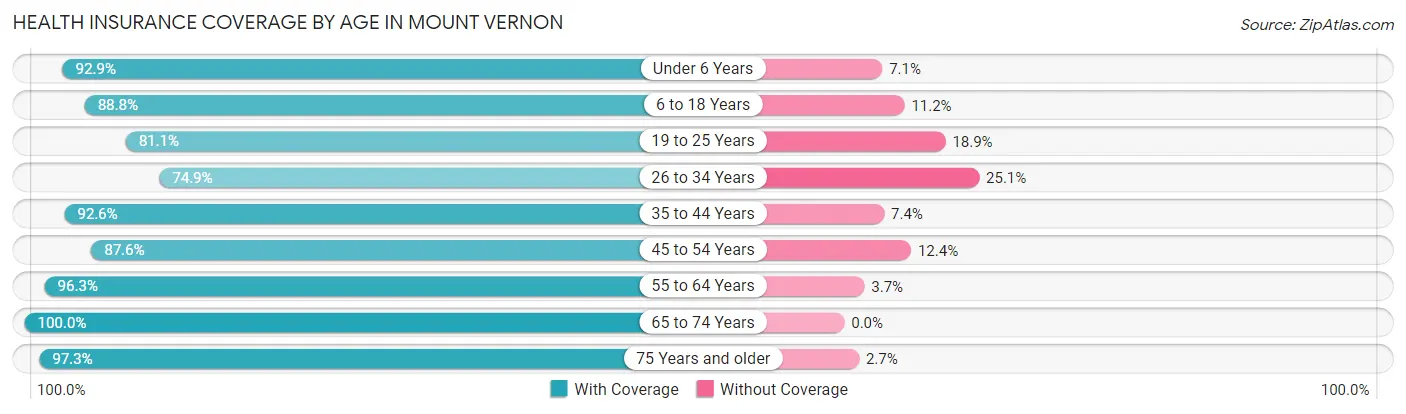
| Age Bracket | With Coverage | Without Coverage |
| Under 6 Years | 1,063 (92.9%) | 81 (7.1%) |
| 6 to 18 Years | 2,160 (88.8%) | 273 (11.2%) |
| 19 to 25 Years | 426 (81.1%) | 99 (18.9%) |
| 26 to 34 Years | 807 (74.9%) | 271 (25.1%) |
| 35 to 44 Years | 1,372 (92.6%) | 110 (7.4%) |
| 45 to 54 Years | 1,915 (87.6%) | 272 (12.4%) |
| 55 to 64 Years | 1,774 (96.3%) | 69 (3.7%) |
| 65 to 74 Years | 1,351 (100.0%) | 0 (0.0%) |
| 75 Years and older | 959 (97.3%) | 27 (2.7%) |
| Total | 11,827 (90.8%) | 1,202 (9.2%) |
Health Insurance Coverage by Citizenship Status in Mount Vernon
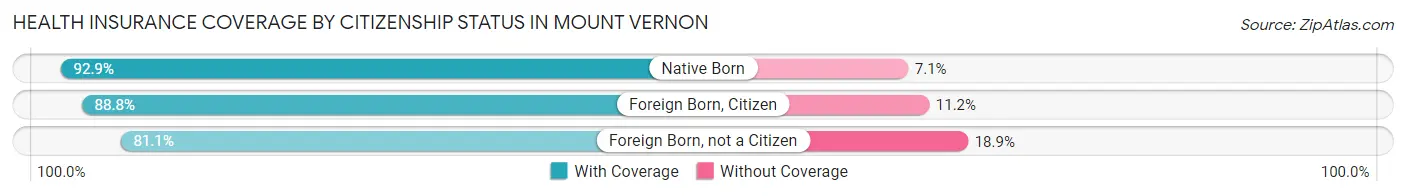
| Citizenship Status | With Coverage | Without Coverage |
| Native Born | 1,063 (92.9%) | 81 (7.1%) |
| Foreign Born, Citizen | 2,160 (88.8%) | 273 (11.2%) |
| Foreign Born, not a Citizen | 426 (81.1%) | 99 (18.9%) |
Health Insurance Coverage by Household Income in Mount Vernon
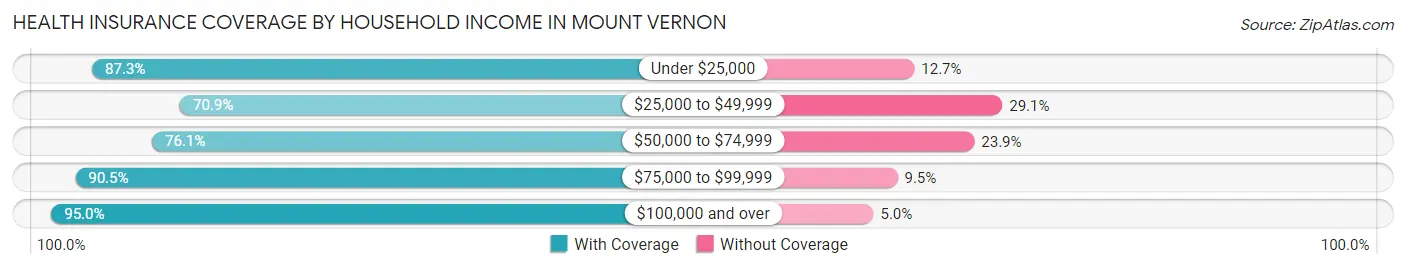
| Household Income | With Coverage | Without Coverage |
| Under $25,000 | 800 (87.3%) | 116 (12.7%) |
| $25,000 to $49,999 | 832 (70.9%) | 342 (29.1%) |
| $50,000 to $74,999 | 691 (76.1%) | 217 (23.9%) |
| $75,000 to $99,999 | 495 (90.5%) | 52 (9.5%) |
| $100,000 and over | 8,998 (95.0%) | 475 (5.0%) |
Public vs Private Health Insurance Coverage by Age in Mount Vernon
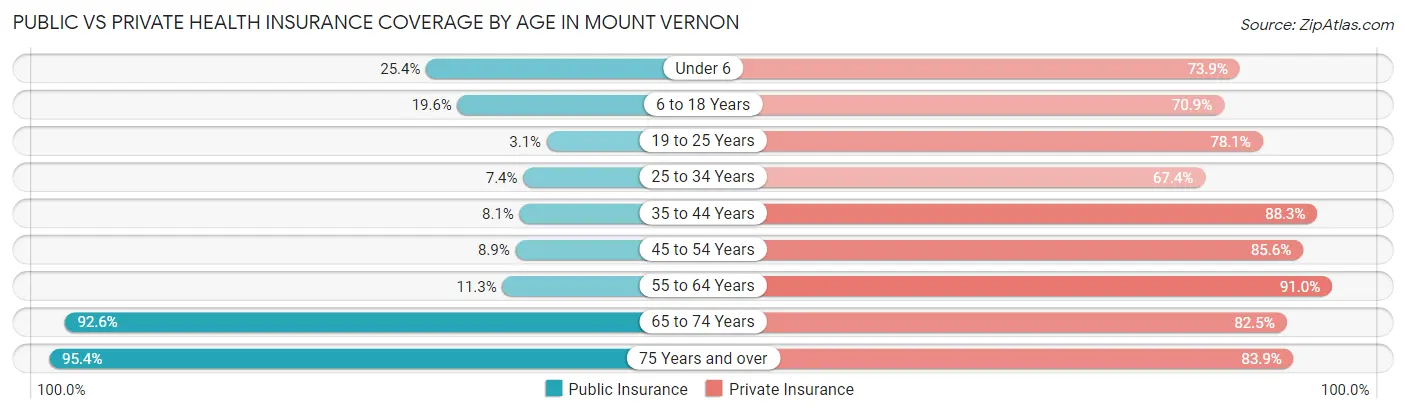
| Age Bracket | Public Insurance | Private Insurance |
| Under 6 | 291 (25.4%) | 845 (73.9%) |
| 6 to 18 Years | 477 (19.6%) | 1,726 (70.9%) |
| 19 to 25 Years | 16 (3.0%) | 410 (78.1%) |
| 25 to 34 Years | 80 (7.4%) | 727 (67.4%) |
| 35 to 44 Years | 120 (8.1%) | 1,308 (88.3%) |
| 45 to 54 Years | 194 (8.9%) | 1,872 (85.6%) |
| 55 to 64 Years | 208 (11.3%) | 1,677 (91.0%) |
| 65 to 74 Years | 1,251 (92.6%) | 1,115 (82.5%) |
| 75 Years and over | 941 (95.4%) | 827 (83.9%) |
| Total | 3,578 (27.5%) | 10,507 (80.6%) |
Disability Status by Sex by Age in Mount Vernon
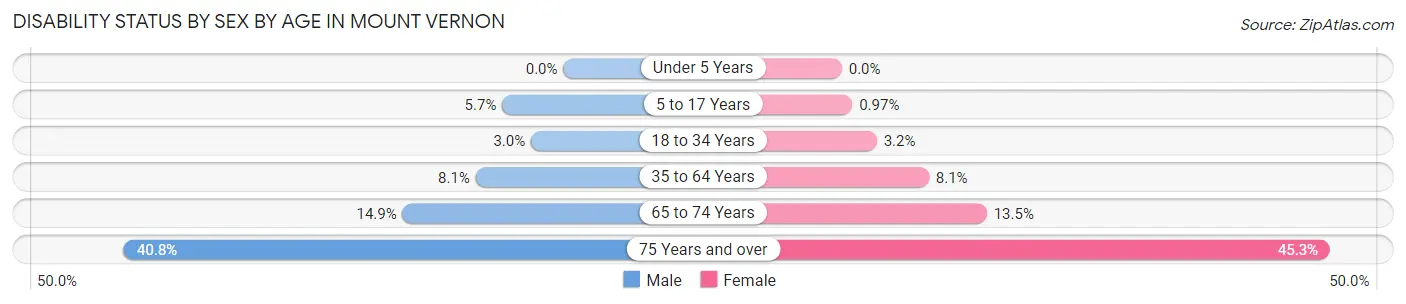
| Age Bracket | Male | Female |
| Under 5 Years | 0 (0.0%) | 0 (0.0%) |
| 5 to 17 Years | 74 (5.7%) | 10 (1.0%) |
| 18 to 34 Years | 26 (3.0%) | 31 (3.2%) |
| 35 to 64 Years | 213 (8.1%) | 234 (8.1%) |
| 65 to 74 Years | 94 (14.9%) | 97 (13.5%) |
| 75 Years and over | 168 (40.8%) | 260 (45.3%) |
Disability Class by Sex by Age in Mount Vernon
Disability Class: Hearing Difficulty
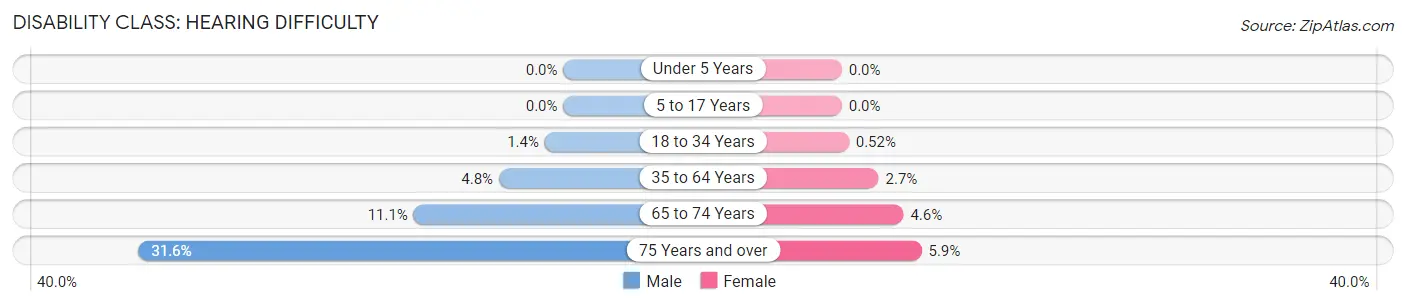
| Age Bracket | Male | Female |
| Under 5 Years | 0 (0.0%) | 0 (0.0%) |
| 5 to 17 Years | 0 (0.0%) | 0 (0.0%) |
| 18 to 34 Years | 12 (1.4%) | 5 (0.5%) |
| 35 to 64 Years | 125 (4.8%) | 79 (2.7%) |
| 65 to 74 Years | 70 (11.1%) | 33 (4.6%) |
| 75 Years and over | 130 (31.6%) | 34 (5.9%) |
Disability Class: Vision Difficulty
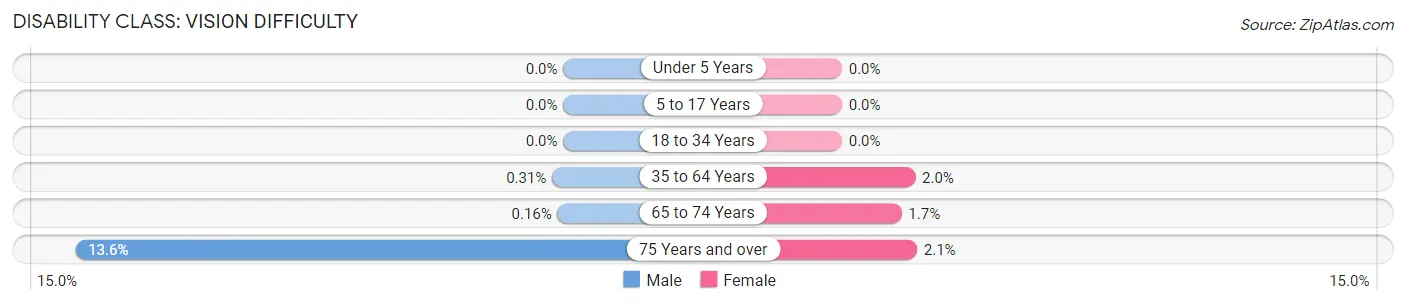
| Age Bracket | Male | Female |
| Under 5 Years | 0 (0.0%) | 0 (0.0%) |
| 5 to 17 Years | 0 (0.0%) | 0 (0.0%) |
| 18 to 34 Years | 0 (0.0%) | 0 (0.0%) |
| 35 to 64 Years | 8 (0.3%) | 59 (2.0%) |
| 65 to 74 Years | 1 (0.2%) | 12 (1.7%) |
| 75 Years and over | 56 (13.6%) | 12 (2.1%) |
Disability Class: Cognitive Difficulty
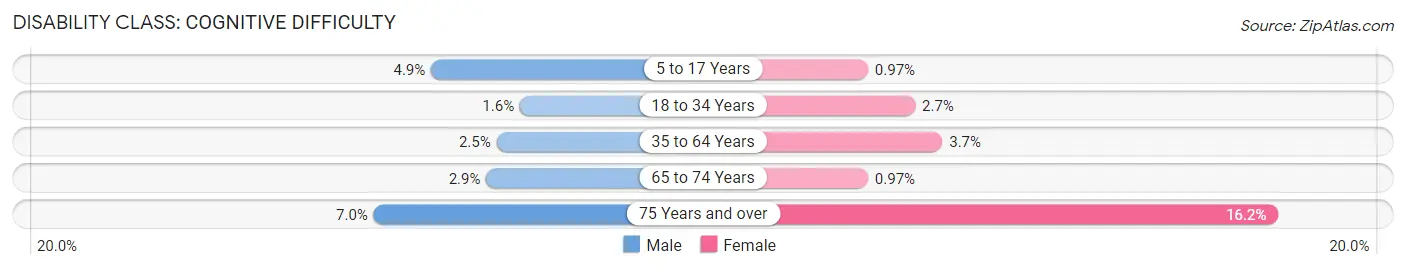
| Age Bracket | Male | Female |
| 5 to 17 Years | 64 (4.9%) | 10 (1.0%) |
| 18 to 34 Years | 14 (1.6%) | 26 (2.7%) |
| 35 to 64 Years | 65 (2.5%) | 108 (3.7%) |
| 65 to 74 Years | 18 (2.9%) | 7 (1.0%) |
| 75 Years and over | 29 (7.0%) | 93 (16.2%) |
Disability Class: Ambulatory Difficulty
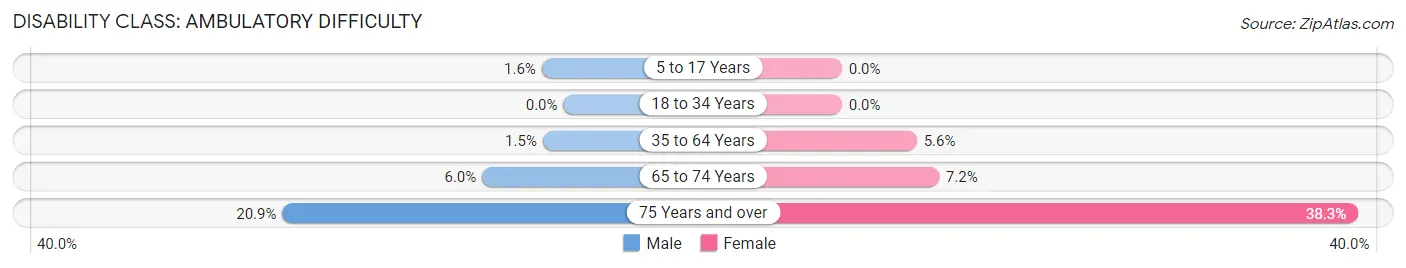
| Age Bracket | Male | Female |
| 5 to 17 Years | 21 (1.6%) | 0 (0.0%) |
| 18 to 34 Years | 0 (0.0%) | 0 (0.0%) |
| 35 to 64 Years | 40 (1.5%) | 161 (5.6%) |
| 65 to 74 Years | 38 (6.0%) | 52 (7.2%) |
| 75 Years and over | 86 (20.9%) | 220 (38.3%) |
Disability Class: Self-Care Difficulty
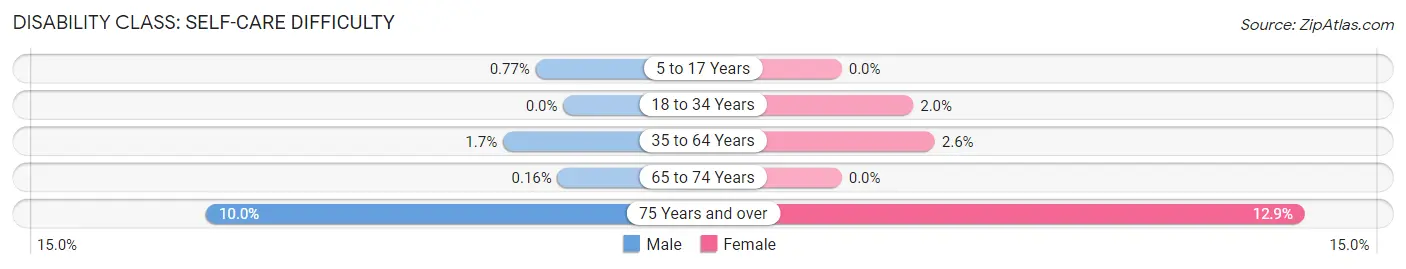
| Age Bracket | Male | Female |
| 5 to 17 Years | 10 (0.8%) | 0 (0.0%) |
| 18 to 34 Years | 0 (0.0%) | 19 (2.0%) |
| 35 to 64 Years | 44 (1.7%) | 75 (2.6%) |
| 65 to 74 Years | 1 (0.2%) | 0 (0.0%) |
| 75 Years and over | 41 (10.0%) | 74 (12.9%) |
Technology Access in Mount Vernon
Computing Device Access in Mount Vernon
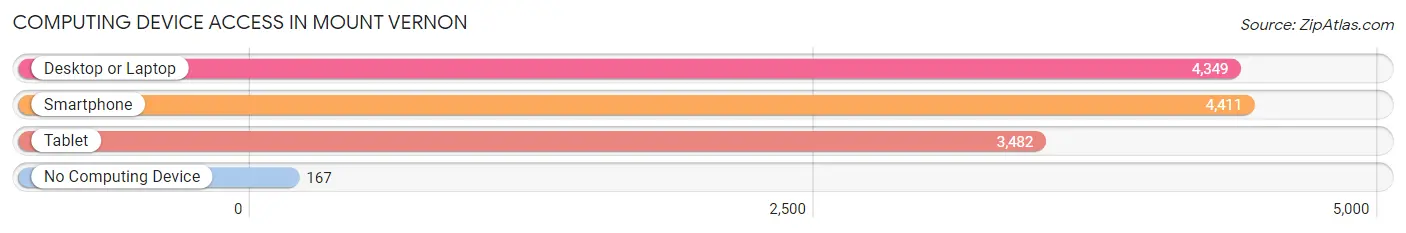
| Device Type | # Households | % Households |
| Desktop or Laptop | 4,349 | 90.1% |
| Smartphone | 4,411 | 91.4% |
| Tablet | 3,482 | 72.2% |
| No Computing Device | 167 | 3.5% |
| Total | 4,826 | 100.0% |
Internet Access in Mount Vernon
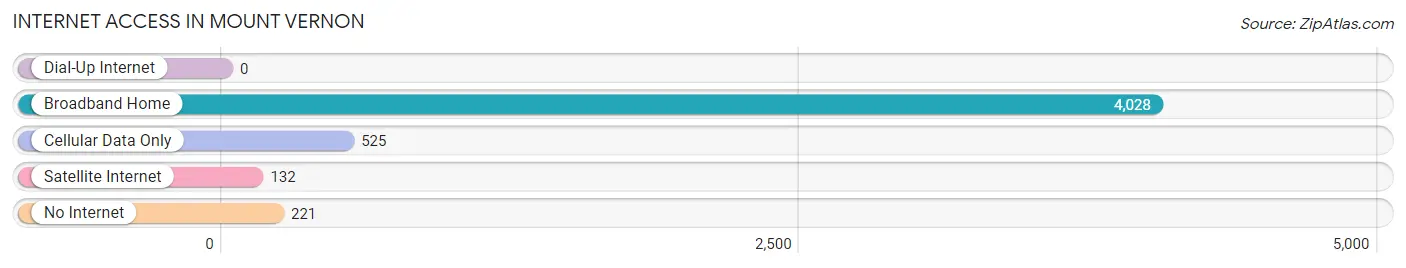
| Internet Type | # Households | % Households |
| Dial-Up Internet | 0 | 0.0% |
| Broadband Home | 4,028 | 83.5% |
| Cellular Data Only | 525 | 10.9% |
| Satellite Internet | 132 | 2.7% |
| No Internet | 221 | 4.6% |
| Total | 4,826 | 100.0% |
Mount Vernon Summary
Introduction
Mount Vernon, Virginia is a small city located in Fairfax County, Virginia, just south of Washington, D.C. It is best known as the home of George Washington, the first President of the United States. The city has a rich history, a diverse geography, a thriving economy, and a unique demographic makeup. This paper will explore each of these aspects of Mount Vernon in detail.
History
Mount Vernon was first settled in 1674 by John Washington, the great-grandfather of George Washington. The city was named after the estate of George Washington, which was named after the British admiral Edward Vernon. The city was incorporated in 1892 and has since grown to become a vibrant community.
Mount Vernon has a long and storied history. During the Revolutionary War, the city was the site of several battles, including the Battle of Mount Vernon in 1781. The city was also the site of the first presidential inauguration, when George Washington was sworn in as the first President of the United States in 1789.
The city has also been home to many notable figures throughout its history, including George Washington, Robert E. Lee, and John F. Kennedy. The city has also been the site of several important events, such as the first presidential inauguration and the signing of the Treaty of Paris in 1783.
Geography
Mount Vernon is located in Fairfax County, Virginia, just south of Washington, D.C. The city is situated on the banks of the Potomac River and is bordered by the cities of Alexandria and Arlington. The city covers an area of 8.3 square miles and has a population of 12,717 as of the 2010 census.
The city is divided into several distinct neighborhoods, including Belle Haven, Fort Hunt, and Mount Vernon Woods. The city is also home to several parks, including Huntley Meadows Park, Pohick Bay Regional Park, and the George Washington Memorial Parkway.
Economy
Mount Vernon has a thriving economy that is largely driven by the tourism industry. The city is home to several popular attractions, including George Washington's Mount Vernon Estate and Gardens, the George Washington Masonic National Memorial, and the Woodlawn Plantation. The city is also home to several corporate headquarters, including the National Rural Electric Cooperative Association and the American Red Cross.
The city also has a strong retail sector, with several shopping centers and malls located in the city. The city is also home to several restaurants, bars, and entertainment venues.
Demographics
As of the 2010 census, the population of Mount Vernon was 12,717. The city has a diverse population, with a majority of the population being white (63.3%), followed by African American (25.2%), Asian (4.7%), and Hispanic or Latino (4.3%). The median household income in the city is $90,845, and the median age is 40.
Conclusion
Mount Vernon, Virginia is a small city located in Fairfax County, Virginia, just south of Washington, D.C. It is best known as the home of George Washington, the first President of the United States. The city has a rich history, a diverse geography, a thriving economy, and a unique demographic makeup. This paper has explored each of these aspects of Mount Vernon in detail, providing an overview of the city's history, geography, economy, and demographics.
Common Questions
What is Per Capita Income in Mount Vernon?
Per Capita income in Mount Vernon is $76,057.
What is the Median Family Income in Mount Vernon?
Median Family Income in Mount Vernon is $197,500.
What is the Median Household income in Mount Vernon?
Median Household Income in Mount Vernon is $160,096.
What is Income or Wage Gap in Mount Vernon?
Income or Wage Gap in Mount Vernon is 58.3%.
Women in Mount Vernon earn 41.7 cents for every dollar earned by a man.
What is Family Income Deficit in Mount Vernon?
Family Income Deficit in Mount Vernon is $15,444.
Families that are below poverty line in Mount Vernon earn $15,444 less on average than the poverty threshold level.
What is Inequality or Gini Index in Mount Vernon?
Inequality or Gini Index in Mount Vernon is 0.47.
What is the Total Population of Mount Vernon?
Total Population of Mount Vernon is 13,299.
What is the Total Male Population of Mount Vernon?
Total Male Population of Mount Vernon is 6,355.
What is the Total Female Population of Mount Vernon?
Total Female Population of Mount Vernon is 6,944.
What is the Ratio of Males per 100 Females in Mount Vernon?
There are 91.52 Males per 100 Females in Mount Vernon.
What is the Ratio of Females per 100 Males in Mount Vernon?
There are 109.27 Females per 100 Males in Mount Vernon.
What is the Median Population Age in Mount Vernon?
Median Population Age in Mount Vernon is 43.4 Years.
What is the Average Family Size in Mount Vernon
Average Family Size in Mount Vernon is 3.2 People.
What is the Average Household Size in Mount Vernon
Average Household Size in Mount Vernon is 2.8 People.
How Large is the Labor Force in Mount Vernon?
There are 7,126 People in the Labor Forcein in Mount Vernon.
What is the Percentage of People in the Labor Force in Mount Vernon?
69.4% of People are in the Labor Force in Mount Vernon.
What is the Unemployment Rate in Mount Vernon?
Unemployment Rate in Mount Vernon is 3.3%.