Massanetta Springs, VA Map & Demographics
Massanetta Springs Map
Massanetta Springs Overview
$57,084
PER CAPITA INCOME
$113,514
AVG FAMILY INCOME
$99,740
AVG HOUSEHOLD INCOME
45.0%
WAGE / INCOME GAP [ % ]
55.0¢/ $1
WAGE / INCOME GAP [ $ ]
0.43
INEQUALITY / GINI INDEX
6,254
TOTAL POPULATION
2,875
MALE POPULATION
3,379
FEMALE POPULATION
85.08
MALES / 100 FEMALES
117.53
FEMALES / 100 MALES
47.1
MEDIAN AGE
3.0
AVG FAMILY SIZE
2.4
AVG HOUSEHOLD SIZE
3,191
LABOR FORCE [ PEOPLE ]
62.8%
PERCENT IN LABOR FORCE
3.4%
UNEMPLOYMENT RATE
Income in Massanetta Springs
Income Overview in Massanetta Springs
Per Capita Income in Massanetta Springs is $57,084, while median incomes of families and households are $113,514 and $99,740 respectively.
| Characteristic | Number | Measure |
| Per Capita Income | 6,254 | $57,084 |
| Median Family Income | 1,678 | $113,514 |
| Mean Family Income | 1,678 | $131,139 |
| Median Household Income | 2,595 | $99,740 |
| Mean Household Income | 2,595 | $135,962 |
| Income Deficit | 1,678 | $0 |
| Wage / Income Gap (%) | 6,254 | 45.02% |
| Wage / Income Gap ($) | 6,254 | 54.98¢ per $1 |
| Gini / Inequality Index | 6,254 | 0.43 |
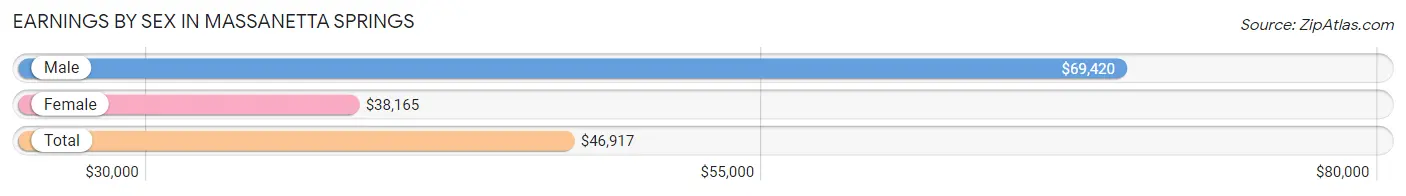
Earnings by Sex in Massanetta Springs
Average Earnings in Massanetta Springs are $46,917, $69,420 for men and $38,165 for women, a difference of 45.0%.
| Sex | Number | Average Earnings |
| Male | 1,606 (49.7%) | $69,420 |
| Female | 1,628 (50.3%) | $38,165 |
| Total | 3,234 (100.0%) | $46,917 |
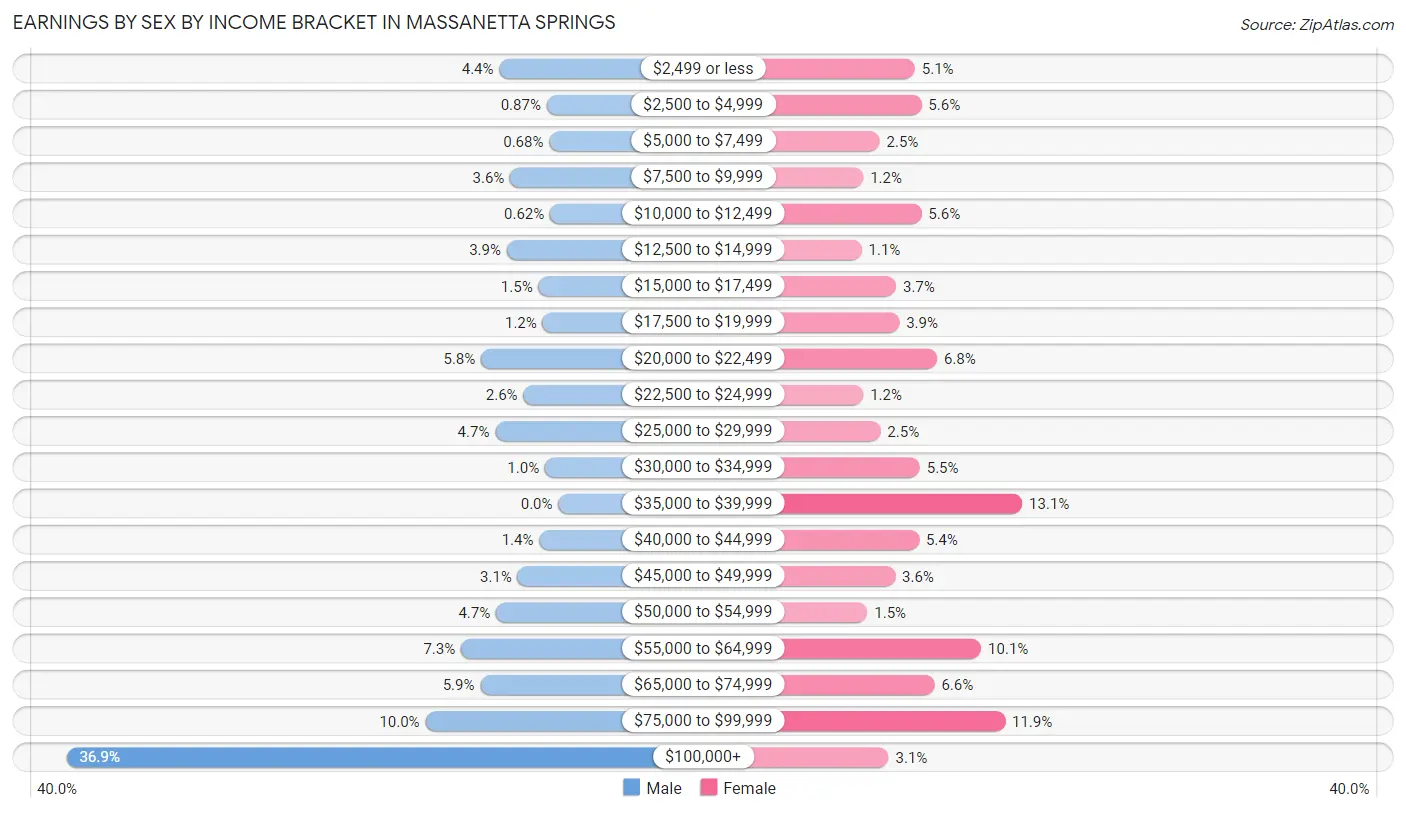
Earnings by Sex by Income Bracket in Massanetta Springs
The most common earnings brackets in Massanetta Springs are $100,000+ for men (592 | 36.9%) and $35,000 to $39,999 for women (214 | 13.1%).
| Income | Male | Female |
| $2,499 or less | 71 (4.4%) | 83 (5.1%) |
| $2,500 to $4,999 | 14 (0.9%) | 91 (5.6%) |
| $5,000 to $7,499 | 11 (0.7%) | 40 (2.5%) |
| $7,500 to $9,999 | 58 (3.6%) | 20 (1.2%) |
| $10,000 to $12,499 | 10 (0.6%) | 91 (5.6%) |
| $12,500 to $14,999 | 62 (3.9%) | 18 (1.1%) |
| $15,000 to $17,499 | 24 (1.5%) | 60 (3.7%) |
| $17,500 to $19,999 | 19 (1.2%) | 64 (3.9%) |
| $20,000 to $22,499 | 93 (5.8%) | 110 (6.8%) |
| $22,500 to $24,999 | 42 (2.6%) | 20 (1.2%) |
| $25,000 to $29,999 | 76 (4.7%) | 41 (2.5%) |
| $30,000 to $34,999 | 16 (1.0%) | 89 (5.5%) |
| $35,000 to $39,999 | 0 (0.0%) | 214 (13.1%) |
| $40,000 to $44,999 | 23 (1.4%) | 88 (5.4%) |
| $45,000 to $49,999 | 49 (3.0%) | 59 (3.6%) |
| $50,000 to $54,999 | 75 (4.7%) | 25 (1.5%) |
| $55,000 to $64,999 | 117 (7.3%) | 164 (10.1%) |
| $65,000 to $74,999 | 94 (5.9%) | 107 (6.6%) |
| $75,000 to $99,999 | 160 (10.0%) | 193 (11.9%) |
| $100,000+ | 592 (36.9%) | 51 (3.1%) |
| Total | 1,606 (100.0%) | 1,628 (100.0%) |
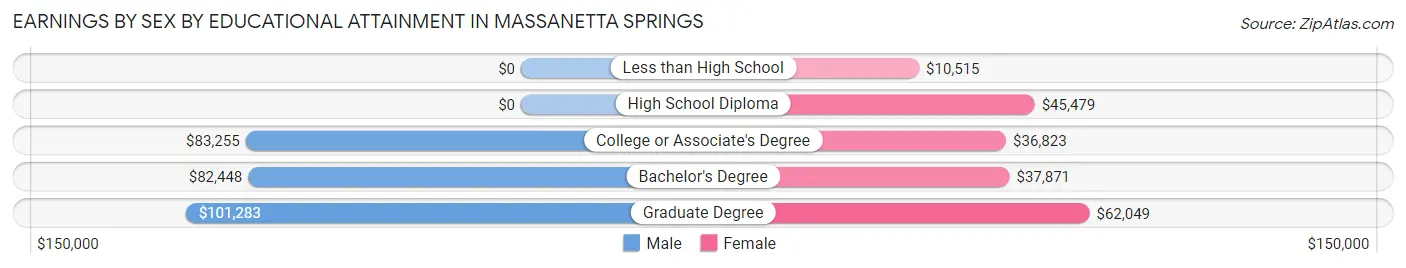
Earnings by Sex by Educational Attainment in Massanetta Springs
Average earnings in Massanetta Springs are $80,651 for men and $38,931 for women, a difference of 51.7%. Men with an educational attainment of graduate degree enjoy the highest average annual earnings of $101,283, while those with bachelor's degree education earn the least with $82,448. Women with an educational attainment of graduate degree earn the most with the average annual earnings of $62,049, while those with less than high school education have the smallest earnings of $10,515.
| Educational Attainment | Male Income | Female Income |
| Less than High School | - | - |
| High School Diploma | - | - |
| College or Associate's Degree | $83,255 | $36,823 |
| Bachelor's Degree | $82,448 | $37,871 |
| Graduate Degree | $101,283 | $62,049 |
| Total | $80,651 | $38,931 |
Family Income in Massanetta Springs
Family Income Brackets in Massanetta Springs
According to the Massanetta Springs family income data, there are 497 families falling into the $100,000 to $149,999 income range, which is the most common income bracket and makes up 29.6% of all families.
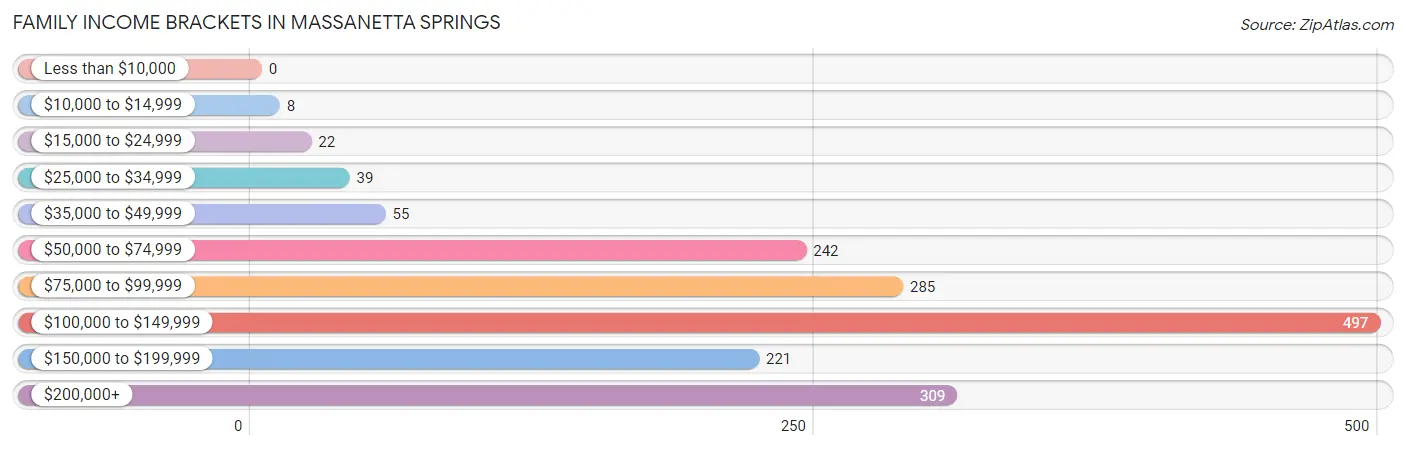
| Income Bracket | # Families | % Families |
| Less than $10,000 | 0 | 0.0% |
| $10,000 to $14,999 | 8 | 0.5% |
| $15,000 to $24,999 | 22 | 1.3% |
| $25,000 to $34,999 | 39 | 2.3% |
| $35,000 to $49,999 | 55 | 3.3% |
| $50,000 to $74,999 | 242 | 14.4% |
| $75,000 to $99,999 | 285 | 17.0% |
| $100,000 to $149,999 | 497 | 29.6% |
| $150,000 to $199,999 | 221 | 13.2% |
| $200,000+ | 309 | 18.4% |
Family Income by Famaliy Size in Massanetta Springs
5-person families (88 | 5.2%) account for the highest median family income in Massanetta Springs with $141,375 per family, while 2-person families (891 | 53.1%) have the highest median income of $56,406 per family member.
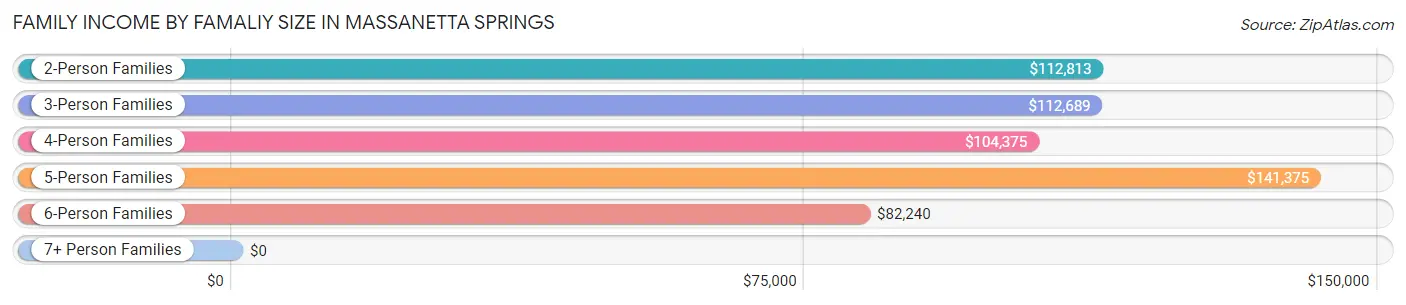
| Income Bracket | # Families | Median Income |
| 2-Person Families | 891 (53.1%) | $112,813 |
| 3-Person Families | 357 (21.3%) | $112,689 |
| 4-Person Families | 240 (14.3%) | $104,375 |
| 5-Person Families | 88 (5.2%) | $141,375 |
| 6-Person Families | 86 (5.1%) | $82,240 |
| 7+ Person Families | 16 (0.9%) | $0 |
| Total | 1,678 (100.0%) | $113,514 |
Family Income by Number of Earners in Massanetta Springs
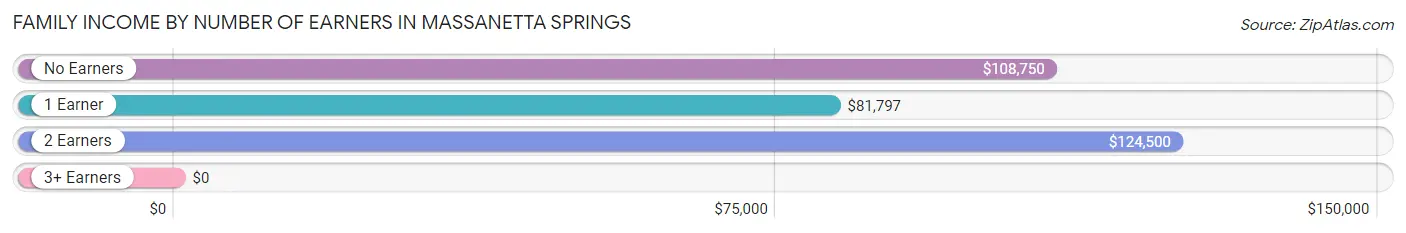
| Number of Earners | # Families | Median Income |
| No Earners | 374 (22.3%) | $108,750 |
| 1 Earner | 411 (24.5%) | $81,797 |
| 2 Earners | 744 (44.3%) | $124,500 |
| 3+ Earners | 149 (8.9%) | $0 |
| Total | 1,678 (100.0%) | $113,514 |
Household Income in Massanetta Springs
Household Income Brackets in Massanetta Springs
With 571 households falling in the category, the $100,000 to $149,999 income range is the most frequent in Massanetta Springs, accounting for 22.0% of all households.
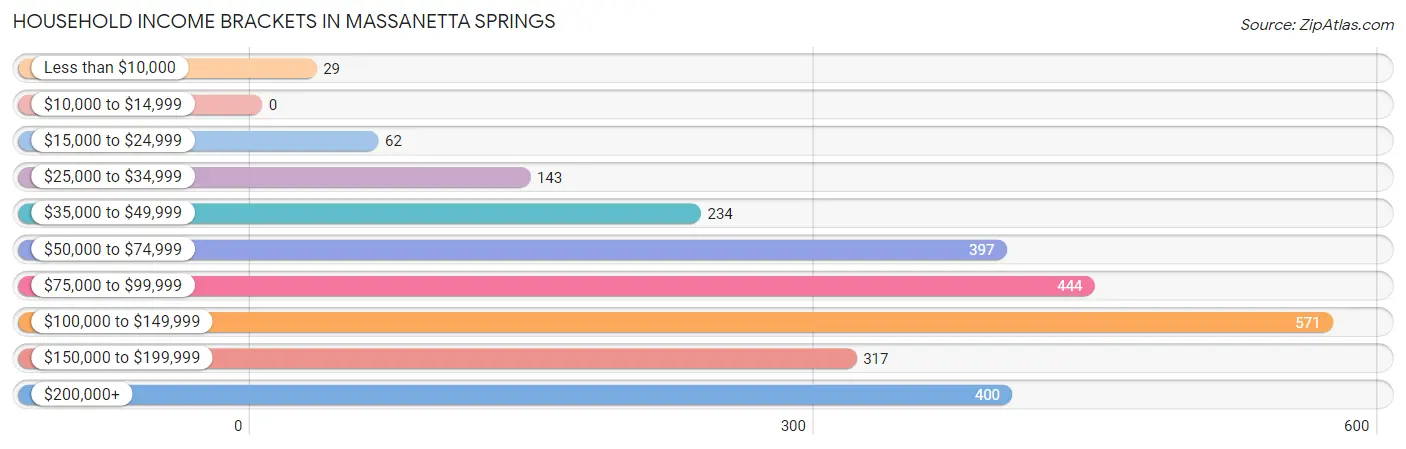
| Income Bracket | # Households | % Households |
| Less than $10,000 | 29 | 1.1% |
| $10,000 to $14,999 | 0 | 0.0% |
| $15,000 to $24,999 | 62 | 2.4% |
| $25,000 to $34,999 | 143 | 5.5% |
| $35,000 to $49,999 | 234 | 9.0% |
| $50,000 to $74,999 | 397 | 15.3% |
| $75,000 to $99,999 | 444 | 17.1% |
| $100,000 to $149,999 | 571 | 22.0% |
| $150,000 to $199,999 | 317 | 12.2% |
| $200,000+ | 400 | 15.4% |
Household Income by Householder Age in Massanetta Springs
The median household income in Massanetta Springs is $99,740, with the highest median household income of $124,618 found in the 45 to 64 years age bracket for the primary householder. A total of 843 households (32.5%) fall into this category. Meanwhile, the 15 to 24 years age bracket for the primary householder has the lowest median household income of $0, with 27 households (1.0%) in this group.
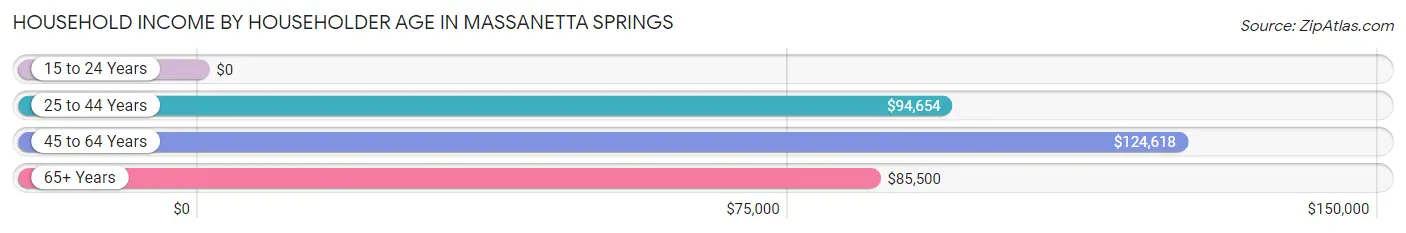
| Income Bracket | # Households | Median Income |
| 15 to 24 Years | 27 (1.0%) | $0 |
| 25 to 44 Years | 659 (25.4%) | $94,654 |
| 45 to 64 Years | 843 (32.5%) | $124,618 |
| 65+ Years | 1,066 (41.1%) | $85,500 |
| Total | 2,595 (100.0%) | $99,740 |
Poverty in Massanetta Springs
Income Below Poverty by Sex and Age in Massanetta Springs
With 2.4% poverty level for males and 3.3% for females among the residents of Massanetta Springs, 18 to 24 year old males and 18 to 24 year old females are the most vulnerable to poverty, with 35 males (19.3%) and 18 females (14.6%) in their respective age groups living below the poverty level.
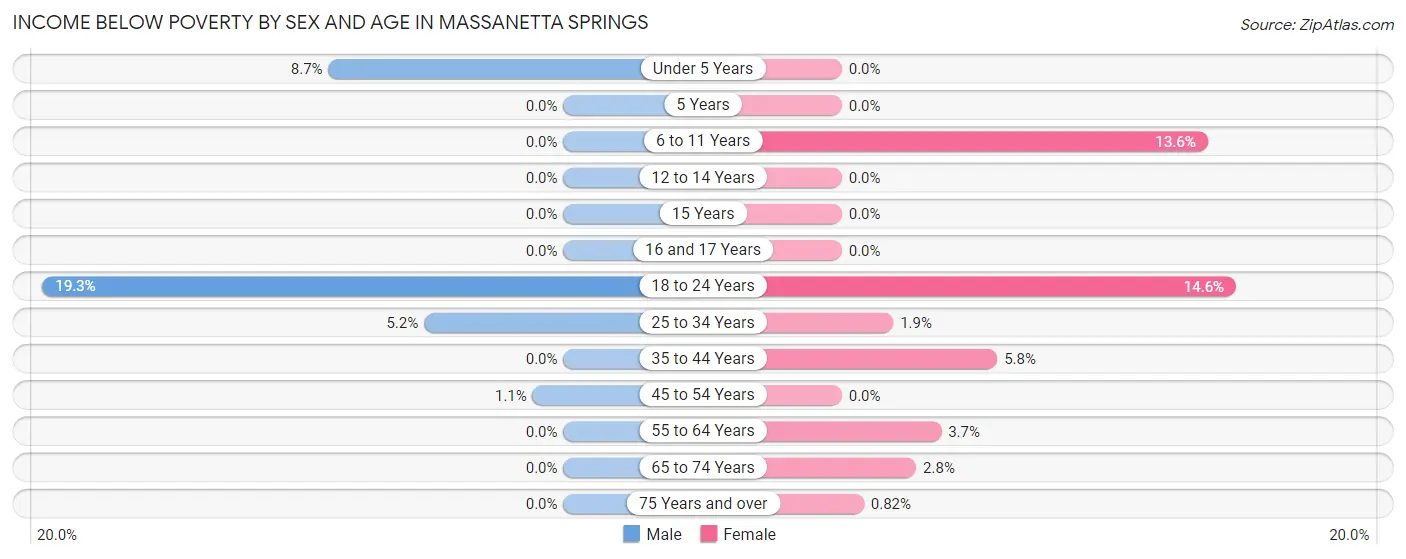
| Age Bracket | Male | Female |
| Under 5 Years | 13 (8.7%) | 0 (0.0%) |
| 5 Years | 0 (0.0%) | 0 (0.0%) |
| 6 to 11 Years | 0 (0.0%) | 22 (13.6%) |
| 12 to 14 Years | 0 (0.0%) | 0 (0.0%) |
| 15 Years | 0 (0.0%) | 0 (0.0%) |
| 16 and 17 Years | 0 (0.0%) | 0 (0.0%) |
| 18 to 24 Years | 35 (19.3%) | 18 (14.6%) |
| 25 to 34 Years | 17 (5.2%) | 8 (1.9%) |
| 35 to 44 Years | 0 (0.0%) | 28 (5.8%) |
| 45 to 54 Years | 4 (1.1%) | 0 (0.0%) |
| 55 to 64 Years | 0 (0.0%) | 16 (3.7%) |
| 65 to 74 Years | 0 (0.0%) | 12 (2.8%) |
| 75 Years and over | 0 (0.0%) | 4 (0.8%) |
| Total | 69 (2.4%) | 108 (3.3%) |
Income Above Poverty by Sex and Age in Massanetta Springs
According to the poverty statistics in Massanetta Springs, males aged 6 to 11 years and females aged under 5 years are the age groups that are most secure financially, with 100.0% of males and 100.0% of females in these age groups living above the poverty line.
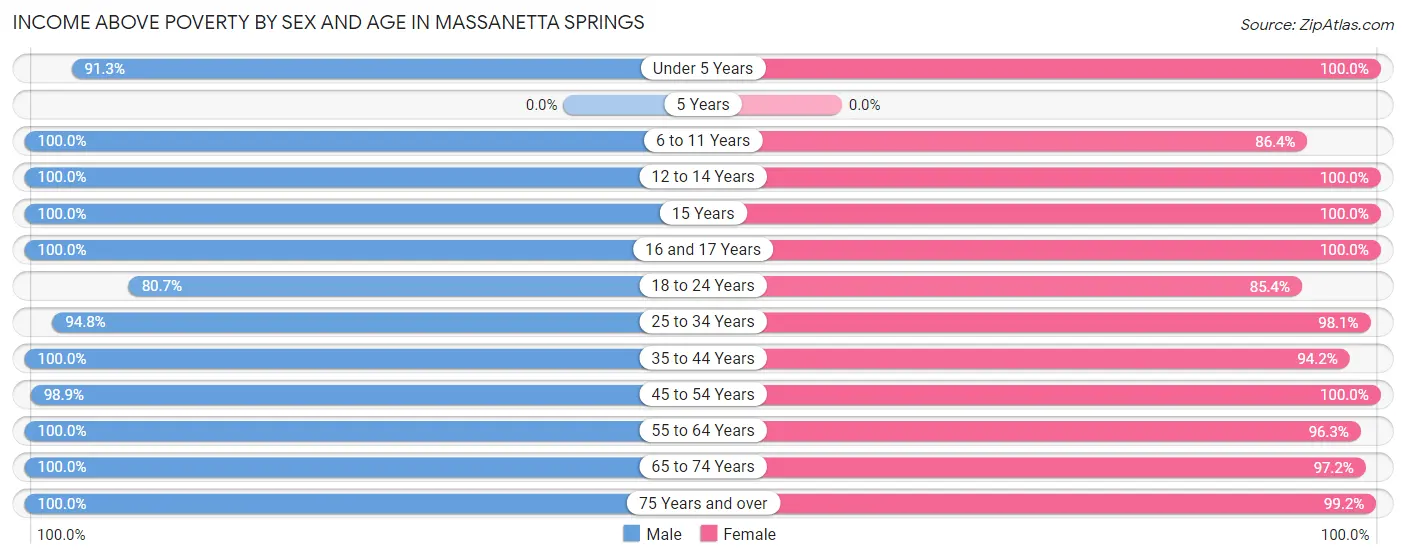
| Age Bracket | Male | Female |
| Under 5 Years | 136 (91.3%) | 128 (100.0%) |
| 5 Years | 0 (0.0%) | 0 (0.0%) |
| 6 to 11 Years | 231 (100.0%) | 140 (86.4%) |
| 12 to 14 Years | 176 (100.0%) | 236 (100.0%) |
| 15 Years | 63 (100.0%) | 17 (100.0%) |
| 16 and 17 Years | 45 (100.0%) | 11 (100.0%) |
| 18 to 24 Years | 146 (80.7%) | 105 (85.4%) |
| 25 to 34 Years | 312 (94.8%) | 410 (98.1%) |
| 35 to 44 Years | 226 (100.0%) | 457 (94.2%) |
| 45 to 54 Years | 346 (98.9%) | 348 (100.0%) |
| 55 to 64 Years | 401 (100.0%) | 418 (96.3%) |
| 65 to 74 Years | 313 (100.0%) | 423 (97.2%) |
| 75 Years and over | 392 (100.0%) | 483 (99.2%) |
| Total | 2,787 (97.6%) | 3,176 (96.7%) |
Income Below Poverty Among Married-Couple Families in Massanetta Springs
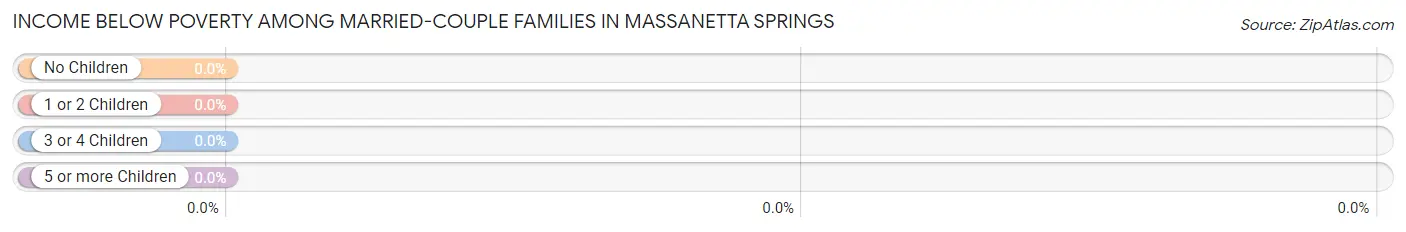
| Children | Above Poverty | Below Poverty |
| No Children | 984 (100.0%) | 0 (0.0%) |
| 1 or 2 Children | 281 (100.0%) | 0 (0.0%) |
| 3 or 4 Children | 170 (100.0%) | 0 (0.0%) |
| 5 or more Children | 0 (0.0%) | 0 (0.0%) |
| Total | 1,435 (100.0%) | 0 (0.0%) |
Income Below Poverty Among Single-Parent Households in Massanetta Springs
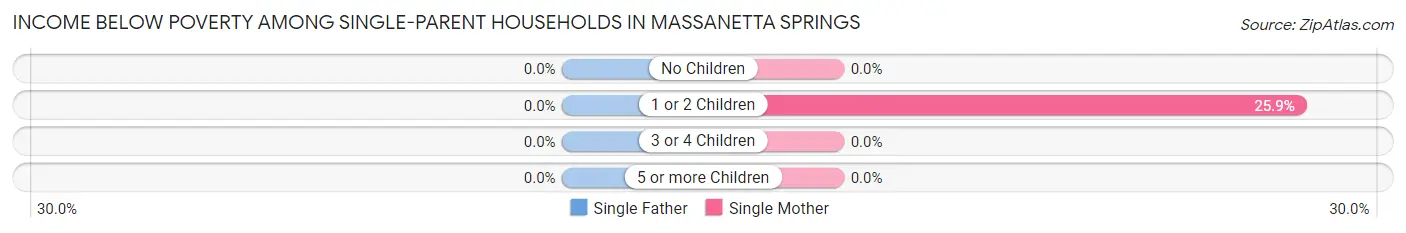
| Children | Single Father | Single Mother |
| No Children | 0 (0.0%) | 0 (0.0%) |
| 1 or 2 Children | 0 (0.0%) | 30 (25.9%) |
| 3 or 4 Children | 0 (0.0%) | 0 (0.0%) |
| 5 or more Children | 0 (0.0%) | 0 (0.0%) |
| Total | 0 (0.0%) | 30 (18.8%) |
Income Below Poverty Among Married-Couple vs Single-Parent Households in Massanetta Springs
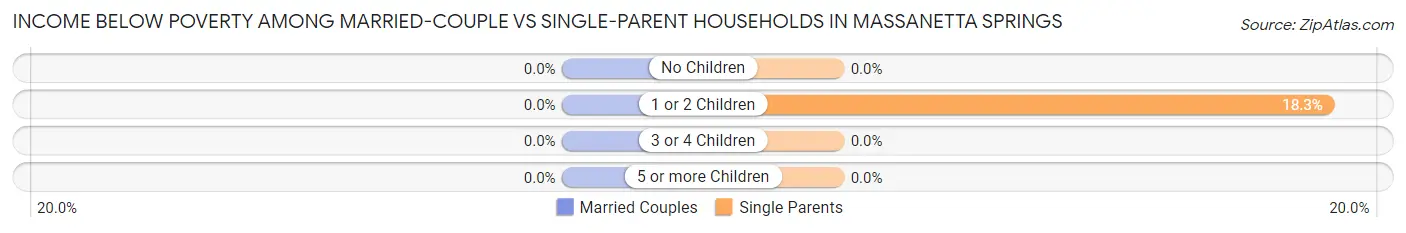
| Children | Married-Couple Families | Single-Parent Households |
| No Children | 0 (0.0%) | 0 (0.0%) |
| 1 or 2 Children | 0 (0.0%) | 30 (18.3%) |
| 3 or 4 Children | 0 (0.0%) | 0 (0.0%) |
| 5 or more Children | 0 (0.0%) | 0 (0.0%) |
| Total | 0 (0.0%) | 30 (12.3%) |
Race in Massanetta Springs
The most populous races in Massanetta Springs are White / Caucasian (5,550 | 88.7%), Hispanic or Latino (342 | 5.5%), and Two or more Races (266 | 4.3%).
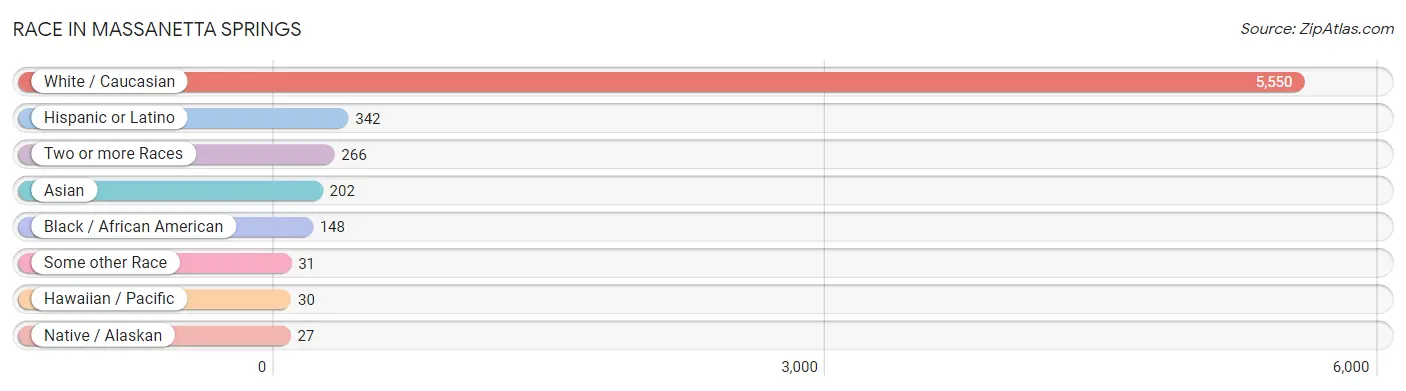
| Race | # Population | % Population |
| Asian | 202 | 3.2% |
| Black / African American | 148 | 2.4% |
| Hawaiian / Pacific | 30 | 0.5% |
| Hispanic or Latino | 342 | 5.5% |
| Native / Alaskan | 27 | 0.4% |
| White / Caucasian | 5,550 | 88.7% |
| Two or more Races | 266 | 4.3% |
| Some other Race | 31 | 0.5% |
| Total | 6,254 | 100.0% |
Ancestry in Massanetta Springs
The most populous ancestries reported in Massanetta Springs are German (1,165 | 18.6%), English (795 | 12.7%), Irish (558 | 8.9%), American (485 | 7.8%), and Swiss (297 | 4.8%), together accounting for 52.8% of all Massanetta Springs residents.
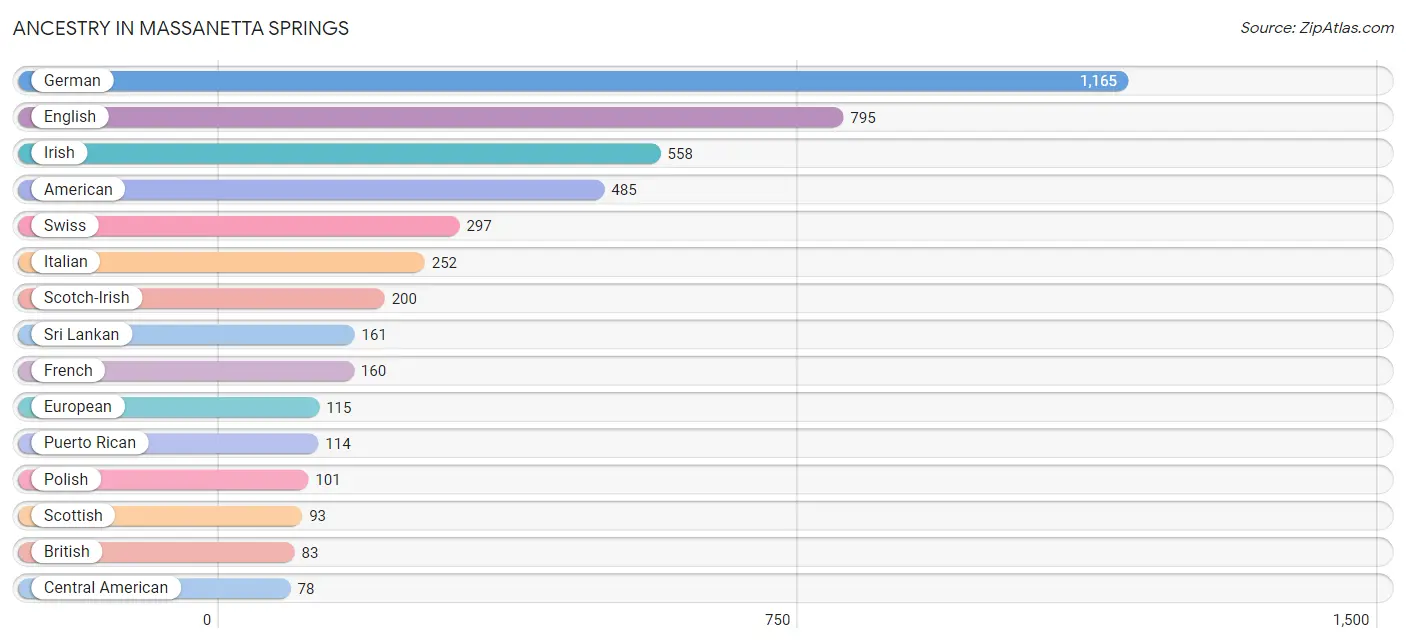
| Ancestry | # Population | % Population |
| American | 485 | 7.8% |
| Arab | 65 | 1.0% |
| Austrian | 33 | 0.5% |
| Bolivian | 17 | 0.3% |
| British | 83 | 1.3% |
| Burmese | 51 | 0.8% |
| Canadian | 16 | 0.3% |
| Central American | 78 | 1.3% |
| Central American Indian | 27 | 0.4% |
| Czechoslovakian | 12 | 0.2% |
| Danish | 30 | 0.5% |
| Dutch | 70 | 1.1% |
| Ecuadorian | 18 | 0.3% |
| English | 795 | 12.7% |
| European | 115 | 1.8% |
| French | 160 | 2.6% |
| French Canadian | 47 | 0.7% |
| German | 1,165 | 18.6% |
| Greek | 20 | 0.3% |
| Guatemalan | 78 | 1.3% |
| Hungarian | 6 | 0.1% |
| Irish | 558 | 8.9% |
| Italian | 252 | 4.0% |
| Jordanian | 65 | 1.0% |
| Korean | 54 | 0.9% |
| Malaysian | 12 | 0.2% |
| Mexican | 27 | 0.4% |
| Norwegian | 27 | 0.4% |
| Pakistani | 26 | 0.4% |
| Polish | 101 | 1.6% |
| Puerto Rican | 114 | 1.8% |
| Russian | 54 | 0.9% |
| Scandinavian | 24 | 0.4% |
| Scotch-Irish | 200 | 3.2% |
| Scottish | 93 | 1.5% |
| Serbian | 22 | 0.4% |
| Slovak | 19 | 0.3% |
| South American | 35 | 0.6% |
| Spaniard | 66 | 1.1% |
| Spanish American | 10 | 0.2% |
| Sri Lankan | 161 | 2.6% |
| Swiss | 297 | 4.8% |
| Tongan | 30 | 0.5% |
| Ukrainian | 68 | 1.1% |
| Welsh | 14 | 0.2% | View All 45 Rows |
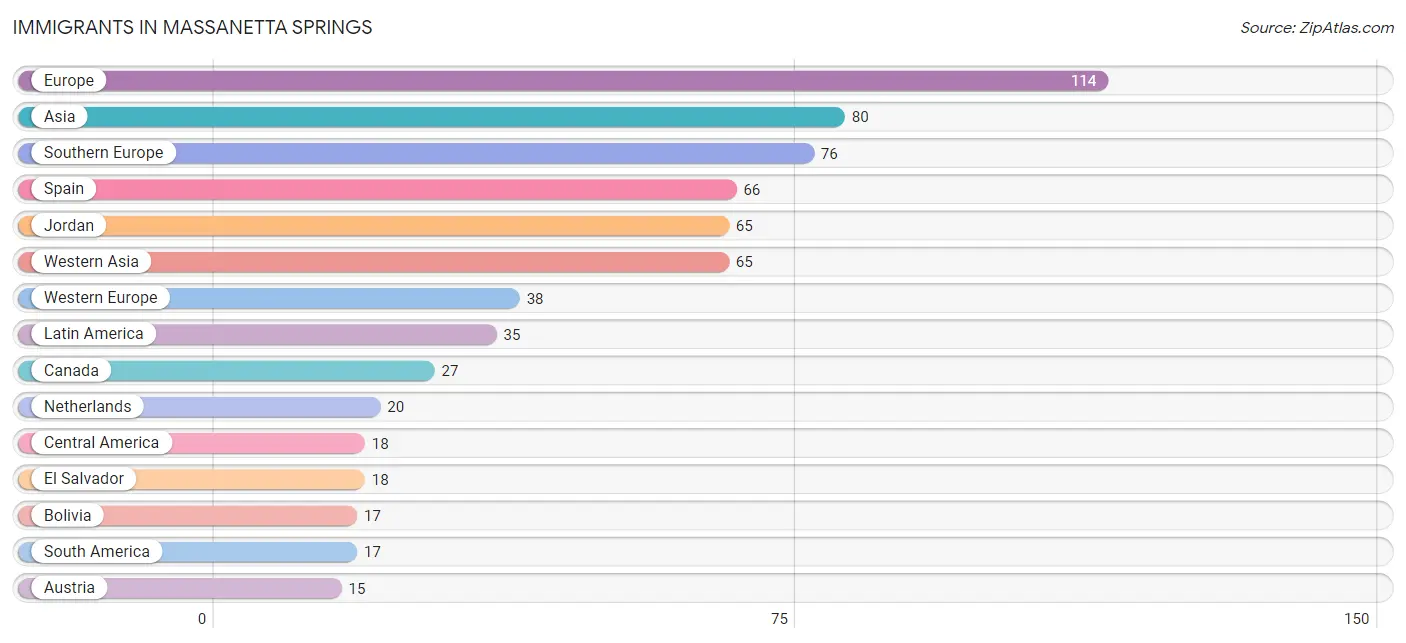
Immigrants in Massanetta Springs
The most numerous immigrant groups reported in Massanetta Springs came from Europe (114 | 1.8%), Asia (80 | 1.3%), Southern Europe (76 | 1.2%), Spain (66 | 1.1%), and Jordan (65 | 1.0%), together accounting for 6.4% of all Massanetta Springs residents.
| Immigration Origin | # Population | % Population |
| Asia | 80 | 1.3% |
| Austria | 15 | 0.2% |
| Bolivia | 17 | 0.3% |
| Canada | 27 | 0.4% |
| Central America | 18 | 0.3% |
| Eastern Asia | 15 | 0.2% |
| El Salvador | 18 | 0.3% |
| Europe | 114 | 1.8% |
| Germany | 3 | 0.1% |
| Italy | 10 | 0.2% |
| Jordan | 65 | 1.0% |
| Korea | 15 | 0.2% |
| Latin America | 35 | 0.6% |
| Netherlands | 20 | 0.3% |
| South America | 17 | 0.3% |
| Southern Europe | 76 | 1.2% |
| Spain | 66 | 1.1% |
| Western Asia | 65 | 1.0% |
| Western Europe | 38 | 0.6% | View All 19 Rows |
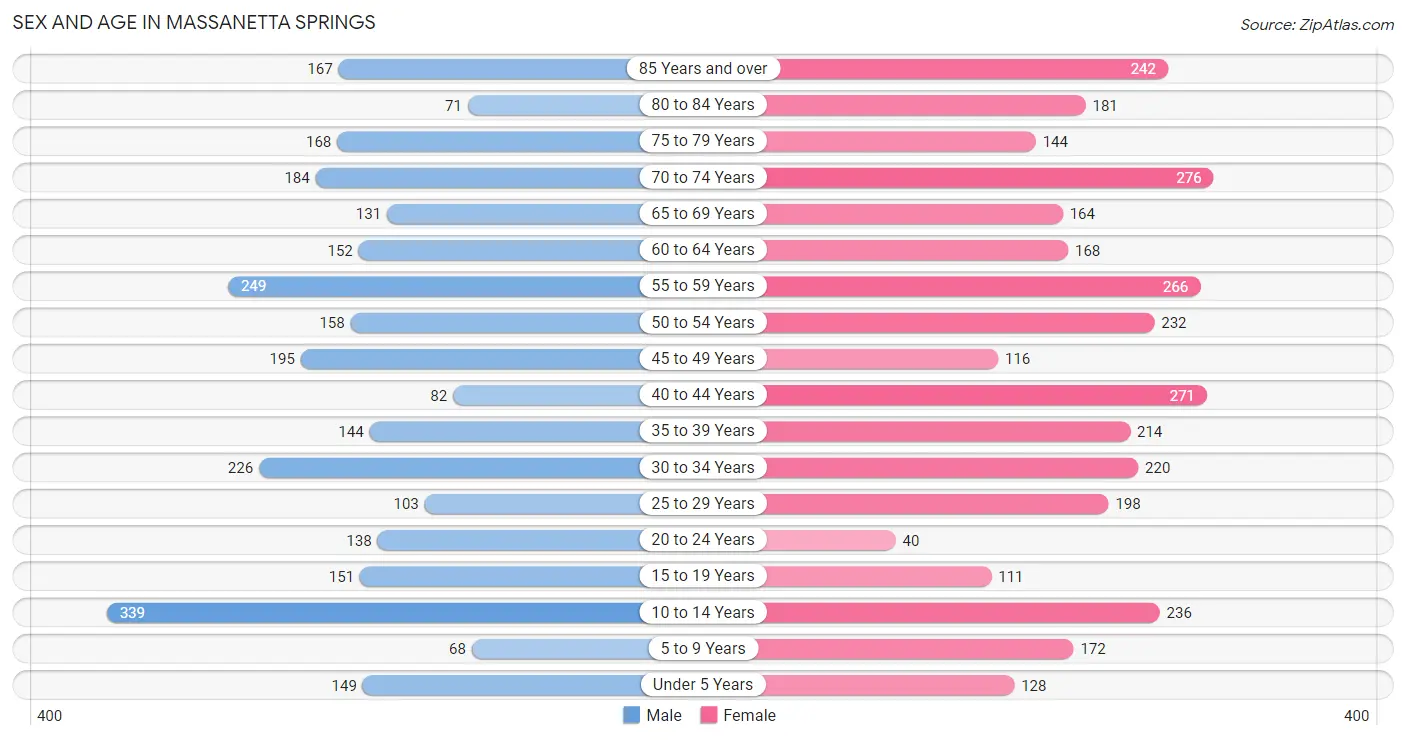
Sex and Age in Massanetta Springs
Sex and Age in Massanetta Springs
The most populous age groups in Massanetta Springs are 10 to 14 Years (339 | 11.8%) for men and 70 to 74 Years (276 | 8.2%) for women.
| Age Bracket | Male | Female |
| Under 5 Years | 149 (5.2%) | 128 (3.8%) |
| 5 to 9 Years | 68 (2.4%) | 172 (5.1%) |
| 10 to 14 Years | 339 (11.8%) | 236 (7.0%) |
| 15 to 19 Years | 151 (5.2%) | 111 (3.3%) |
| 20 to 24 Years | 138 (4.8%) | 40 (1.2%) |
| 25 to 29 Years | 103 (3.6%) | 198 (5.9%) |
| 30 to 34 Years | 226 (7.9%) | 220 (6.5%) |
| 35 to 39 Years | 144 (5.0%) | 214 (6.3%) |
| 40 to 44 Years | 82 (2.9%) | 271 (8.0%) |
| 45 to 49 Years | 195 (6.8%) | 116 (3.4%) |
| 50 to 54 Years | 158 (5.5%) | 232 (6.9%) |
| 55 to 59 Years | 249 (8.7%) | 266 (7.9%) |
| 60 to 64 Years | 152 (5.3%) | 168 (5.0%) |
| 65 to 69 Years | 131 (4.6%) | 164 (4.9%) |
| 70 to 74 Years | 184 (6.4%) | 276 (8.2%) |
| 75 to 79 Years | 168 (5.8%) | 144 (4.3%) |
| 80 to 84 Years | 71 (2.5%) | 181 (5.4%) |
| 85 Years and over | 167 (5.8%) | 242 (7.2%) |
| Total | 2,875 (100.0%) | 3,379 (100.0%) |
Families and Households in Massanetta Springs
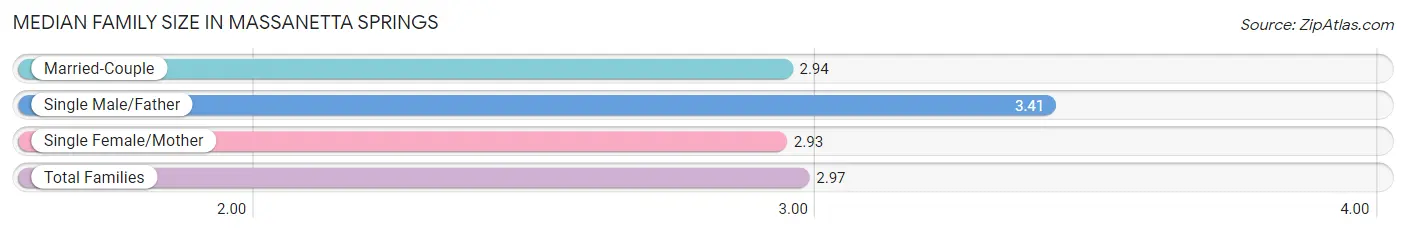
Median Family Size in Massanetta Springs
The median family size in Massanetta Springs is 2.97 persons per family, with single male/father families (83 | 5.0%) accounting for the largest median family size of 3.41 persons per family. On the other hand, single female/mother families (160 | 9.5%) represent the smallest median family size with 2.93 persons per family.
| Family Type | # Families | Family Size |
| Married-Couple | 1,435 (85.5%) | 2.94 |
| Single Male/Father | 83 (5.0%) | 3.41 |
| Single Female/Mother | 160 (9.5%) | 2.93 |
| Total Families | 1,678 (100.0%) | 2.97 |
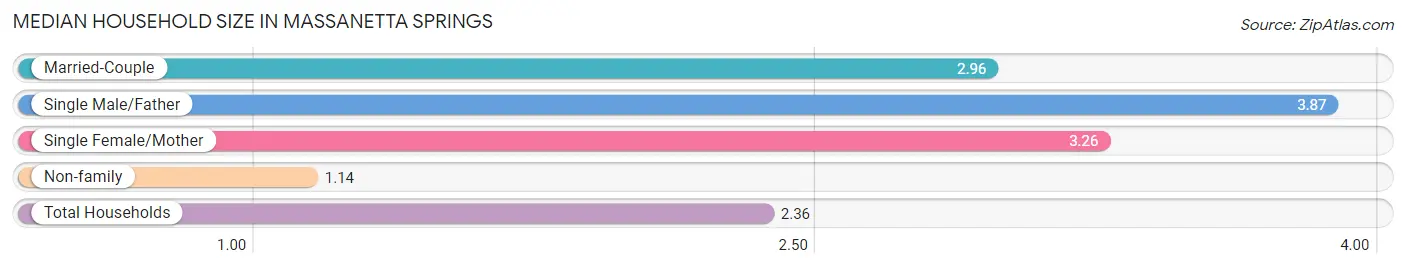
Median Household Size in Massanetta Springs
The median household size in Massanetta Springs is 2.36 persons per household, with single male/father households (83 | 3.2%) accounting for the largest median household size of 3.87 persons per household. non-family households (917 | 35.3%) represent the smallest median household size with 1.14 persons per household.
| Household Type | # Households | Household Size |
| Married-Couple | 1,435 (55.3%) | 2.96 |
| Single Male/Father | 83 (3.2%) | 3.87 |
| Single Female/Mother | 160 (6.2%) | 3.26 |
| Non-family | 917 (35.3%) | 1.14 |
| Total Households | 2,595 (100.0%) | 2.36 |
Household Size by Marriage Status in Massanetta Springs
Out of a total of 2,595 households in Massanetta Springs, 1,678 (64.7%) are family households, while 917 (35.3%) are nonfamily households. The most numerous type of family households are 2-person households, comprising 883, and the most common type of nonfamily households are 1-person households, comprising 772.
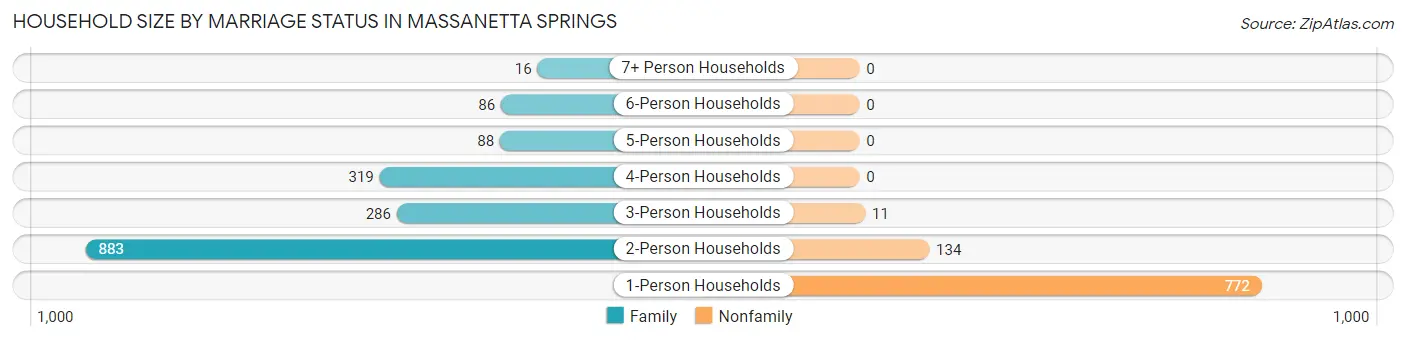
| Household Size | Family Households | Nonfamily Households |
| 1-Person Households | - | 772 (29.7%) |
| 2-Person Households | 883 (34.0%) | 134 (5.2%) |
| 3-Person Households | 286 (11.0%) | 11 (0.4%) |
| 4-Person Households | 319 (12.3%) | 0 (0.0%) |
| 5-Person Households | 88 (3.4%) | 0 (0.0%) |
| 6-Person Households | 86 (3.3%) | 0 (0.0%) |
| 7+ Person Households | 16 (0.6%) | 0 (0.0%) |
| Total | 1,678 (64.7%) | 917 (35.3%) |
Female Fertility in Massanetta Springs
Fertility by Age in Massanetta Springs
Average fertility rate in Massanetta Springs is 38.0 births per 1,000 women. Women in the age bracket of 20 to 34 years have the highest fertility rate with 100.0 births per 1,000 women. Women in the age bracket of 20 to 34 years acount for 100.0% of all women with births.
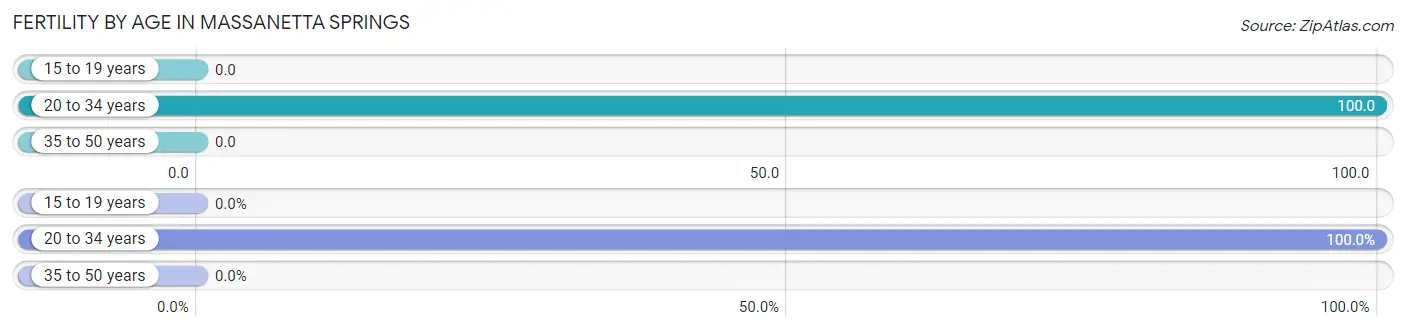
| Age Bracket | Women with Births | Births / 1,000 Women |
| 15 to 19 years | 0 (0.0%) | 0.0 |
| 20 to 34 years | 46 (100.0%) | 100.0 |
| 35 to 50 years | 0 (0.0%) | 0.0 |
| Total | 46 (100.0%) | 38.0 |
Fertility by Age by Marriage Status in Massanetta Springs
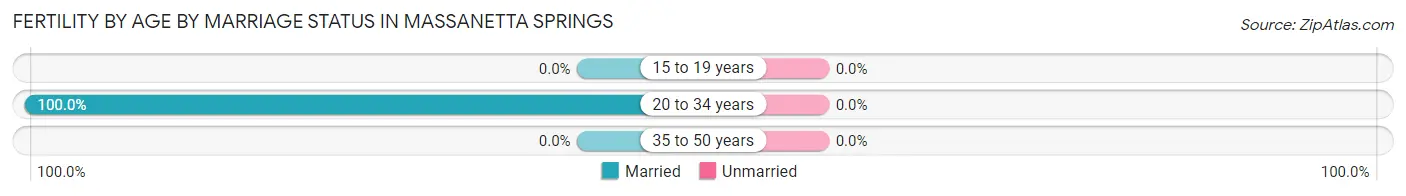
| Age Bracket | Married | Unmarried |
| 15 to 19 years | 0 (0.0%) | 0 (0.0%) |
| 20 to 34 years | 46 (100.0%) | 0 (0.0%) |
| 35 to 50 years | 0 (0.0%) | 0 (0.0%) |
| Total | 46 (100.0%) | 0 (0.0%) |
Fertility by Education in Massanetta Springs
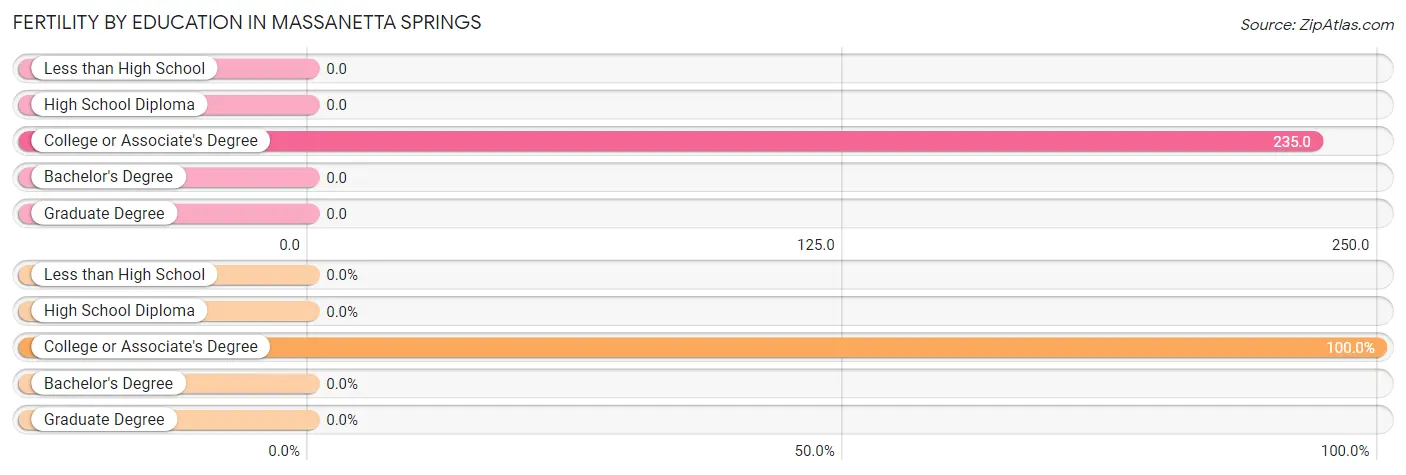
| Educational Attainment | Women with Births | Births / 1,000 Women |
| Less than High School | 0 (0.0%) | 0.0 |
| High School Diploma | 0 (0.0%) | 0.0 |
| College or Associate's Degree | 46 (100.0%) | 235.0 |
| Bachelor's Degree | 0 (0.0%) | 0.0 |
| Graduate Degree | 0 (0.0%) | 0.0 |
| Total | 46 (100.0%) | 38.0 |
Fertility by Education by Marriage Status in Massanetta Springs
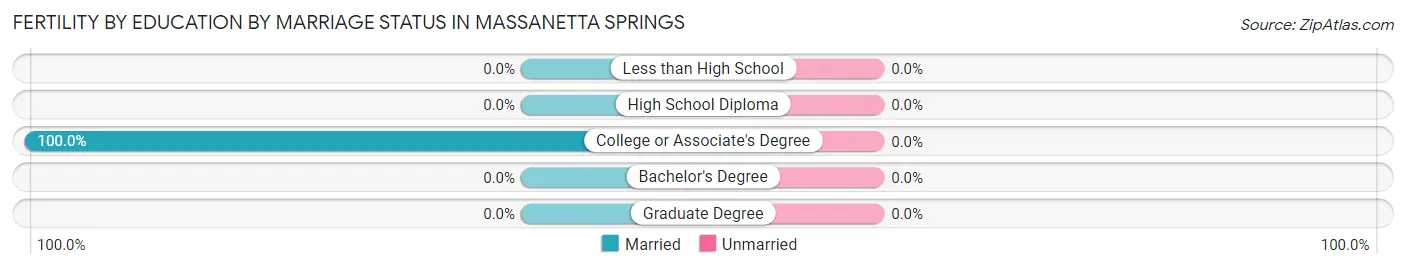
| Educational Attainment | Married | Unmarried |
| Less than High School | 0 (0.0%) | 0 (0.0%) |
| High School Diploma | 0 (0.0%) | 0 (0.0%) |
| College or Associate's Degree | 46 (100.0%) | 0 (0.0%) |
| Bachelor's Degree | 0 (0.0%) | 0 (0.0%) |
| Graduate Degree | 0 (0.0%) | 0 (0.0%) |
| Total | 46 (100.0%) | 0 (0.0%) |
Employment Characteristics in Massanetta Springs
Employment by Class of Employer in Massanetta Springs
Among the 3,053 employed individuals in Massanetta Springs, private company employees (1,378 | 45.1%), state government employees (435 | 14.2%), and local government employees (372 | 12.2%) make up the most common classes of employment.
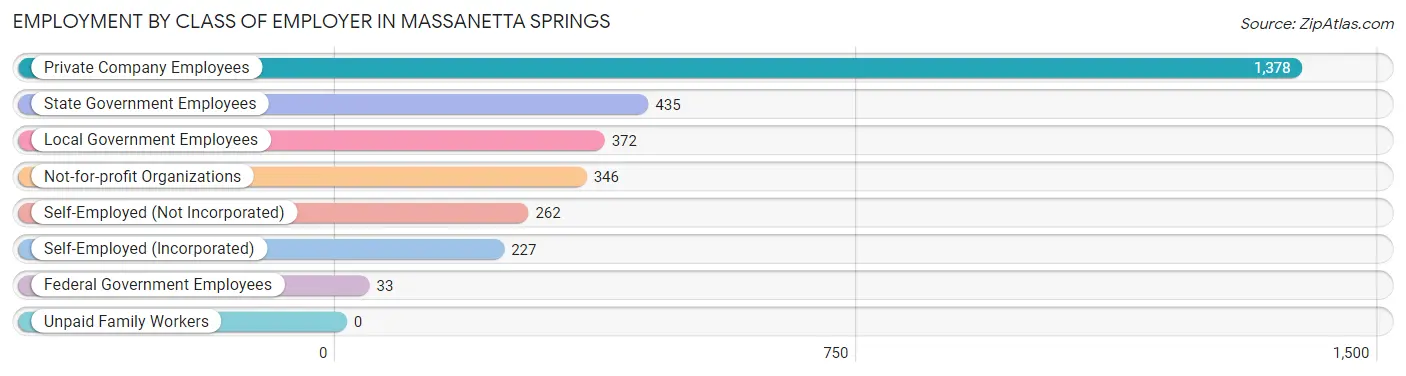
| Employer Class | # Employees | % Employees |
| Private Company Employees | 1,378 | 45.1% |
| Self-Employed (Incorporated) | 227 | 7.4% |
| Self-Employed (Not Incorporated) | 262 | 8.6% |
| Not-for-profit Organizations | 346 | 11.3% |
| Local Government Employees | 372 | 12.2% |
| State Government Employees | 435 | 14.2% |
| Federal Government Employees | 33 | 1.1% |
| Unpaid Family Workers | 0 | 0.0% |
| Total | 3,053 | 100.0% |
Employment Status by Age in Massanetta Springs
According to the labor force statistics for Massanetta Springs, out of the total population over 16 years of age (5,082), 62.8% or 3,191 individuals are in the labor force, with 3.4% or 108 of them unemployed. The age group with the highest labor force participation rate is 20 to 24 years, with 100.0% or 178 individuals in the labor force. Within the labor force, the 16 to 19 years age range has the highest percentage of unemployed individuals, with 34.7% or 43 of them being unemployed.
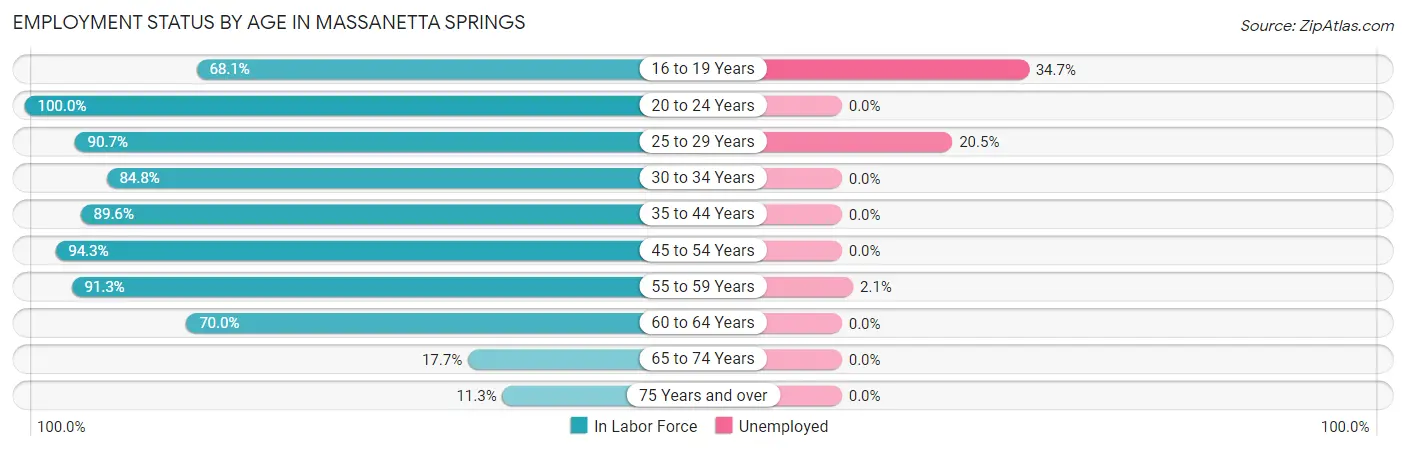
| Age Bracket | In Labor Force | Unemployed |
| 16 to 19 Years | 124 (68.1%) | 43 (34.7%) |
| 20 to 24 Years | 178 (100.0%) | 0 (0.0%) |
| 25 to 29 Years | 273 (90.7%) | 56 (20.5%) |
| 30 to 34 Years | 378 (84.8%) | 0 (0.0%) |
| 35 to 44 Years | 637 (89.6%) | 0 (0.0%) |
| 45 to 54 Years | 661 (94.3%) | 0 (0.0%) |
| 55 to 59 Years | 470 (91.3%) | 10 (2.1%) |
| 60 to 64 Years | 224 (70.0%) | 0 (0.0%) |
| 65 to 74 Years | 134 (17.7%) | 0 (0.0%) |
| 75 Years and over | 110 (11.3%) | 0 (0.0%) |
| Total | 3,191 (62.8%) | 108 (3.4%) |
Employment Status by Educational Attainment in Massanetta Springs
According to labor force statistics for Massanetta Springs, 88.3% of individuals (2,644) out of the total population between 25 and 64 years of age (2,994) are in the labor force, with 2.5% or 66 of them being unemployed. The group with the highest labor force participation rate are those with the educational attainment of bachelor's degree or higher, with 92.0% or 1,721 individuals in the labor force. Within the labor force, individuals with bachelor's degree or higher education have the highest percentage of unemployment, with 3.3% or 57 of them being unemployed.
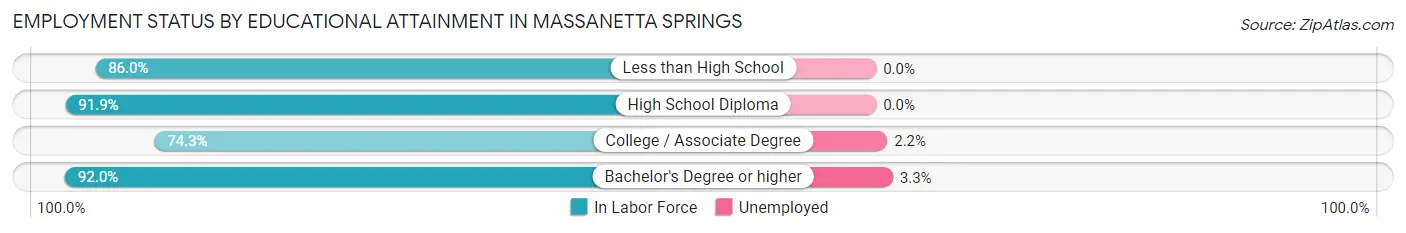
| Educational Attainment | In Labor Force | Unemployed |
| Less than High School | 37 (86.0%) | 0 (0.0%) |
| High School Diploma | 431 (91.9%) | 0 (0.0%) |
| College / Associate Degree | 454 (74.3%) | 13 (2.2%) |
| Bachelor's Degree or higher | 1,721 (92.0%) | 62 (3.3%) |
| Total | 2,644 (88.3%) | 75 (2.5%) |
Employment Occupations by Sex in Massanetta Springs
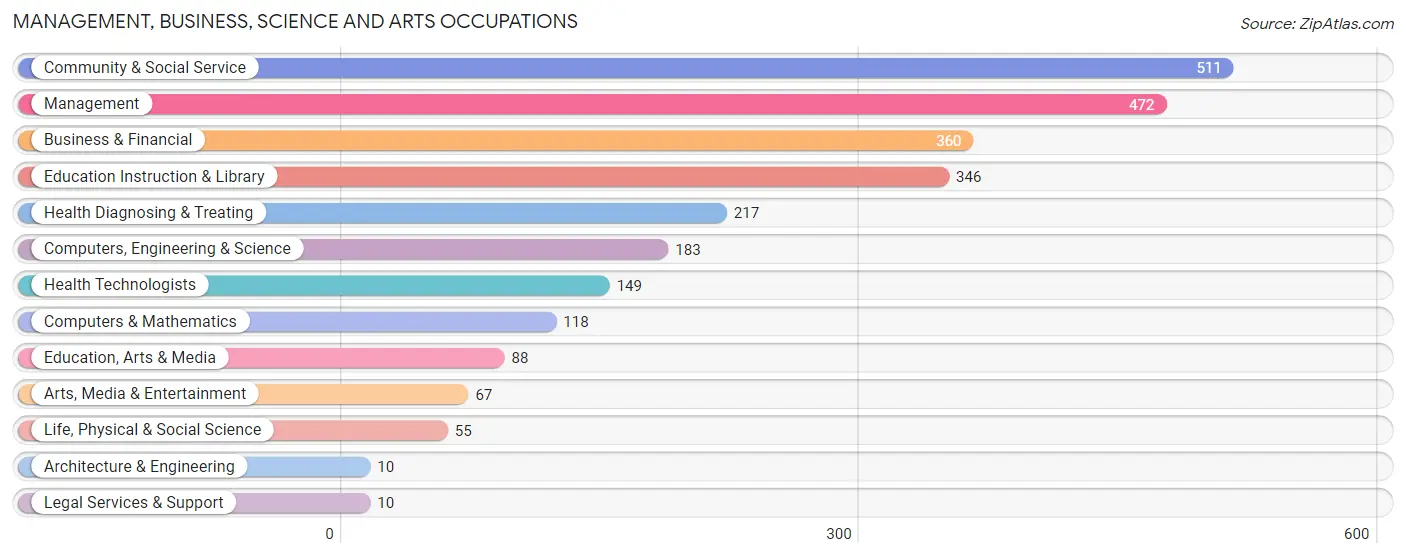
Management, Business, Science and Arts Occupations
The most common Management, Business, Science and Arts occupations in Massanetta Springs are Community & Social Service (511 | 16.6%), Management (472 | 15.3%), Business & Financial (360 | 11.7%), Education Instruction & Library (346 | 11.2%), and Health Diagnosing & Treating (217 | 7.0%).
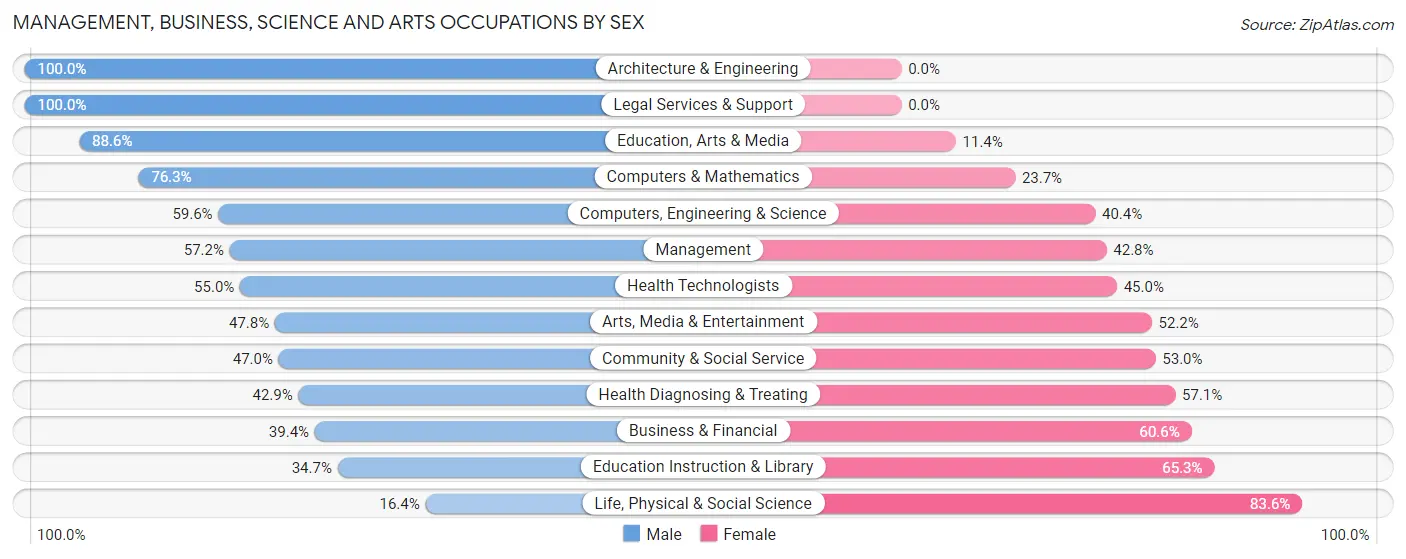
Management, Business, Science and Arts Occupations by Sex
Within the Management, Business, Science and Arts occupations in Massanetta Springs, the most male-oriented occupations are Architecture & Engineering (100.0%), Legal Services & Support (100.0%), and Education, Arts & Media (88.6%), while the most female-oriented occupations are Life, Physical & Social Science (83.6%), Education Instruction & Library (65.3%), and Business & Financial (60.6%).
| Occupation | Male | Female |
| Management | 270 (57.2%) | 202 (42.8%) |
| Business & Financial | 142 (39.4%) | 218 (60.6%) |
| Computers, Engineering & Science | 109 (59.6%) | 74 (40.4%) |
| Computers & Mathematics | 90 (76.3%) | 28 (23.7%) |
| Architecture & Engineering | 10 (100.0%) | 0 (0.0%) |
| Life, Physical & Social Science | 9 (16.4%) | 46 (83.6%) |
| Community & Social Service | 240 (47.0%) | 271 (53.0%) |
| Education, Arts & Media | 78 (88.6%) | 10 (11.4%) |
| Legal Services & Support | 10 (100.0%) | 0 (0.0%) |
| Education Instruction & Library | 120 (34.7%) | 226 (65.3%) |
| Arts, Media & Entertainment | 32 (47.8%) | 35 (52.2%) |
| Health Diagnosing & Treating | 93 (42.9%) | 124 (57.1%) |
| Health Technologists | 82 (55.0%) | 67 (45.0%) |
| Total (Category) | 854 (49.0%) | 889 (51.0%) |
| Total (Overall) | 1,559 (50.6%) | 1,521 (49.4%) |
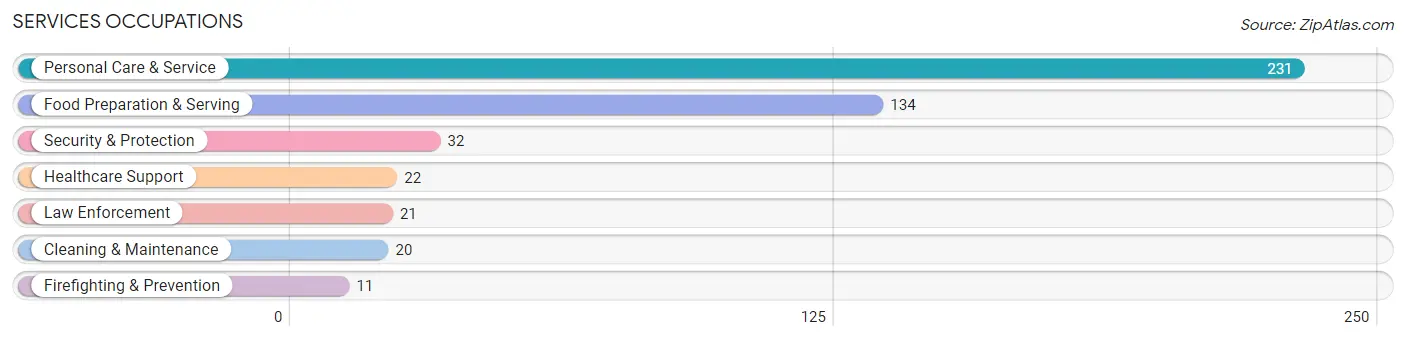
Services Occupations
The most common Services occupations in Massanetta Springs are Personal Care & Service (231 | 7.5%), Food Preparation & Serving (134 | 4.3%), Security & Protection (32 | 1.0%), Healthcare Support (22 | 0.7%), and Law Enforcement (21 | 0.7%).
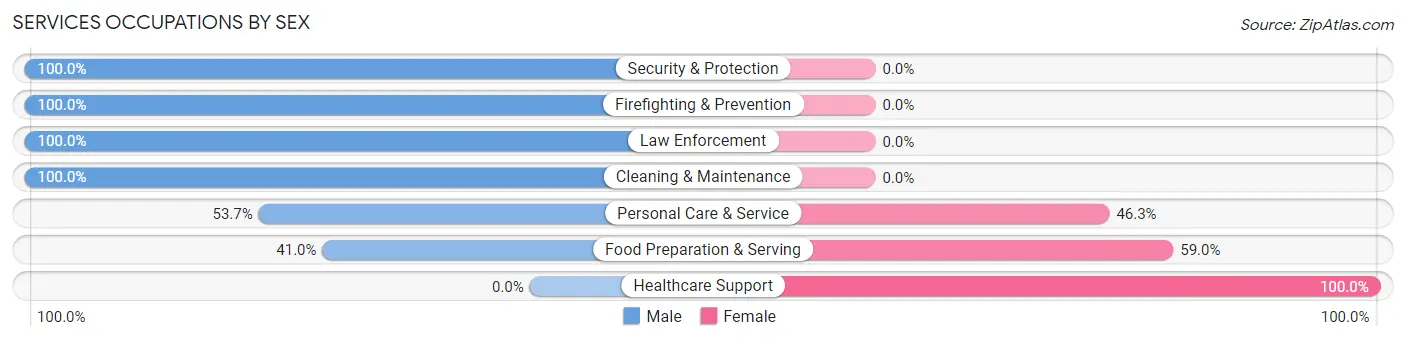
Services Occupations by Sex
Within the Services occupations in Massanetta Springs, the most male-oriented occupations are Security & Protection (100.0%), Firefighting & Prevention (100.0%), and Law Enforcement (100.0%), while the most female-oriented occupations are Healthcare Support (100.0%), Food Preparation & Serving (59.0%), and Personal Care & Service (46.3%).
| Occupation | Male | Female |
| Healthcare Support | 0 (0.0%) | 22 (100.0%) |
| Security & Protection | 32 (100.0%) | 0 (0.0%) |
| Firefighting & Prevention | 11 (100.0%) | 0 (0.0%) |
| Law Enforcement | 21 (100.0%) | 0 (0.0%) |
| Food Preparation & Serving | 55 (41.0%) | 79 (59.0%) |
| Cleaning & Maintenance | 20 (100.0%) | 0 (0.0%) |
| Personal Care & Service | 124 (53.7%) | 107 (46.3%) |
| Total (Category) | 231 (52.6%) | 208 (47.4%) |
| Total (Overall) | 1,559 (50.6%) | 1,521 (49.4%) |
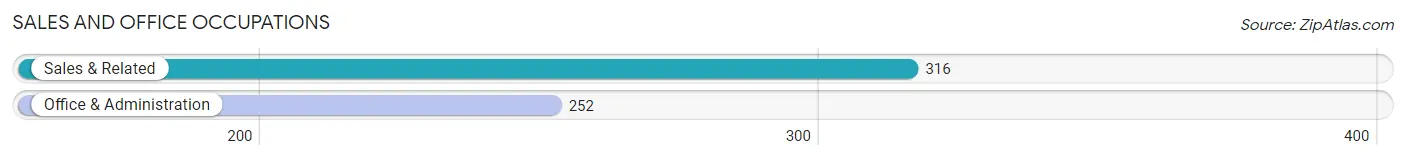
Sales and Office Occupations
The most common Sales and Office occupations in Massanetta Springs are Sales & Related (316 | 10.3%), and Office & Administration (252 | 8.2%).
Sales and Office Occupations by Sex
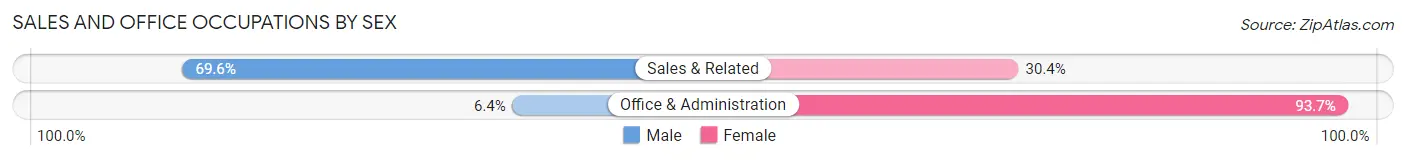
| Occupation | Male | Female |
| Sales & Related | 220 (69.6%) | 96 (30.4%) |
| Office & Administration | 16 (6.4%) | 236 (93.6%) |
| Total (Category) | 236 (41.5%) | 332 (58.5%) |
| Total (Overall) | 1,559 (50.6%) | 1,521 (49.4%) |
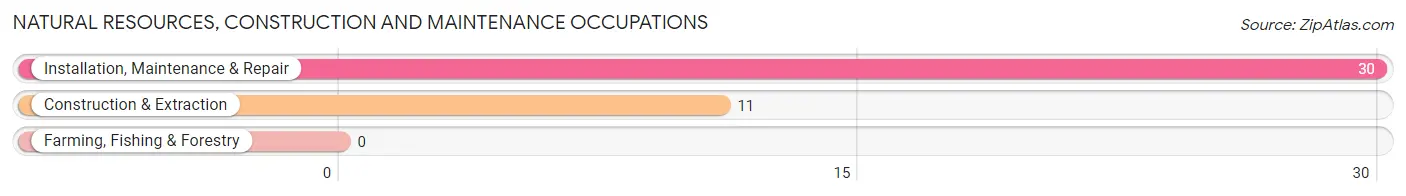
Natural Resources, Construction and Maintenance Occupations
The most common Natural Resources, Construction and Maintenance occupations in Massanetta Springs are Installation, Maintenance & Repair (30 | 1.0%), and Construction & Extraction (11 | 0.4%).
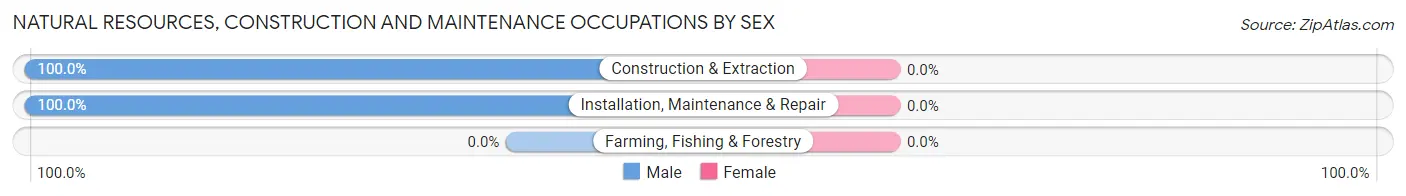
Natural Resources, Construction and Maintenance Occupations by Sex
| Occupation | Male | Female |
| Farming, Fishing & Forestry | 0 (0.0%) | 0 (0.0%) |
| Construction & Extraction | 11 (100.0%) | 0 (0.0%) |
| Installation, Maintenance & Repair | 30 (100.0%) | 0 (0.0%) |
| Total (Category) | 41 (100.0%) | 0 (0.0%) |
| Total (Overall) | 1,559 (50.6%) | 1,521 (49.4%) |
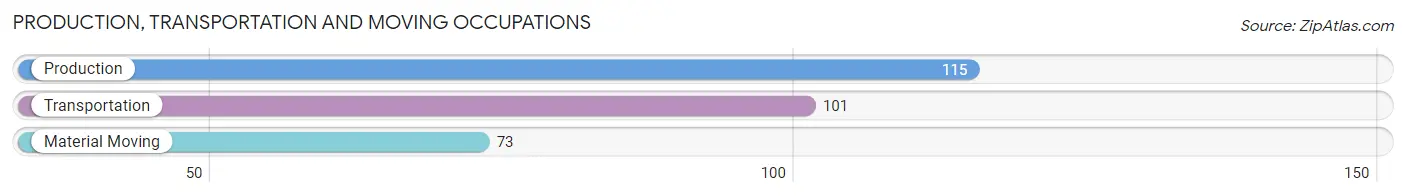
Production, Transportation and Moving Occupations
The most common Production, Transportation and Moving occupations in Massanetta Springs are Production (115 | 3.7%), Transportation (101 | 3.3%), and Material Moving (73 | 2.4%).
Production, Transportation and Moving Occupations by Sex
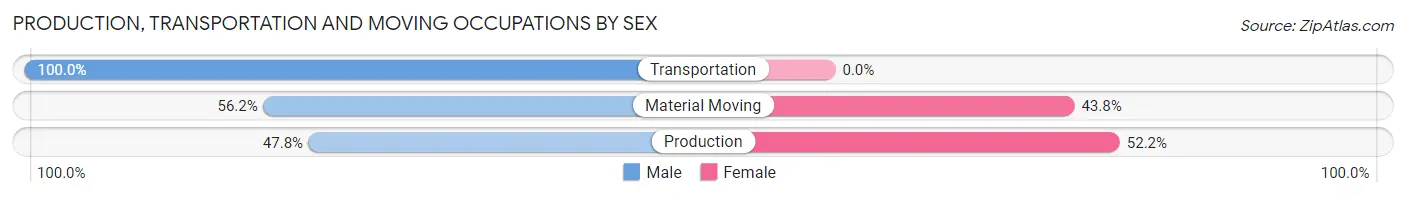
| Occupation | Male | Female |
| Production | 55 (47.8%) | 60 (52.2%) |
| Transportation | 101 (100.0%) | 0 (0.0%) |
| Material Moving | 41 (56.2%) | 32 (43.8%) |
| Total (Category) | 197 (68.2%) | 92 (31.8%) |
| Total (Overall) | 1,559 (50.6%) | 1,521 (49.4%) |
Employment Industries by Sex in Massanetta Springs
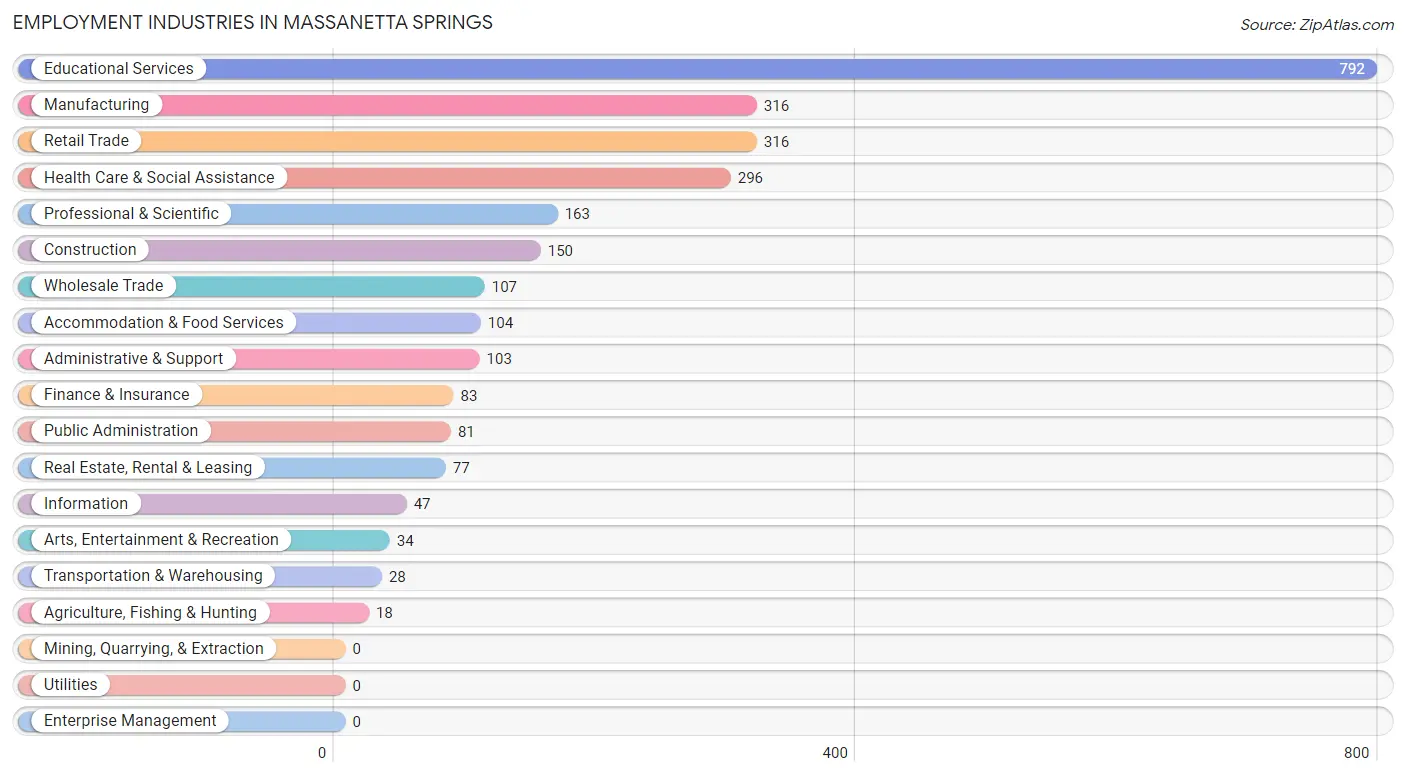
Employment Industries in Massanetta Springs
The major employment industries in Massanetta Springs include Educational Services (792 | 25.7%), Manufacturing (316 | 10.3%), Retail Trade (316 | 10.3%), Health Care & Social Assistance (296 | 9.6%), and Professional & Scientific (163 | 5.3%).
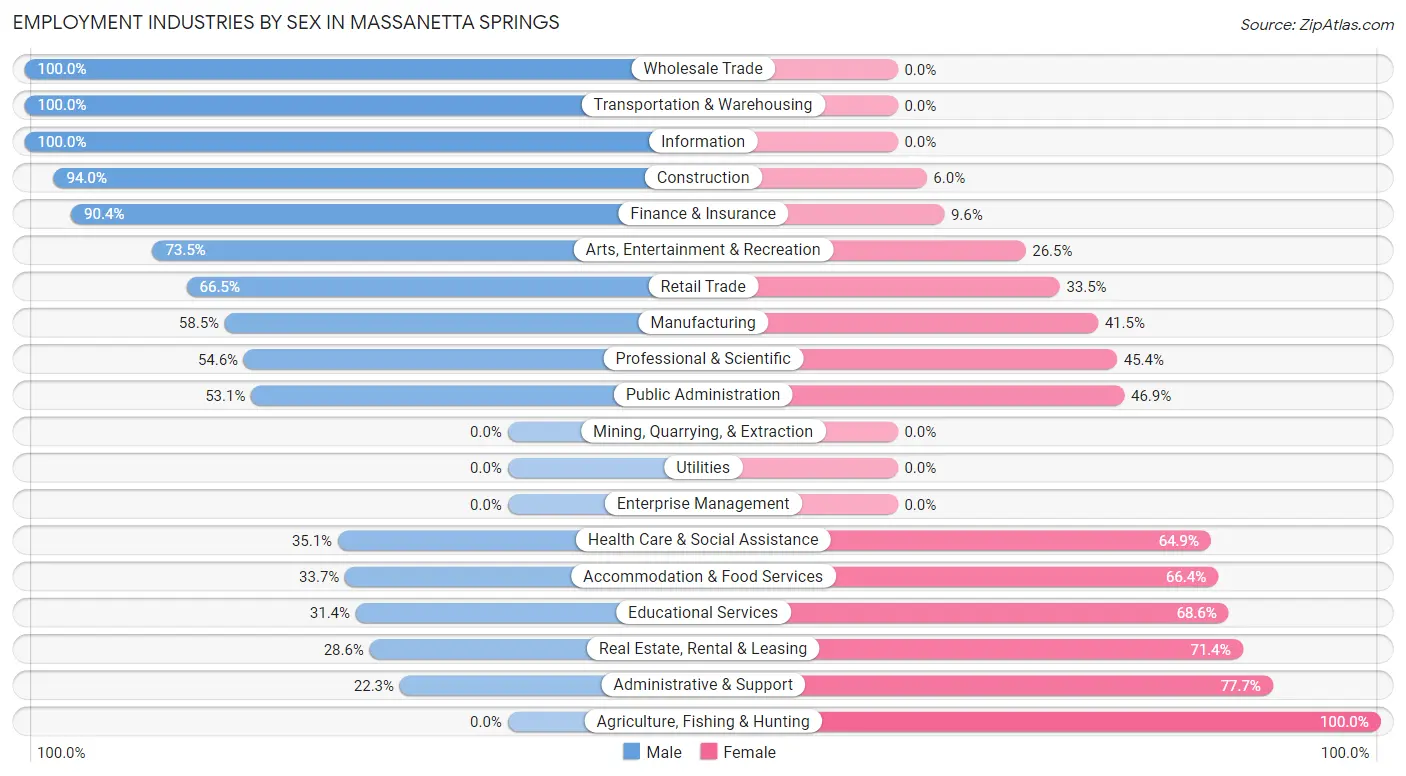
Employment Industries by Sex in Massanetta Springs
The Massanetta Springs industries that see more men than women are Wholesale Trade (100.0%), Transportation & Warehousing (100.0%), and Information (100.0%), whereas the industries that tend to have a higher number of women are Agriculture, Fishing & Hunting (100.0%), Administrative & Support (77.7%), and Real Estate, Rental & Leasing (71.4%).
| Industry | Male | Female |
| Agriculture, Fishing & Hunting | 0 (0.0%) | 18 (100.0%) |
| Mining, Quarrying, & Extraction | 0 (0.0%) | 0 (0.0%) |
| Construction | 141 (94.0%) | 9 (6.0%) |
| Manufacturing | 185 (58.5%) | 131 (41.5%) |
| Wholesale Trade | 107 (100.0%) | 0 (0.0%) |
| Retail Trade | 210 (66.5%) | 106 (33.5%) |
| Transportation & Warehousing | 28 (100.0%) | 0 (0.0%) |
| Utilities | 0 (0.0%) | 0 (0.0%) |
| Information | 47 (100.0%) | 0 (0.0%) |
| Finance & Insurance | 75 (90.4%) | 8 (9.6%) |
| Real Estate, Rental & Leasing | 22 (28.6%) | 55 (71.4%) |
| Professional & Scientific | 89 (54.6%) | 74 (45.4%) |
| Enterprise Management | 0 (0.0%) | 0 (0.0%) |
| Administrative & Support | 23 (22.3%) | 80 (77.7%) |
| Educational Services | 249 (31.4%) | 543 (68.6%) |
| Health Care & Social Assistance | 104 (35.1%) | 192 (64.9%) |
| Arts, Entertainment & Recreation | 25 (73.5%) | 9 (26.5%) |
| Accommodation & Food Services | 35 (33.7%) | 69 (66.3%) |
| Public Administration | 43 (53.1%) | 38 (46.9%) |
| Total | 1,559 (50.6%) | 1,521 (49.4%) |
Education in Massanetta Springs
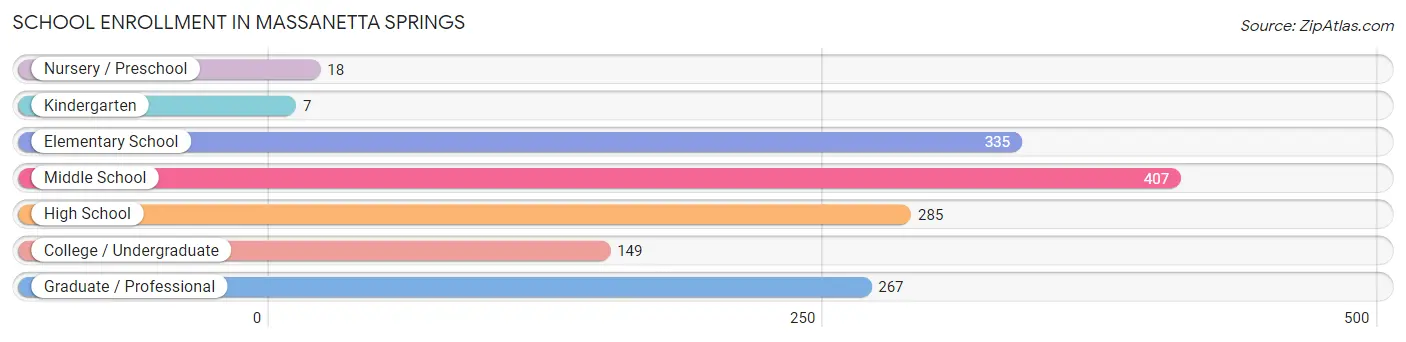
School Enrollment in Massanetta Springs
The most common levels of schooling among the 1,468 students in Massanetta Springs are middle school (407 | 27.7%), elementary school (335 | 22.8%), and high school (285 | 19.4%).
| School Level | # Students | % Students |
| Nursery / Preschool | 18 | 1.2% |
| Kindergarten | 7 | 0.5% |
| Elementary School | 335 | 22.8% |
| Middle School | 407 | 27.7% |
| High School | 285 | 19.4% |
| College / Undergraduate | 149 | 10.2% |
| Graduate / Professional | 267 | 18.2% |
| Total | 1,468 | 100.0% |
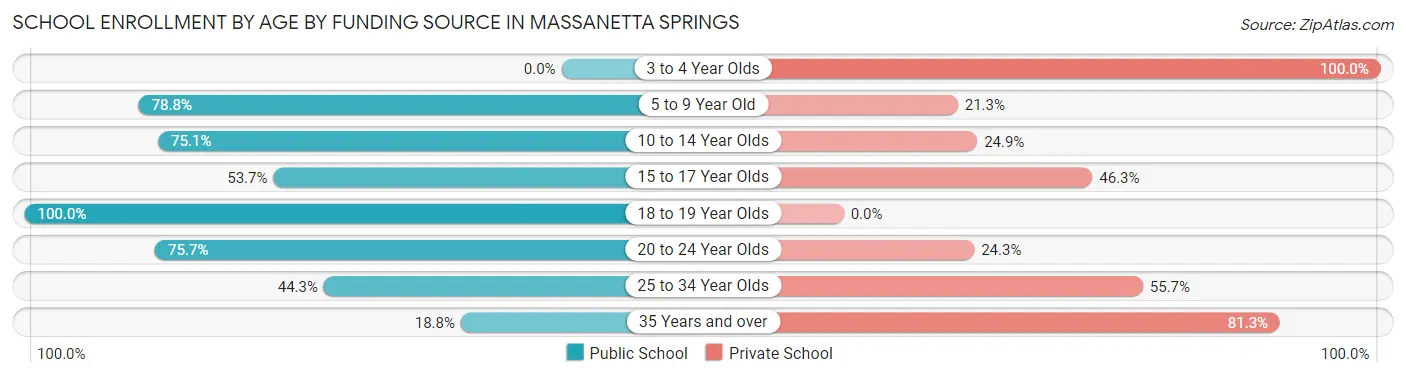
School Enrollment by Age by Funding Source in Massanetta Springs
Out of a total of 1,468 students who are enrolled in schools in Massanetta Springs, 504 (34.3%) attend a private institution, while the remaining 964 (65.7%) are enrolled in public schools. The age group of 3 to 4 year olds has the highest likelihood of being enrolled in private schools, with 18 (100.0% in the age bracket) enrolled. Conversely, the age group of 18 to 19 year olds has the lowest likelihood of being enrolled in a private school, with 83 (100.0% in the age bracket) attending a public institution.
| Age Bracket | Public School | Private School |
| 3 to 4 Year Olds | 0 (0.0%) | 18 (100.0%) |
| 5 to 9 Year Old | 189 (78.7%) | 51 (21.2%) |
| 10 to 14 Year Olds | 432 (75.1%) | 143 (24.9%) |
| 15 to 17 Year Olds | 73 (53.7%) | 63 (46.3%) |
| 18 to 19 Year Olds | 83 (100.0%) | 0 (0.0%) |
| 20 to 24 Year Olds | 56 (75.7%) | 18 (24.3%) |
| 25 to 34 Year Olds | 116 (44.3%) | 146 (55.7%) |
| 35 Years and over | 15 (18.8%) | 65 (81.2%) |
| Total | 964 (65.7%) | 504 (34.3%) |
Educational Attainment by Field of Study in Massanetta Springs
Business (501 | 17.6%), education (352 | 12.4%), psychology (313 | 11.0%), liberal arts & history (300 | 10.5%), and literature & languages (258 | 9.1%) are the most common fields of study among 2,844 individuals in Massanetta Springs who have obtained a bachelor's degree or higher.
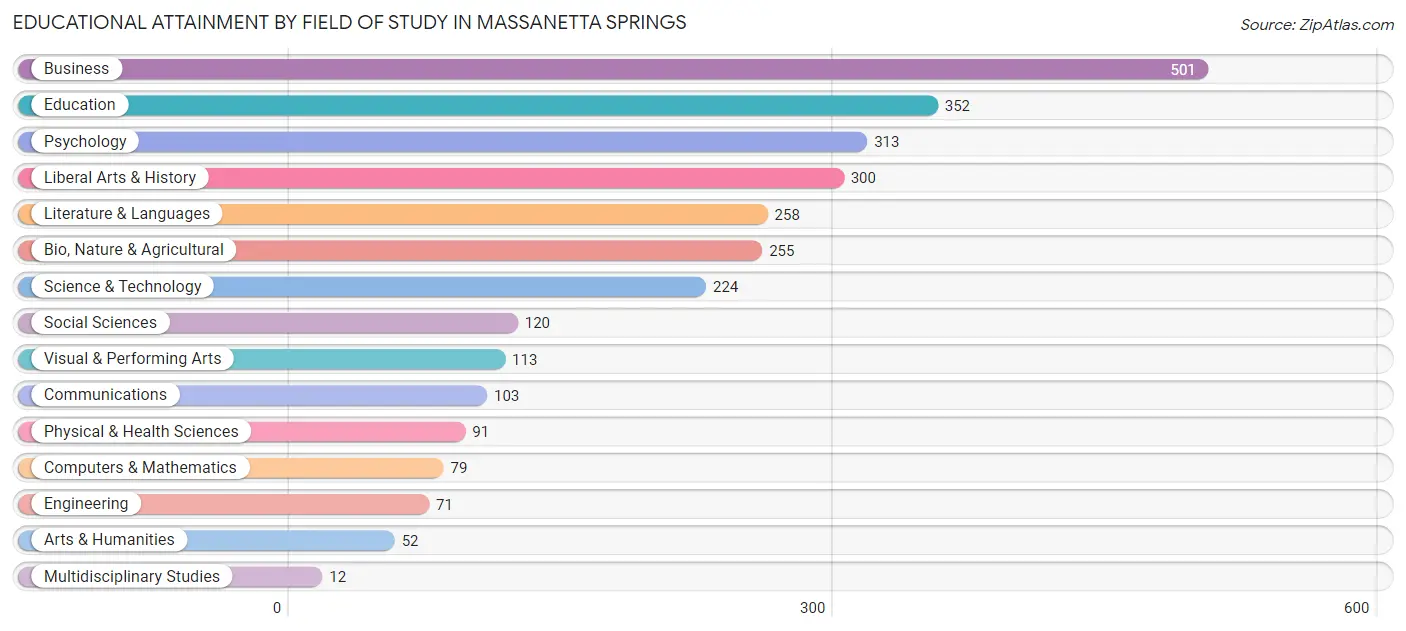
| Field of Study | # Graduates | % Graduates |
| Computers & Mathematics | 79 | 2.8% |
| Bio, Nature & Agricultural | 255 | 9.0% |
| Physical & Health Sciences | 91 | 3.2% |
| Psychology | 313 | 11.0% |
| Social Sciences | 120 | 4.2% |
| Engineering | 71 | 2.5% |
| Multidisciplinary Studies | 12 | 0.4% |
| Science & Technology | 224 | 7.9% |
| Business | 501 | 17.6% |
| Education | 352 | 12.4% |
| Literature & Languages | 258 | 9.1% |
| Liberal Arts & History | 300 | 10.5% |
| Visual & Performing Arts | 113 | 4.0% |
| Communications | 103 | 3.6% |
| Arts & Humanities | 52 | 1.8% |
| Total | 2,844 | 100.0% |
Transportation & Commute in Massanetta Springs
Vehicle Availability by Sex in Massanetta Springs
The most prevalent vehicle ownership categories in Massanetta Springs are males with 2 vehicles (868, accounting for 56.7%) and females with 2 vehicles (747, making up 57.2%).
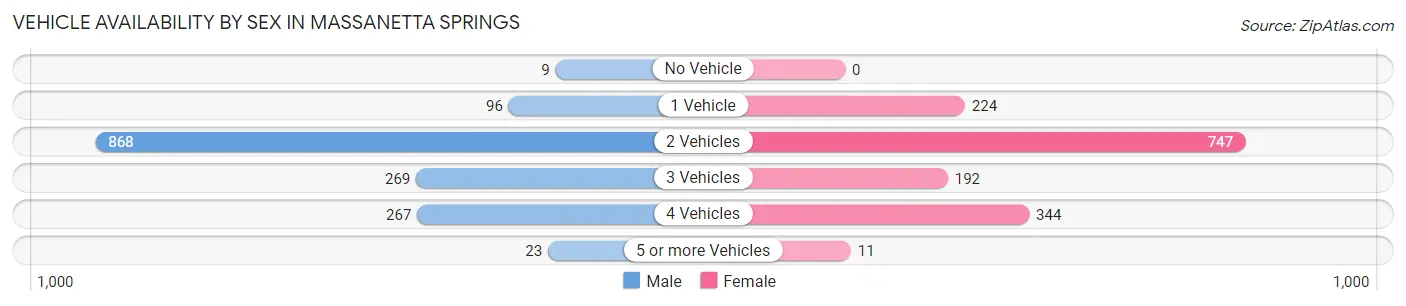
| Vehicles Available | Male | Female |
| No Vehicle | 9 (0.6%) | 0 (0.0%) |
| 1 Vehicle | 96 (6.3%) | 224 (14.8%) |
| 2 Vehicles | 868 (56.7%) | 747 (49.2%) |
| 3 Vehicles | 269 (17.6%) | 192 (12.7%) |
| 4 Vehicles | 267 (17.4%) | 344 (22.7%) |
| 5 or more Vehicles | 23 (1.5%) | 11 (0.7%) |
| Total | 1,532 (100.0%) | 1,518 (100.0%) |
Commute Time in Massanetta Springs
The most frequently occuring commute durations in Massanetta Springs are 15 to 19 minutes (801 commuters, 29.3%), 10 to 14 minutes (670 commuters, 24.5%), and 5 to 9 minutes (388 commuters, 14.2%).
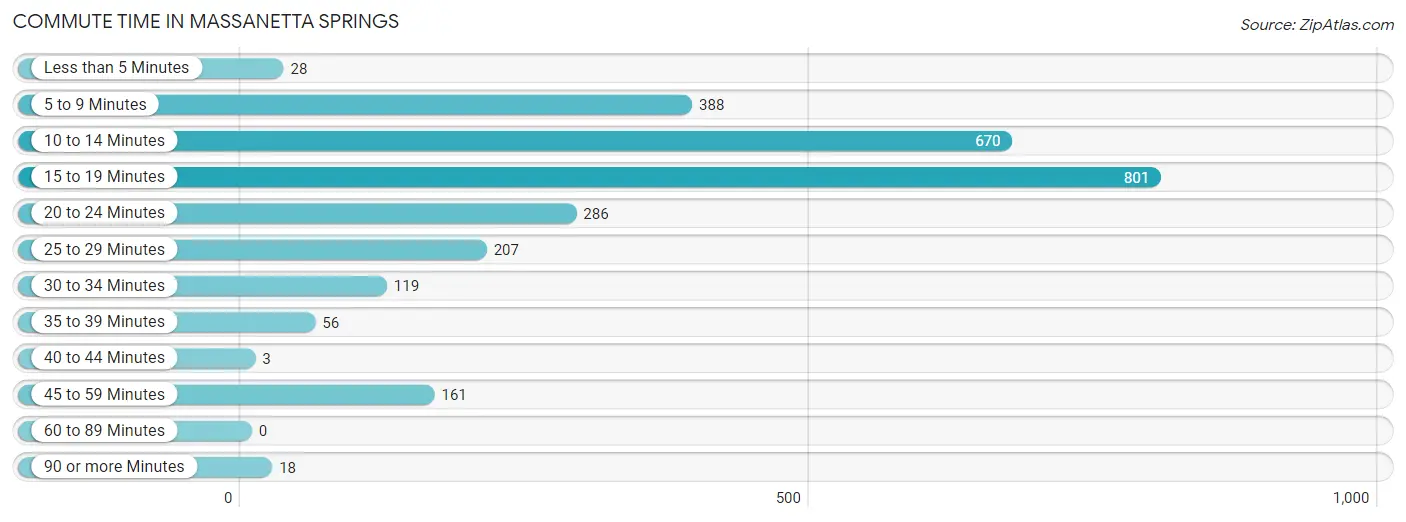
| Commute Time | # Commuters | % Commuters |
| Less than 5 Minutes | 28 | 1.0% |
| 5 to 9 Minutes | 388 | 14.2% |
| 10 to 14 Minutes | 670 | 24.5% |
| 15 to 19 Minutes | 801 | 29.3% |
| 20 to 24 Minutes | 286 | 10.4% |
| 25 to 29 Minutes | 207 | 7.6% |
| 30 to 34 Minutes | 119 | 4.3% |
| 35 to 39 Minutes | 56 | 2.1% |
| 40 to 44 Minutes | 3 | 0.1% |
| 45 to 59 Minutes | 161 | 5.9% |
| 60 to 89 Minutes | 0 | 0.0% |
| 90 or more Minutes | 18 | 0.7% |
Commute Time by Sex in Massanetta Springs
The most common commute times in Massanetta Springs are 15 to 19 minutes (433 commuters, 31.1%) for males and 15 to 19 minutes (368 commuters, 27.3%) for females.
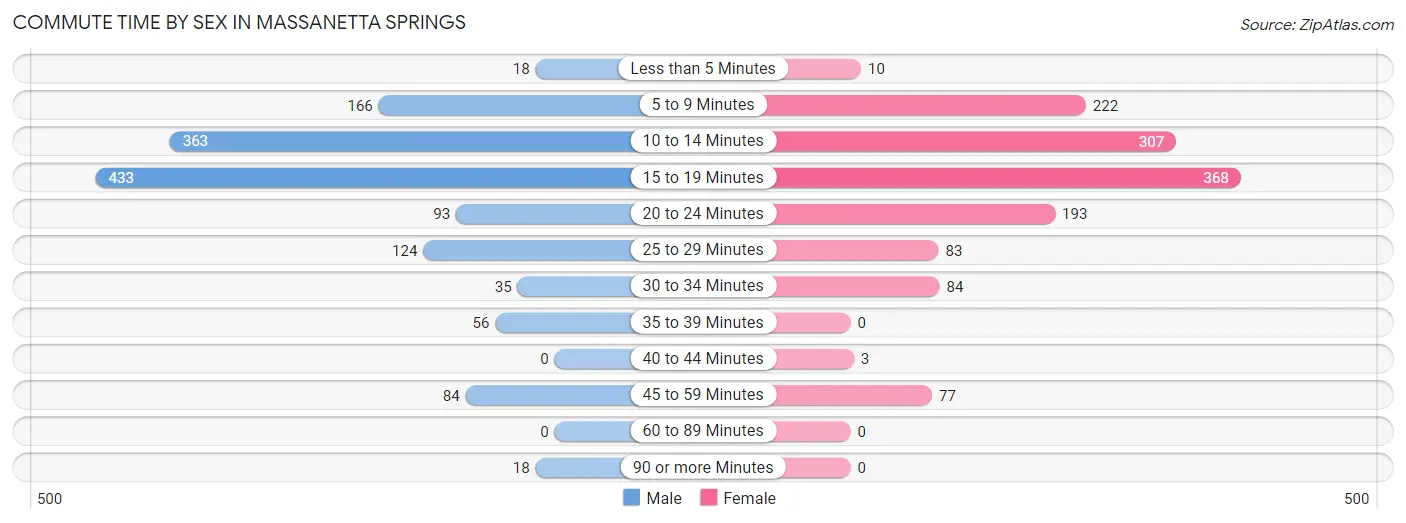
| Commute Time | Male | Female |
| Less than 5 Minutes | 18 (1.3%) | 10 (0.7%) |
| 5 to 9 Minutes | 166 (11.9%) | 222 (16.5%) |
| 10 to 14 Minutes | 363 (26.1%) | 307 (22.8%) |
| 15 to 19 Minutes | 433 (31.1%) | 368 (27.3%) |
| 20 to 24 Minutes | 93 (6.7%) | 193 (14.3%) |
| 25 to 29 Minutes | 124 (8.9%) | 83 (6.2%) |
| 30 to 34 Minutes | 35 (2.5%) | 84 (6.2%) |
| 35 to 39 Minutes | 56 (4.0%) | 0 (0.0%) |
| 40 to 44 Minutes | 0 (0.0%) | 3 (0.2%) |
| 45 to 59 Minutes | 84 (6.0%) | 77 (5.7%) |
| 60 to 89 Minutes | 0 (0.0%) | 0 (0.0%) |
| 90 or more Minutes | 18 (1.3%) | 0 (0.0%) |
Time of Departure to Work by Sex in Massanetta Springs
The most frequent times of departure to work in Massanetta Springs are 7:30 AM to 7:59 AM (346, 24.9%) for males and 7:30 AM to 7:59 AM (531, 39.4%) for females.
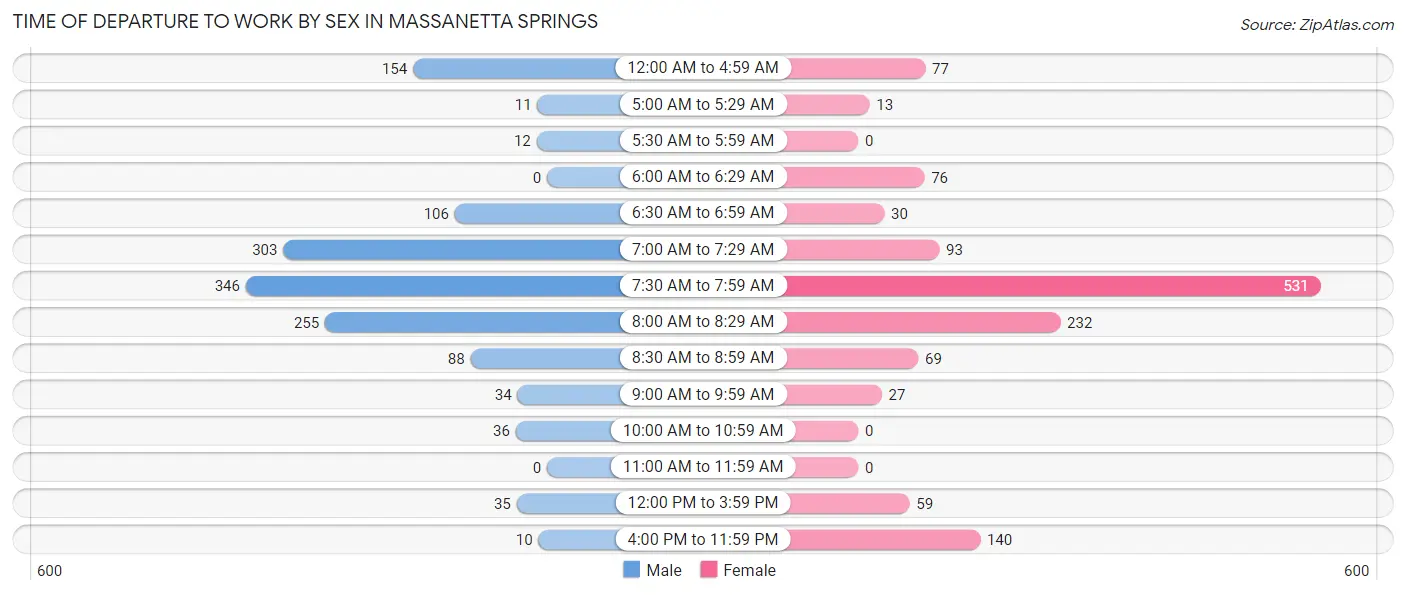
| Time of Departure | Male | Female |
| 12:00 AM to 4:59 AM | 154 (11.1%) | 77 (5.7%) |
| 5:00 AM to 5:29 AM | 11 (0.8%) | 13 (1.0%) |
| 5:30 AM to 5:59 AM | 12 (0.9%) | 0 (0.0%) |
| 6:00 AM to 6:29 AM | 0 (0.0%) | 76 (5.6%) |
| 6:30 AM to 6:59 AM | 106 (7.6%) | 30 (2.2%) |
| 7:00 AM to 7:29 AM | 303 (21.8%) | 93 (6.9%) |
| 7:30 AM to 7:59 AM | 346 (24.9%) | 531 (39.4%) |
| 8:00 AM to 8:29 AM | 255 (18.3%) | 232 (17.2%) |
| 8:30 AM to 8:59 AM | 88 (6.3%) | 69 (5.1%) |
| 9:00 AM to 9:59 AM | 34 (2.5%) | 27 (2.0%) |
| 10:00 AM to 10:59 AM | 36 (2.6%) | 0 (0.0%) |
| 11:00 AM to 11:59 AM | 0 (0.0%) | 0 (0.0%) |
| 12:00 PM to 3:59 PM | 35 (2.5%) | 59 (4.4%) |
| 4:00 PM to 11:59 PM | 10 (0.7%) | 140 (10.4%) |
| Total | 1,390 (100.0%) | 1,347 (100.0%) |
Housing Occupancy in Massanetta Springs
Occupancy by Ownership in Massanetta Springs
Of the total 2,595 dwellings in Massanetta Springs, owner-occupied units account for 1,857 (71.6%), while renter-occupied units make up 738 (28.4%).
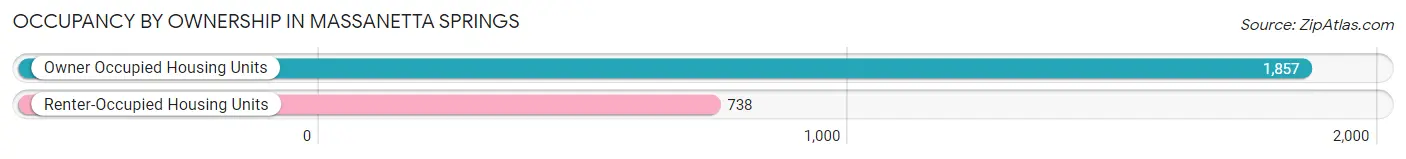
| Occupancy | # Housing Units | % Housing Units |
| Owner Occupied Housing Units | 1,857 | 71.6% |
| Renter-Occupied Housing Units | 738 | 28.4% |
| Total Occupied Housing Units | 2,595 | 100.0% |
Occupancy by Household Size in Massanetta Springs
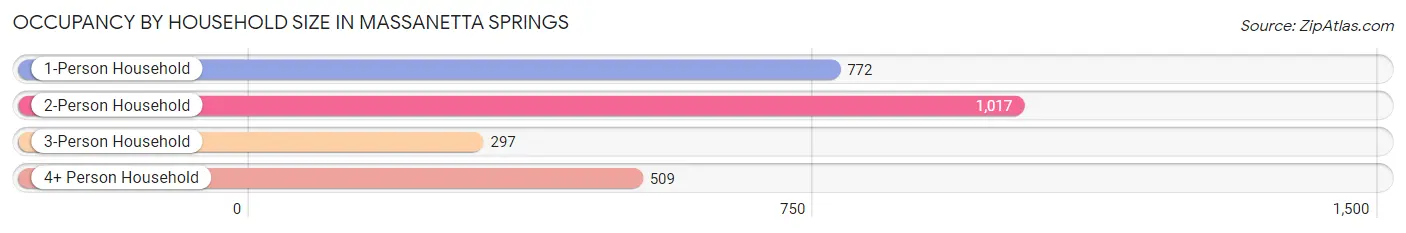
| Household Size | # Housing Units | % Housing Units |
| 1-Person Household | 772 | 29.7% |
| 2-Person Household | 1,017 | 39.2% |
| 3-Person Household | 297 | 11.5% |
| 4+ Person Household | 509 | 19.6% |
| Total Housing Units | 2,595 | 100.0% |
Occupancy by Ownership by Household Size in Massanetta Springs
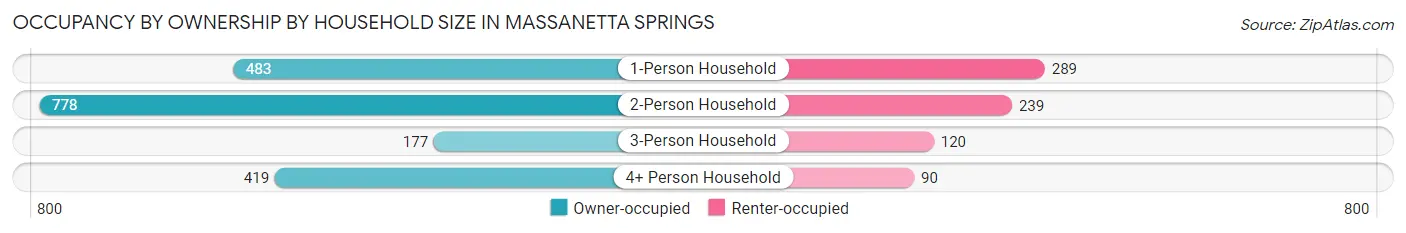
| Household Size | Owner-occupied | Renter-occupied |
| 1-Person Household | 483 (62.6%) | 289 (37.4%) |
| 2-Person Household | 778 (76.5%) | 239 (23.5%) |
| 3-Person Household | 177 (59.6%) | 120 (40.4%) |
| 4+ Person Household | 419 (82.3%) | 90 (17.7%) |
| Total Housing Units | 1,857 (71.6%) | 738 (28.4%) |
Occupancy by Educational Attainment in Massanetta Springs
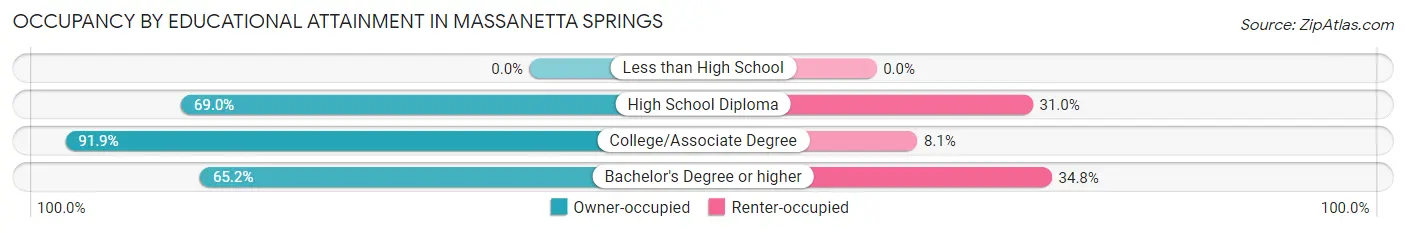
| Household Size | Owner-occupied | Renter-occupied |
| Less than High School | 0 (0.0%) | 0 (0.0%) |
| High School Diploma | 296 (69.0%) | 133 (31.0%) |
| College/Associate Degree | 511 (91.9%) | 45 (8.1%) |
| Bachelor's Degree or higher | 1,050 (65.2%) | 560 (34.8%) |
Occupancy by Age of Householder in Massanetta Springs
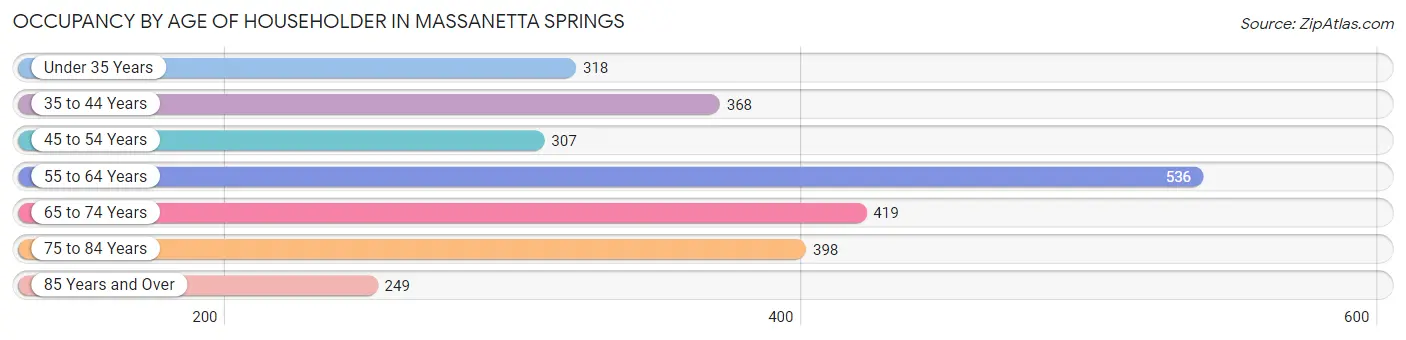
| Age Bracket | # Households | % Households |
| Under 35 Years | 318 | 12.2% |
| 35 to 44 Years | 368 | 14.2% |
| 45 to 54 Years | 307 | 11.8% |
| 55 to 64 Years | 536 | 20.7% |
| 65 to 74 Years | 419 | 16.2% |
| 75 to 84 Years | 398 | 15.3% |
| 85 Years and Over | 249 | 9.6% |
| Total | 2,595 | 100.0% |
Housing Finances in Massanetta Springs
Median Income by Occupancy in Massanetta Springs
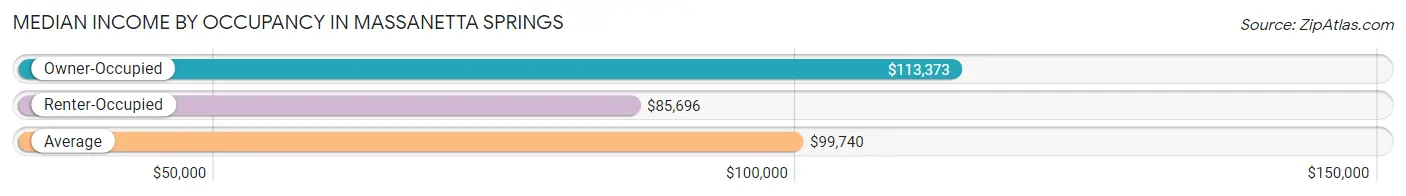
| Occupancy Type | # Households | Median Income |
| Owner-Occupied | 1,857 (71.6%) | $113,373 |
| Renter-Occupied | 738 (28.4%) | $85,696 |
| Average | 2,595 (100.0%) | $99,740 |
Occupancy by Householder Income Bracket in Massanetta Springs
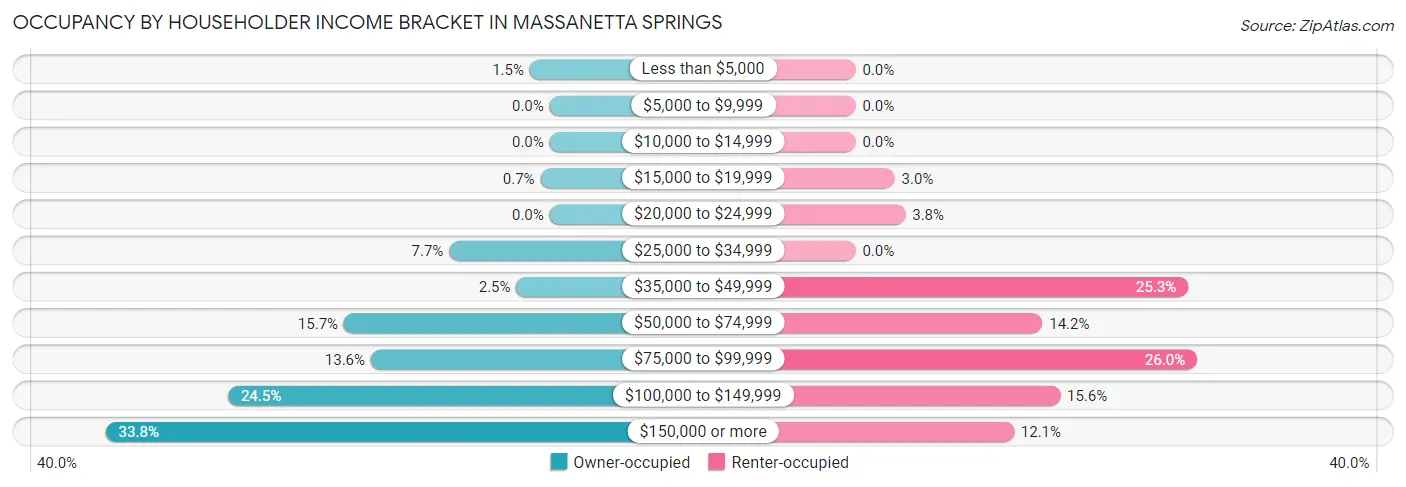
| Income Bracket | Owner-occupied | Renter-occupied |
| Less than $5,000 | 28 (1.5%) | 0 (0.0%) |
| $5,000 to $9,999 | 0 (0.0%) | 0 (0.0%) |
| $10,000 to $14,999 | 0 (0.0%) | 0 (0.0%) |
| $15,000 to $19,999 | 13 (0.7%) | 22 (3.0%) |
| $20,000 to $24,999 | 0 (0.0%) | 28 (3.8%) |
| $25,000 to $34,999 | 142 (7.6%) | 0 (0.0%) |
| $35,000 to $49,999 | 47 (2.5%) | 187 (25.3%) |
| $50,000 to $74,999 | 291 (15.7%) | 105 (14.2%) |
| $75,000 to $99,999 | 253 (13.6%) | 192 (26.0%) |
| $100,000 to $149,999 | 455 (24.5%) | 115 (15.6%) |
| $150,000 or more | 628 (33.8%) | 89 (12.1%) |
| Total | 1,857 (100.0%) | 738 (100.0%) |
Monthly Housing Cost Tiers in Massanetta Springs
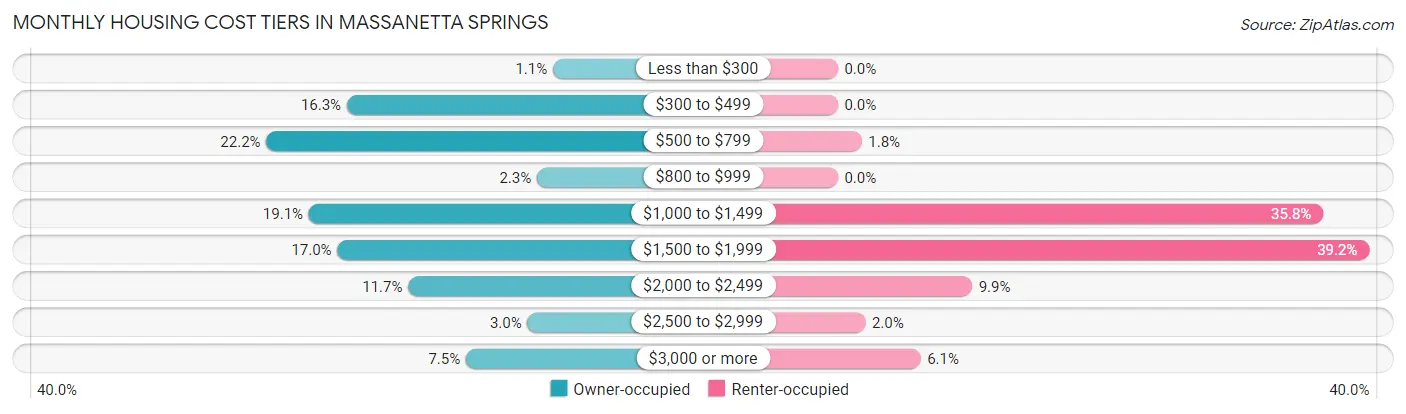
| Monthly Cost | Owner-occupied | Renter-occupied |
| Less than $300 | 20 (1.1%) | 0 (0.0%) |
| $300 to $499 | 302 (16.3%) | 0 (0.0%) |
| $500 to $799 | 412 (22.2%) | 13 (1.8%) |
| $800 to $999 | 42 (2.3%) | 0 (0.0%) |
| $1,000 to $1,499 | 354 (19.1%) | 264 (35.8%) |
| $1,500 to $1,999 | 315 (17.0%) | 289 (39.2%) |
| $2,000 to $2,499 | 218 (11.7%) | 73 (9.9%) |
| $2,500 to $2,999 | 55 (3.0%) | 15 (2.0%) |
| $3,000 or more | 139 (7.5%) | 45 (6.1%) |
| Total | 1,857 (100.0%) | 738 (100.0%) |
Physical Housing Characteristics in Massanetta Springs
Housing Structures in Massanetta Springs
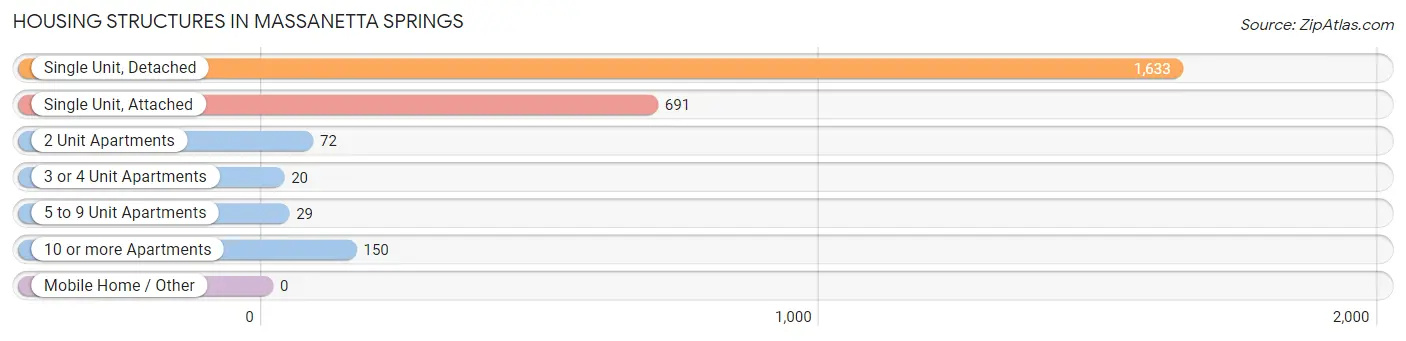
| Structure Type | # Housing Units | % Housing Units |
| Single Unit, Detached | 1,633 | 62.9% |
| Single Unit, Attached | 691 | 26.6% |
| 2 Unit Apartments | 72 | 2.8% |
| 3 or 4 Unit Apartments | 20 | 0.8% |
| 5 to 9 Unit Apartments | 29 | 1.1% |
| 10 or more Apartments | 150 | 5.8% |
| Mobile Home / Other | 0 | 0.0% |
| Total | 2,595 | 100.0% |
Housing Structures by Occupancy in Massanetta Springs
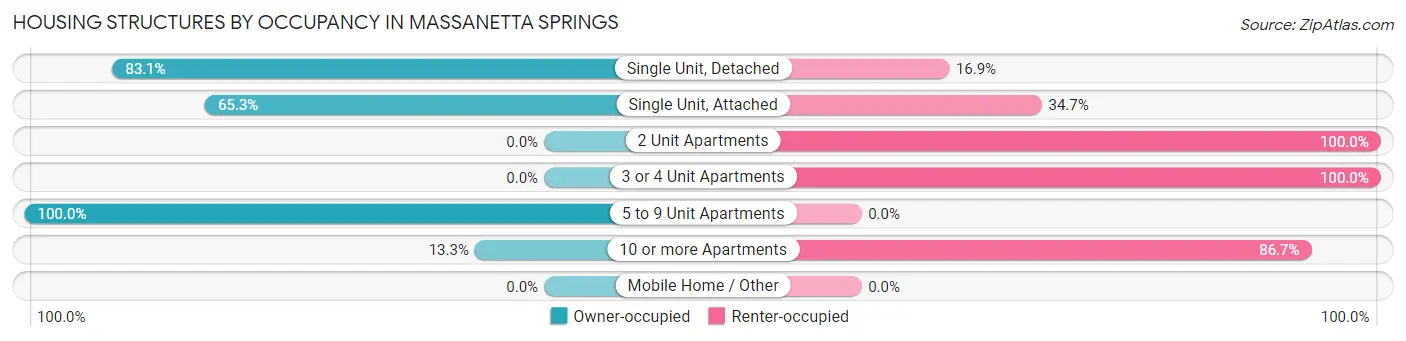
| Structure Type | Owner-occupied | Renter-occupied |
| Single Unit, Detached | 1,357 (83.1%) | 276 (16.9%) |
| Single Unit, Attached | 451 (65.3%) | 240 (34.7%) |
| 2 Unit Apartments | 0 (0.0%) | 72 (100.0%) |
| 3 or 4 Unit Apartments | 0 (0.0%) | 20 (100.0%) |
| 5 to 9 Unit Apartments | 29 (100.0%) | 0 (0.0%) |
| 10 or more Apartments | 20 (13.3%) | 130 (86.7%) |
| Mobile Home / Other | 0 (0.0%) | 0 (0.0%) |
| Total | 1,857 (71.6%) | 738 (28.4%) |
Housing Structures by Number of Rooms in Massanetta Springs
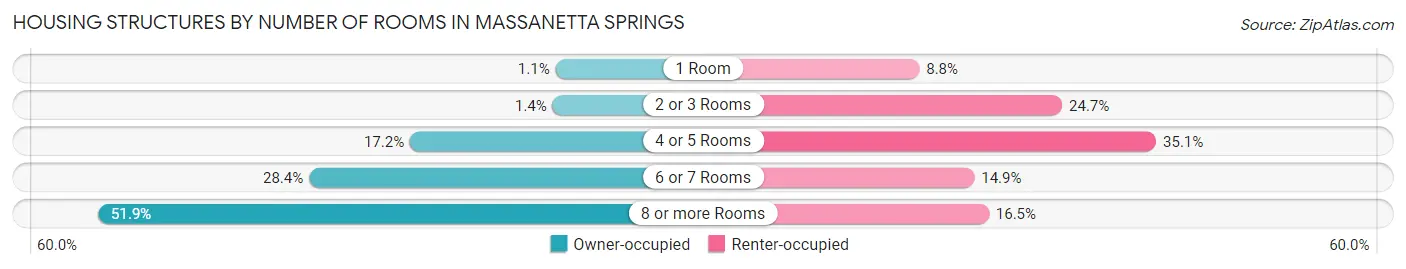
| Number of Rooms | Owner-occupied | Renter-occupied |
| 1 Room | 20 (1.1%) | 65 (8.8%) |
| 2 or 3 Rooms | 26 (1.4%) | 182 (24.7%) |
| 4 or 5 Rooms | 320 (17.2%) | 259 (35.1%) |
| 6 or 7 Rooms | 528 (28.4%) | 110 (14.9%) |
| 8 or more Rooms | 963 (51.9%) | 122 (16.5%) |
| Total | 1,857 (100.0%) | 738 (100.0%) |
Housing Structure by Heating Type in Massanetta Springs
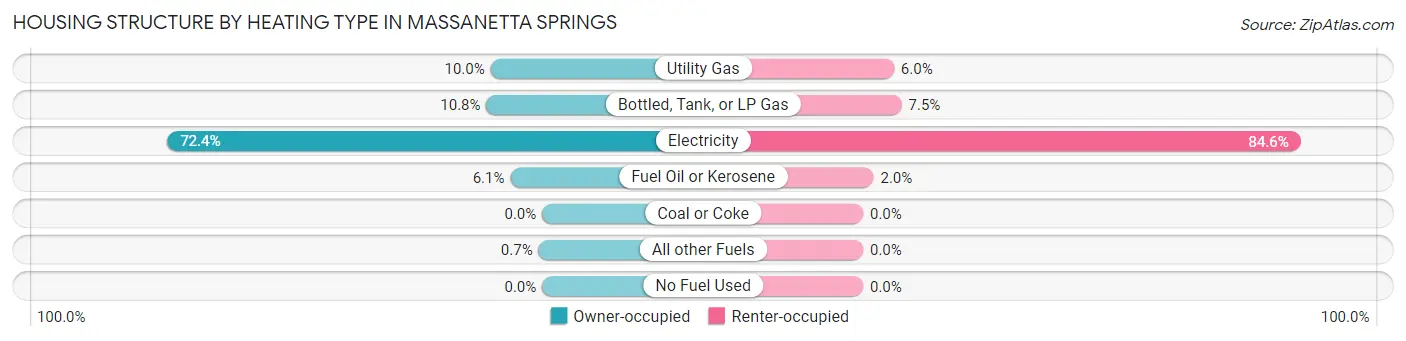
| Heating Type | Owner-occupied | Renter-occupied |
| Utility Gas | 185 (10.0%) | 44 (6.0%) |
| Bottled, Tank, or LP Gas | 200 (10.8%) | 55 (7.4%) |
| Electricity | 1,345 (72.4%) | 624 (84.6%) |
| Fuel Oil or Kerosene | 114 (6.1%) | 15 (2.0%) |
| Coal or Coke | 0 (0.0%) | 0 (0.0%) |
| All other Fuels | 13 (0.7%) | 0 (0.0%) |
| No Fuel Used | 0 (0.0%) | 0 (0.0%) |
| Total | 1,857 (100.0%) | 738 (100.0%) |
Household Vehicle Usage in Massanetta Springs
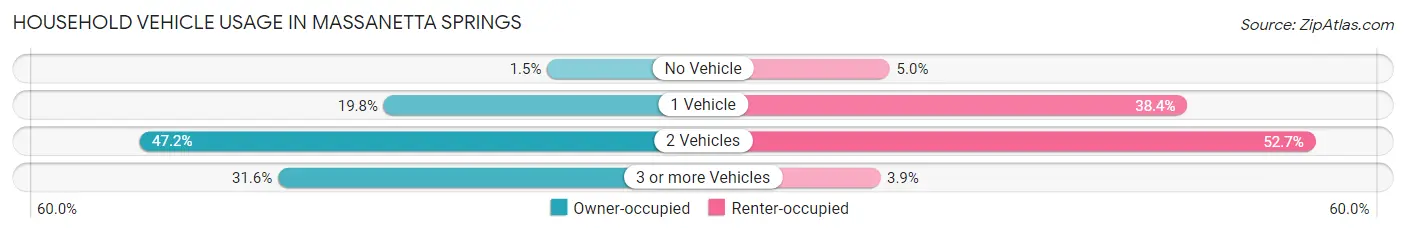
| Vehicles per Household | Owner-occupied | Renter-occupied |
| No Vehicle | 27 (1.5%) | 37 (5.0%) |
| 1 Vehicle | 367 (19.8%) | 283 (38.4%) |
| 2 Vehicles | 876 (47.2%) | 389 (52.7%) |
| 3 or more Vehicles | 587 (31.6%) | 29 (3.9%) |
| Total | 1,857 (100.0%) | 738 (100.0%) |
Real Estate & Mortgages in Massanetta Springs
Real Estate and Mortgage Overview in Massanetta Springs
| Characteristic | Without Mortgage | With Mortgage |
| Housing Units | 828 | 1,029 |
| Median Property Value | $443,100 | $466,300 |
| Median Household Income | $98,750 | $346 |
| Monthly Housing Costs | $561 | $139 |
| Real Estate Taxes | $2,856 | $58 |
Property Value by Mortgage Status in Massanetta Springs
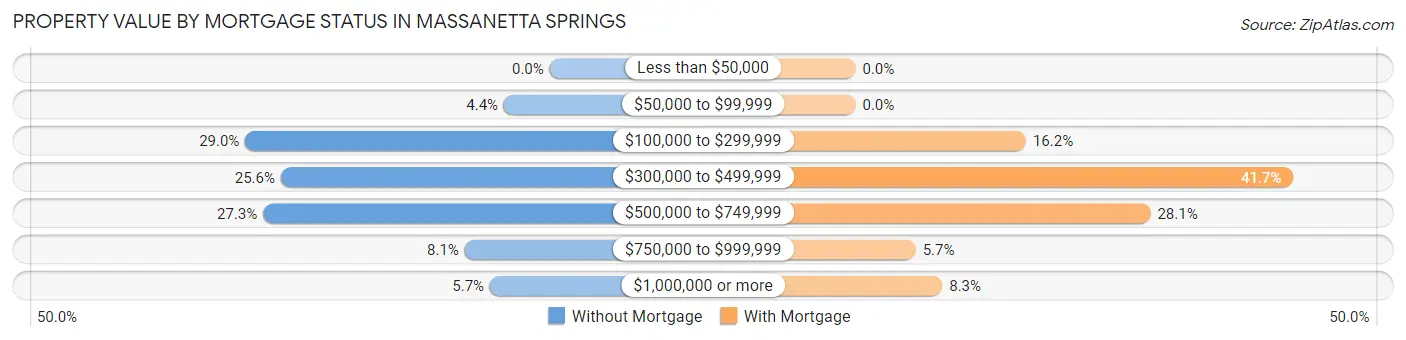
| Property Value | Without Mortgage | With Mortgage |
| Less than $50,000 | 0 (0.0%) | 0 (0.0%) |
| $50,000 to $99,999 | 36 (4.3%) | 0 (0.0%) |
| $100,000 to $299,999 | 240 (29.0%) | 167 (16.2%) |
| $300,000 to $499,999 | 212 (25.6%) | 429 (41.7%) |
| $500,000 to $749,999 | 226 (27.3%) | 289 (28.1%) |
| $750,000 to $999,999 | 67 (8.1%) | 59 (5.7%) |
| $1,000,000 or more | 47 (5.7%) | 85 (8.3%) |
| Total | 828 (100.0%) | 1,029 (100.0%) |
Household Income by Mortgage Status in Massanetta Springs
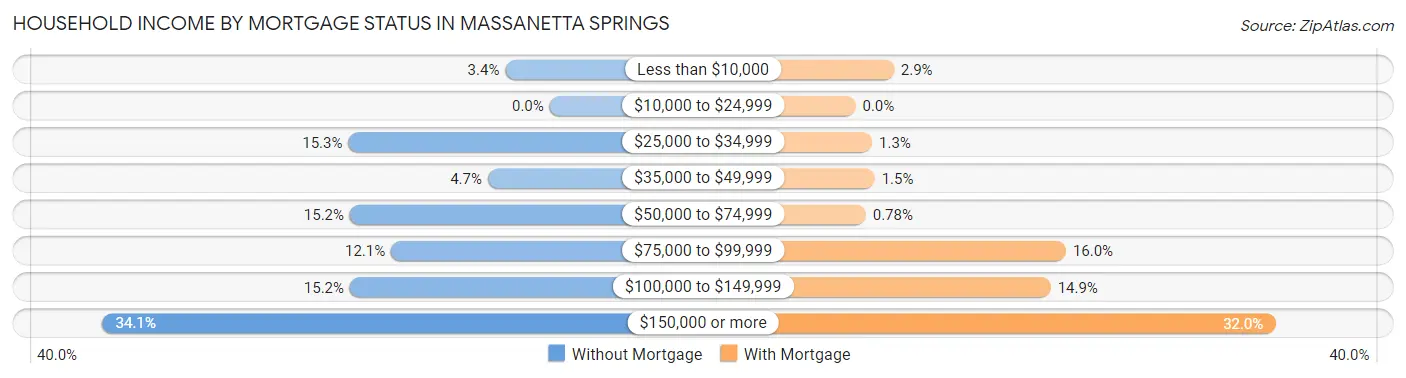
| Household Income | Without Mortgage | With Mortgage |
| Less than $10,000 | 28 (3.4%) | 30 (2.9%) |
| $10,000 to $24,999 | 0 (0.0%) | 0 (0.0%) |
| $25,000 to $34,999 | 127 (15.3%) | 13 (1.3%) |
| $35,000 to $49,999 | 39 (4.7%) | 15 (1.5%) |
| $50,000 to $74,999 | 126 (15.2%) | 8 (0.8%) |
| $75,000 to $99,999 | 100 (12.1%) | 165 (16.0%) |
| $100,000 to $149,999 | 126 (15.2%) | 153 (14.9%) |
| $150,000 or more | 282 (34.1%) | 329 (32.0%) |
| Total | 828 (100.0%) | 1,029 (100.0%) |
Property Value to Household Income Ratio in Massanetta Springs
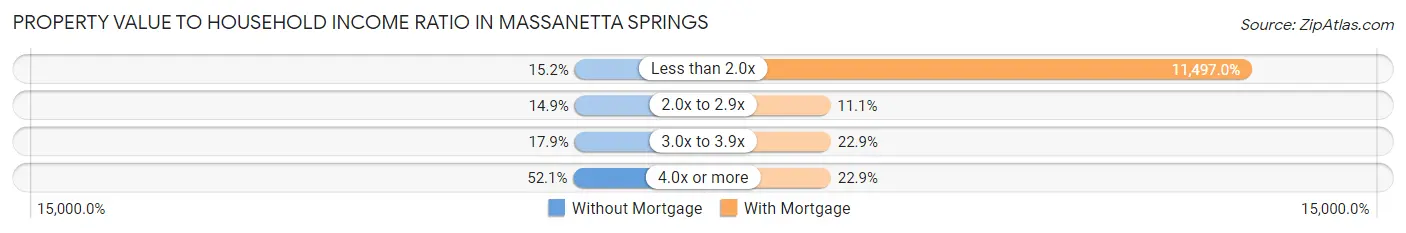
| Value-to-Income Ratio | Without Mortgage | With Mortgage |
| Less than 2.0x | 126 (15.2%) | 118,304 (11,497.0%) |
| 2.0x to 2.9x | 123 (14.9%) | 114 (11.1%) |
| 3.0x to 3.9x | 148 (17.9%) | 236 (22.9%) |
| 4.0x or more | 431 (52.0%) | 236 (22.9%) |
| Total | 828 (100.0%) | 1,029 (100.0%) |
Real Estate Taxes by Mortgage Status in Massanetta Springs
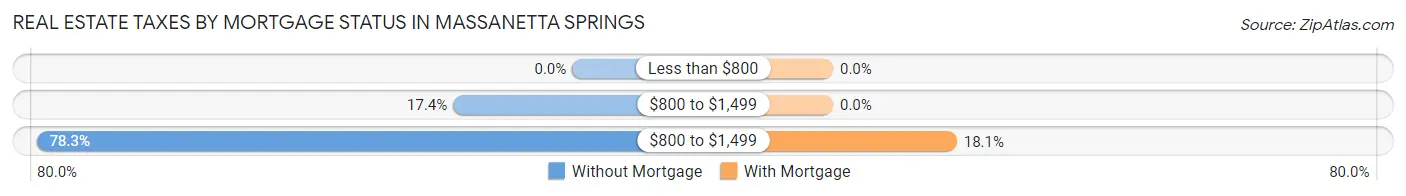
| Property Taxes | Without Mortgage | With Mortgage |
| Less than $800 | 0 (0.0%) | 0 (0.0%) |
| $800 to $1,499 | 144 (17.4%) | 0 (0.0%) |
| $800 to $1,499 | 648 (78.3%) | 186 (18.1%) |
| Total | 828 (100.0%) | 1,029 (100.0%) |
Health & Disability in Massanetta Springs
Health Insurance Coverage by Age in Massanetta Springs
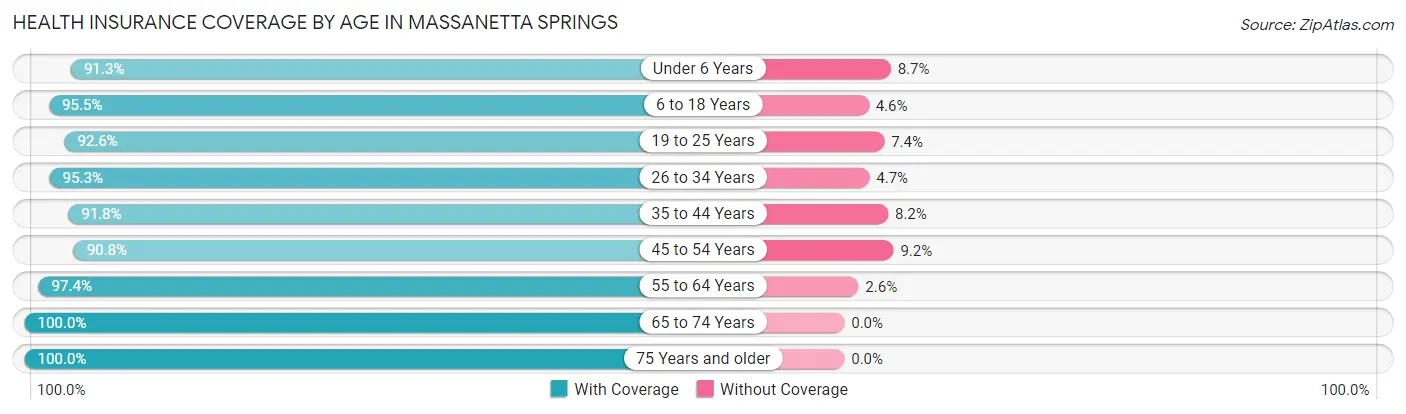
| Age Bracket | With Coverage | Without Coverage |
| Under 6 Years | 253 (91.3%) | 24 (8.7%) |
| 6 to 18 Years | 987 (95.5%) | 47 (4.5%) |
| 19 to 25 Years | 224 (92.6%) | 18 (7.4%) |
| 26 to 34 Years | 692 (95.3%) | 34 (4.7%) |
| 35 to 44 Years | 653 (91.8%) | 58 (8.2%) |
| 45 to 54 Years | 634 (90.8%) | 64 (9.2%) |
| 55 to 64 Years | 813 (97.4%) | 22 (2.6%) |
| 65 to 74 Years | 748 (100.0%) | 0 (0.0%) |
| 75 Years and older | 879 (100.0%) | 0 (0.0%) |
| Total | 5,883 (95.7%) | 267 (4.3%) |
Health Insurance Coverage by Citizenship Status in Massanetta Springs
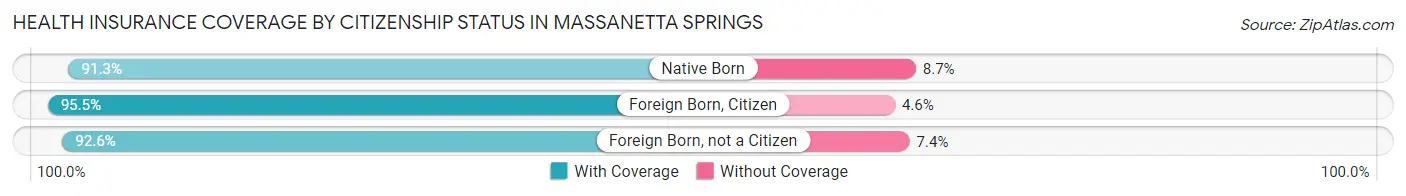
| Citizenship Status | With Coverage | Without Coverage |
| Native Born | 253 (91.3%) | 24 (8.7%) |
| Foreign Born, Citizen | 987 (95.5%) | 47 (4.5%) |
| Foreign Born, not a Citizen | 224 (92.6%) | 18 (7.4%) |
Health Insurance Coverage by Household Income in Massanetta Springs
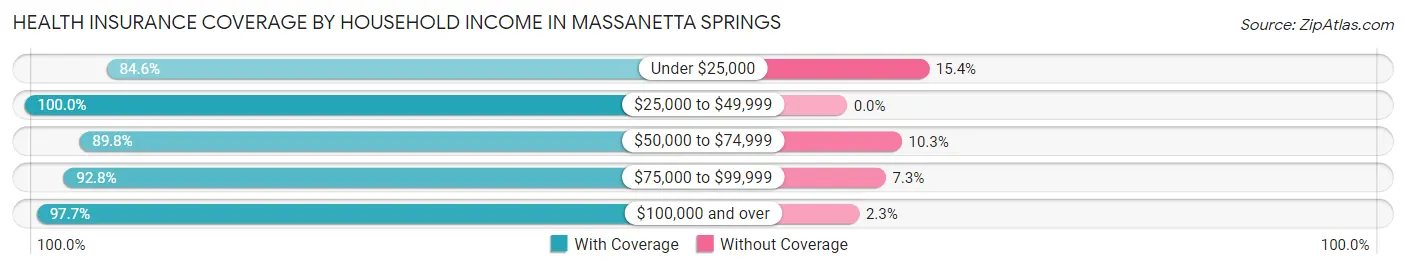
| Household Income | With Coverage | Without Coverage |
| Under $25,000 | 121 (84.6%) | 22 (15.4%) |
| $25,000 to $49,999 | 587 (100.0%) | 0 (0.0%) |
| $50,000 to $74,999 | 718 (89.7%) | 82 (10.2%) |
| $75,000 to $99,999 | 1,088 (92.7%) | 85 (7.2%) |
| $100,000 and over | 3,349 (97.7%) | 78 (2.3%) |
Public vs Private Health Insurance Coverage by Age in Massanetta Springs
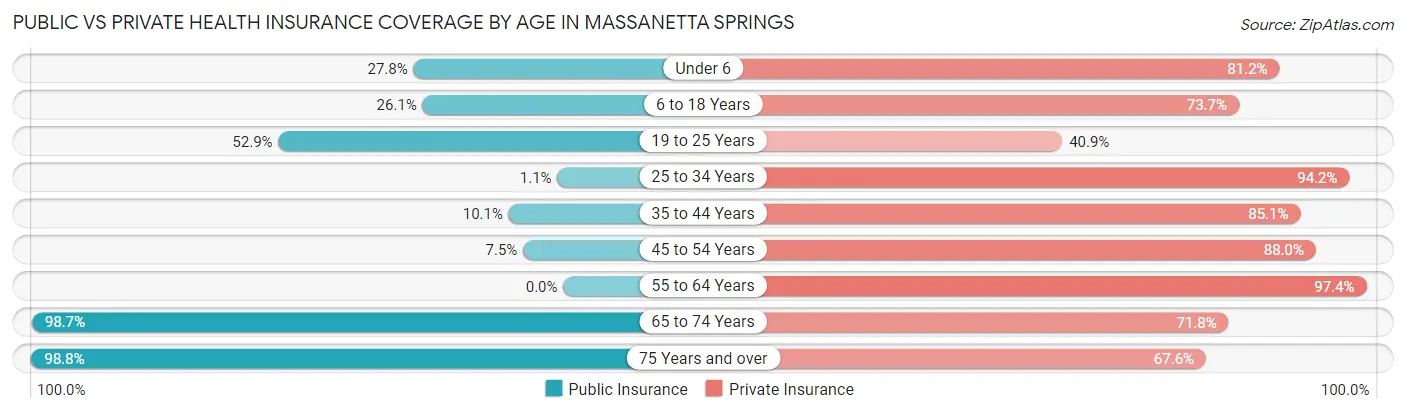
| Age Bracket | Public Insurance | Private Insurance |
| Under 6 | 77 (27.8%) | 225 (81.2%) |
| 6 to 18 Years | 270 (26.1%) | 762 (73.7%) |
| 19 to 25 Years | 128 (52.9%) | 99 (40.9%) |
| 25 to 34 Years | 8 (1.1%) | 684 (94.2%) |
| 35 to 44 Years | 72 (10.1%) | 605 (85.1%) |
| 45 to 54 Years | 52 (7.4%) | 614 (88.0%) |
| 55 to 64 Years | 0 (0.0%) | 813 (97.4%) |
| 65 to 74 Years | 738 (98.7%) | 537 (71.8%) |
| 75 Years and over | 868 (98.8%) | 594 (67.6%) |
| Total | 2,213 (36.0%) | 4,933 (80.2%) |
Disability Status by Sex by Age in Massanetta Springs
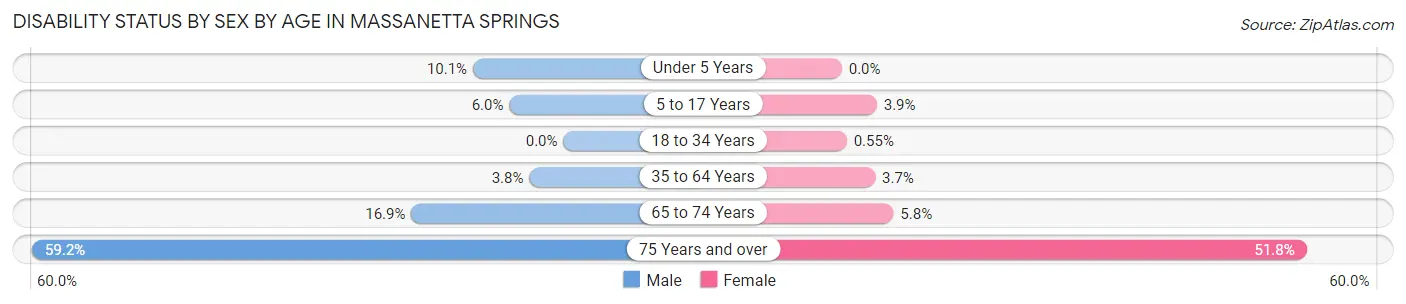
| Age Bracket | Male | Female |
| Under 5 Years | 15 (10.1%) | 0 (0.0%) |
| 5 to 17 Years | 31 (6.0%) | 17 (3.9%) |
| 18 to 34 Years | 0 (0.0%) | 3 (0.5%) |
| 35 to 64 Years | 37 (3.8%) | 47 (3.7%) |
| 65 to 74 Years | 53 (16.9%) | 25 (5.8%) |
| 75 Years and over | 232 (59.2%) | 252 (51.7%) |
Disability Class by Sex by Age in Massanetta Springs
Disability Class: Hearing Difficulty
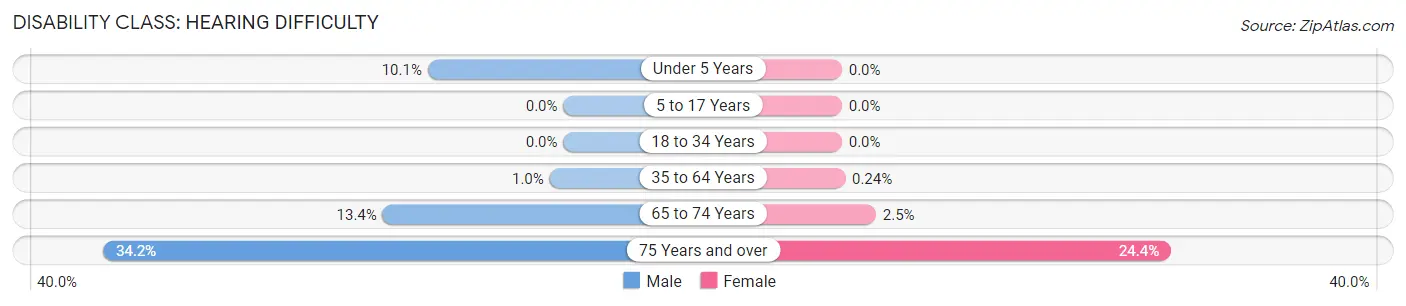
| Age Bracket | Male | Female |
| Under 5 Years | 15 (10.1%) | 0 (0.0%) |
| 5 to 17 Years | 0 (0.0%) | 0 (0.0%) |
| 18 to 34 Years | 0 (0.0%) | 0 (0.0%) |
| 35 to 64 Years | 10 (1.0%) | 3 (0.2%) |
| 65 to 74 Years | 42 (13.4%) | 11 (2.5%) |
| 75 Years and over | 134 (34.2%) | 119 (24.4%) |
Disability Class: Vision Difficulty
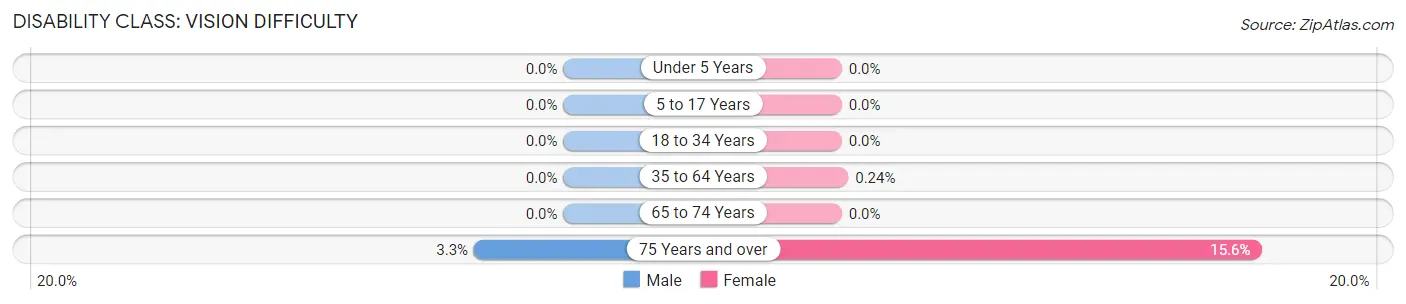
| Age Bracket | Male | Female |
| Under 5 Years | 0 (0.0%) | 0 (0.0%) |
| 5 to 17 Years | 0 (0.0%) | 0 (0.0%) |
| 18 to 34 Years | 0 (0.0%) | 0 (0.0%) |
| 35 to 64 Years | 0 (0.0%) | 3 (0.2%) |
| 65 to 74 Years | 0 (0.0%) | 0 (0.0%) |
| 75 Years and over | 13 (3.3%) | 76 (15.6%) |
Disability Class: Cognitive Difficulty
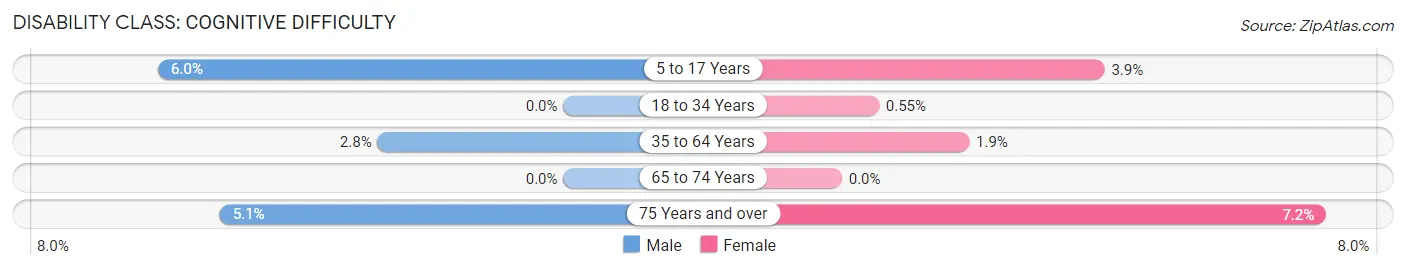
| Age Bracket | Male | Female |
| 5 to 17 Years | 31 (6.0%) | 17 (3.9%) |
| 18 to 34 Years | 0 (0.0%) | 3 (0.5%) |
| 35 to 64 Years | 27 (2.8%) | 24 (1.9%) |
| 65 to 74 Years | 0 (0.0%) | 0 (0.0%) |
| 75 Years and over | 20 (5.1%) | 35 (7.2%) |
Disability Class: Ambulatory Difficulty
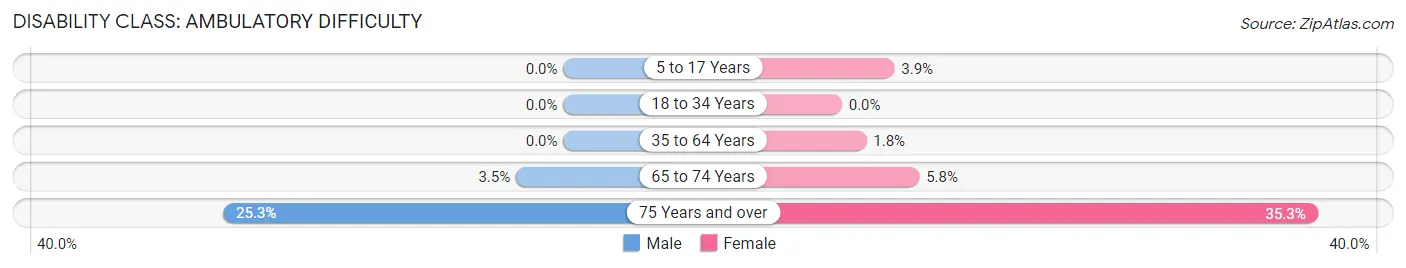
| Age Bracket | Male | Female |
| 5 to 17 Years | 0 (0.0%) | 17 (3.9%) |
| 18 to 34 Years | 0 (0.0%) | 0 (0.0%) |
| 35 to 64 Years | 0 (0.0%) | 23 (1.8%) |
| 65 to 74 Years | 11 (3.5%) | 25 (5.8%) |
| 75 Years and over | 99 (25.3%) | 172 (35.3%) |
Disability Class: Self-Care Difficulty
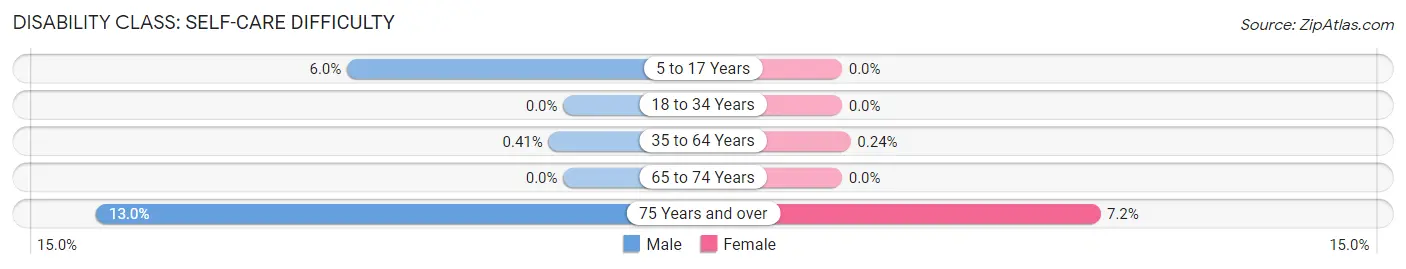
| Age Bracket | Male | Female |
| 5 to 17 Years | 31 (6.0%) | 0 (0.0%) |
| 18 to 34 Years | 0 (0.0%) | 0 (0.0%) |
| 35 to 64 Years | 4 (0.4%) | 3 (0.2%) |
| 65 to 74 Years | 0 (0.0%) | 0 (0.0%) |
| 75 Years and over | 51 (13.0%) | 35 (7.2%) |
Technology Access in Massanetta Springs
Computing Device Access in Massanetta Springs
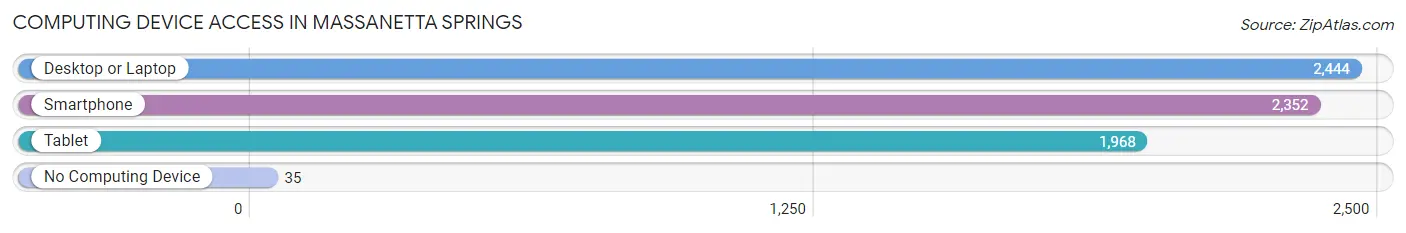
| Device Type | # Households | % Households |
| Desktop or Laptop | 2,444 | 94.2% |
| Smartphone | 2,352 | 90.6% |
| Tablet | 1,968 | 75.8% |
| No Computing Device | 35 | 1.3% |
| Total | 2,595 | 100.0% |
Internet Access in Massanetta Springs
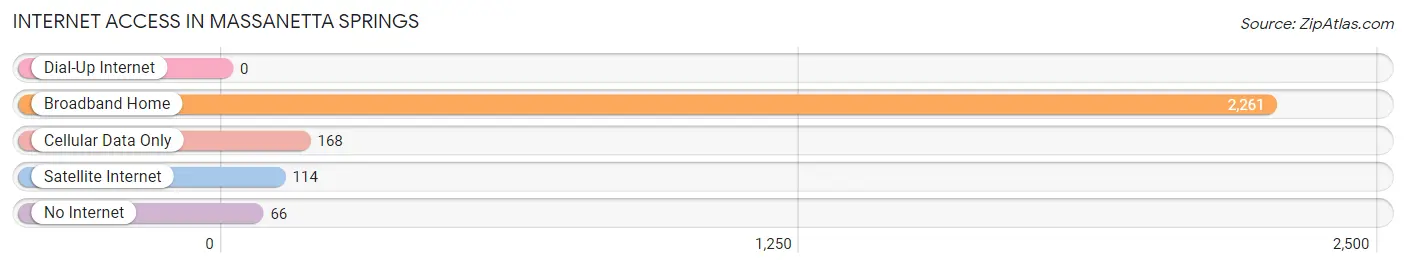
| Internet Type | # Households | % Households |
| Dial-Up Internet | 0 | 0.0% |
| Broadband Home | 2,261 | 87.1% |
| Cellular Data Only | 168 | 6.5% |
| Satellite Internet | 114 | 4.4% |
| No Internet | 66 | 2.5% |
| Total | 2,595 | 100.0% |
Massanetta Springs Summary
History
Massanetta Springs is a small unincorporated community located in Rockingham County, Virginia. It is situated in the Shenandoah Valley, approximately 10 miles south of Harrisonburg. The area was first settled in the late 1700s by German immigrants, and the community was officially established in 1820. The name “Massanetta” is derived from the Native American word for “big spring”, which is a reference to the large spring located in the area.
The community was originally a farming and milling center, and the spring was used to power a grist mill and a saw mill. In the late 1800s, the area began to develop as a resort destination, and the Massanetta Springs Hotel was built in 1891. The hotel was a popular destination for visitors from the nearby cities of Harrisonburg and Staunton, and it was known for its mineral springs, which were believed to have healing properties. The hotel was destroyed by fire in the early 1900s, but the area continued to be a popular destination for visitors.
In the early 1900s, the Massanetta Springs Camp and Conference Center was established. The camp was founded by the Presbyterian Church and is still in operation today. It is a popular destination for church retreats, conferences, and other events.
Geography
Massanetta Springs is located in the Shenandoah Valley of Virginia, approximately 10 miles south of Harrisonburg. The area is characterized by rolling hills and valleys, and is part of the Appalachian Mountains. The area is known for its scenic beauty, and is home to a variety of wildlife, including deer, bear, and wild turkey.
The community is situated along the North Fork of the Shenandoah River, and is surrounded by the George Washington National Forest. The area is also home to a variety of recreational activities, including fishing, hunting, camping, and hiking.
Economy
The economy of Massanetta Springs is largely based on tourism and agriculture. The area is home to a variety of farms, and the local economy is supported by the sale of produce, livestock, and other agricultural products. The area is also home to a variety of small businesses, including restaurants, shops, and other services.
The Massanetta Springs Camp and Conference Center is a major employer in the area, and it is a popular destination for church retreats, conferences, and other events. The camp also offers a variety of recreational activities, including swimming, fishing, and hiking.
Demographics
As of the 2010 census, the population of Massanetta Springs was 1,845. The population is largely white (94.3%), with a small percentage of African Americans (2.3%) and Hispanics (2.2%). The median household income is $45,000, and the median age is 44. The area is largely rural, with a population density of just 28 people per square mile.
Common Questions
What is Per Capita Income in Massanetta Springs?
Per Capita income in Massanetta Springs is $57,084.
What is the Median Family Income in Massanetta Springs?
Median Family Income in Massanetta Springs is $113,514.
What is the Median Household income in Massanetta Springs?
Median Household Income in Massanetta Springs is $99,740.
What is Income or Wage Gap in Massanetta Springs?
Income or Wage Gap in Massanetta Springs is 45.0%.
Women in Massanetta Springs earn 55.0 cents for every dollar earned by a man.
What is Inequality or Gini Index in Massanetta Springs?
Inequality or Gini Index in Massanetta Springs is 0.43.
What is the Total Population of Massanetta Springs?
Total Population of Massanetta Springs is 6,254.
What is the Total Male Population of Massanetta Springs?
Total Male Population of Massanetta Springs is 2,875.
What is the Total Female Population of Massanetta Springs?
Total Female Population of Massanetta Springs is 3,379.
What is the Ratio of Males per 100 Females in Massanetta Springs?
There are 85.08 Males per 100 Females in Massanetta Springs.
What is the Ratio of Females per 100 Males in Massanetta Springs?
There are 117.53 Females per 100 Males in Massanetta Springs.
What is the Median Population Age in Massanetta Springs?
Median Population Age in Massanetta Springs is 47.1 Years.
What is the Average Family Size in Massanetta Springs
Average Family Size in Massanetta Springs is 3.0 People.
What is the Average Household Size in Massanetta Springs
Average Household Size in Massanetta Springs is 2.4 People.
How Large is the Labor Force in Massanetta Springs?
There are 3,191 People in the Labor Forcein in Massanetta Springs.
What is the Percentage of People in the Labor Force in Massanetta Springs?
62.8% of People are in the Labor Force in Massanetta Springs.
What is the Unemployment Rate in Massanetta Springs?
Unemployment Rate in Massanetta Springs is 3.4%.