Stanley, VA Map & Demographics
Stanley Map
Stanley Overview
$28,382
PER CAPITA INCOME
$60,000
AVG FAMILY INCOME
$42,976
AVG HOUSEHOLD INCOME
19.3%
WAGE / INCOME GAP [ % ]
80.7¢/ $1
WAGE / INCOME GAP [ $ ]
0.47
INEQUALITY / GINI INDEX
1,811
TOTAL POPULATION
919
MALE POPULATION
892
FEMALE POPULATION
103.03
MALES / 100 FEMALES
97.06
FEMALES / 100 MALES
41.1
MEDIAN AGE
3.8
AVG FAMILY SIZE
2.9
AVG HOUSEHOLD SIZE
1,010
LABOR FORCE [ PEOPLE ]
65.6%
PERCENT IN LABOR FORCE
5.9%
UNEMPLOYMENT RATE
Stanley Zip Codes
Stanley Area Codes
Income in Stanley
Income Overview in Stanley
Per Capita Income in Stanley is $28,382, while median incomes of families and households are $60,000 and $42,976 respectively.
| Characteristic | Number | Measure |
| Per Capita Income | 1,811 | $28,382 |
| Median Family Income | 372 | $60,000 |
| Mean Family Income | 372 | $75,196 |
| Median Household Income | 620 | $42,976 |
| Mean Household Income | 620 | $62,023 |
| Income Deficit | 372 | $0 |
| Wage / Income Gap (%) | 1,811 | 19.26% |
| Wage / Income Gap ($) | 1,811 | 80.74¢ per $1 |
| Gini / Inequality Index | 1,811 | 0.47 |
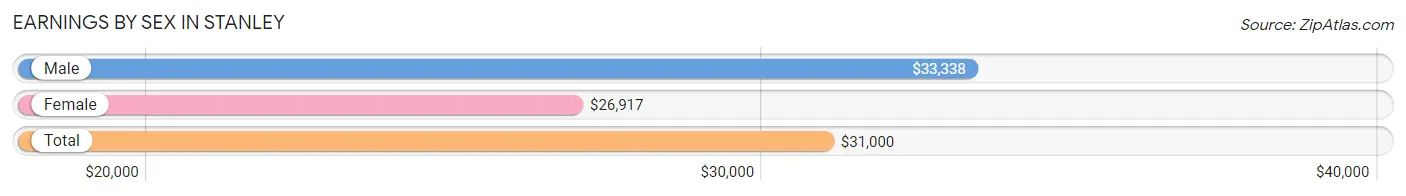
Earnings by Sex in Stanley
Average Earnings in Stanley are $31,000, $33,338 for men and $26,917 for women, a difference of 19.3%.
| Sex | Number | Average Earnings |
| Male | 571 (55.3%) | $33,338 |
| Female | 461 (44.7%) | $26,917 |
| Total | 1,032 (100.0%) | $31,000 |
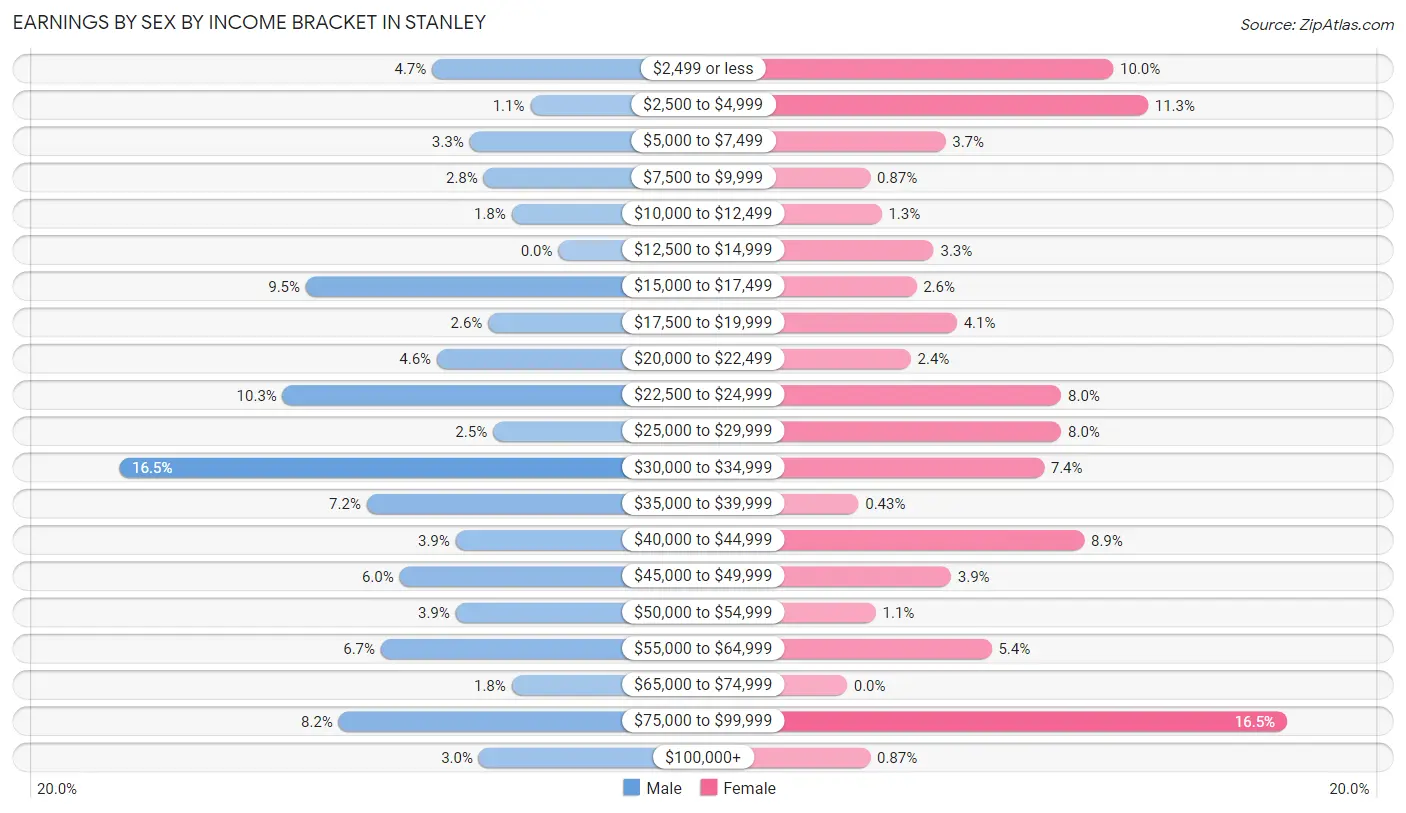
Earnings by Sex by Income Bracket in Stanley
The most common earnings brackets in Stanley are $30,000 to $34,999 for men (94 | 16.5%) and $75,000 to $99,999 for women (76 | 16.5%).
| Income | Male | Female |
| $2,499 or less | 27 (4.7%) | 46 (10.0%) |
| $2,500 to $4,999 | 6 (1.1%) | 52 (11.3%) |
| $5,000 to $7,499 | 19 (3.3%) | 17 (3.7%) |
| $7,500 to $9,999 | 16 (2.8%) | 4 (0.9%) |
| $10,000 to $12,499 | 10 (1.8%) | 6 (1.3%) |
| $12,500 to $14,999 | 0 (0.0%) | 15 (3.3%) |
| $15,000 to $17,499 | 54 (9.5%) | 12 (2.6%) |
| $17,500 to $19,999 | 15 (2.6%) | 19 (4.1%) |
| $20,000 to $22,499 | 26 (4.5%) | 11 (2.4%) |
| $22,500 to $24,999 | 59 (10.3%) | 37 (8.0%) |
| $25,000 to $29,999 | 14 (2.5%) | 37 (8.0%) |
| $30,000 to $34,999 | 94 (16.5%) | 34 (7.4%) |
| $35,000 to $39,999 | 41 (7.2%) | 2 (0.4%) |
| $40,000 to $44,999 | 22 (3.8%) | 41 (8.9%) |
| $45,000 to $49,999 | 34 (5.9%) | 18 (3.9%) |
| $50,000 to $54,999 | 22 (3.8%) | 5 (1.1%) |
| $55,000 to $64,999 | 38 (6.7%) | 25 (5.4%) |
| $65,000 to $74,999 | 10 (1.8%) | 0 (0.0%) |
| $75,000 to $99,999 | 47 (8.2%) | 76 (16.5%) |
| $100,000+ | 17 (3.0%) | 4 (0.9%) |
| Total | 571 (100.0%) | 461 (100.0%) |
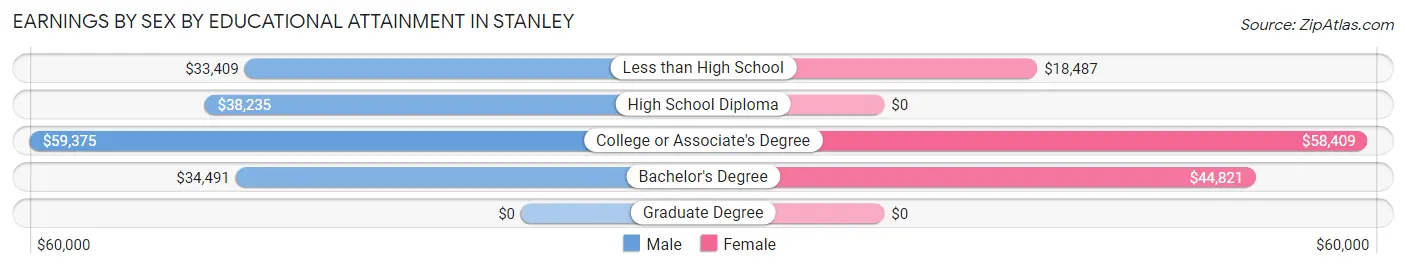
Earnings by Sex by Educational Attainment in Stanley
Average earnings in Stanley are $37,240 for men and $28,403 for women, a difference of 23.7%. Men with an educational attainment of college or associate's degree enjoy the highest average annual earnings of $59,375, while those with less than high school education earn the least with $33,409. Women with an educational attainment of college or associate's degree earn the most with the average annual earnings of $58,409, while those with less than high school education have the smallest earnings of $18,487.
| Educational Attainment | Male Income | Female Income |
| Less than High School | $33,409 | $18,487 |
| High School Diploma | $38,235 | $0 |
| College or Associate's Degree | $59,375 | $58,409 |
| Bachelor's Degree | $34,491 | $44,821 |
| Graduate Degree | - | - |
| Total | $37,240 | $28,403 |
Family Income in Stanley
Family Income Brackets in Stanley
According to the Stanley family income data, there are 90 families falling into the $100,000 to $149,999 income range, which is the most common income bracket and makes up 24.2% of all families. Conversely, the $150,000 to $199,999 income bracket is the least frequent group with only 5 families (1.3%) belonging to this category.
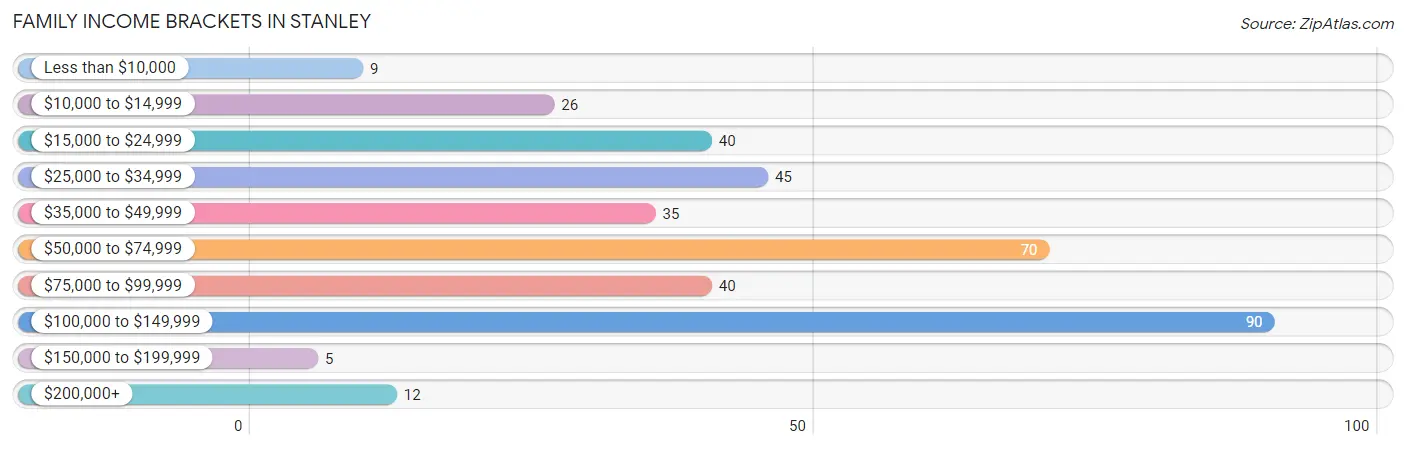
| Income Bracket | # Families | % Families |
| Less than $10,000 | 9 | 2.4% |
| $10,000 to $14,999 | 26 | 7.0% |
| $15,000 to $24,999 | 40 | 10.8% |
| $25,000 to $34,999 | 45 | 12.1% |
| $35,000 to $49,999 | 35 | 9.4% |
| $50,000 to $74,999 | 70 | 18.8% |
| $75,000 to $99,999 | 40 | 10.8% |
| $100,000 to $149,999 | 90 | 24.2% |
| $150,000 to $199,999 | 5 | 1.3% |
| $200,000+ | 12 | 3.2% |
Family Income by Famaliy Size in Stanley
4-person families (50 | 13.4%) account for the highest median family income in Stanley with $112,917 per family, while 4-person families (50 | 13.4%) have the highest median income of $28,229 per family member.
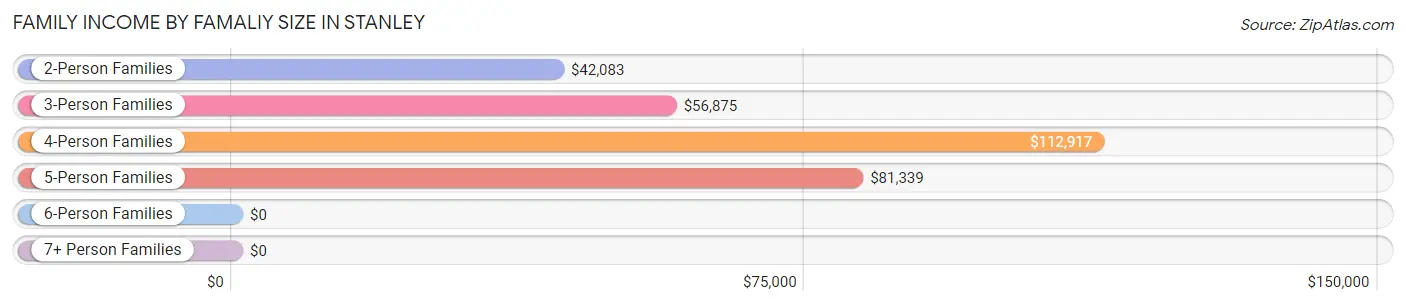
| Income Bracket | # Families | Median Income |
| 2-Person Families | 191 (51.3%) | $42,083 |
| 3-Person Families | 89 (23.9%) | $56,875 |
| 4-Person Families | 50 (13.4%) | $112,917 |
| 5-Person Families | 29 (7.8%) | $81,339 |
| 6-Person Families | 13 (3.5%) | $0 |
| 7+ Person Families | 0 (0.0%) | $0 |
| Total | 372 (100.0%) | $60,000 |
Family Income by Number of Earners in Stanley
The median family income in Stanley is $60,000, with families comprising 3+ earners (43) having the highest median family income of $131,250, while families with no earners (82) have the lowest median family income of $22,188, accounting for 11.6% and 22.0% of families, respectively.
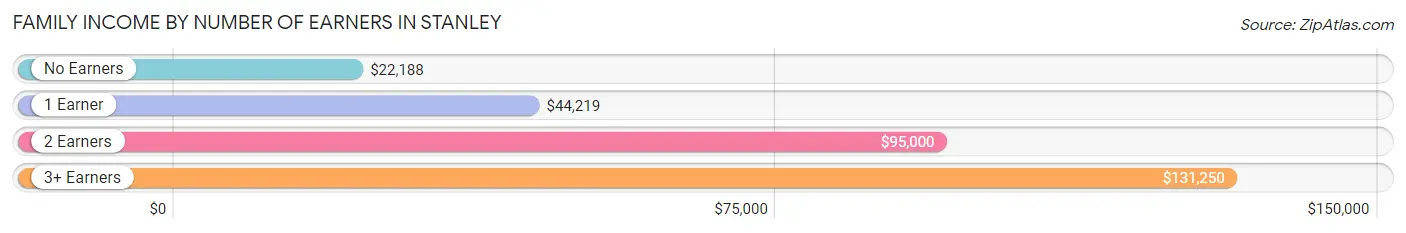
| Number of Earners | # Families | Median Income |
| No Earners | 82 (22.0%) | $22,188 |
| 1 Earner | 135 (36.3%) | $44,219 |
| 2 Earners | 112 (30.1%) | $95,000 |
| 3+ Earners | 43 (11.6%) | $131,250 |
| Total | 372 (100.0%) | $60,000 |
Household Income in Stanley
Household Income Brackets in Stanley
With 117 households falling in the category, the $100,000 to $149,999 income range is the most frequent in Stanley, accounting for 18.9% of all households. In contrast, only 9 households (1.5%) fall into the $150,000 to $199,999 income bracket, making it the least populous group.
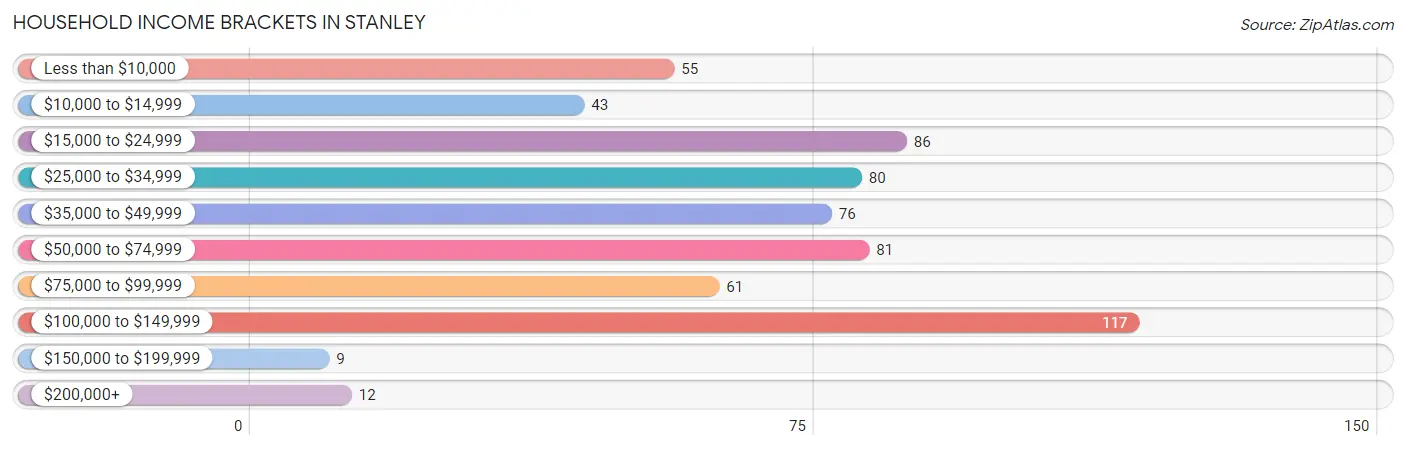
| Income Bracket | # Households | % Households |
| Less than $10,000 | 55 | 8.9% |
| $10,000 to $14,999 | 43 | 6.9% |
| $15,000 to $24,999 | 86 | 13.9% |
| $25,000 to $34,999 | 80 | 12.9% |
| $35,000 to $49,999 | 76 | 12.3% |
| $50,000 to $74,999 | 81 | 13.1% |
| $75,000 to $99,999 | 61 | 9.8% |
| $100,000 to $149,999 | 117 | 18.9% |
| $150,000 to $199,999 | 9 | 1.5% |
| $200,000+ | 12 | 1.9% |
Household Income by Householder Age in Stanley
The median household income in Stanley is $42,976, with the highest median household income of $76,250 found in the 25 to 44 years age bracket for the primary householder. A total of 170 households (27.4%) fall into this category. Meanwhile, the 15 to 24 years age bracket for the primary householder has the lowest median household income of $0, with 20 households (3.2%) in this group.
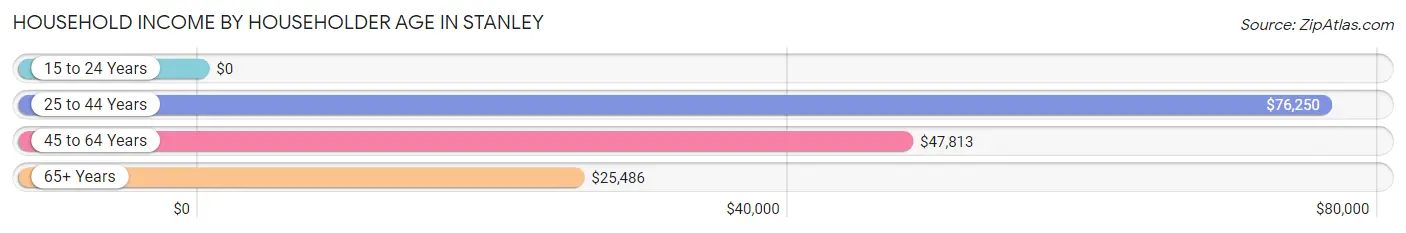
| Income Bracket | # Households | Median Income |
| 15 to 24 Years | 20 (3.2%) | $0 |
| 25 to 44 Years | 170 (27.4%) | $76,250 |
| 45 to 64 Years | 217 (35.0%) | $47,813 |
| 65+ Years | 213 (34.4%) | $25,486 |
| Total | 620 (100.0%) | $42,976 |
Poverty in Stanley
Income Below Poverty by Sex and Age in Stanley
With 12.2% poverty level for males and 16.1% for females among the residents of Stanley, 12 to 14 year old males and 65 to 74 year old females are the most vulnerable to poverty, with 3 males (23.1%) and 66 females (43.1%) in their respective age groups living below the poverty level.
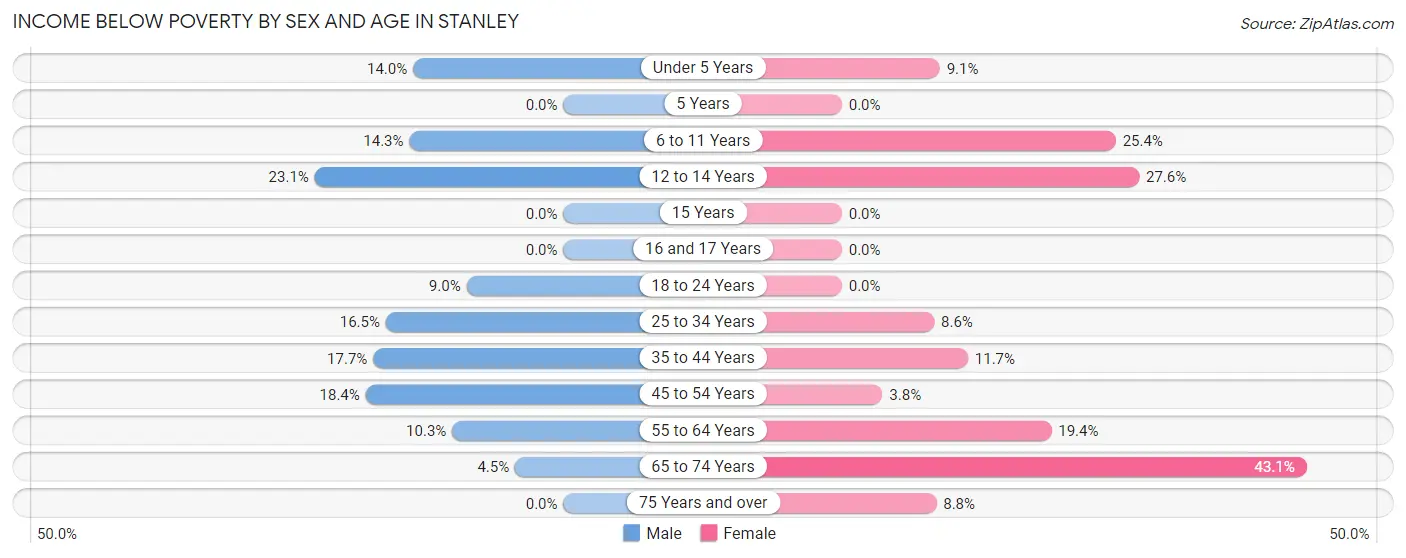
| Age Bracket | Male | Female |
| Under 5 Years | 6 (14.0%) | 3 (9.1%) |
| 5 Years | 0 (0.0%) | 0 (0.0%) |
| 6 to 11 Years | 6 (14.3%) | 15 (25.4%) |
| 12 to 14 Years | 3 (23.1%) | 8 (27.6%) |
| 15 Years | 0 (0.0%) | 0 (0.0%) |
| 16 and 17 Years | 0 (0.0%) | 0 (0.0%) |
| 18 to 24 Years | 16 (9.0%) | 0 (0.0%) |
| 25 to 34 Years | 15 (16.5%) | 9 (8.6%) |
| 35 to 44 Years | 30 (17.6%) | 11 (11.7%) |
| 45 to 54 Years | 20 (18.3%) | 6 (3.8%) |
| 55 to 64 Years | 13 (10.3%) | 21 (19.4%) |
| 65 to 74 Years | 3 (4.5%) | 66 (43.1%) |
| 75 Years and over | 0 (0.0%) | 5 (8.8%) |
| Total | 112 (12.2%) | 144 (16.1%) |
Income Above Poverty by Sex and Age in Stanley
According to the poverty statistics in Stanley, males aged 5 years and females aged 5 years are the age groups that are most secure financially, with 100.0% of males and 100.0% of females in these age groups living above the poverty line.
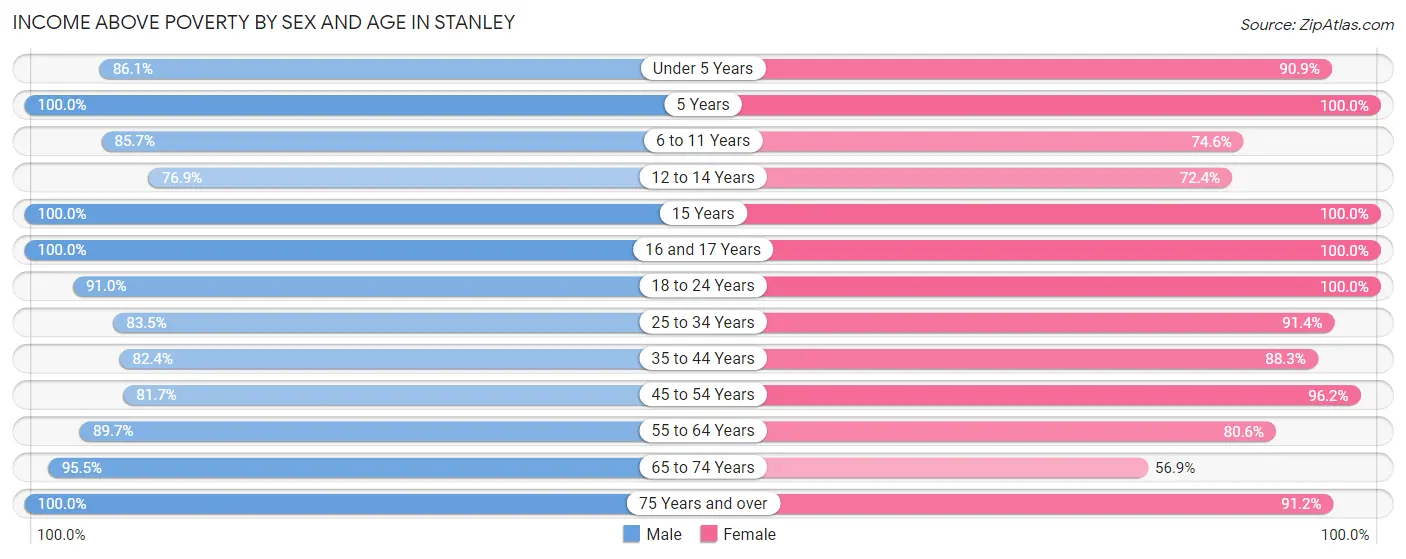
| Age Bracket | Male | Female |
| Under 5 Years | 37 (86.1%) | 30 (90.9%) |
| 5 Years | 15 (100.0%) | 8 (100.0%) |
| 6 to 11 Years | 36 (85.7%) | 44 (74.6%) |
| 12 to 14 Years | 10 (76.9%) | 21 (72.4%) |
| 15 Years | 7 (100.0%) | 23 (100.0%) |
| 16 and 17 Years | 6 (100.0%) | 10 (100.0%) |
| 18 to 24 Years | 162 (91.0%) | 54 (100.0%) |
| 25 to 34 Years | 76 (83.5%) | 96 (91.4%) |
| 35 to 44 Years | 140 (82.4%) | 83 (88.3%) |
| 45 to 54 Years | 89 (81.7%) | 153 (96.2%) |
| 55 to 64 Years | 113 (89.7%) | 87 (80.6%) |
| 65 to 74 Years | 64 (95.5%) | 87 (56.9%) |
| 75 Years and over | 52 (100.0%) | 52 (91.2%) |
| Total | 807 (87.8%) | 748 (83.9%) |
Income Below Poverty Among Married-Couple Families in Stanley
The poverty statistics for married-couple families in Stanley show that 4.8% or 11 of the total 231 families live below the poverty line. Families with no children have the highest poverty rate of 8.0%, comprising of 11 families. On the other hand, families with 1 or 2 children have the lowest poverty rate of 0.0%, which includes 0 families.
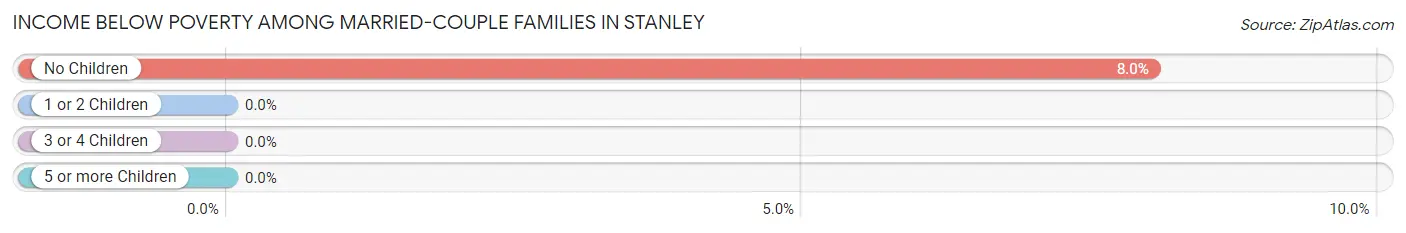
| Children | Above Poverty | Below Poverty |
| No Children | 126 (92.0%) | 11 (8.0%) |
| 1 or 2 Children | 73 (100.0%) | 0 (0.0%) |
| 3 or 4 Children | 21 (100.0%) | 0 (0.0%) |
| 5 or more Children | 0 (0.0%) | 0 (0.0%) |
| Total | 220 (95.2%) | 11 (4.8%) |
Income Below Poverty Among Single-Parent Households in Stanley
According to the poverty data in Stanley, 23.8% or 10 single-father households and 25.3% or 25 single-mother households are living below the poverty line. Among single-father households, those with 1 or 2 children have the highest poverty rate, with 10 households (52.6%) experiencing poverty. Likewise, among single-mother households, those with 3 or 4 children have the highest poverty rate, with 4 households (80.0%) falling below the poverty line.
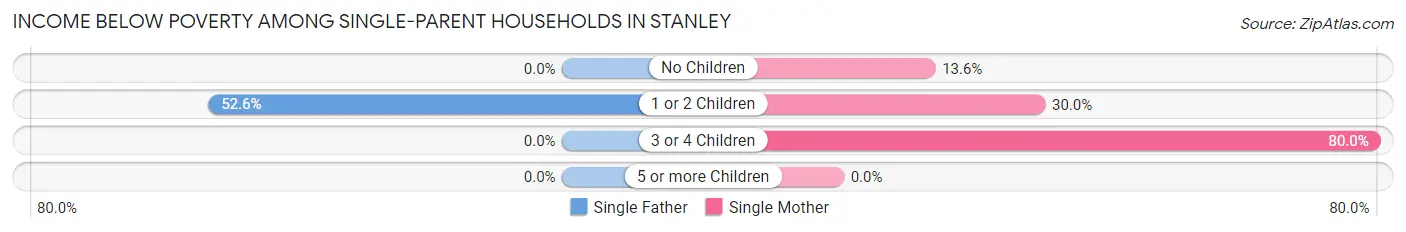
| Children | Single Father | Single Mother |
| No Children | 0 (0.0%) | 6 (13.6%) |
| 1 or 2 Children | 10 (52.6%) | 15 (30.0%) |
| 3 or 4 Children | 0 (0.0%) | 4 (80.0%) |
| 5 or more Children | 0 (0.0%) | 0 (0.0%) |
| Total | 10 (23.8%) | 25 (25.3%) |
Income Below Poverty Among Married-Couple vs Single-Parent Households in Stanley
The poverty data for Stanley shows that 11 of the married-couple family households (4.8%) and 35 of the single-parent households (24.8%) are living below the poverty level. Within the married-couple family households, those with no children have the highest poverty rate, with 11 households (8.0%) falling below the poverty line. Among the single-parent households, those with 3 or 4 children have the highest poverty rate, with 4 household (80.0%) living below poverty.
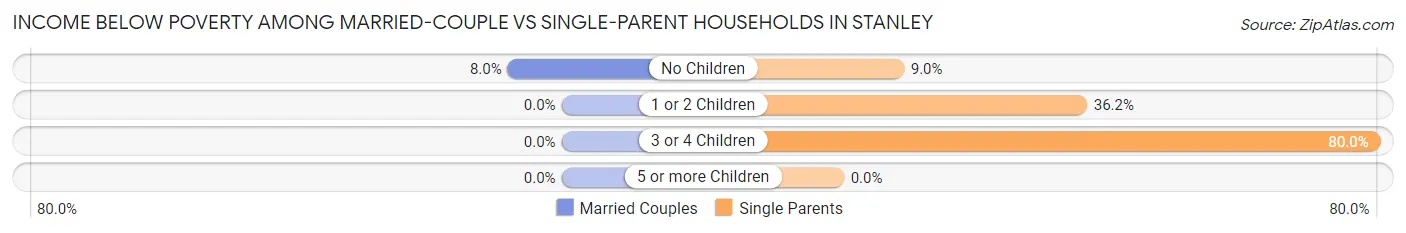
| Children | Married-Couple Families | Single-Parent Households |
| No Children | 11 (8.0%) | 6 (9.0%) |
| 1 or 2 Children | 0 (0.0%) | 25 (36.2%) |
| 3 or 4 Children | 0 (0.0%) | 4 (80.0%) |
| 5 or more Children | 0 (0.0%) | 0 (0.0%) |
| Total | 11 (4.8%) | 35 (24.8%) |
Race in Stanley
The most populous races in Stanley are White / Caucasian (1,750 | 96.6%), Two or more Races (44 | 2.4%), and Hispanic or Latino (31 | 1.7%).
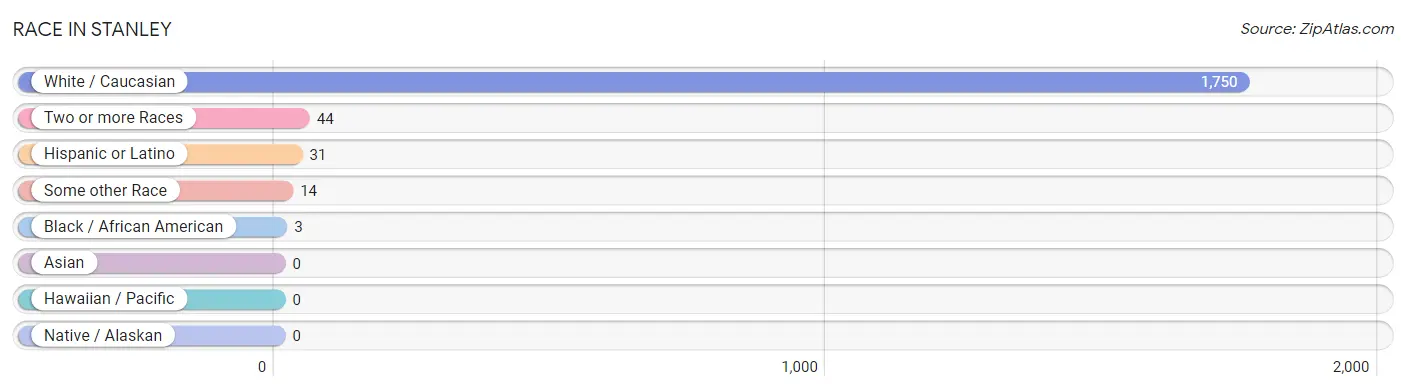
| Race | # Population | % Population |
| Asian | 0 | 0.0% |
| Black / African American | 3 | 0.2% |
| Hawaiian / Pacific | 0 | 0.0% |
| Hispanic or Latino | 31 | 1.7% |
| Native / Alaskan | 0 | 0.0% |
| White / Caucasian | 1,750 | 96.6% |
| Two or more Races | 44 | 2.4% |
| Some other Race | 14 | 0.8% |
| Total | 1,811 | 100.0% |
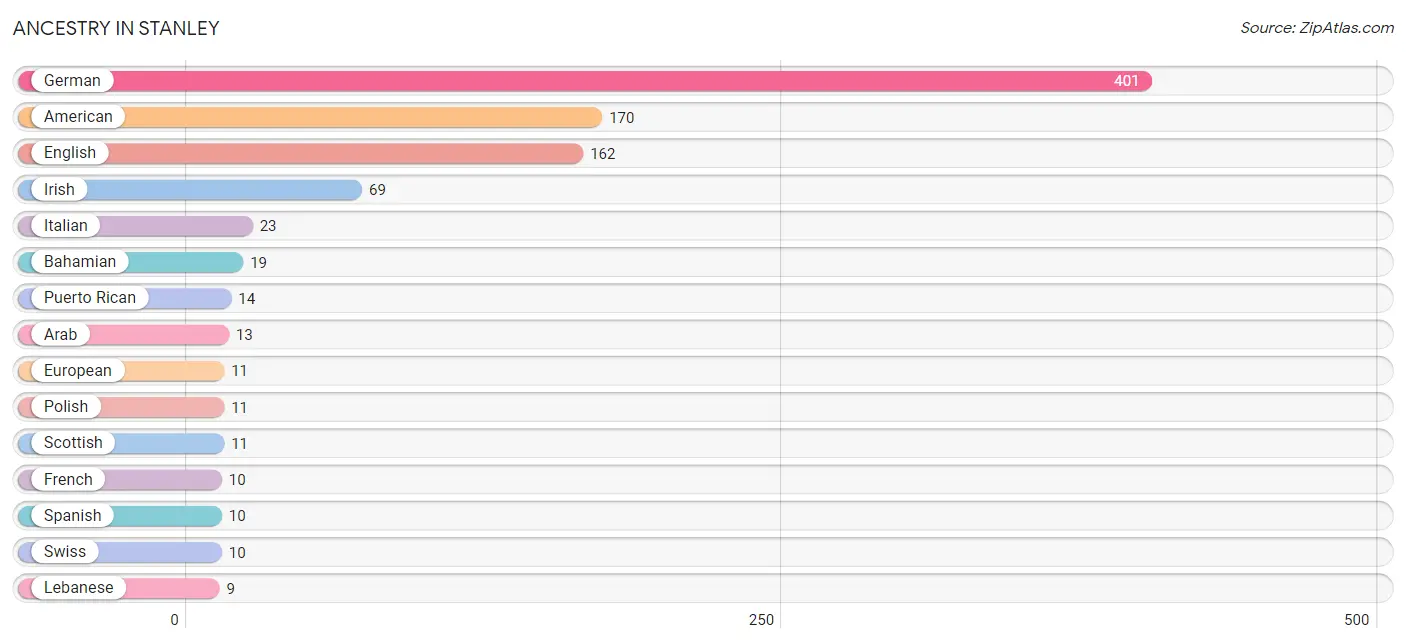
Ancestry in Stanley
The most populous ancestries reported in Stanley are German (401 | 22.1%), American (170 | 9.4%), English (162 | 8.9%), Irish (69 | 3.8%), and Italian (23 | 1.3%), together accounting for 45.6% of all Stanley residents.
| Ancestry | # Population | % Population |
| American | 170 | 9.4% |
| Arab | 13 | 0.7% |
| Bahamian | 19 | 1.1% |
| Belgian | 4 | 0.2% |
| Bhutanese | 2 | 0.1% |
| British | 6 | 0.3% |
| Central American | 3 | 0.2% |
| Costa Rican | 3 | 0.2% |
| Danish | 1 | 0.1% |
| English | 162 | 8.9% |
| European | 11 | 0.6% |
| Finnish | 3 | 0.2% |
| French | 10 | 0.5% |
| German | 401 | 22.1% |
| Irish | 69 | 3.8% |
| Italian | 23 | 1.3% |
| Korean | 5 | 0.3% |
| Lebanese | 9 | 0.5% |
| Mexican | 4 | 0.2% |
| Moroccan | 4 | 0.2% |
| Navajo | 3 | 0.2% |
| Northern European | 2 | 0.1% |
| Norwegian | 3 | 0.2% |
| Polish | 11 | 0.6% |
| Puerto Rican | 14 | 0.8% |
| Russian | 2 | 0.1% |
| Scotch-Irish | 2 | 0.1% |
| Scottish | 11 | 0.6% |
| Spanish | 10 | 0.5% |
| Swedish | 3 | 0.2% |
| Swiss | 10 | 0.5% |
| Welsh | 2 | 0.1% | View All 32 Rows |
Immigrants in Stanley
The most numerous immigrant groups reported in Stanley came from Asia (9 | 0.5%), Western Asia (9 | 0.5%), Kuwait (6 | 0.3%), Latin America (6 | 0.3%), and Africa (4 | 0.2%), together accounting for 1.9% of all Stanley residents.
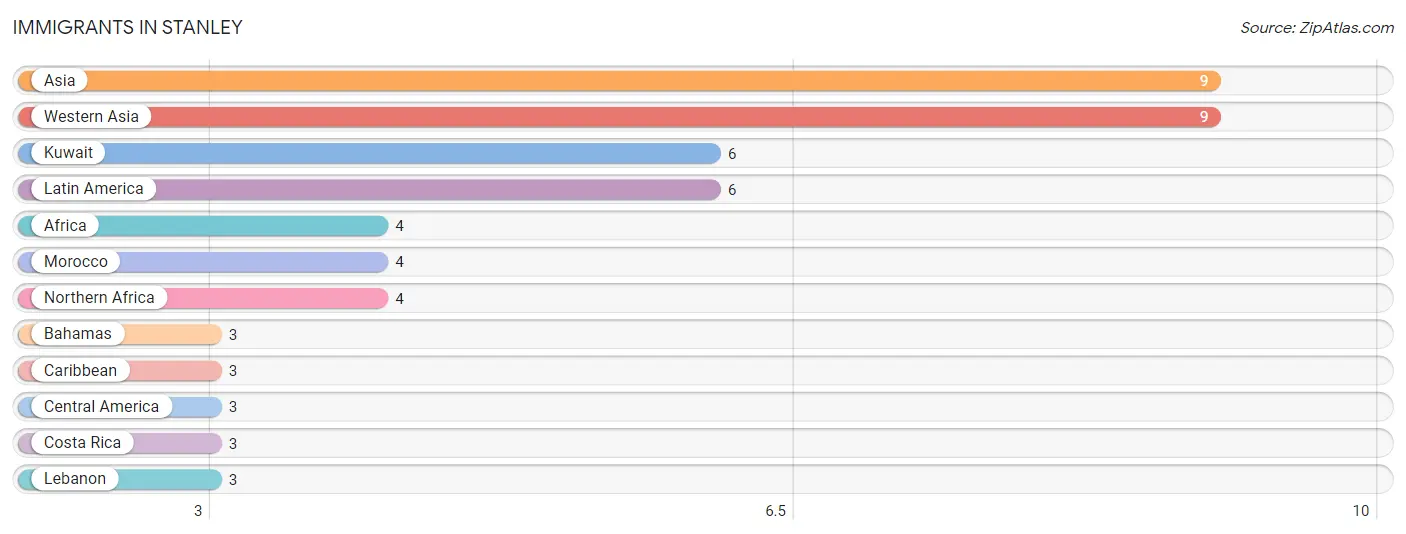
| Immigration Origin | # Population | % Population |
| Africa | 4 | 0.2% |
| Asia | 9 | 0.5% |
| Bahamas | 3 | 0.2% |
| Caribbean | 3 | 0.2% |
| Central America | 3 | 0.2% |
| Costa Rica | 3 | 0.2% |
| Kuwait | 6 | 0.3% |
| Latin America | 6 | 0.3% |
| Lebanon | 3 | 0.2% |
| Morocco | 4 | 0.2% |
| Northern Africa | 4 | 0.2% |
| Western Asia | 9 | 0.5% | View All 12 Rows |
Sex and Age in Stanley
Sex and Age in Stanley
The most populous age groups in Stanley are 20 to 24 Years (129 | 14.0%) for men and 65 to 69 Years (122 | 13.7%) for women.
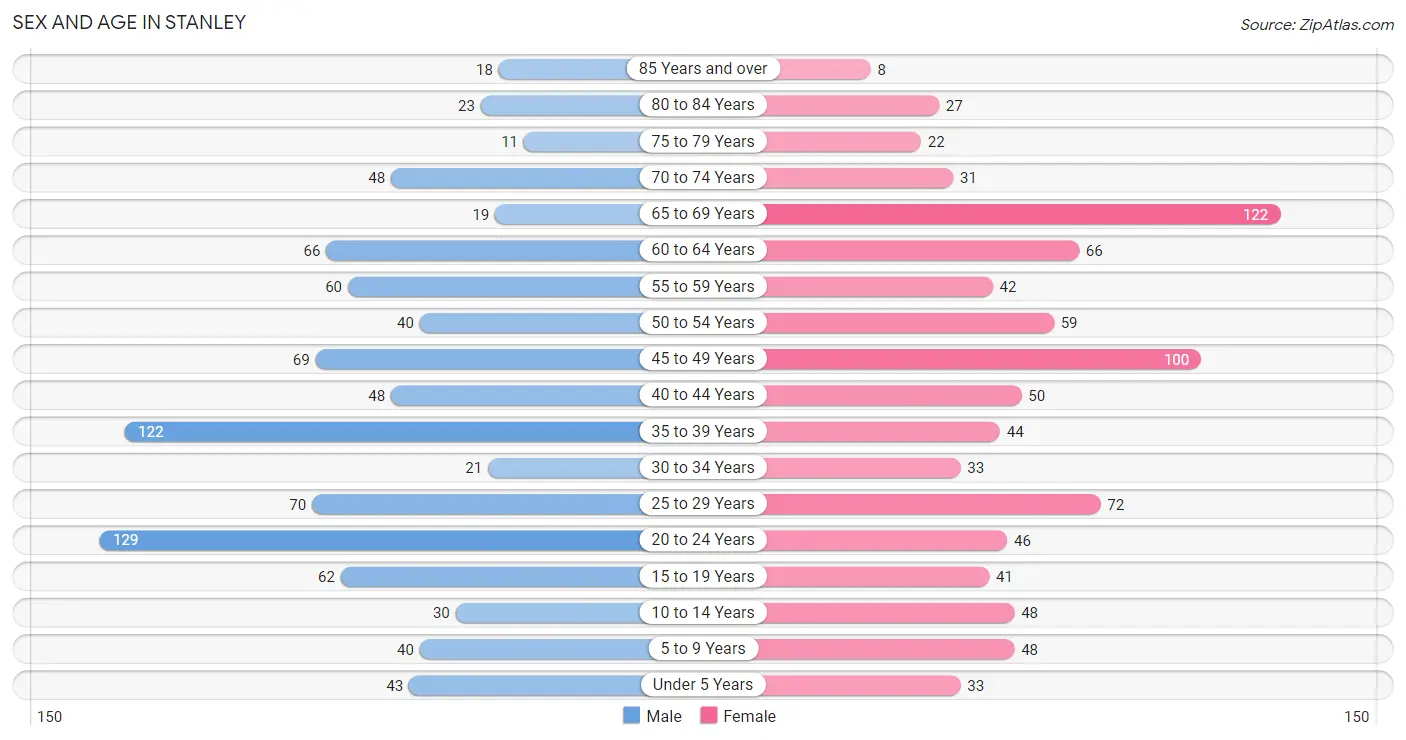
| Age Bracket | Male | Female |
| Under 5 Years | 43 (4.7%) | 33 (3.7%) |
| 5 to 9 Years | 40 (4.3%) | 48 (5.4%) |
| 10 to 14 Years | 30 (3.3%) | 48 (5.4%) |
| 15 to 19 Years | 62 (6.8%) | 41 (4.6%) |
| 20 to 24 Years | 129 (14.0%) | 46 (5.2%) |
| 25 to 29 Years | 70 (7.6%) | 72 (8.1%) |
| 30 to 34 Years | 21 (2.3%) | 33 (3.7%) |
| 35 to 39 Years | 122 (13.3%) | 44 (4.9%) |
| 40 to 44 Years | 48 (5.2%) | 50 (5.6%) |
| 45 to 49 Years | 69 (7.5%) | 100 (11.2%) |
| 50 to 54 Years | 40 (4.3%) | 59 (6.6%) |
| 55 to 59 Years | 60 (6.5%) | 42 (4.7%) |
| 60 to 64 Years | 66 (7.2%) | 66 (7.4%) |
| 65 to 69 Years | 19 (2.1%) | 122 (13.7%) |
| 70 to 74 Years | 48 (5.2%) | 31 (3.5%) |
| 75 to 79 Years | 11 (1.2%) | 22 (2.5%) |
| 80 to 84 Years | 23 (2.5%) | 27 (3.0%) |
| 85 Years and over | 18 (2.0%) | 8 (0.9%) |
| Total | 919 (100.0%) | 892 (100.0%) |
Families and Households in Stanley
Median Family Size in Stanley
The median family size in Stanley is 3.76 persons per family, with single female/mother families (99 | 26.6%) accounting for the largest median family size of 5.06 persons per family. On the other hand, single male/father families (42 | 11.3%) represent the smallest median family size with 2.48 persons per family.
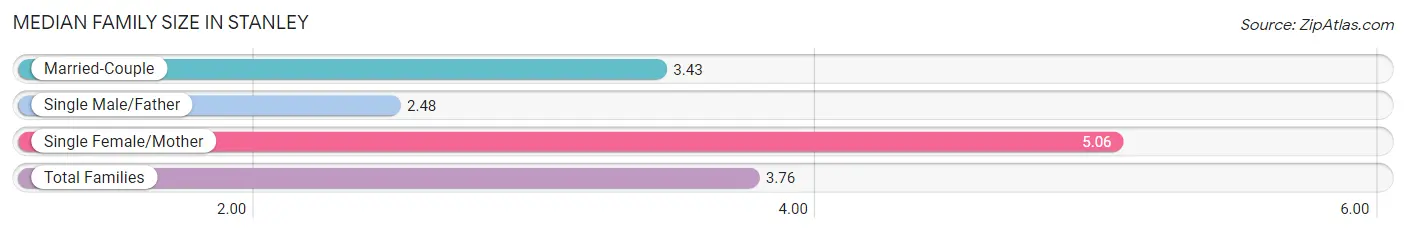
| Family Type | # Families | Family Size |
| Married-Couple | 231 (62.1%) | 3.43 |
| Single Male/Father | 42 (11.3%) | 2.48 |
| Single Female/Mother | 99 (26.6%) | 5.06 |
| Total Families | 372 (100.0%) | 3.76 |
Median Household Size in Stanley
The median household size in Stanley is 2.92 persons per household, with single female/mother households (99 | 16.0%) accounting for the largest median household size of 6.39 persons per household. non-family households (248 | 40.0%) represent the smallest median household size with 1.08 persons per household.
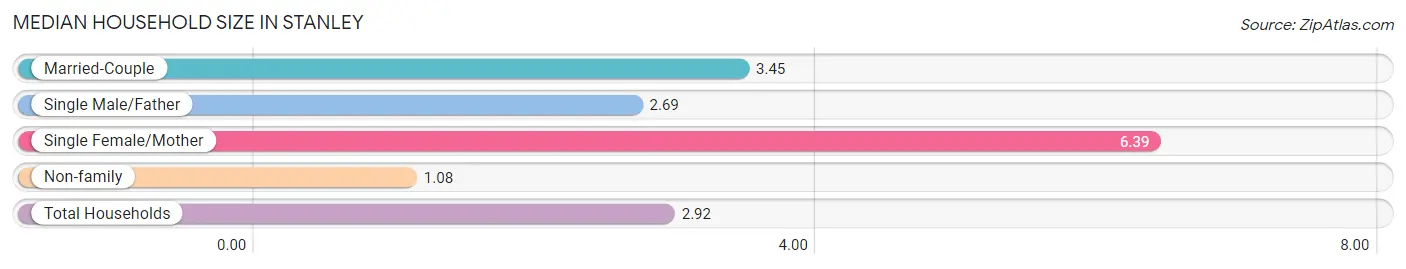
| Household Type | # Households | Household Size |
| Married-Couple | 231 (37.3%) | 3.45 |
| Single Male/Father | 42 (6.8%) | 2.69 |
| Single Female/Mother | 99 (16.0%) | 6.39 |
| Non-family | 248 (40.0%) | 1.08 |
| Total Households | 620 (100.0%) | 2.92 |
Household Size by Marriage Status in Stanley
Out of a total of 620 households in Stanley, 372 (60.0%) are family households, while 248 (40.0%) are nonfamily households. The most numerous type of family households are 2-person households, comprising 175, and the most common type of nonfamily households are 1-person households, comprising 230.
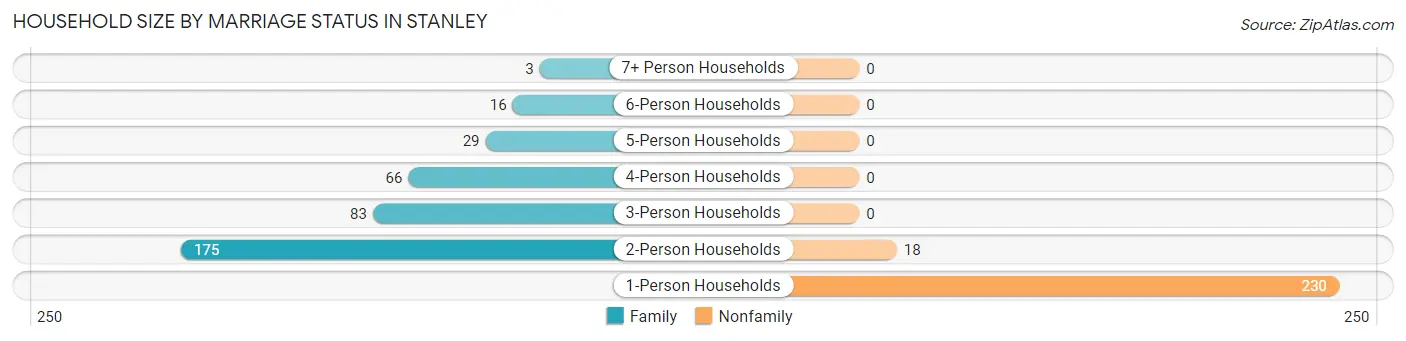
| Household Size | Family Households | Nonfamily Households |
| 1-Person Households | - | 230 (37.1%) |
| 2-Person Households | 175 (28.2%) | 18 (2.9%) |
| 3-Person Households | 83 (13.4%) | 0 (0.0%) |
| 4-Person Households | 66 (10.6%) | 0 (0.0%) |
| 5-Person Households | 29 (4.7%) | 0 (0.0%) |
| 6-Person Households | 16 (2.6%) | 0 (0.0%) |
| 7+ Person Households | 3 (0.5%) | 0 (0.0%) |
| Total | 372 (60.0%) | 248 (40.0%) |
Female Fertility in Stanley
Fertility by Age in Stanley
Average fertility rate in Stanley is 30.0 births per 1,000 women. Women in the age bracket of 20 to 34 years have the highest fertility rate with 66.0 births per 1,000 women. Women in the age bracket of 20 to 34 years acount for 83.3% of all women with births.
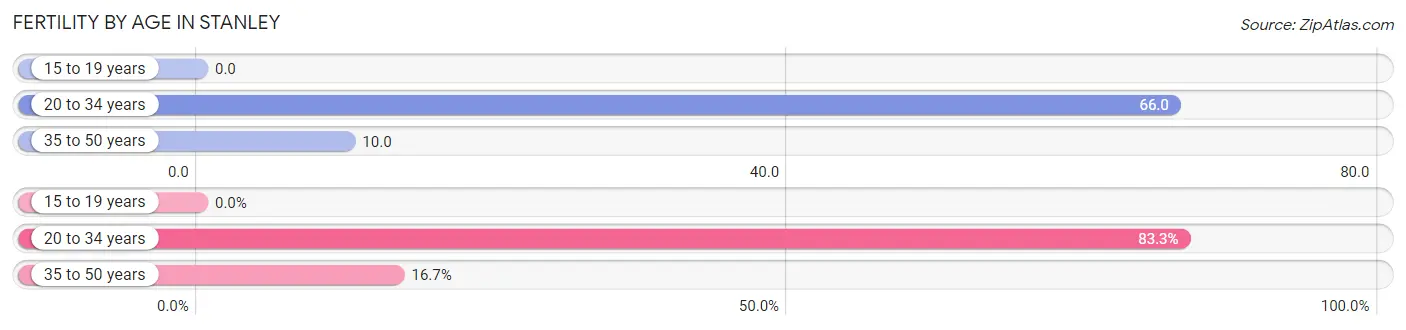
| Age Bracket | Women with Births | Births / 1,000 Women |
| 15 to 19 years | 0 (0.0%) | 0.0 |
| 20 to 34 years | 10 (83.3%) | 66.0 |
| 35 to 50 years | 2 (16.7%) | 10.0 |
| Total | 12 (100.0%) | 30.0 |
Fertility by Age by Marriage Status in Stanley
75.0% of women with births (12) in Stanley are married. The highest percentage of unmarried women with births falls into 20 to 34 years age bracket with 30.0% of them unmarried at the time of birth, while the lowest percentage of unmarried women with births belong to 35 to 50 years age bracket with 0.0% of them unmarried.
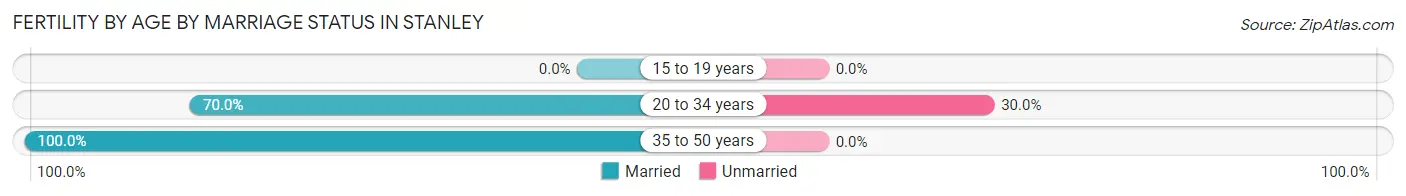
| Age Bracket | Married | Unmarried |
| 15 to 19 years | 0 (0.0%) | 0 (0.0%) |
| 20 to 34 years | 7 (70.0%) | 3 (30.0%) |
| 35 to 50 years | 2 (100.0%) | 0 (0.0%) |
| Total | 9 (75.0%) | 3 (25.0%) |
Fertility by Education in Stanley
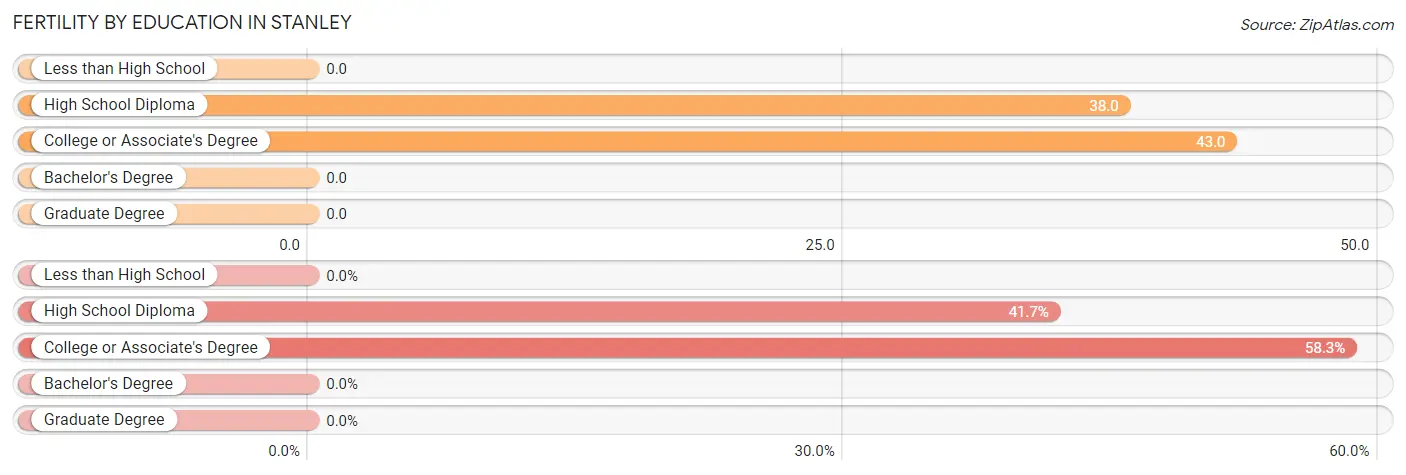
| Educational Attainment | Women with Births | Births / 1,000 Women |
| Less than High School | 0 (0.0%) | 0.0 |
| High School Diploma | 5 (41.7%) | 38.0 |
| College or Associate's Degree | 7 (58.3%) | 43.0 |
| Bachelor's Degree | 0 (0.0%) | 0.0 |
| Graduate Degree | 0 (0.0%) | 0.0 |
| Total | 12 (100.0%) | 30.0 |
Fertility by Education by Marriage Status in Stanley
25.0% of women with births in Stanley are unmarried. Women with the educational attainment of college or associate's degree are most likely to be married with 100.0% of them married at childbirth, while women with the educational attainment of high school diploma are least likely to be married with 60.0% of them unmarried at childbirth.
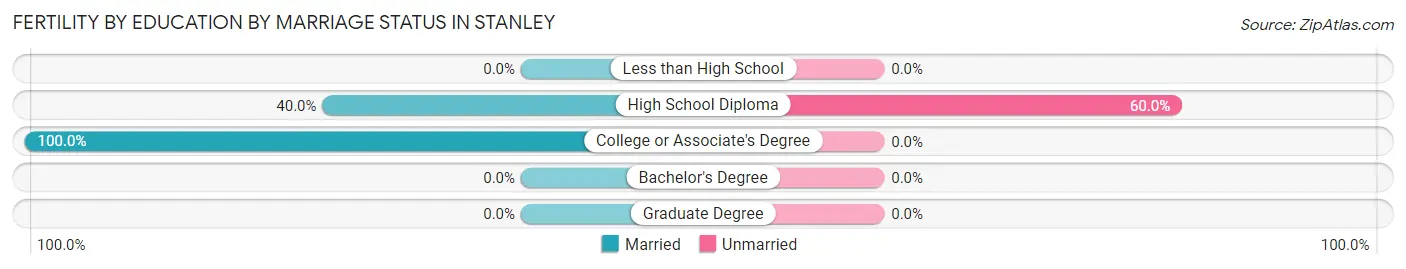
| Educational Attainment | Married | Unmarried |
| Less than High School | 0 (0.0%) | 0 (0.0%) |
| High School Diploma | 2 (40.0%) | 3 (60.0%) |
| College or Associate's Degree | 7 (100.0%) | 0 (0.0%) |
| Bachelor's Degree | 0 (0.0%) | 0 (0.0%) |
| Graduate Degree | 0 (0.0%) | 0 (0.0%) |
| Total | 9 (75.0%) | 3 (25.0%) |
Employment Characteristics in Stanley
Employment by Class of Employer in Stanley
Among the 901 employed individuals in Stanley, private company employees (638 | 70.8%), local government employees (81 | 9.0%), and not-for-profit organizations (70 | 7.8%) make up the most common classes of employment.
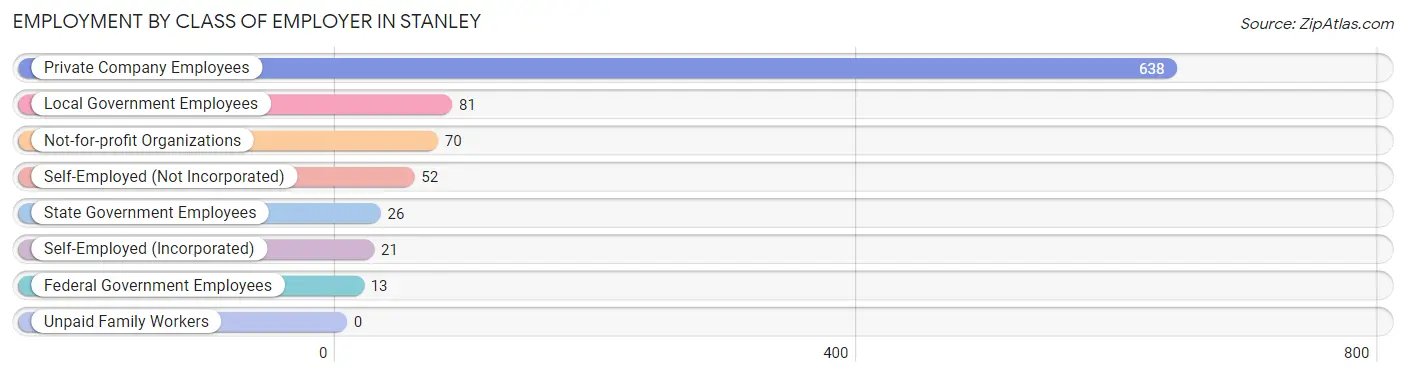
| Employer Class | # Employees | % Employees |
| Private Company Employees | 638 | 70.8% |
| Self-Employed (Incorporated) | 21 | 2.3% |
| Self-Employed (Not Incorporated) | 52 | 5.8% |
| Not-for-profit Organizations | 70 | 7.8% |
| Local Government Employees | 81 | 9.0% |
| State Government Employees | 26 | 2.9% |
| Federal Government Employees | 13 | 1.4% |
| Unpaid Family Workers | 0 | 0.0% |
| Total | 901 | 100.0% |
Employment Status by Age in Stanley
According to the labor force statistics for Stanley, out of the total population over 16 years of age (1,539), 65.6% or 1,010 individuals are in the labor force, with 5.9% or 60 of them unemployed. The age group with the highest labor force participation rate is 20 to 24 years, with 94.9% or 166 individuals in the labor force. Within the labor force, the 35 to 44 years age range has the highest percentage of unemployed individuals, with 11.2% or 25 of them being unemployed.
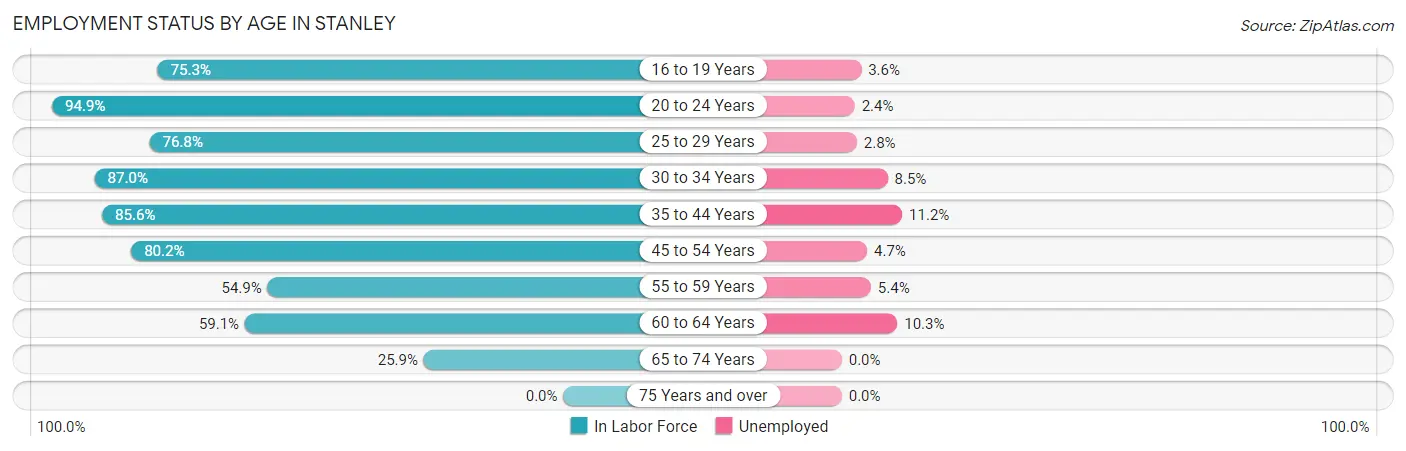
| Age Bracket | In Labor Force | Unemployed |
| 16 to 19 Years | 55 (75.3%) | 2 (3.6%) |
| 20 to 24 Years | 166 (94.9%) | 4 (2.4%) |
| 25 to 29 Years | 109 (76.8%) | 3 (2.8%) |
| 30 to 34 Years | 47 (87.0%) | 4 (8.5%) |
| 35 to 44 Years | 226 (85.6%) | 25 (11.2%) |
| 45 to 54 Years | 215 (80.2%) | 10 (4.7%) |
| 55 to 59 Years | 56 (54.9%) | 3 (5.4%) |
| 60 to 64 Years | 78 (59.1%) | 8 (10.3%) |
| 65 to 74 Years | 57 (25.9%) | 0 (0.0%) |
| 75 Years and over | 0 (0.0%) | 0 (0.0%) |
| Total | 1,010 (65.6%) | 60 (5.9%) |
Employment Status by Educational Attainment in Stanley
According to labor force statistics for Stanley, 76.0% of individuals (731) out of the total population between 25 and 64 years of age (962) are in the labor force, with 7.3% or 53 of them being unemployed. The group with the highest labor force participation rate are those with the educational attainment of college / associate degree, with 89.9% or 205 individuals in the labor force. Within the labor force, individuals with high school diploma education have the highest percentage of unemployment, with 10.8% or 34 of them being unemployed.

| Educational Attainment | In Labor Force | Unemployed |
| Less than High School | 119 (51.3%) | 21 (9.2%) |
| High School Diploma | 316 (80.0%) | 43 (10.8%) |
| College / Associate Degree | 205 (89.9%) | 3 (1.5%) |
| Bachelor's Degree or higher | 91 (85.0%) | 6 (5.7%) |
| Total | 731 (76.0%) | 70 (7.3%) |
Employment Occupations by Sex in Stanley
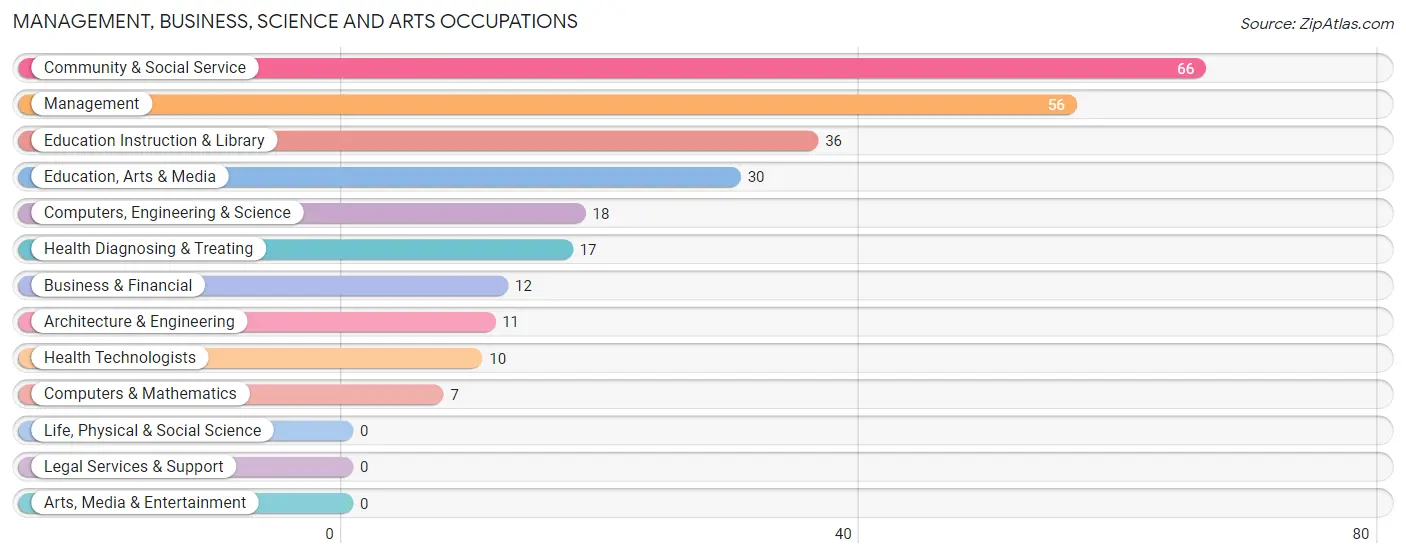
Management, Business, Science and Arts Occupations
The most common Management, Business, Science and Arts occupations in Stanley are Community & Social Service (66 | 7.0%), Management (56 | 5.9%), Education Instruction & Library (36 | 3.8%), Education, Arts & Media (30 | 3.2%), and Computers, Engineering & Science (18 | 1.9%).
Management, Business, Science and Arts Occupations by Sex
Within the Management, Business, Science and Arts occupations in Stanley, the most male-oriented occupations are Computers, Engineering & Science (100.0%), Computers & Mathematics (100.0%), and Architecture & Engineering (100.0%), while the most female-oriented occupations are Health Diagnosing & Treating (100.0%), Health Technologists (100.0%), and Education Instruction & Library (77.8%).
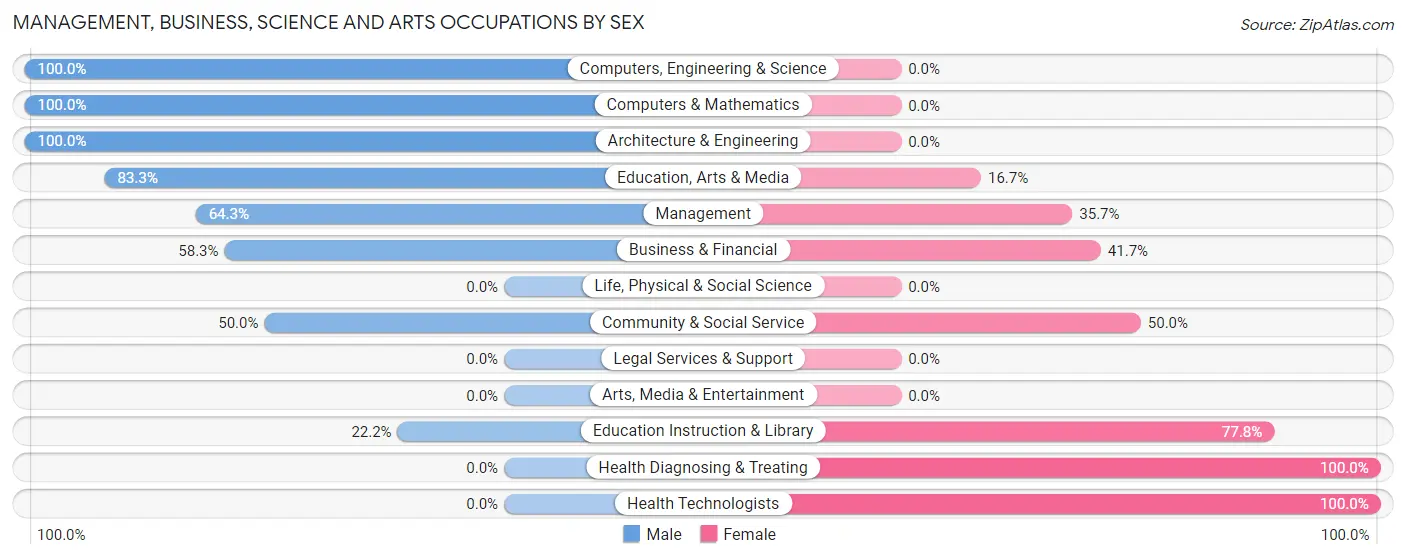
| Occupation | Male | Female |
| Management | 36 (64.3%) | 20 (35.7%) |
| Business & Financial | 7 (58.3%) | 5 (41.7%) |
| Computers, Engineering & Science | 18 (100.0%) | 0 (0.0%) |
| Computers & Mathematics | 7 (100.0%) | 0 (0.0%) |
| Architecture & Engineering | 11 (100.0%) | 0 (0.0%) |
| Life, Physical & Social Science | 0 (0.0%) | 0 (0.0%) |
| Community & Social Service | 33 (50.0%) | 33 (50.0%) |
| Education, Arts & Media | 25 (83.3%) | 5 (16.7%) |
| Legal Services & Support | 0 (0.0%) | 0 (0.0%) |
| Education Instruction & Library | 8 (22.2%) | 28 (77.8%) |
| Arts, Media & Entertainment | 0 (0.0%) | 0 (0.0%) |
| Health Diagnosing & Treating | 0 (0.0%) | 17 (100.0%) |
| Health Technologists | 0 (0.0%) | 10 (100.0%) |
| Total (Category) | 94 (55.6%) | 75 (44.4%) |
| Total (Overall) | 508 (53.6%) | 439 (46.4%) |
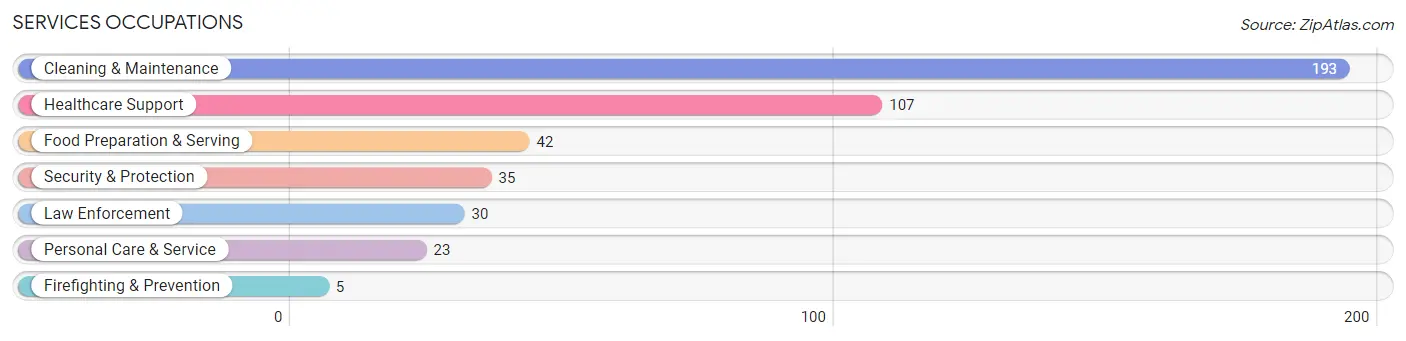
Services Occupations
The most common Services occupations in Stanley are Cleaning & Maintenance (193 | 20.4%), Healthcare Support (107 | 11.3%), Food Preparation & Serving (42 | 4.4%), Security & Protection (35 | 3.7%), and Law Enforcement (30 | 3.2%).
Services Occupations by Sex
Within the Services occupations in Stanley, the most male-oriented occupations are Firefighting & Prevention (100.0%), Cleaning & Maintenance (92.2%), and Security & Protection (68.6%), while the most female-oriented occupations are Healthcare Support (100.0%), Personal Care & Service (100.0%), and Food Preparation & Serving (78.6%).
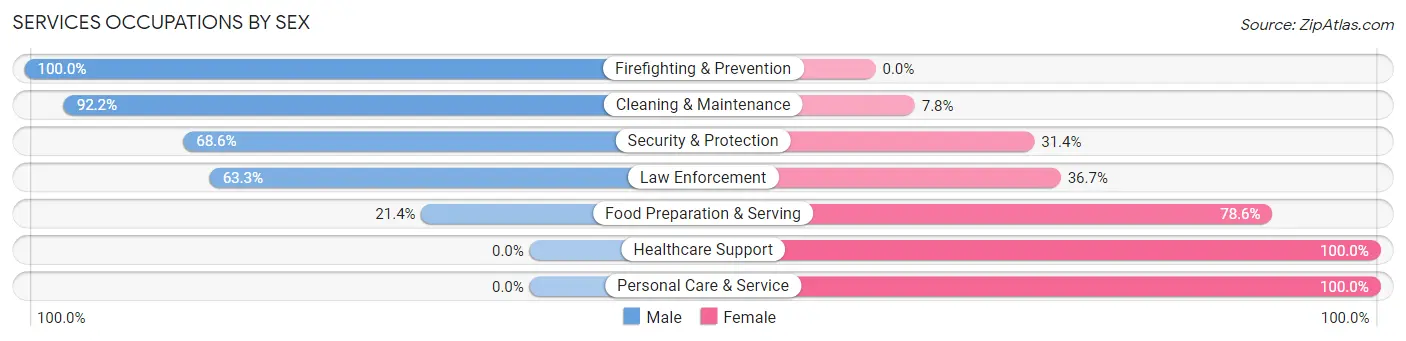
| Occupation | Male | Female |
| Healthcare Support | 0 (0.0%) | 107 (100.0%) |
| Security & Protection | 24 (68.6%) | 11 (31.4%) |
| Firefighting & Prevention | 5 (100.0%) | 0 (0.0%) |
| Law Enforcement | 19 (63.3%) | 11 (36.7%) |
| Food Preparation & Serving | 9 (21.4%) | 33 (78.6%) |
| Cleaning & Maintenance | 178 (92.2%) | 15 (7.8%) |
| Personal Care & Service | 0 (0.0%) | 23 (100.0%) |
| Total (Category) | 211 (52.7%) | 189 (47.2%) |
| Total (Overall) | 508 (53.6%) | 439 (46.4%) |
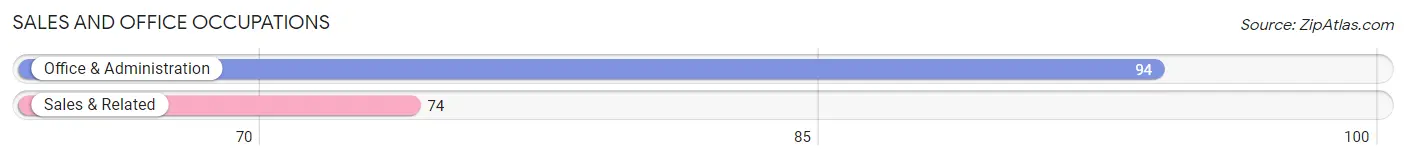
Sales and Office Occupations
The most common Sales and Office occupations in Stanley are Office & Administration (94 | 9.9%), and Sales & Related (74 | 7.8%).
Sales and Office Occupations by Sex
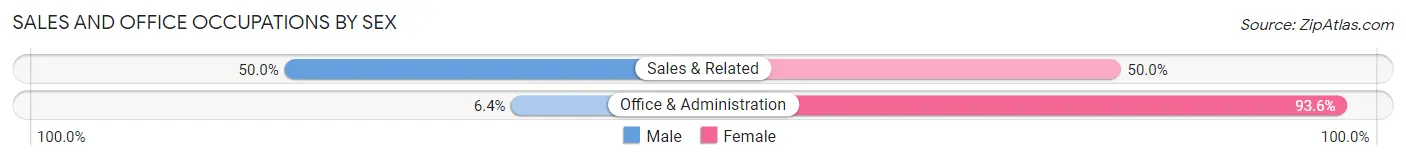
| Occupation | Male | Female |
| Sales & Related | 37 (50.0%) | 37 (50.0%) |
| Office & Administration | 6 (6.4%) | 88 (93.6%) |
| Total (Category) | 43 (25.6%) | 125 (74.4%) |
| Total (Overall) | 508 (53.6%) | 439 (46.4%) |
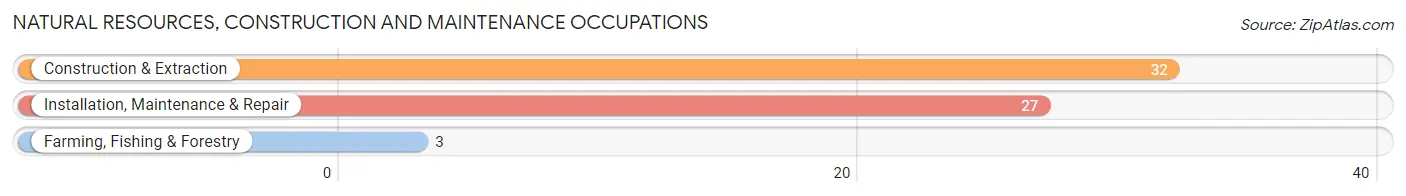
Natural Resources, Construction and Maintenance Occupations
The most common Natural Resources, Construction and Maintenance occupations in Stanley are Construction & Extraction (32 | 3.4%), Installation, Maintenance & Repair (27 | 2.9%), and Farming, Fishing & Forestry (3 | 0.3%).
Natural Resources, Construction and Maintenance Occupations by Sex
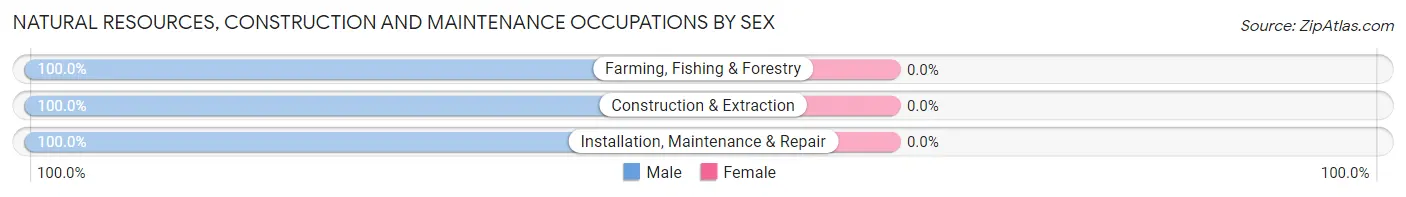
| Occupation | Male | Female |
| Farming, Fishing & Forestry | 3 (100.0%) | 0 (0.0%) |
| Construction & Extraction | 32 (100.0%) | 0 (0.0%) |
| Installation, Maintenance & Repair | 27 (100.0%) | 0 (0.0%) |
| Total (Category) | 62 (100.0%) | 0 (0.0%) |
| Total (Overall) | 508 (53.6%) | 439 (46.4%) |
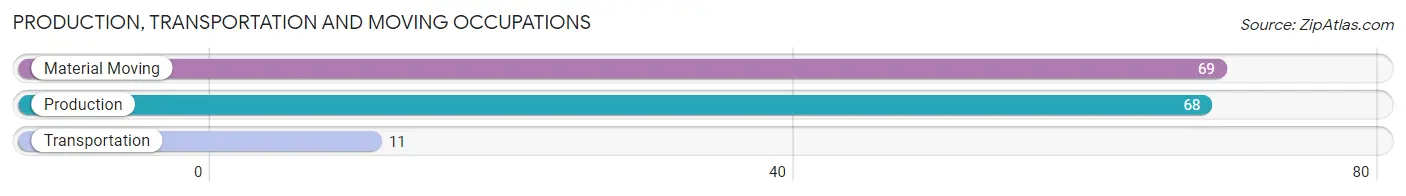
Production, Transportation and Moving Occupations
The most common Production, Transportation and Moving occupations in Stanley are Material Moving (69 | 7.3%), Production (68 | 7.2%), and Transportation (11 | 1.2%).
Production, Transportation and Moving Occupations by Sex
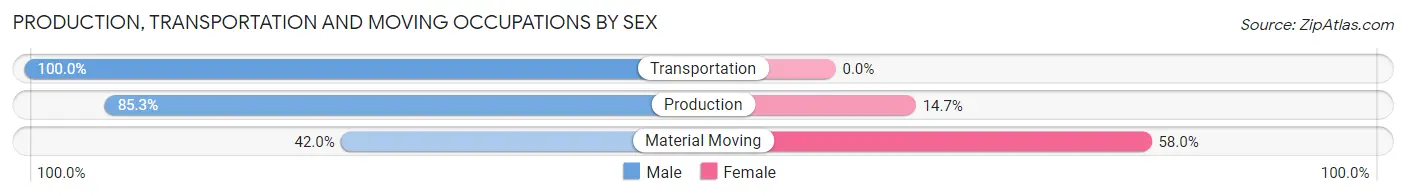
| Occupation | Male | Female |
| Production | 58 (85.3%) | 10 (14.7%) |
| Transportation | 11 (100.0%) | 0 (0.0%) |
| Material Moving | 29 (42.0%) | 40 (58.0%) |
| Total (Category) | 98 (66.2%) | 50 (33.8%) |
| Total (Overall) | 508 (53.6%) | 439 (46.4%) |
Employment Industries by Sex in Stanley
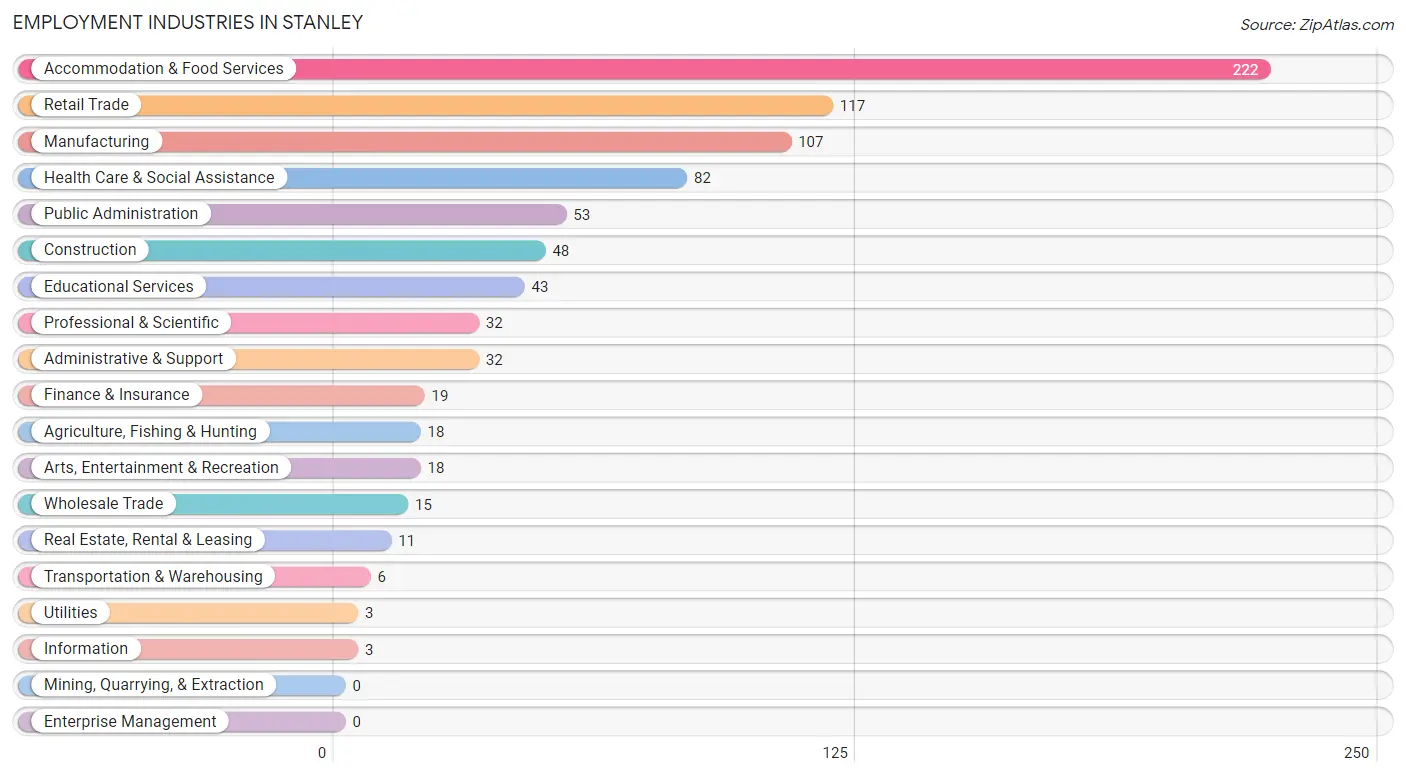
Employment Industries in Stanley
The major employment industries in Stanley include Accommodation & Food Services (222 | 23.4%), Retail Trade (117 | 12.3%), Manufacturing (107 | 11.3%), Health Care & Social Assistance (82 | 8.7%), and Public Administration (53 | 5.6%).
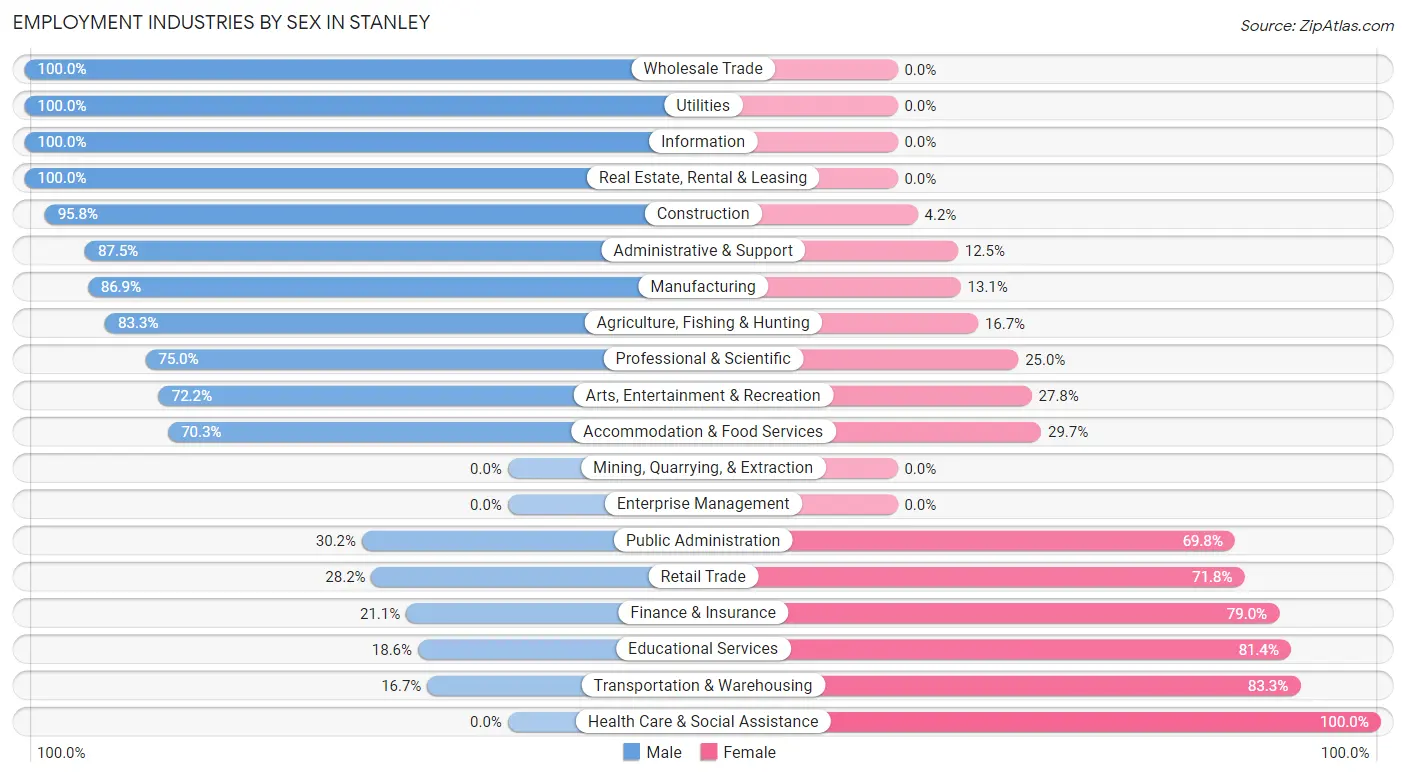
Employment Industries by Sex in Stanley
The Stanley industries that see more men than women are Wholesale Trade (100.0%), Utilities (100.0%), and Information (100.0%), whereas the industries that tend to have a higher number of women are Health Care & Social Assistance (100.0%), Transportation & Warehousing (83.3%), and Educational Services (81.4%).
| Industry | Male | Female |
| Agriculture, Fishing & Hunting | 15 (83.3%) | 3 (16.7%) |
| Mining, Quarrying, & Extraction | 0 (0.0%) | 0 (0.0%) |
| Construction | 46 (95.8%) | 2 (4.2%) |
| Manufacturing | 93 (86.9%) | 14 (13.1%) |
| Wholesale Trade | 15 (100.0%) | 0 (0.0%) |
| Retail Trade | 33 (28.2%) | 84 (71.8%) |
| Transportation & Warehousing | 1 (16.7%) | 5 (83.3%) |
| Utilities | 3 (100.0%) | 0 (0.0%) |
| Information | 3 (100.0%) | 0 (0.0%) |
| Finance & Insurance | 4 (21.0%) | 15 (78.9%) |
| Real Estate, Rental & Leasing | 11 (100.0%) | 0 (0.0%) |
| Professional & Scientific | 24 (75.0%) | 8 (25.0%) |
| Enterprise Management | 0 (0.0%) | 0 (0.0%) |
| Administrative & Support | 28 (87.5%) | 4 (12.5%) |
| Educational Services | 8 (18.6%) | 35 (81.4%) |
| Health Care & Social Assistance | 0 (0.0%) | 82 (100.0%) |
| Arts, Entertainment & Recreation | 13 (72.2%) | 5 (27.8%) |
| Accommodation & Food Services | 156 (70.3%) | 66 (29.7%) |
| Public Administration | 16 (30.2%) | 37 (69.8%) |
| Total | 508 (53.6%) | 439 (46.4%) |
Education in Stanley
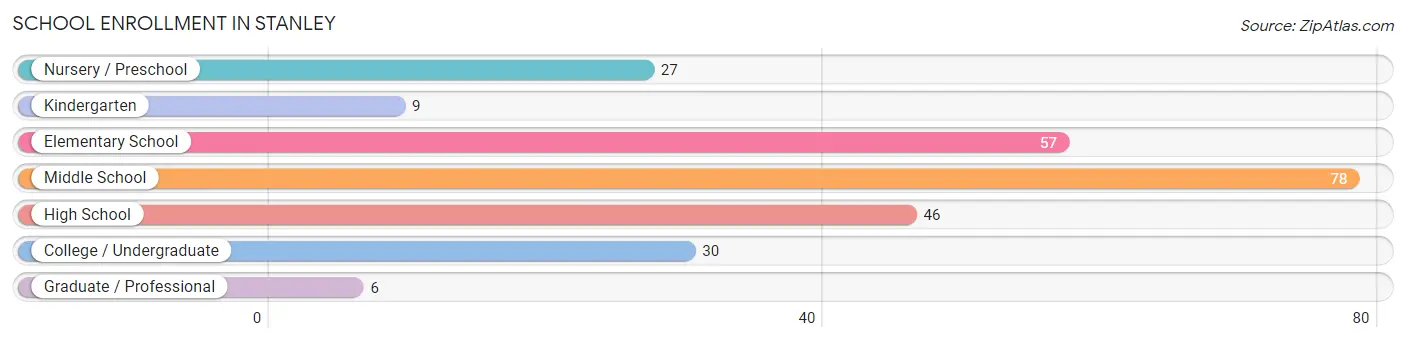
School Enrollment in Stanley
The most common levels of schooling among the 253 students in Stanley are middle school (78 | 30.8%), elementary school (57 | 22.5%), and high school (46 | 18.2%).
| School Level | # Students | % Students |
| Nursery / Preschool | 27 | 10.7% |
| Kindergarten | 9 | 3.6% |
| Elementary School | 57 | 22.5% |
| Middle School | 78 | 30.8% |
| High School | 46 | 18.2% |
| College / Undergraduate | 30 | 11.9% |
| Graduate / Professional | 6 | 2.4% |
| Total | 253 | 100.0% |
School Enrollment by Age by Funding Source in Stanley
Out of a total of 253 students who are enrolled in schools in Stanley, 21 (8.3%) attend a private institution, while the remaining 232 (91.7%) are enrolled in public schools. The age group of 3 to 4 year olds has the highest likelihood of being enrolled in private schools, with 13 (100.0% in the age bracket) enrolled. Conversely, the age group of 10 to 14 year olds has the lowest likelihood of being enrolled in a private school, with 78 (100.0% in the age bracket) attending a public institution.
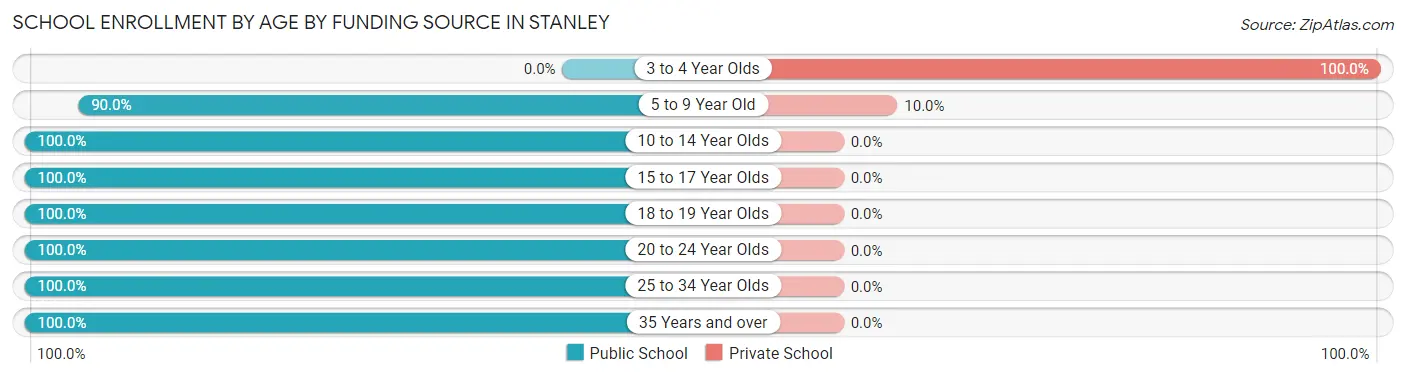
| Age Bracket | Public School | Private School |
| 3 to 4 Year Olds | 0 (0.0%) | 13 (100.0%) |
| 5 to 9 Year Old | 72 (90.0%) | 8 (10.0%) |
| 10 to 14 Year Olds | 78 (100.0%) | 0 (0.0%) |
| 15 to 17 Year Olds | 46 (100.0%) | 0 (0.0%) |
| 18 to 19 Year Olds | 14 (100.0%) | 0 (0.0%) |
| 20 to 24 Year Olds | 16 (100.0%) | 0 (0.0%) |
| 25 to 34 Year Olds | 1 (100.0%) | 0 (0.0%) |
| 35 Years and over | 5 (100.0%) | 0 (0.0%) |
| Total | 232 (91.7%) | 21 (8.3%) |
Educational Attainment by Field of Study in Stanley
Social sciences (29 | 20.1%), physical & health sciences (27 | 18.8%), education (22 | 15.3%), multidisciplinary studies (14 | 9.7%), and science & technology (10 | 6.9%) are the most common fields of study among 144 individuals in Stanley who have obtained a bachelor's degree or higher.
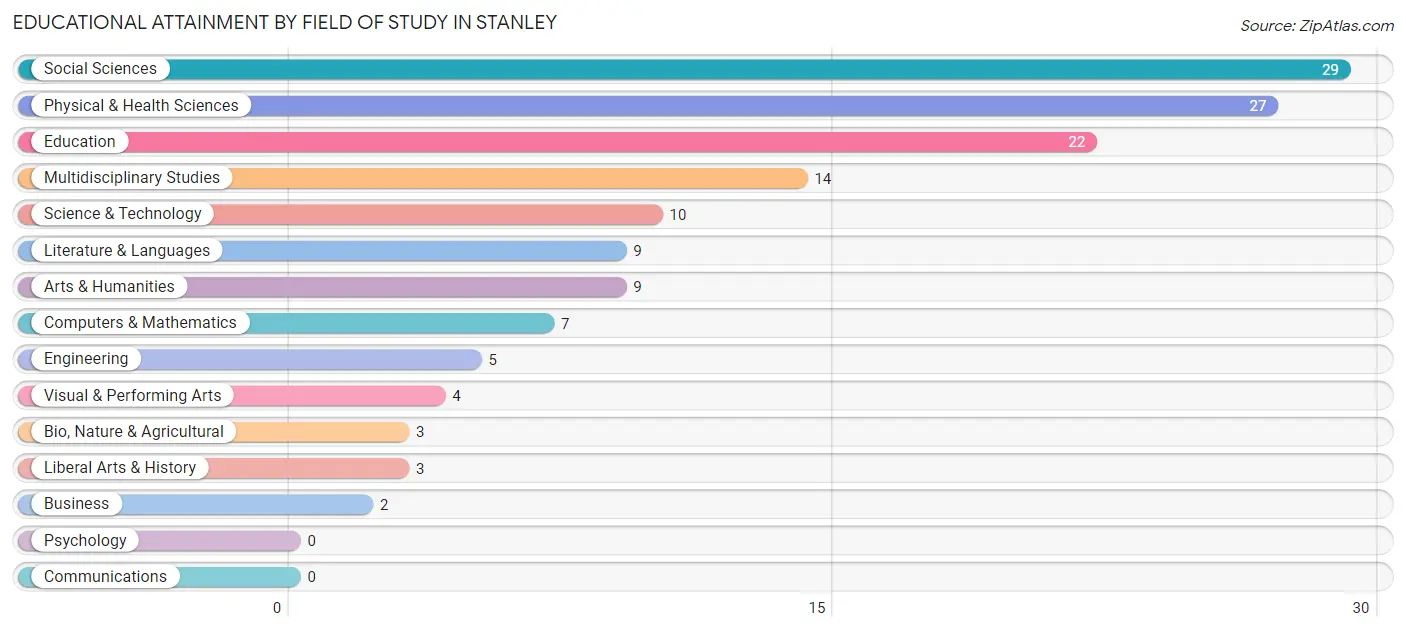
| Field of Study | # Graduates | % Graduates |
| Computers & Mathematics | 7 | 4.9% |
| Bio, Nature & Agricultural | 3 | 2.1% |
| Physical & Health Sciences | 27 | 18.8% |
| Psychology | 0 | 0.0% |
| Social Sciences | 29 | 20.1% |
| Engineering | 5 | 3.5% |
| Multidisciplinary Studies | 14 | 9.7% |
| Science & Technology | 10 | 6.9% |
| Business | 2 | 1.4% |
| Education | 22 | 15.3% |
| Literature & Languages | 9 | 6.2% |
| Liberal Arts & History | 3 | 2.1% |
| Visual & Performing Arts | 4 | 2.8% |
| Communications | 0 | 0.0% |
| Arts & Humanities | 9 | 6.2% |
| Total | 144 | 100.0% |
Transportation & Commute in Stanley
Vehicle Availability by Sex in Stanley
The most prevalent vehicle ownership categories in Stanley are males with 5 or more vehicles (202, accounting for 39.5%) and females with 5 or more vehicles (68, making up 51.8%).
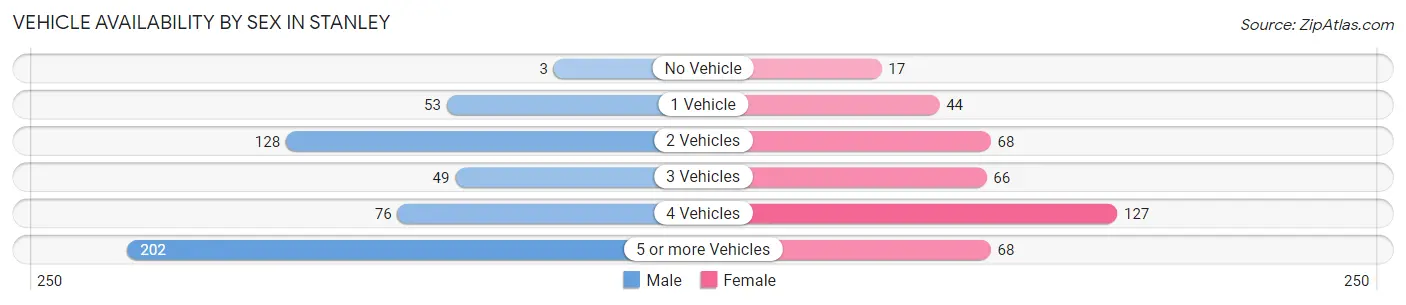
| Vehicles Available | Male | Female |
| No Vehicle | 3 (0.6%) | 17 (4.4%) |
| 1 Vehicle | 53 (10.4%) | 44 (11.3%) |
| 2 Vehicles | 128 (25.1%) | 68 (17.4%) |
| 3 Vehicles | 49 (9.6%) | 66 (16.9%) |
| 4 Vehicles | 76 (14.9%) | 127 (32.6%) |
| 5 or more Vehicles | 202 (39.5%) | 68 (17.4%) |
| Total | 511 (100.0%) | 390 (100.0%) |
Commute Time in Stanley
The most frequently occuring commute durations in Stanley are 35 to 39 minutes (172 commuters, 19.4%), 45 to 59 minutes (167 commuters, 18.9%), and 15 to 19 minutes (105 commuters, 11.9%).
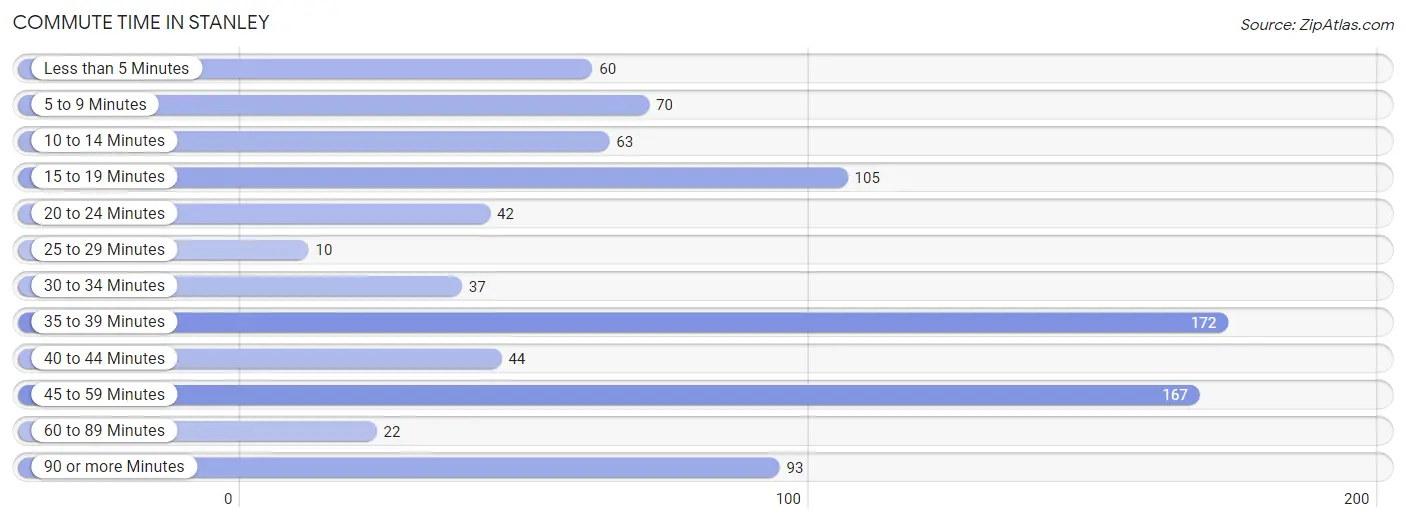
| Commute Time | # Commuters | % Commuters |
| Less than 5 Minutes | 60 | 6.8% |
| 5 to 9 Minutes | 70 | 7.9% |
| 10 to 14 Minutes | 63 | 7.1% |
| 15 to 19 Minutes | 105 | 11.9% |
| 20 to 24 Minutes | 42 | 4.8% |
| 25 to 29 Minutes | 10 | 1.1% |
| 30 to 34 Minutes | 37 | 4.2% |
| 35 to 39 Minutes | 172 | 19.4% |
| 40 to 44 Minutes | 44 | 5.0% |
| 45 to 59 Minutes | 167 | 18.9% |
| 60 to 89 Minutes | 22 | 2.5% |
| 90 or more Minutes | 93 | 10.5% |
Commute Time by Sex in Stanley
The most common commute times in Stanley are 35 to 39 minutes (158 commuters, 31.6%) for males and 90 or more minutes (83 commuters, 21.6%) for females.
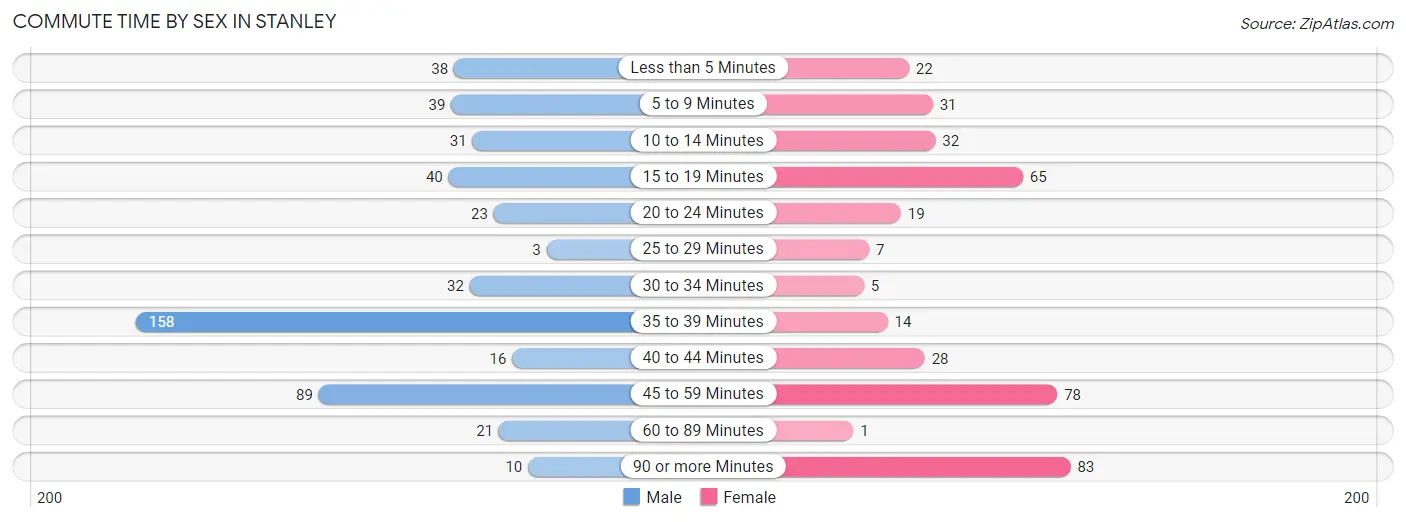
| Commute Time | Male | Female |
| Less than 5 Minutes | 38 (7.6%) | 22 (5.7%) |
| 5 to 9 Minutes | 39 (7.8%) | 31 (8.1%) |
| 10 to 14 Minutes | 31 (6.2%) | 32 (8.3%) |
| 15 to 19 Minutes | 40 (8.0%) | 65 (16.9%) |
| 20 to 24 Minutes | 23 (4.6%) | 19 (4.9%) |
| 25 to 29 Minutes | 3 (0.6%) | 7 (1.8%) |
| 30 to 34 Minutes | 32 (6.4%) | 5 (1.3%) |
| 35 to 39 Minutes | 158 (31.6%) | 14 (3.6%) |
| 40 to 44 Minutes | 16 (3.2%) | 28 (7.3%) |
| 45 to 59 Minutes | 89 (17.8%) | 78 (20.3%) |
| 60 to 89 Minutes | 21 (4.2%) | 1 (0.3%) |
| 90 or more Minutes | 10 (2.0%) | 83 (21.6%) |
Time of Departure to Work by Sex in Stanley
The most frequent times of departure to work in Stanley are 7:00 AM to 7:29 AM (174, 34.8%) for males and 5:30 AM to 5:59 AM (89, 23.1%) for females.
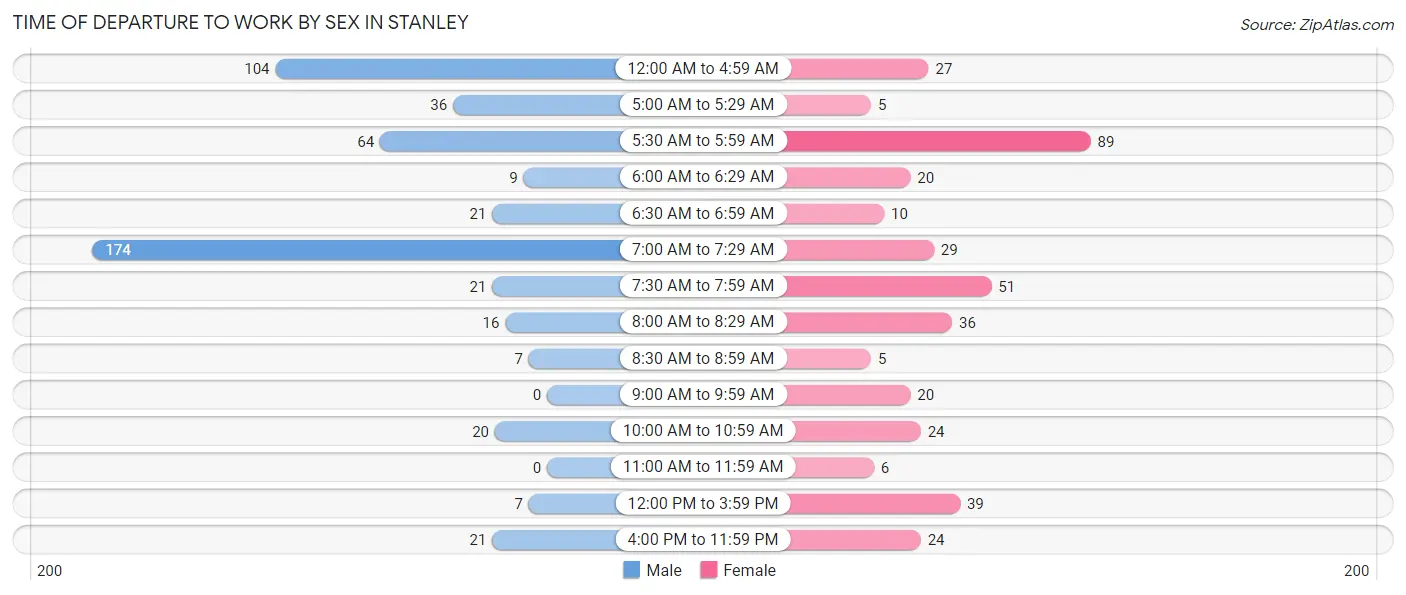
| Time of Departure | Male | Female |
| 12:00 AM to 4:59 AM | 104 (20.8%) | 27 (7.0%) |
| 5:00 AM to 5:29 AM | 36 (7.2%) | 5 (1.3%) |
| 5:30 AM to 5:59 AM | 64 (12.8%) | 89 (23.1%) |
| 6:00 AM to 6:29 AM | 9 (1.8%) | 20 (5.2%) |
| 6:30 AM to 6:59 AM | 21 (4.2%) | 10 (2.6%) |
| 7:00 AM to 7:29 AM | 174 (34.8%) | 29 (7.5%) |
| 7:30 AM to 7:59 AM | 21 (4.2%) | 51 (13.3%) |
| 8:00 AM to 8:29 AM | 16 (3.2%) | 36 (9.3%) |
| 8:30 AM to 8:59 AM | 7 (1.4%) | 5 (1.3%) |
| 9:00 AM to 9:59 AM | 0 (0.0%) | 20 (5.2%) |
| 10:00 AM to 10:59 AM | 20 (4.0%) | 24 (6.2%) |
| 11:00 AM to 11:59 AM | 0 (0.0%) | 6 (1.6%) |
| 12:00 PM to 3:59 PM | 7 (1.4%) | 39 (10.1%) |
| 4:00 PM to 11:59 PM | 21 (4.2%) | 24 (6.2%) |
| Total | 500 (100.0%) | 385 (100.0%) |
Housing Occupancy in Stanley
Occupancy by Ownership in Stanley
Of the total 620 dwellings in Stanley, owner-occupied units account for 371 (59.8%), while renter-occupied units make up 249 (40.2%).
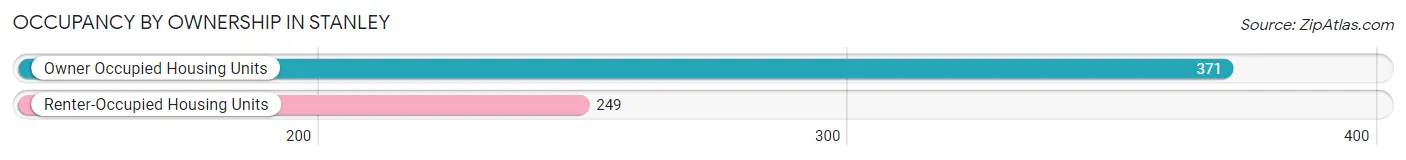
| Occupancy | # Housing Units | % Housing Units |
| Owner Occupied Housing Units | 371 | 59.8% |
| Renter-Occupied Housing Units | 249 | 40.2% |
| Total Occupied Housing Units | 620 | 100.0% |
Occupancy by Household Size in Stanley
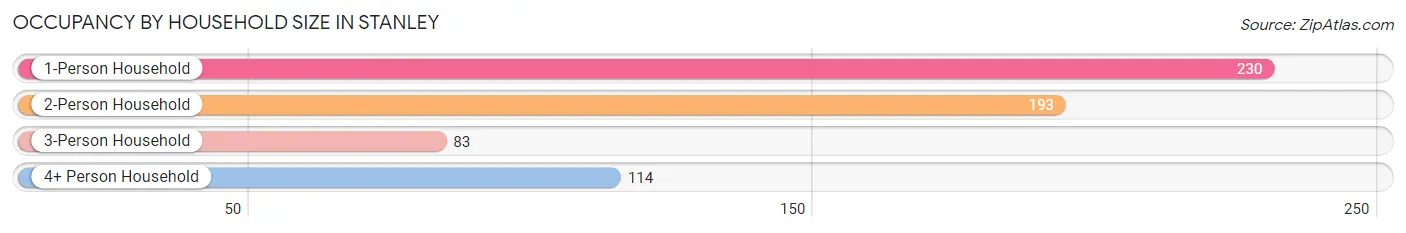
| Household Size | # Housing Units | % Housing Units |
| 1-Person Household | 230 | 37.1% |
| 2-Person Household | 193 | 31.1% |
| 3-Person Household | 83 | 13.4% |
| 4+ Person Household | 114 | 18.4% |
| Total Housing Units | 620 | 100.0% |
Occupancy by Ownership by Household Size in Stanley
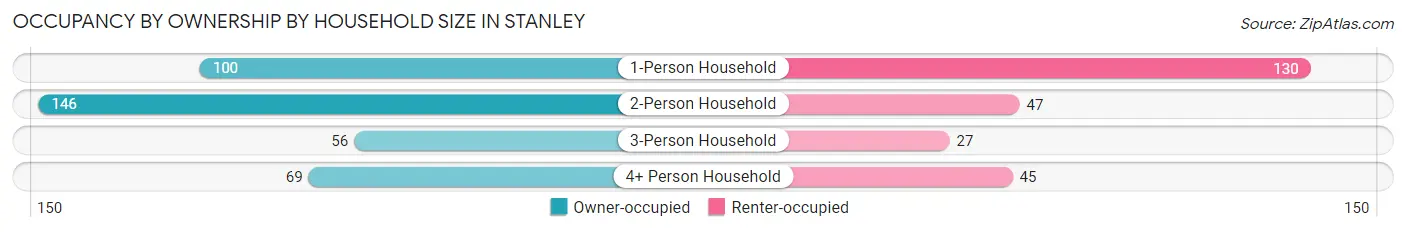
| Household Size | Owner-occupied | Renter-occupied |
| 1-Person Household | 100 (43.5%) | 130 (56.5%) |
| 2-Person Household | 146 (75.6%) | 47 (24.3%) |
| 3-Person Household | 56 (67.5%) | 27 (32.5%) |
| 4+ Person Household | 69 (60.5%) | 45 (39.5%) |
| Total Housing Units | 371 (59.8%) | 249 (40.2%) |
Occupancy by Educational Attainment in Stanley
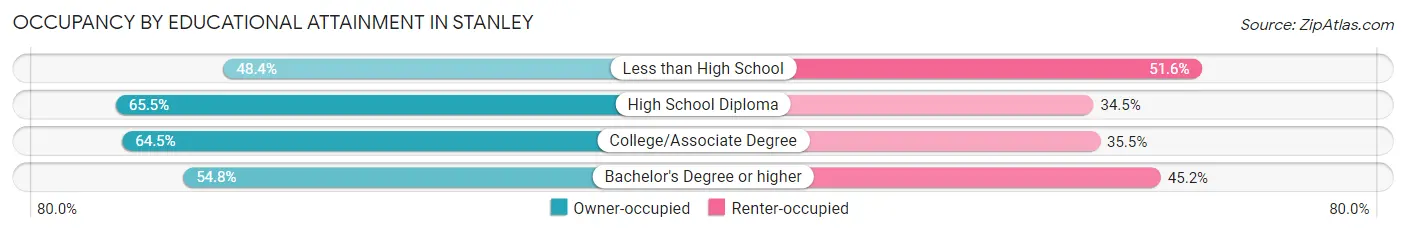
| Household Size | Owner-occupied | Renter-occupied |
| Less than High School | 77 (48.4%) | 82 (51.6%) |
| High School Diploma | 171 (65.5%) | 90 (34.5%) |
| College/Associate Degree | 89 (64.5%) | 49 (35.5%) |
| Bachelor's Degree or higher | 34 (54.8%) | 28 (45.2%) |
Occupancy by Age of Householder in Stanley
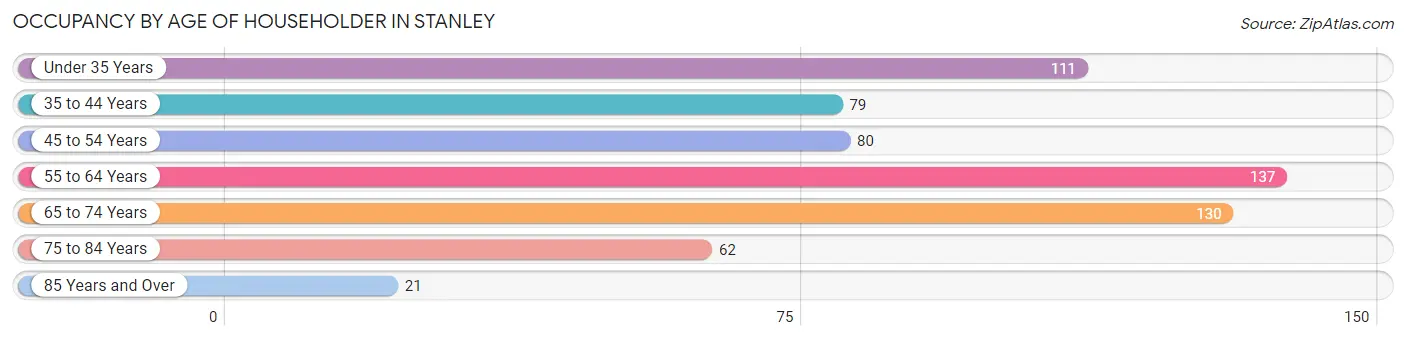
| Age Bracket | # Households | % Households |
| Under 35 Years | 111 | 17.9% |
| 35 to 44 Years | 79 | 12.7% |
| 45 to 54 Years | 80 | 12.9% |
| 55 to 64 Years | 137 | 22.1% |
| 65 to 74 Years | 130 | 21.0% |
| 75 to 84 Years | 62 | 10.0% |
| 85 Years and Over | 21 | 3.4% |
| Total | 620 | 100.0% |
Housing Finances in Stanley
Median Income by Occupancy in Stanley
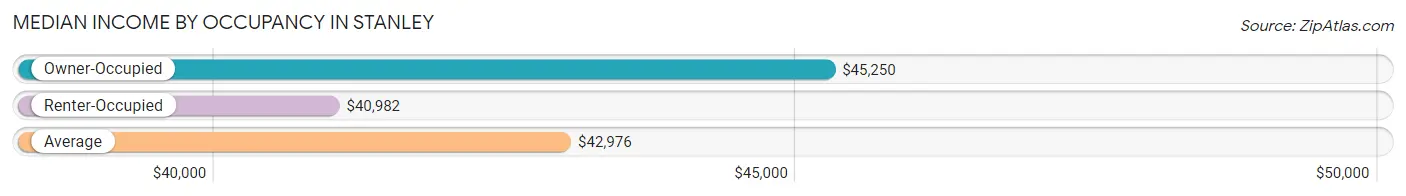
| Occupancy Type | # Households | Median Income |
| Owner-Occupied | 371 (59.8%) | $45,250 |
| Renter-Occupied | 249 (40.2%) | $40,982 |
| Average | 620 (100.0%) | $42,976 |
Occupancy by Householder Income Bracket in Stanley
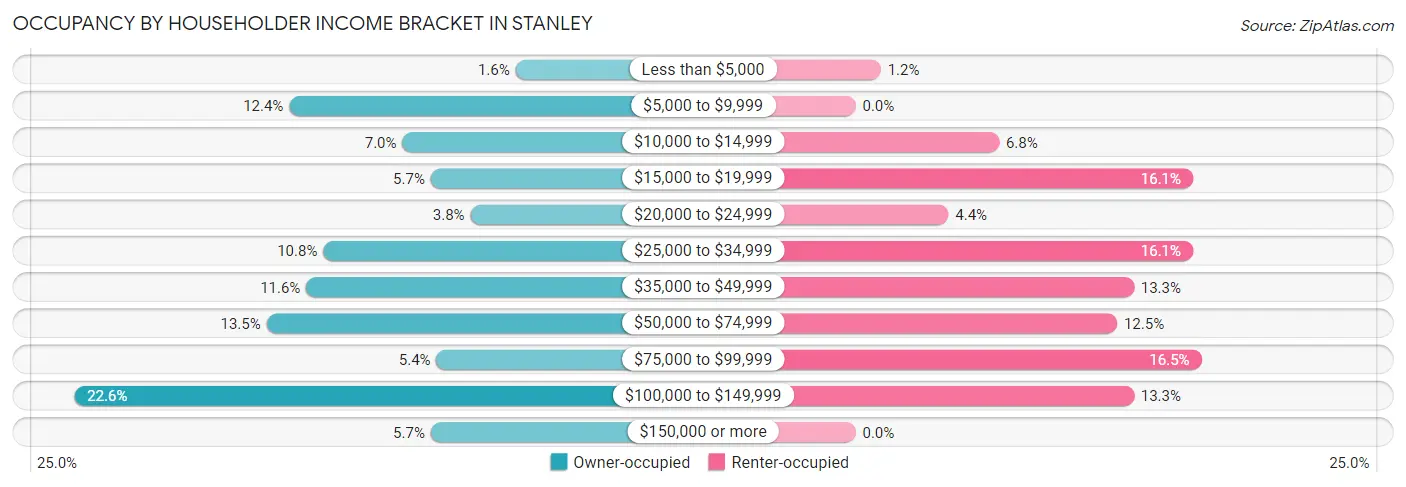
| Income Bracket | Owner-occupied | Renter-occupied |
| Less than $5,000 | 6 (1.6%) | 3 (1.2%) |
| $5,000 to $9,999 | 46 (12.4%) | 0 (0.0%) |
| $10,000 to $14,999 | 26 (7.0%) | 17 (6.8%) |
| $15,000 to $19,999 | 21 (5.7%) | 40 (16.1%) |
| $20,000 to $24,999 | 14 (3.8%) | 11 (4.4%) |
| $25,000 to $34,999 | 40 (10.8%) | 40 (16.1%) |
| $35,000 to $49,999 | 43 (11.6%) | 33 (13.3%) |
| $50,000 to $74,999 | 50 (13.5%) | 31 (12.4%) |
| $75,000 to $99,999 | 20 (5.4%) | 41 (16.5%) |
| $100,000 to $149,999 | 84 (22.6%) | 33 (13.3%) |
| $150,000 or more | 21 (5.7%) | 0 (0.0%) |
| Total | 371 (100.0%) | 249 (100.0%) |
Monthly Housing Cost Tiers in Stanley
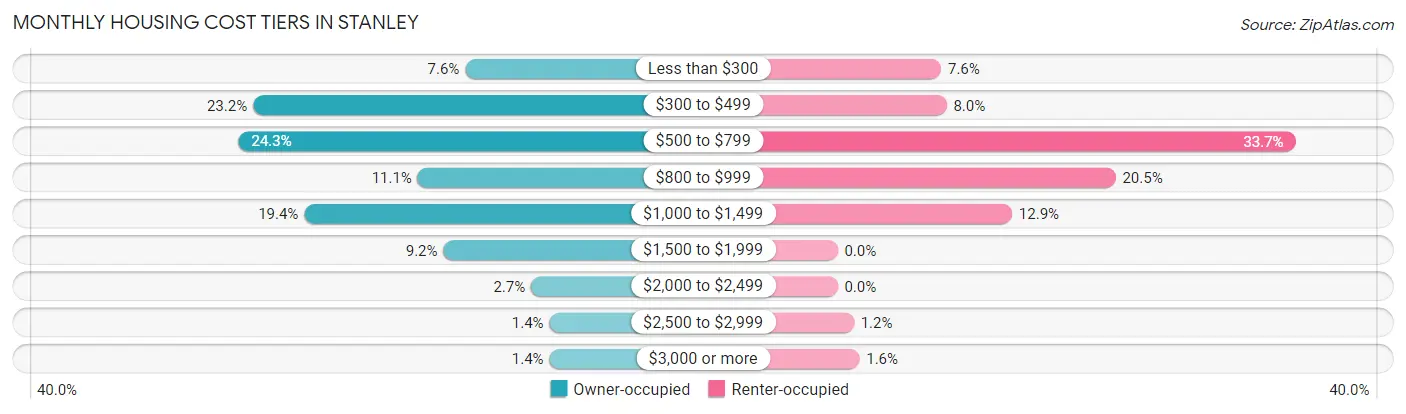
| Monthly Cost | Owner-occupied | Renter-occupied |
| Less than $300 | 28 (7.5%) | 19 (7.6%) |
| $300 to $499 | 86 (23.2%) | 20 (8.0%) |
| $500 to $799 | 90 (24.3%) | 84 (33.7%) |
| $800 to $999 | 41 (11.1%) | 51 (20.5%) |
| $1,000 to $1,499 | 72 (19.4%) | 32 (12.9%) |
| $1,500 to $1,999 | 34 (9.2%) | 0 (0.0%) |
| $2,000 to $2,499 | 10 (2.7%) | 0 (0.0%) |
| $2,500 to $2,999 | 5 (1.3%) | 3 (1.2%) |
| $3,000 or more | 5 (1.3%) | 4 (1.6%) |
| Total | 371 (100.0%) | 249 (100.0%) |
Physical Housing Characteristics in Stanley
Housing Structures in Stanley
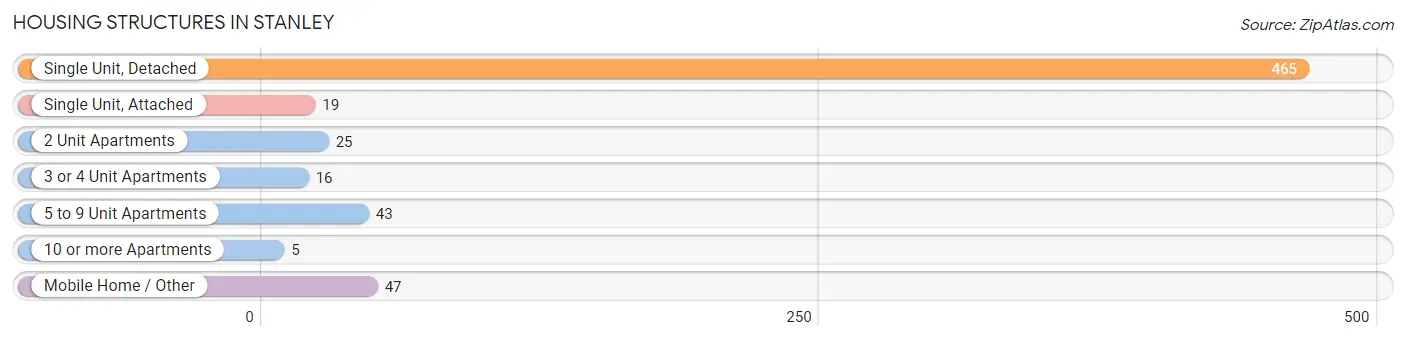
| Structure Type | # Housing Units | % Housing Units |
| Single Unit, Detached | 465 | 75.0% |
| Single Unit, Attached | 19 | 3.1% |
| 2 Unit Apartments | 25 | 4.0% |
| 3 or 4 Unit Apartments | 16 | 2.6% |
| 5 to 9 Unit Apartments | 43 | 6.9% |
| 10 or more Apartments | 5 | 0.8% |
| Mobile Home / Other | 47 | 7.6% |
| Total | 620 | 100.0% |
Housing Structures by Occupancy in Stanley
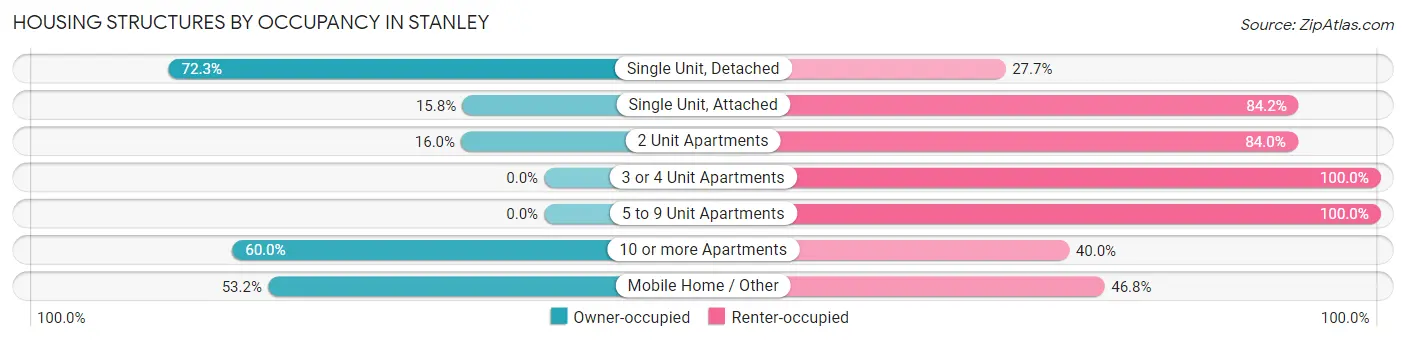
| Structure Type | Owner-occupied | Renter-occupied |
| Single Unit, Detached | 336 (72.3%) | 129 (27.7%) |
| Single Unit, Attached | 3 (15.8%) | 16 (84.2%) |
| 2 Unit Apartments | 4 (16.0%) | 21 (84.0%) |
| 3 or 4 Unit Apartments | 0 (0.0%) | 16 (100.0%) |
| 5 to 9 Unit Apartments | 0 (0.0%) | 43 (100.0%) |
| 10 or more Apartments | 3 (60.0%) | 2 (40.0%) |
| Mobile Home / Other | 25 (53.2%) | 22 (46.8%) |
| Total | 371 (59.8%) | 249 (40.2%) |
Housing Structures by Number of Rooms in Stanley
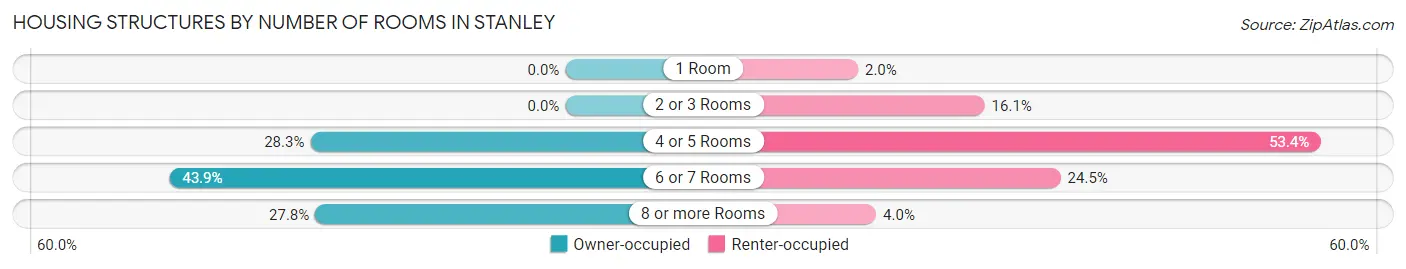
| Number of Rooms | Owner-occupied | Renter-occupied |
| 1 Room | 0 (0.0%) | 5 (2.0%) |
| 2 or 3 Rooms | 0 (0.0%) | 40 (16.1%) |
| 4 or 5 Rooms | 105 (28.3%) | 133 (53.4%) |
| 6 or 7 Rooms | 163 (43.9%) | 61 (24.5%) |
| 8 or more Rooms | 103 (27.8%) | 10 (4.0%) |
| Total | 371 (100.0%) | 249 (100.0%) |
Housing Structure by Heating Type in Stanley
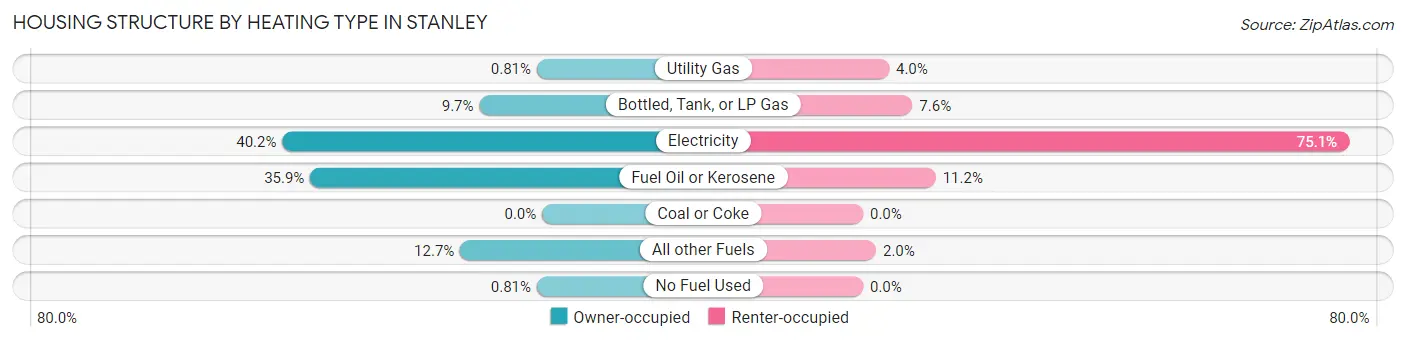
| Heating Type | Owner-occupied | Renter-occupied |
| Utility Gas | 3 (0.8%) | 10 (4.0%) |
| Bottled, Tank, or LP Gas | 36 (9.7%) | 19 (7.6%) |
| Electricity | 149 (40.2%) | 187 (75.1%) |
| Fuel Oil or Kerosene | 133 (35.8%) | 28 (11.2%) |
| Coal or Coke | 0 (0.0%) | 0 (0.0%) |
| All other Fuels | 47 (12.7%) | 5 (2.0%) |
| No Fuel Used | 3 (0.8%) | 0 (0.0%) |
| Total | 371 (100.0%) | 249 (100.0%) |
Household Vehicle Usage in Stanley
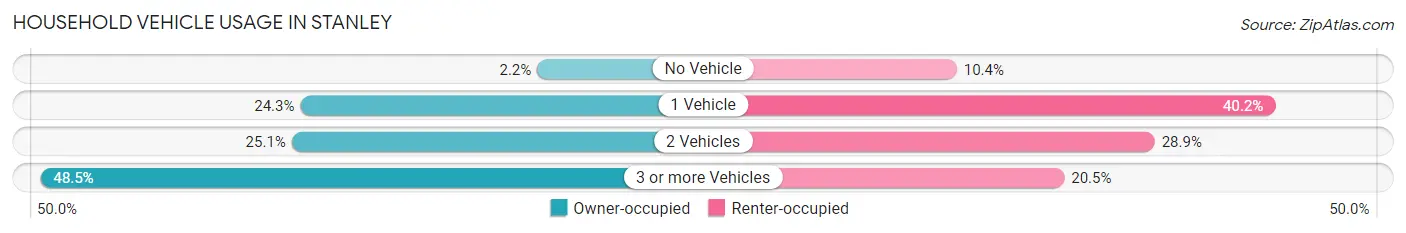
| Vehicles per Household | Owner-occupied | Renter-occupied |
| No Vehicle | 8 (2.2%) | 26 (10.4%) |
| 1 Vehicle | 90 (24.3%) | 100 (40.2%) |
| 2 Vehicles | 93 (25.1%) | 72 (28.9%) |
| 3 or more Vehicles | 180 (48.5%) | 51 (20.5%) |
| Total | 371 (100.0%) | 249 (100.0%) |
Real Estate & Mortgages in Stanley
Real Estate and Mortgage Overview in Stanley
| Characteristic | Without Mortgage | With Mortgage |
| Housing Units | 182 | 189 |
| Median Property Value | $200,000 | $166,400 |
| Median Household Income | $34,063 | $11 |
| Monthly Housing Costs | $461 | $5 |
| Real Estate Taxes | $1,274 | $2 |
Property Value by Mortgage Status in Stanley
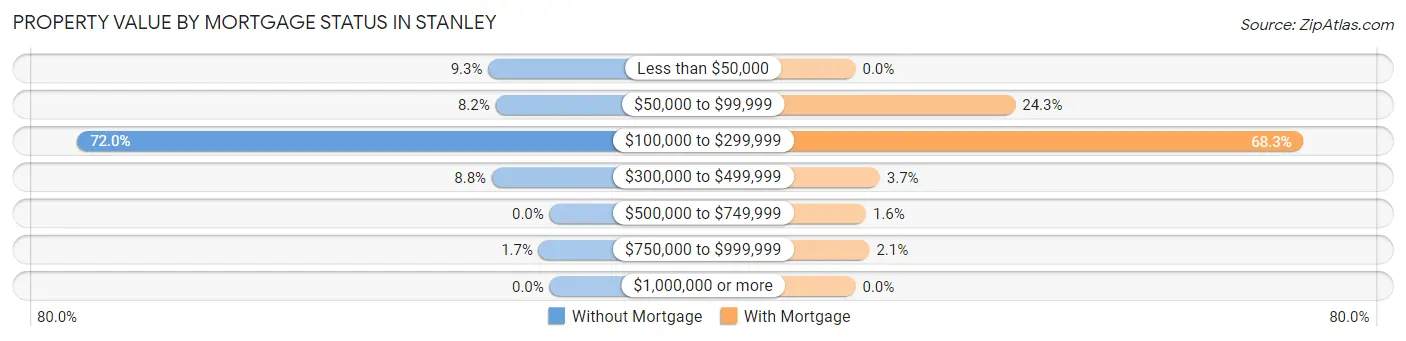
| Property Value | Without Mortgage | With Mortgage |
| Less than $50,000 | 17 (9.3%) | 0 (0.0%) |
| $50,000 to $99,999 | 15 (8.2%) | 46 (24.3%) |
| $100,000 to $299,999 | 131 (72.0%) | 129 (68.2%) |
| $300,000 to $499,999 | 16 (8.8%) | 7 (3.7%) |
| $500,000 to $749,999 | 0 (0.0%) | 3 (1.6%) |
| $750,000 to $999,999 | 3 (1.7%) | 4 (2.1%) |
| $1,000,000 or more | 0 (0.0%) | 0 (0.0%) |
| Total | 182 (100.0%) | 189 (100.0%) |
Household Income by Mortgage Status in Stanley
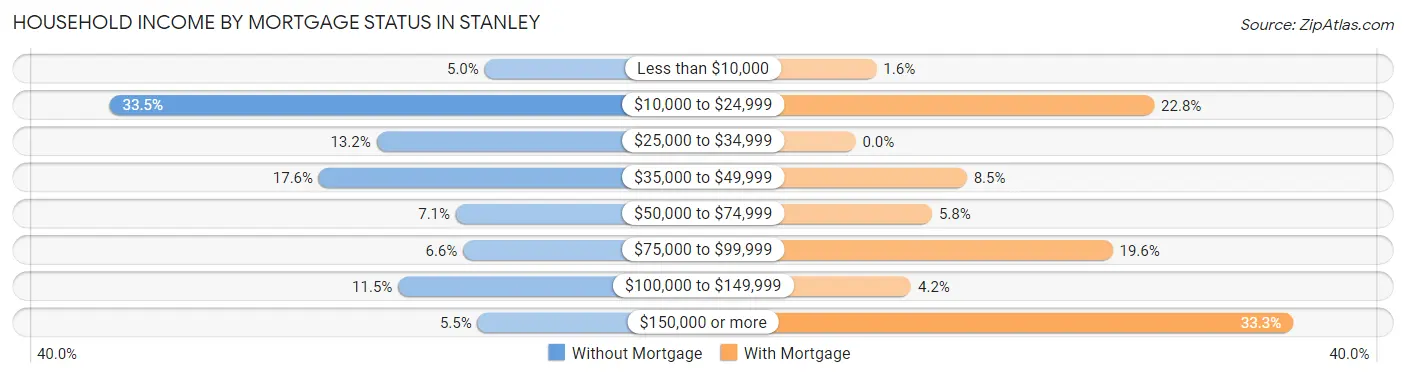
| Household Income | Without Mortgage | With Mortgage |
| Less than $10,000 | 9 (5.0%) | 3 (1.6%) |
| $10,000 to $24,999 | 61 (33.5%) | 43 (22.8%) |
| $25,000 to $34,999 | 24 (13.2%) | 0 (0.0%) |
| $35,000 to $49,999 | 32 (17.6%) | 16 (8.5%) |
| $50,000 to $74,999 | 13 (7.1%) | 11 (5.8%) |
| $75,000 to $99,999 | 12 (6.6%) | 37 (19.6%) |
| $100,000 to $149,999 | 21 (11.5%) | 8 (4.2%) |
| $150,000 or more | 10 (5.5%) | 63 (33.3%) |
| Total | 182 (100.0%) | 189 (100.0%) |
Property Value to Household Income Ratio in Stanley
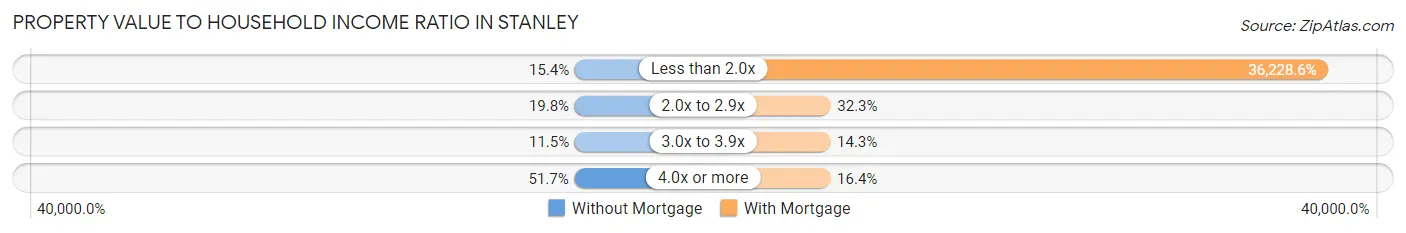
| Value-to-Income Ratio | Without Mortgage | With Mortgage |
| Less than 2.0x | 28 (15.4%) | 68,472 (36,228.6%) |
| 2.0x to 2.9x | 36 (19.8%) | 61 (32.3%) |
| 3.0x to 3.9x | 21 (11.5%) | 27 (14.3%) |
| 4.0x or more | 94 (51.6%) | 31 (16.4%) |
| Total | 182 (100.0%) | 189 (100.0%) |
Real Estate Taxes by Mortgage Status in Stanley
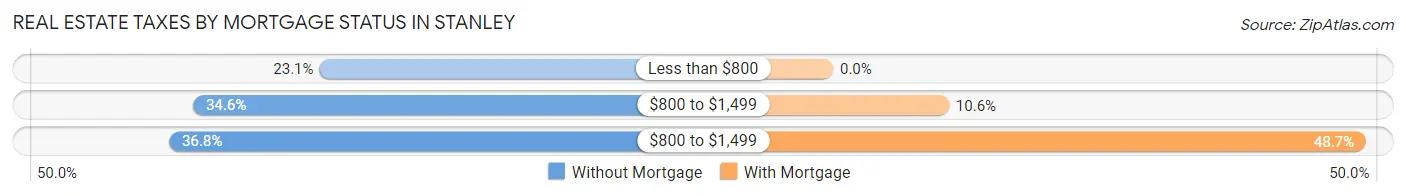
| Property Taxes | Without Mortgage | With Mortgage |
| Less than $800 | 42 (23.1%) | 0 (0.0%) |
| $800 to $1,499 | 63 (34.6%) | 20 (10.6%) |
| $800 to $1,499 | 67 (36.8%) | 92 (48.7%) |
| Total | 182 (100.0%) | 189 (100.0%) |
Health & Disability in Stanley
Health Insurance Coverage by Age in Stanley
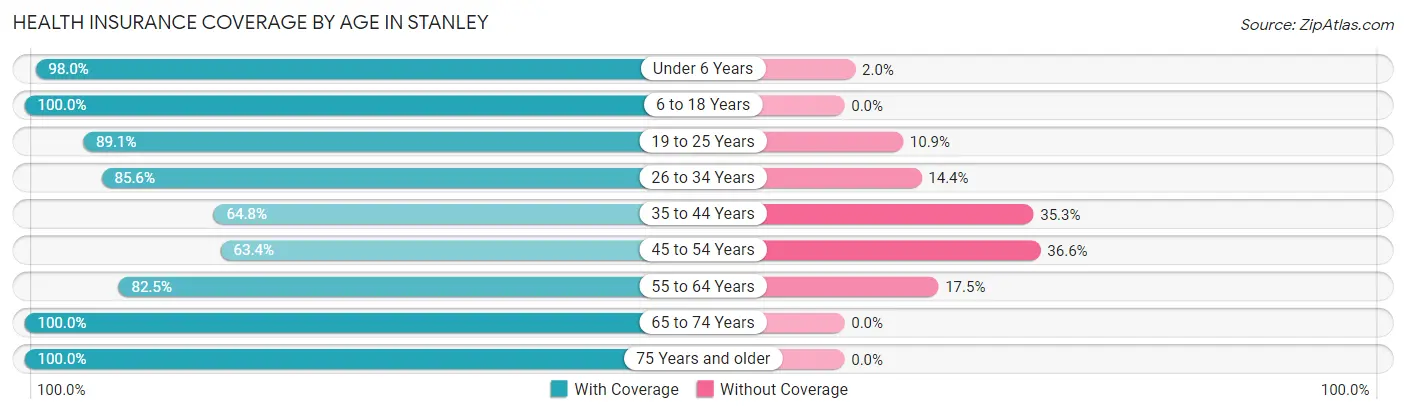
| Age Bracket | With Coverage | Without Coverage |
| Under 6 Years | 97 (98.0%) | 2 (2.0%) |
| 6 to 18 Years | 205 (100.0%) | 0 (0.0%) |
| 19 to 25 Years | 212 (89.1%) | 26 (10.9%) |
| 26 to 34 Years | 149 (85.6%) | 25 (14.4%) |
| 35 to 44 Years | 169 (64.7%) | 92 (35.2%) |
| 45 to 54 Years | 170 (63.4%) | 98 (36.6%) |
| 55 to 64 Years | 193 (82.5%) | 41 (17.5%) |
| 65 to 74 Years | 220 (100.0%) | 0 (0.0%) |
| 75 Years and older | 109 (100.0%) | 0 (0.0%) |
| Total | 1,524 (84.3%) | 284 (15.7%) |
Health Insurance Coverage by Citizenship Status in Stanley
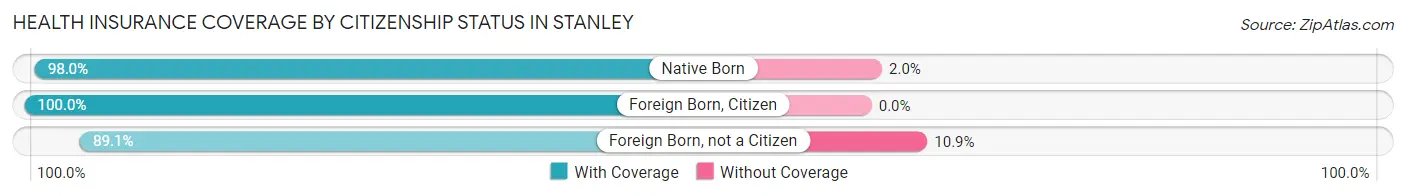
| Citizenship Status | With Coverage | Without Coverage |
| Native Born | 97 (98.0%) | 2 (2.0%) |
| Foreign Born, Citizen | 205 (100.0%) | 0 (0.0%) |
| Foreign Born, not a Citizen | 212 (89.1%) | 26 (10.9%) |
Health Insurance Coverage by Household Income in Stanley
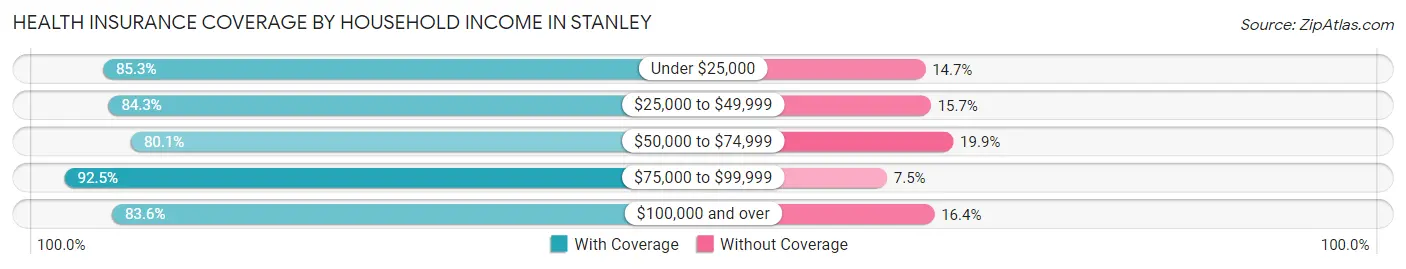
| Household Income | With Coverage | Without Coverage |
| Under $25,000 | 273 (85.3%) | 47 (14.7%) |
| $25,000 to $49,999 | 268 (84.3%) | 50 (15.7%) |
| $50,000 to $74,999 | 241 (80.1%) | 60 (19.9%) |
| $75,000 to $99,999 | 160 (92.5%) | 13 (7.5%) |
| $100,000 and over | 582 (83.6%) | 114 (16.4%) |
Public vs Private Health Insurance Coverage by Age in Stanley
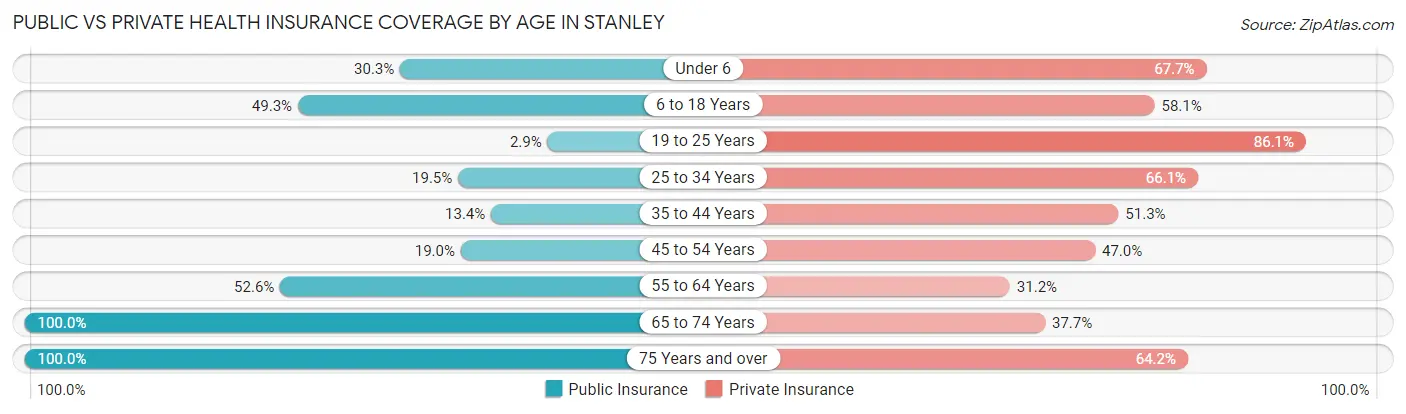
| Age Bracket | Public Insurance | Private Insurance |
| Under 6 | 30 (30.3%) | 67 (67.7%) |
| 6 to 18 Years | 101 (49.3%) | 119 (58.1%) |
| 19 to 25 Years | 7 (2.9%) | 205 (86.1%) |
| 25 to 34 Years | 34 (19.5%) | 115 (66.1%) |
| 35 to 44 Years | 35 (13.4%) | 134 (51.3%) |
| 45 to 54 Years | 51 (19.0%) | 126 (47.0%) |
| 55 to 64 Years | 123 (52.6%) | 73 (31.2%) |
| 65 to 74 Years | 220 (100.0%) | 83 (37.7%) |
| 75 Years and over | 109 (100.0%) | 70 (64.2%) |
| Total | 710 (39.3%) | 992 (54.9%) |
Disability Status by Sex by Age in Stanley
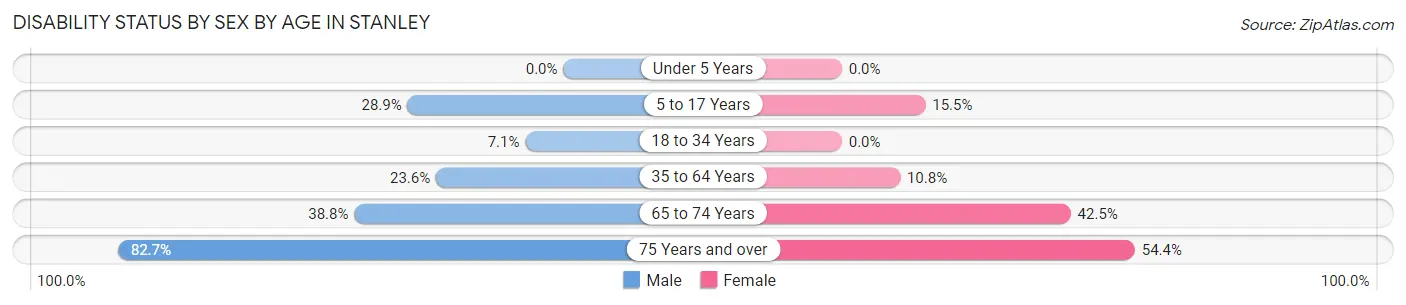
| Age Bracket | Male | Female |
| Under 5 Years | 0 (0.0%) | 0 (0.0%) |
| 5 to 17 Years | 24 (28.9%) | 20 (15.5%) |
| 18 to 34 Years | 19 (7.1%) | 0 (0.0%) |
| 35 to 64 Years | 95 (23.6%) | 39 (10.8%) |
| 65 to 74 Years | 26 (38.8%) | 65 (42.5%) |
| 75 Years and over | 43 (82.7%) | 31 (54.4%) |
Disability Class by Sex by Age in Stanley
Disability Class: Hearing Difficulty
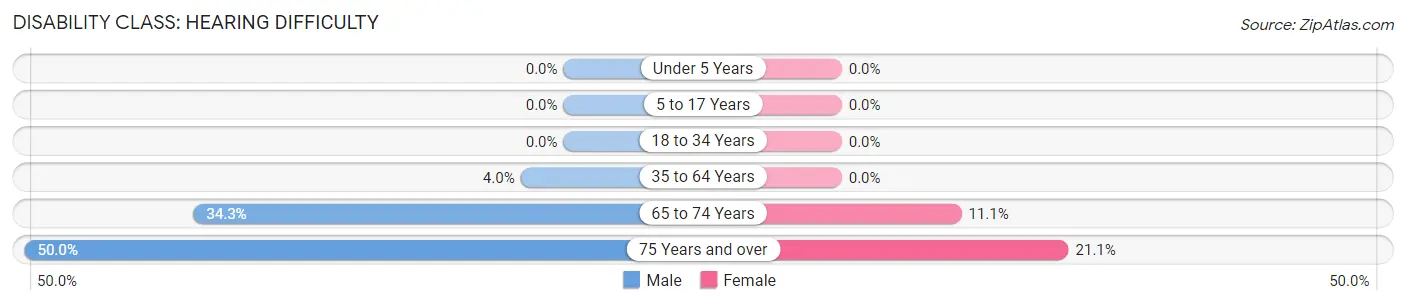
| Age Bracket | Male | Female |
| Under 5 Years | 0 (0.0%) | 0 (0.0%) |
| 5 to 17 Years | 0 (0.0%) | 0 (0.0%) |
| 18 to 34 Years | 0 (0.0%) | 0 (0.0%) |
| 35 to 64 Years | 16 (4.0%) | 0 (0.0%) |
| 65 to 74 Years | 23 (34.3%) | 17 (11.1%) |
| 75 Years and over | 26 (50.0%) | 12 (21.0%) |
Disability Class: Vision Difficulty
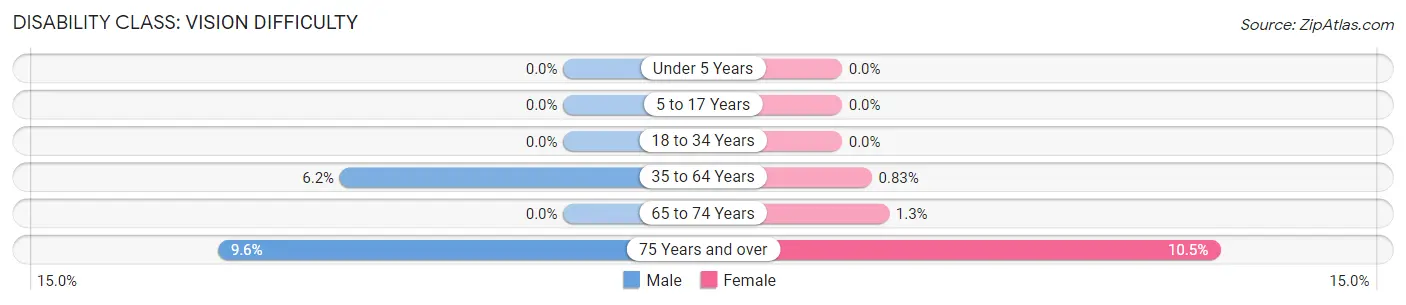
| Age Bracket | Male | Female |
| Under 5 Years | 0 (0.0%) | 0 (0.0%) |
| 5 to 17 Years | 0 (0.0%) | 0 (0.0%) |
| 18 to 34 Years | 0 (0.0%) | 0 (0.0%) |
| 35 to 64 Years | 25 (6.2%) | 3 (0.8%) |
| 65 to 74 Years | 0 (0.0%) | 2 (1.3%) |
| 75 Years and over | 5 (9.6%) | 6 (10.5%) |
Disability Class: Cognitive Difficulty
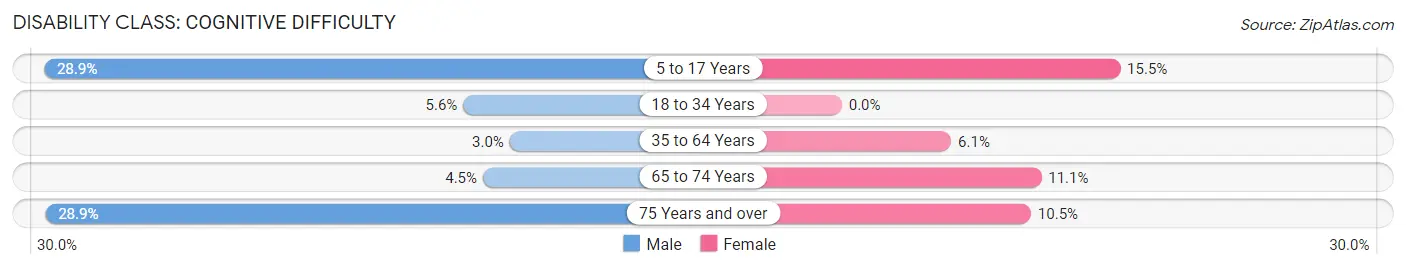
| Age Bracket | Male | Female |
| 5 to 17 Years | 24 (28.9%) | 20 (15.5%) |
| 18 to 34 Years | 15 (5.6%) | 0 (0.0%) |
| 35 to 64 Years | 12 (3.0%) | 22 (6.1%) |
| 65 to 74 Years | 3 (4.5%) | 17 (11.1%) |
| 75 Years and over | 15 (28.8%) | 6 (10.5%) |
Disability Class: Ambulatory Difficulty
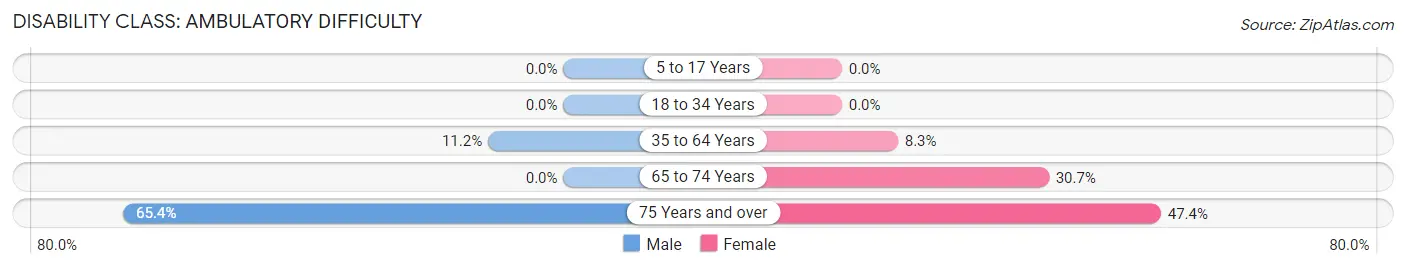
| Age Bracket | Male | Female |
| 5 to 17 Years | 0 (0.0%) | 0 (0.0%) |
| 18 to 34 Years | 0 (0.0%) | 0 (0.0%) |
| 35 to 64 Years | 45 (11.2%) | 30 (8.3%) |
| 65 to 74 Years | 0 (0.0%) | 47 (30.7%) |
| 75 Years and over | 34 (65.4%) | 27 (47.4%) |
Disability Class: Self-Care Difficulty
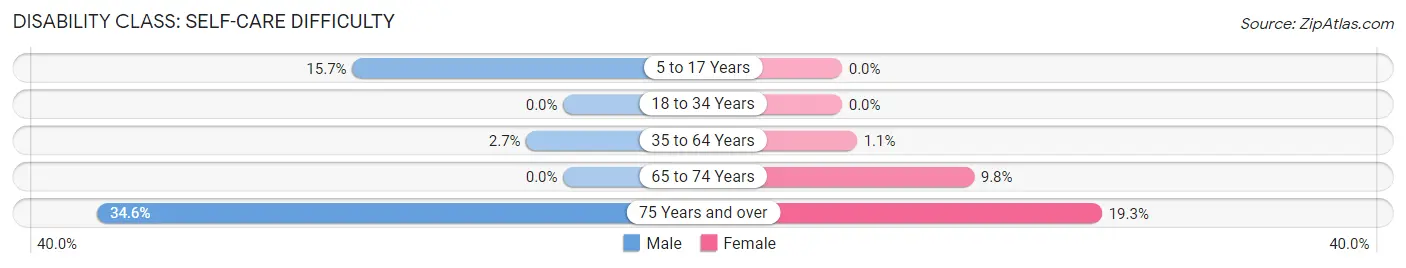
| Age Bracket | Male | Female |
| 5 to 17 Years | 13 (15.7%) | 0 (0.0%) |
| 18 to 34 Years | 0 (0.0%) | 0 (0.0%) |
| 35 to 64 Years | 11 (2.7%) | 4 (1.1%) |
| 65 to 74 Years | 0 (0.0%) | 15 (9.8%) |
| 75 Years and over | 18 (34.6%) | 11 (19.3%) |
Technology Access in Stanley
Computing Device Access in Stanley
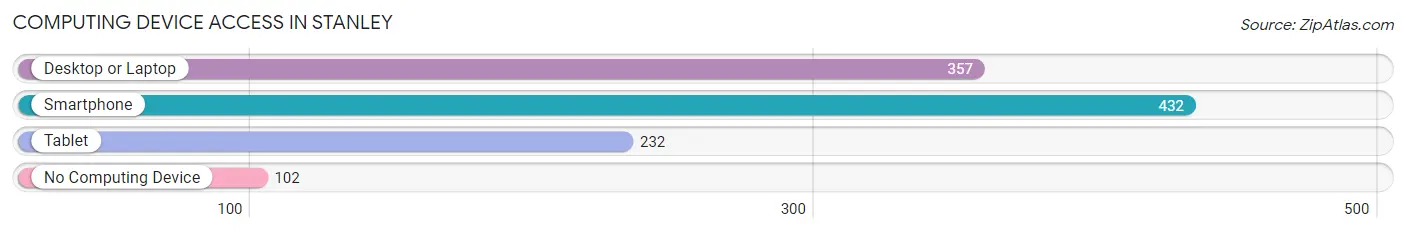
| Device Type | # Households | % Households |
| Desktop or Laptop | 357 | 57.6% |
| Smartphone | 432 | 69.7% |
| Tablet | 232 | 37.4% |
| No Computing Device | 102 | 16.5% |
| Total | 620 | 100.0% |
Internet Access in Stanley

| Internet Type | # Households | % Households |
| Dial-Up Internet | 0 | 0.0% |
| Broadband Home | 378 | 61.0% |
| Cellular Data Only | 52 | 8.4% |
| Satellite Internet | 41 | 6.6% |
| No Internet | 161 | 26.0% |
| Total | 620 | 100.0% |
Stanley Summary
Stanley, Virginia is a small town located in Page County, Virginia. It is situated in the Shenandoah Valley, approximately 10 miles south of Luray and 15 miles north of Harrisonburg. The town was founded in 1820 and is named after the Stanley family, who were among the first settlers in the area.
History
The area that is now Stanley was first settled in the late 1700s by the Stanley family, who were among the first settlers in the area. The town was officially established in 1820 and was named after the Stanley family. The town was originally a farming community, with the main crops being corn, wheat, and tobacco. In the late 1800s, the town began to grow and develop, with the construction of a railroad line and the opening of a post office.
In the early 1900s, the town began to experience a period of growth and development. The town was home to several businesses, including a general store, a blacksmith shop, a sawmill, and a gristmill. The town also had a school, a church, and a hotel.
In the mid-1900s, the town experienced a period of decline. The railroad line was abandoned and the post office closed. The town's population decreased and many of the businesses closed. In the late 1900s, the town began to experience a period of revitalization. The town was home to several new businesses, including a restaurant, a grocery store, and a hardware store.
Geography
Stanley is located in the Shenandoah Valley in Page County, Virginia. The town is situated on the banks of the South Fork of the Shenandoah River. The town is surrounded by rolling hills and mountains, with the Blue Ridge Mountains to the east and the Massanutten Mountains to the west. The town is located approximately 10 miles south of Luray and 15 miles north of Harrisonburg.
Economy
The economy of Stanley is largely based on agriculture and tourism. The town is home to several farms, which produce a variety of crops, including corn, wheat, and tobacco. The town is also home to several wineries, which produce a variety of wines. The town is also home to several restaurants, shops, and other businesses.
Demographics
As of the 2010 census, the population of Stanley was 1,092. The town has a total area of 0.7 square miles, all of which is land. The town has a population density of 1,541 people per square mile. The median household income in Stanley is $41,250, and the median age is 44. The town is predominantly white, with 92.3% of the population identifying as white. The town also has a small Hispanic population, with 4.2% of the population identifying as Hispanic or Latino.
Common Questions
What is Per Capita Income in Stanley?
Per Capita income in Stanley is $28,382.
What is the Median Family Income in Stanley?
Median Family Income in Stanley is $60,000.
What is the Median Household income in Stanley?
Median Household Income in Stanley is $42,976.
What is Income or Wage Gap in Stanley?
Income or Wage Gap in Stanley is 19.3%.
Women in Stanley earn 80.7 cents for every dollar earned by a man.
What is Inequality or Gini Index in Stanley?
Inequality or Gini Index in Stanley is 0.47.
What is the Total Population of Stanley?
Total Population of Stanley is 1,811.
What is the Total Male Population of Stanley?
Total Male Population of Stanley is 919.
What is the Total Female Population of Stanley?
Total Female Population of Stanley is 892.
What is the Ratio of Males per 100 Females in Stanley?
There are 103.03 Males per 100 Females in Stanley.
What is the Ratio of Females per 100 Males in Stanley?
There are 97.06 Females per 100 Males in Stanley.
What is the Median Population Age in Stanley?
Median Population Age in Stanley is 41.1 Years.
What is the Average Family Size in Stanley
Average Family Size in Stanley is 3.8 People.
What is the Average Household Size in Stanley
Average Household Size in Stanley is 2.9 People.
How Large is the Labor Force in Stanley?
There are 1,010 People in the Labor Forcein in Stanley.
What is the Percentage of People in the Labor Force in Stanley?
65.6% of People are in the Labor Force in Stanley.
What is the Unemployment Rate in Stanley?
Unemployment Rate in Stanley is 5.9%.