Ivor, VA Map & Demographics
Ivor Map
Ivor Overview
$35,089
PER CAPITA INCOME
$95,000
AVG FAMILY INCOME
$57,857
AVG HOUSEHOLD INCOME
0.36
INEQUALITY / GINI INDEX
276
TOTAL POPULATION
127
MALE POPULATION
149
FEMALE POPULATION
85.23
MALES / 100 FEMALES
117.32
FEMALES / 100 MALES
56.2
MEDIAN AGE
2.5
AVG FAMILY SIZE
2.0
AVG HOUSEHOLD SIZE
130
LABOR FORCE [ PEOPLE ]
55.1%
PERCENT IN LABOR FORCE
Ivor Zip Codes
Ivor Area Codes
Income in Ivor
Income Overview in Ivor
Per Capita Income in Ivor is $35,089, while median incomes of families and households are $95,000 and $57,857 respectively.
| Characteristic | Number | Measure |
| Per Capita Income | 276 | $35,089 |
| Median Family Income | 80 | $95,000 |
| Mean Family Income | 80 | $86,695 |
| Median Household Income | 138 | $57,857 |
| Mean Household Income | 138 | $68,407 |
| Income Deficit | 80 | $0 |
| Wage / Income Gap (%) | 276 | 0.00% |
| Wage / Income Gap ($) | 276 | 100.00¢ per $1 |
| Gini / Inequality Index | 276 | 0.36 |
Earnings by Sex in Ivor
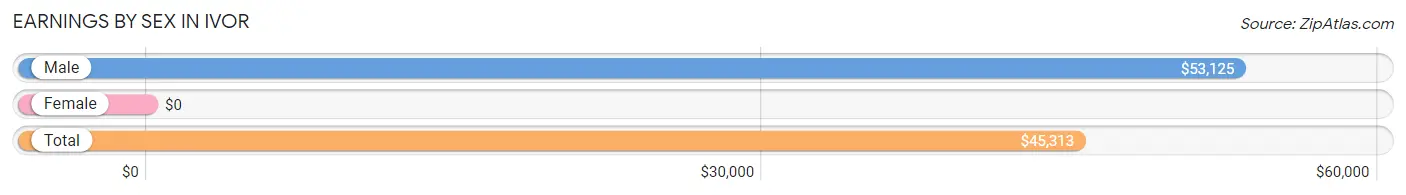
| Sex | Number | Average Earnings |
| Male | 79 (56.0%) | $53,125 |
| Female | 62 (44.0%) | $0 |
| Total | 141 (100.0%) | $45,313 |
Earnings by Sex by Income Bracket in Ivor
The most common earnings brackets in Ivor are $75,000 to $99,999 for men (13 | 16.5%) and $2,499 or less for women (13 | 21.0%).
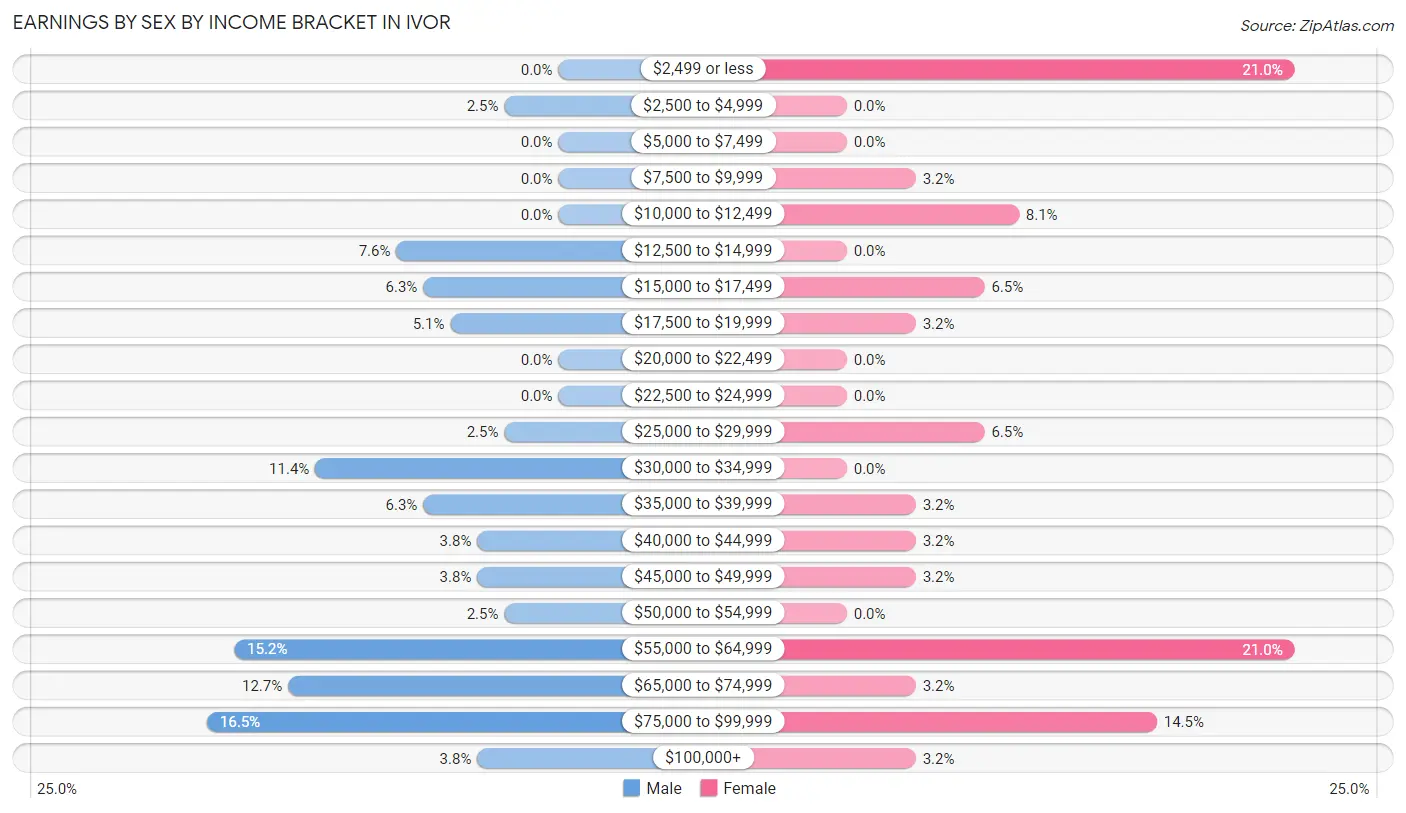
| Income | Male | Female |
| $2,499 or less | 0 (0.0%) | 13 (21.0%) |
| $2,500 to $4,999 | 2 (2.5%) | 0 (0.0%) |
| $5,000 to $7,499 | 0 (0.0%) | 0 (0.0%) |
| $7,500 to $9,999 | 0 (0.0%) | 2 (3.2%) |
| $10,000 to $12,499 | 0 (0.0%) | 5 (8.1%) |
| $12,500 to $14,999 | 6 (7.6%) | 0 (0.0%) |
| $15,000 to $17,499 | 5 (6.3%) | 4 (6.5%) |
| $17,500 to $19,999 | 4 (5.1%) | 2 (3.2%) |
| $20,000 to $22,499 | 0 (0.0%) | 0 (0.0%) |
| $22,500 to $24,999 | 0 (0.0%) | 0 (0.0%) |
| $25,000 to $29,999 | 2 (2.5%) | 4 (6.5%) |
| $30,000 to $34,999 | 9 (11.4%) | 0 (0.0%) |
| $35,000 to $39,999 | 5 (6.3%) | 2 (3.2%) |
| $40,000 to $44,999 | 3 (3.8%) | 2 (3.2%) |
| $45,000 to $49,999 | 3 (3.8%) | 2 (3.2%) |
| $50,000 to $54,999 | 2 (2.5%) | 0 (0.0%) |
| $55,000 to $64,999 | 12 (15.2%) | 13 (21.0%) |
| $65,000 to $74,999 | 10 (12.7%) | 2 (3.2%) |
| $75,000 to $99,999 | 13 (16.5%) | 9 (14.5%) |
| $100,000+ | 3 (3.8%) | 2 (3.2%) |
| Total | 79 (100.0%) | 62 (100.0%) |
Earnings by Sex by Educational Attainment in Ivor
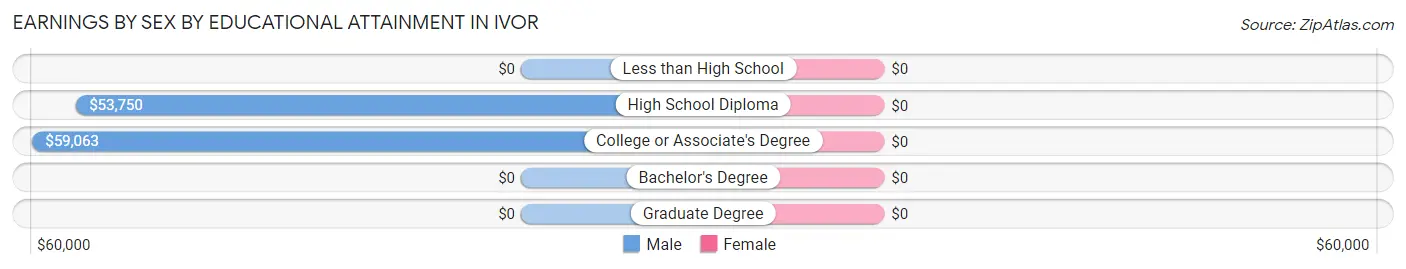
| Educational Attainment | Male Income | Female Income |
| Less than High School | - | - |
| High School Diploma | $53,750 | $0 |
| College or Associate's Degree | $59,063 | $0 |
| Bachelor's Degree | - | - |
| Graduate Degree | - | - |
| Total | $55,625 | $0 |
Family Income in Ivor
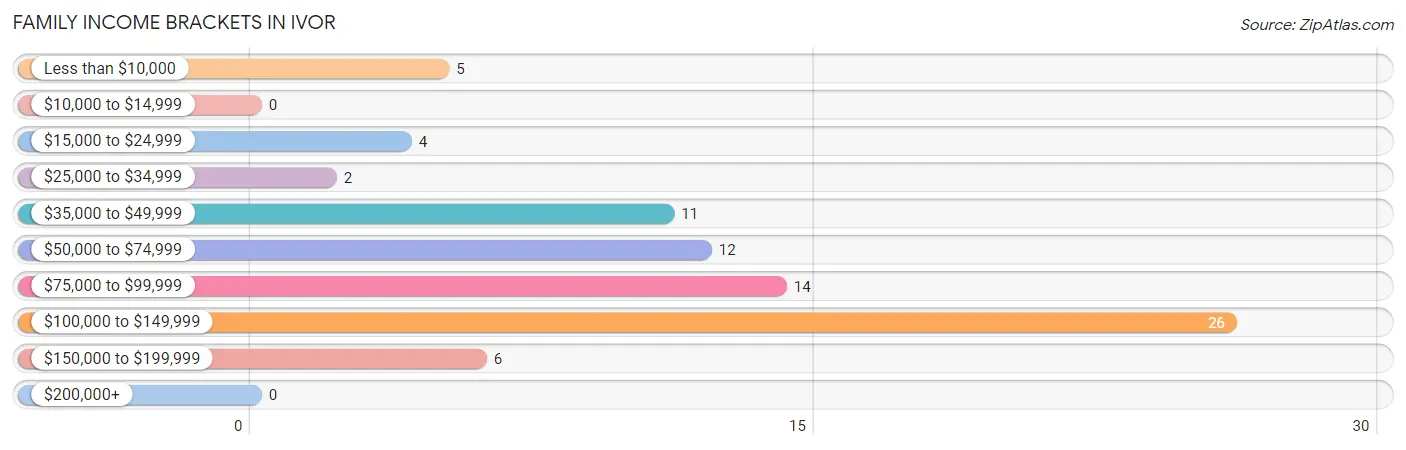
Family Income Brackets in Ivor
According to the Ivor family income data, there are 26 families falling into the $100,000 to $149,999 income range, which is the most common income bracket and makes up 32.5% of all families.
| Income Bracket | # Families | % Families |
| Less than $10,000 | 5 | 6.3% |
| $10,000 to $14,999 | 0 | 0.0% |
| $15,000 to $24,999 | 4 | 5.0% |
| $25,000 to $34,999 | 2 | 2.5% |
| $35,000 to $49,999 | 11 | 13.8% |
| $50,000 to $74,999 | 12 | 15.0% |
| $75,000 to $99,999 | 14 | 17.5% |
| $100,000 to $149,999 | 26 | 32.5% |
| $150,000 to $199,999 | 6 | 7.5% |
| $200,000+ | 0 | 0.0% |
Family Income by Famaliy Size in Ivor
2-person families (54 | 67.5%) account for the highest median family income in Ivor with $97,083 per family, while 2-person families (54 | 67.5%) have the highest median income of $48,542 per family member.
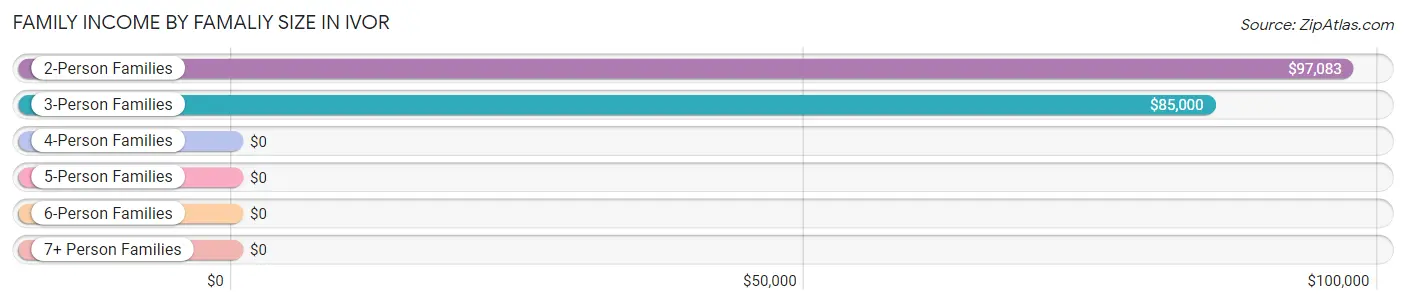
| Income Bracket | # Families | Median Income |
| 2-Person Families | 54 (67.5%) | $97,083 |
| 3-Person Families | 18 (22.5%) | $85,000 |
| 4-Person Families | 5 (6.2%) | $0 |
| 5-Person Families | 1 (1.3%) | $0 |
| 6-Person Families | 2 (2.5%) | $0 |
| 7+ Person Families | 0 (0.0%) | $0 |
| Total | 80 (100.0%) | $95,000 |
Family Income by Number of Earners in Ivor
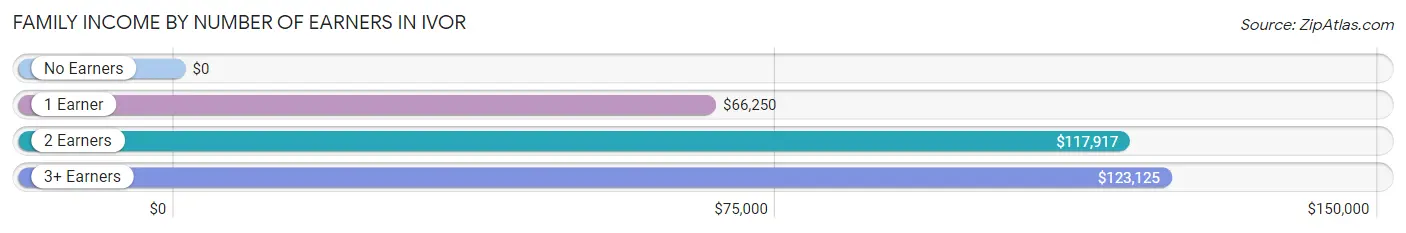
| Number of Earners | # Families | Median Income |
| No Earners | 20 (25.0%) | $0 |
| 1 Earner | 24 (30.0%) | $66,250 |
| 2 Earners | 29 (36.2%) | $117,917 |
| 3+ Earners | 7 (8.7%) | $123,125 |
| Total | 80 (100.0%) | $95,000 |
Household Income in Ivor
Household Income Brackets in Ivor
With 28 households falling in the category, the $35,000 to $49,999 income range is the most frequent in Ivor, accounting for 20.3% of all households.
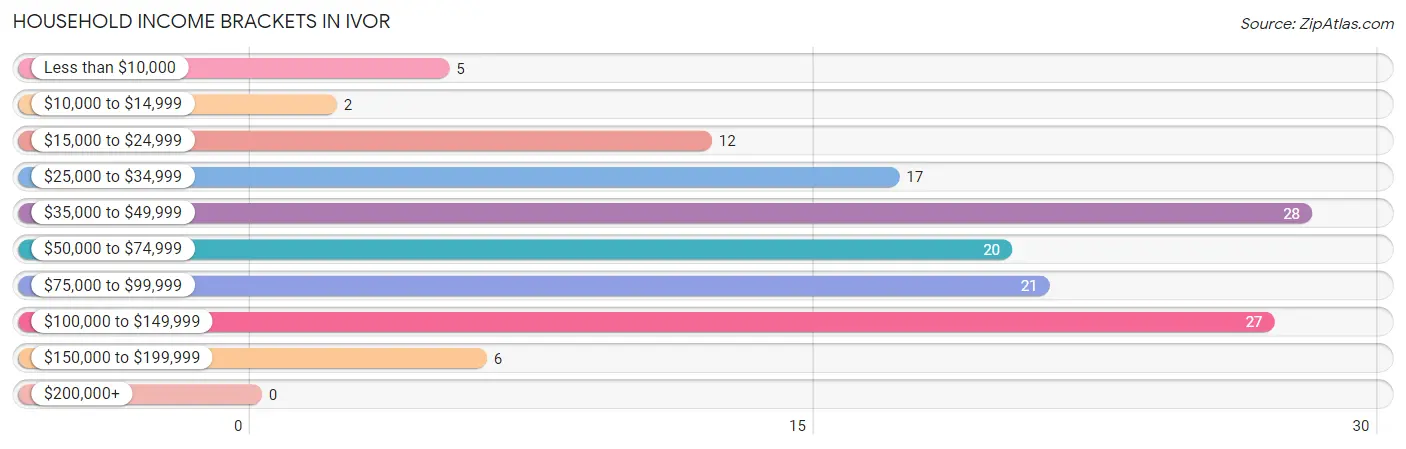
| Income Bracket | # Households | % Households |
| Less than $10,000 | 5 | 3.6% |
| $10,000 to $14,999 | 2 | 1.4% |
| $15,000 to $24,999 | 12 | 8.7% |
| $25,000 to $34,999 | 17 | 12.3% |
| $35,000 to $49,999 | 28 | 20.3% |
| $50,000 to $74,999 | 20 | 14.5% |
| $75,000 to $99,999 | 21 | 15.2% |
| $100,000 to $149,999 | 27 | 19.6% |
| $150,000 to $199,999 | 6 | 4.3% |
| $200,000+ | 0 | 0.0% |
Household Income by Householder Age in Ivor
The median household income in Ivor is $57,857, with the highest median household income of $95,208 found in the 45 to 64 years age bracket for the primary householder. A total of 59 households (42.7%) fall into this category. Meanwhile, the 15 to 24 years age bracket for the primary householder has the lowest median household income of $0, with 4 households (2.9%) in this group.
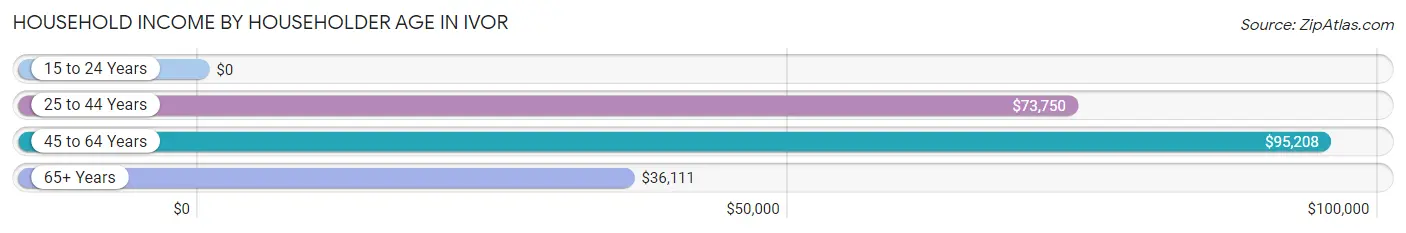
| Income Bracket | # Households | Median Income |
| 15 to 24 Years | 4 (2.9%) | $0 |
| 25 to 44 Years | 19 (13.8%) | $73,750 |
| 45 to 64 Years | 59 (42.7%) | $95,208 |
| 65+ Years | 56 (40.6%) | $36,111 |
| Total | 138 (100.0%) | $57,857 |
Poverty in Ivor
Income Below Poverty by Sex and Age in Ivor
With 5.0% poverty level for males and 14.1% for females among the residents of Ivor, 12 to 14 year old males and 35 to 44 year old females are the most vulnerable to poverty, with 6 males (85.7%) and 5 females (41.7%) in their respective age groups living below the poverty level.
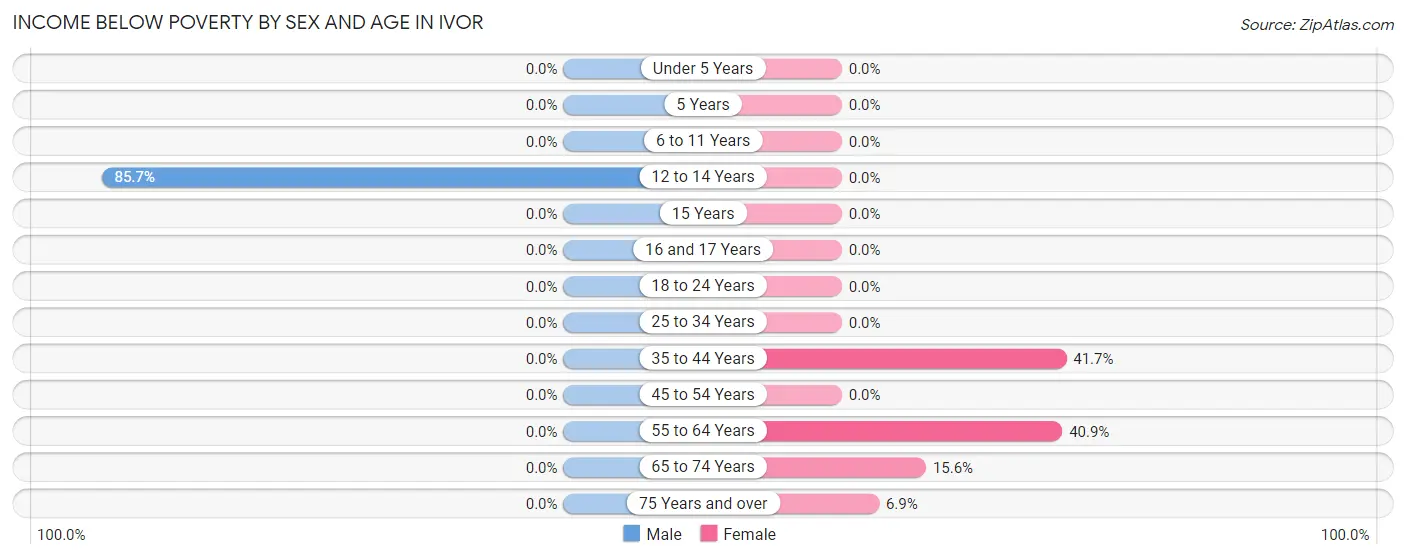
| Age Bracket | Male | Female |
| Under 5 Years | 0 (0.0%) | 0 (0.0%) |
| 5 Years | 0 (0.0%) | 0 (0.0%) |
| 6 to 11 Years | 0 (0.0%) | 0 (0.0%) |
| 12 to 14 Years | 6 (85.7%) | 0 (0.0%) |
| 15 Years | 0 (0.0%) | 0 (0.0%) |
| 16 and 17 Years | 0 (0.0%) | 0 (0.0%) |
| 18 to 24 Years | 0 (0.0%) | 0 (0.0%) |
| 25 to 34 Years | 0 (0.0%) | 0 (0.0%) |
| 35 to 44 Years | 0 (0.0%) | 5 (41.7%) |
| 45 to 54 Years | 0 (0.0%) | 0 (0.0%) |
| 55 to 64 Years | 0 (0.0%) | 9 (40.9%) |
| 65 to 74 Years | 0 (0.0%) | 5 (15.6%) |
| 75 Years and over | 0 (0.0%) | 2 (6.9%) |
| Total | 6 (5.0%) | 21 (14.1%) |
Income Above Poverty by Sex and Age in Ivor
According to the poverty statistics in Ivor, males aged under 5 years and females aged under 5 years are the age groups that are most secure financially, with 100.0% of males and 100.0% of females in these age groups living above the poverty line.
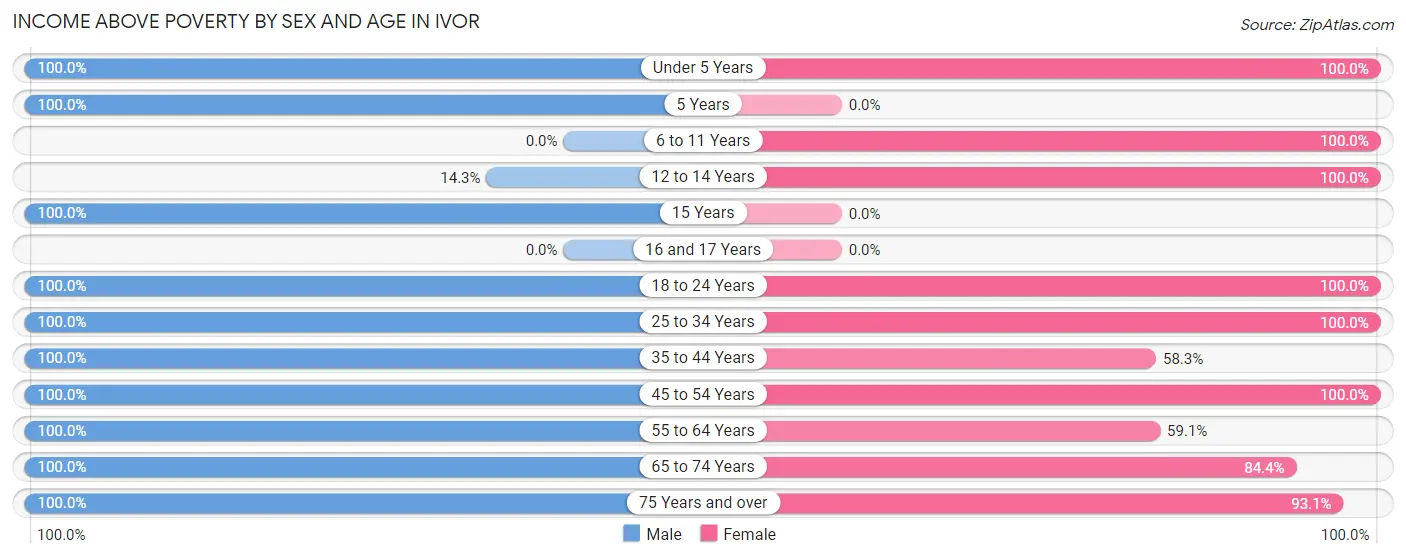
| Age Bracket | Male | Female |
| Under 5 Years | 7 (100.0%) | 8 (100.0%) |
| 5 Years | 1 (100.0%) | 0 (0.0%) |
| 6 to 11 Years | 0 (0.0%) | 9 (100.0%) |
| 12 to 14 Years | 1 (14.3%) | 1 (100.0%) |
| 15 Years | 1 (100.0%) | 0 (0.0%) |
| 16 and 17 Years | 0 (0.0%) | 0 (0.0%) |
| 18 to 24 Years | 4 (100.0%) | 3 (100.0%) |
| 25 to 34 Years | 22 (100.0%) | 15 (100.0%) |
| 35 to 44 Years | 1 (100.0%) | 7 (58.3%) |
| 45 to 54 Years | 21 (100.0%) | 18 (100.0%) |
| 55 to 64 Years | 28 (100.0%) | 13 (59.1%) |
| 65 to 74 Years | 19 (100.0%) | 27 (84.4%) |
| 75 Years and over | 10 (100.0%) | 27 (93.1%) |
| Total | 115 (95.0%) | 128 (85.9%) |
Income Below Poverty Among Married-Couple Families in Ivor
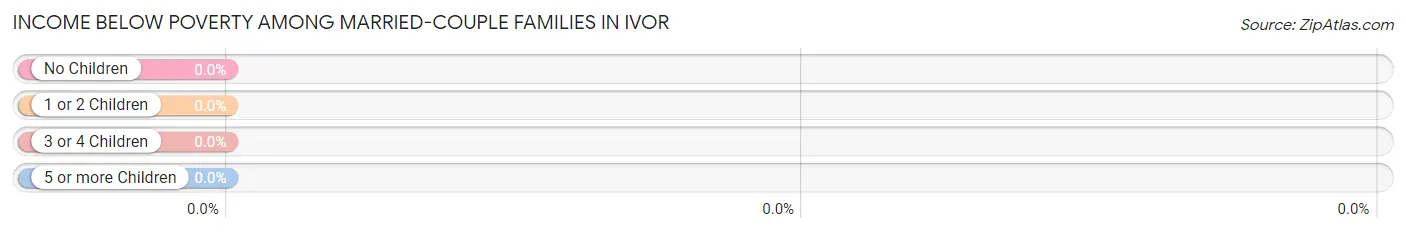
| Children | Above Poverty | Below Poverty |
| No Children | 57 (100.0%) | 0 (0.0%) |
| 1 or 2 Children | 10 (100.0%) | 0 (0.0%) |
| 3 or 4 Children | 3 (100.0%) | 0 (0.0%) |
| 5 or more Children | 0 (0.0%) | 0 (0.0%) |
| Total | 70 (100.0%) | 0 (0.0%) |
Income Below Poverty Among Single-Parent Households in Ivor
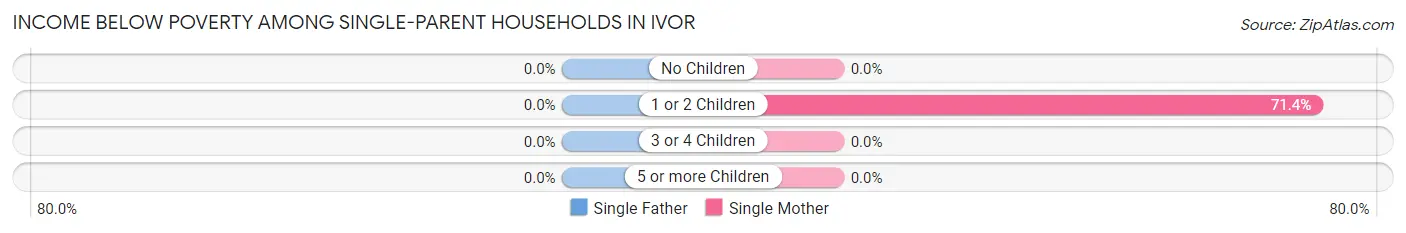
| Children | Single Father | Single Mother |
| No Children | 0 (0.0%) | 0 (0.0%) |
| 1 or 2 Children | 0 (0.0%) | 5 (71.4%) |
| 3 or 4 Children | 0 (0.0%) | 0 (0.0%) |
| 5 or more Children | 0 (0.0%) | 0 (0.0%) |
| Total | 0 (0.0%) | 5 (71.4%) |
Income Below Poverty Among Married-Couple vs Single-Parent Households in Ivor
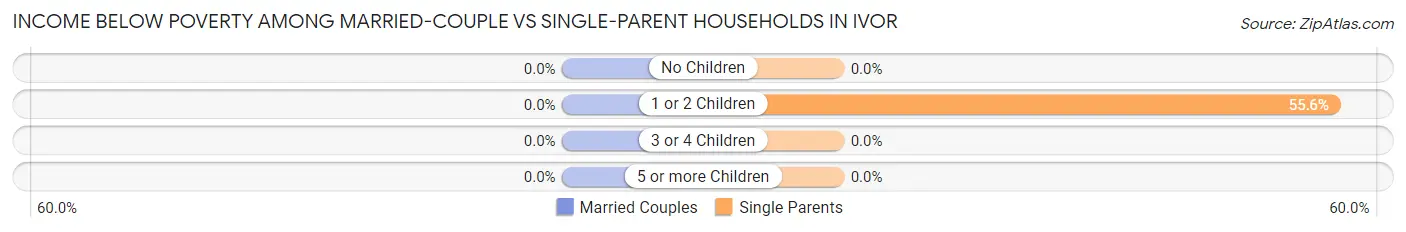
| Children | Married-Couple Families | Single-Parent Households |
| No Children | 0 (0.0%) | 0 (0.0%) |
| 1 or 2 Children | 0 (0.0%) | 5 (55.6%) |
| 3 or 4 Children | 0 (0.0%) | 0 (0.0%) |
| 5 or more Children | 0 (0.0%) | 0 (0.0%) |
| Total | 0 (0.0%) | 5 (50.0%) |
Race in Ivor
The most populous races in Ivor are White / Caucasian (231 | 83.7%), Two or more Races (24 | 8.7%), and Black / African American (21 | 7.6%).
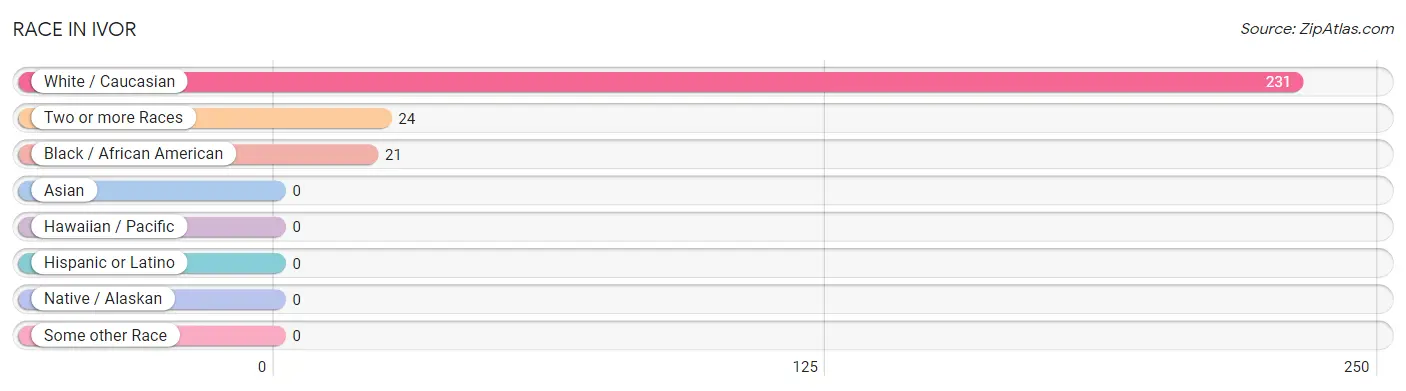
| Race | # Population | % Population |
| Asian | 0 | 0.0% |
| Black / African American | 21 | 7.6% |
| Hawaiian / Pacific | 0 | 0.0% |
| Hispanic or Latino | 0 | 0.0% |
| Native / Alaskan | 0 | 0.0% |
| White / Caucasian | 231 | 83.7% |
| Two or more Races | 24 | 8.7% |
| Some other Race | 0 | 0.0% |
| Total | 276 | 100.0% |
Ancestry in Ivor
The most populous ancestries reported in Ivor are English (36 | 13.0%), American (30 | 10.9%), Irish (28 | 10.1%), African (20 | 7.2%), and Subsaharan African (20 | 7.2%), together accounting for 48.5% of all Ivor residents.
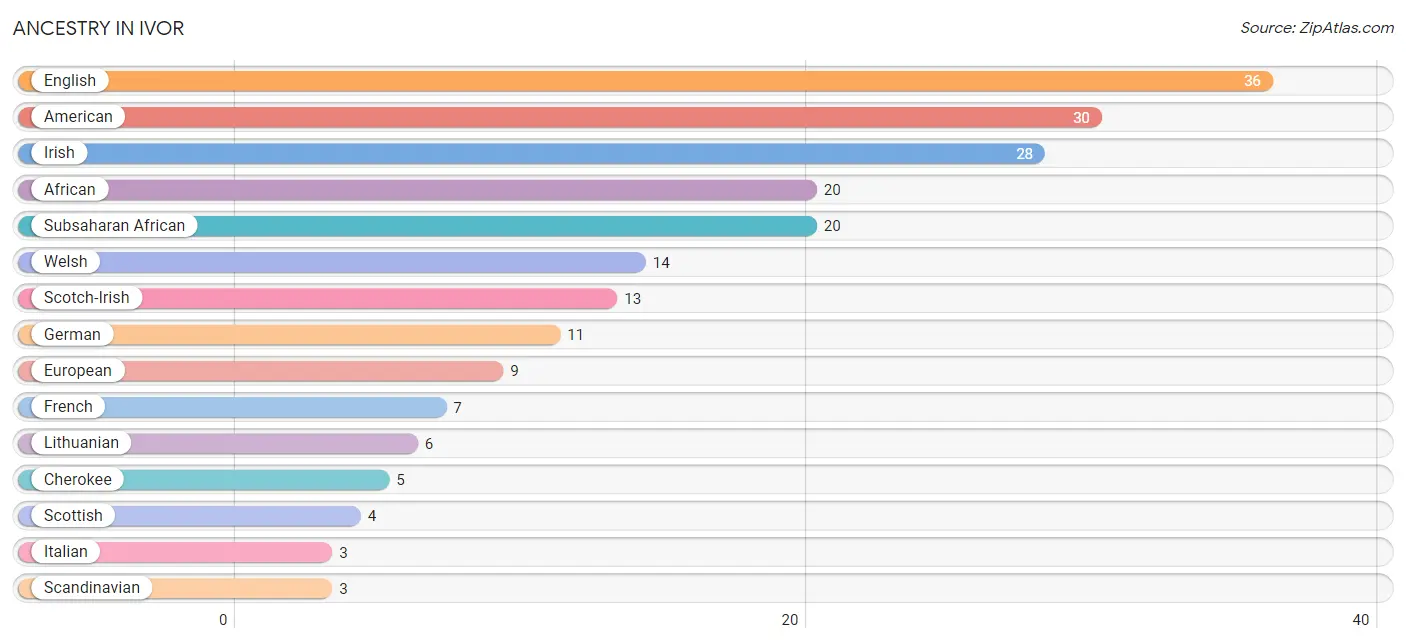
| Ancestry | # Population | % Population |
| African | 20 | 7.2% |
| American | 30 | 10.9% |
| British | 2 | 0.7% |
| Cherokee | 5 | 1.8% |
| English | 36 | 13.0% |
| European | 9 | 3.3% |
| French | 7 | 2.5% |
| German | 11 | 4.0% |
| Irish | 28 | 10.1% |
| Italian | 3 | 1.1% |
| Lithuanian | 6 | 2.2% |
| Polish | 2 | 0.7% |
| Russian | 2 | 0.7% |
| Scandinavian | 3 | 1.1% |
| Scotch-Irish | 13 | 4.7% |
| Scottish | 4 | 1.5% |
| Subsaharan African | 20 | 7.2% |
| Welsh | 14 | 5.1% |
| Yugoslavian | 2 | 0.7% | View All 19 Rows |
Immigrants in Ivor
The most numerous immigrant groups reported in Ivor came from Eastern Europe (2 | 0.7%), and Europe (2 | 0.7%), together accounting for 1.4% of all Ivor residents.
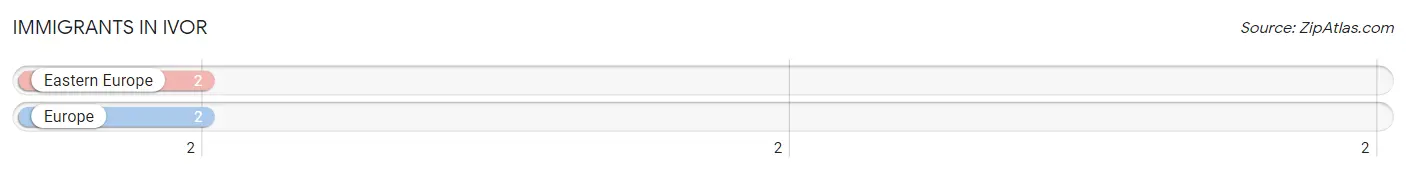
| Immigration Origin | # Population | % Population |
| Eastern Europe | 2 | 0.7% |
| Europe | 2 | 0.7% | View All 2 Rows |
Sex and Age in Ivor
Sex and Age in Ivor
The most populous age groups in Ivor are 50 to 54 Years (16 | 12.6%) for men and 65 to 69 Years (21 | 14.1%) for women.
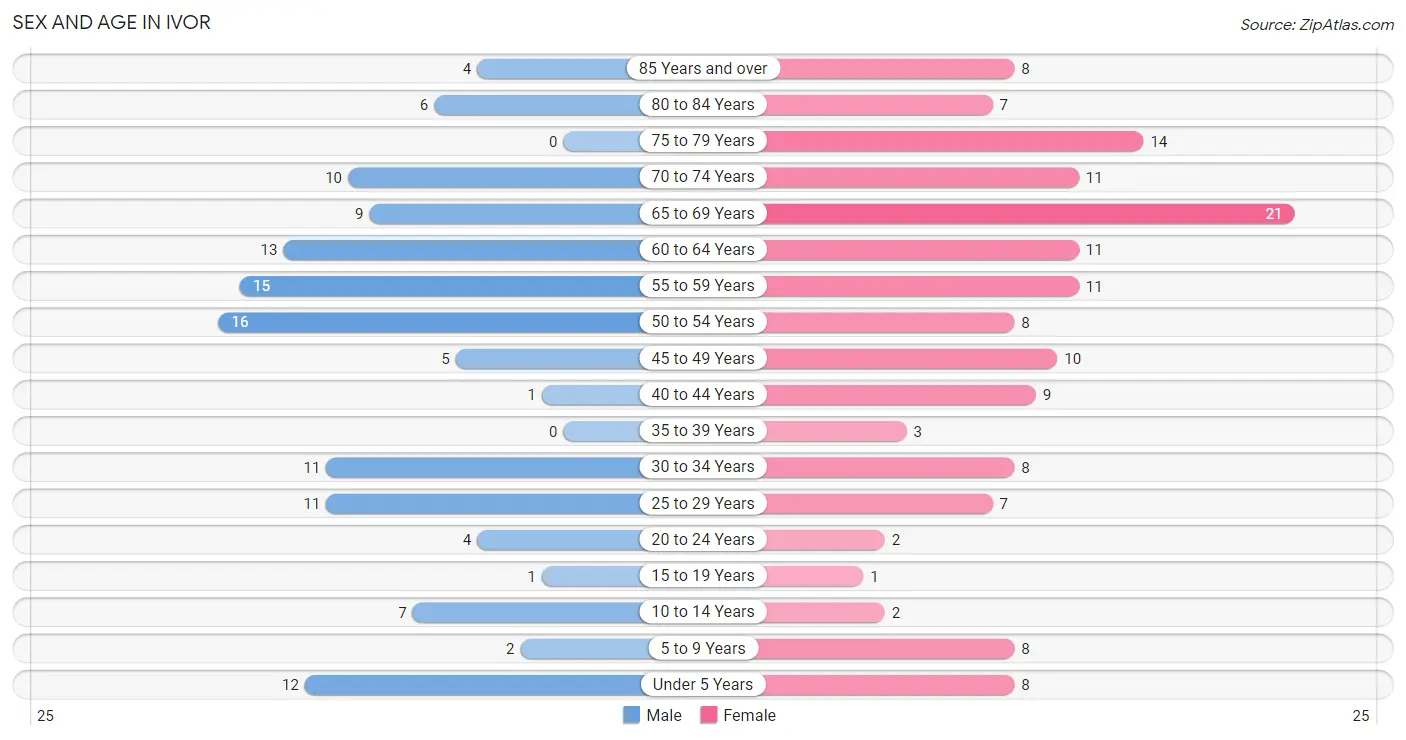
| Age Bracket | Male | Female |
| Under 5 Years | 12 (9.5%) | 8 (5.4%) |
| 5 to 9 Years | 2 (1.6%) | 8 (5.4%) |
| 10 to 14 Years | 7 (5.5%) | 2 (1.3%) |
| 15 to 19 Years | 1 (0.8%) | 1 (0.7%) |
| 20 to 24 Years | 4 (3.2%) | 2 (1.3%) |
| 25 to 29 Years | 11 (8.7%) | 7 (4.7%) |
| 30 to 34 Years | 11 (8.7%) | 8 (5.4%) |
| 35 to 39 Years | 0 (0.0%) | 3 (2.0%) |
| 40 to 44 Years | 1 (0.8%) | 9 (6.0%) |
| 45 to 49 Years | 5 (3.9%) | 10 (6.7%) |
| 50 to 54 Years | 16 (12.6%) | 8 (5.4%) |
| 55 to 59 Years | 15 (11.8%) | 11 (7.4%) |
| 60 to 64 Years | 13 (10.2%) | 11 (7.4%) |
| 65 to 69 Years | 9 (7.1%) | 21 (14.1%) |
| 70 to 74 Years | 10 (7.9%) | 11 (7.4%) |
| 75 to 79 Years | 0 (0.0%) | 14 (9.4%) |
| 80 to 84 Years | 6 (4.7%) | 7 (4.7%) |
| 85 Years and over | 4 (3.2%) | 8 (5.4%) |
| Total | 127 (100.0%) | 149 (100.0%) |
Families and Households in Ivor
Median Family Size in Ivor
The median family size in Ivor is 2.48 persons per family, with single female/mother families (7 | 8.7%) accounting for the largest median family size of 2.86 persons per family. On the other hand, single male/father families (3 | 3.7%) represent the smallest median family size with 2.33 persons per family.
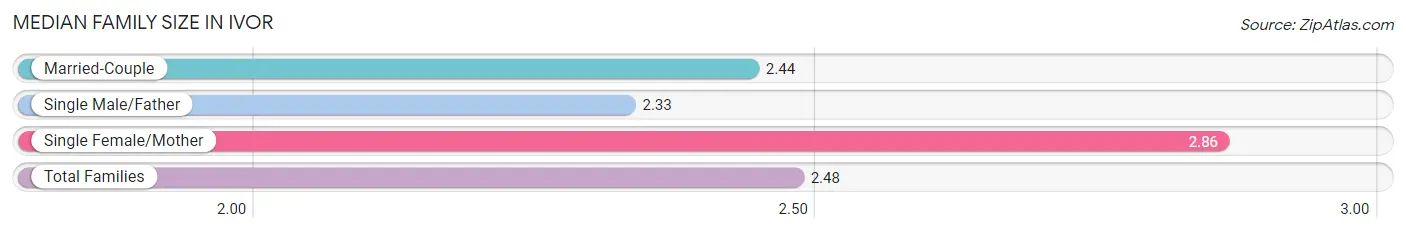
| Family Type | # Families | Family Size |
| Married-Couple | 70 (87.5%) | 2.44 |
| Single Male/Father | 3 (3.7%) | 2.33 |
| Single Female/Mother | 7 (8.7%) | 2.86 |
| Total Families | 80 (100.0%) | 2.48 |
Median Household Size in Ivor
The median household size in Ivor is 2.00 persons per household, with single female/mother households (7 | 5.1%) accounting for the largest median household size of 2.86 persons per household. non-family households (58 | 42.0%) represent the smallest median household size with 1.22 persons per household.
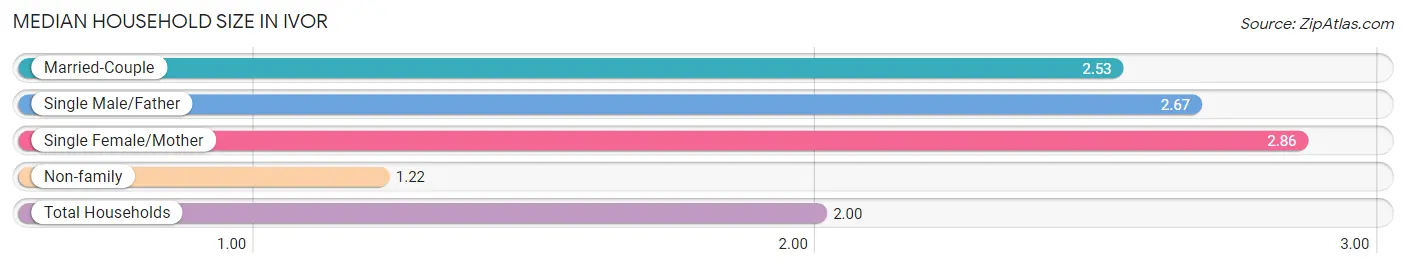
| Household Type | # Households | Household Size |
| Married-Couple | 70 (50.7%) | 2.53 |
| Single Male/Father | 3 (2.2%) | 2.67 |
| Single Female/Mother | 7 (5.1%) | 2.86 |
| Non-family | 58 (42.0%) | 1.22 |
| Total Households | 138 (100.0%) | 2.00 |
Household Size by Marriage Status in Ivor
Out of a total of 138 households in Ivor, 80 (58.0%) are family households, while 58 (42.0%) are nonfamily households. The most numerous type of family households are 2-person households, comprising 46, and the most common type of nonfamily households are 1-person households, comprising 46.
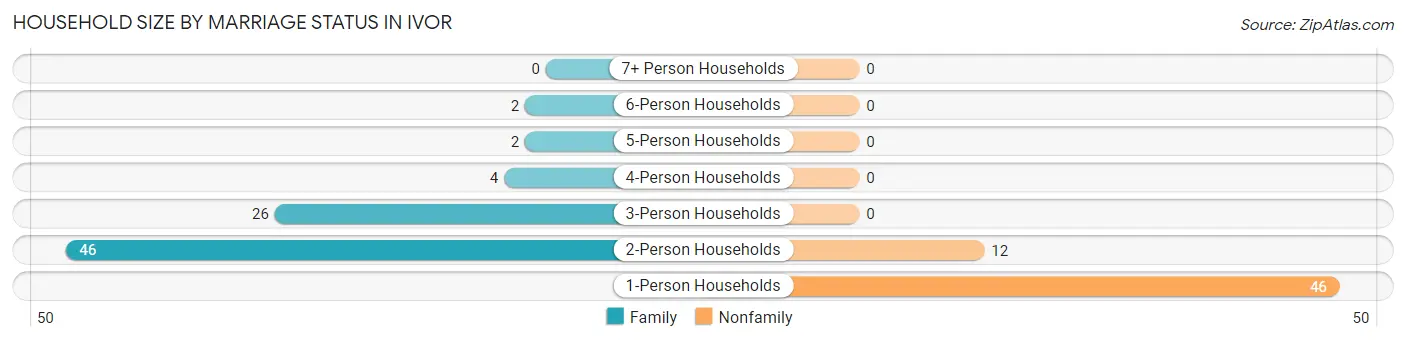
| Household Size | Family Households | Nonfamily Households |
| 1-Person Households | - | 46 (33.3%) |
| 2-Person Households | 46 (33.3%) | 12 (8.7%) |
| 3-Person Households | 26 (18.8%) | 0 (0.0%) |
| 4-Person Households | 4 (2.9%) | 0 (0.0%) |
| 5-Person Households | 2 (1.5%) | 0 (0.0%) |
| 6-Person Households | 2 (1.5%) | 0 (0.0%) |
| 7+ Person Households | 0 (0.0%) | 0 (0.0%) |
| Total | 80 (58.0%) | 58 (42.0%) |
Female Fertility in Ivor
Fertility by Age in Ivor
Average fertility rate in Ivor is 119.0 births per 1,000 women. Women in the age bracket of 20 to 34 years have the highest fertility rate with 294.0 births per 1,000 women. Women in the age bracket of 20 to 34 years acount for 100.0% of all women with births.
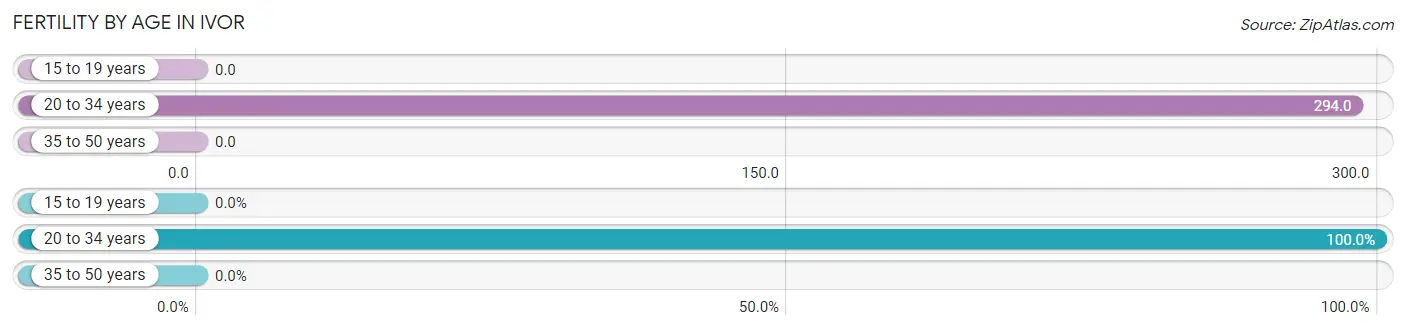
| Age Bracket | Women with Births | Births / 1,000 Women |
| 15 to 19 years | 0 (0.0%) | 0.0 |
| 20 to 34 years | 5 (100.0%) | 294.0 |
| 35 to 50 years | 0 (0.0%) | 0.0 |
| Total | 5 (100.0%) | 119.0 |
Fertility by Age by Marriage Status in Ivor
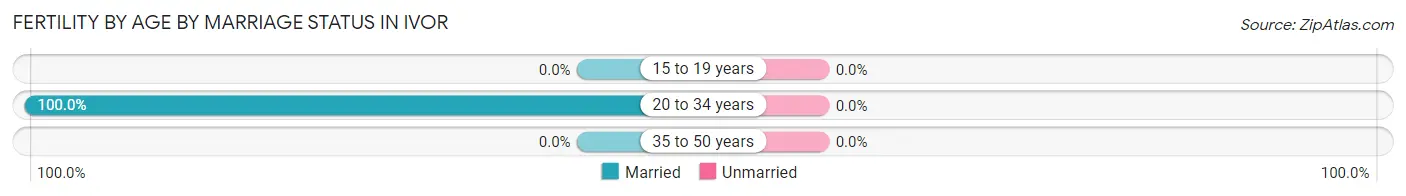
| Age Bracket | Married | Unmarried |
| 15 to 19 years | 0 (0.0%) | 0 (0.0%) |
| 20 to 34 years | 5 (100.0%) | 0 (0.0%) |
| 35 to 50 years | 0 (0.0%) | 0 (0.0%) |
| Total | 5 (100.0%) | 0 (0.0%) |
Fertility by Education in Ivor
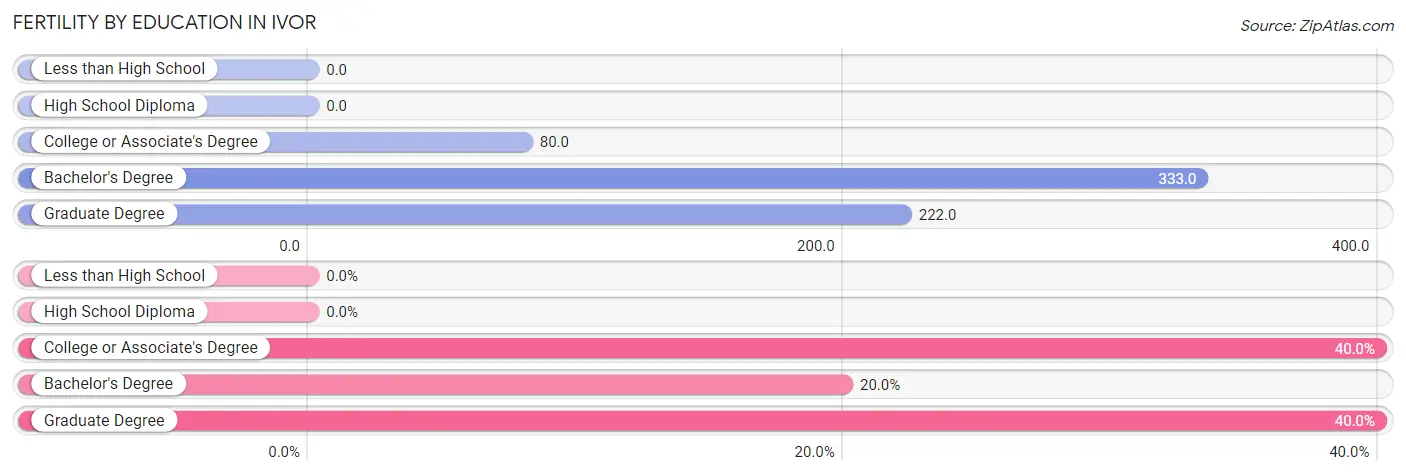
| Educational Attainment | Women with Births | Births / 1,000 Women |
| Less than High School | 0 (0.0%) | 0.0 |
| High School Diploma | 0 (0.0%) | 0.0 |
| College or Associate's Degree | 2 (40.0%) | 80.0 |
| Bachelor's Degree | 1 (20.0%) | 333.0 |
| Graduate Degree | 2 (40.0%) | 222.0 |
| Total | 5 (100.0%) | 119.0 |
Fertility by Education by Marriage Status in Ivor
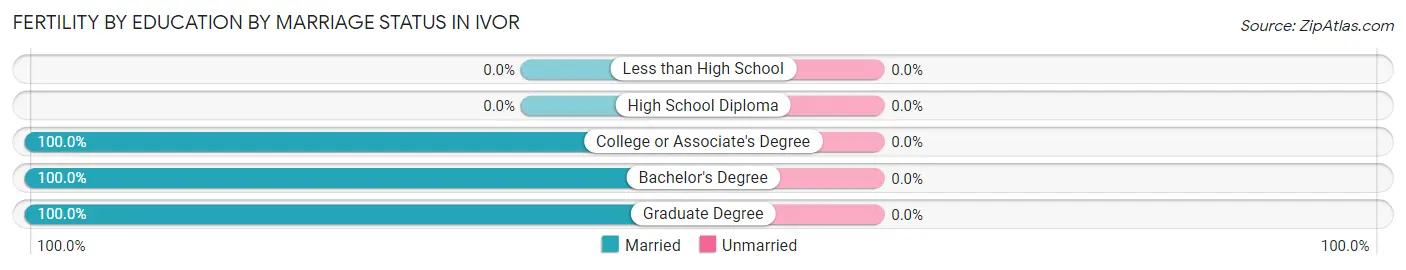
| Educational Attainment | Married | Unmarried |
| Less than High School | 0 (0.0%) | 0 (0.0%) |
| High School Diploma | 0 (0.0%) | 0 (0.0%) |
| College or Associate's Degree | 2 (100.0%) | 0 (0.0%) |
| Bachelor's Degree | 1 (100.0%) | 0 (0.0%) |
| Graduate Degree | 2 (100.0%) | 0 (0.0%) |
| Total | 5 (100.0%) | 0 (0.0%) |
Employment Characteristics in Ivor
Employment by Class of Employer in Ivor
Among the 125 employed individuals in Ivor, private company employees (75 | 60.0%), federal government employees (15 | 12.0%), and self-employed (not incorporated) (12 | 9.6%) make up the most common classes of employment.
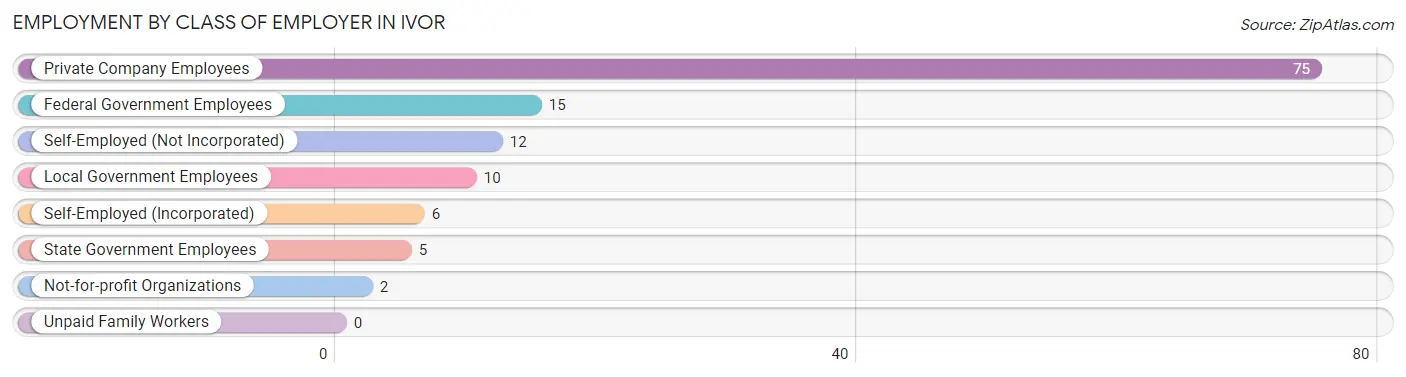
| Employer Class | # Employees | % Employees |
| Private Company Employees | 75 | 60.0% |
| Self-Employed (Incorporated) | 6 | 4.8% |
| Self-Employed (Not Incorporated) | 12 | 9.6% |
| Not-for-profit Organizations | 2 | 1.6% |
| Local Government Employees | 10 | 8.0% |
| State Government Employees | 5 | 4.0% |
| Federal Government Employees | 15 | 12.0% |
| Unpaid Family Workers | 0 | 0.0% |
| Total | 125 | 100.0% |
Employment Status by Age in Ivor
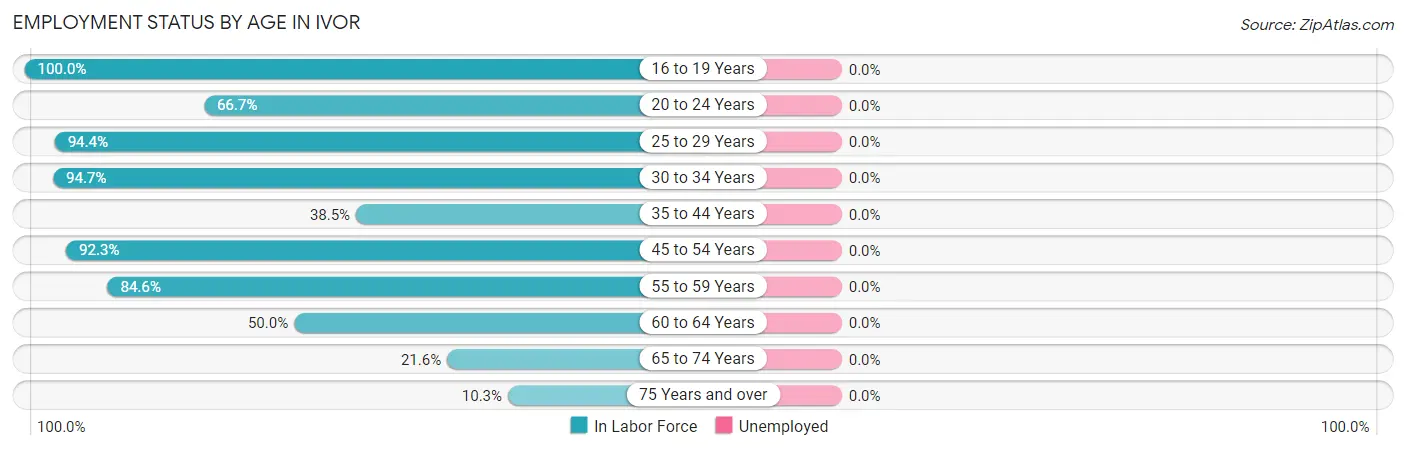
| Age Bracket | In Labor Force | Unemployed |
| 16 to 19 Years | 1 (100.0%) | 0 (0.0%) |
| 20 to 24 Years | 4 (66.7%) | 0 (0.0%) |
| 25 to 29 Years | 17 (94.4%) | 0 (0.0%) |
| 30 to 34 Years | 18 (94.7%) | 0 (0.0%) |
| 35 to 44 Years | 5 (38.5%) | 0 (0.0%) |
| 45 to 54 Years | 36 (92.3%) | 0 (0.0%) |
| 55 to 59 Years | 22 (84.6%) | 0 (0.0%) |
| 60 to 64 Years | 12 (50.0%) | 0 (0.0%) |
| 65 to 74 Years | 11 (21.6%) | 0 (0.0%) |
| 75 Years and over | 4 (10.3%) | 0 (0.0%) |
| Total | 130 (55.1%) | 0 (0.0%) |
Employment Status by Educational Attainment in Ivor
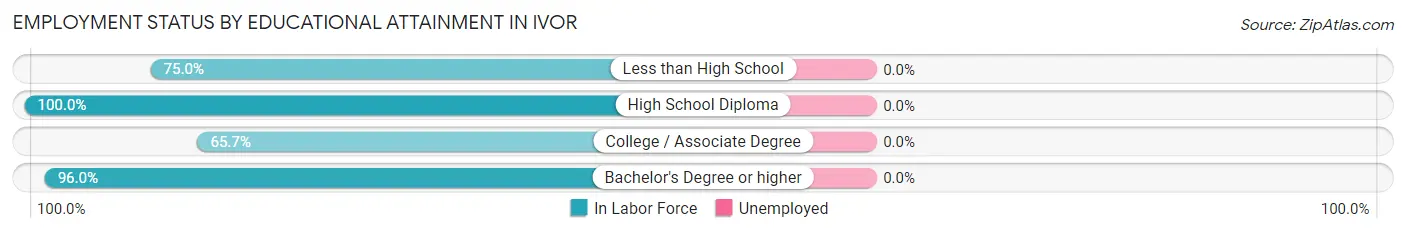
| Educational Attainment | In Labor Force | Unemployed |
| Less than High School | 12 (75.0%) | 0 (0.0%) |
| High School Diploma | 28 (100.0%) | 0 (0.0%) |
| College / Associate Degree | 46 (65.7%) | 0 (0.0%) |
| Bachelor's Degree or higher | 24 (96.0%) | 0 (0.0%) |
| Total | 110 (79.1%) | 0 (0.0%) |
Employment Occupations by Sex in Ivor
Management, Business, Science and Arts Occupations
The most common Management, Business, Science and Arts occupations in Ivor are Management (14 | 11.3%), Community & Social Service (9 | 7.3%), Health Diagnosing & Treating (8 | 6.5%), Education Instruction & Library (7 | 5.7%), and Computers, Engineering & Science (6 | 4.8%).
Management, Business, Science and Arts Occupations by Sex
Within the Management, Business, Science and Arts occupations in Ivor, the most male-oriented occupations are Business & Financial (100.0%), Management (85.7%), and Architecture & Engineering (50.0%), while the most female-oriented occupations are Computers & Mathematics (100.0%), Community & Social Service (100.0%), and Legal Services & Support (100.0%).
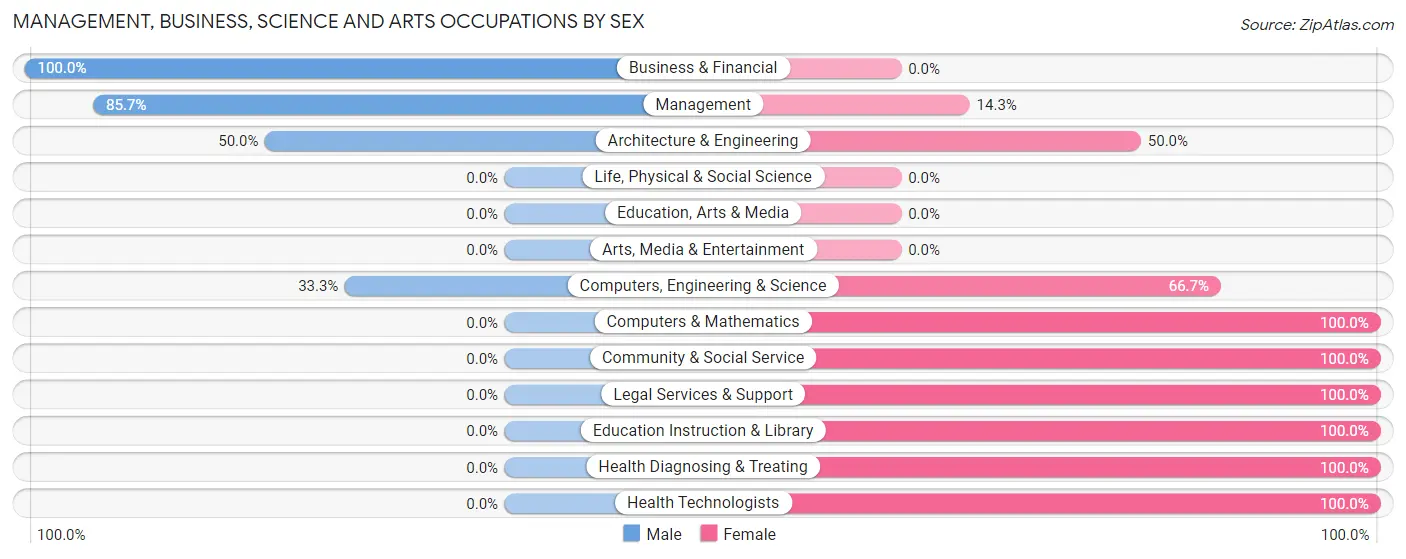
| Occupation | Male | Female |
| Management | 12 (85.7%) | 2 (14.3%) |
| Business & Financial | 2 (100.0%) | 0 (0.0%) |
| Computers, Engineering & Science | 2 (33.3%) | 4 (66.7%) |
| Computers & Mathematics | 0 (0.0%) | 2 (100.0%) |
| Architecture & Engineering | 2 (50.0%) | 2 (50.0%) |
| Life, Physical & Social Science | 0 (0.0%) | 0 (0.0%) |
| Community & Social Service | 0 (0.0%) | 9 (100.0%) |
| Education, Arts & Media | 0 (0.0%) | 0 (0.0%) |
| Legal Services & Support | 0 (0.0%) | 2 (100.0%) |
| Education Instruction & Library | 0 (0.0%) | 7 (100.0%) |
| Arts, Media & Entertainment | 0 (0.0%) | 0 (0.0%) |
| Health Diagnosing & Treating | 0 (0.0%) | 8 (100.0%) |
| Health Technologists | 0 (0.0%) | 2 (100.0%) |
| Total (Category) | 16 (41.0%) | 23 (59.0%) |
| Total (Overall) | 67 (54.0%) | 57 (46.0%) |
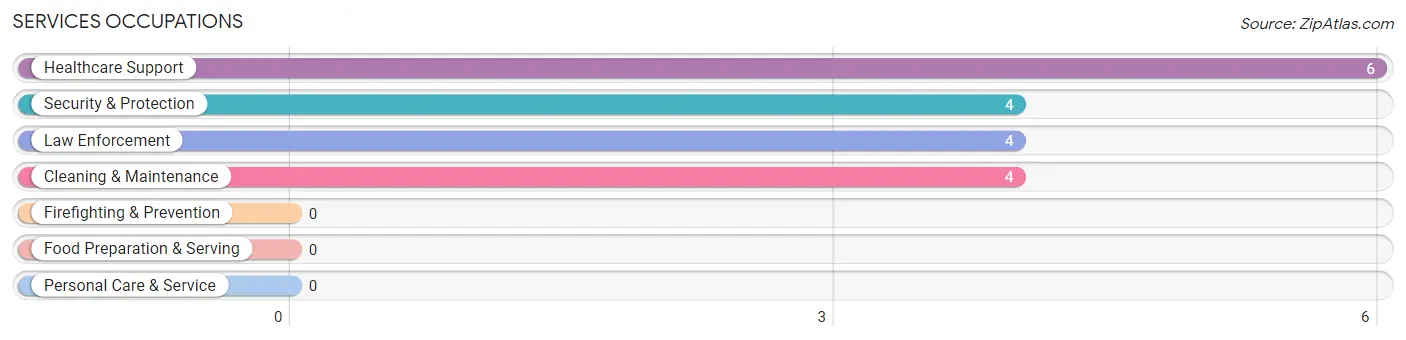
Services Occupations
The most common Services occupations in Ivor are Healthcare Support (6 | 4.8%), Security & Protection (4 | 3.2%), Law Enforcement (4 | 3.2%), and Cleaning & Maintenance (4 | 3.2%).
Services Occupations by Sex
Within the Services occupations in Ivor, the most male-oriented occupations are Security & Protection (100.0%), Law Enforcement (100.0%), and Cleaning & Maintenance (50.0%), while the most female-oriented occupations are Healthcare Support (100.0%), and Cleaning & Maintenance (50.0%).
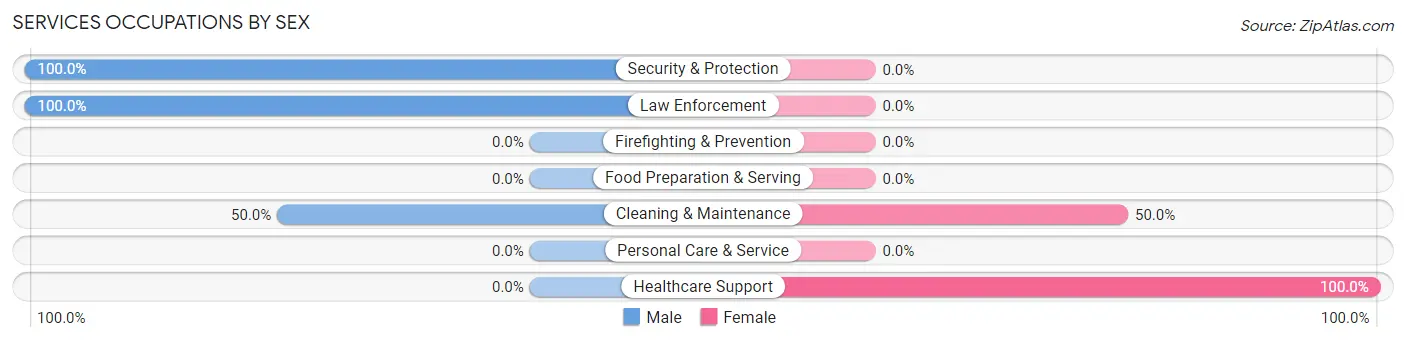
| Occupation | Male | Female |
| Healthcare Support | 0 (0.0%) | 6 (100.0%) |
| Security & Protection | 4 (100.0%) | 0 (0.0%) |
| Firefighting & Prevention | 0 (0.0%) | 0 (0.0%) |
| Law Enforcement | 4 (100.0%) | 0 (0.0%) |
| Food Preparation & Serving | 0 (0.0%) | 0 (0.0%) |
| Cleaning & Maintenance | 2 (50.0%) | 2 (50.0%) |
| Personal Care & Service | 0 (0.0%) | 0 (0.0%) |
| Total (Category) | 6 (42.9%) | 8 (57.1%) |
| Total (Overall) | 67 (54.0%) | 57 (46.0%) |
Sales and Office Occupations
The most common Sales and Office occupations in Ivor are Sales & Related (26 | 21.0%), and Office & Administration (14 | 11.3%).
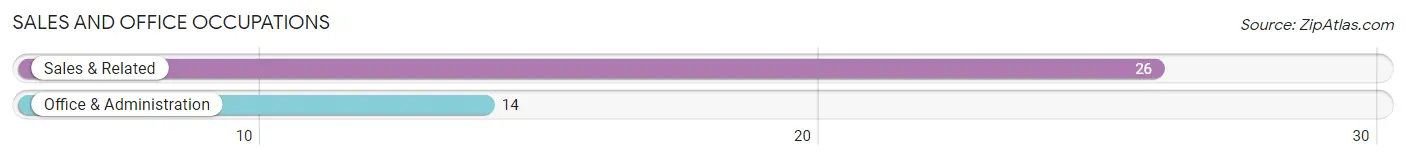
Sales and Office Occupations by Sex
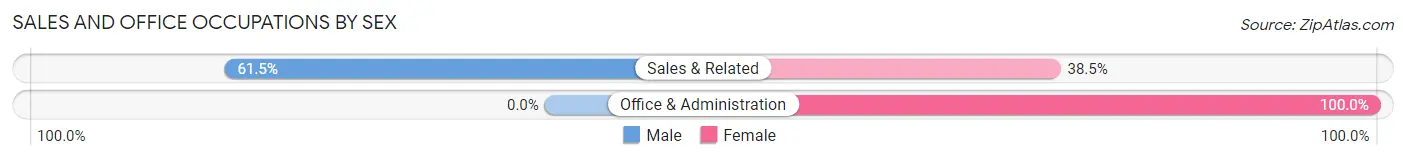
| Occupation | Male | Female |
| Sales & Related | 16 (61.5%) | 10 (38.5%) |
| Office & Administration | 0 (0.0%) | 14 (100.0%) |
| Total (Category) | 16 (40.0%) | 24 (60.0%) |
| Total (Overall) | 67 (54.0%) | 57 (46.0%) |
Natural Resources, Construction and Maintenance Occupations
The most common Natural Resources, Construction and Maintenance occupations in Ivor are Construction & Extraction (12 | 9.7%), Farming, Fishing & Forestry (2 | 1.6%), and Installation, Maintenance & Repair (2 | 1.6%).
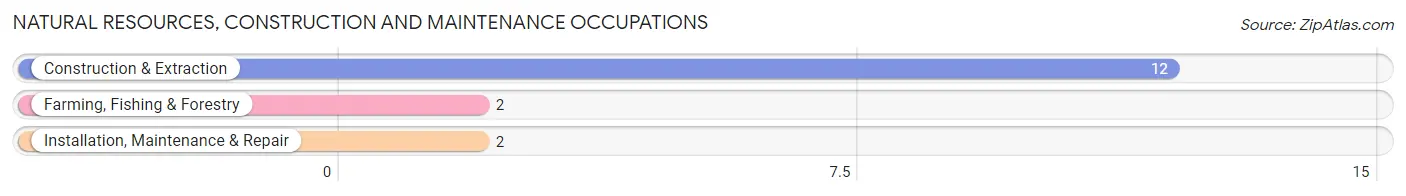
Natural Resources, Construction and Maintenance Occupations by Sex
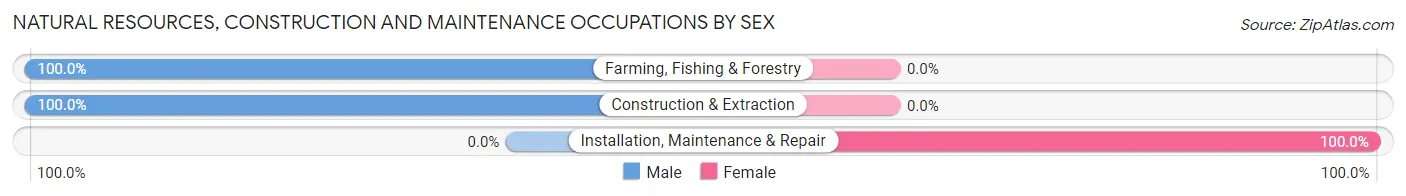
| Occupation | Male | Female |
| Farming, Fishing & Forestry | 2 (100.0%) | 0 (0.0%) |
| Construction & Extraction | 12 (100.0%) | 0 (0.0%) |
| Installation, Maintenance & Repair | 0 (0.0%) | 2 (100.0%) |
| Total (Category) | 14 (87.5%) | 2 (12.5%) |
| Total (Overall) | 67 (54.0%) | 57 (46.0%) |
Production, Transportation and Moving Occupations
The most common Production, Transportation and Moving occupations in Ivor are Production (8 | 6.5%), and Transportation (7 | 5.7%).
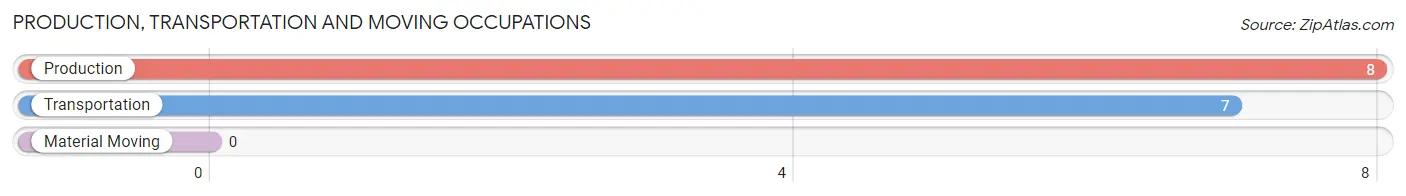
Production, Transportation and Moving Occupations by Sex
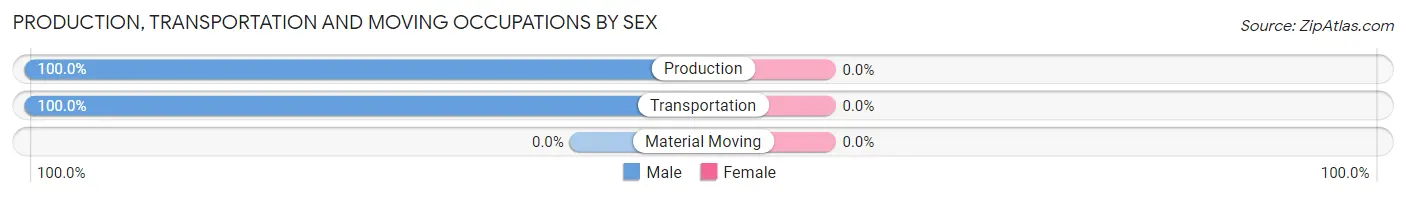
| Occupation | Male | Female |
| Production | 8 (100.0%) | 0 (0.0%) |
| Transportation | 7 (100.0%) | 0 (0.0%) |
| Material Moving | 0 (0.0%) | 0 (0.0%) |
| Total (Category) | 15 (100.0%) | 0 (0.0%) |
| Total (Overall) | 67 (54.0%) | 57 (46.0%) |
Employment Industries by Sex in Ivor
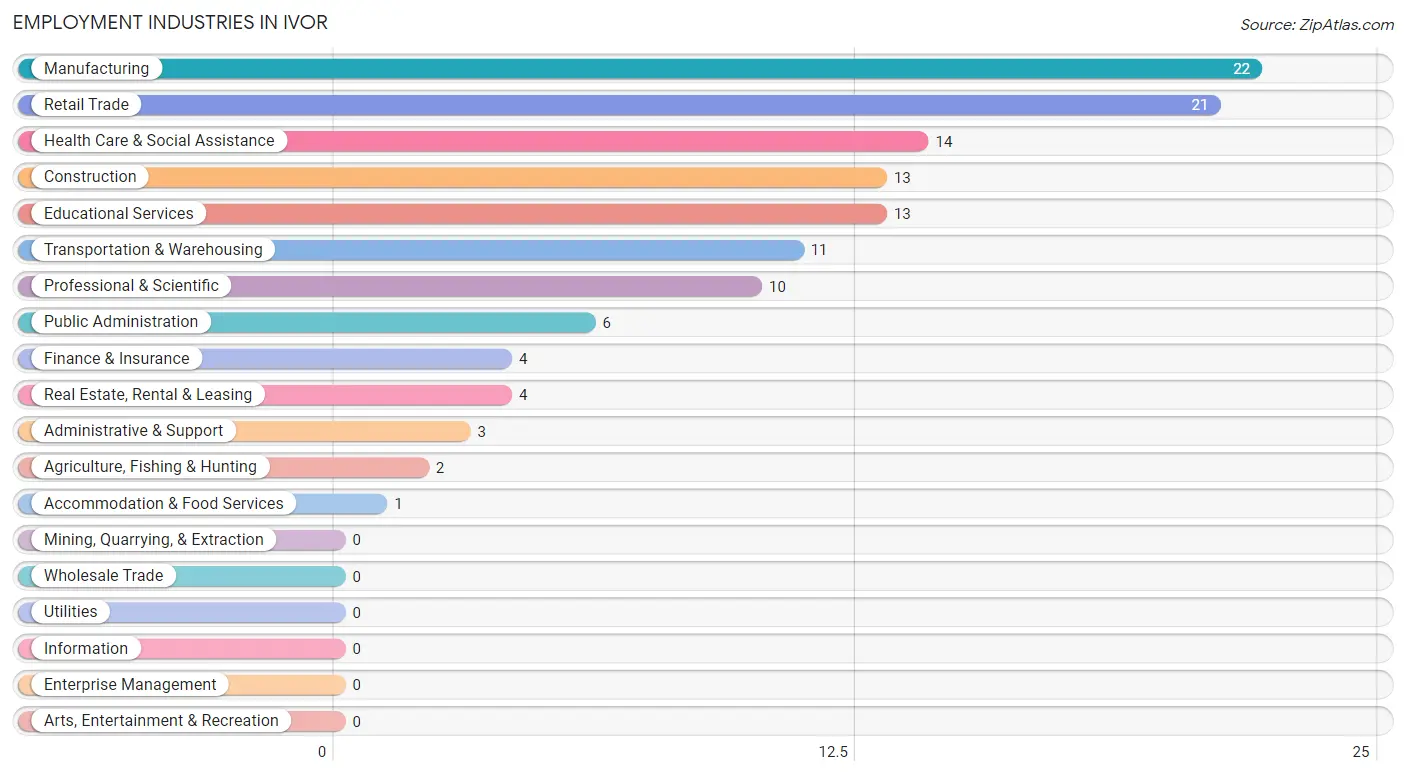
Employment Industries in Ivor
The major employment industries in Ivor include Manufacturing (22 | 17.7%), Retail Trade (21 | 16.9%), Health Care & Social Assistance (14 | 11.3%), Construction (13 | 10.5%), and Educational Services (13 | 10.5%).
Employment Industries by Sex in Ivor
The Ivor industries that see more men than women are Agriculture, Fishing & Hunting (100.0%), Construction (100.0%), and Manufacturing (100.0%), whereas the industries that tend to have a higher number of women are Real Estate, Rental & Leasing (100.0%), Health Care & Social Assistance (100.0%), and Accommodation & Food Services (100.0%).
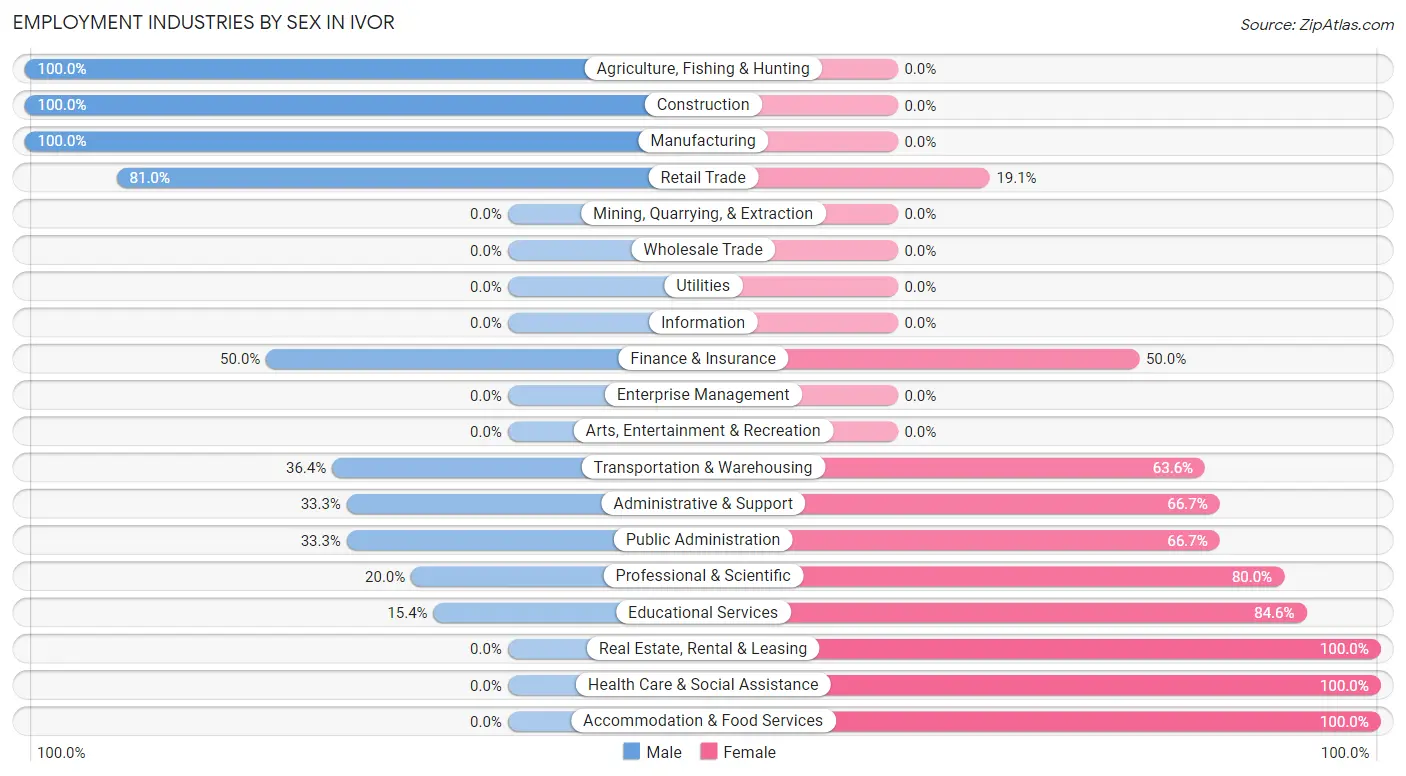
| Industry | Male | Female |
| Agriculture, Fishing & Hunting | 2 (100.0%) | 0 (0.0%) |
| Mining, Quarrying, & Extraction | 0 (0.0%) | 0 (0.0%) |
| Construction | 13 (100.0%) | 0 (0.0%) |
| Manufacturing | 22 (100.0%) | 0 (0.0%) |
| Wholesale Trade | 0 (0.0%) | 0 (0.0%) |
| Retail Trade | 17 (80.9%) | 4 (19.1%) |
| Transportation & Warehousing | 4 (36.4%) | 7 (63.6%) |
| Utilities | 0 (0.0%) | 0 (0.0%) |
| Information | 0 (0.0%) | 0 (0.0%) |
| Finance & Insurance | 2 (50.0%) | 2 (50.0%) |
| Real Estate, Rental & Leasing | 0 (0.0%) | 4 (100.0%) |
| Professional & Scientific | 2 (20.0%) | 8 (80.0%) |
| Enterprise Management | 0 (0.0%) | 0 (0.0%) |
| Administrative & Support | 1 (33.3%) | 2 (66.7%) |
| Educational Services | 2 (15.4%) | 11 (84.6%) |
| Health Care & Social Assistance | 0 (0.0%) | 14 (100.0%) |
| Arts, Entertainment & Recreation | 0 (0.0%) | 0 (0.0%) |
| Accommodation & Food Services | 0 (0.0%) | 1 (100.0%) |
| Public Administration | 2 (33.3%) | 4 (66.7%) |
| Total | 67 (54.0%) | 57 (46.0%) |
Education in Ivor
School Enrollment in Ivor
The most common levels of schooling among the 29 students in Ivor are middle school (9 | 31.0%), college / undergraduate (6 | 20.7%), and graduate / professional (5 | 17.2%).
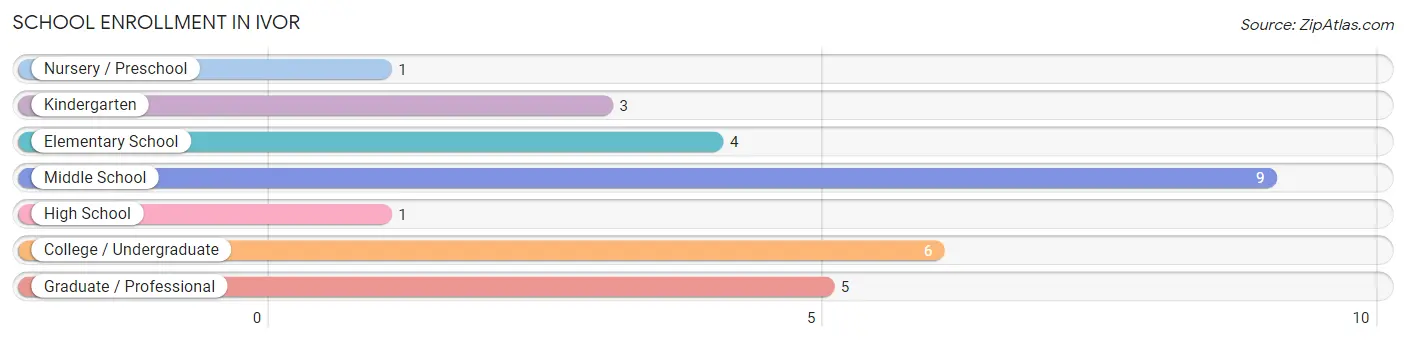
| School Level | # Students | % Students |
| Nursery / Preschool | 1 | 3.5% |
| Kindergarten | 3 | 10.3% |
| Elementary School | 4 | 13.8% |
| Middle School | 9 | 31.0% |
| High School | 1 | 3.5% |
| College / Undergraduate | 6 | 20.7% |
| Graduate / Professional | 5 | 17.2% |
| Total | 29 | 100.0% |
School Enrollment by Age by Funding Source in Ivor
Out of a total of 29 students who are enrolled in schools in Ivor, 15 (51.7%) attend a private institution, while the remaining 14 (48.3%) are enrolled in public schools. The age group of 10 to 14 year olds has the highest likelihood of being enrolled in private schools, with 7 (77.8% in the age bracket) enrolled. Conversely, the age group of 15 to 17 year olds has the lowest likelihood of being enrolled in a private school, with 1 (100.0% in the age bracket) attending a public institution.
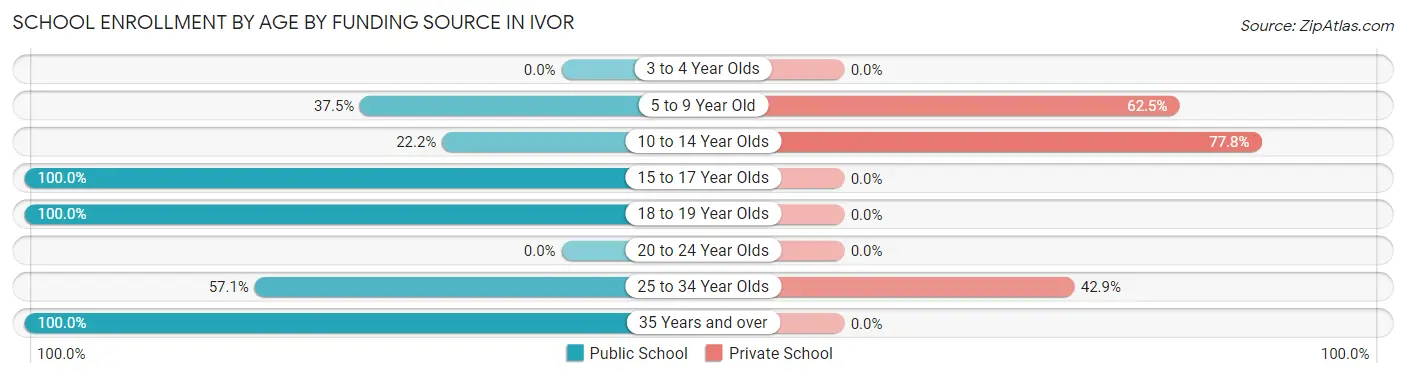
| Age Bracket | Public School | Private School |
| 3 to 4 Year Olds | 0 (0.0%) | 0 (0.0%) |
| 5 to 9 Year Old | 3 (37.5%) | 5 (62.5%) |
| 10 to 14 Year Olds | 2 (22.2%) | 7 (77.8%) |
| 15 to 17 Year Olds | 1 (100.0%) | 0 (0.0%) |
| 18 to 19 Year Olds | 1 (100.0%) | 0 (0.0%) |
| 20 to 24 Year Olds | 0 (0.0%) | 0 (0.0%) |
| 25 to 34 Year Olds | 4 (57.1%) | 3 (42.9%) |
| 35 Years and over | 3 (100.0%) | 0 (0.0%) |
| Total | 14 (48.3%) | 15 (51.7%) |
Educational Attainment by Field of Study in Ivor
Education (7 | 20.0%), social sciences (5 | 14.3%), science & technology (4 | 11.4%), business (4 | 11.4%), and literature & languages (3 | 8.6%) are the most common fields of study among 35 individuals in Ivor who have obtained a bachelor's degree or higher.
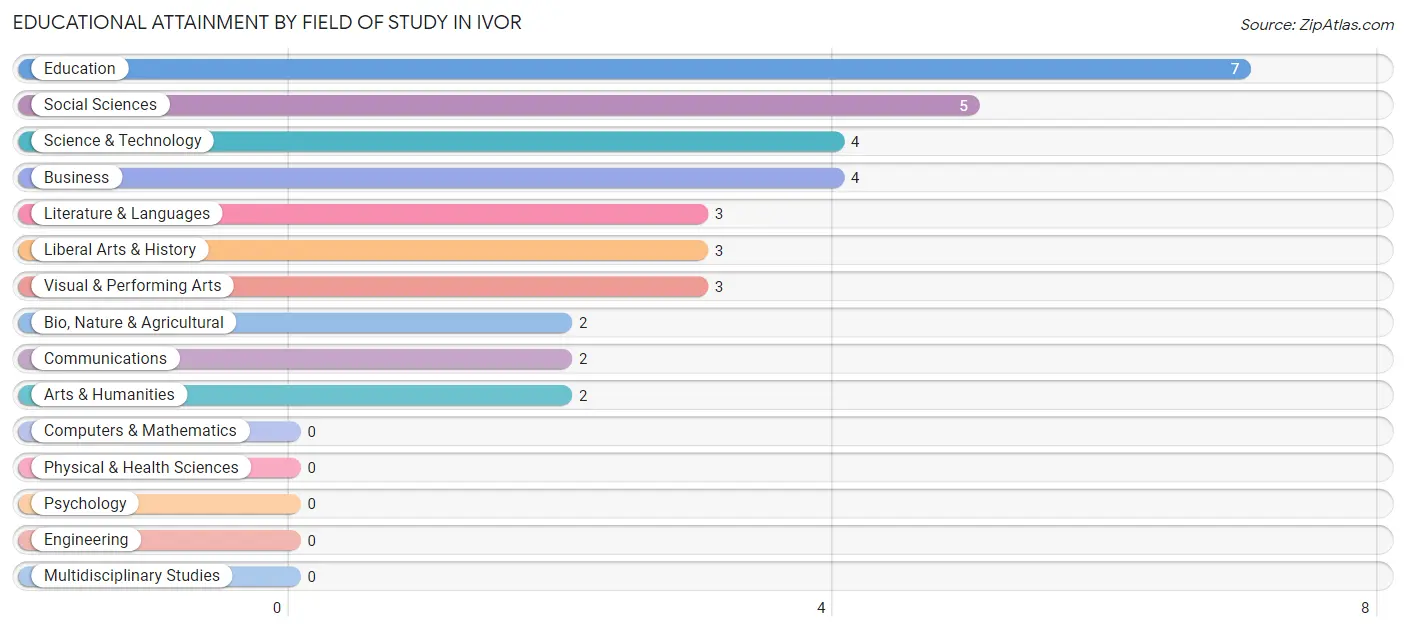
| Field of Study | # Graduates | % Graduates |
| Computers & Mathematics | 0 | 0.0% |
| Bio, Nature & Agricultural | 2 | 5.7% |
| Physical & Health Sciences | 0 | 0.0% |
| Psychology | 0 | 0.0% |
| Social Sciences | 5 | 14.3% |
| Engineering | 0 | 0.0% |
| Multidisciplinary Studies | 0 | 0.0% |
| Science & Technology | 4 | 11.4% |
| Business | 4 | 11.4% |
| Education | 7 | 20.0% |
| Literature & Languages | 3 | 8.6% |
| Liberal Arts & History | 3 | 8.6% |
| Visual & Performing Arts | 3 | 8.6% |
| Communications | 2 | 5.7% |
| Arts & Humanities | 2 | 5.7% |
| Total | 35 | 100.0% |
Transportation & Commute in Ivor
Vehicle Availability by Sex in Ivor
The most prevalent vehicle ownership categories in Ivor are males with 3 vehicles (37, accounting for 50.7%) and females with 3 vehicles (17, making up 71.2%).
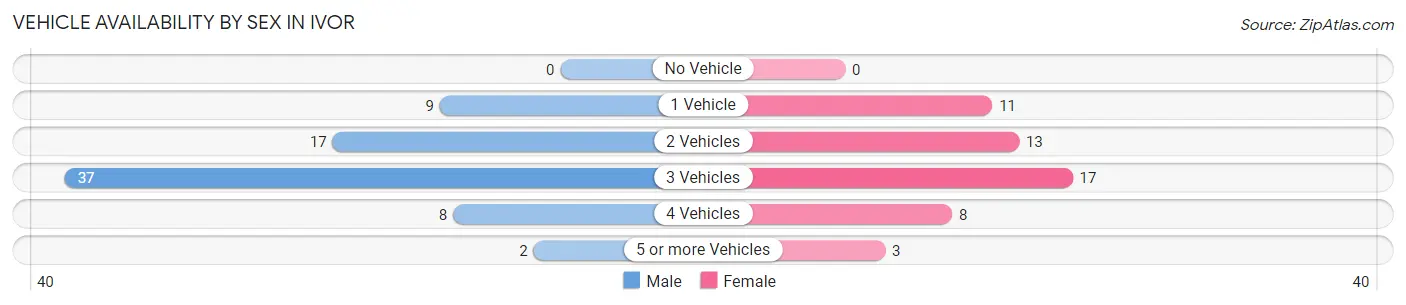
| Vehicles Available | Male | Female |
| No Vehicle | 0 (0.0%) | 0 (0.0%) |
| 1 Vehicle | 9 (12.3%) | 11 (21.1%) |
| 2 Vehicles | 17 (23.3%) | 13 (25.0%) |
| 3 Vehicles | 37 (50.7%) | 17 (32.7%) |
| 4 Vehicles | 8 (11.0%) | 8 (15.4%) |
| 5 or more Vehicles | 2 (2.7%) | 3 (5.8%) |
| Total | 73 (100.0%) | 52 (100.0%) |
Commute Time in Ivor
The most frequently occuring commute durations in Ivor are 60 to 89 minutes (27 commuters, 23.9%), 20 to 24 minutes (15 commuters, 13.3%), and 30 to 34 minutes (15 commuters, 13.3%).
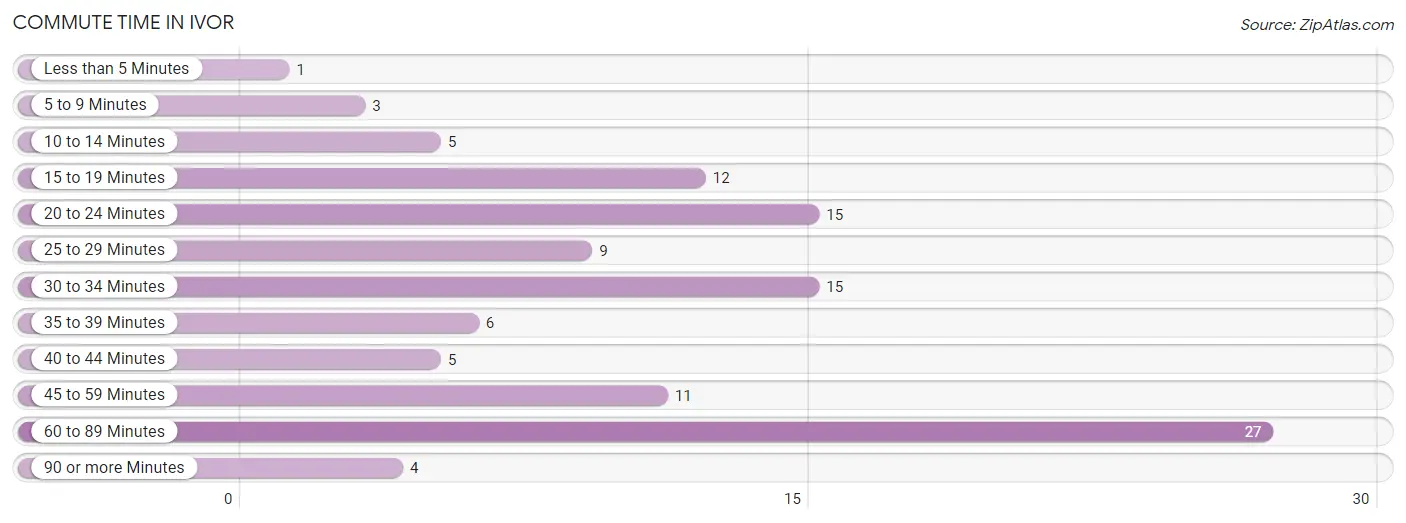
| Commute Time | # Commuters | % Commuters |
| Less than 5 Minutes | 1 | 0.9% |
| 5 to 9 Minutes | 3 | 2.6% |
| 10 to 14 Minutes | 5 | 4.4% |
| 15 to 19 Minutes | 12 | 10.6% |
| 20 to 24 Minutes | 15 | 13.3% |
| 25 to 29 Minutes | 9 | 8.0% |
| 30 to 34 Minutes | 15 | 13.3% |
| 35 to 39 Minutes | 6 | 5.3% |
| 40 to 44 Minutes | 5 | 4.4% |
| 45 to 59 Minutes | 11 | 9.7% |
| 60 to 89 Minutes | 27 | 23.9% |
| 90 or more Minutes | 4 | 3.5% |
Commute Time by Sex in Ivor
The most common commute times in Ivor are 60 to 89 minutes (19 commuters, 28.8%) for males and 45 to 59 minutes (8 commuters, 17.0%) for females.
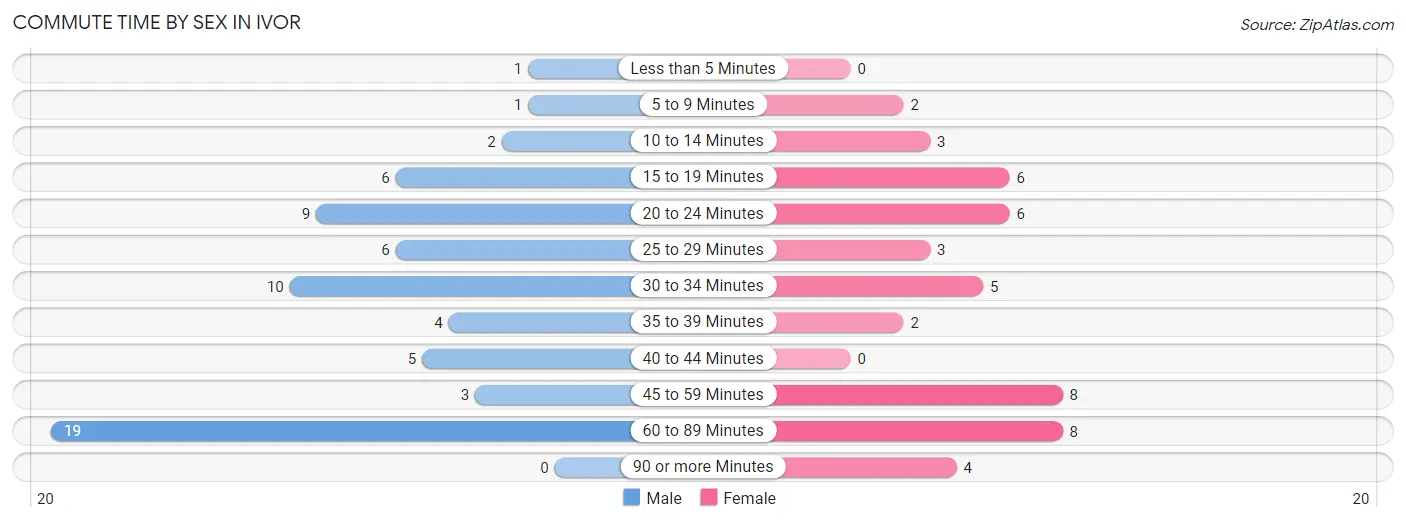
| Commute Time | Male | Female |
| Less than 5 Minutes | 1 (1.5%) | 0 (0.0%) |
| 5 to 9 Minutes | 1 (1.5%) | 2 (4.3%) |
| 10 to 14 Minutes | 2 (3.0%) | 3 (6.4%) |
| 15 to 19 Minutes | 6 (9.1%) | 6 (12.8%) |
| 20 to 24 Minutes | 9 (13.6%) | 6 (12.8%) |
| 25 to 29 Minutes | 6 (9.1%) | 3 (6.4%) |
| 30 to 34 Minutes | 10 (15.1%) | 5 (10.6%) |
| 35 to 39 Minutes | 4 (6.1%) | 2 (4.3%) |
| 40 to 44 Minutes | 5 (7.6%) | 0 (0.0%) |
| 45 to 59 Minutes | 3 (4.5%) | 8 (17.0%) |
| 60 to 89 Minutes | 19 (28.8%) | 8 (17.0%) |
| 90 or more Minutes | 0 (0.0%) | 4 (8.5%) |
Time of Departure to Work by Sex in Ivor
The most frequent times of departure to work in Ivor are 6:00 AM to 6:29 AM (18, 27.3%) for males and 6:00 AM to 6:29 AM (14, 29.8%) for females.
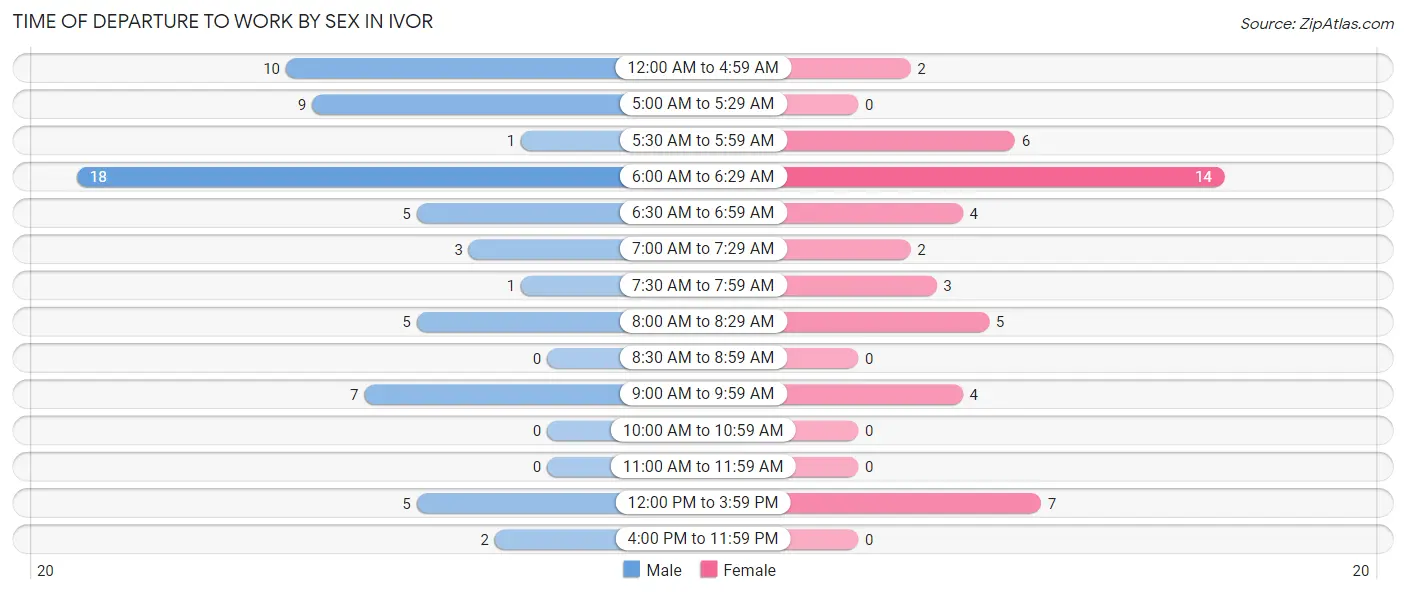
| Time of Departure | Male | Female |
| 12:00 AM to 4:59 AM | 10 (15.1%) | 2 (4.3%) |
| 5:00 AM to 5:29 AM | 9 (13.6%) | 0 (0.0%) |
| 5:30 AM to 5:59 AM | 1 (1.5%) | 6 (12.8%) |
| 6:00 AM to 6:29 AM | 18 (27.3%) | 14 (29.8%) |
| 6:30 AM to 6:59 AM | 5 (7.6%) | 4 (8.5%) |
| 7:00 AM to 7:29 AM | 3 (4.5%) | 2 (4.3%) |
| 7:30 AM to 7:59 AM | 1 (1.5%) | 3 (6.4%) |
| 8:00 AM to 8:29 AM | 5 (7.6%) | 5 (10.6%) |
| 8:30 AM to 8:59 AM | 0 (0.0%) | 0 (0.0%) |
| 9:00 AM to 9:59 AM | 7 (10.6%) | 4 (8.5%) |
| 10:00 AM to 10:59 AM | 0 (0.0%) | 0 (0.0%) |
| 11:00 AM to 11:59 AM | 0 (0.0%) | 0 (0.0%) |
| 12:00 PM to 3:59 PM | 5 (7.6%) | 7 (14.9%) |
| 4:00 PM to 11:59 PM | 2 (3.0%) | 0 (0.0%) |
| Total | 66 (100.0%) | 47 (100.0%) |
Housing Occupancy in Ivor
Occupancy by Ownership in Ivor
Of the total 138 dwellings in Ivor, owner-occupied units account for 111 (80.4%), while renter-occupied units make up 27 (19.6%).
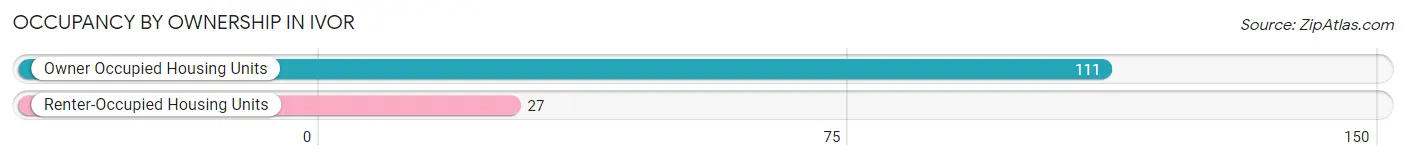
| Occupancy | # Housing Units | % Housing Units |
| Owner Occupied Housing Units | 111 | 80.4% |
| Renter-Occupied Housing Units | 27 | 19.6% |
| Total Occupied Housing Units | 138 | 100.0% |
Occupancy by Household Size in Ivor
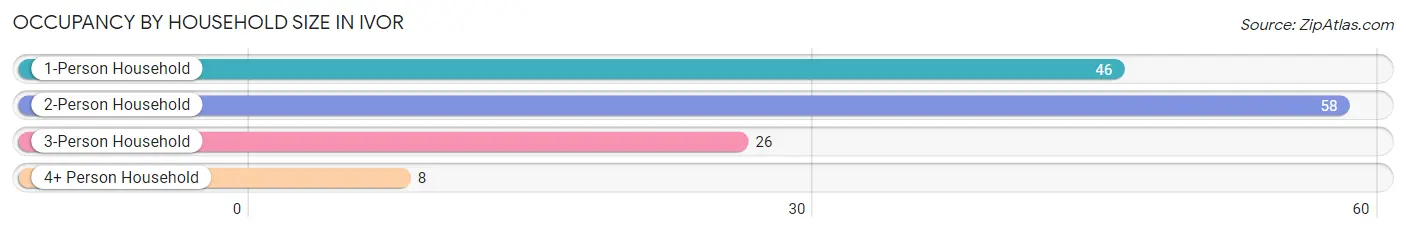
| Household Size | # Housing Units | % Housing Units |
| 1-Person Household | 46 | 33.3% |
| 2-Person Household | 58 | 42.0% |
| 3-Person Household | 26 | 18.8% |
| 4+ Person Household | 8 | 5.8% |
| Total Housing Units | 138 | 100.0% |
Occupancy by Ownership by Household Size in Ivor
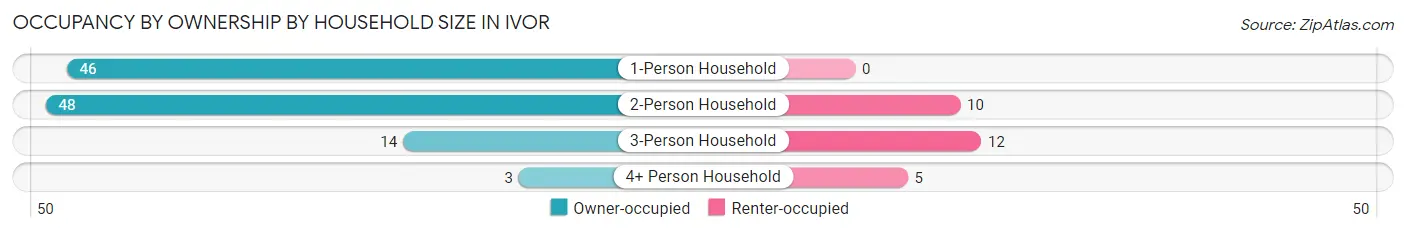
| Household Size | Owner-occupied | Renter-occupied |
| 1-Person Household | 46 (100.0%) | 0 (0.0%) |
| 2-Person Household | 48 (82.8%) | 10 (17.2%) |
| 3-Person Household | 14 (53.8%) | 12 (46.2%) |
| 4+ Person Household | 3 (37.5%) | 5 (62.5%) |
| Total Housing Units | 111 (80.4%) | 27 (19.6%) |
Occupancy by Educational Attainment in Ivor
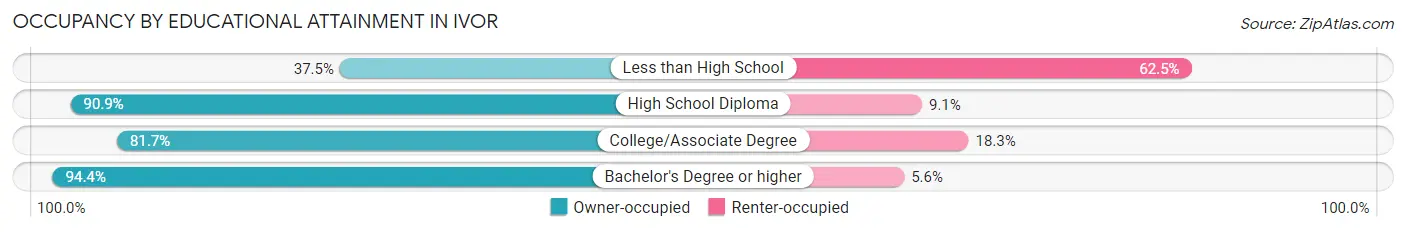
| Household Size | Owner-occupied | Renter-occupied |
| Less than High School | 6 (37.5%) | 10 (62.5%) |
| High School Diploma | 30 (90.9%) | 3 (9.1%) |
| College/Associate Degree | 58 (81.7%) | 13 (18.3%) |
| Bachelor's Degree or higher | 17 (94.4%) | 1 (5.6%) |
Occupancy by Age of Householder in Ivor
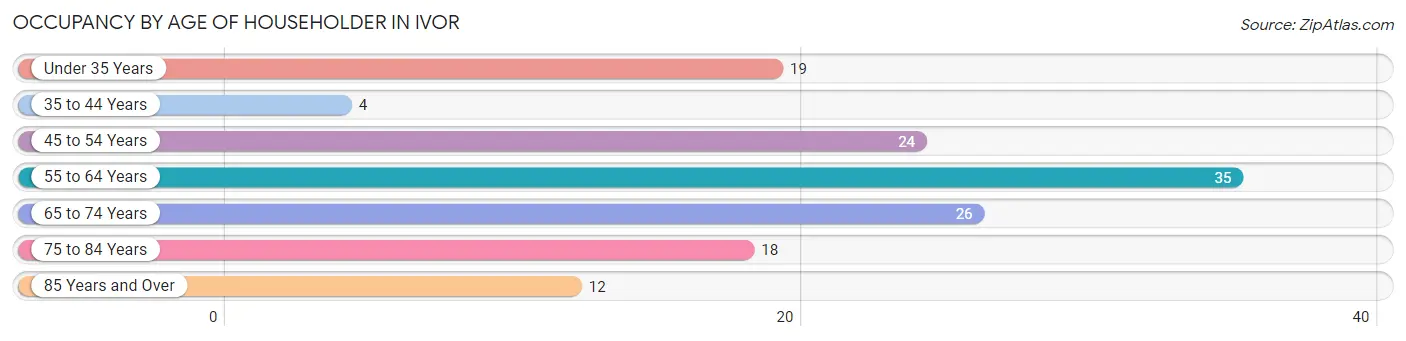
| Age Bracket | # Households | % Households |
| Under 35 Years | 19 | 13.8% |
| 35 to 44 Years | 4 | 2.9% |
| 45 to 54 Years | 24 | 17.4% |
| 55 to 64 Years | 35 | 25.4% |
| 65 to 74 Years | 26 | 18.8% |
| 75 to 84 Years | 18 | 13.0% |
| 85 Years and Over | 12 | 8.7% |
| Total | 138 | 100.0% |
Housing Finances in Ivor
Median Income by Occupancy in Ivor
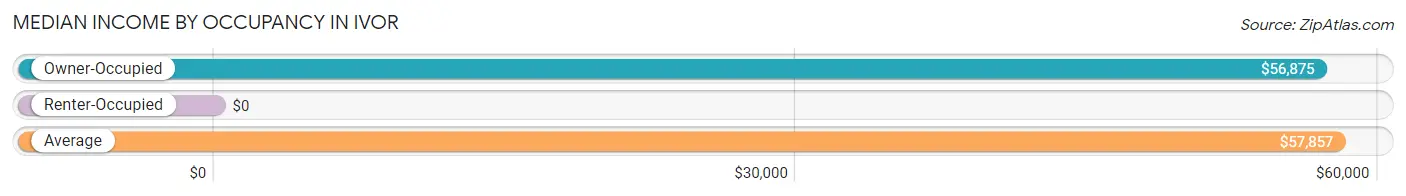
| Occupancy Type | # Households | Median Income |
| Owner-Occupied | 111 (80.4%) | $56,875 |
| Renter-Occupied | 27 (19.6%) | $0 |
| Average | 138 (100.0%) | $57,857 |
Occupancy by Householder Income Bracket in Ivor
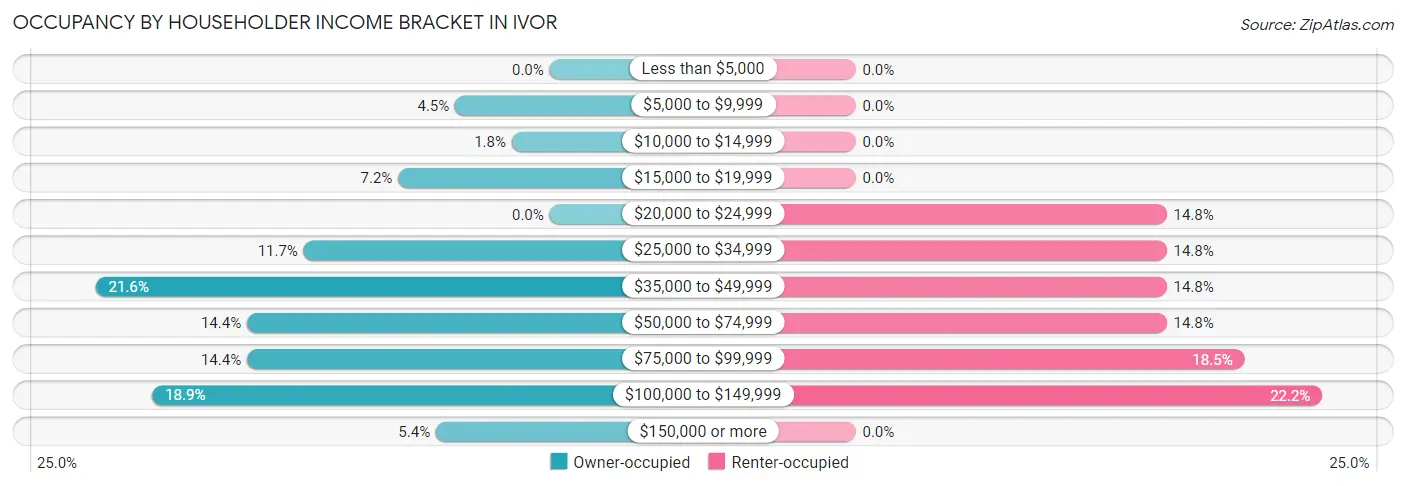
| Income Bracket | Owner-occupied | Renter-occupied |
| Less than $5,000 | 0 (0.0%) | 0 (0.0%) |
| $5,000 to $9,999 | 5 (4.5%) | 0 (0.0%) |
| $10,000 to $14,999 | 2 (1.8%) | 0 (0.0%) |
| $15,000 to $19,999 | 8 (7.2%) | 0 (0.0%) |
| $20,000 to $24,999 | 0 (0.0%) | 4 (14.8%) |
| $25,000 to $34,999 | 13 (11.7%) | 4 (14.8%) |
| $35,000 to $49,999 | 24 (21.6%) | 4 (14.8%) |
| $50,000 to $74,999 | 16 (14.4%) | 4 (14.8%) |
| $75,000 to $99,999 | 16 (14.4%) | 5 (18.5%) |
| $100,000 to $149,999 | 21 (18.9%) | 6 (22.2%) |
| $150,000 or more | 6 (5.4%) | 0 (0.0%) |
| Total | 111 (100.0%) | 27 (100.0%) |
Monthly Housing Cost Tiers in Ivor
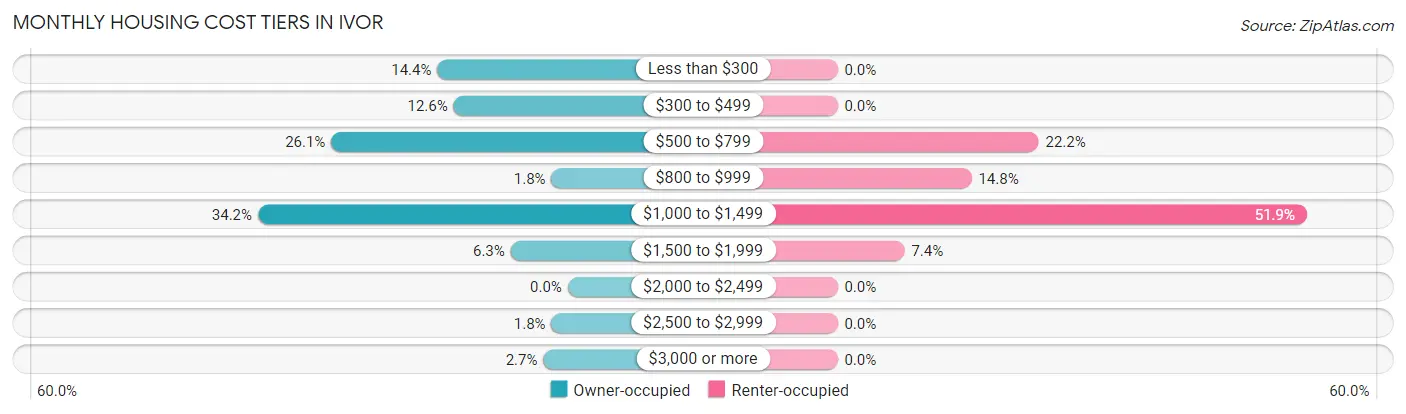
| Monthly Cost | Owner-occupied | Renter-occupied |
| Less than $300 | 16 (14.4%) | 0 (0.0%) |
| $300 to $499 | 14 (12.6%) | 0 (0.0%) |
| $500 to $799 | 29 (26.1%) | 6 (22.2%) |
| $800 to $999 | 2 (1.8%) | 4 (14.8%) |
| $1,000 to $1,499 | 38 (34.2%) | 14 (51.8%) |
| $1,500 to $1,999 | 7 (6.3%) | 2 (7.4%) |
| $2,000 to $2,499 | 0 (0.0%) | 0 (0.0%) |
| $2,500 to $2,999 | 2 (1.8%) | 0 (0.0%) |
| $3,000 or more | 3 (2.7%) | 0 (0.0%) |
| Total | 111 (100.0%) | 27 (100.0%) |
Physical Housing Characteristics in Ivor
Housing Structures in Ivor
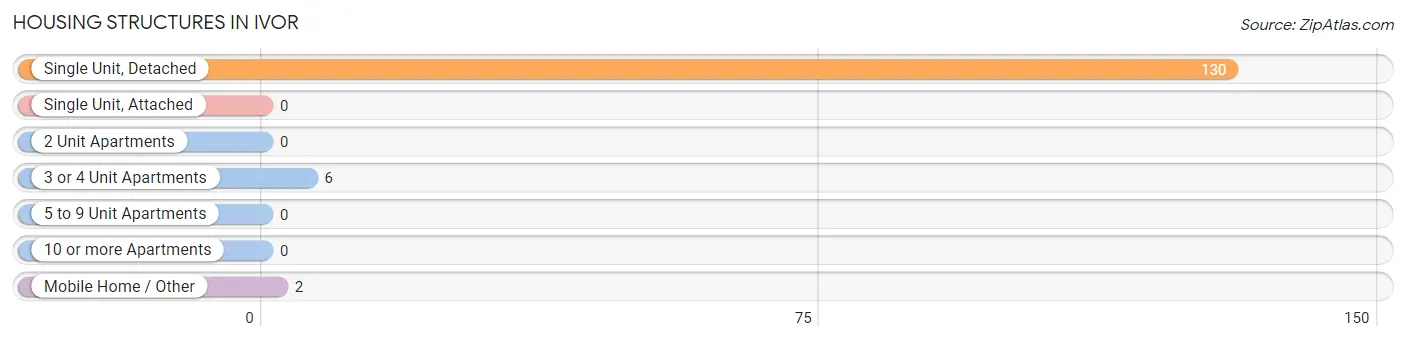
| Structure Type | # Housing Units | % Housing Units |
| Single Unit, Detached | 130 | 94.2% |
| Single Unit, Attached | 0 | 0.0% |
| 2 Unit Apartments | 0 | 0.0% |
| 3 or 4 Unit Apartments | 6 | 4.3% |
| 5 to 9 Unit Apartments | 0 | 0.0% |
| 10 or more Apartments | 0 | 0.0% |
| Mobile Home / Other | 2 | 1.5% |
| Total | 138 | 100.0% |
Housing Structures by Occupancy in Ivor
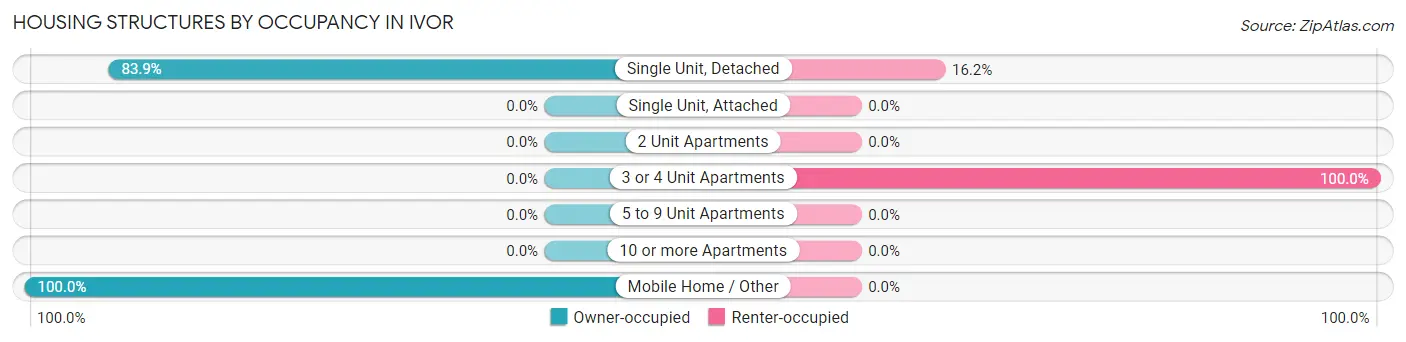
| Structure Type | Owner-occupied | Renter-occupied |
| Single Unit, Detached | 109 (83.9%) | 21 (16.2%) |
| Single Unit, Attached | 0 (0.0%) | 0 (0.0%) |
| 2 Unit Apartments | 0 (0.0%) | 0 (0.0%) |
| 3 or 4 Unit Apartments | 0 (0.0%) | 6 (100.0%) |
| 5 to 9 Unit Apartments | 0 (0.0%) | 0 (0.0%) |
| 10 or more Apartments | 0 (0.0%) | 0 (0.0%) |
| Mobile Home / Other | 2 (100.0%) | 0 (0.0%) |
| Total | 111 (80.4%) | 27 (19.6%) |
Housing Structures by Number of Rooms in Ivor
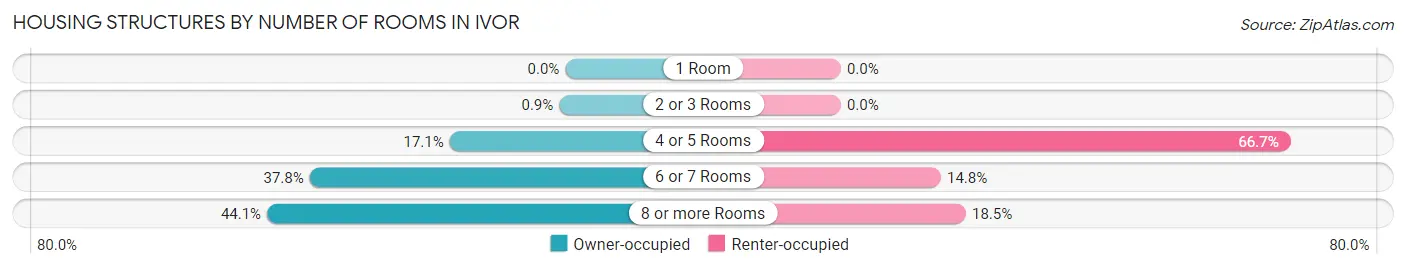
| Number of Rooms | Owner-occupied | Renter-occupied |
| 1 Room | 0 (0.0%) | 0 (0.0%) |
| 2 or 3 Rooms | 1 (0.9%) | 0 (0.0%) |
| 4 or 5 Rooms | 19 (17.1%) | 18 (66.7%) |
| 6 or 7 Rooms | 42 (37.8%) | 4 (14.8%) |
| 8 or more Rooms | 49 (44.1%) | 5 (18.5%) |
| Total | 111 (100.0%) | 27 (100.0%) |
Housing Structure by Heating Type in Ivor
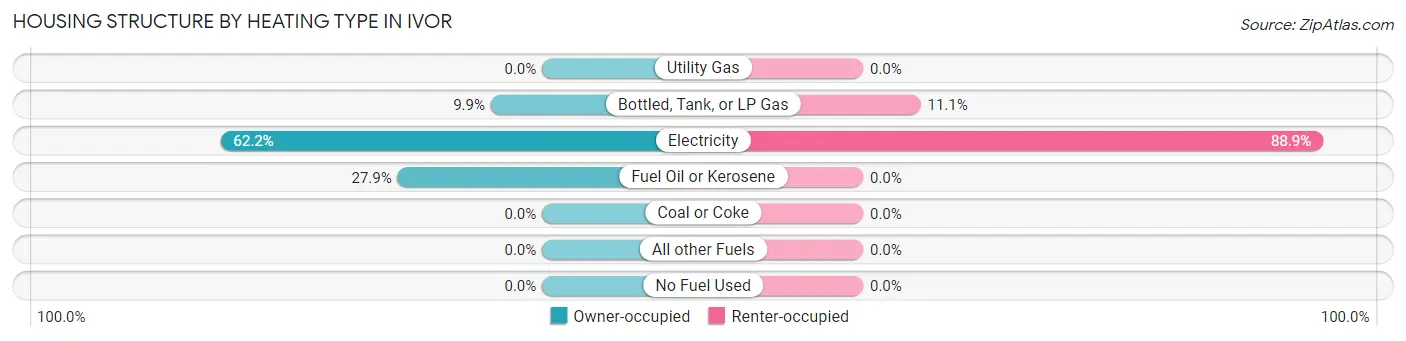
| Heating Type | Owner-occupied | Renter-occupied |
| Utility Gas | 0 (0.0%) | 0 (0.0%) |
| Bottled, Tank, or LP Gas | 11 (9.9%) | 3 (11.1%) |
| Electricity | 69 (62.2%) | 24 (88.9%) |
| Fuel Oil or Kerosene | 31 (27.9%) | 0 (0.0%) |
| Coal or Coke | 0 (0.0%) | 0 (0.0%) |
| All other Fuels | 0 (0.0%) | 0 (0.0%) |
| No Fuel Used | 0 (0.0%) | 0 (0.0%) |
| Total | 111 (100.0%) | 27 (100.0%) |
Household Vehicle Usage in Ivor
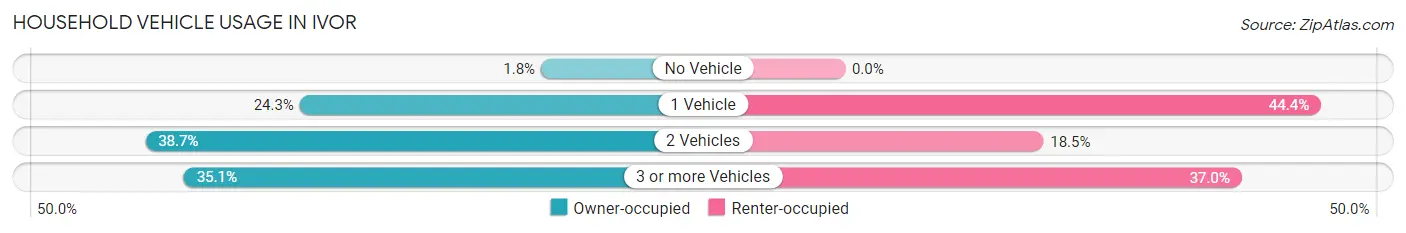
| Vehicles per Household | Owner-occupied | Renter-occupied |
| No Vehicle | 2 (1.8%) | 0 (0.0%) |
| 1 Vehicle | 27 (24.3%) | 12 (44.4%) |
| 2 Vehicles | 43 (38.7%) | 5 (18.5%) |
| 3 or more Vehicles | 39 (35.1%) | 10 (37.0%) |
| Total | 111 (100.0%) | 27 (100.0%) |
Real Estate & Mortgages in Ivor
Real Estate and Mortgage Overview in Ivor
| Characteristic | Without Mortgage | With Mortgage |
| Housing Units | 49 | 62 |
| Median Property Value | $183,000 | $167,900 |
| Median Household Income | $43,125 | $6 |
| Monthly Housing Costs | $358 | $3 |
| Real Estate Taxes | $1,167 | $2 |
Property Value by Mortgage Status in Ivor
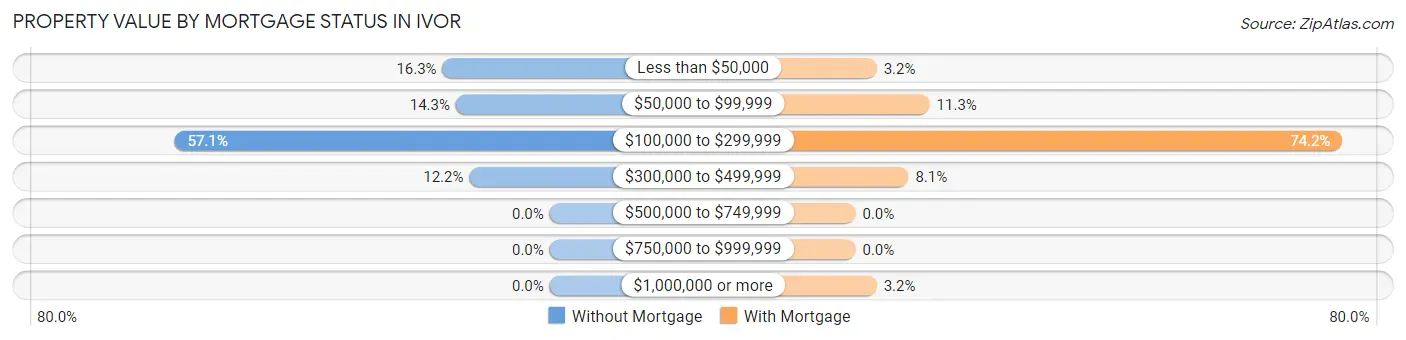
| Property Value | Without Mortgage | With Mortgage |
| Less than $50,000 | 8 (16.3%) | 2 (3.2%) |
| $50,000 to $99,999 | 7 (14.3%) | 7 (11.3%) |
| $100,000 to $299,999 | 28 (57.1%) | 46 (74.2%) |
| $300,000 to $499,999 | 6 (12.2%) | 5 (8.1%) |
| $500,000 to $749,999 | 0 (0.0%) | 0 (0.0%) |
| $750,000 to $999,999 | 0 (0.0%) | 0 (0.0%) |
| $1,000,000 or more | 0 (0.0%) | 2 (3.2%) |
| Total | 49 (100.0%) | 62 (100.0%) |
Household Income by Mortgage Status in Ivor
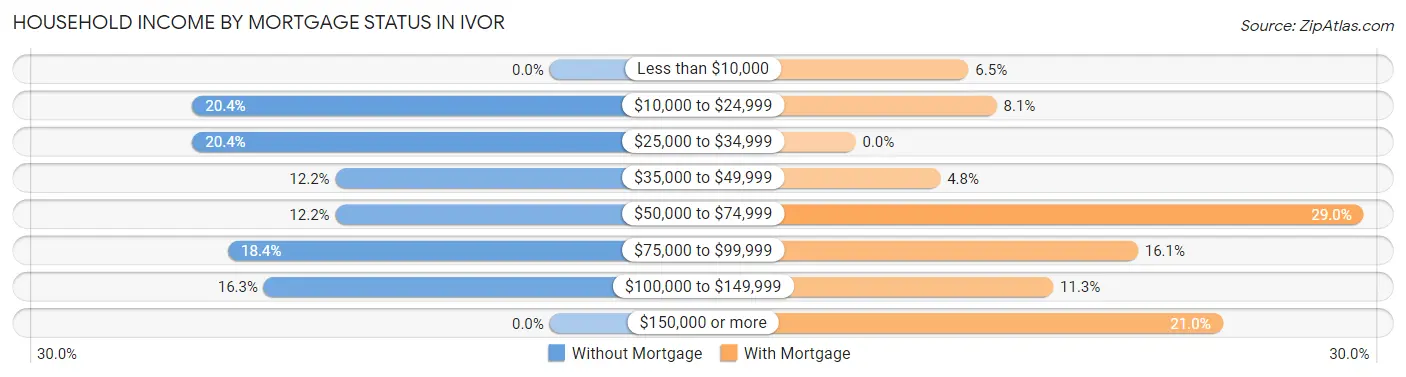
| Household Income | Without Mortgage | With Mortgage |
| Less than $10,000 | 0 (0.0%) | 4 (6.5%) |
| $10,000 to $24,999 | 10 (20.4%) | 5 (8.1%) |
| $25,000 to $34,999 | 10 (20.4%) | 0 (0.0%) |
| $35,000 to $49,999 | 6 (12.2%) | 3 (4.8%) |
| $50,000 to $74,999 | 6 (12.2%) | 18 (29.0%) |
| $75,000 to $99,999 | 9 (18.4%) | 10 (16.1%) |
| $100,000 to $149,999 | 8 (16.3%) | 7 (11.3%) |
| $150,000 or more | 0 (0.0%) | 13 (21.0%) |
| Total | 49 (100.0%) | 62 (100.0%) |
Property Value to Household Income Ratio in Ivor
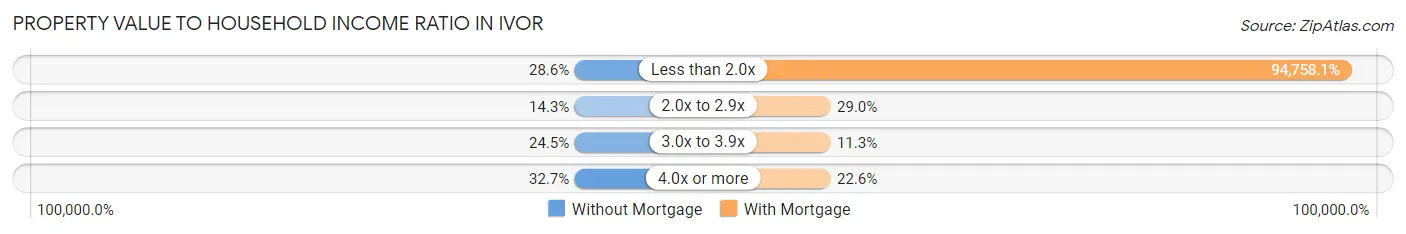
| Value-to-Income Ratio | Without Mortgage | With Mortgage |
| Less than 2.0x | 14 (28.6%) | 58,750 (94,758.1%) |
| 2.0x to 2.9x | 7 (14.3%) | 18 (29.0%) |
| 3.0x to 3.9x | 12 (24.5%) | 7 (11.3%) |
| 4.0x or more | 16 (32.7%) | 14 (22.6%) |
| Total | 49 (100.0%) | 62 (100.0%) |
Real Estate Taxes by Mortgage Status in Ivor
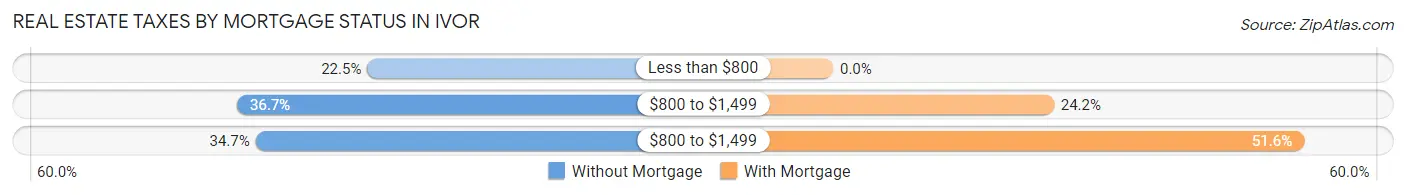
| Property Taxes | Without Mortgage | With Mortgage |
| Less than $800 | 11 (22.5%) | 0 (0.0%) |
| $800 to $1,499 | 18 (36.7%) | 15 (24.2%) |
| $800 to $1,499 | 17 (34.7%) | 32 (51.6%) |
| Total | 49 (100.0%) | 62 (100.0%) |
Health & Disability in Ivor
Health Insurance Coverage by Age in Ivor
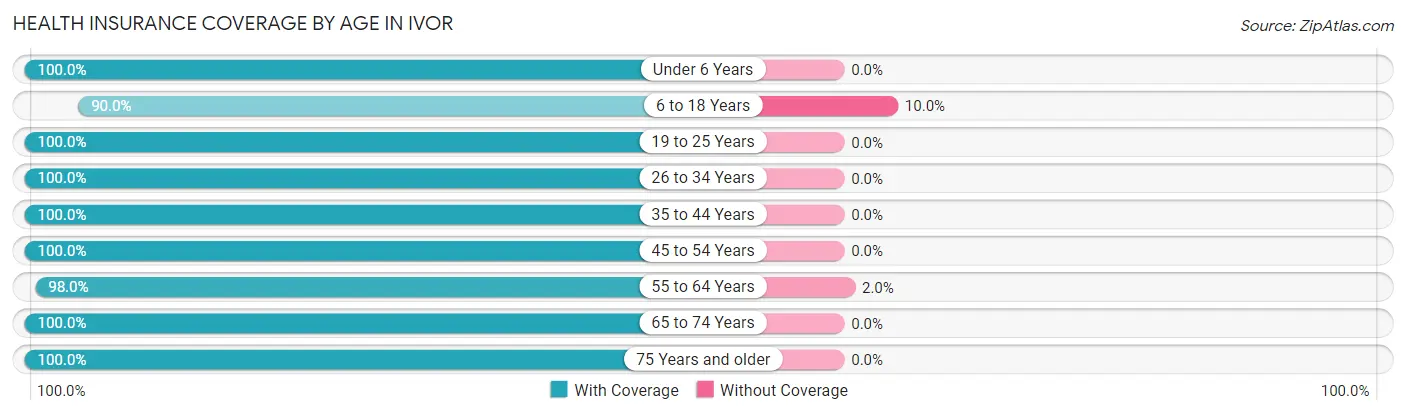
| Age Bracket | With Coverage | Without Coverage |
| Under 6 Years | 21 (100.0%) | 0 (0.0%) |
| 6 to 18 Years | 18 (90.0%) | 2 (10.0%) |
| 19 to 25 Years | 8 (100.0%) | 0 (0.0%) |
| 26 to 34 Years | 29 (100.0%) | 0 (0.0%) |
| 35 to 44 Years | 13 (100.0%) | 0 (0.0%) |
| 45 to 54 Years | 39 (100.0%) | 0 (0.0%) |
| 55 to 64 Years | 49 (98.0%) | 1 (2.0%) |
| 65 to 74 Years | 51 (100.0%) | 0 (0.0%) |
| 75 Years and older | 39 (100.0%) | 0 (0.0%) |
| Total | 267 (98.9%) | 3 (1.1%) |
Health Insurance Coverage by Citizenship Status in Ivor
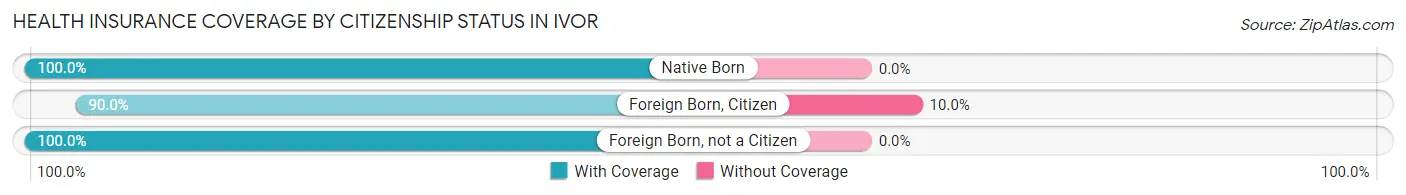
| Citizenship Status | With Coverage | Without Coverage |
| Native Born | 21 (100.0%) | 0 (0.0%) |
| Foreign Born, Citizen | 18 (90.0%) | 2 (10.0%) |
| Foreign Born, not a Citizen | 8 (100.0%) | 0 (0.0%) |
Health Insurance Coverage by Household Income in Ivor
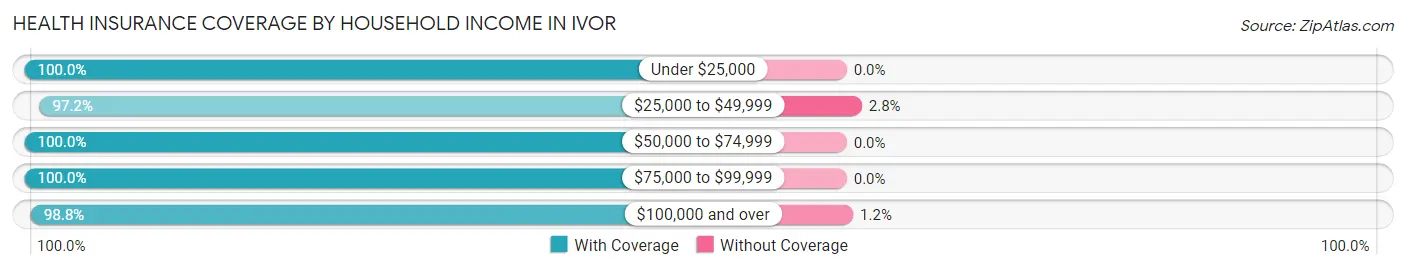
| Household Income | With Coverage | Without Coverage |
| Under $25,000 | 37 (100.0%) | 0 (0.0%) |
| $25,000 to $49,999 | 69 (97.2%) | 2 (2.8%) |
| $50,000 to $74,999 | 43 (100.0%) | 0 (0.0%) |
| $75,000 to $99,999 | 35 (100.0%) | 0 (0.0%) |
| $100,000 and over | 83 (98.8%) | 1 (1.2%) |
Public vs Private Health Insurance Coverage by Age in Ivor
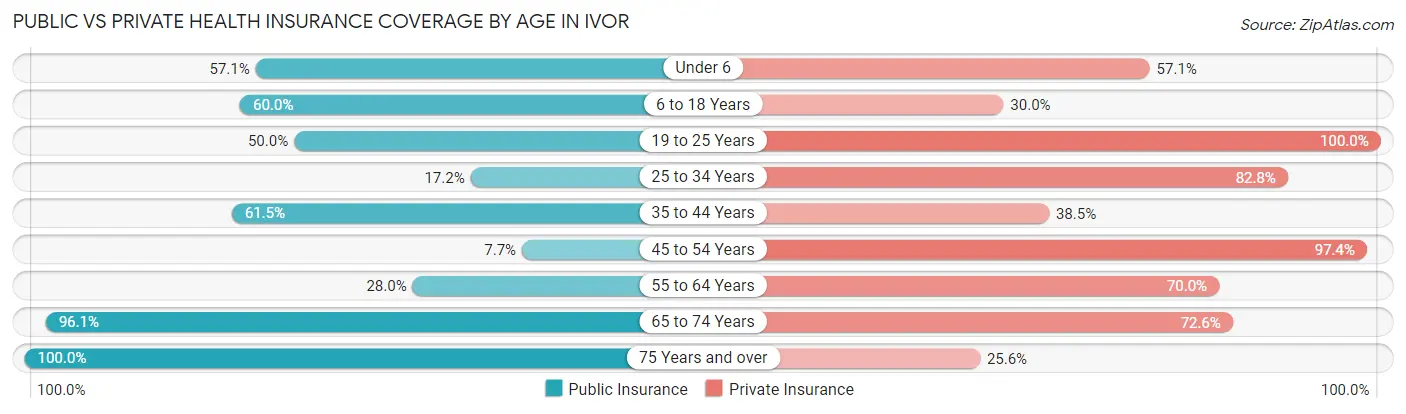
| Age Bracket | Public Insurance | Private Insurance |
| Under 6 | 12 (57.1%) | 12 (57.1%) |
| 6 to 18 Years | 12 (60.0%) | 6 (30.0%) |
| 19 to 25 Years | 4 (50.0%) | 8 (100.0%) |
| 25 to 34 Years | 5 (17.2%) | 24 (82.8%) |
| 35 to 44 Years | 8 (61.5%) | 5 (38.5%) |
| 45 to 54 Years | 3 (7.7%) | 38 (97.4%) |
| 55 to 64 Years | 14 (28.0%) | 35 (70.0%) |
| 65 to 74 Years | 49 (96.1%) | 37 (72.6%) |
| 75 Years and over | 39 (100.0%) | 10 (25.6%) |
| Total | 146 (54.1%) | 175 (64.8%) |
Disability Status by Sex by Age in Ivor
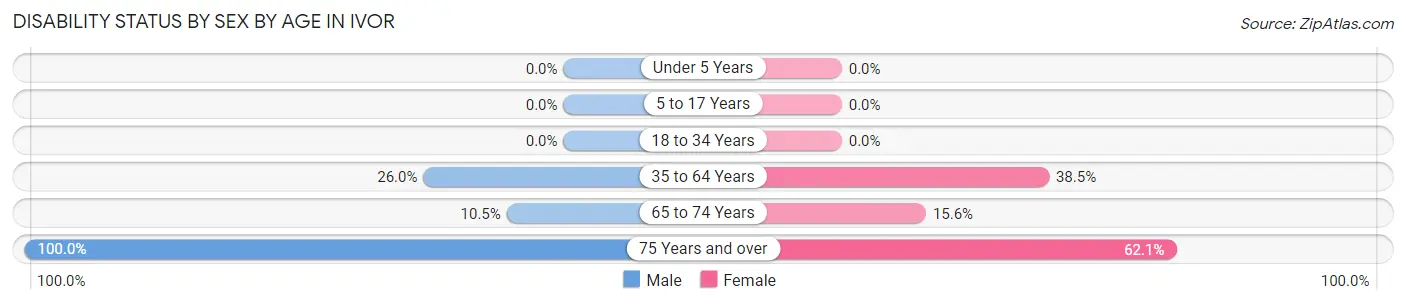
| Age Bracket | Male | Female |
| Under 5 Years | 0 (0.0%) | 0 (0.0%) |
| 5 to 17 Years | 0 (0.0%) | 0 (0.0%) |
| 18 to 34 Years | 0 (0.0%) | 0 (0.0%) |
| 35 to 64 Years | 13 (26.0%) | 20 (38.5%) |
| 65 to 74 Years | 2 (10.5%) | 5 (15.6%) |
| 75 Years and over | 10 (100.0%) | 18 (62.1%) |
Disability Class by Sex by Age in Ivor
Disability Class: Hearing Difficulty
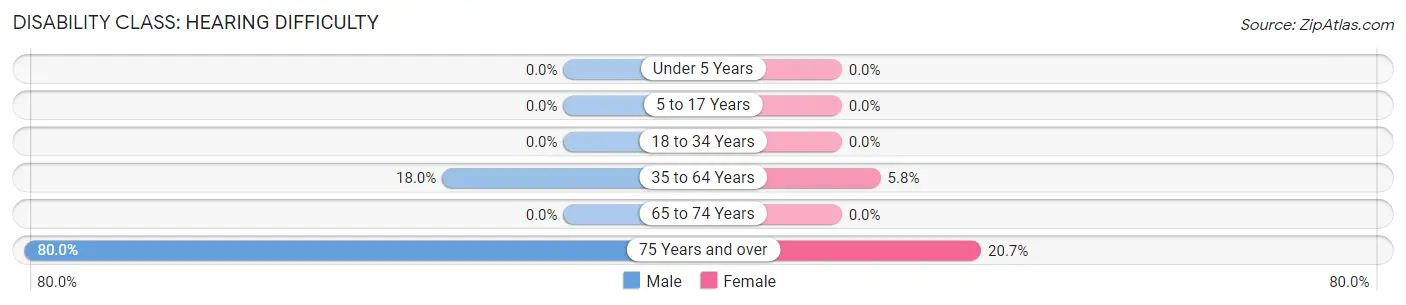
| Age Bracket | Male | Female |
| Under 5 Years | 0 (0.0%) | 0 (0.0%) |
| 5 to 17 Years | 0 (0.0%) | 0 (0.0%) |
| 18 to 34 Years | 0 (0.0%) | 0 (0.0%) |
| 35 to 64 Years | 9 (18.0%) | 3 (5.8%) |
| 65 to 74 Years | 0 (0.0%) | 0 (0.0%) |
| 75 Years and over | 8 (80.0%) | 6 (20.7%) |
Disability Class: Vision Difficulty
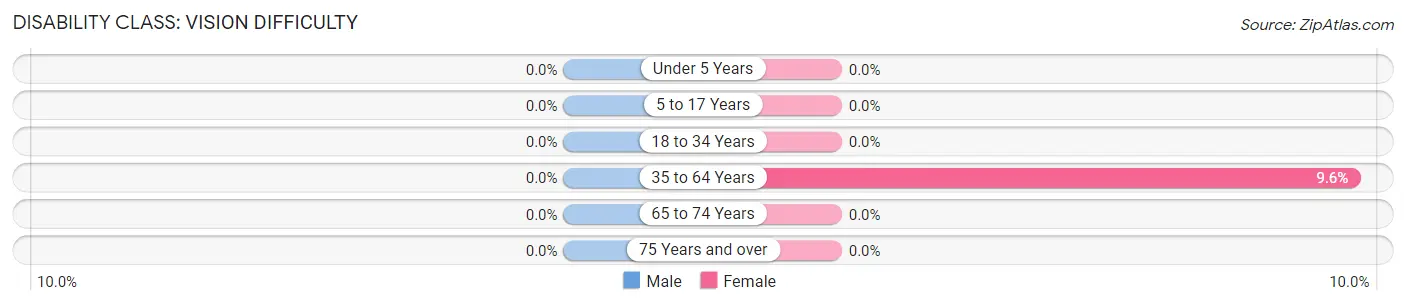
| Age Bracket | Male | Female |
| Under 5 Years | 0 (0.0%) | 0 (0.0%) |
| 5 to 17 Years | 0 (0.0%) | 0 (0.0%) |
| 18 to 34 Years | 0 (0.0%) | 0 (0.0%) |
| 35 to 64 Years | 0 (0.0%) | 5 (9.6%) |
| 65 to 74 Years | 0 (0.0%) | 0 (0.0%) |
| 75 Years and over | 0 (0.0%) | 0 (0.0%) |
Disability Class: Cognitive Difficulty
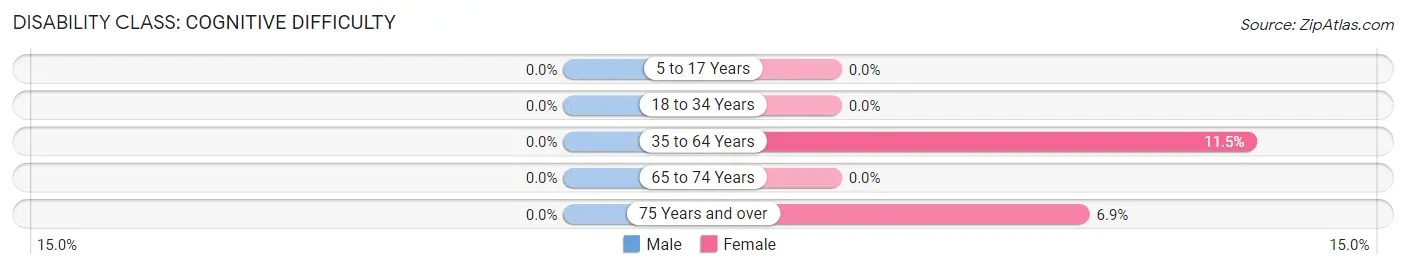
| Age Bracket | Male | Female |
| 5 to 17 Years | 0 (0.0%) | 0 (0.0%) |
| 18 to 34 Years | 0 (0.0%) | 0 (0.0%) |
| 35 to 64 Years | 0 (0.0%) | 6 (11.5%) |
| 65 to 74 Years | 0 (0.0%) | 0 (0.0%) |
| 75 Years and over | 0 (0.0%) | 2 (6.9%) |
Disability Class: Ambulatory Difficulty
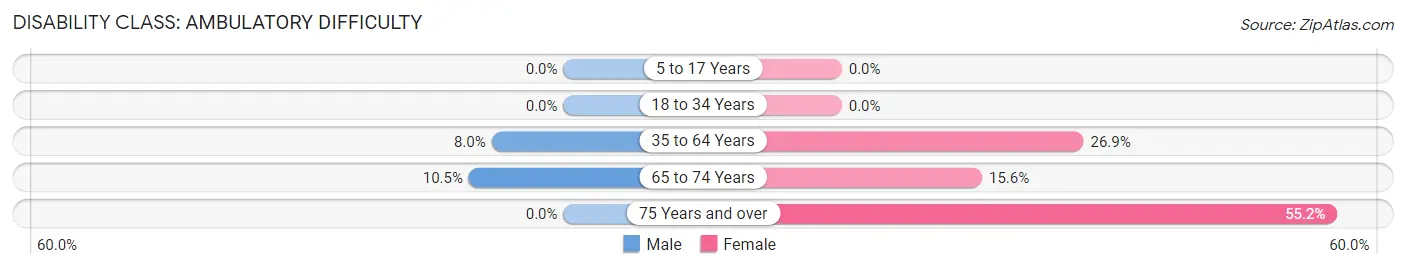
| Age Bracket | Male | Female |
| 5 to 17 Years | 0 (0.0%) | 0 (0.0%) |
| 18 to 34 Years | 0 (0.0%) | 0 (0.0%) |
| 35 to 64 Years | 4 (8.0%) | 14 (26.9%) |
| 65 to 74 Years | 2 (10.5%) | 5 (15.6%) |
| 75 Years and over | 0 (0.0%) | 16 (55.2%) |
Disability Class: Self-Care Difficulty
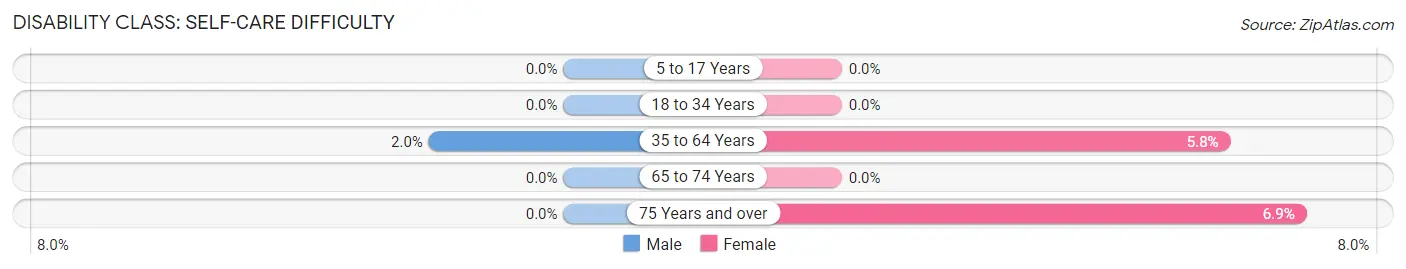
| Age Bracket | Male | Female |
| 5 to 17 Years | 0 (0.0%) | 0 (0.0%) |
| 18 to 34 Years | 0 (0.0%) | 0 (0.0%) |
| 35 to 64 Years | 1 (2.0%) | 3 (5.8%) |
| 65 to 74 Years | 0 (0.0%) | 0 (0.0%) |
| 75 Years and over | 0 (0.0%) | 2 (6.9%) |
Technology Access in Ivor
Computing Device Access in Ivor
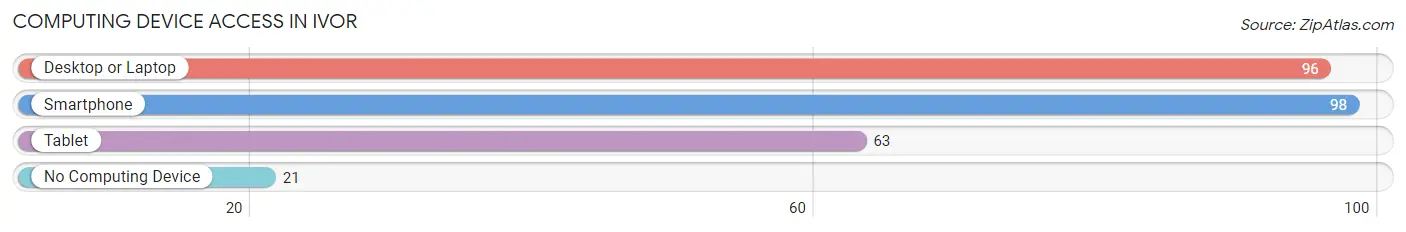
| Device Type | # Households | % Households |
| Desktop or Laptop | 96 | 69.6% |
| Smartphone | 98 | 71.0% |
| Tablet | 63 | 45.7% |
| No Computing Device | 21 | 15.2% |
| Total | 138 | 100.0% |
Internet Access in Ivor
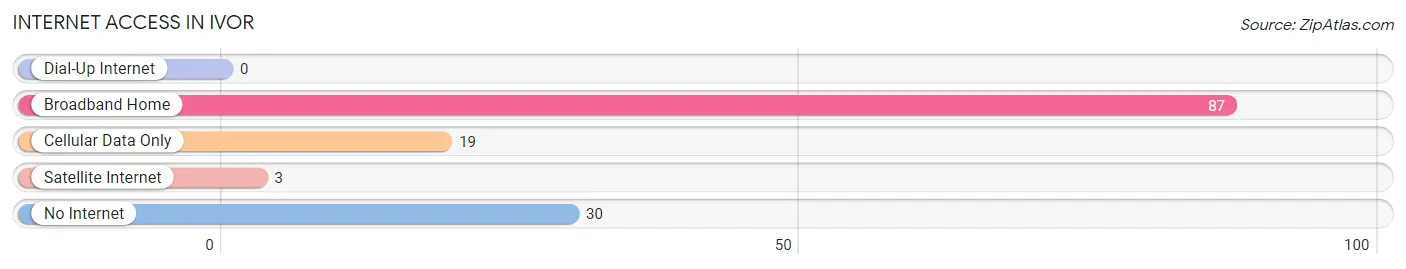
| Internet Type | # Households | % Households |
| Dial-Up Internet | 0 | 0.0% |
| Broadband Home | 87 | 63.0% |
| Cellular Data Only | 19 | 13.8% |
| Satellite Internet | 3 | 2.2% |
| No Internet | 30 | 21.7% |
| Total | 138 | 100.0% |
Ivor Summary
Ivor is a small town located in the southeastern corner of the state of Virginia. It is situated in the heart of Southampton County, which is part of the Hampton Roads metropolitan area. The town is located on the banks of the Blackwater River, and is home to a population of approximately 1,000 people.
Geography
Ivor is located in the southeastern corner of the state of Virginia, in the heart of Southampton County. The town is situated on the banks of the Blackwater River, and is surrounded by a number of small towns and villages. The town is located approximately 30 miles south of the city of Norfolk, and is part of the Hampton Roads metropolitan area. The town is located in a rural area, and is surrounded by farmland and forests. The town is located at an elevation of approximately 30 feet above sea level.
History
Ivor was founded in the late 19th century, and was named after the nearby Blackwater River. The town was originally a small farming community, and was home to a number of small businesses. In the early 20th century, the town began to grow, and a number of new businesses were established. In the mid-20th century, the town began to experience a period of decline, as many of the businesses closed and the population began to decline. In recent years, the town has experienced a resurgence, and is now home to a number of small businesses and a growing population.
Economy
Ivor is a small town, and the economy is largely based on small businesses and agriculture. The town is home to a number of small businesses, including restaurants, retail stores, and service providers. The town is also home to a number of farms, which produce a variety of crops, including corn, soybeans, and wheat. The town is also home to a number of manufacturing businesses, which produce a variety of products, including furniture, clothing, and electronics.
Demographics
As of the 2010 census, the population of Ivor was 1,000 people. The town is predominantly white, with approximately 90% of the population being white. The town is also home to a small African American population, which makes up approximately 5% of the population. The town is also home to a small Hispanic population, which makes up approximately 3% of the population. The median household income in the town is approximately $35,000, and the median home value is approximately $150,000.
Conclusion
Ivor is a small town located in the southeastern corner of the state of Virginia. It is situated in the heart of Southampton County, and is part of the Hampton Roads metropolitan area. The town is located on the banks of the Blackwater River, and is home to a population of approximately 1,000 people. The town is predominantly white, and is home to a number of small businesses and farms. The town is also home to a small African American and Hispanic population. The economy of the town is largely based on small businesses and agriculture, and the median household income is approximately $35,000.
Common Questions
What is Per Capita Income in Ivor?
Per Capita income in Ivor is $35,089.
What is the Median Family Income in Ivor?
Median Family Income in Ivor is $95,000.
What is the Median Household income in Ivor?
Median Household Income in Ivor is $57,857.
What is Inequality or Gini Index in Ivor?
Inequality or Gini Index in Ivor is 0.36.
What is the Total Population of Ivor?
Total Population of Ivor is 276.
What is the Total Male Population of Ivor?
Total Male Population of Ivor is 127.
What is the Total Female Population of Ivor?
Total Female Population of Ivor is 149.
What is the Ratio of Males per 100 Females in Ivor?
There are 85.23 Males per 100 Females in Ivor.
What is the Ratio of Females per 100 Males in Ivor?
There are 117.32 Females per 100 Males in Ivor.
What is the Median Population Age in Ivor?
Median Population Age in Ivor is 56.2 Years.
What is the Average Family Size in Ivor
Average Family Size in Ivor is 2.5 People.
What is the Average Household Size in Ivor
Average Household Size in Ivor is 2.0 People.
How Large is the Labor Force in Ivor?
There are 130 People in the Labor Forcein in Ivor.
What is the Percentage of People in the Labor Force in Ivor?
55.1% of People are in the Labor Force in Ivor.