Captains Cove, VA Map & Demographics
Captains Cove Map
Captains Cove Overview
$31,955
PER CAPITA INCOME
$73,958
AVG FAMILY INCOME
$66,083
AVG HOUSEHOLD INCOME
15.6%
WAGE / INCOME GAP [ % ]
84.4¢/ $1
WAGE / INCOME GAP [ $ ]
0.29
INEQUALITY / GINI INDEX
1,189
TOTAL POPULATION
578
MALE POPULATION
611
FEMALE POPULATION
94.60
MALES / 100 FEMALES
105.71
FEMALES / 100 MALES
62.8
MEDIAN AGE
2.9
AVG FAMILY SIZE
2.6
AVG HOUSEHOLD SIZE
338
LABOR FORCE [ PEOPLE ]
36.5%
PERCENT IN LABOR FORCE
12.4%
UNEMPLOYMENT RATE
Income in Captains Cove
Income Overview in Captains Cove
Per Capita Income in Captains Cove is $31,955, while median incomes of families and households are $73,958 and $66,083 respectively.
| Characteristic | Number | Measure |
| Per Capita Income | 1,189 | $31,955 |
| Median Family Income | 354 | $73,958 |
| Mean Family Income | 354 | $84,726 |
| Median Household Income | 459 | $66,083 |
| Mean Household Income | 459 | $78,628 |
| Income Deficit | 354 | $0 |
| Wage / Income Gap (%) | 1,189 | 15.61% |
| Wage / Income Gap ($) | 1,189 | 84.39¢ per $1 |
| Gini / Inequality Index | 1,189 | 0.29 |
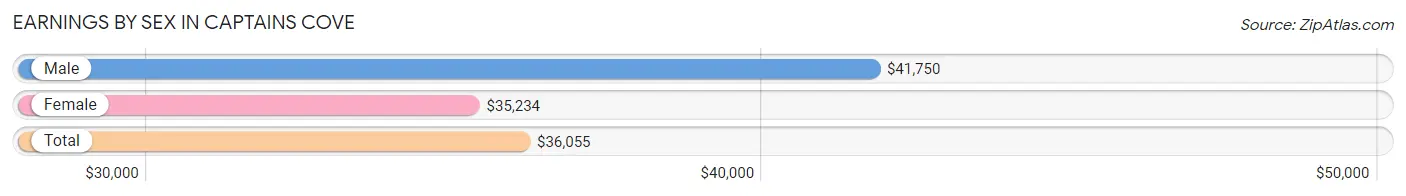
Earnings by Sex in Captains Cove
Average Earnings in Captains Cove are $36,055, $41,750 for men and $35,234 for women, a difference of 15.6%.
| Sex | Number | Average Earnings |
| Male | 165 (42.9%) | $41,750 |
| Female | 220 (57.1%) | $35,234 |
| Total | 385 (100.0%) | $36,055 |
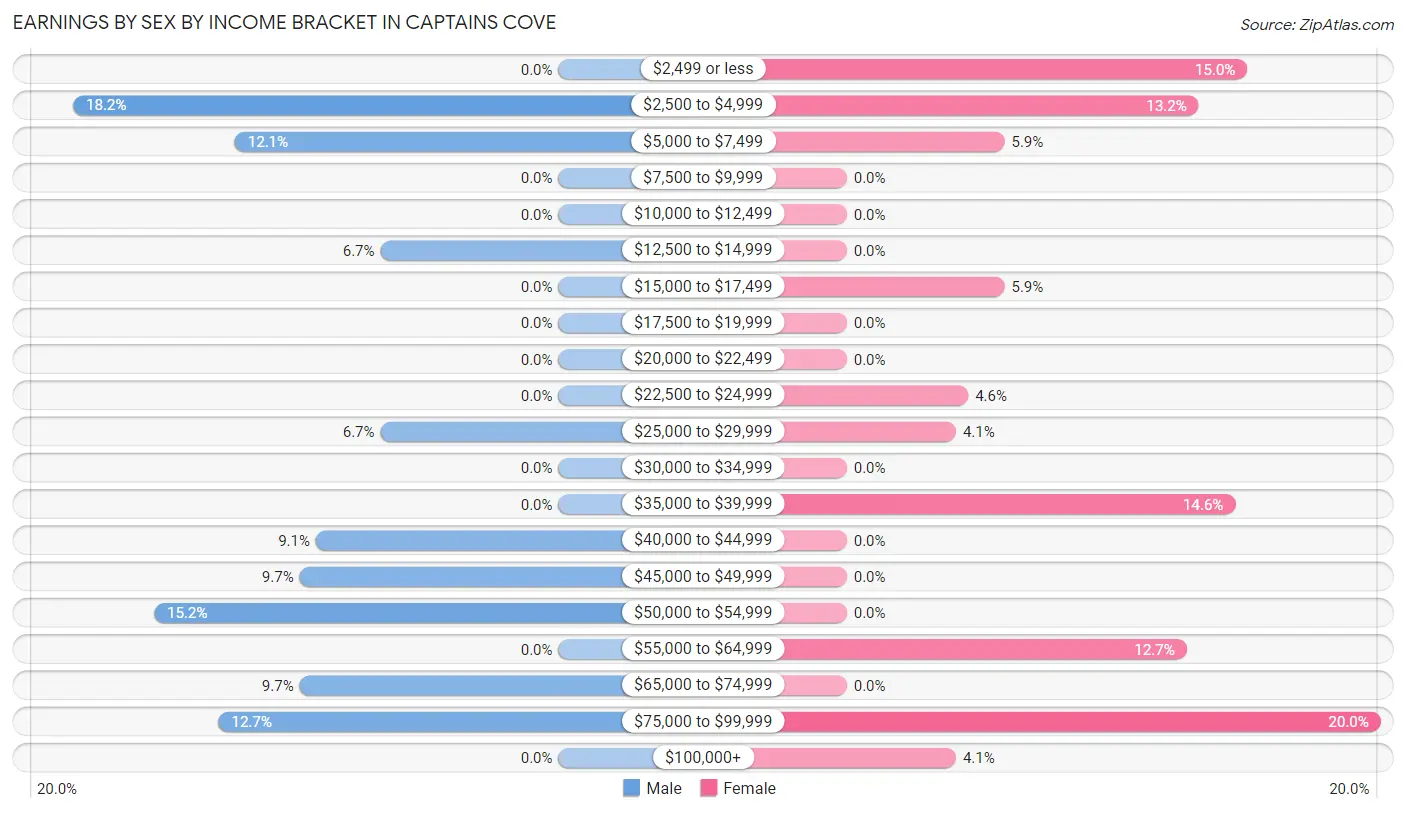
Earnings by Sex by Income Bracket in Captains Cove
The most common earnings brackets in Captains Cove are $2,500 to $4,999 for men (30 | 18.2%) and $75,000 to $99,999 for women (44 | 20.0%).
| Income | Male | Female |
| $2,499 or less | 0 (0.0%) | 33 (15.0%) |
| $2,500 to $4,999 | 30 (18.2%) | 29 (13.2%) |
| $5,000 to $7,499 | 20 (12.1%) | 13 (5.9%) |
| $7,500 to $9,999 | 0 (0.0%) | 0 (0.0%) |
| $10,000 to $12,499 | 0 (0.0%) | 0 (0.0%) |
| $12,500 to $14,999 | 11 (6.7%) | 0 (0.0%) |
| $15,000 to $17,499 | 0 (0.0%) | 13 (5.9%) |
| $17,500 to $19,999 | 0 (0.0%) | 0 (0.0%) |
| $20,000 to $22,499 | 0 (0.0%) | 0 (0.0%) |
| $22,500 to $24,999 | 0 (0.0%) | 10 (4.5%) |
| $25,000 to $29,999 | 11 (6.7%) | 9 (4.1%) |
| $30,000 to $34,999 | 0 (0.0%) | 0 (0.0%) |
| $35,000 to $39,999 | 0 (0.0%) | 32 (14.5%) |
| $40,000 to $44,999 | 15 (9.1%) | 0 (0.0%) |
| $45,000 to $49,999 | 16 (9.7%) | 0 (0.0%) |
| $50,000 to $54,999 | 25 (15.1%) | 0 (0.0%) |
| $55,000 to $64,999 | 0 (0.0%) | 28 (12.7%) |
| $65,000 to $74,999 | 16 (9.7%) | 0 (0.0%) |
| $75,000 to $99,999 | 21 (12.7%) | 44 (20.0%) |
| $100,000+ | 0 (0.0%) | 9 (4.1%) |
| Total | 165 (100.0%) | 220 (100.0%) |
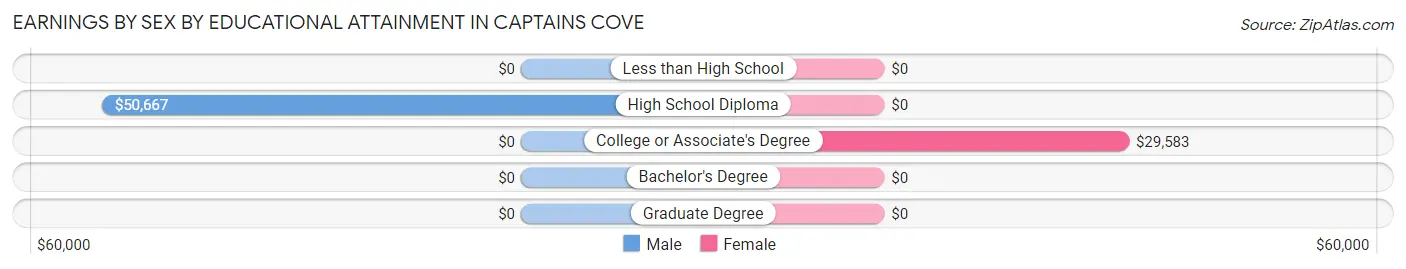
Earnings by Sex by Educational Attainment in Captains Cove
Average earnings in Captains Cove are $45,156 for men and $35,586 for women, a difference of 21.2%. Men with an educational attainment of high school diploma enjoy the highest average annual earnings of $50,667, while those with high school diploma education earn the least with $50,667. Women with an educational attainment of college or associate's degree earn the most with the average annual earnings of $29,583, while those with college or associate's degree education have the smallest earnings of $29,583.
| Educational Attainment | Male Income | Female Income |
| Less than High School | - | - |
| High School Diploma | $50,667 | $0 |
| College or Associate's Degree | - | - |
| Bachelor's Degree | - | - |
| Graduate Degree | - | - |
| Total | $45,156 | $35,586 |
Family Income in Captains Cove
Family Income Brackets in Captains Cove
According to the Captains Cove family income data, there are 117 families falling into the $50,000 to $74,999 income range, which is the most common income bracket and makes up 33.1% of all families.
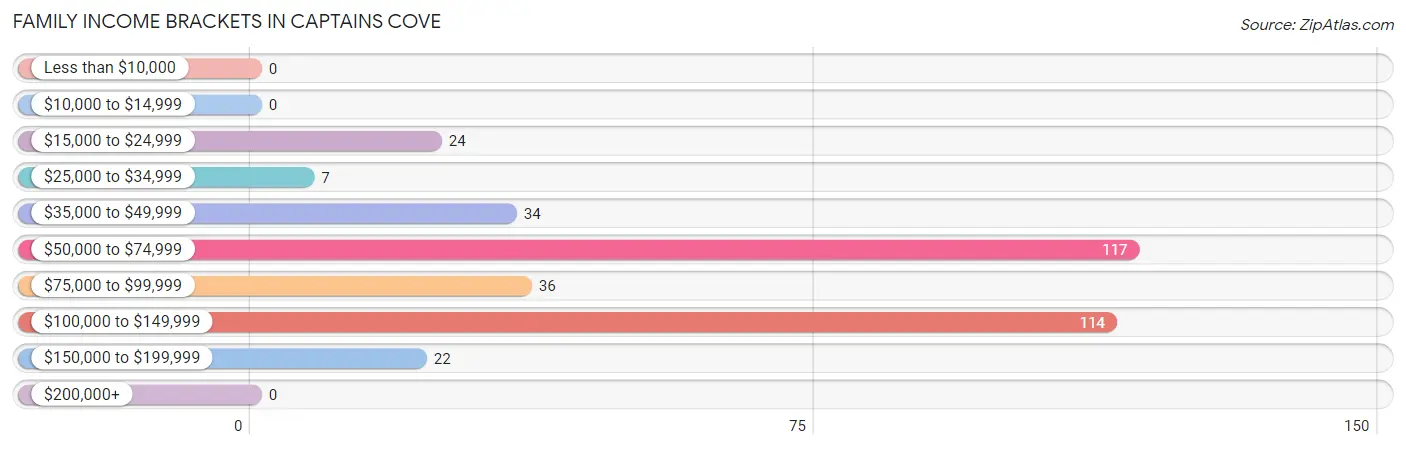
| Income Bracket | # Families | % Families |
| Less than $10,000 | 0 | 0.0% |
| $10,000 to $14,999 | 0 | 0.0% |
| $15,000 to $24,999 | 24 | 6.8% |
| $25,000 to $34,999 | 7 | 2.0% |
| $35,000 to $49,999 | 34 | 9.6% |
| $50,000 to $74,999 | 117 | 33.1% |
| $75,000 to $99,999 | 36 | 10.2% |
| $100,000 to $149,999 | 114 | 32.2% |
| $150,000 to $199,999 | 22 | 6.2% |
| $200,000+ | 0 | 0.0% |
Family Income by Famaliy Size in Captains Cove
2-person families (233 | 65.8%) account for the highest median family income in Captains Cove with $62,841 per family, while 2-person families (233 | 65.8%) have the highest median income of $31,420 per family member.
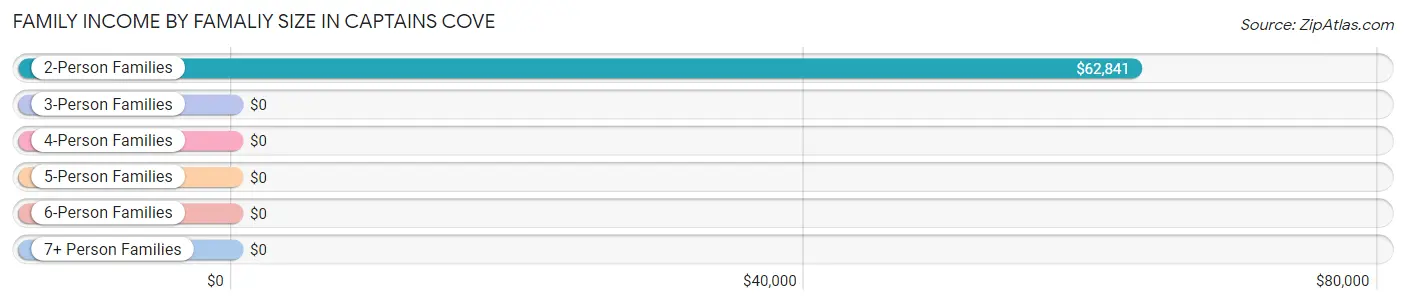
| Income Bracket | # Families | Median Income |
| 2-Person Families | 233 (65.8%) | $62,841 |
| 3-Person Families | 55 (15.5%) | $0 |
| 4-Person Families | 16 (4.5%) | $0 |
| 5-Person Families | 14 (4.0%) | $0 |
| 6-Person Families | 36 (10.2%) | $0 |
| 7+ Person Families | 0 (0.0%) | $0 |
| Total | 354 (100.0%) | $73,958 |
Family Income by Number of Earners in Captains Cove
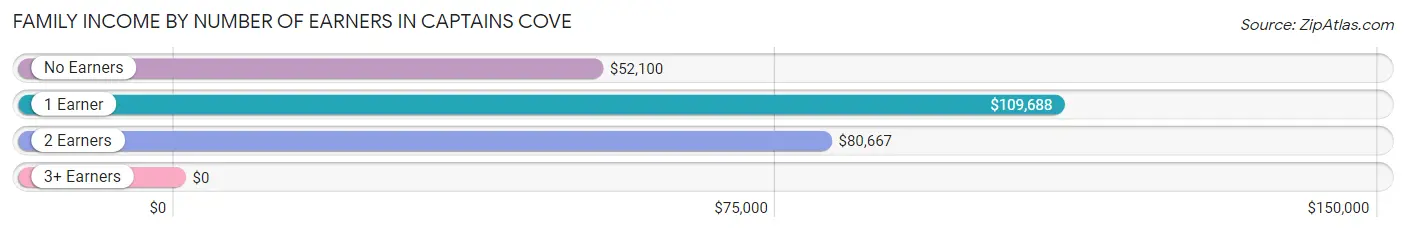
| Number of Earners | # Families | Median Income |
| No Earners | 198 (55.9%) | $52,100 |
| 1 Earner | 44 (12.4%) | $109,688 |
| 2 Earners | 82 (23.2%) | $80,667 |
| 3+ Earners | 30 (8.5%) | $0 |
| Total | 354 (100.0%) | $73,958 |
Household Income in Captains Cove
Household Income Brackets in Captains Cove
With 130 households falling in the category, the $50,000 to $74,999 income range is the most frequent in Captains Cove, accounting for 28.3% of all households.
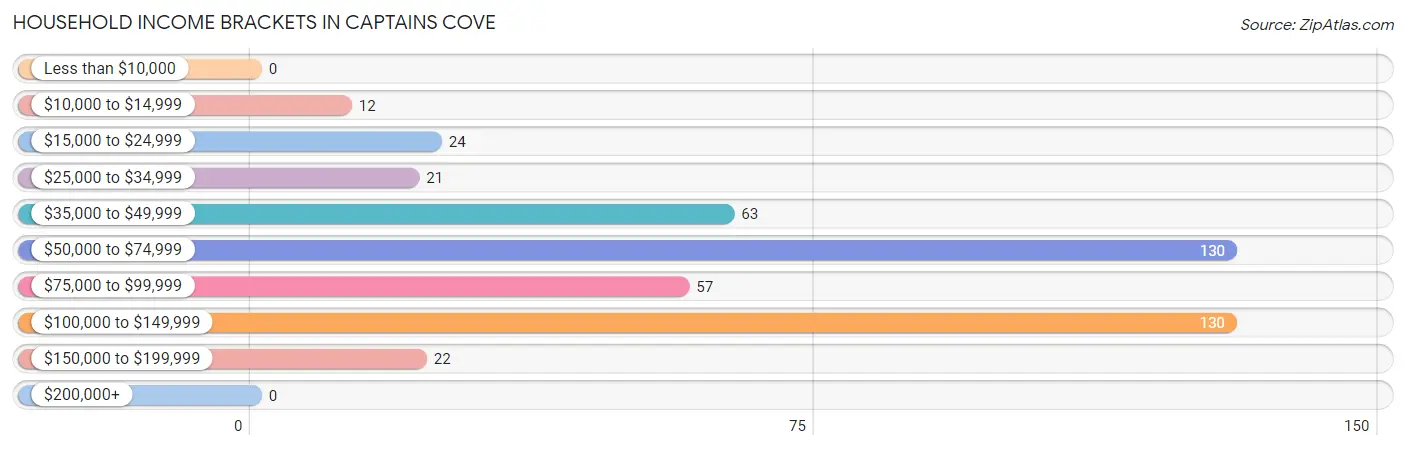
| Income Bracket | # Households | % Households |
| Less than $10,000 | 0 | 0.0% |
| $10,000 to $14,999 | 12 | 2.6% |
| $15,000 to $24,999 | 24 | 5.2% |
| $25,000 to $34,999 | 21 | 4.6% |
| $35,000 to $49,999 | 63 | 13.7% |
| $50,000 to $74,999 | 130 | 28.3% |
| $75,000 to $99,999 | 57 | 12.4% |
| $100,000 to $149,999 | 130 | 28.3% |
| $150,000 to $199,999 | 22 | 4.8% |
| $200,000+ | 0 | 0.0% |
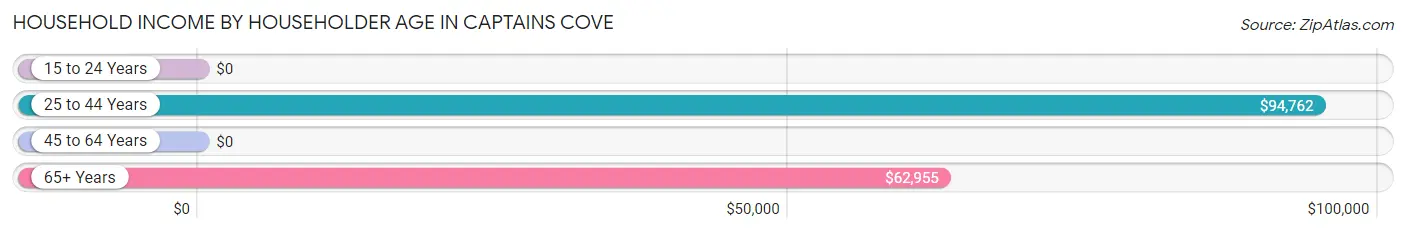
Household Income by Householder Age in Captains Cove
The median household income in Captains Cove is $66,083, with the highest median household income of $94,762 found in the 25 to 44 years age bracket for the primary householder. A total of 96 households (20.9%) fall into this category.
| Income Bracket | # Households | Median Income |
| 15 to 24 Years | 0 (0.0%) | $0 |
| 25 to 44 Years | 96 (20.9%) | $94,762 |
| 45 to 64 Years | 75 (16.3%) | $0 |
| 65+ Years | 288 (62.7%) | $62,955 |
| Total | 459 (100.0%) | $66,083 |
Poverty in Captains Cove
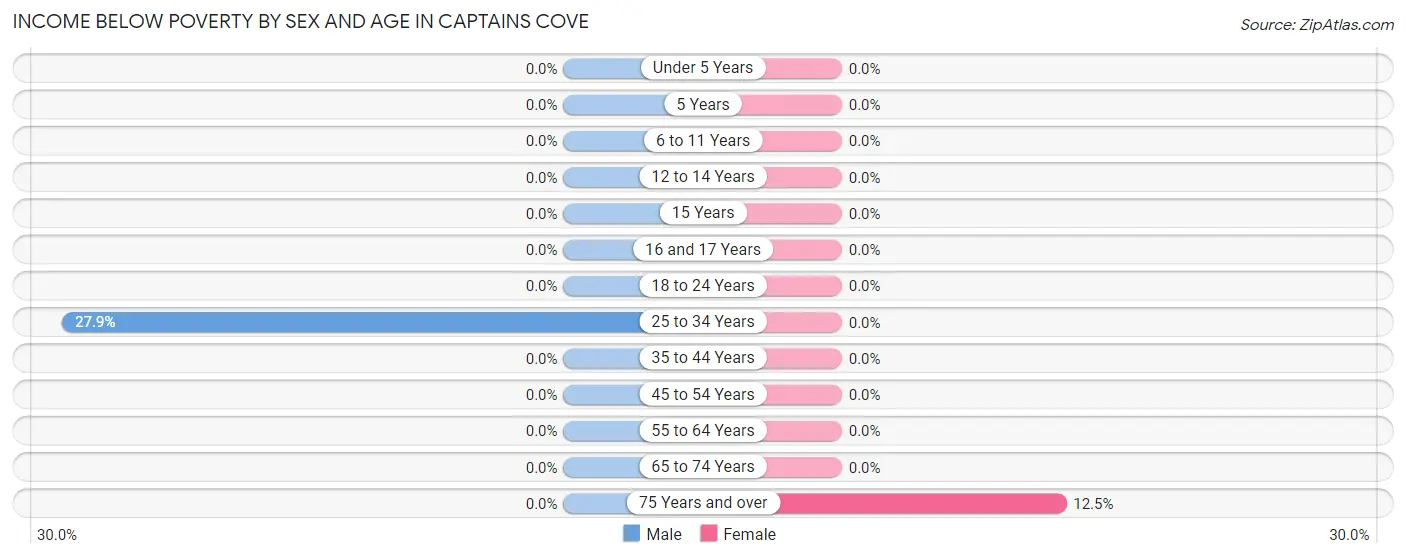
Income Below Poverty by Sex and Age in Captains Cove
With 2.1% poverty level for males and 2.0% for females among the residents of Captains Cove, 25 to 34 year old males and 75 year old and over females are the most vulnerable to poverty, with 12 males (27.9%) and 12 females (12.5%) in their respective age groups living below the poverty level.
| Age Bracket | Male | Female |
| Under 5 Years | 0 (0.0%) | 0 (0.0%) |
| 5 Years | 0 (0.0%) | 0 (0.0%) |
| 6 to 11 Years | 0 (0.0%) | 0 (0.0%) |
| 12 to 14 Years | 0 (0.0%) | 0 (0.0%) |
| 15 Years | 0 (0.0%) | 0 (0.0%) |
| 16 and 17 Years | 0 (0.0%) | 0 (0.0%) |
| 18 to 24 Years | 0 (0.0%) | 0 (0.0%) |
| 25 to 34 Years | 12 (27.9%) | 0 (0.0%) |
| 35 to 44 Years | 0 (0.0%) | 0 (0.0%) |
| 45 to 54 Years | 0 (0.0%) | 0 (0.0%) |
| 55 to 64 Years | 0 (0.0%) | 0 (0.0%) |
| 65 to 74 Years | 0 (0.0%) | 0 (0.0%) |
| 75 Years and over | 0 (0.0%) | 12 (12.5%) |
| Total | 12 (2.1%) | 12 (2.0%) |
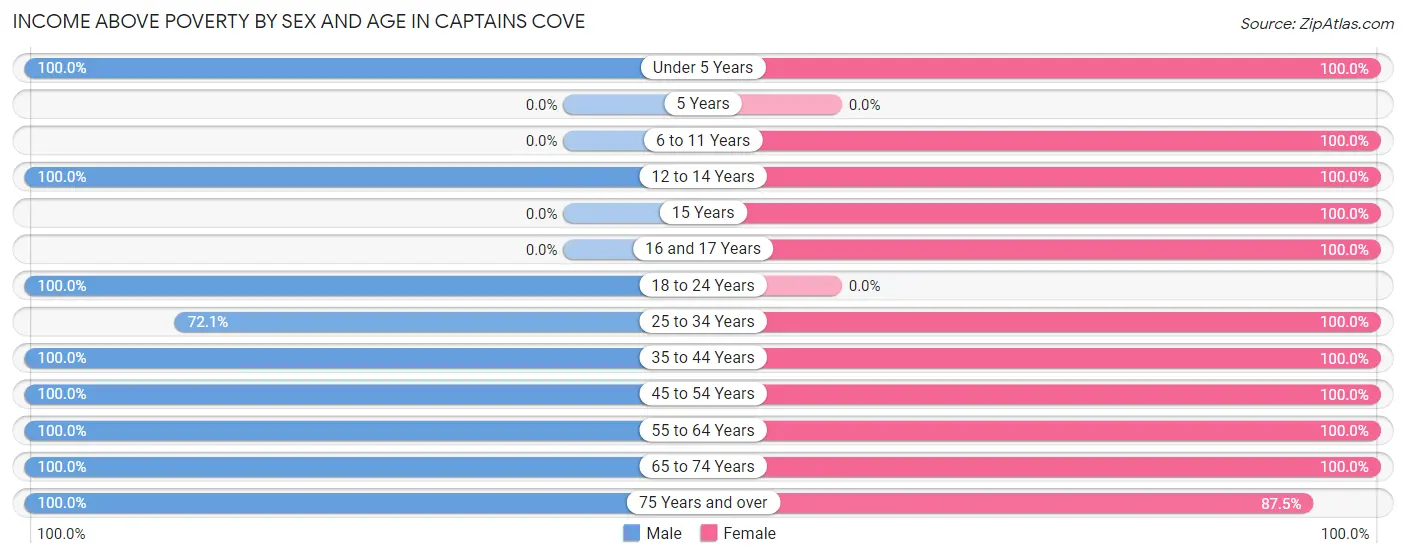
Income Above Poverty by Sex and Age in Captains Cove
According to the poverty statistics in Captains Cove, males aged under 5 years and females aged under 5 years are the age groups that are most secure financially, with 100.0% of males and 100.0% of females in these age groups living above the poverty line.
| Age Bracket | Male | Female |
| Under 5 Years | 47 (100.0%) | 36 (100.0%) |
| 5 Years | 0 (0.0%) | 0 (0.0%) |
| 6 to 11 Years | 0 (0.0%) | 40 (100.0%) |
| 12 to 14 Years | 93 (100.0%) | 34 (100.0%) |
| 15 Years | 0 (0.0%) | 12 (100.0%) |
| 16 and 17 Years | 0 (0.0%) | 9 (100.0%) |
| 18 to 24 Years | 11 (100.0%) | 0 (0.0%) |
| 25 to 34 Years | 31 (72.1%) | 89 (100.0%) |
| 35 to 44 Years | 52 (100.0%) | 57 (100.0%) |
| 45 to 54 Years | 15 (100.0%) | 13 (100.0%) |
| 55 to 64 Years | 18 (100.0%) | 108 (100.0%) |
| 65 to 74 Years | 169 (100.0%) | 117 (100.0%) |
| 75 Years and over | 130 (100.0%) | 84 (87.5%) |
| Total | 566 (97.9%) | 599 (98.0%) |
Income Below Poverty Among Married-Couple Families in Captains Cove
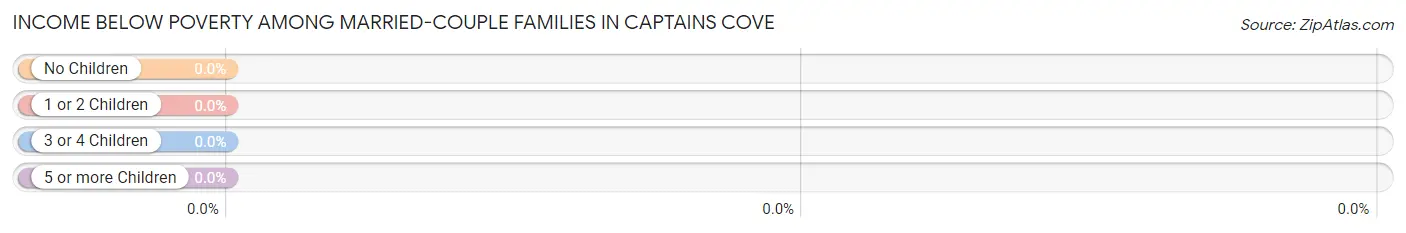
| Children | Above Poverty | Below Poverty |
| No Children | 233 (100.0%) | 0 (0.0%) |
| 1 or 2 Children | 85 (100.0%) | 0 (0.0%) |
| 3 or 4 Children | 36 (100.0%) | 0 (0.0%) |
| 5 or more Children | 0 (0.0%) | 0 (0.0%) |
| Total | 354 (100.0%) | 0 (0.0%) |
Income Below Poverty Among Single-Parent Households in Captains Cove
| Children | Single Father | Single Mother |
| No Children | 0 (0.0%) | 0 (0.0%) |
| 1 or 2 Children | 0 (0.0%) | 0 (0.0%) |
| 3 or 4 Children | 0 (0.0%) | 0 (0.0%) |
| 5 or more Children | 0 (0.0%) | 0 (0.0%) |
| Total | 0 (0.0%) | 0 (0.0%) |
Income Below Poverty Among Married-Couple vs Single-Parent Households in Captains Cove
| Children | Married-Couple Families | Single-Parent Households |
| No Children | 0 (0.0%) | 0 (0.0%) |
| 1 or 2 Children | 0 (0.0%) | 0 (0.0%) |
| 3 or 4 Children | 0 (0.0%) | 0 (0.0%) |
| 5 or more Children | 0 (0.0%) | 0 (0.0%) |
| Total | 0 (0.0%) | 0 (0.0%) |
Race in Captains Cove
The most populous races in Captains Cove are White / Caucasian (1,168 | 98.2%), Black / African American (21 | 1.8%), and Hispanic or Latino (11 | 0.9%).
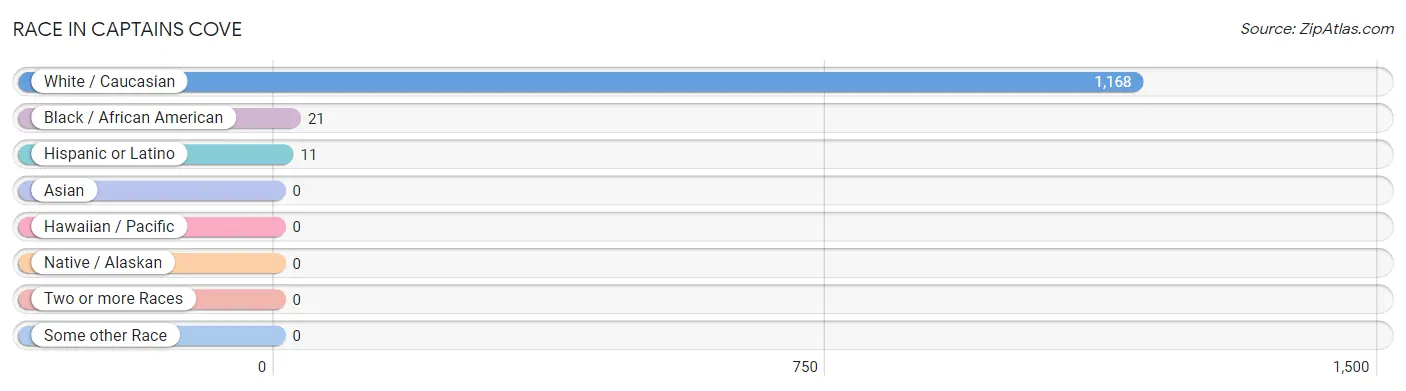
| Race | # Population | % Population |
| Asian | 0 | 0.0% |
| Black / African American | 21 | 1.8% |
| Hawaiian / Pacific | 0 | 0.0% |
| Hispanic or Latino | 11 | 0.9% |
| Native / Alaskan | 0 | 0.0% |
| White / Caucasian | 1,168 | 98.2% |
| Two or more Races | 0 | 0.0% |
| Some other Race | 0 | 0.0% |
| Total | 1,189 | 100.0% |
Ancestry in Captains Cove
The most populous ancestries reported in Captains Cove are English (404 | 34.0%), Irish (355 | 29.9%), German (247 | 20.8%), Polish (152 | 12.8%), and Italian (77 | 6.5%), together accounting for 103.9% of all Captains Cove residents.
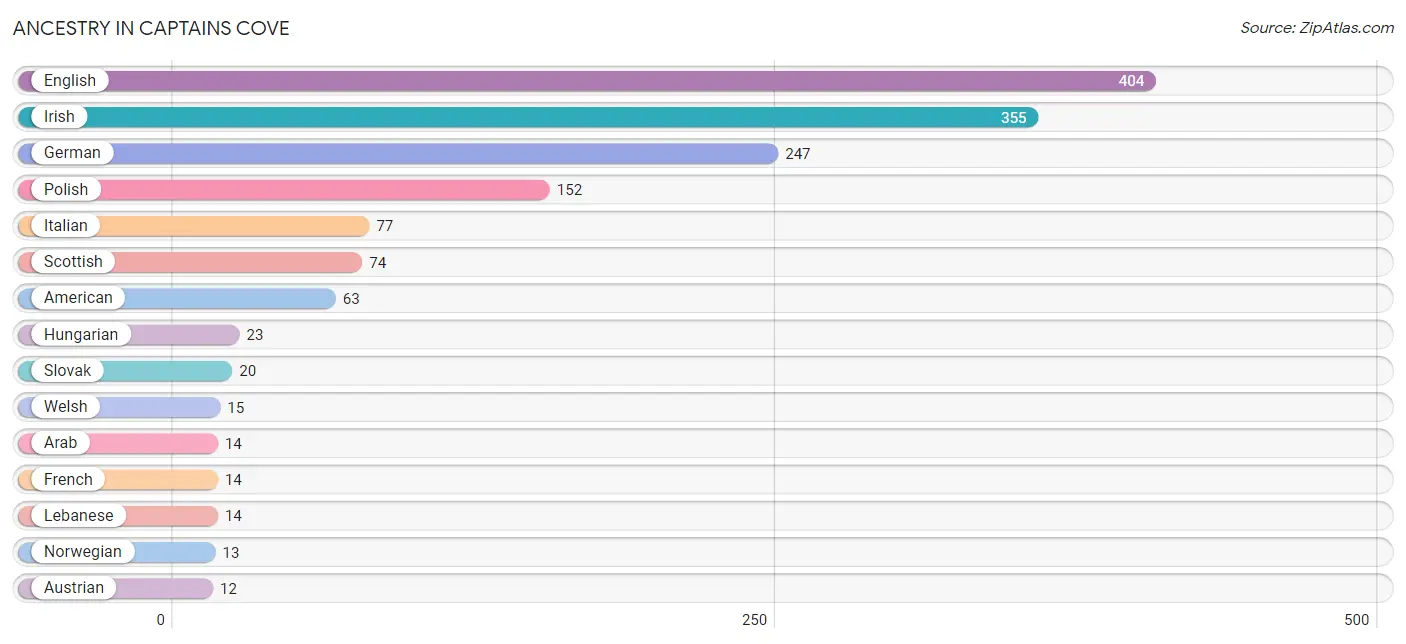
| Ancestry | # Population | % Population |
| American | 63 | 5.3% |
| Arab | 14 | 1.2% |
| Austrian | 12 | 1.0% |
| Czech | 9 | 0.8% |
| English | 404 | 34.0% |
| French | 14 | 1.2% |
| German | 247 | 20.8% |
| Hungarian | 23 | 1.9% |
| Irish | 355 | 29.9% |
| Italian | 77 | 6.5% |
| Lebanese | 14 | 1.2% |
| Norwegian | 13 | 1.1% |
| Polish | 152 | 12.8% |
| Puerto Rican | 11 | 0.9% |
| Scottish | 74 | 6.2% |
| Slovak | 20 | 1.7% |
| Ukrainian | 11 | 0.9% |
| Welsh | 15 | 1.3% | View All 18 Rows |
Immigrants in Captains Cove

| Immigration Origin | # Population | % Population | View All 0 Rows |
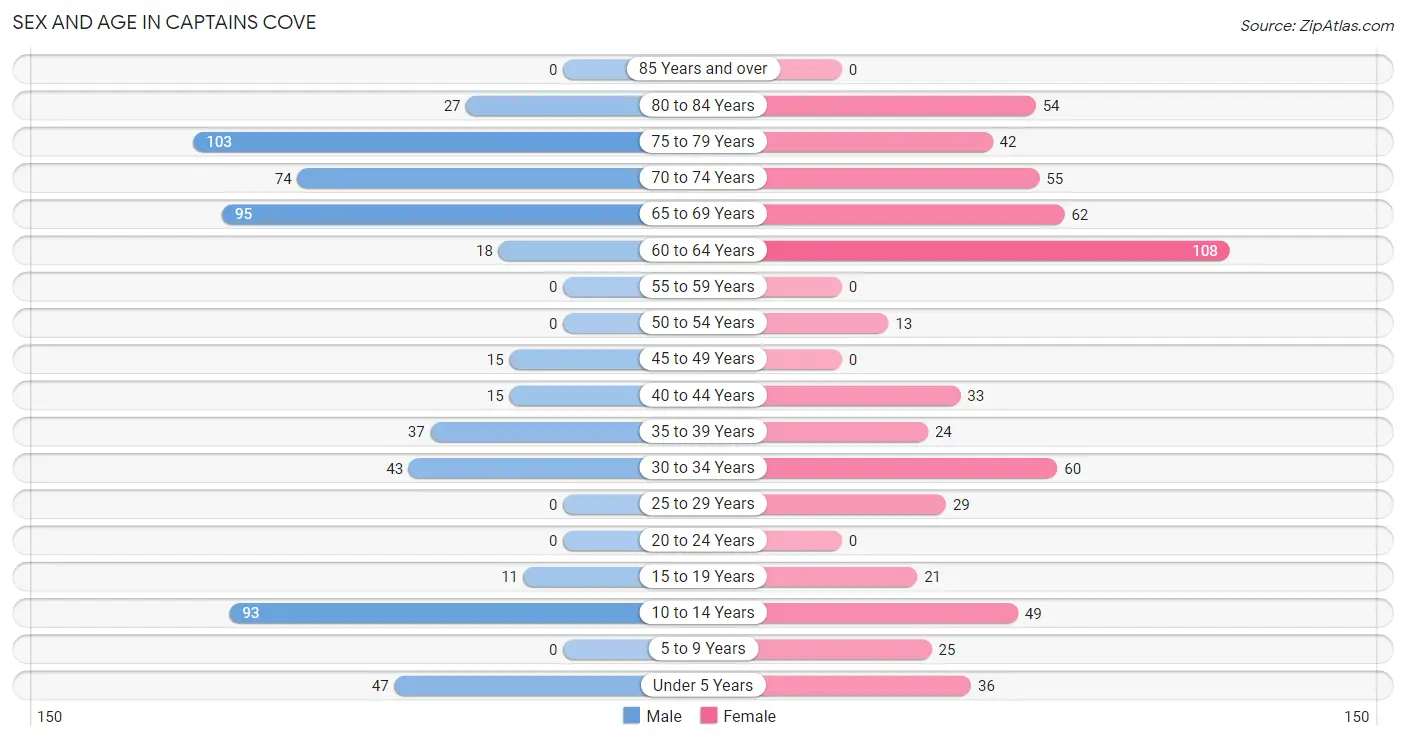
Sex and Age in Captains Cove
Sex and Age in Captains Cove
The most populous age groups in Captains Cove are 75 to 79 Years (103 | 17.8%) for men and 60 to 64 Years (108 | 17.7%) for women.
| Age Bracket | Male | Female |
| Under 5 Years | 47 (8.1%) | 36 (5.9%) |
| 5 to 9 Years | 0 (0.0%) | 25 (4.1%) |
| 10 to 14 Years | 93 (16.1%) | 49 (8.0%) |
| 15 to 19 Years | 11 (1.9%) | 21 (3.4%) |
| 20 to 24 Years | 0 (0.0%) | 0 (0.0%) |
| 25 to 29 Years | 0 (0.0%) | 29 (4.8%) |
| 30 to 34 Years | 43 (7.4%) | 60 (9.8%) |
| 35 to 39 Years | 37 (6.4%) | 24 (3.9%) |
| 40 to 44 Years | 15 (2.6%) | 33 (5.4%) |
| 45 to 49 Years | 15 (2.6%) | 0 (0.0%) |
| 50 to 54 Years | 0 (0.0%) | 13 (2.1%) |
| 55 to 59 Years | 0 (0.0%) | 0 (0.0%) |
| 60 to 64 Years | 18 (3.1%) | 108 (17.7%) |
| 65 to 69 Years | 95 (16.4%) | 62 (10.2%) |
| 70 to 74 Years | 74 (12.8%) | 55 (9.0%) |
| 75 to 79 Years | 103 (17.8%) | 42 (6.9%) |
| 80 to 84 Years | 27 (4.7%) | 54 (8.8%) |
| 85 Years and over | 0 (0.0%) | 0 (0.0%) |
| Total | 578 (100.0%) | 611 (100.0%) |
Families and Households in Captains Cove
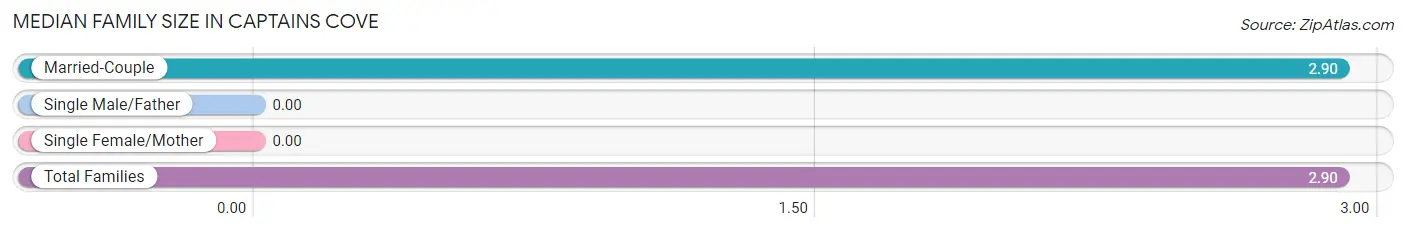
Median Family Size in Captains Cove
| Family Type | # Families | Family Size |
| Married-Couple | 354 (100.0%) | 2.90 |
| Single Male/Father | 0 (0.0%) | - |
| Single Female/Mother | 0 (0.0%) | - |
| Total Families | 354 (100.0%) | 2.90 |
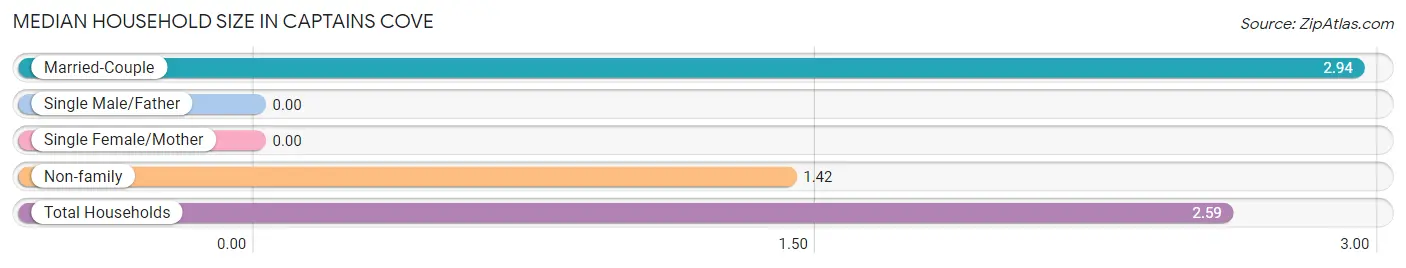
Median Household Size in Captains Cove
| Household Type | # Households | Household Size |
| Married-Couple | 354 (77.1%) | 2.94 |
| Single Male/Father | 0 (0.0%) | - |
| Single Female/Mother | 0 (0.0%) | - |
| Non-family | 105 (22.9%) | 1.42 |
| Total Households | 459 (100.0%) | 2.59 |
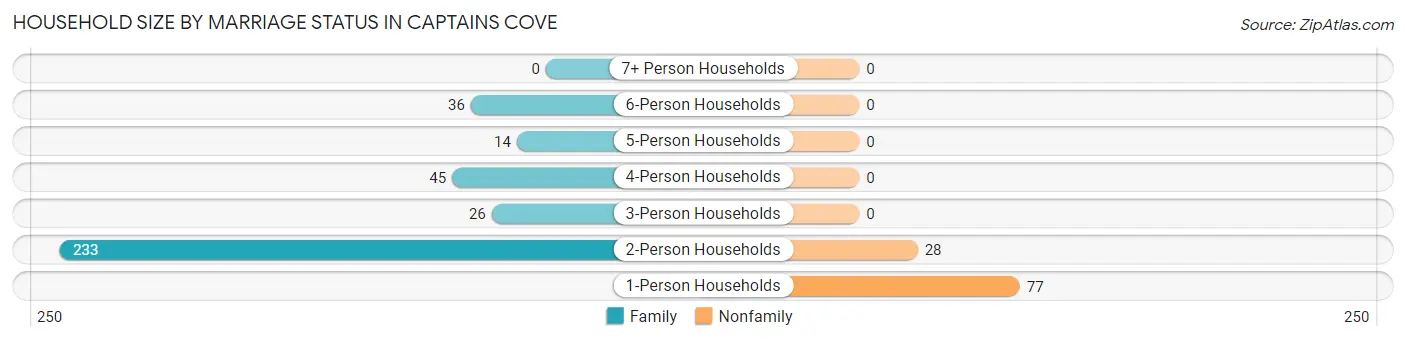
Household Size by Marriage Status in Captains Cove
Out of a total of 459 households in Captains Cove, 354 (77.1%) are family households, while 105 (22.9%) are nonfamily households. The most numerous type of family households are 2-person households, comprising 233, and the most common type of nonfamily households are 1-person households, comprising 77.
| Household Size | Family Households | Nonfamily Households |
| 1-Person Households | - | 77 (16.8%) |
| 2-Person Households | 233 (50.8%) | 28 (6.1%) |
| 3-Person Households | 26 (5.7%) | 0 (0.0%) |
| 4-Person Households | 45 (9.8%) | 0 (0.0%) |
| 5-Person Households | 14 (3.0%) | 0 (0.0%) |
| 6-Person Households | 36 (7.8%) | 0 (0.0%) |
| 7+ Person Households | 0 (0.0%) | 0 (0.0%) |
| Total | 354 (77.1%) | 105 (22.9%) |
Female Fertility in Captains Cove
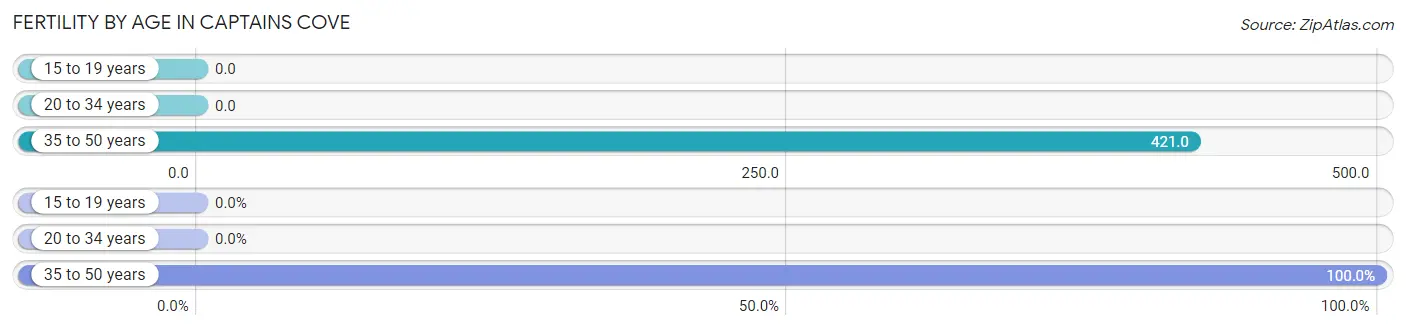
Fertility by Age in Captains Cove
Average fertility rate in Captains Cove is 144.0 births per 1,000 women. Women in the age bracket of 35 to 50 years have the highest fertility rate with 421.0 births per 1,000 women. Women in the age bracket of 35 to 50 years acount for 100.0% of all women with births.
| Age Bracket | Women with Births | Births / 1,000 Women |
| 15 to 19 years | 0 (0.0%) | 0.0 |
| 20 to 34 years | 0 (0.0%) | 0.0 |
| 35 to 50 years | 24 (100.0%) | 421.0 |
| Total | 24 (100.0%) | 144.0 |
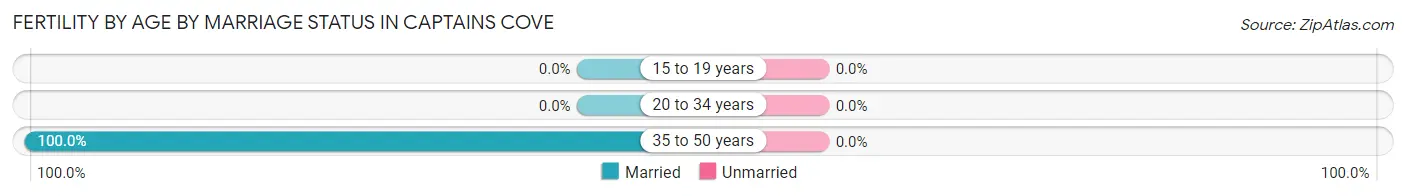
Fertility by Age by Marriage Status in Captains Cove
| Age Bracket | Married | Unmarried |
| 15 to 19 years | 0 (0.0%) | 0 (0.0%) |
| 20 to 34 years | 0 (0.0%) | 0 (0.0%) |
| 35 to 50 years | 24 (100.0%) | 0 (0.0%) |
| Total | 24 (100.0%) | 0 (0.0%) |
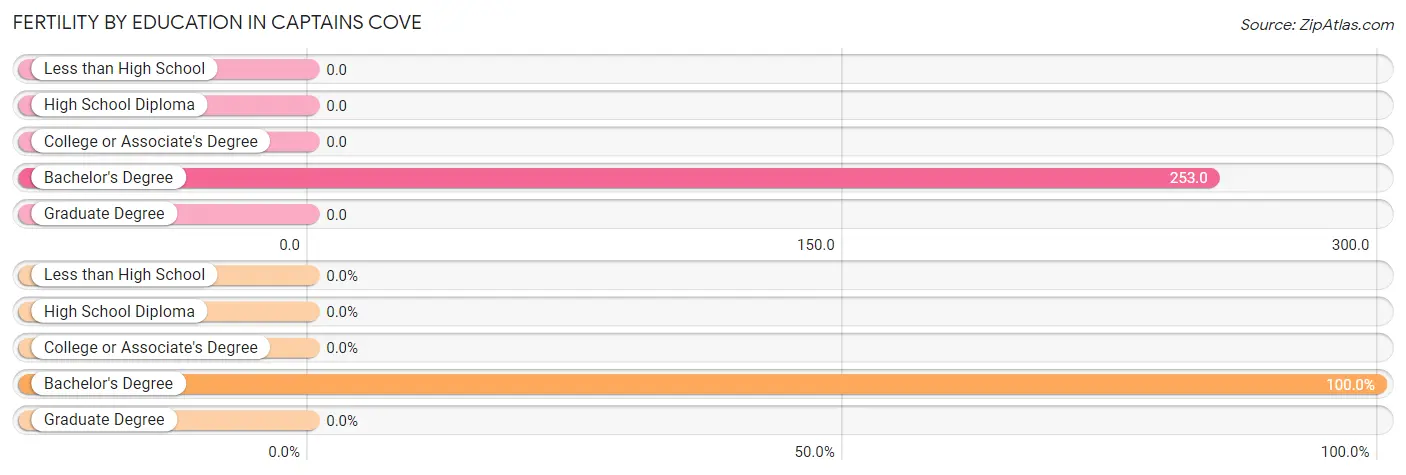
Fertility by Education in Captains Cove
| Educational Attainment | Women with Births | Births / 1,000 Women |
| Less than High School | 0 (0.0%) | 0.0 |
| High School Diploma | 0 (0.0%) | 0.0 |
| College or Associate's Degree | 0 (0.0%) | 0.0 |
| Bachelor's Degree | 24 (100.0%) | 253.0 |
| Graduate Degree | 0 (0.0%) | 0.0 |
| Total | 24 (100.0%) | 144.0 |
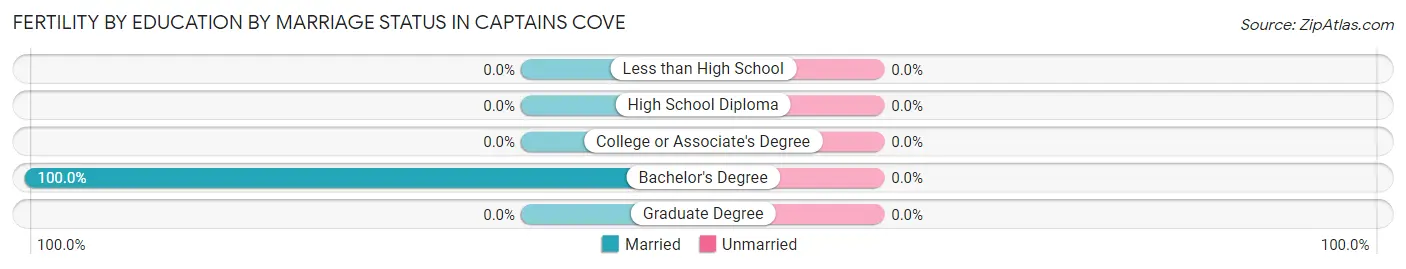
Fertility by Education by Marriage Status in Captains Cove
| Educational Attainment | Married | Unmarried |
| Less than High School | 0 (0.0%) | 0 (0.0%) |
| High School Diploma | 0 (0.0%) | 0 (0.0%) |
| College or Associate's Degree | 0 (0.0%) | 0 (0.0%) |
| Bachelor's Degree | 24 (100.0%) | 0 (0.0%) |
| Graduate Degree | 0 (0.0%) | 0 (0.0%) |
| Total | 24 (100.0%) | 0 (0.0%) |
Employment Characteristics in Captains Cove
Employment by Class of Employer in Captains Cove
Among the 273 employed individuals in Captains Cove, private company employees (137 | 50.2%), not-for-profit organizations (57 | 20.9%), and federal government employees (31 | 11.4%) make up the most common classes of employment.
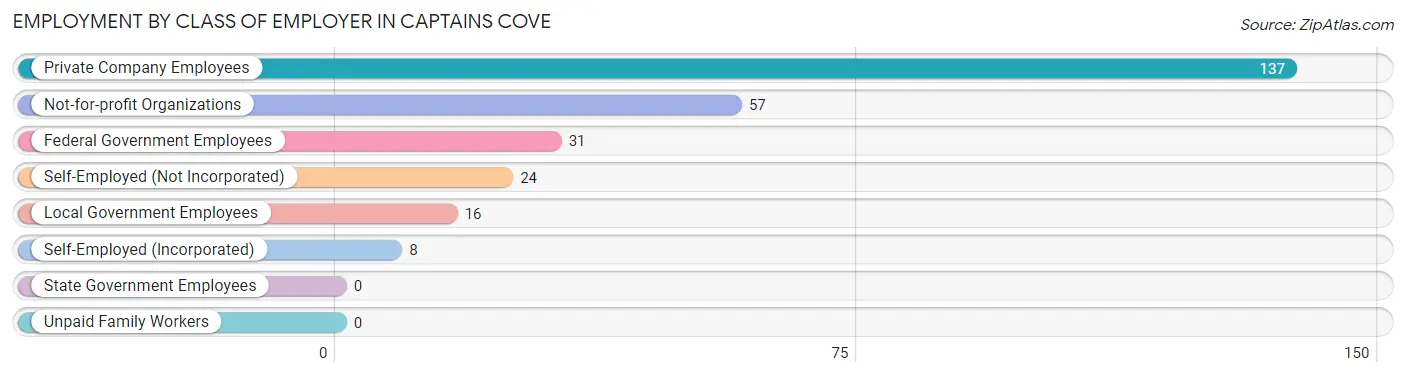
| Employer Class | # Employees | % Employees |
| Private Company Employees | 137 | 50.2% |
| Self-Employed (Incorporated) | 8 | 2.9% |
| Self-Employed (Not Incorporated) | 24 | 8.8% |
| Not-for-profit Organizations | 57 | 20.9% |
| Local Government Employees | 16 | 5.9% |
| State Government Employees | 0 | 0.0% |
| Federal Government Employees | 31 | 11.4% |
| Unpaid Family Workers | 0 | 0.0% |
| Total | 273 | 100.0% |
Employment Status by Age in Captains Cove
According to the labor force statistics for Captains Cove, out of the total population over 16 years of age (927), 36.5% or 338 individuals are in the labor force, with 12.4% or 42 of them unemployed. The age group with the highest labor force participation rate is 25 to 29 years, with 100.0% or 29 individuals in the labor force. Within the labor force, the 16 to 19 years age range has the highest percentage of unemployed individuals, with 100.0% or 11 of them being unemployed.
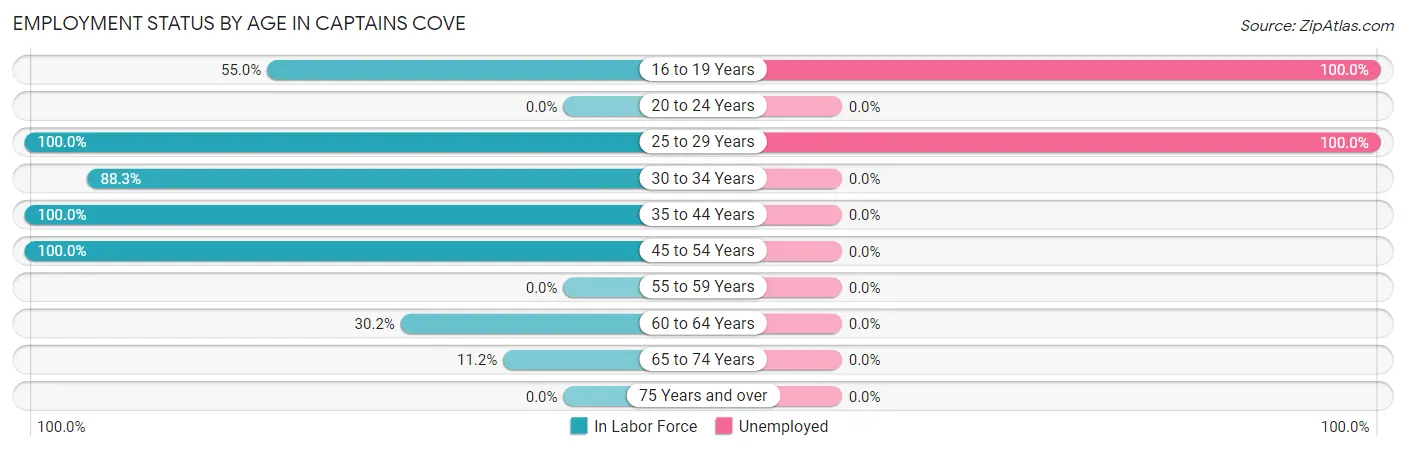
| Age Bracket | In Labor Force | Unemployed |
| 16 to 19 Years | 11 (55.0%) | 11 (100.0%) |
| 20 to 24 Years | 0 (0.0%) | 0 (0.0%) |
| 25 to 29 Years | 29 (100.0%) | 29 (100.0%) |
| 30 to 34 Years | 91 (88.3%) | 0 (0.0%) |
| 35 to 44 Years | 109 (100.0%) | 0 (0.0%) |
| 45 to 54 Years | 28 (100.0%) | 0 (0.0%) |
| 55 to 59 Years | 0 (0.0%) | 0 (0.0%) |
| 60 to 64 Years | 38 (30.2%) | 0 (0.0%) |
| 65 to 74 Years | 32 (11.2%) | 0 (0.0%) |
| 75 Years and over | 0 (0.0%) | 0 (0.0%) |
| Total | 338 (36.5%) | 42 (12.4%) |
Employment Status by Educational Attainment in Captains Cove
According to labor force statistics for Captains Cove, 74.7% of individuals (295) out of the total population between 25 and 64 years of age (395) are in the labor force, with 10.4% or 31 of them being unemployed. The group with the highest labor force participation rate are those with the educational attainment of bachelor's degree or higher, with 76.9% or 143 individuals in the labor force. Within the labor force, individuals with bachelor's degree or higher education have the highest percentage of unemployment, with 20.3% or 29 of them being unemployed.
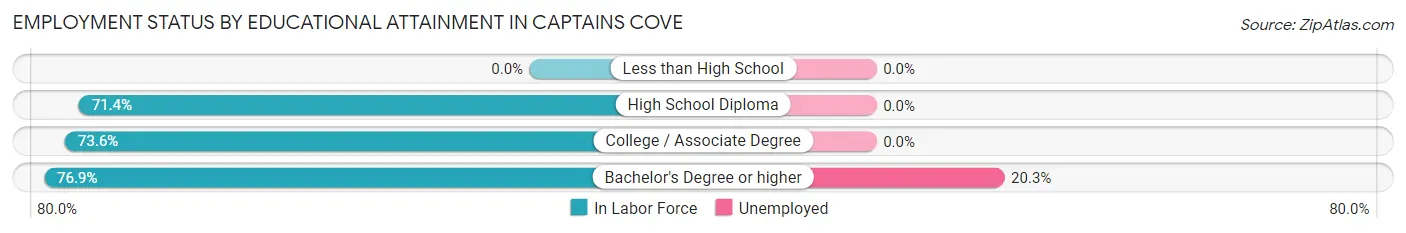
| Educational Attainment | In Labor Force | Unemployed |
| Less than High School | 0 (0.0%) | 0 (0.0%) |
| High School Diploma | 60 (71.4%) | 0 (0.0%) |
| College / Associate Degree | 92 (73.6%) | 0 (0.0%) |
| Bachelor's Degree or higher | 143 (76.9%) | 38 (20.3%) |
| Total | 295 (74.7%) | 41 (10.4%) |
Employment Occupations by Sex in Captains Cove
Management, Business, Science and Arts Occupations
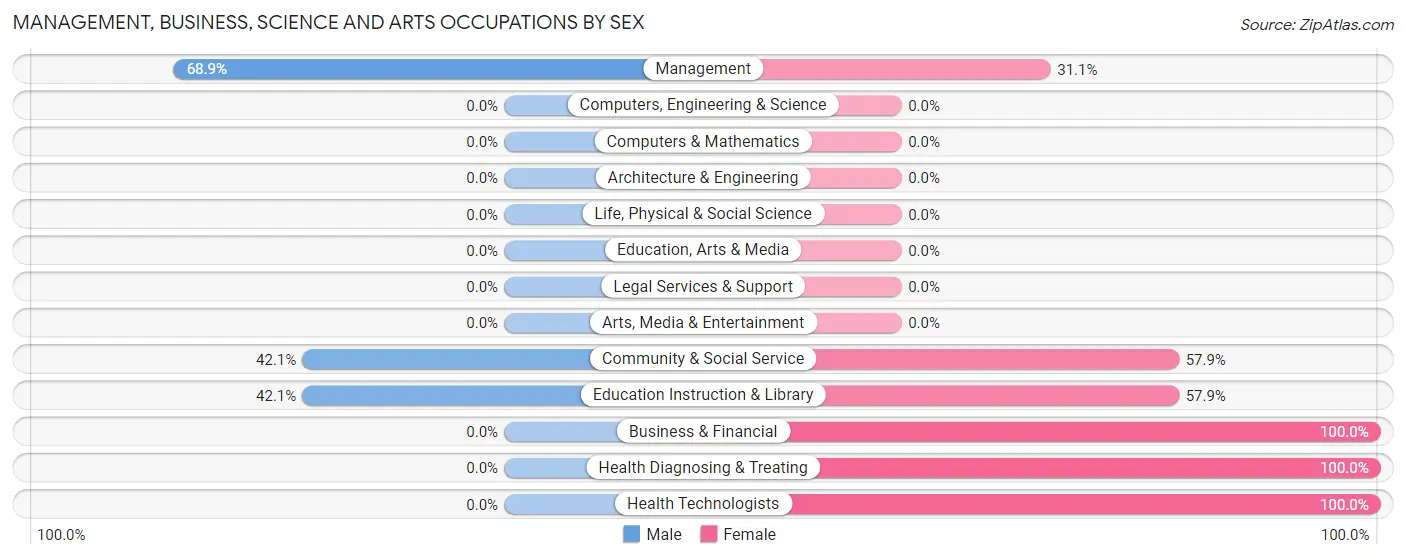
The most common Management, Business, Science and Arts occupations in Captains Cove are Management (45 | 15.9%), Community & Social Service (38 | 13.4%), Education Instruction & Library (38 | 13.4%), Health Diagnosing & Treating (20 | 7.1%), and Health Technologists (20 | 7.1%).
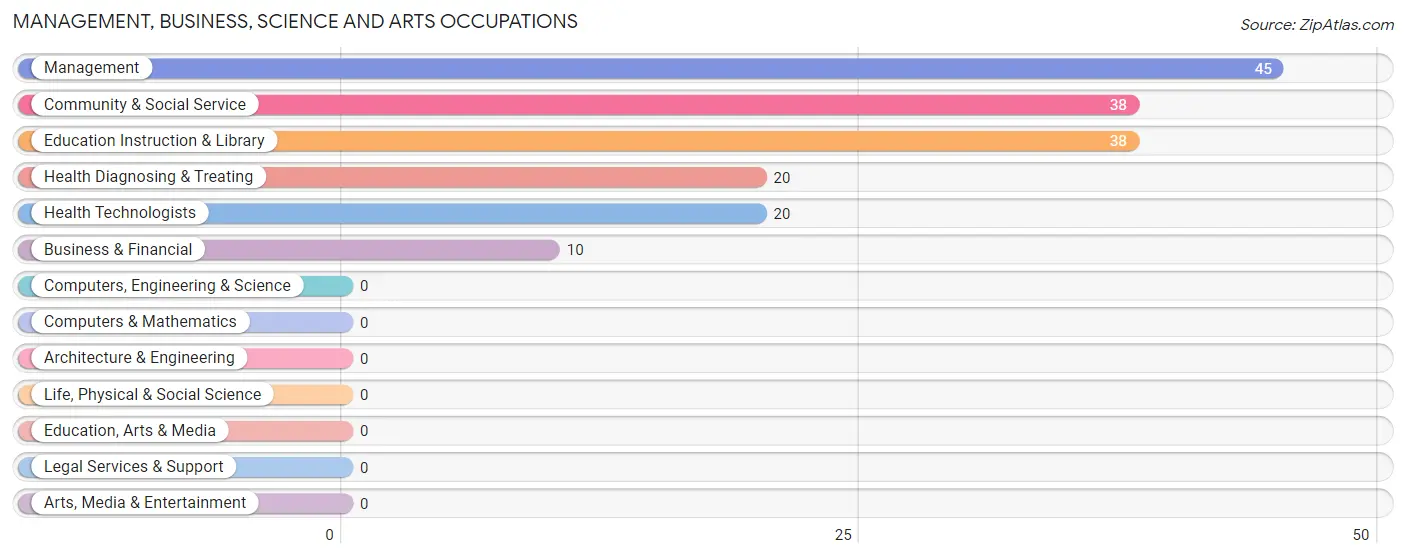
Management, Business, Science and Arts Occupations by Sex
Within the Management, Business, Science and Arts occupations in Captains Cove, the most male-oriented occupations are Management (68.9%), Community & Social Service (42.1%), and Education Instruction & Library (42.1%), while the most female-oriented occupations are Business & Financial (100.0%), Health Diagnosing & Treating (100.0%), and Health Technologists (100.0%).
| Occupation | Male | Female |
| Management | 31 (68.9%) | 14 (31.1%) |
| Business & Financial | 0 (0.0%) | 10 (100.0%) |
| Computers, Engineering & Science | 0 (0.0%) | 0 (0.0%) |
| Computers & Mathematics | 0 (0.0%) | 0 (0.0%) |
| Architecture & Engineering | 0 (0.0%) | 0 (0.0%) |
| Life, Physical & Social Science | 0 (0.0%) | 0 (0.0%) |
| Community & Social Service | 16 (42.1%) | 22 (57.9%) |
| Education, Arts & Media | 0 (0.0%) | 0 (0.0%) |
| Legal Services & Support | 0 (0.0%) | 0 (0.0%) |
| Education Instruction & Library | 16 (42.1%) | 22 (57.9%) |
| Arts, Media & Entertainment | 0 (0.0%) | 0 (0.0%) |
| Health Diagnosing & Treating | 0 (0.0%) | 20 (100.0%) |
| Health Technologists | 0 (0.0%) | 20 (100.0%) |
| Total (Category) | 47 (41.6%) | 66 (58.4%) |
| Total (Overall) | 101 (35.7%) | 182 (64.3%) |
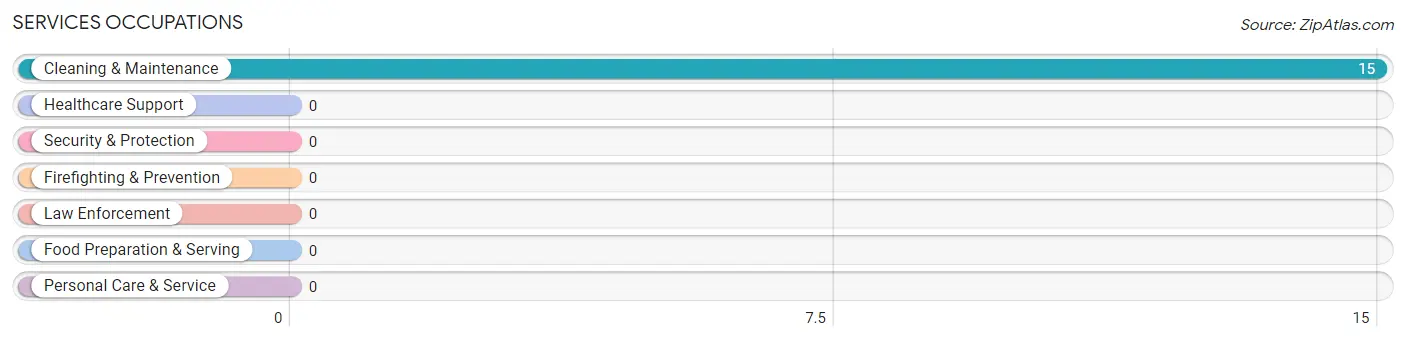
Services Occupations
The most common Services occupations in Captains Cove are , and Cleaning & Maintenance (15 | 5.3%).
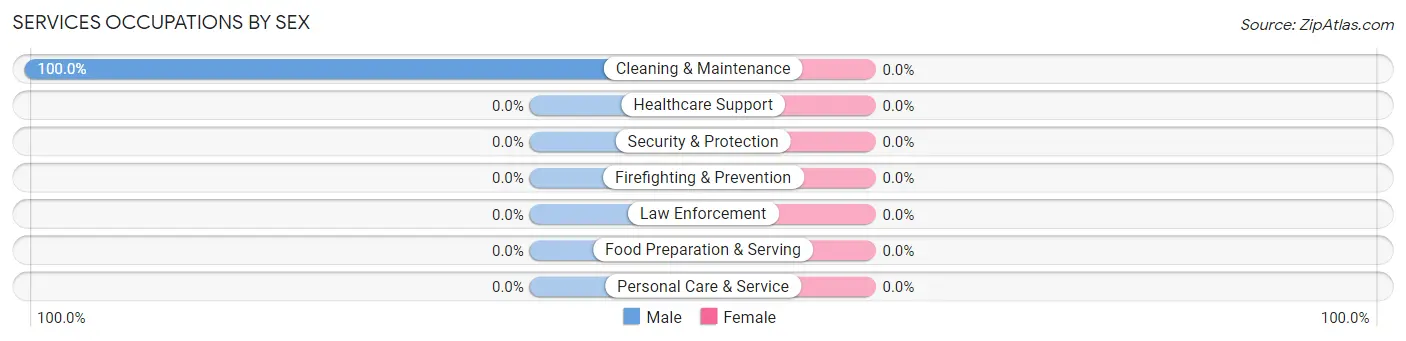
Services Occupations by Sex
| Occupation | Male | Female |
| Healthcare Support | 0 (0.0%) | 0 (0.0%) |
| Security & Protection | 0 (0.0%) | 0 (0.0%) |
| Firefighting & Prevention | 0 (0.0%) | 0 (0.0%) |
| Law Enforcement | 0 (0.0%) | 0 (0.0%) |
| Food Preparation & Serving | 0 (0.0%) | 0 (0.0%) |
| Cleaning & Maintenance | 15 (100.0%) | 0 (0.0%) |
| Personal Care & Service | 0 (0.0%) | 0 (0.0%) |
| Total (Category) | 15 (100.0%) | 0 (0.0%) |
| Total (Overall) | 101 (35.7%) | 182 (64.3%) |
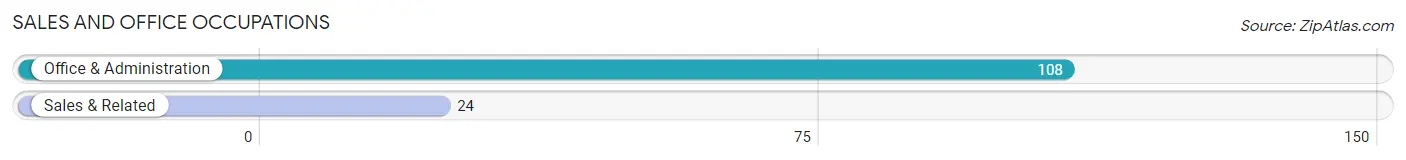
Sales and Office Occupations
The most common Sales and Office occupations in Captains Cove are Office & Administration (108 | 38.2%), and Sales & Related (24 | 8.5%).
Sales and Office Occupations by Sex
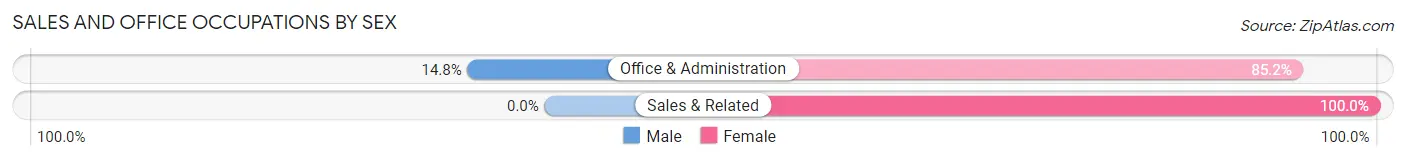
| Occupation | Male | Female |
| Sales & Related | 0 (0.0%) | 24 (100.0%) |
| Office & Administration | 16 (14.8%) | 92 (85.2%) |
| Total (Category) | 16 (12.1%) | 116 (87.9%) |
| Total (Overall) | 101 (35.7%) | 182 (64.3%) |
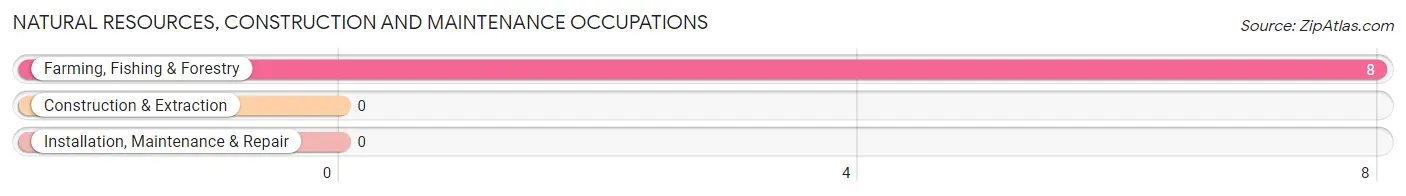
Natural Resources, Construction and Maintenance Occupations
The most common Natural Resources, Construction and Maintenance occupations in Captains Cove are , and Farming, Fishing & Forestry (8 | 2.8%).
Natural Resources, Construction and Maintenance Occupations by Sex
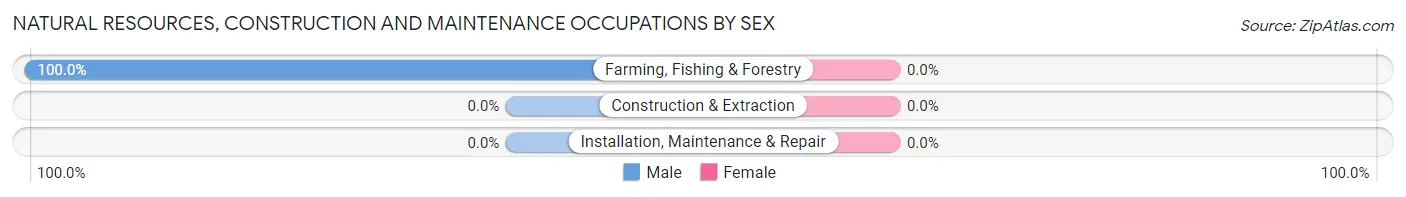
| Occupation | Male | Female |
| Farming, Fishing & Forestry | 8 (100.0%) | 0 (0.0%) |
| Construction & Extraction | 0 (0.0%) | 0 (0.0%) |
| Installation, Maintenance & Repair | 0 (0.0%) | 0 (0.0%) |
| Total (Category) | 8 (100.0%) | 0 (0.0%) |
| Total (Overall) | 101 (35.7%) | 182 (64.3%) |
Production, Transportation and Moving Occupations
The most common Production, Transportation and Moving occupations in Captains Cove are , and Material Moving (15 | 5.3%).
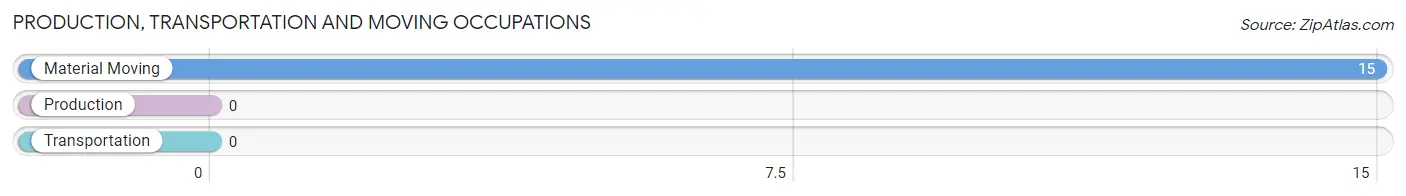
Production, Transportation and Moving Occupations by Sex
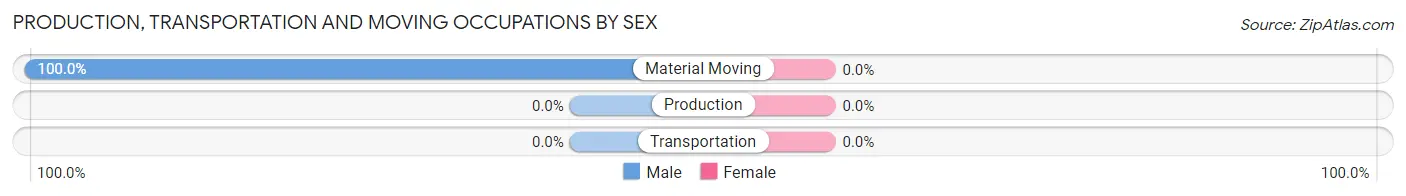
| Occupation | Male | Female |
| Production | 0 (0.0%) | 0 (0.0%) |
| Transportation | 0 (0.0%) | 0 (0.0%) |
| Material Moving | 15 (100.0%) | 0 (0.0%) |
| Total (Category) | 15 (100.0%) | 0 (0.0%) |
| Total (Overall) | 101 (35.7%) | 182 (64.3%) |
Employment Industries by Sex in Captains Cove
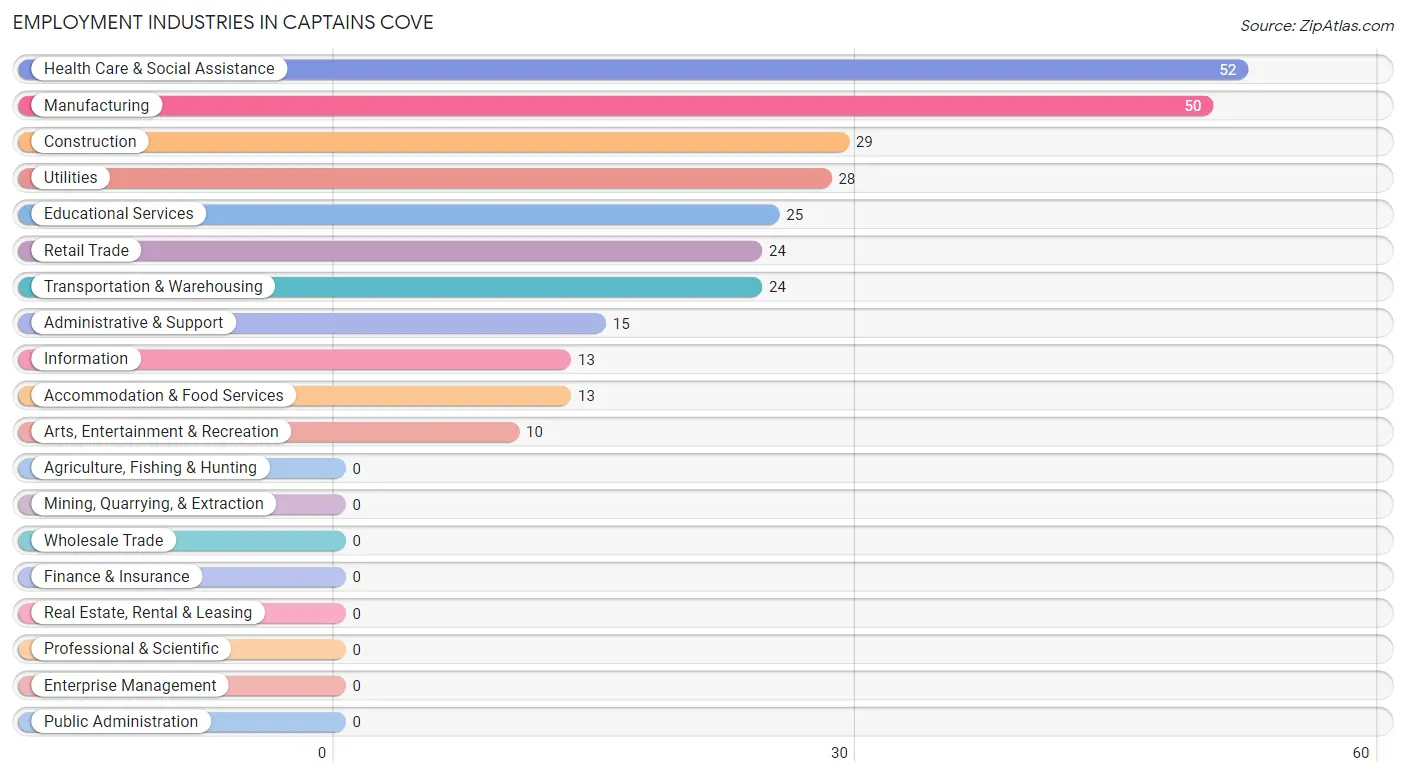
Employment Industries in Captains Cove
The major employment industries in Captains Cove include Health Care & Social Assistance (52 | 18.4%), Manufacturing (50 | 17.7%), Construction (29 | 10.2%), Utilities (28 | 9.9%), and Educational Services (25 | 8.8%).
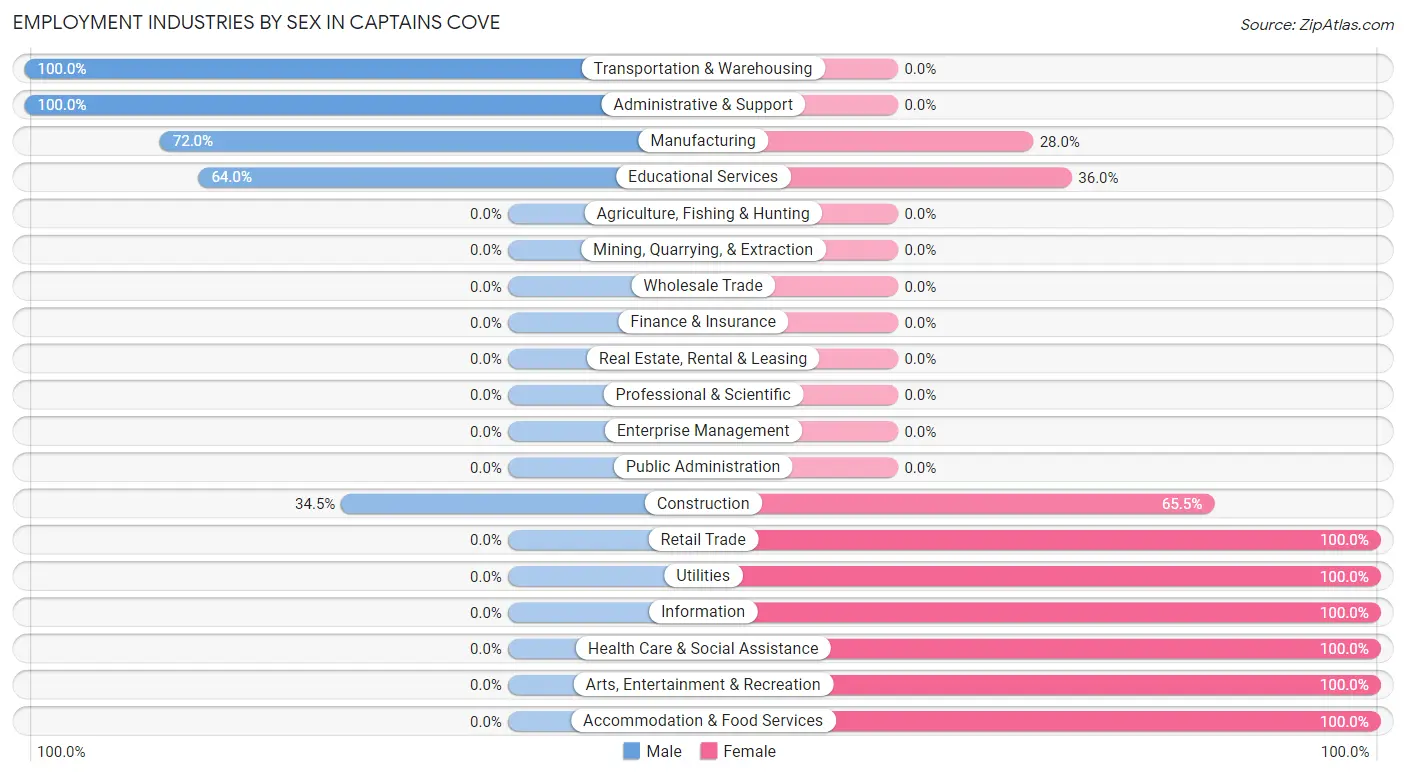
Employment Industries by Sex in Captains Cove
The Captains Cove industries that see more men than women are Transportation & Warehousing (100.0%), Administrative & Support (100.0%), and Manufacturing (72.0%), whereas the industries that tend to have a higher number of women are Retail Trade (100.0%), Utilities (100.0%), and Information (100.0%).
| Industry | Male | Female |
| Agriculture, Fishing & Hunting | 0 (0.0%) | 0 (0.0%) |
| Mining, Quarrying, & Extraction | 0 (0.0%) | 0 (0.0%) |
| Construction | 10 (34.5%) | 19 (65.5%) |
| Manufacturing | 36 (72.0%) | 14 (28.0%) |
| Wholesale Trade | 0 (0.0%) | 0 (0.0%) |
| Retail Trade | 0 (0.0%) | 24 (100.0%) |
| Transportation & Warehousing | 24 (100.0%) | 0 (0.0%) |
| Utilities | 0 (0.0%) | 28 (100.0%) |
| Information | 0 (0.0%) | 13 (100.0%) |
| Finance & Insurance | 0 (0.0%) | 0 (0.0%) |
| Real Estate, Rental & Leasing | 0 (0.0%) | 0 (0.0%) |
| Professional & Scientific | 0 (0.0%) | 0 (0.0%) |
| Enterprise Management | 0 (0.0%) | 0 (0.0%) |
| Administrative & Support | 15 (100.0%) | 0 (0.0%) |
| Educational Services | 16 (64.0%) | 9 (36.0%) |
| Health Care & Social Assistance | 0 (0.0%) | 52 (100.0%) |
| Arts, Entertainment & Recreation | 0 (0.0%) | 10 (100.0%) |
| Accommodation & Food Services | 0 (0.0%) | 13 (100.0%) |
| Public Administration | 0 (0.0%) | 0 (0.0%) |
| Total | 101 (35.7%) | 182 (64.3%) |
Education in Captains Cove
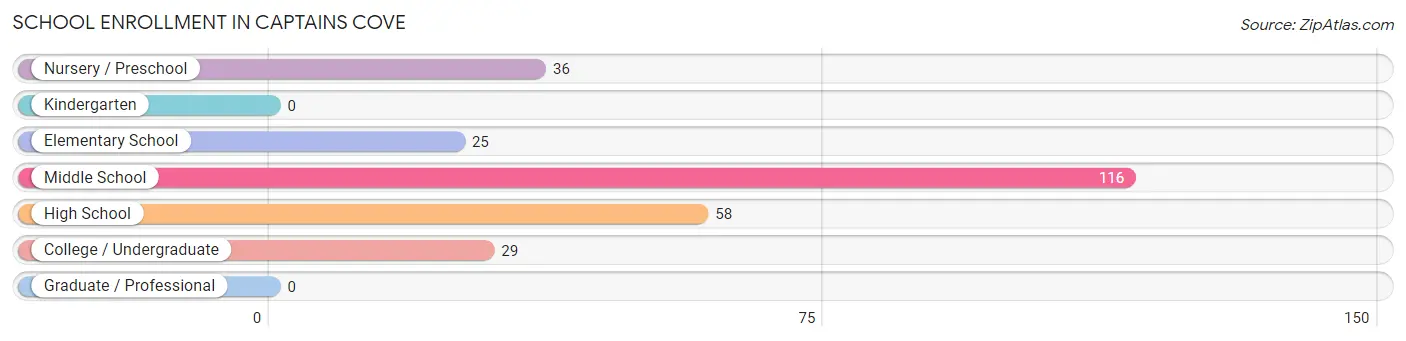
School Enrollment in Captains Cove
The most common levels of schooling among the 264 students in Captains Cove are middle school (116 | 43.9%), high school (58 | 22.0%), and nursery / preschool (36 | 13.6%).
| School Level | # Students | % Students |
| Nursery / Preschool | 36 | 13.6% |
| Kindergarten | 0 | 0.0% |
| Elementary School | 25 | 9.5% |
| Middle School | 116 | 43.9% |
| High School | 58 | 22.0% |
| College / Undergraduate | 29 | 11.0% |
| Graduate / Professional | 0 | 0.0% |
| Total | 264 | 100.0% |
School Enrollment by Age by Funding Source in Captains Cove
Out of a total of 264 students who are enrolled in schools in Captains Cove, 127 (48.1%) attend a private institution, while the remaining 137 (51.9%) are enrolled in public schools. The age group of 5 to 9 year old has the highest likelihood of being enrolled in private schools, with 25 (100.0% in the age bracket) enrolled. Conversely, the age group of 3 to 4 year olds has the lowest likelihood of being enrolled in a private school, with 36 (100.0% in the age bracket) attending a public institution.
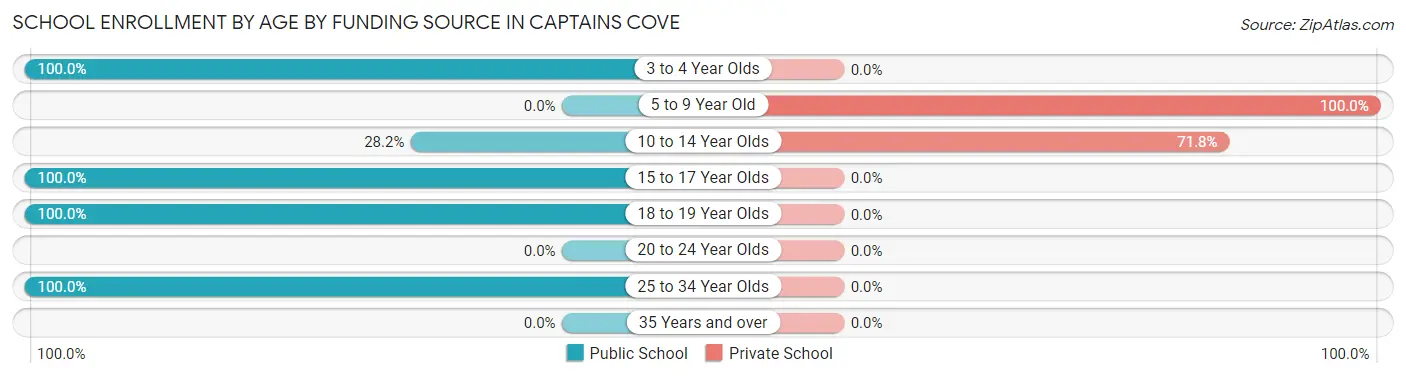
| Age Bracket | Public School | Private School |
| 3 to 4 Year Olds | 36 (100.0%) | 0 (0.0%) |
| 5 to 9 Year Old | 0 (0.0%) | 25 (100.0%) |
| 10 to 14 Year Olds | 40 (28.2%) | 102 (71.8%) |
| 15 to 17 Year Olds | 21 (100.0%) | 0 (0.0%) |
| 18 to 19 Year Olds | 11 (100.0%) | 0 (0.0%) |
| 20 to 24 Year Olds | 0 (0.0%) | 0 (0.0%) |
| 25 to 34 Year Olds | 29 (100.0%) | 0 (0.0%) |
| 35 Years and over | 0 (0.0%) | 0 (0.0%) |
| Total | 137 (51.9%) | 127 (48.1%) |
Educational Attainment by Field of Study in Captains Cove
Science & technology (64 | 19.9%), liberal arts & history (52 | 16.2%), bio, nature & agricultural (49 | 15.3%), social sciences (39 | 12.1%), and engineering (36 | 11.2%) are the most common fields of study among 321 individuals in Captains Cove who have obtained a bachelor's degree or higher.
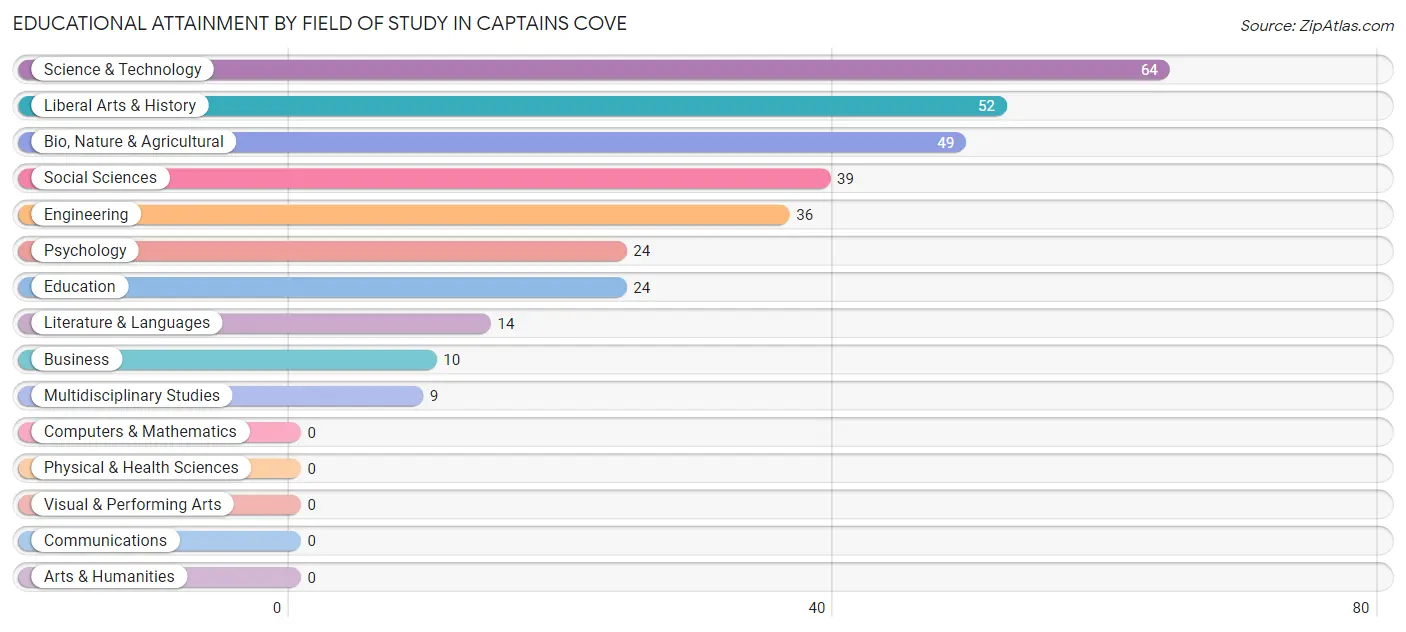
| Field of Study | # Graduates | % Graduates |
| Computers & Mathematics | 0 | 0.0% |
| Bio, Nature & Agricultural | 49 | 15.3% |
| Physical & Health Sciences | 0 | 0.0% |
| Psychology | 24 | 7.5% |
| Social Sciences | 39 | 12.1% |
| Engineering | 36 | 11.2% |
| Multidisciplinary Studies | 9 | 2.8% |
| Science & Technology | 64 | 19.9% |
| Business | 10 | 3.1% |
| Education | 24 | 7.5% |
| Literature & Languages | 14 | 4.4% |
| Liberal Arts & History | 52 | 16.2% |
| Visual & Performing Arts | 0 | 0.0% |
| Communications | 0 | 0.0% |
| Arts & Humanities | 0 | 0.0% |
| Total | 321 | 100.0% |
Transportation & Commute in Captains Cove
Vehicle Availability by Sex in Captains Cove
The most prevalent vehicle ownership categories in Captains Cove are males with 3 vehicles (52, accounting for 57.1%) and females with 3 vehicles (76, making up 28.6%).
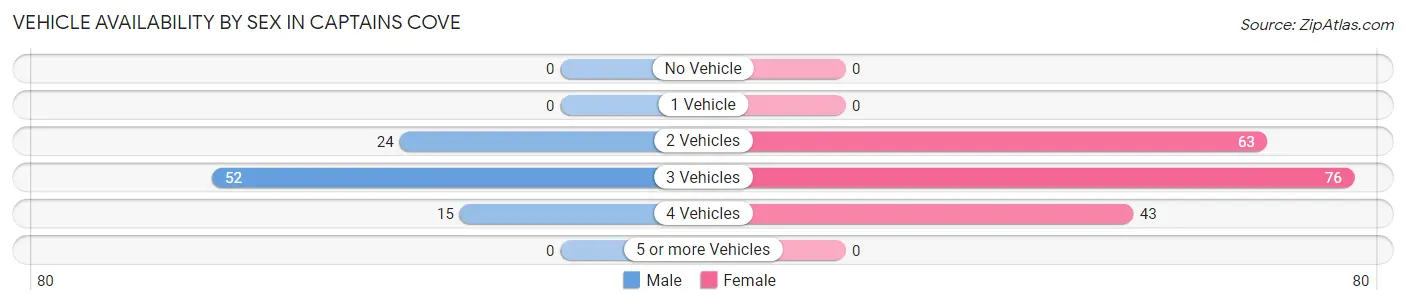
| Vehicles Available | Male | Female |
| No Vehicle | 0 (0.0%) | 0 (0.0%) |
| 1 Vehicle | 0 (0.0%) | 0 (0.0%) |
| 2 Vehicles | 24 (26.4%) | 63 (34.6%) |
| 3 Vehicles | 52 (57.1%) | 76 (41.8%) |
| 4 Vehicles | 15 (16.5%) | 43 (23.6%) |
| 5 or more Vehicles | 0 (0.0%) | 0 (0.0%) |
| Total | 91 (100.0%) | 182 (100.0%) |
Commute Time in Captains Cove
The most frequently occuring commute durations in Captains Cove are 15 to 19 minutes (74 commuters, 30.8%), 25 to 29 minutes (71 commuters, 29.6%), and 45 to 59 minutes (32 commuters, 13.3%).
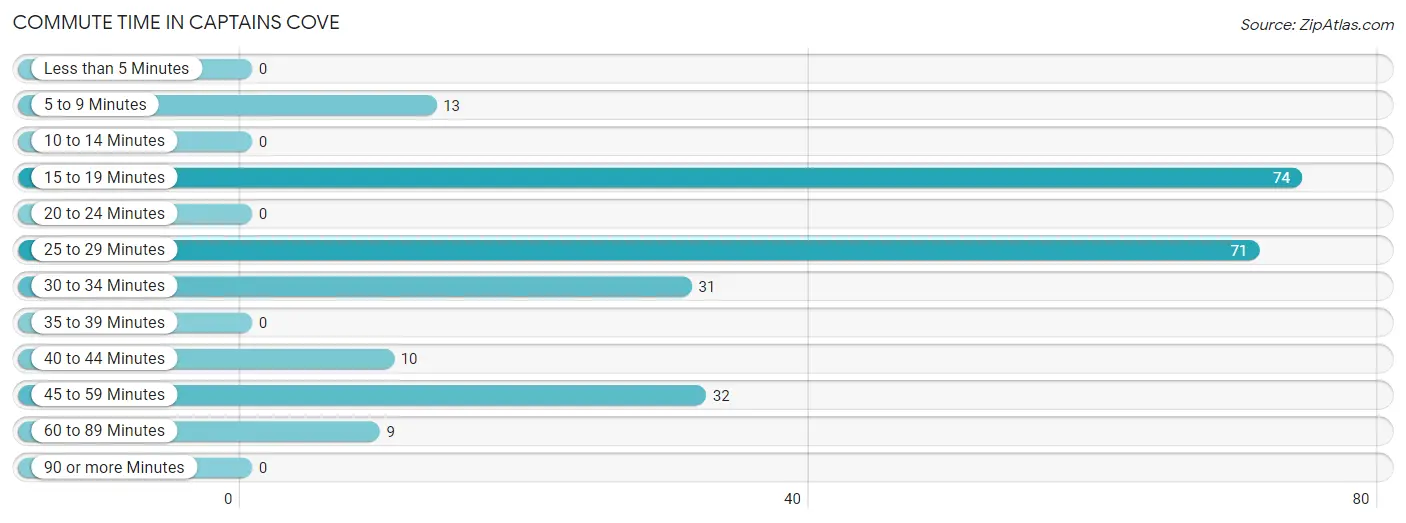
| Commute Time | # Commuters | % Commuters |
| Less than 5 Minutes | 0 | 0.0% |
| 5 to 9 Minutes | 13 | 5.4% |
| 10 to 14 Minutes | 0 | 0.0% |
| 15 to 19 Minutes | 74 | 30.8% |
| 20 to 24 Minutes | 0 | 0.0% |
| 25 to 29 Minutes | 71 | 29.6% |
| 30 to 34 Minutes | 31 | 12.9% |
| 35 to 39 Minutes | 0 | 0.0% |
| 40 to 44 Minutes | 10 | 4.2% |
| 45 to 59 Minutes | 32 | 13.3% |
| 60 to 89 Minutes | 9 | 3.7% |
| 90 or more Minutes | 0 | 0.0% |
Commute Time by Sex in Captains Cove
The most common commute times in Captains Cove are 15 to 19 minutes (60 commuters, 65.9%) for males and 25 to 29 minutes (71 commuters, 47.6%) for females.
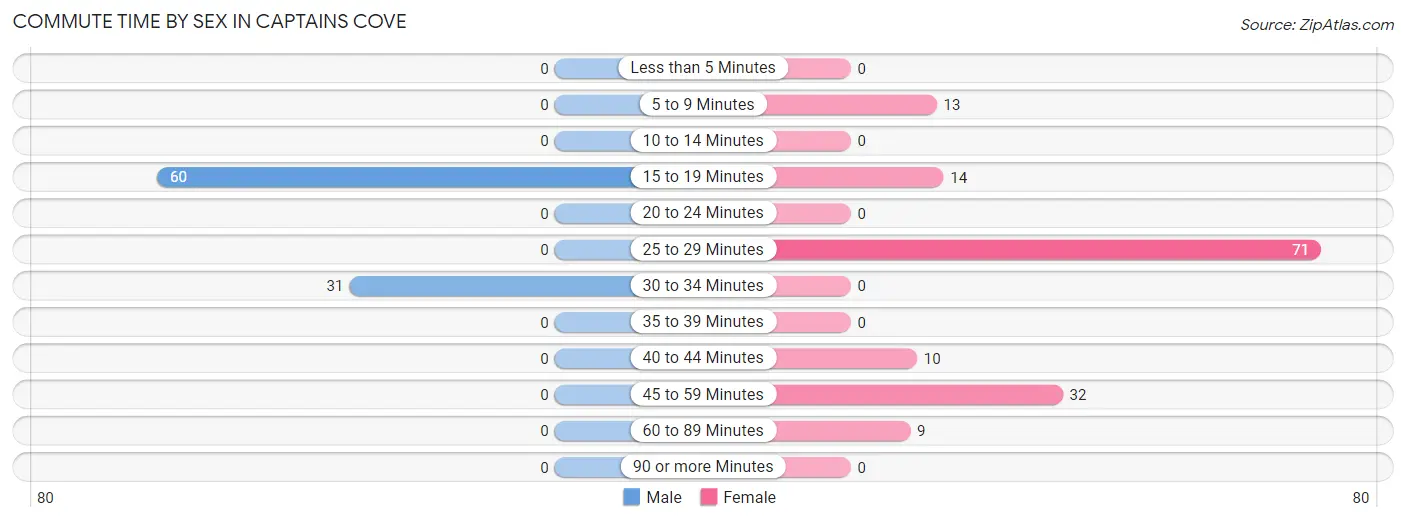
| Commute Time | Male | Female |
| Less than 5 Minutes | 0 (0.0%) | 0 (0.0%) |
| 5 to 9 Minutes | 0 (0.0%) | 13 (8.7%) |
| 10 to 14 Minutes | 0 (0.0%) | 0 (0.0%) |
| 15 to 19 Minutes | 60 (65.9%) | 14 (9.4%) |
| 20 to 24 Minutes | 0 (0.0%) | 0 (0.0%) |
| 25 to 29 Minutes | 0 (0.0%) | 71 (47.6%) |
| 30 to 34 Minutes | 31 (34.1%) | 0 (0.0%) |
| 35 to 39 Minutes | 0 (0.0%) | 0 (0.0%) |
| 40 to 44 Minutes | 0 (0.0%) | 10 (6.7%) |
| 45 to 59 Minutes | 0 (0.0%) | 32 (21.5%) |
| 60 to 89 Minutes | 0 (0.0%) | 9 (6.0%) |
| 90 or more Minutes | 0 (0.0%) | 0 (0.0%) |
Time of Departure to Work by Sex in Captains Cove
The most frequent times of departure to work in Captains Cove are 7:30 AM to 7:59 AM (36, 39.6%) for males and 6:30 AM to 6:59 AM (60, 40.3%) for females.
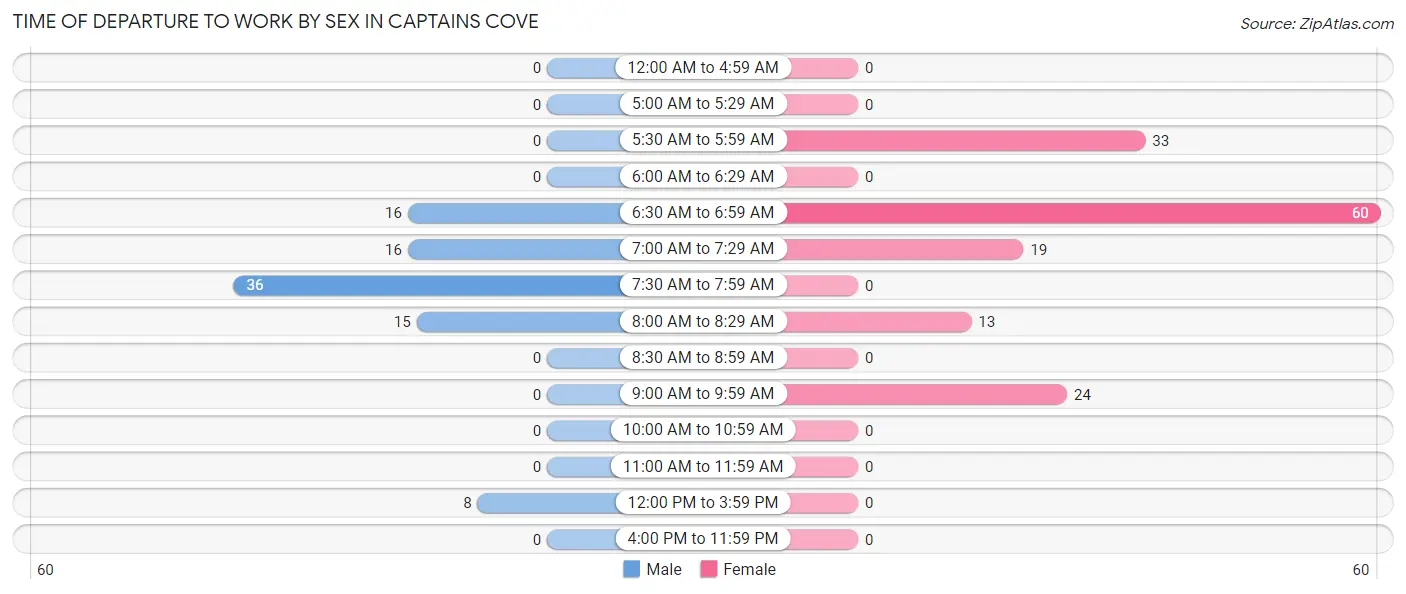
| Time of Departure | Male | Female |
| 12:00 AM to 4:59 AM | 0 (0.0%) | 0 (0.0%) |
| 5:00 AM to 5:29 AM | 0 (0.0%) | 0 (0.0%) |
| 5:30 AM to 5:59 AM | 0 (0.0%) | 33 (22.2%) |
| 6:00 AM to 6:29 AM | 0 (0.0%) | 0 (0.0%) |
| 6:30 AM to 6:59 AM | 16 (17.6%) | 60 (40.3%) |
| 7:00 AM to 7:29 AM | 16 (17.6%) | 19 (12.8%) |
| 7:30 AM to 7:59 AM | 36 (39.6%) | 0 (0.0%) |
| 8:00 AM to 8:29 AM | 15 (16.5%) | 13 (8.7%) |
| 8:30 AM to 8:59 AM | 0 (0.0%) | 0 (0.0%) |
| 9:00 AM to 9:59 AM | 0 (0.0%) | 24 (16.1%) |
| 10:00 AM to 10:59 AM | 0 (0.0%) | 0 (0.0%) |
| 11:00 AM to 11:59 AM | 0 (0.0%) | 0 (0.0%) |
| 12:00 PM to 3:59 PM | 8 (8.8%) | 0 (0.0%) |
| 4:00 PM to 11:59 PM | 0 (0.0%) | 0 (0.0%) |
| Total | 91 (100.0%) | 149 (100.0%) |
Housing Occupancy in Captains Cove
Occupancy by Ownership in Captains Cove
Of the total 459 dwellings in Captains Cove, owner-occupied units account for 429 (93.5%), while renter-occupied units make up 30 (6.5%).
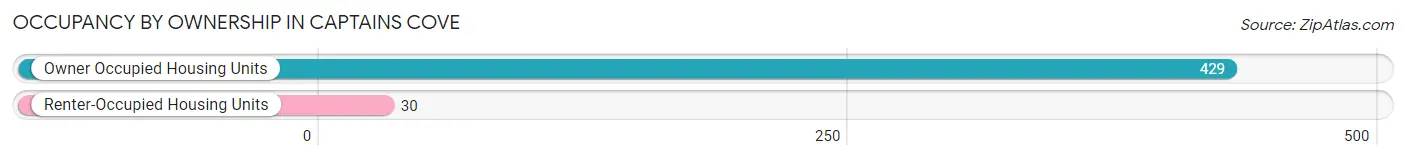
| Occupancy | # Housing Units | % Housing Units |
| Owner Occupied Housing Units | 429 | 93.5% |
| Renter-Occupied Housing Units | 30 | 6.5% |
| Total Occupied Housing Units | 459 | 100.0% |
Occupancy by Household Size in Captains Cove
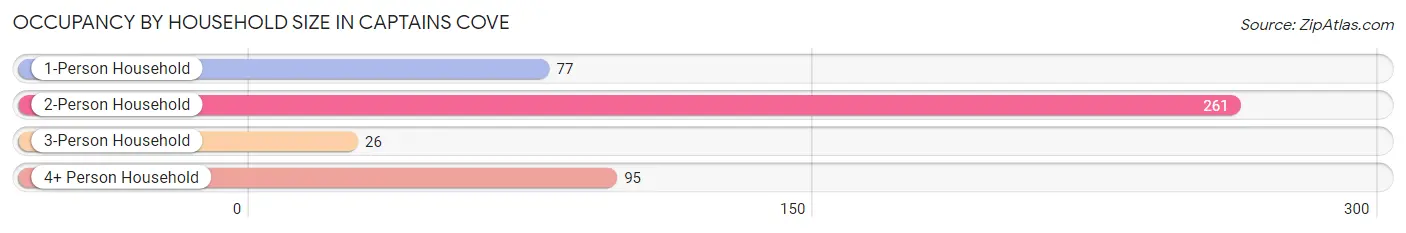
| Household Size | # Housing Units | % Housing Units |
| 1-Person Household | 77 | 16.8% |
| 2-Person Household | 261 | 56.9% |
| 3-Person Household | 26 | 5.7% |
| 4+ Person Household | 95 | 20.7% |
| Total Housing Units | 459 | 100.0% |
Occupancy by Ownership by Household Size in Captains Cove
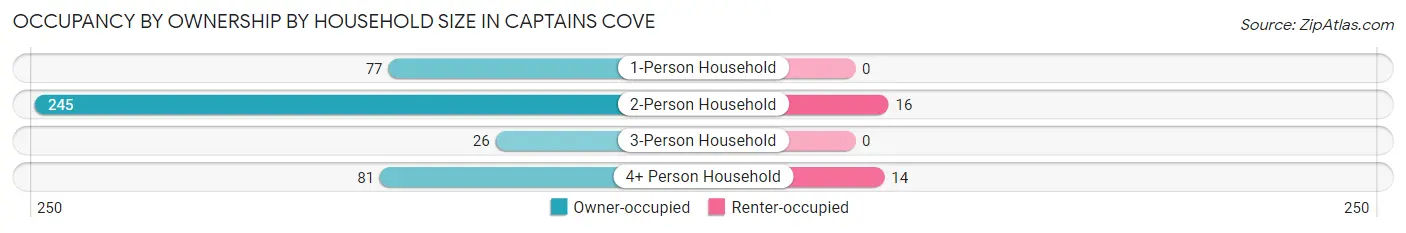
| Household Size | Owner-occupied | Renter-occupied |
| 1-Person Household | 77 (100.0%) | 0 (0.0%) |
| 2-Person Household | 245 (93.9%) | 16 (6.1%) |
| 3-Person Household | 26 (100.0%) | 0 (0.0%) |
| 4+ Person Household | 81 (85.3%) | 14 (14.7%) |
| Total Housing Units | 429 (93.5%) | 30 (6.5%) |
Occupancy by Educational Attainment in Captains Cove
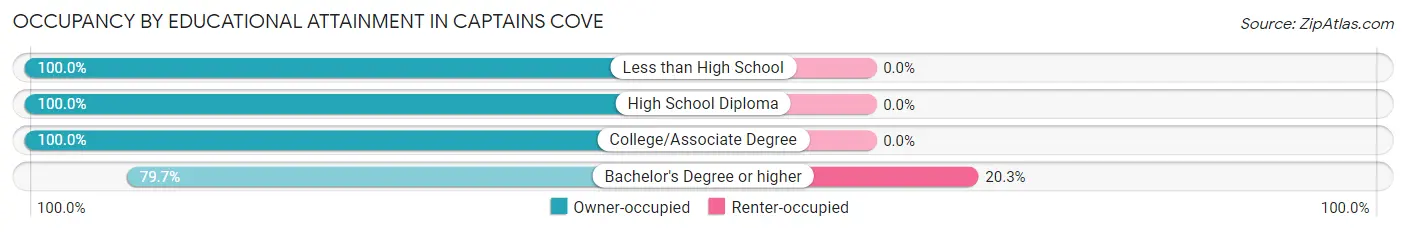
| Household Size | Owner-occupied | Renter-occupied |
| Less than High School | 32 (100.0%) | 0 (0.0%) |
| High School Diploma | 68 (100.0%) | 0 (0.0%) |
| College/Associate Degree | 211 (100.0%) | 0 (0.0%) |
| Bachelor's Degree or higher | 118 (79.7%) | 30 (20.3%) |
Occupancy by Age of Householder in Captains Cove
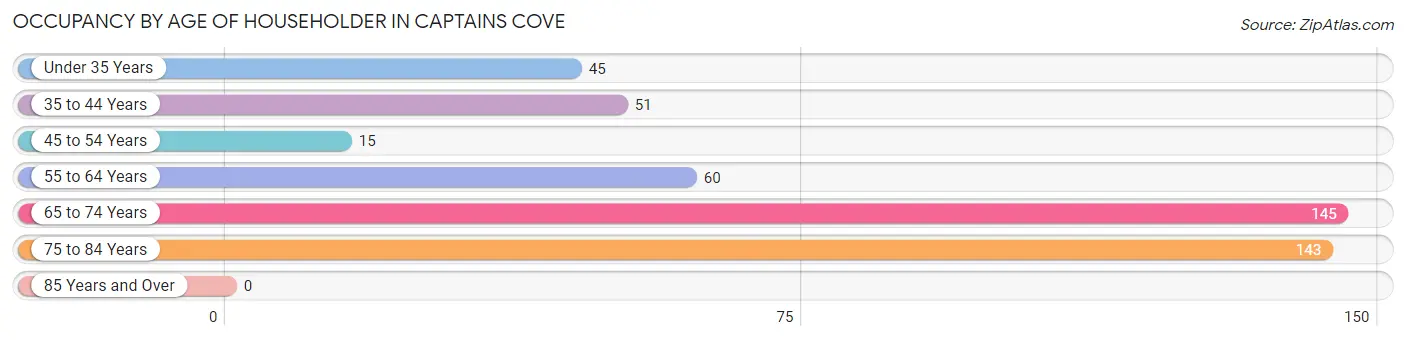
| Age Bracket | # Households | % Households |
| Under 35 Years | 45 | 9.8% |
| 35 to 44 Years | 51 | 11.1% |
| 45 to 54 Years | 15 | 3.3% |
| 55 to 64 Years | 60 | 13.1% |
| 65 to 74 Years | 145 | 31.6% |
| 75 to 84 Years | 143 | 31.1% |
| 85 Years and Over | 0 | 0.0% |
| Total | 459 | 100.0% |
Housing Finances in Captains Cove
Median Income by Occupancy in Captains Cove
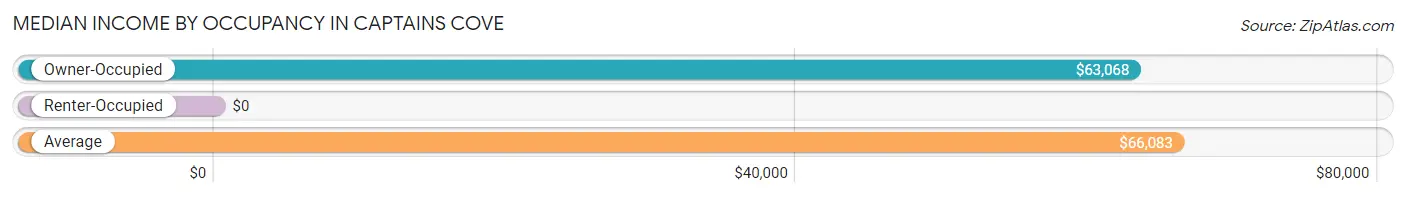
| Occupancy Type | # Households | Median Income |
| Owner-Occupied | 429 (93.5%) | $63,068 |
| Renter-Occupied | 30 (6.5%) | $0 |
| Average | 459 (100.0%) | $66,083 |
Occupancy by Householder Income Bracket in Captains Cove
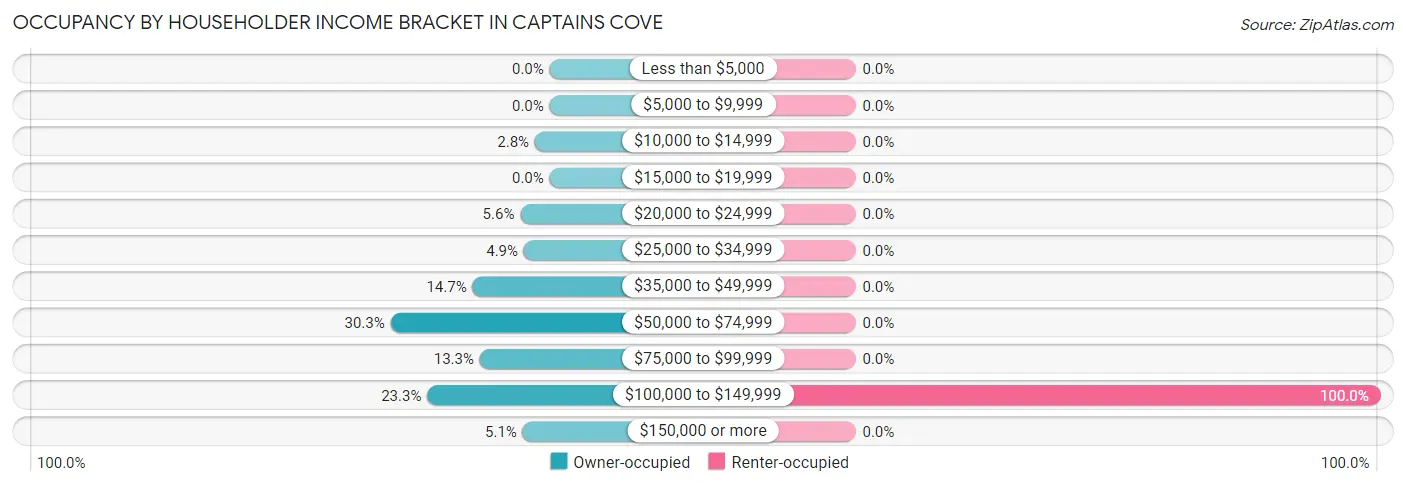
| Income Bracket | Owner-occupied | Renter-occupied |
| Less than $5,000 | 0 (0.0%) | 0 (0.0%) |
| $5,000 to $9,999 | 0 (0.0%) | 0 (0.0%) |
| $10,000 to $14,999 | 12 (2.8%) | 0 (0.0%) |
| $15,000 to $19,999 | 0 (0.0%) | 0 (0.0%) |
| $20,000 to $24,999 | 24 (5.6%) | 0 (0.0%) |
| $25,000 to $34,999 | 21 (4.9%) | 0 (0.0%) |
| $35,000 to $49,999 | 63 (14.7%) | 0 (0.0%) |
| $50,000 to $74,999 | 130 (30.3%) | 0 (0.0%) |
| $75,000 to $99,999 | 57 (13.3%) | 0 (0.0%) |
| $100,000 to $149,999 | 100 (23.3%) | 30 (100.0%) |
| $150,000 or more | 22 (5.1%) | 0 (0.0%) |
| Total | 429 (100.0%) | 30 (100.0%) |
Monthly Housing Cost Tiers in Captains Cove
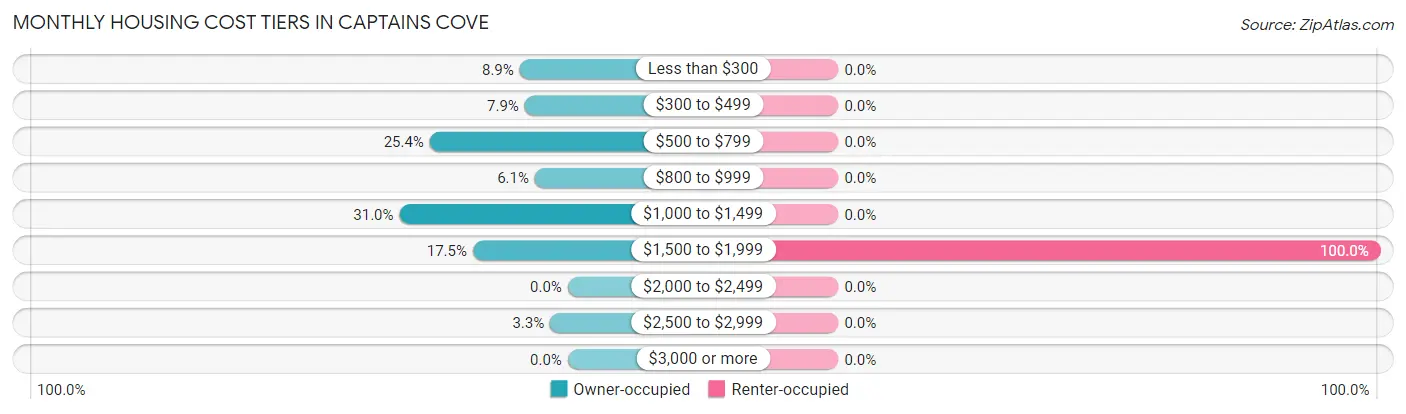
| Monthly Cost | Owner-occupied | Renter-occupied |
| Less than $300 | 38 (8.9%) | 0 (0.0%) |
| $300 to $499 | 34 (7.9%) | 0 (0.0%) |
| $500 to $799 | 109 (25.4%) | 0 (0.0%) |
| $800 to $999 | 26 (6.1%) | 0 (0.0%) |
| $1,000 to $1,499 | 133 (31.0%) | 0 (0.0%) |
| $1,500 to $1,999 | 75 (17.5%) | 30 (100.0%) |
| $2,000 to $2,499 | 0 (0.0%) | 0 (0.0%) |
| $2,500 to $2,999 | 14 (3.3%) | 0 (0.0%) |
| $3,000 or more | 0 (0.0%) | 0 (0.0%) |
| Total | 429 (100.0%) | 30 (100.0%) |
Physical Housing Characteristics in Captains Cove
Housing Structures in Captains Cove
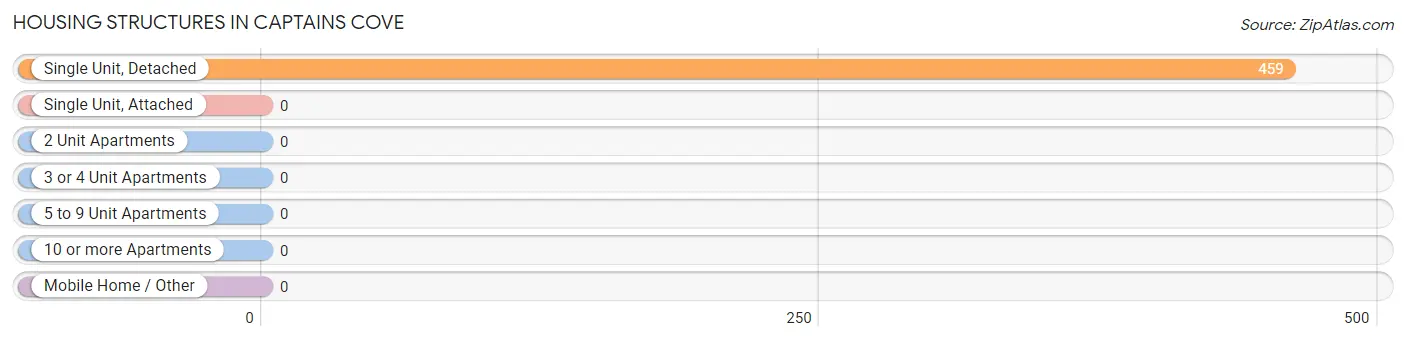
| Structure Type | # Housing Units | % Housing Units |
| Single Unit, Detached | 459 | 100.0% |
| Single Unit, Attached | 0 | 0.0% |
| 2 Unit Apartments | 0 | 0.0% |
| 3 or 4 Unit Apartments | 0 | 0.0% |
| 5 to 9 Unit Apartments | 0 | 0.0% |
| 10 or more Apartments | 0 | 0.0% |
| Mobile Home / Other | 0 | 0.0% |
| Total | 459 | 100.0% |
Housing Structures by Occupancy in Captains Cove
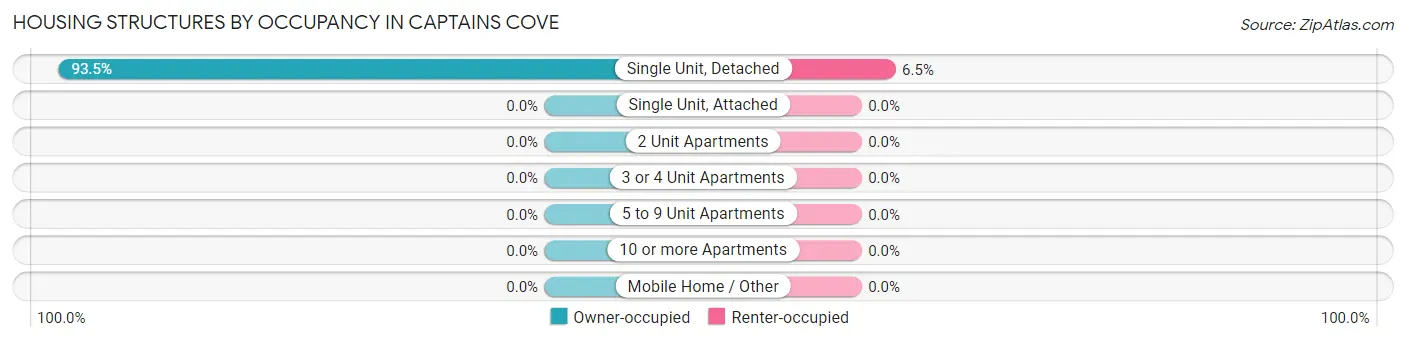
| Structure Type | Owner-occupied | Renter-occupied |
| Single Unit, Detached | 429 (93.5%) | 30 (6.5%) |
| Single Unit, Attached | 0 (0.0%) | 0 (0.0%) |
| 2 Unit Apartments | 0 (0.0%) | 0 (0.0%) |
| 3 or 4 Unit Apartments | 0 (0.0%) | 0 (0.0%) |
| 5 to 9 Unit Apartments | 0 (0.0%) | 0 (0.0%) |
| 10 or more Apartments | 0 (0.0%) | 0 (0.0%) |
| Mobile Home / Other | 0 (0.0%) | 0 (0.0%) |
| Total | 429 (93.5%) | 30 (6.5%) |
Housing Structures by Number of Rooms in Captains Cove
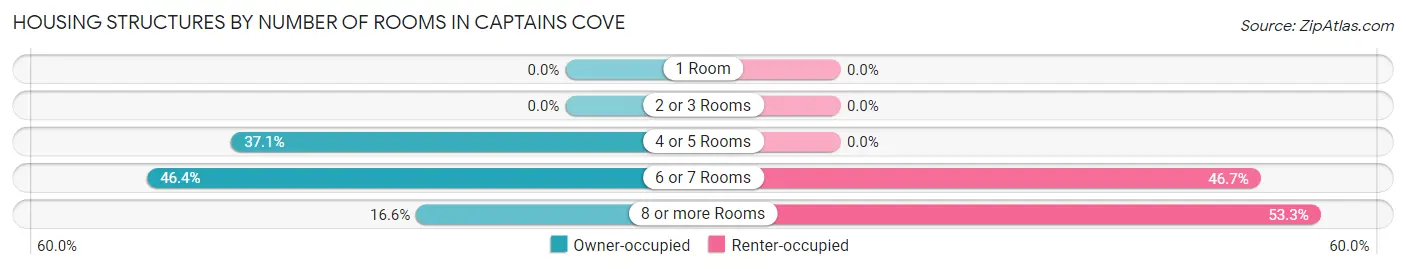
| Number of Rooms | Owner-occupied | Renter-occupied |
| 1 Room | 0 (0.0%) | 0 (0.0%) |
| 2 or 3 Rooms | 0 (0.0%) | 0 (0.0%) |
| 4 or 5 Rooms | 159 (37.1%) | 0 (0.0%) |
| 6 or 7 Rooms | 199 (46.4%) | 14 (46.7%) |
| 8 or more Rooms | 71 (16.6%) | 16 (53.3%) |
| Total | 429 (100.0%) | 30 (100.0%) |
Housing Structure by Heating Type in Captains Cove
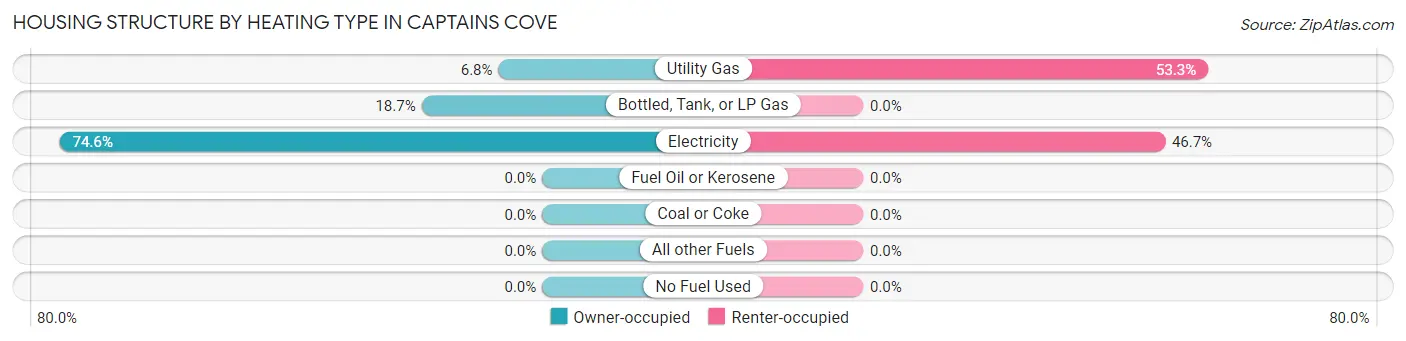
| Heating Type | Owner-occupied | Renter-occupied |
| Utility Gas | 29 (6.8%) | 16 (53.3%) |
| Bottled, Tank, or LP Gas | 80 (18.6%) | 0 (0.0%) |
| Electricity | 320 (74.6%) | 14 (46.7%) |
| Fuel Oil or Kerosene | 0 (0.0%) | 0 (0.0%) |
| Coal or Coke | 0 (0.0%) | 0 (0.0%) |
| All other Fuels | 0 (0.0%) | 0 (0.0%) |
| No Fuel Used | 0 (0.0%) | 0 (0.0%) |
| Total | 429 (100.0%) | 30 (100.0%) |
Household Vehicle Usage in Captains Cove
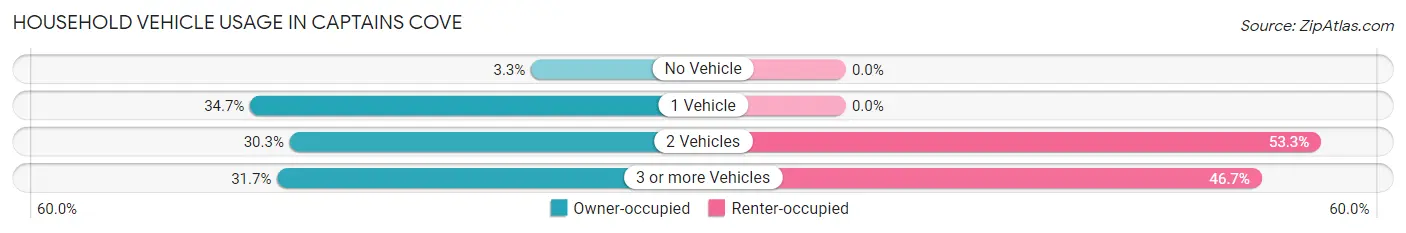
| Vehicles per Household | Owner-occupied | Renter-occupied |
| No Vehicle | 14 (3.3%) | 0 (0.0%) |
| 1 Vehicle | 149 (34.7%) | 0 (0.0%) |
| 2 Vehicles | 130 (30.3%) | 16 (53.3%) |
| 3 or more Vehicles | 136 (31.7%) | 14 (46.7%) |
| Total | 429 (100.0%) | 30 (100.0%) |
Real Estate & Mortgages in Captains Cove
Real Estate and Mortgage Overview in Captains Cove
| Characteristic | Without Mortgage | With Mortgage |
| Housing Units | 134 | 295 |
| Median Property Value | $231,300 | $203,500 |
| Median Household Income | $65,667 | $14 |
| Monthly Housing Costs | $450 | $0 |
| Real Estate Taxes | $1,136 | $0 |
Property Value by Mortgage Status in Captains Cove
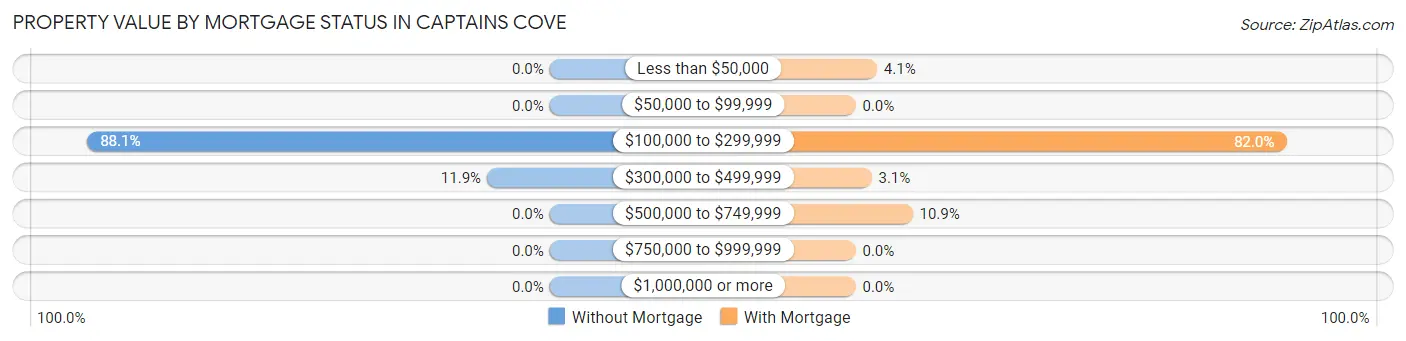
| Property Value | Without Mortgage | With Mortgage |
| Less than $50,000 | 0 (0.0%) | 12 (4.1%) |
| $50,000 to $99,999 | 0 (0.0%) | 0 (0.0%) |
| $100,000 to $299,999 | 118 (88.1%) | 242 (82.0%) |
| $300,000 to $499,999 | 16 (11.9%) | 9 (3.0%) |
| $500,000 to $749,999 | 0 (0.0%) | 32 (10.8%) |
| $750,000 to $999,999 | 0 (0.0%) | 0 (0.0%) |
| $1,000,000 or more | 0 (0.0%) | 0 (0.0%) |
| Total | 134 (100.0%) | 295 (100.0%) |
Household Income by Mortgage Status in Captains Cove
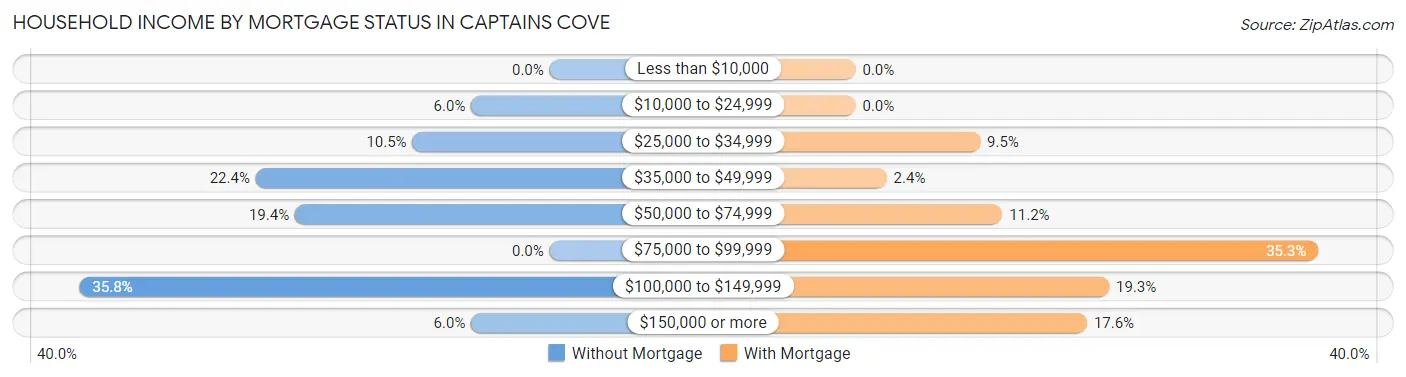
| Household Income | Without Mortgage | With Mortgage |
| Less than $10,000 | 0 (0.0%) | 0 (0.0%) |
| $10,000 to $24,999 | 8 (6.0%) | 0 (0.0%) |
| $25,000 to $34,999 | 14 (10.4%) | 28 (9.5%) |
| $35,000 to $49,999 | 30 (22.4%) | 7 (2.4%) |
| $50,000 to $74,999 | 26 (19.4%) | 33 (11.2%) |
| $75,000 to $99,999 | 0 (0.0%) | 104 (35.2%) |
| $100,000 to $149,999 | 48 (35.8%) | 57 (19.3%) |
| $150,000 or more | 8 (6.0%) | 52 (17.6%) |
| Total | 134 (100.0%) | 295 (100.0%) |
Property Value to Household Income Ratio in Captains Cove
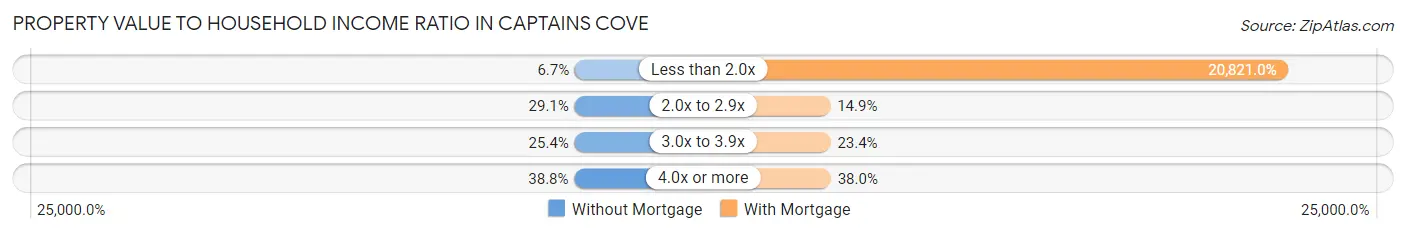
| Value-to-Income Ratio | Without Mortgage | With Mortgage |
| Less than 2.0x | 9 (6.7%) | 61,422 (20,821.0%) |
| 2.0x to 2.9x | 39 (29.1%) | 44 (14.9%) |
| 3.0x to 3.9x | 34 (25.4%) | 69 (23.4%) |
| 4.0x or more | 52 (38.8%) | 112 (38.0%) |
| Total | 134 (100.0%) | 295 (100.0%) |
Real Estate Taxes by Mortgage Status in Captains Cove
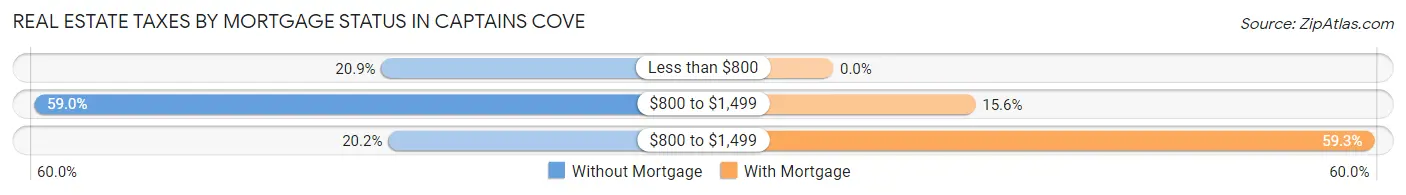
| Property Taxes | Without Mortgage | With Mortgage |
| Less than $800 | 28 (20.9%) | 0 (0.0%) |
| $800 to $1,499 | 79 (59.0%) | 46 (15.6%) |
| $800 to $1,499 | 27 (20.2%) | 175 (59.3%) |
| Total | 134 (100.0%) | 295 (100.0%) |
Health & Disability in Captains Cove
Health Insurance Coverage by Age in Captains Cove
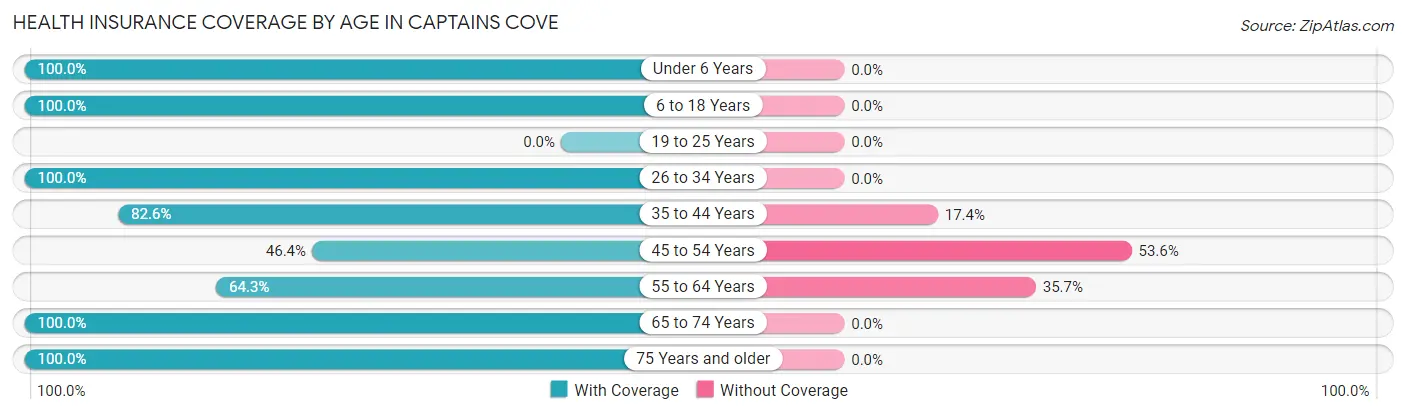
| Age Bracket | With Coverage | Without Coverage |
| Under 6 Years | 83 (100.0%) | 0 (0.0%) |
| 6 to 18 Years | 199 (100.0%) | 0 (0.0%) |
| 19 to 25 Years | 0 (0.0%) | 0 (0.0%) |
| 26 to 34 Years | 117 (100.0%) | 0 (0.0%) |
| 35 to 44 Years | 90 (82.6%) | 19 (17.4%) |
| 45 to 54 Years | 13 (46.4%) | 15 (53.6%) |
| 55 to 64 Years | 81 (64.3%) | 45 (35.7%) |
| 65 to 74 Years | 286 (100.0%) | 0 (0.0%) |
| 75 Years and older | 226 (100.0%) | 0 (0.0%) |
| Total | 1,095 (93.3%) | 79 (6.7%) |
Health Insurance Coverage by Citizenship Status in Captains Cove
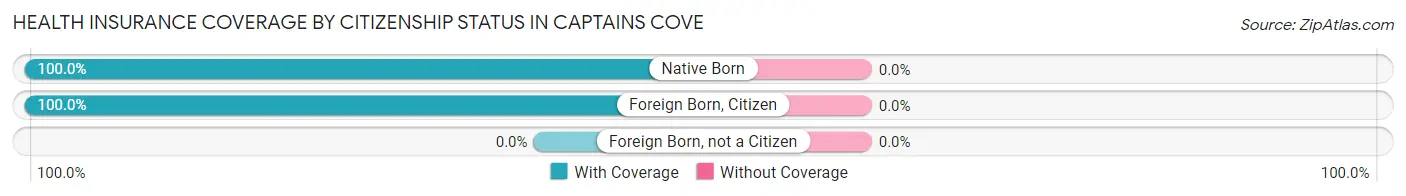
| Citizenship Status | With Coverage | Without Coverage |
| Native Born | 83 (100.0%) | 0 (0.0%) |
| Foreign Born, Citizen | 199 (100.0%) | 0 (0.0%) |
| Foreign Born, not a Citizen | 0 (0.0%) | 0 (0.0%) |
Health Insurance Coverage by Household Income in Captains Cove
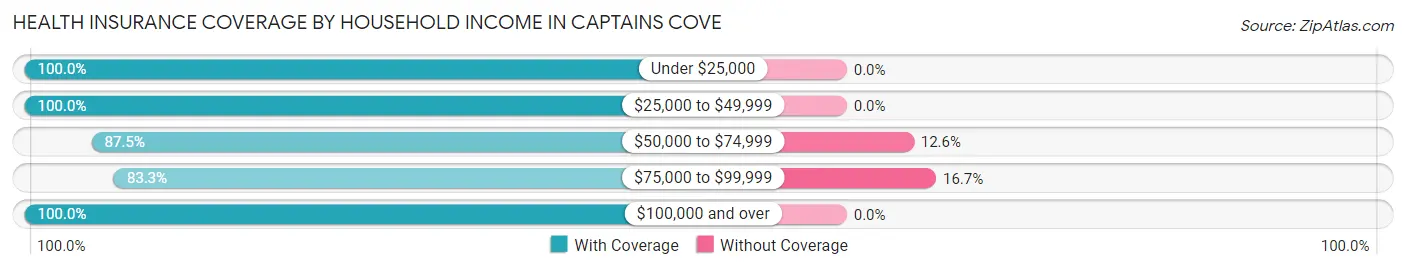
| Household Income | With Coverage | Without Coverage |
| Under $25,000 | 78 (100.0%) | 0 (0.0%) |
| $25,000 to $49,999 | 123 (100.0%) | 0 (0.0%) |
| $50,000 to $74,999 | 230 (87.5%) | 33 (12.6%) |
| $75,000 to $99,999 | 229 (83.3%) | 46 (16.7%) |
| $100,000 and over | 435 (100.0%) | 0 (0.0%) |
Public vs Private Health Insurance Coverage by Age in Captains Cove
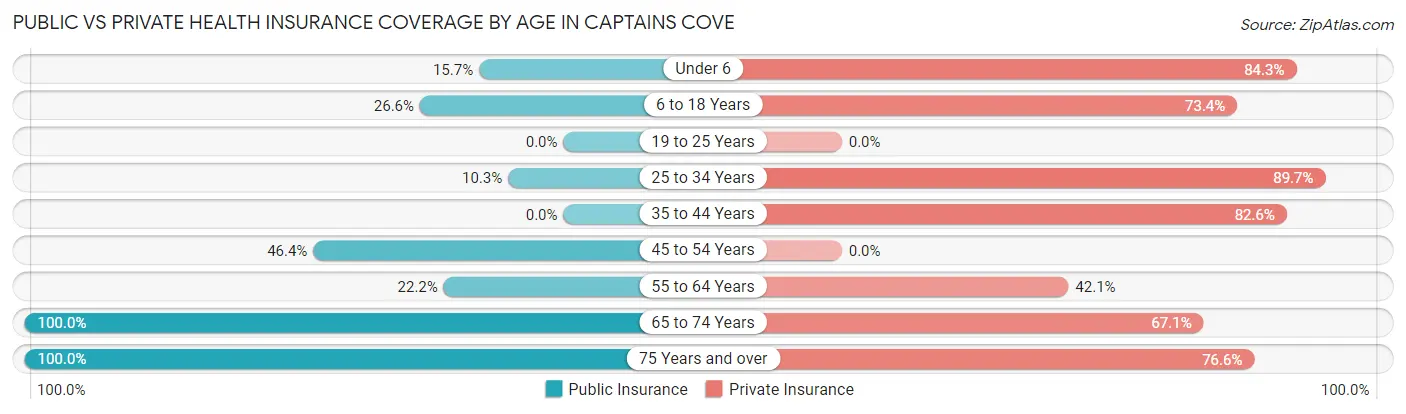
| Age Bracket | Public Insurance | Private Insurance |
| Under 6 | 13 (15.7%) | 70 (84.3%) |
| 6 to 18 Years | 53 (26.6%) | 146 (73.4%) |
| 19 to 25 Years | 0 (0.0%) | 0 (0.0%) |
| 25 to 34 Years | 12 (10.3%) | 105 (89.7%) |
| 35 to 44 Years | 0 (0.0%) | 90 (82.6%) |
| 45 to 54 Years | 13 (46.4%) | 0 (0.0%) |
| 55 to 64 Years | 28 (22.2%) | 53 (42.1%) |
| 65 to 74 Years | 286 (100.0%) | 192 (67.1%) |
| 75 Years and over | 226 (100.0%) | 173 (76.5%) |
| Total | 631 (53.7%) | 829 (70.6%) |
Disability Status by Sex by Age in Captains Cove
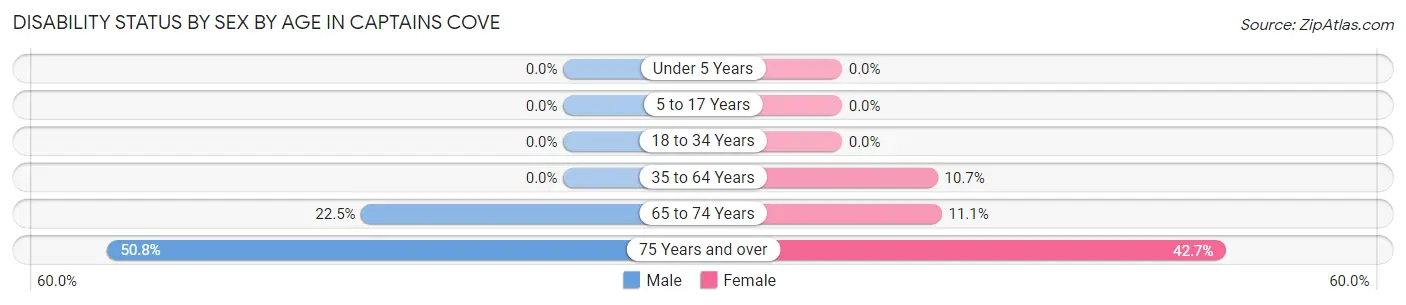
| Age Bracket | Male | Female |
| Under 5 Years | 0 (0.0%) | 0 (0.0%) |
| 5 to 17 Years | 0 (0.0%) | 0 (0.0%) |
| 18 to 34 Years | 0 (0.0%) | 0 (0.0%) |
| 35 to 64 Years | 0 (0.0%) | 19 (10.7%) |
| 65 to 74 Years | 38 (22.5%) | 13 (11.1%) |
| 75 Years and over | 66 (50.8%) | 41 (42.7%) |
Disability Class by Sex by Age in Captains Cove
Disability Class: Hearing Difficulty
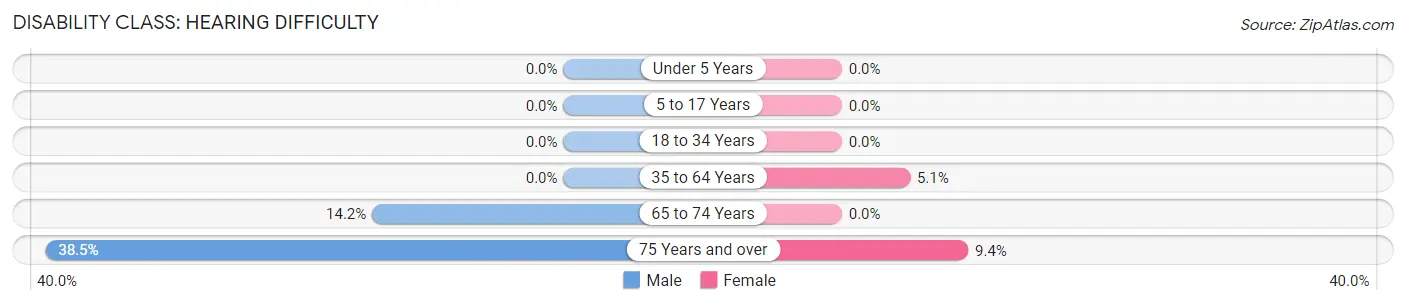
| Age Bracket | Male | Female |
| Under 5 Years | 0 (0.0%) | 0 (0.0%) |
| 5 to 17 Years | 0 (0.0%) | 0 (0.0%) |
| 18 to 34 Years | 0 (0.0%) | 0 (0.0%) |
| 35 to 64 Years | 0 (0.0%) | 9 (5.1%) |
| 65 to 74 Years | 24 (14.2%) | 0 (0.0%) |
| 75 Years and over | 50 (38.5%) | 9 (9.4%) |
Disability Class: Vision Difficulty
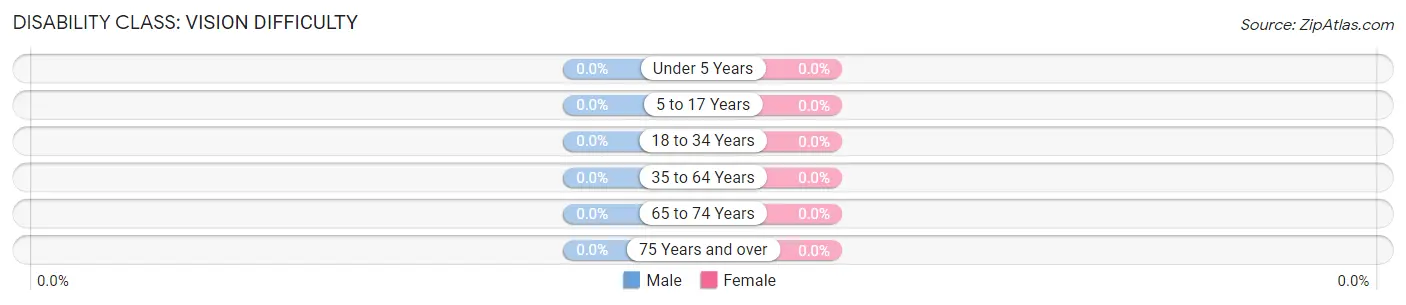
| Age Bracket | Male | Female |
| Under 5 Years | 0 (0.0%) | 0 (0.0%) |
| 5 to 17 Years | 0 (0.0%) | 0 (0.0%) |
| 18 to 34 Years | 0 (0.0%) | 0 (0.0%) |
| 35 to 64 Years | 0 (0.0%) | 0 (0.0%) |
| 65 to 74 Years | 0 (0.0%) | 0 (0.0%) |
| 75 Years and over | 0 (0.0%) | 0 (0.0%) |
Disability Class: Cognitive Difficulty
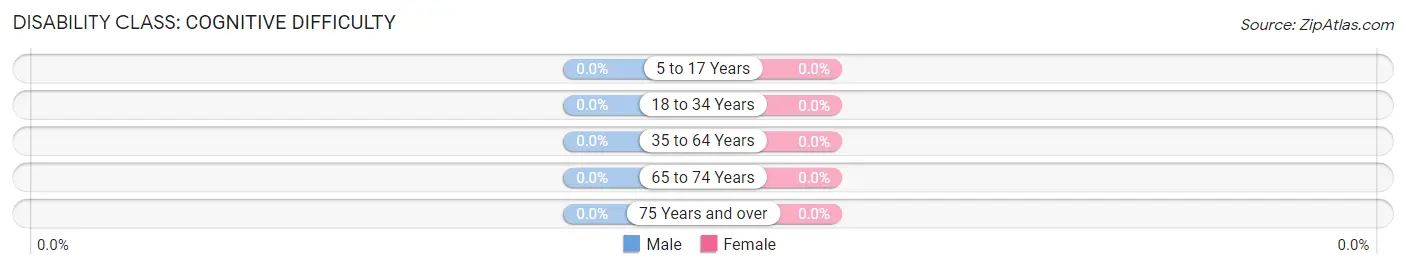
| Age Bracket | Male | Female |
| 5 to 17 Years | 0 (0.0%) | 0 (0.0%) |
| 18 to 34 Years | 0 (0.0%) | 0 (0.0%) |
| 35 to 64 Years | 0 (0.0%) | 0 (0.0%) |
| 65 to 74 Years | 0 (0.0%) | 0 (0.0%) |
| 75 Years and over | 0 (0.0%) | 0 (0.0%) |
Disability Class: Ambulatory Difficulty
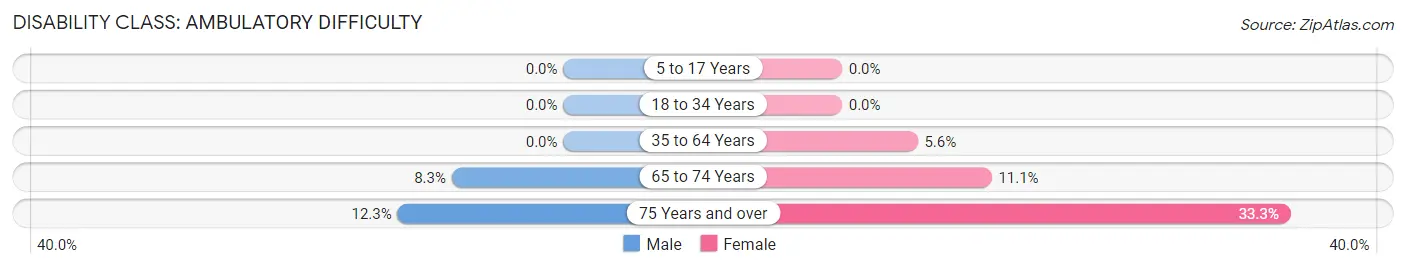
| Age Bracket | Male | Female |
| 5 to 17 Years | 0 (0.0%) | 0 (0.0%) |
| 18 to 34 Years | 0 (0.0%) | 0 (0.0%) |
| 35 to 64 Years | 0 (0.0%) | 10 (5.6%) |
| 65 to 74 Years | 14 (8.3%) | 13 (11.1%) |
| 75 Years and over | 16 (12.3%) | 32 (33.3%) |
Disability Class: Self-Care Difficulty
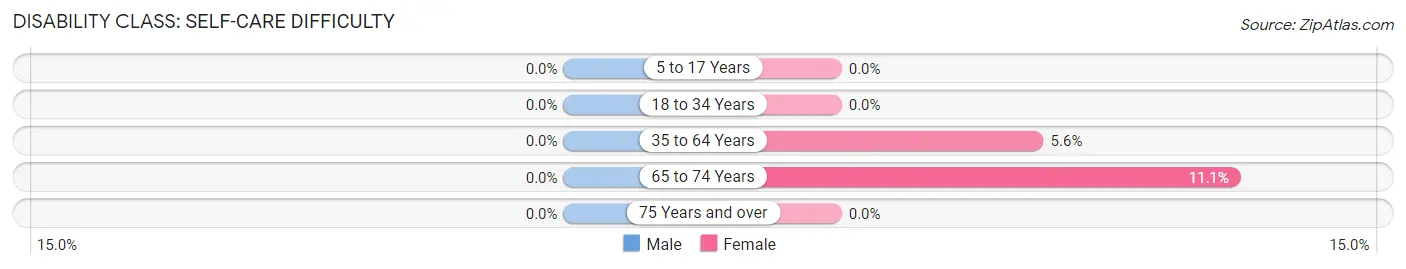
| Age Bracket | Male | Female |
| 5 to 17 Years | 0 (0.0%) | 0 (0.0%) |
| 18 to 34 Years | 0 (0.0%) | 0 (0.0%) |
| 35 to 64 Years | 0 (0.0%) | 10 (5.6%) |
| 65 to 74 Years | 0 (0.0%) | 13 (11.1%) |
| 75 Years and over | 0 (0.0%) | 0 (0.0%) |
Technology Access in Captains Cove
Computing Device Access in Captains Cove
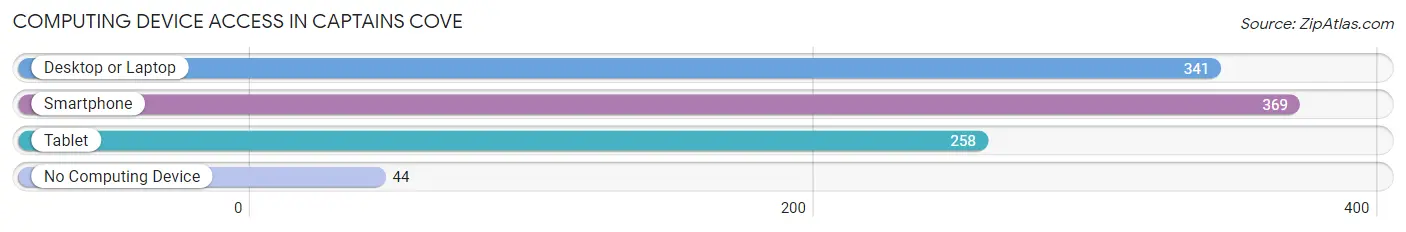
| Device Type | # Households | % Households |
| Desktop or Laptop | 341 | 74.3% |
| Smartphone | 369 | 80.4% |
| Tablet | 258 | 56.2% |
| No Computing Device | 44 | 9.6% |
| Total | 459 | 100.0% |
Internet Access in Captains Cove
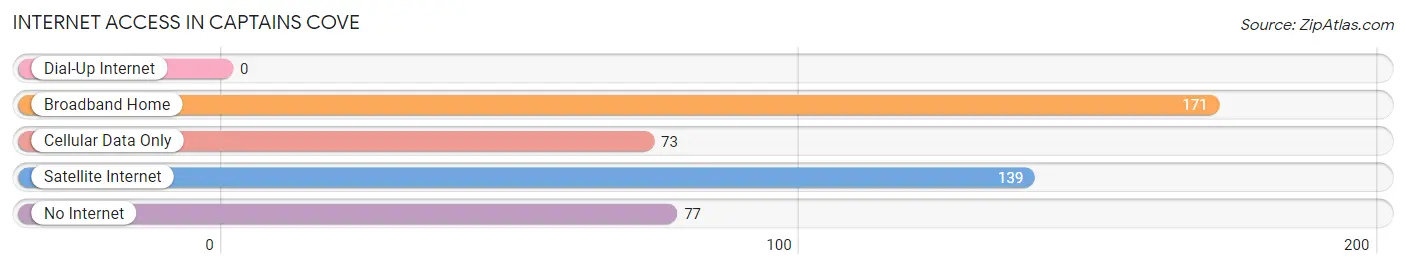
| Internet Type | # Households | % Households |
| Dial-Up Internet | 0 | 0.0% |
| Broadband Home | 171 | 37.2% |
| Cellular Data Only | 73 | 15.9% |
| Satellite Internet | 139 | 30.3% |
| No Internet | 77 | 16.8% |
| Total | 459 | 100.0% |
Captains Cove Summary
Captains Cove, Virginia is a small unincorporated community located in Accomack County on the Eastern Shore of Virginia. It is situated on the Chesapeake Bay, just south of the Maryland border. The community is home to a variety of businesses, including a marina, a seafood market, and a few restaurants.
History
Captains Cove was first settled in the early 1700s by English colonists. The area was originally known as “Cove Point” and was used as a fishing and trading post. In the late 1700s, the area was renamed “Captains Cove” after a local sea captain who was known for his skill in navigating the waters of the Chesapeake Bay.
In the early 1800s, Captains Cove became a popular destination for oyster harvesting. The oyster industry was so successful that the town was incorporated in 1836. The town was also home to a number of shipbuilding companies, which produced vessels for the US Navy and merchant marine.
In the late 1800s, Captains Cove became a popular vacation destination for wealthy families from the North. The town was home to several large hotels and resorts, which attracted visitors from all over the country.
Geography
Captains Cove is located on the Eastern Shore of Virginia, just south of the Maryland border. The town is situated on the Chesapeake Bay, which provides access to the Atlantic Ocean. The town is surrounded by wetlands and marshlands, which provide a habitat for a variety of wildlife.
The town is located in Accomack County, which is part of the Hampton Roads metropolitan area. The county is home to a number of small towns and villages, including Chincoteague, Onancock, and Exmore.
Economy
The economy of Captains Cove is largely based on tourism and the seafood industry. The town is home to a number of seafood restaurants, which serve fresh seafood caught in the Chesapeake Bay. The town is also home to a marina, which provides access to the bay for recreational boaters.
The town is also home to a number of small businesses, including a seafood market, a boat repair shop, and a few retail stores. The town is also home to a number of bed and breakfasts, which attract visitors from all over the country.
Demographics
As of the 2010 census, the population of Captains Cove was 1,845. The town is predominantly white, with a small African American population. The median household income in the town is $45,000, and the median home value is $150,000.
The town is served by the Accomack County Public Schools system. The town is home to a number of churches, including the Captains Cove United Methodist Church and the Captains Cove Baptist Church.
Conclusion
Captains Cove, Virginia is a small unincorporated community located on the Eastern Shore of Virginia. The town is situated on the Chesapeake Bay and is home to a variety of businesses, including a marina, a seafood market, and a few restaurants. The economy of the town is largely based on tourism and the seafood industry, and the town is served by the Accomack County Public Schools system. As of the 2010 census, the population of Captains Cove was 1,845.
Common Questions
What is Per Capita Income in Captains Cove?
Per Capita income in Captains Cove is $31,955.
What is the Median Family Income in Captains Cove?
Median Family Income in Captains Cove is $73,958.
What is the Median Household income in Captains Cove?
Median Household Income in Captains Cove is $66,083.
What is Income or Wage Gap in Captains Cove?
Income or Wage Gap in Captains Cove is 15.6%.
Women in Captains Cove earn 84.4 cents for every dollar earned by a man.
What is Inequality or Gini Index in Captains Cove?
Inequality or Gini Index in Captains Cove is 0.29.
What is the Total Population of Captains Cove?
Total Population of Captains Cove is 1,189.
What is the Total Male Population of Captains Cove?
Total Male Population of Captains Cove is 578.
What is the Total Female Population of Captains Cove?
Total Female Population of Captains Cove is 611.
What is the Ratio of Males per 100 Females in Captains Cove?
There are 94.60 Males per 100 Females in Captains Cove.
What is the Ratio of Females per 100 Males in Captains Cove?
There are 105.71 Females per 100 Males in Captains Cove.
What is the Median Population Age in Captains Cove?
Median Population Age in Captains Cove is 62.8 Years.
What is the Average Family Size in Captains Cove
Average Family Size in Captains Cove is 2.9 People.
What is the Average Household Size in Captains Cove
Average Household Size in Captains Cove is 2.6 People.
How Large is the Labor Force in Captains Cove?
There are 338 People in the Labor Forcein in Captains Cove.
What is the Percentage of People in the Labor Force in Captains Cove?
36.5% of People are in the Labor Force in Captains Cove.
What is the Unemployment Rate in Captains Cove?
Unemployment Rate in Captains Cove is 12.4%.