New Market, VA Map & Demographics
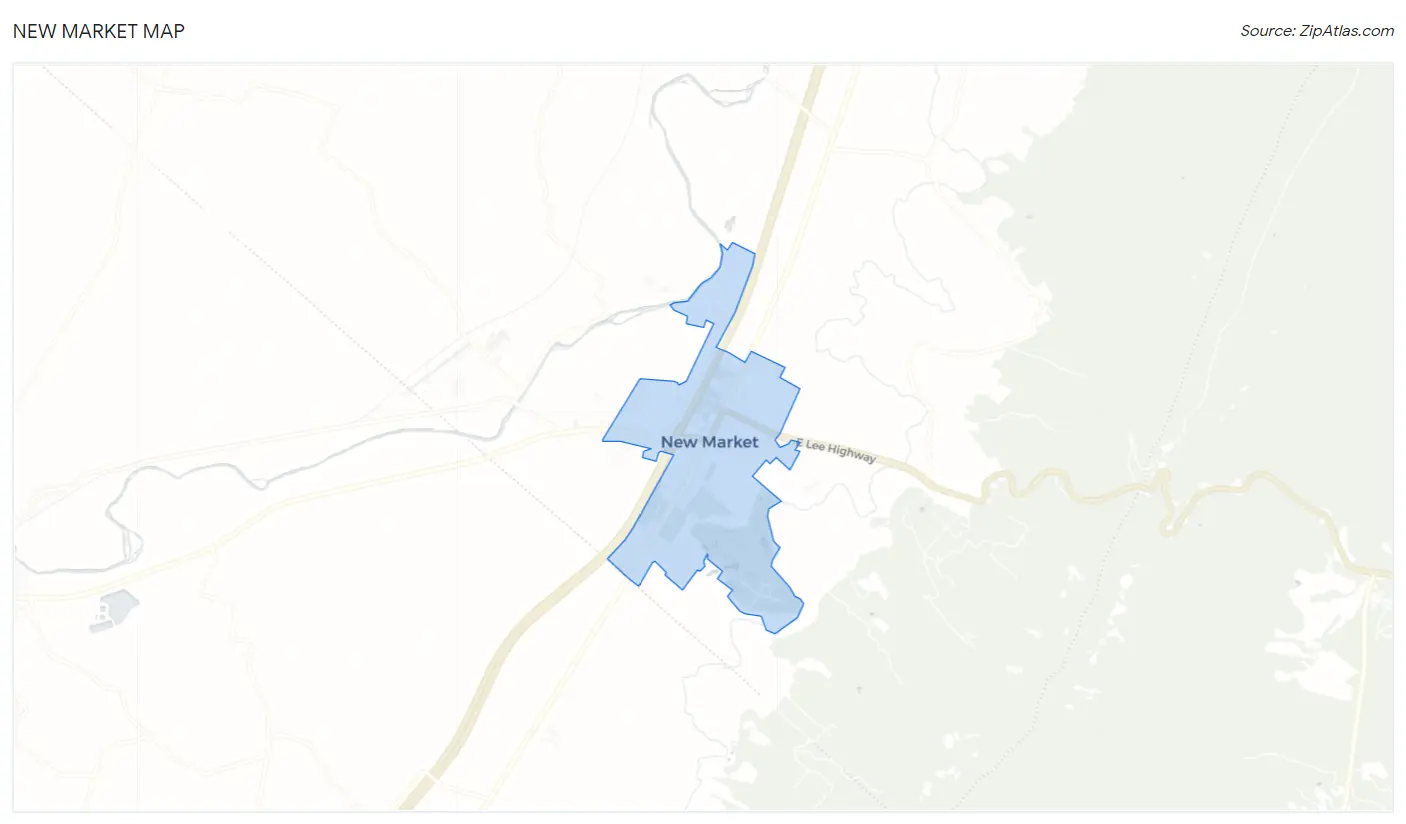
New Market Map
New Market Overview
$35,671
PER CAPITA INCOME
$60,089
AVG FAMILY INCOME
$47,855
AVG HOUSEHOLD INCOME
12.6%
WAGE / INCOME GAP [ % ]
87.4¢/ $1
WAGE / INCOME GAP [ $ ]
0.50
INEQUALITY / GINI INDEX
2,162
TOTAL POPULATION
952
MALE POPULATION
1,210
FEMALE POPULATION
78.68
MALES / 100 FEMALES
127.10
FEMALES / 100 MALES
57.3
MEDIAN AGE
2.6
AVG FAMILY SIZE
1.9
AVG HOUSEHOLD SIZE
1,000
LABOR FORCE [ PEOPLE ]
52.5%
PERCENT IN LABOR FORCE
1.9%
UNEMPLOYMENT RATE
New Market Zip Codes
New Market Area Codes
Income in New Market
Income Overview in New Market
Per Capita Income in New Market is $35,671, while median incomes of families and households are $60,089 and $47,855 respectively.
| Characteristic | Number | Measure |
| Per Capita Income | 2,162 | $35,671 |
| Median Family Income | 521 | $60,089 |
| Mean Family Income | 521 | $98,618 |
| Median Household Income | 1,041 | $47,855 |
| Mean Household Income | 1,041 | $69,329 |
| Income Deficit | 521 | $0 |
| Wage / Income Gap (%) | 2,162 | 12.63% |
| Wage / Income Gap ($) | 2,162 | 87.37¢ per $1 |
| Gini / Inequality Index | 2,162 | 0.50 |
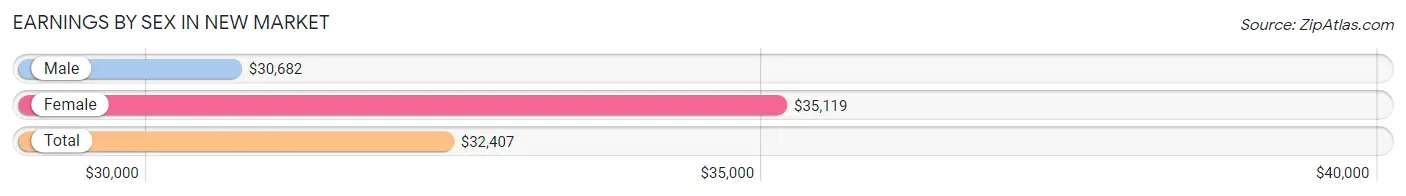
Earnings by Sex in New Market
Average Earnings in New Market are $32,407, $30,682 for men and $35,119 for women, a difference of 12.6%.
| Sex | Number | Average Earnings |
| Male | 618 (59.8%) | $30,682 |
| Female | 416 (40.2%) | $35,119 |
| Total | 1,034 (100.0%) | $32,407 |
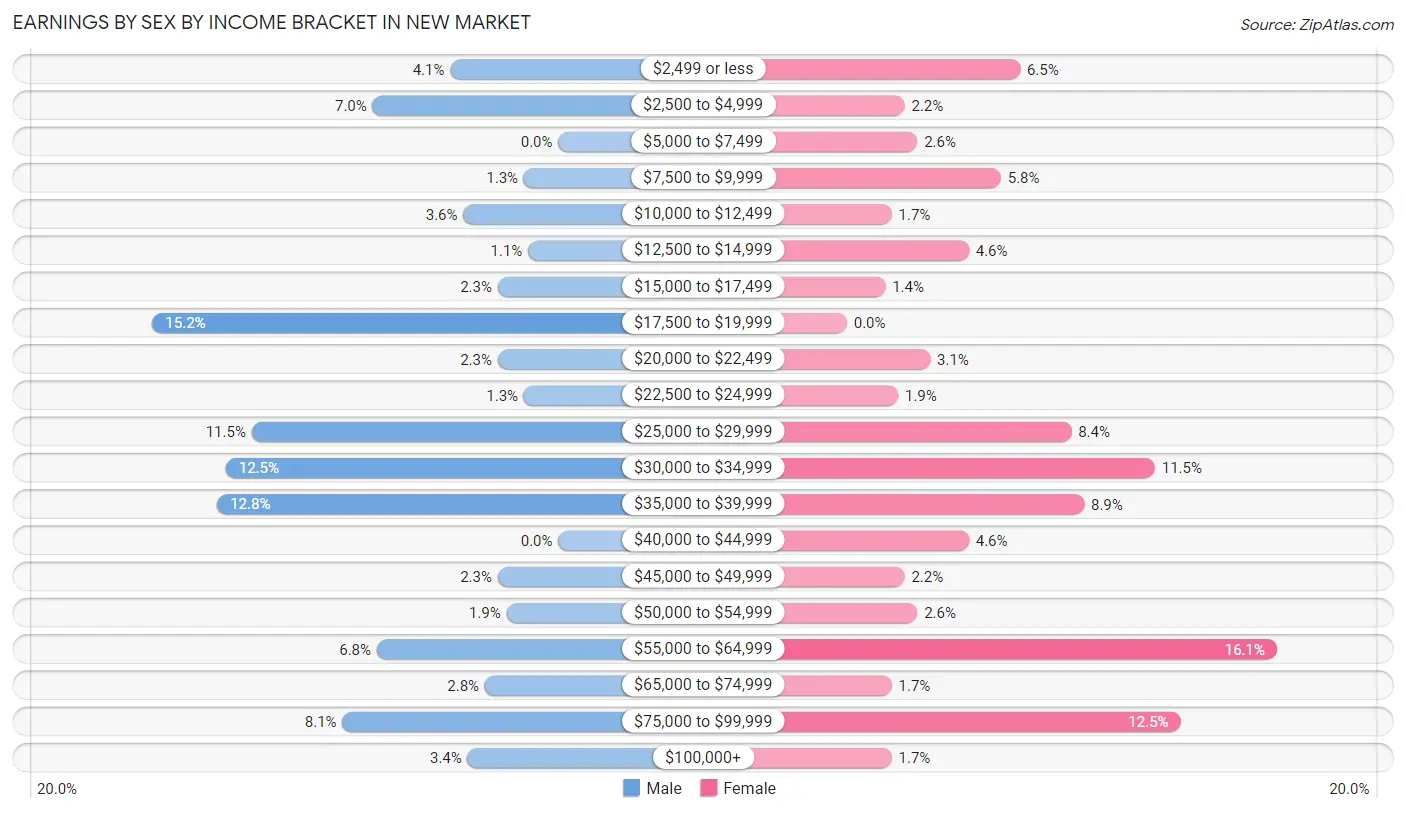
Earnings by Sex by Income Bracket in New Market
The most common earnings brackets in New Market are $17,500 to $19,999 for men (94 | 15.2%) and $55,000 to $64,999 for women (67 | 16.1%).
| Income | Male | Female |
| $2,499 or less | 25 (4.1%) | 27 (6.5%) |
| $2,500 to $4,999 | 43 (7.0%) | 9 (2.2%) |
| $5,000 to $7,499 | 0 (0.0%) | 11 (2.6%) |
| $7,500 to $9,999 | 8 (1.3%) | 24 (5.8%) |
| $10,000 to $12,499 | 22 (3.6%) | 7 (1.7%) |
| $12,500 to $14,999 | 7 (1.1%) | 19 (4.6%) |
| $15,000 to $17,499 | 14 (2.3%) | 6 (1.4%) |
| $17,500 to $19,999 | 94 (15.2%) | 0 (0.0%) |
| $20,000 to $22,499 | 14 (2.3%) | 13 (3.1%) |
| $22,500 to $24,999 | 8 (1.3%) | 8 (1.9%) |
| $25,000 to $29,999 | 71 (11.5%) | 35 (8.4%) |
| $30,000 to $34,999 | 77 (12.5%) | 48 (11.5%) |
| $35,000 to $39,999 | 79 (12.8%) | 37 (8.9%) |
| $40,000 to $44,999 | 0 (0.0%) | 19 (4.6%) |
| $45,000 to $49,999 | 14 (2.3%) | 9 (2.2%) |
| $50,000 to $54,999 | 12 (1.9%) | 11 (2.6%) |
| $55,000 to $64,999 | 42 (6.8%) | 67 (16.1%) |
| $65,000 to $74,999 | 17 (2.8%) | 7 (1.7%) |
| $75,000 to $99,999 | 50 (8.1%) | 52 (12.5%) |
| $100,000+ | 21 (3.4%) | 7 (1.7%) |
| Total | 618 (100.0%) | 416 (100.0%) |
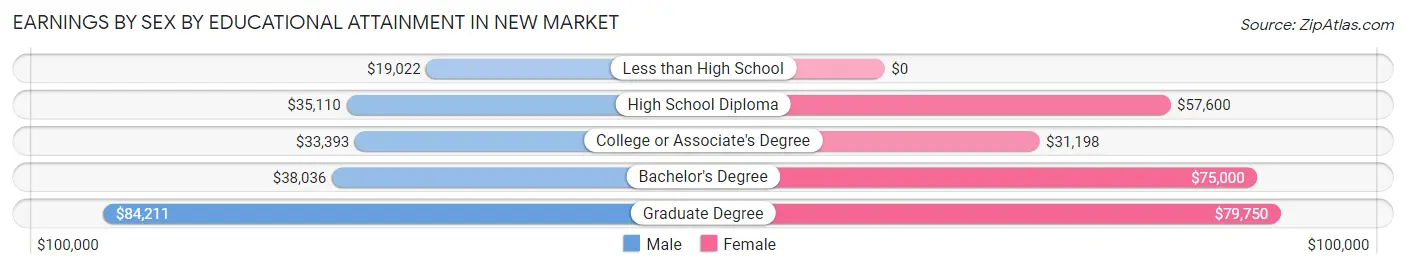
Earnings by Sex by Educational Attainment in New Market
Average earnings in New Market are $33,169 for men and $39,375 for women, a difference of 15.8%. Men with an educational attainment of graduate degree enjoy the highest average annual earnings of $84,211, while those with less than high school education earn the least with $19,022. Women with an educational attainment of graduate degree earn the most with the average annual earnings of $79,750, while those with college or associate's degree education have the smallest earnings of $31,198.
| Educational Attainment | Male Income | Female Income |
| Less than High School | $19,022 | $0 |
| High School Diploma | $35,110 | $57,600 |
| College or Associate's Degree | $33,393 | $31,198 |
| Bachelor's Degree | $38,036 | $75,000 |
| Graduate Degree | $84,211 | $79,750 |
| Total | $33,169 | $39,375 |
Family Income in New Market
Family Income Brackets in New Market
According to the New Market family income data, there are 143 families falling into the $35,000 to $49,999 income range, which is the most common income bracket and makes up 27.5% of all families. Conversely, the $15,000 to $24,999 income bracket is the least frequent group with only 6 families (1.1%) belonging to this category.
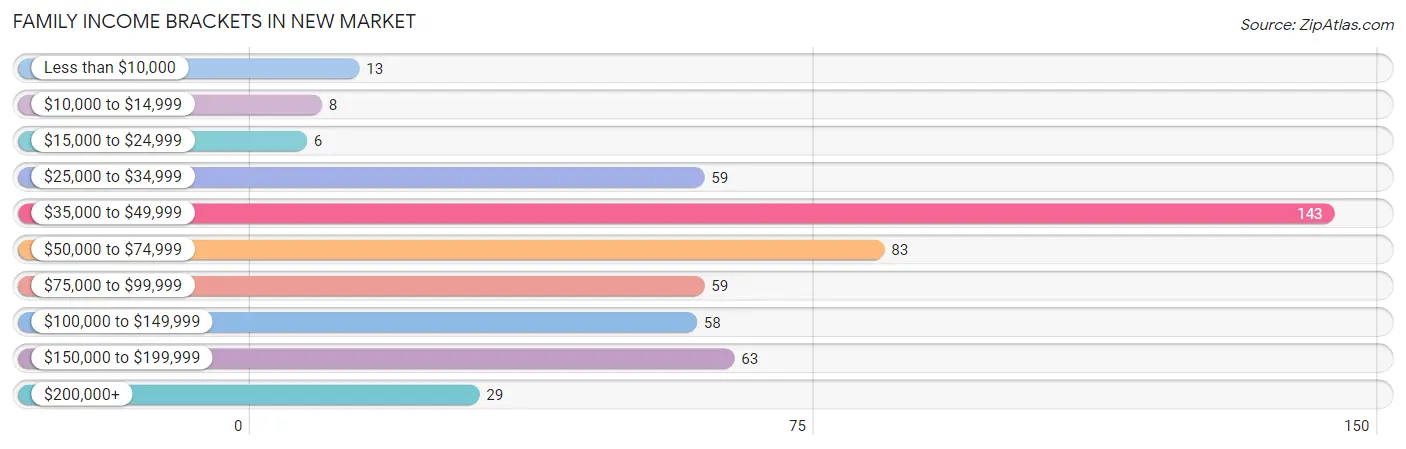
| Income Bracket | # Families | % Families |
| Less than $10,000 | 13 | 2.5% |
| $10,000 to $14,999 | 8 | 1.5% |
| $15,000 to $24,999 | 6 | 1.2% |
| $25,000 to $34,999 | 59 | 11.3% |
| $35,000 to $49,999 | 143 | 27.4% |
| $50,000 to $74,999 | 83 | 15.9% |
| $75,000 to $99,999 | 59 | 11.3% |
| $100,000 to $149,999 | 58 | 11.1% |
| $150,000 to $199,999 | 63 | 12.1% |
| $200,000+ | 29 | 5.6% |
Family Income by Famaliy Size in New Market
4-person families (43 | 8.3%) account for the highest median family income in New Market with $98,250 per family, while 2-person families (357 | 68.5%) have the highest median income of $28,542 per family member.
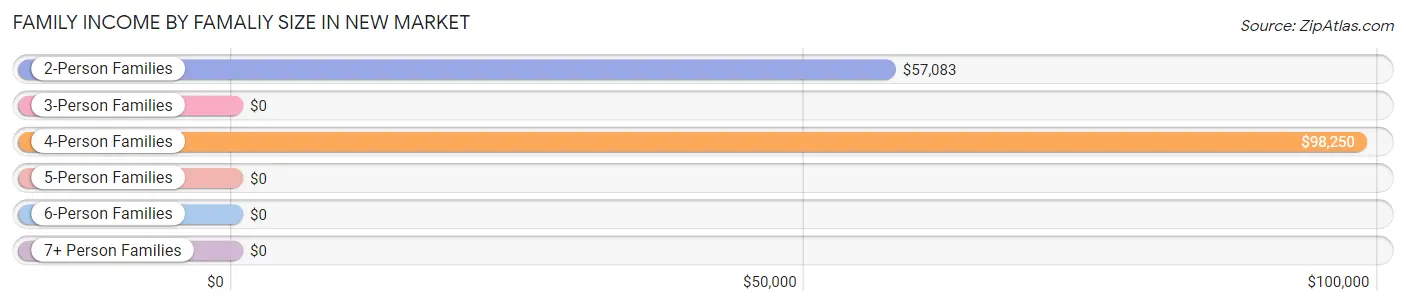
| Income Bracket | # Families | Median Income |
| 2-Person Families | 357 (68.5%) | $57,083 |
| 3-Person Families | 111 (21.3%) | $0 |
| 4-Person Families | 43 (8.3%) | $98,250 |
| 5-Person Families | 10 (1.9%) | $0 |
| 6-Person Families | 0 (0.0%) | $0 |
| 7+ Person Families | 0 (0.0%) | $0 |
| Total | 521 (100.0%) | $60,089 |
Family Income by Number of Earners in New Market
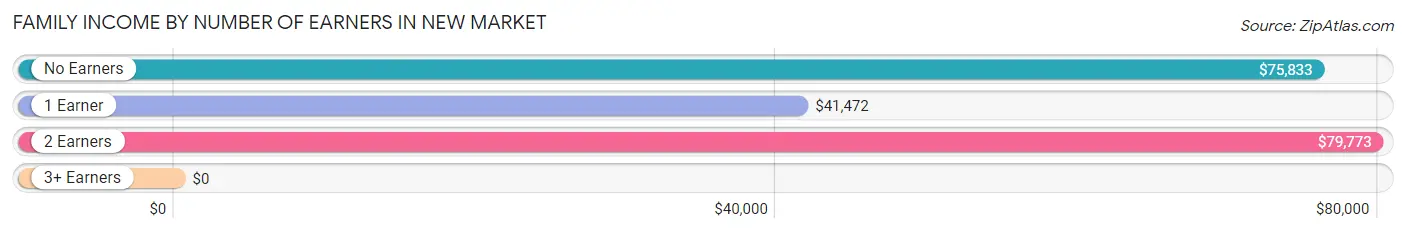
| Number of Earners | # Families | Median Income |
| No Earners | 98 (18.8%) | $75,833 |
| 1 Earner | 257 (49.3%) | $41,472 |
| 2 Earners | 150 (28.8%) | $79,773 |
| 3+ Earners | 16 (3.1%) | $0 |
| Total | 521 (100.0%) | $60,089 |
Household Income in New Market
Household Income Brackets in New Market
With 275 households falling in the category, the $35,000 to $49,999 income range is the most frequent in New Market, accounting for 26.4% of all households. In contrast, only 32 households (3.1%) fall into the $200,000+ income bracket, making it the least populous group.
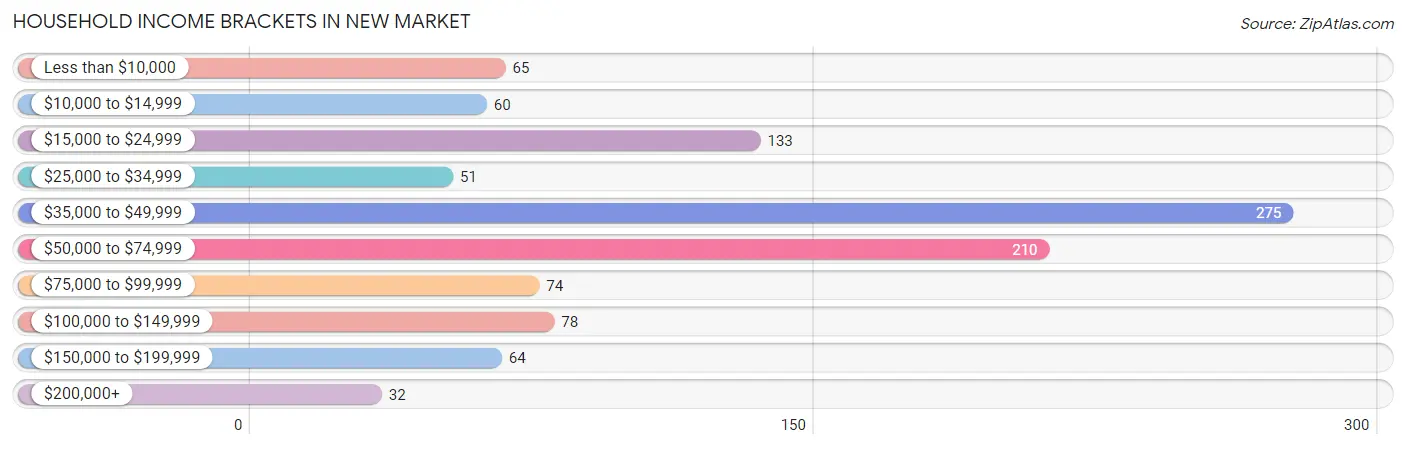
| Income Bracket | # Households | % Households |
| Less than $10,000 | 65 | 6.2% |
| $10,000 to $14,999 | 60 | 5.8% |
| $15,000 to $24,999 | 133 | 12.8% |
| $25,000 to $34,999 | 51 | 4.9% |
| $35,000 to $49,999 | 275 | 26.4% |
| $50,000 to $74,999 | 210 | 20.2% |
| $75,000 to $99,999 | 74 | 7.1% |
| $100,000 to $149,999 | 78 | 7.5% |
| $150,000 to $199,999 | 64 | 6.1% |
| $200,000+ | 32 | 3.1% |
Household Income by Householder Age in New Market
The median household income in New Market is $47,855, with the highest median household income of $60,282 found in the 15 to 24 years age bracket for the primary householder. A total of 55 households (5.3%) fall into this category. Meanwhile, the 25 to 44 years age bracket for the primary householder has the lowest median household income of $45,990, with 239 households (23.0%) in this group.
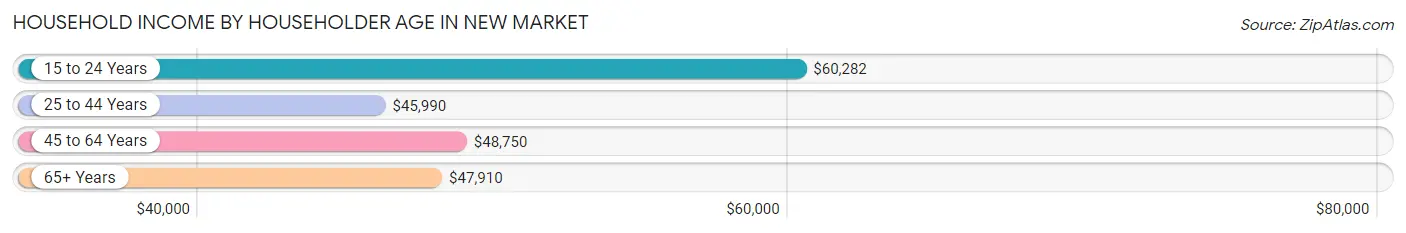
| Income Bracket | # Households | Median Income |
| 15 to 24 Years | 55 (5.3%) | $60,282 |
| 25 to 44 Years | 239 (23.0%) | $45,990 |
| 45 to 64 Years | 360 (34.6%) | $48,750 |
| 65+ Years | 387 (37.2%) | $47,910 |
| Total | 1,041 (100.0%) | $47,855 |
Poverty in New Market
Income Below Poverty by Sex and Age in New Market
With 10.3% poverty level for males and 11.8% for females among the residents of New Market, under 5 year old males and 5 year old females are the most vulnerable to poverty, with 10 males (100.0%) and 13 females (100.0%) in their respective age groups living below the poverty level.
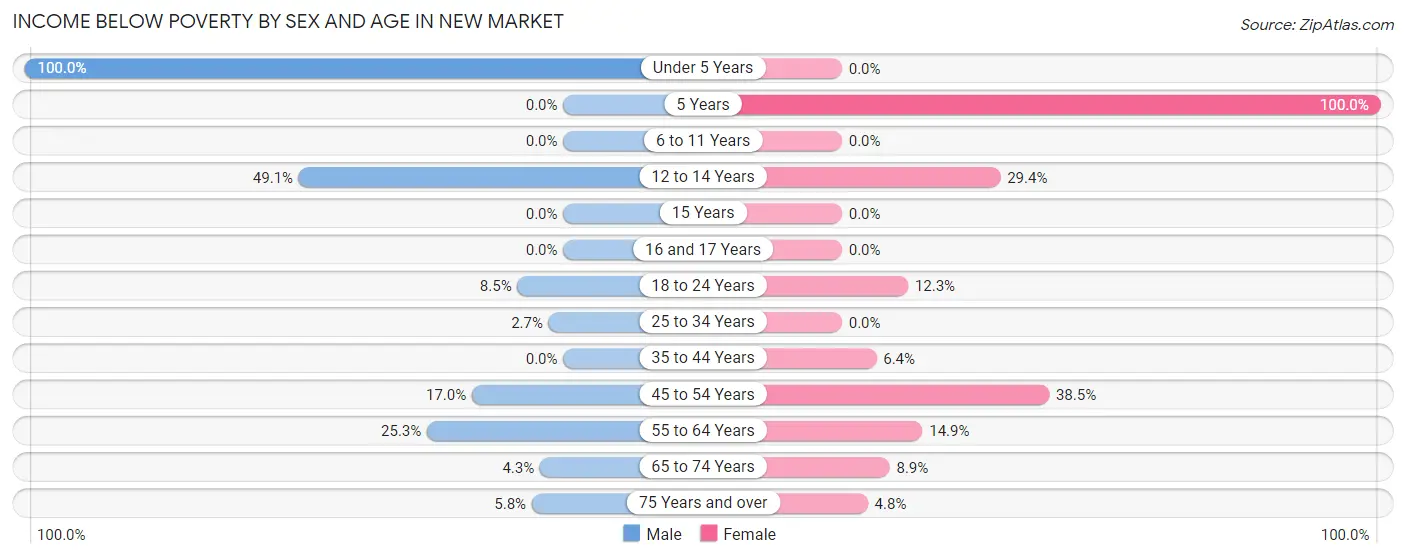
| Age Bracket | Male | Female |
| Under 5 Years | 10 (100.0%) | 0 (0.0%) |
| 5 Years | 0 (0.0%) | 13 (100.0%) |
| 6 to 11 Years | 0 (0.0%) | 0 (0.0%) |
| 12 to 14 Years | 27 (49.1%) | 5 (29.4%) |
| 15 Years | 0 (0.0%) | 0 (0.0%) |
| 16 and 17 Years | 0 (0.0%) | 0 (0.0%) |
| 18 to 24 Years | 8 (8.5%) | 7 (12.3%) |
| 25 to 34 Years | 4 (2.7%) | 0 (0.0%) |
| 35 to 44 Years | 0 (0.0%) | 8 (6.4%) |
| 45 to 54 Years | 10 (17.0%) | 35 (38.5%) |
| 55 to 64 Years | 22 (25.3%) | 36 (14.9%) |
| 65 to 74 Years | 10 (4.3%) | 21 (8.9%) |
| 75 Years and over | 6 (5.8%) | 6 (4.8%) |
| Total | 97 (10.3%) | 131 (11.8%) |
Income Above Poverty by Sex and Age in New Market
According to the poverty statistics in New Market, males aged 6 to 11 years and females aged under 5 years are the age groups that are most secure financially, with 100.0% of males and 100.0% of females in these age groups living above the poverty line.
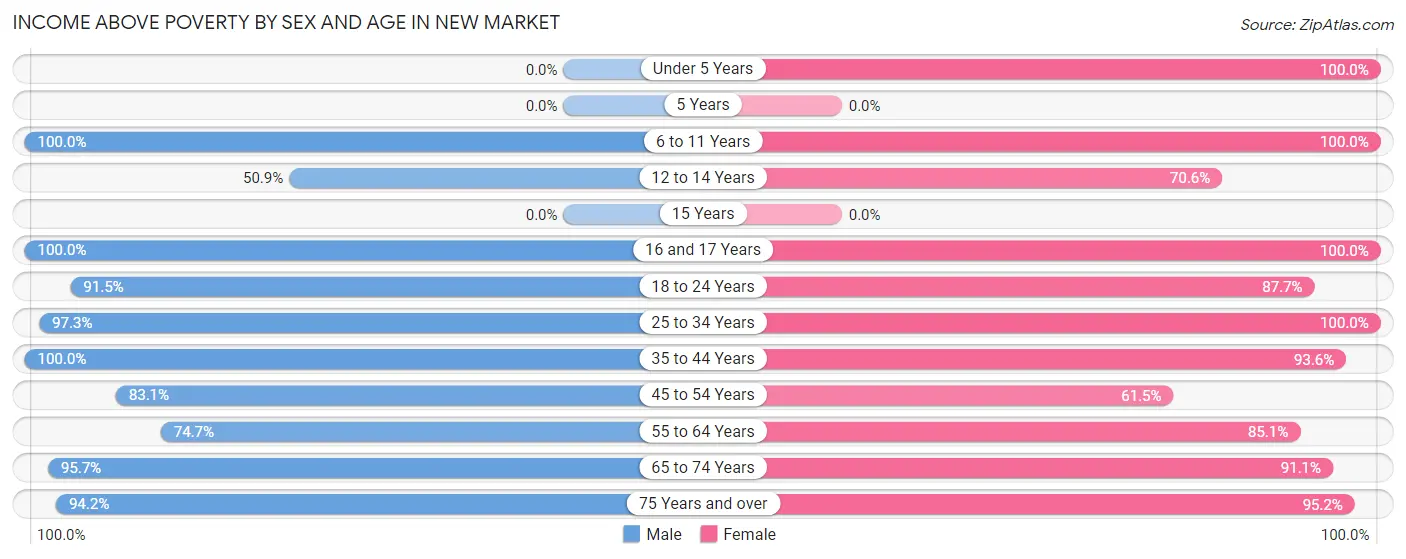
| Age Bracket | Male | Female |
| Under 5 Years | 0 (0.0%) | 45 (100.0%) |
| 5 Years | 0 (0.0%) | 0 (0.0%) |
| 6 to 11 Years | 50 (100.0%) | 67 (100.0%) |
| 12 to 14 Years | 28 (50.9%) | 12 (70.6%) |
| 15 Years | 0 (0.0%) | 0 (0.0%) |
| 16 and 17 Years | 10 (100.0%) | 18 (100.0%) |
| 18 to 24 Years | 86 (91.5%) | 50 (87.7%) |
| 25 to 34 Years | 144 (97.3%) | 72 (100.0%) |
| 35 to 44 Years | 95 (100.0%) | 117 (93.6%) |
| 45 to 54 Years | 49 (83.1%) | 56 (61.5%) |
| 55 to 64 Years | 65 (74.7%) | 205 (85.1%) |
| 65 to 74 Years | 221 (95.7%) | 216 (91.1%) |
| 75 Years and over | 97 (94.2%) | 119 (95.2%) |
| Total | 845 (89.7%) | 977 (88.2%) |
Income Below Poverty Among Married-Couple Families in New Market
The poverty statistics for married-couple families in New Market show that 2.8% or 10 of the total 362 families live below the poverty line. Families with 1 or 2 children have the highest poverty rate of 11.6%, comprising of 10 families. On the other hand, families with no children have the lowest poverty rate of 0.0%, which includes 0 families.
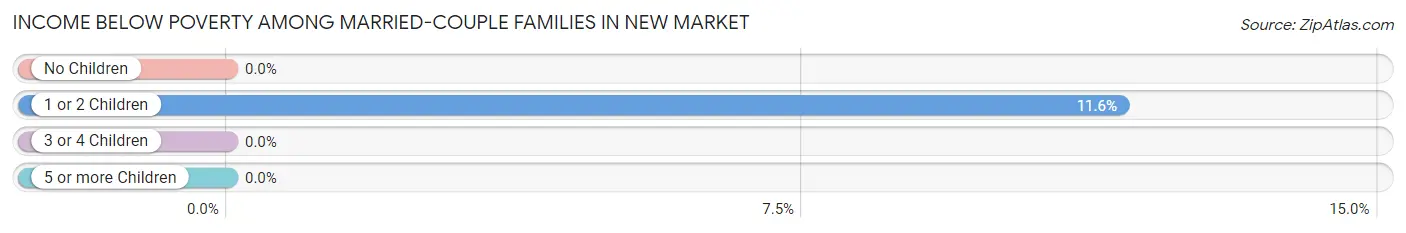
| Children | Above Poverty | Below Poverty |
| No Children | 276 (100.0%) | 0 (0.0%) |
| 1 or 2 Children | 76 (88.4%) | 10 (11.6%) |
| 3 or 4 Children | 0 (0.0%) | 0 (0.0%) |
| 5 or more Children | 0 (0.0%) | 0 (0.0%) |
| Total | 352 (97.2%) | 10 (2.8%) |
Income Below Poverty Among Single-Parent Households in New Market
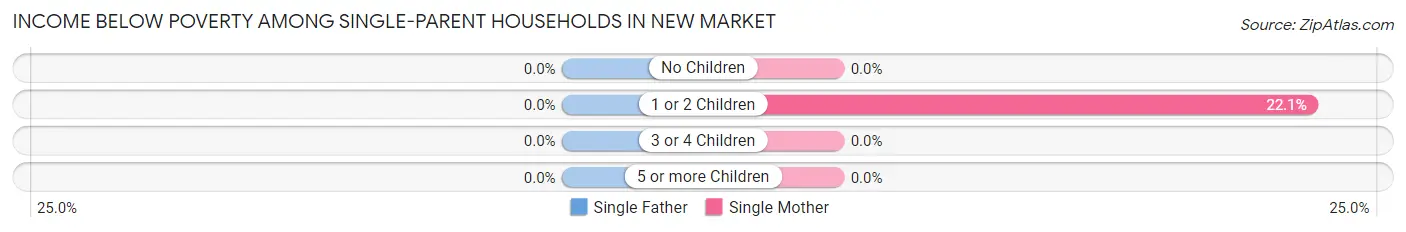
| Children | Single Father | Single Mother |
| No Children | 0 (0.0%) | 0 (0.0%) |
| 1 or 2 Children | 0 (0.0%) | 21 (22.1%) |
| 3 or 4 Children | 0 (0.0%) | 0 (0.0%) |
| 5 or more Children | 0 (0.0%) | 0 (0.0%) |
| Total | 0 (0.0%) | 21 (15.3%) |
Income Below Poverty Among Married-Couple vs Single-Parent Households in New Market
The poverty data for New Market shows that 10 of the married-couple family households (2.8%) and 21 of the single-parent households (13.2%) are living below the poverty level. Within the married-couple family households, those with 1 or 2 children have the highest poverty rate, with 10 households (11.6%) falling below the poverty line. Among the single-parent households, those with 1 or 2 children have the highest poverty rate, with 21 household (22.1%) living below poverty.
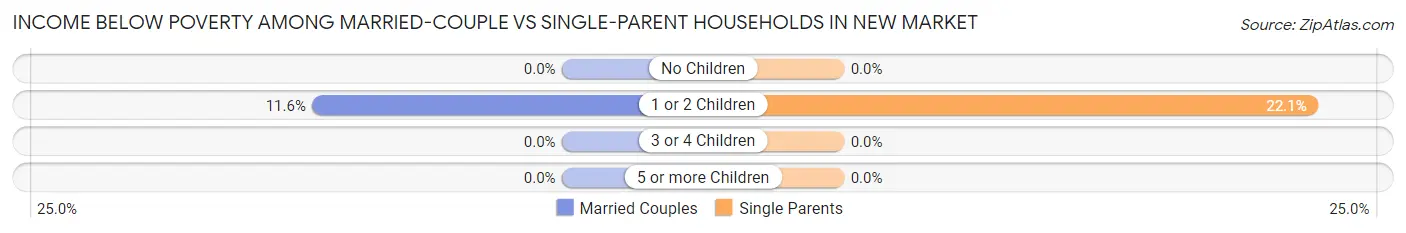
| Children | Married-Couple Families | Single-Parent Households |
| No Children | 0 (0.0%) | 0 (0.0%) |
| 1 or 2 Children | 10 (11.6%) | 21 (22.1%) |
| 3 or 4 Children | 0 (0.0%) | 0 (0.0%) |
| 5 or more Children | 0 (0.0%) | 0 (0.0%) |
| Total | 10 (2.8%) | 21 (13.2%) |
Race in New Market
The most populous races in New Market are White / Caucasian (1,958 | 90.6%), Hispanic or Latino (120 | 5.6%), and Black / African American (92 | 4.3%).
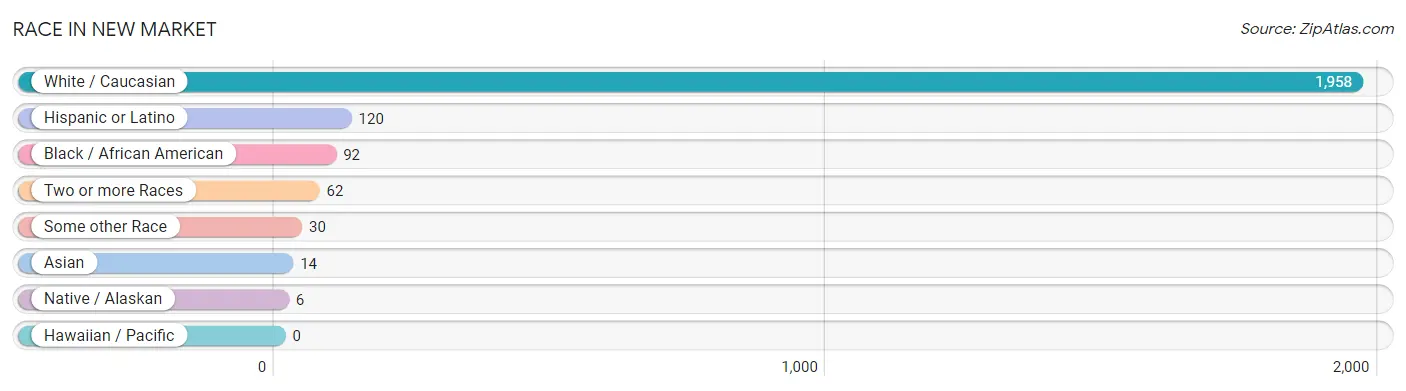
| Race | # Population | % Population |
| Asian | 14 | 0.6% |
| Black / African American | 92 | 4.3% |
| Hawaiian / Pacific | 0 | 0.0% |
| Hispanic or Latino | 120 | 5.6% |
| Native / Alaskan | 6 | 0.3% |
| White / Caucasian | 1,958 | 90.6% |
| Two or more Races | 62 | 2.9% |
| Some other Race | 30 | 1.4% |
| Total | 2,162 | 100.0% |
Ancestry in New Market
The most populous ancestries reported in New Market are German (483 | 22.3%), Irish (268 | 12.4%), American (218 | 10.1%), English (193 | 8.9%), and Italian (129 | 6.0%), together accounting for 59.7% of all New Market residents.
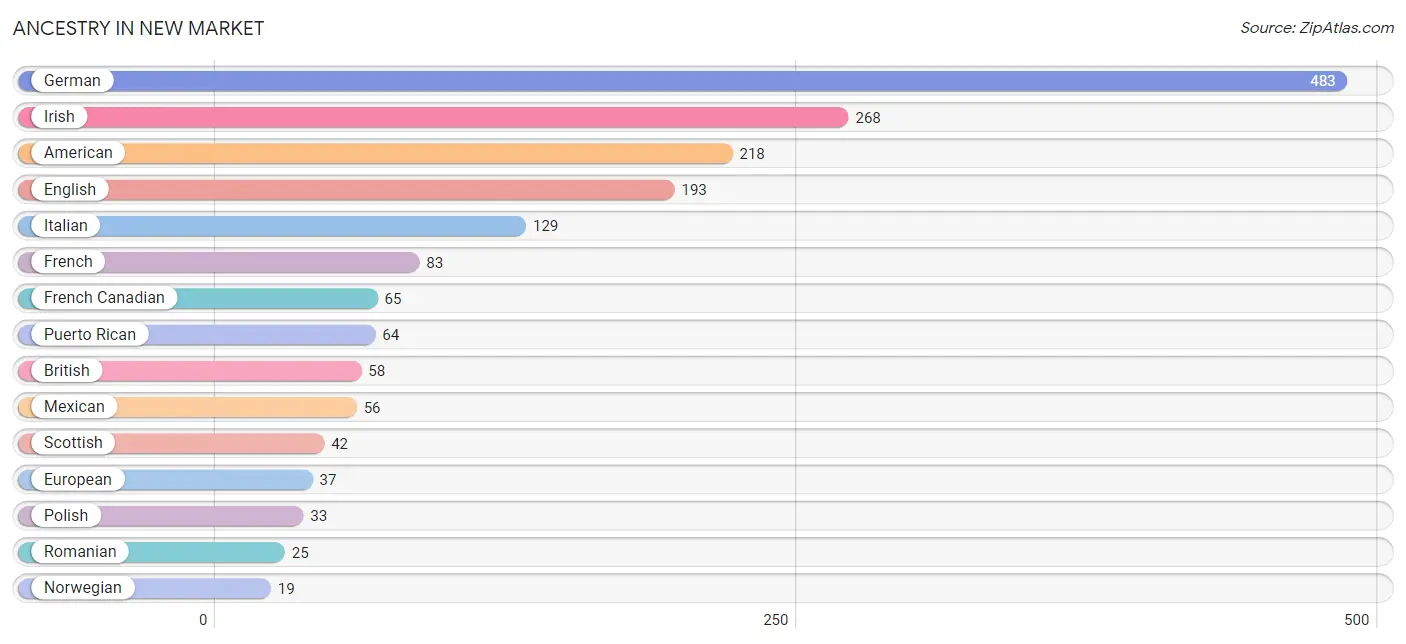
| Ancestry | # Population | % Population |
| African | 15 | 0.7% |
| American | 218 | 10.1% |
| British | 58 | 2.7% |
| Cherokee | 17 | 0.8% |
| Czech | 17 | 0.8% |
| Czechoslovakian | 5 | 0.2% |
| Danish | 5 | 0.2% |
| Dutch | 6 | 0.3% |
| English | 193 | 8.9% |
| European | 37 | 1.7% |
| French | 83 | 3.8% |
| French Canadian | 65 | 3.0% |
| German | 483 | 22.3% |
| Hungarian | 7 | 0.3% |
| Irish | 268 | 12.4% |
| Italian | 129 | 6.0% |
| Mexican | 56 | 2.6% |
| Norwegian | 19 | 0.9% |
| Polish | 33 | 1.5% |
| Puerto Rican | 64 | 3.0% |
| Romanian | 25 | 1.2% |
| Russian | 8 | 0.4% |
| Scandinavian | 5 | 0.2% |
| Scotch-Irish | 16 | 0.7% |
| Scottish | 42 | 1.9% |
| Serbian | 7 | 0.3% |
| Sri Lankan | 14 | 0.6% |
| Subsaharan African | 15 | 0.7% |
| Swiss | 6 | 0.3% | View All 29 Rows |
Immigrants in New Market
The most numerous immigrant groups reported in New Market came from Europe (57 | 2.6%), Eastern Europe (30 | 1.4%), Romania (30 | 1.4%), Central America (21 | 1.0%), and Germany (21 | 1.0%), together accounting for 7.4% of all New Market residents.
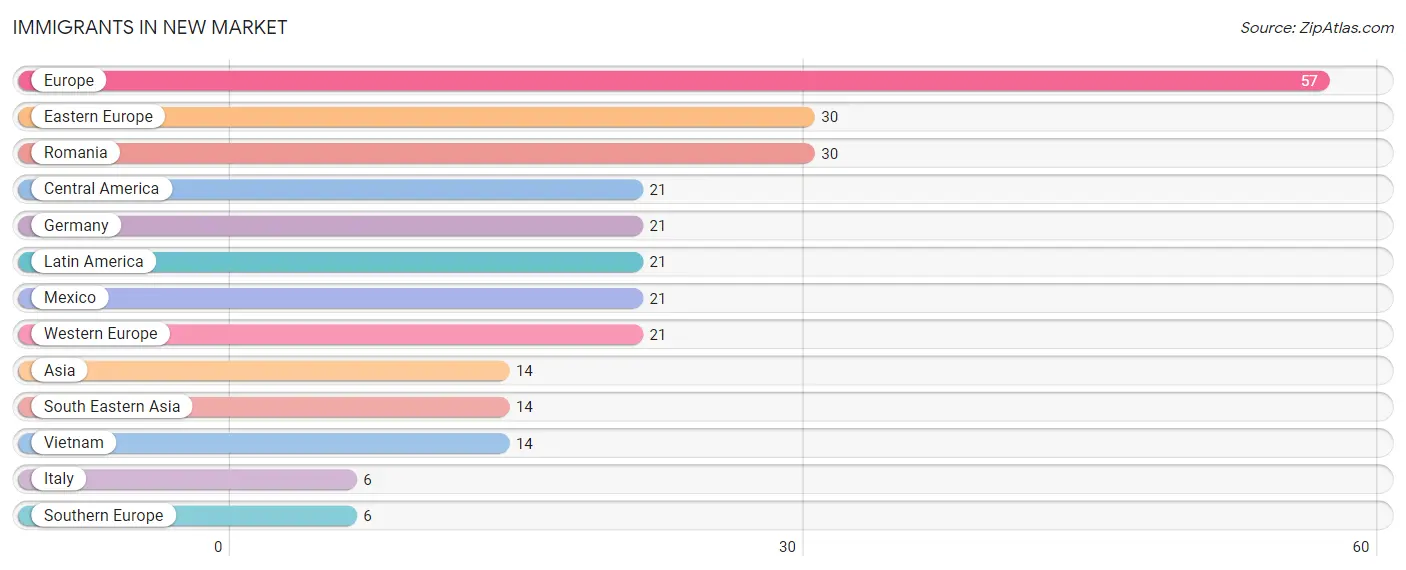
| Immigration Origin | # Population | % Population |
| Asia | 14 | 0.6% |
| Central America | 21 | 1.0% |
| Eastern Europe | 30 | 1.4% |
| Europe | 57 | 2.6% |
| Germany | 21 | 1.0% |
| Italy | 6 | 0.3% |
| Latin America | 21 | 1.0% |
| Mexico | 21 | 1.0% |
| Romania | 30 | 1.4% |
| South Eastern Asia | 14 | 0.6% |
| Southern Europe | 6 | 0.3% |
| Vietnam | 14 | 0.6% |
| Western Europe | 21 | 1.0% | View All 13 Rows |
Sex and Age in New Market
Sex and Age in New Market
The most populous age groups in New Market are 65 to 69 Years (129 | 13.6%) for men and 70 to 74 Years (143 | 11.8%) for women.
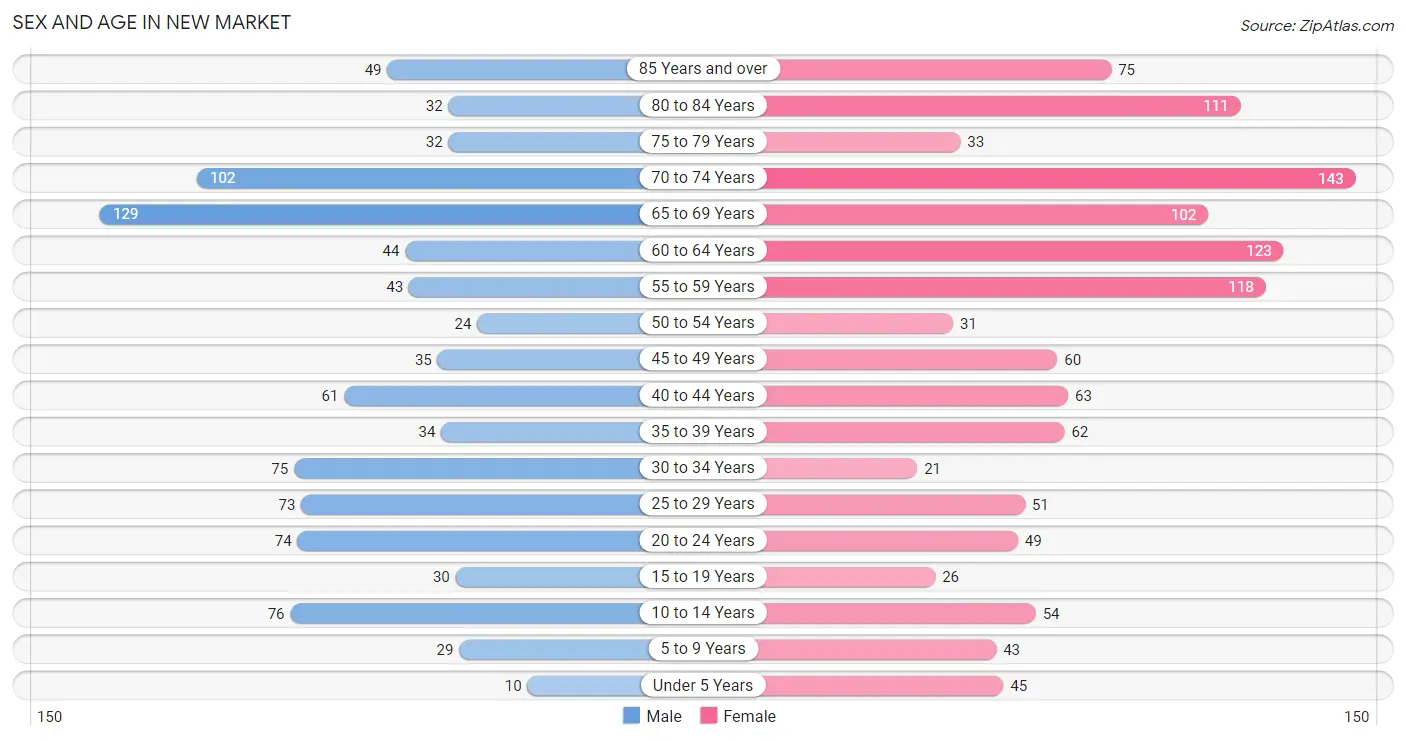
| Age Bracket | Male | Female |
| Under 5 Years | 10 (1.1%) | 45 (3.7%) |
| 5 to 9 Years | 29 (3.0%) | 43 (3.5%) |
| 10 to 14 Years | 76 (8.0%) | 54 (4.5%) |
| 15 to 19 Years | 30 (3.2%) | 26 (2.1%) |
| 20 to 24 Years | 74 (7.8%) | 49 (4.1%) |
| 25 to 29 Years | 73 (7.7%) | 51 (4.2%) |
| 30 to 34 Years | 75 (7.9%) | 21 (1.7%) |
| 35 to 39 Years | 34 (3.6%) | 62 (5.1%) |
| 40 to 44 Years | 61 (6.4%) | 63 (5.2%) |
| 45 to 49 Years | 35 (3.7%) | 60 (5.0%) |
| 50 to 54 Years | 24 (2.5%) | 31 (2.6%) |
| 55 to 59 Years | 43 (4.5%) | 118 (9.8%) |
| 60 to 64 Years | 44 (4.6%) | 123 (10.2%) |
| 65 to 69 Years | 129 (13.6%) | 102 (8.4%) |
| 70 to 74 Years | 102 (10.7%) | 143 (11.8%) |
| 75 to 79 Years | 32 (3.4%) | 33 (2.7%) |
| 80 to 84 Years | 32 (3.4%) | 111 (9.2%) |
| 85 Years and over | 49 (5.1%) | 75 (6.2%) |
| Total | 952 (100.0%) | 1,210 (100.0%) |
Families and Households in New Market
Median Family Size in New Market
The median family size in New Market is 2.58 persons per family, with married-couple families (362 | 69.5%) accounting for the largest median family size of 2.65 persons per family. On the other hand, single male/father families (22 | 4.2%) represent the smallest median family size with 1.91 persons per family.
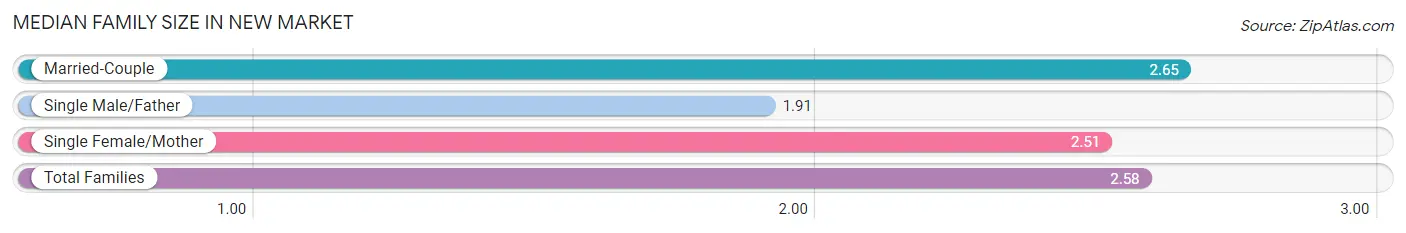
| Family Type | # Families | Family Size |
| Married-Couple | 362 (69.5%) | 2.65 |
| Single Male/Father | 22 (4.2%) | 1.91 |
| Single Female/Mother | 137 (26.3%) | 2.51 |
| Total Families | 521 (100.0%) | 2.58 |
Median Household Size in New Market
The median household size in New Market is 1.94 persons per household, with married-couple households (362 | 34.8%) accounting for the largest median household size of 2.7 persons per household. non-family households (520 | 49.9%) represent the smallest median household size with 1.24 persons per household.
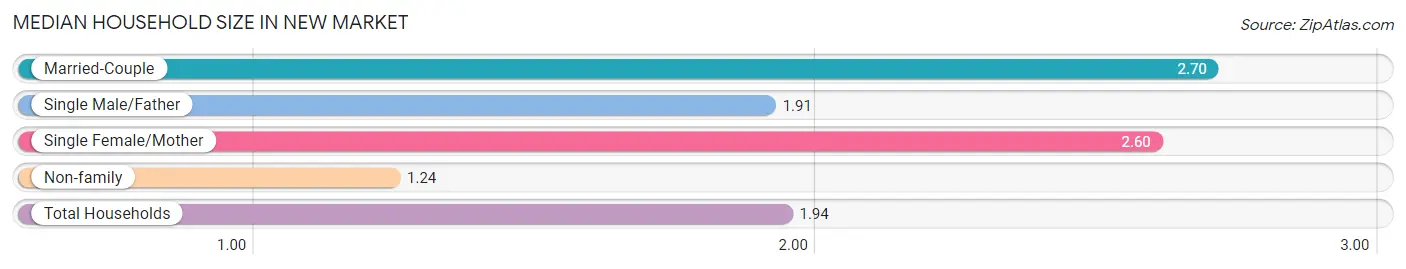
| Household Type | # Households | Household Size |
| Married-Couple | 362 (34.8%) | 2.70 |
| Single Male/Father | 22 (2.1%) | 1.91 |
| Single Female/Mother | 137 (13.2%) | 2.60 |
| Non-family | 520 (49.9%) | 1.24 |
| Total Households | 1,041 (100.0%) | 1.94 |
Household Size by Marriage Status in New Market
Out of a total of 1,041 households in New Market, 521 (50.0%) are family households, while 520 (49.9%) are nonfamily households. The most numerous type of family households are 2-person households, comprising 340, and the most common type of nonfamily households are 1-person households, comprising 425.
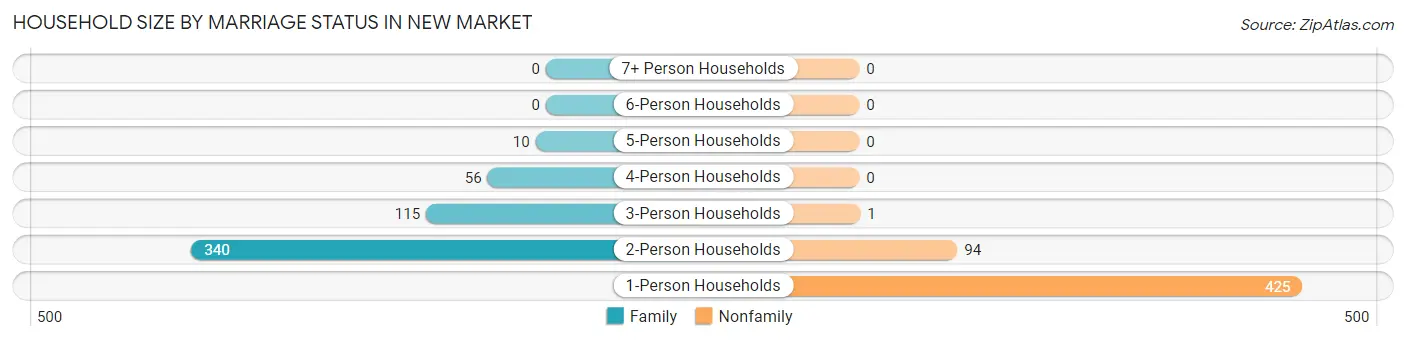
| Household Size | Family Households | Nonfamily Households |
| 1-Person Households | - | 425 (40.8%) |
| 2-Person Households | 340 (32.7%) | 94 (9.0%) |
| 3-Person Households | 115 (11.1%) | 1 (0.1%) |
| 4-Person Households | 56 (5.4%) | 0 (0.0%) |
| 5-Person Households | 10 (1.0%) | 0 (0.0%) |
| 6-Person Households | 0 (0.0%) | 0 (0.0%) |
| 7+ Person Households | 0 (0.0%) | 0 (0.0%) |
| Total | 521 (50.0%) | 520 (49.9%) |
Female Fertility in New Market
Fertility by Age in New Market
Average fertility rate in New Market is 21.0 births per 1,000 women. Women in the age bracket of 20 to 34 years have the highest fertility rate with 58.0 births per 1,000 women. Women in the age bracket of 20 to 34 years acount for 100.0% of all women with births.
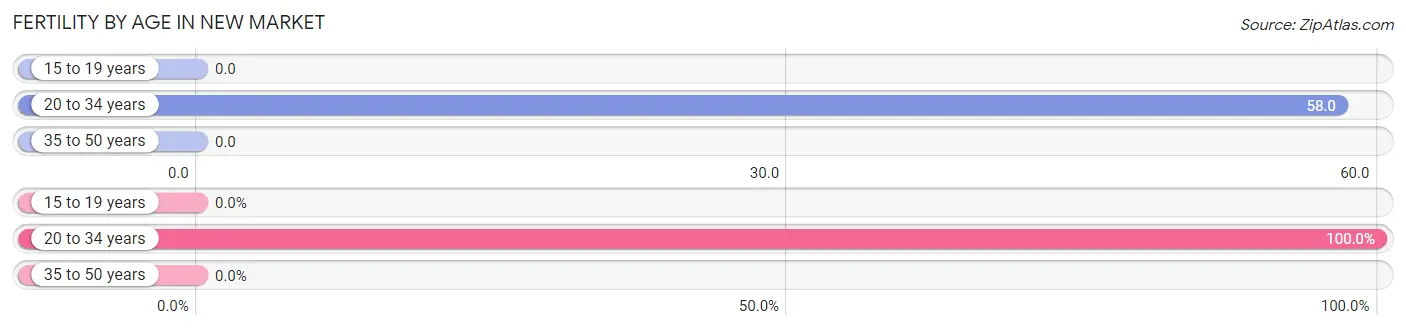
| Age Bracket | Women with Births | Births / 1,000 Women |
| 15 to 19 years | 0 (0.0%) | 0.0 |
| 20 to 34 years | 7 (100.0%) | 58.0 |
| 35 to 50 years | 0 (0.0%) | 0.0 |
| Total | 7 (100.0%) | 21.0 |
Fertility by Age by Marriage Status in New Market
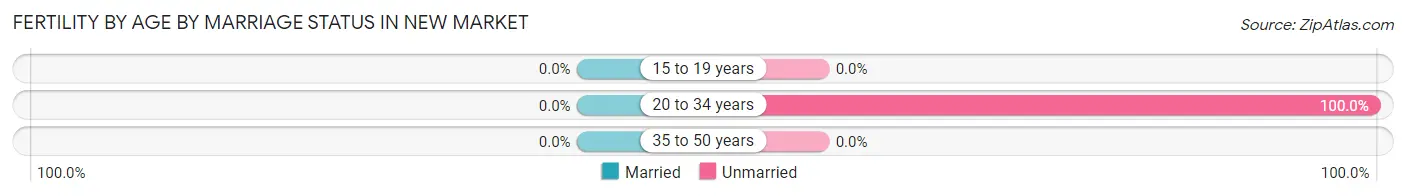
| Age Bracket | Married | Unmarried |
| 15 to 19 years | 0 (0.0%) | 0 (0.0%) |
| 20 to 34 years | 0 (0.0%) | 7 (100.0%) |
| 35 to 50 years | 0 (0.0%) | 0 (0.0%) |
| Total | 0 (0.0%) | 7 (100.0%) |
Fertility by Education in New Market
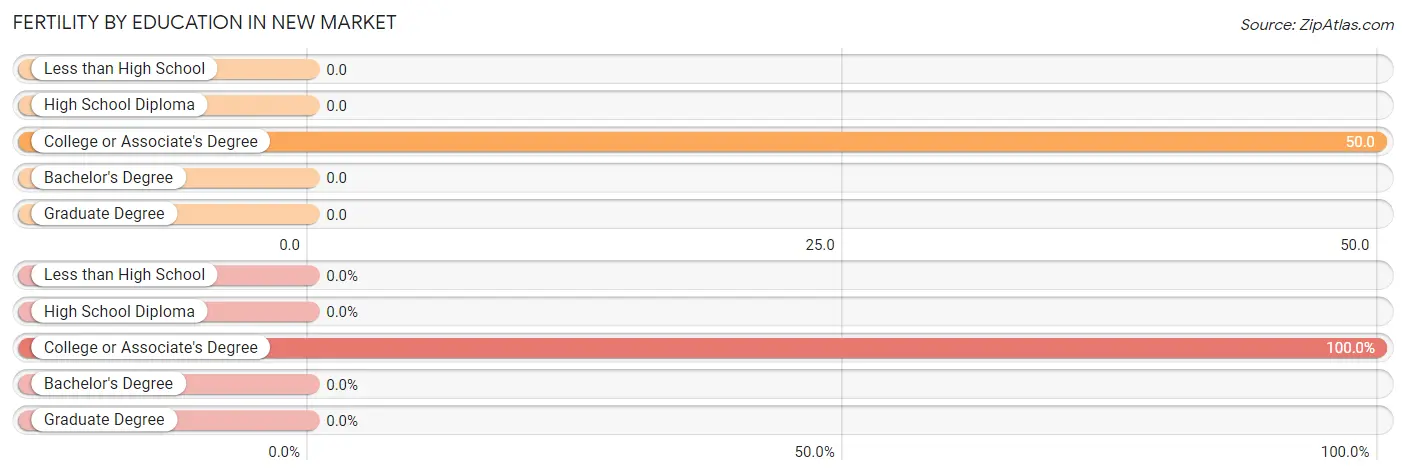
| Educational Attainment | Women with Births | Births / 1,000 Women |
| Less than High School | 0 (0.0%) | 0.0 |
| High School Diploma | 0 (0.0%) | 0.0 |
| College or Associate's Degree | 7 (100.0%) | 50.0 |
| Bachelor's Degree | 0 (0.0%) | 0.0 |
| Graduate Degree | 0 (0.0%) | 0.0 |
| Total | 7 (100.0%) | 21.0 |
Fertility by Education by Marriage Status in New Market
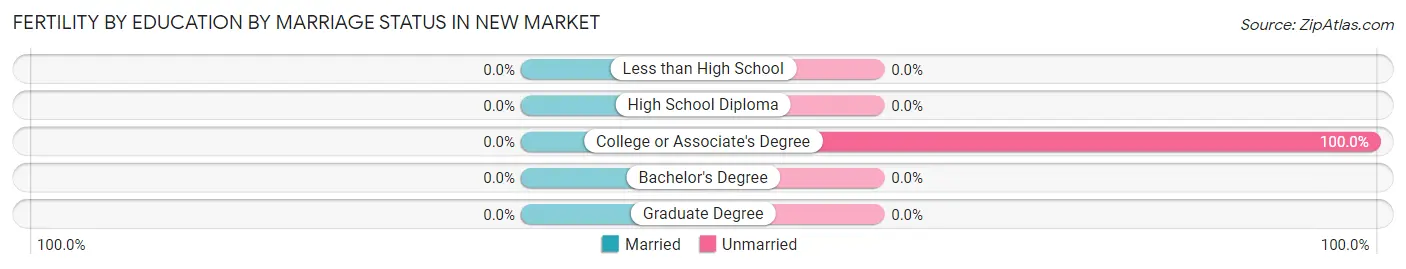
| Educational Attainment | Married | Unmarried |
| Less than High School | 0 (0.0%) | 0 (0.0%) |
| High School Diploma | 0 (0.0%) | 0 (0.0%) |
| College or Associate's Degree | 0 (0.0%) | 7 (100.0%) |
| Bachelor's Degree | 0 (0.0%) | 0 (0.0%) |
| Graduate Degree | 0 (0.0%) | 0 (0.0%) |
| Total | 0 (0.0%) | 7 (100.0%) |
Employment Characteristics in New Market
Employment by Class of Employer in New Market
Among the 981 employed individuals in New Market, private company employees (713 | 72.7%), self-employed (not incorporated) (59 | 6.0%), and local government employees (54 | 5.5%) make up the most common classes of employment.
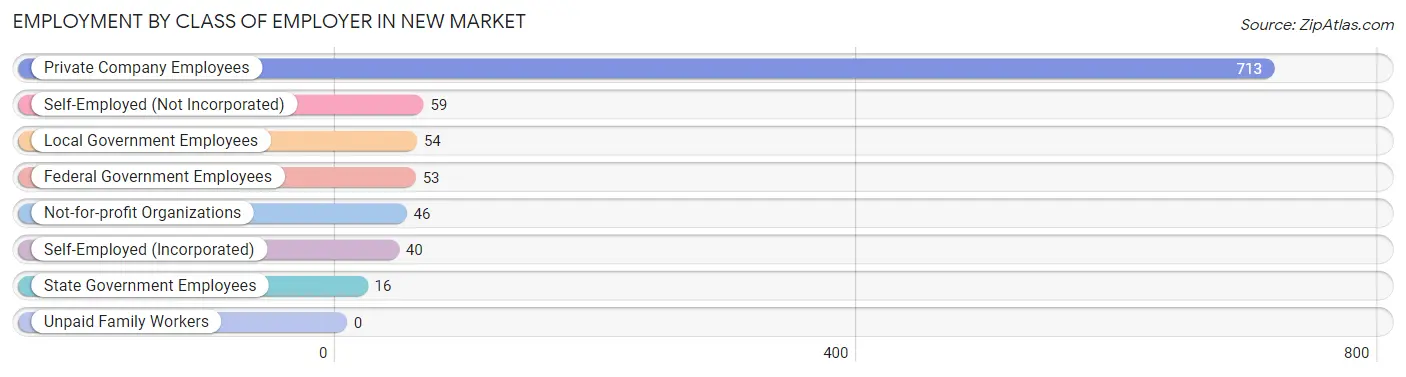
| Employer Class | # Employees | % Employees |
| Private Company Employees | 713 | 72.7% |
| Self-Employed (Incorporated) | 40 | 4.1% |
| Self-Employed (Not Incorporated) | 59 | 6.0% |
| Not-for-profit Organizations | 46 | 4.7% |
| Local Government Employees | 54 | 5.5% |
| State Government Employees | 16 | 1.6% |
| Federal Government Employees | 53 | 5.4% |
| Unpaid Family Workers | 0 | 0.0% |
| Total | 981 | 100.0% |
Employment Status by Age in New Market
According to the labor force statistics for New Market, out of the total population over 16 years of age (1,905), 52.5% or 1,000 individuals are in the labor force, with 1.9% or 19 of them unemployed. The age group with the highest labor force participation rate is 25 to 29 years, with 100.0% or 124 individuals in the labor force. Within the labor force, the 45 to 54 years age range has the highest percentage of unemployed individuals, with 9.5% or 10 of them being unemployed.
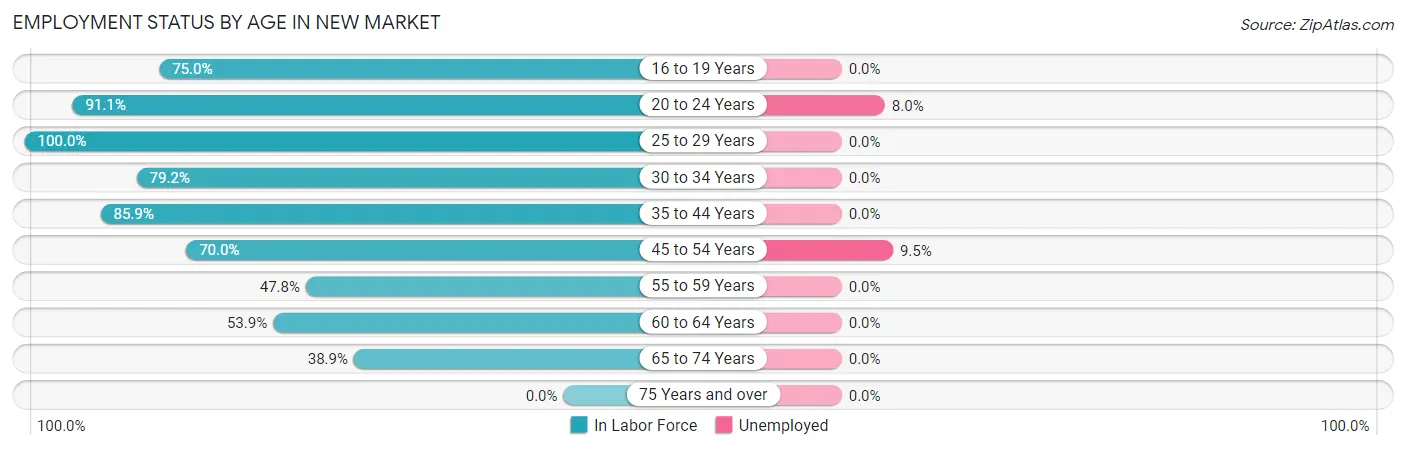
| Age Bracket | In Labor Force | Unemployed |
| 16 to 19 Years | 42 (75.0%) | 0 (0.0%) |
| 20 to 24 Years | 112 (91.1%) | 9 (8.0%) |
| 25 to 29 Years | 124 (100.0%) | 0 (0.0%) |
| 30 to 34 Years | 76 (79.2%) | 0 (0.0%) |
| 35 to 44 Years | 189 (85.9%) | 0 (0.0%) |
| 45 to 54 Years | 105 (70.0%) | 10 (9.5%) |
| 55 to 59 Years | 77 (47.8%) | 0 (0.0%) |
| 60 to 64 Years | 90 (53.9%) | 0 (0.0%) |
| 65 to 74 Years | 185 (38.9%) | 0 (0.0%) |
| 75 Years and over | 0 (0.0%) | 0 (0.0%) |
| Total | 1,000 (52.5%) | 19 (1.9%) |
Employment Status by Educational Attainment in New Market
According to labor force statistics for New Market, 72.0% of individuals (661) out of the total population between 25 and 64 years of age (918) are in the labor force, with 1.5% or 10 of them being unemployed. The group with the highest labor force participation rate are those with the educational attainment of college / associate degree, with 80.5% or 207 individuals in the labor force. Within the labor force, individuals with less than high school education have the highest percentage of unemployment, with 16.4% or 10 of them being unemployed.
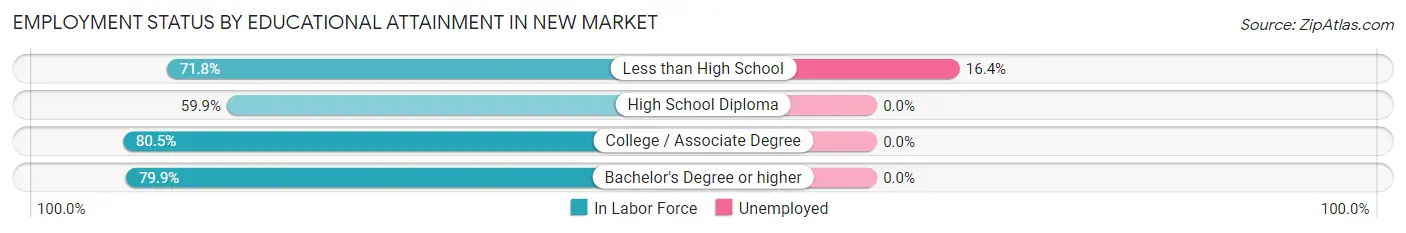
| Educational Attainment | In Labor Force | Unemployed |
| Less than High School | 61 (71.8%) | 14 (16.4%) |
| High School Diploma | 202 (59.9%) | 0 (0.0%) |
| College / Associate Degree | 207 (80.5%) | 0 (0.0%) |
| Bachelor's Degree or higher | 191 (79.9%) | 0 (0.0%) |
| Total | 661 (72.0%) | 14 (1.5%) |
Employment Occupations by Sex in New Market
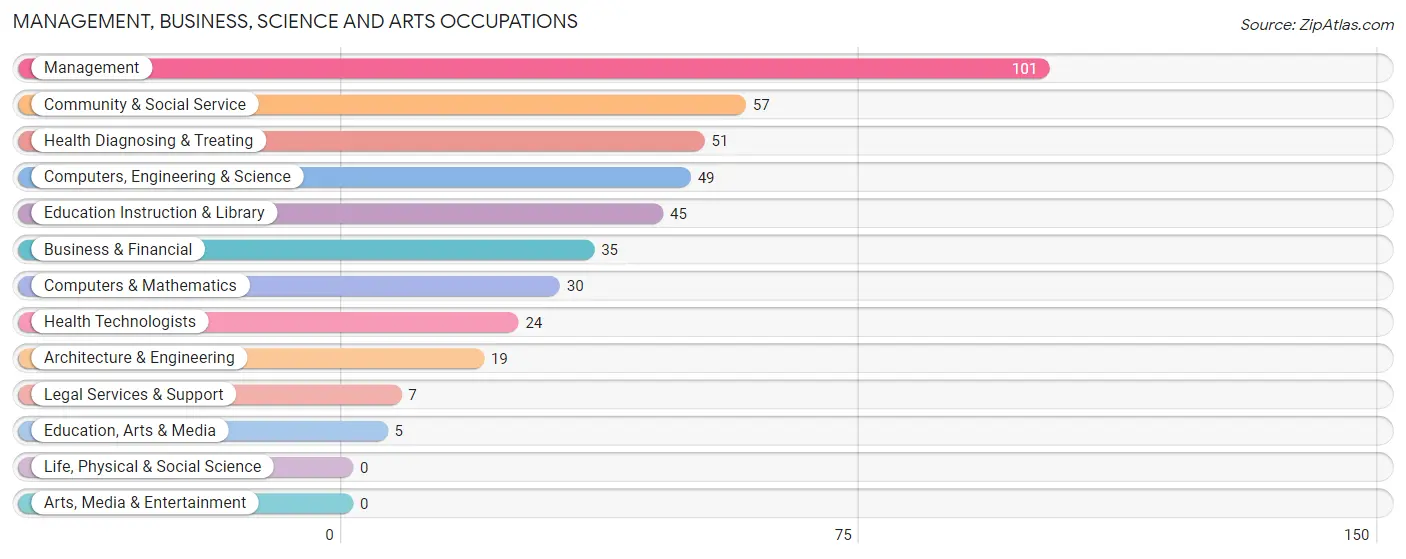
Management, Business, Science and Arts Occupations
The most common Management, Business, Science and Arts occupations in New Market are Management (101 | 10.3%), Community & Social Service (57 | 5.8%), Health Diagnosing & Treating (51 | 5.2%), Computers, Engineering & Science (49 | 5.0%), and Education Instruction & Library (45 | 4.6%).
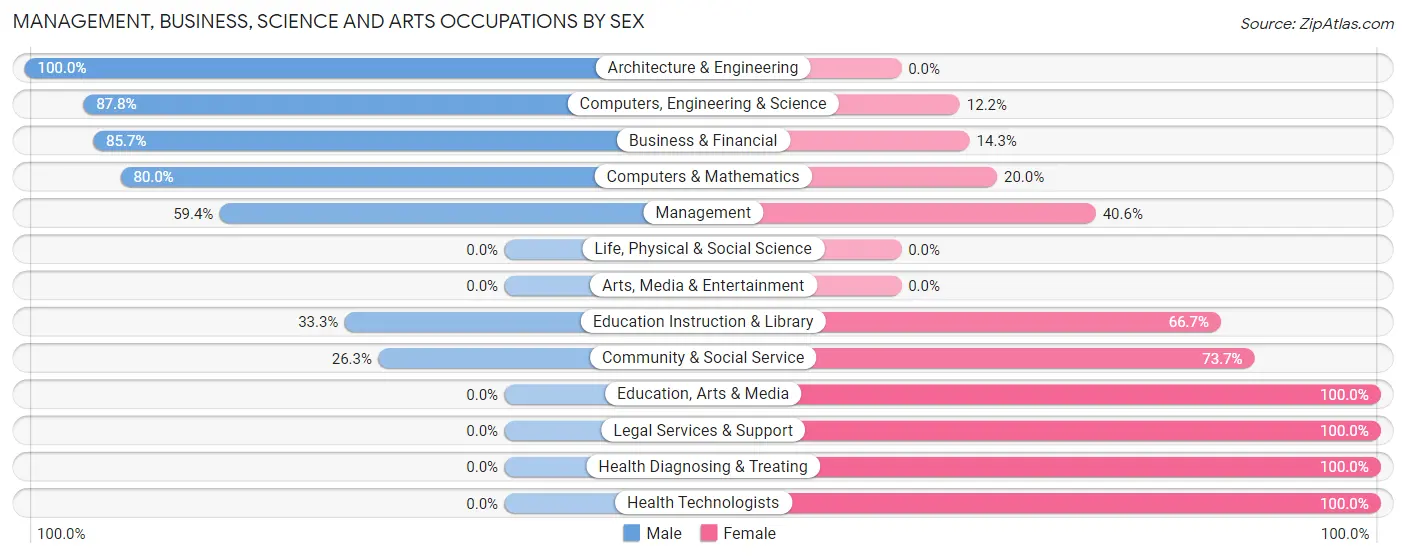
Management, Business, Science and Arts Occupations by Sex
Within the Management, Business, Science and Arts occupations in New Market, the most male-oriented occupations are Architecture & Engineering (100.0%), Computers, Engineering & Science (87.8%), and Business & Financial (85.7%), while the most female-oriented occupations are Education, Arts & Media (100.0%), Legal Services & Support (100.0%), and Health Diagnosing & Treating (100.0%).
| Occupation | Male | Female |
| Management | 60 (59.4%) | 41 (40.6%) |
| Business & Financial | 30 (85.7%) | 5 (14.3%) |
| Computers, Engineering & Science | 43 (87.8%) | 6 (12.2%) |
| Computers & Mathematics | 24 (80.0%) | 6 (20.0%) |
| Architecture & Engineering | 19 (100.0%) | 0 (0.0%) |
| Life, Physical & Social Science | 0 (0.0%) | 0 (0.0%) |
| Community & Social Service | 15 (26.3%) | 42 (73.7%) |
| Education, Arts & Media | 0 (0.0%) | 5 (100.0%) |
| Legal Services & Support | 0 (0.0%) | 7 (100.0%) |
| Education Instruction & Library | 15 (33.3%) | 30 (66.7%) |
| Arts, Media & Entertainment | 0 (0.0%) | 0 (0.0%) |
| Health Diagnosing & Treating | 0 (0.0%) | 51 (100.0%) |
| Health Technologists | 0 (0.0%) | 24 (100.0%) |
| Total (Category) | 148 (50.5%) | 145 (49.5%) |
| Total (Overall) | 582 (59.3%) | 399 (40.7%) |
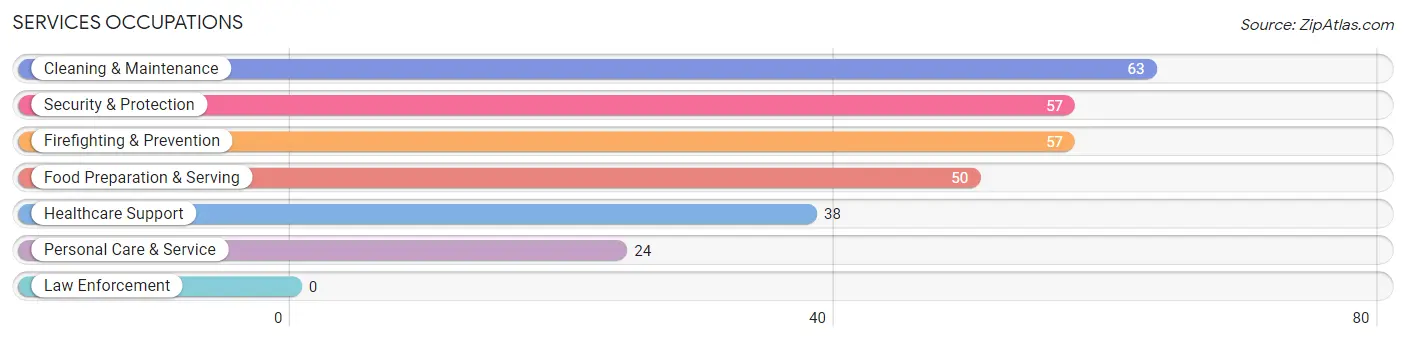
Services Occupations
The most common Services occupations in New Market are Cleaning & Maintenance (63 | 6.4%), Security & Protection (57 | 5.8%), Firefighting & Prevention (57 | 5.8%), Food Preparation & Serving (50 | 5.1%), and Healthcare Support (38 | 3.9%).
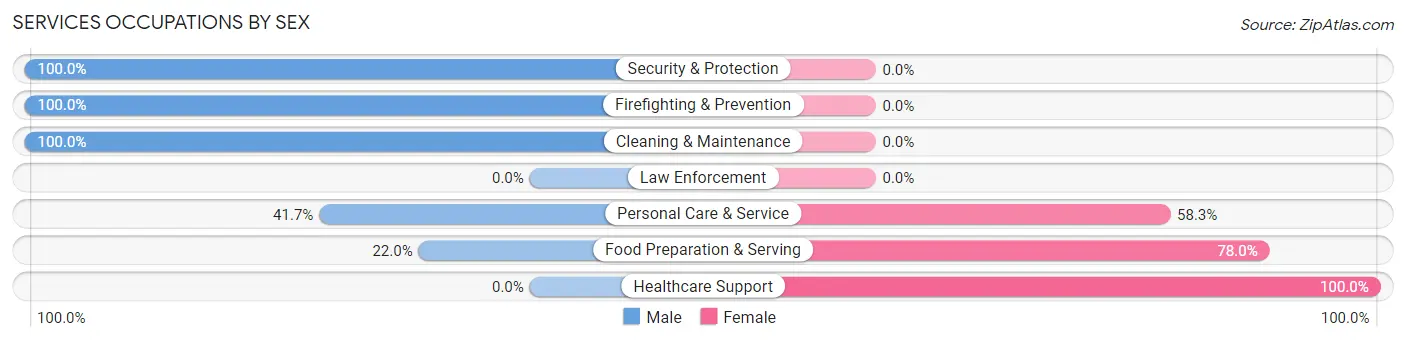
Services Occupations by Sex
Within the Services occupations in New Market, the most male-oriented occupations are Security & Protection (100.0%), Firefighting & Prevention (100.0%), and Cleaning & Maintenance (100.0%), while the most female-oriented occupations are Healthcare Support (100.0%), Food Preparation & Serving (78.0%), and Personal Care & Service (58.3%).
| Occupation | Male | Female |
| Healthcare Support | 0 (0.0%) | 38 (100.0%) |
| Security & Protection | 57 (100.0%) | 0 (0.0%) |
| Firefighting & Prevention | 57 (100.0%) | 0 (0.0%) |
| Law Enforcement | 0 (0.0%) | 0 (0.0%) |
| Food Preparation & Serving | 11 (22.0%) | 39 (78.0%) |
| Cleaning & Maintenance | 63 (100.0%) | 0 (0.0%) |
| Personal Care & Service | 10 (41.7%) | 14 (58.3%) |
| Total (Category) | 141 (60.8%) | 91 (39.2%) |
| Total (Overall) | 582 (59.3%) | 399 (40.7%) |
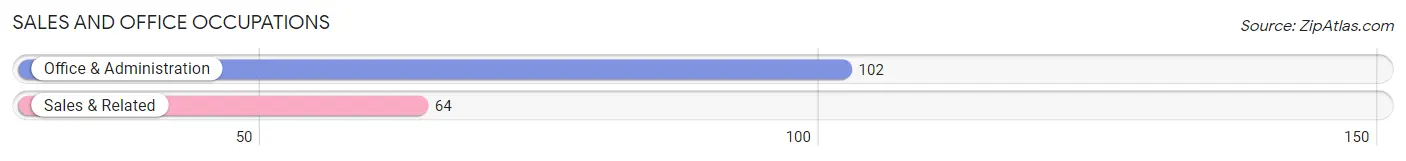
Sales and Office Occupations
The most common Sales and Office occupations in New Market are Office & Administration (102 | 10.4%), and Sales & Related (64 | 6.5%).
Sales and Office Occupations by Sex
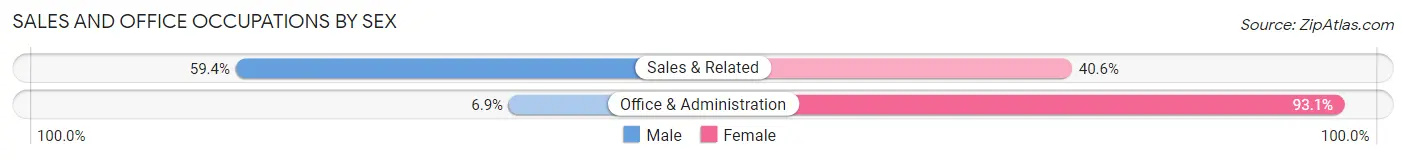
| Occupation | Male | Female |
| Sales & Related | 38 (59.4%) | 26 (40.6%) |
| Office & Administration | 7 (6.9%) | 95 (93.1%) |
| Total (Category) | 45 (27.1%) | 121 (72.9%) |
| Total (Overall) | 582 (59.3%) | 399 (40.7%) |
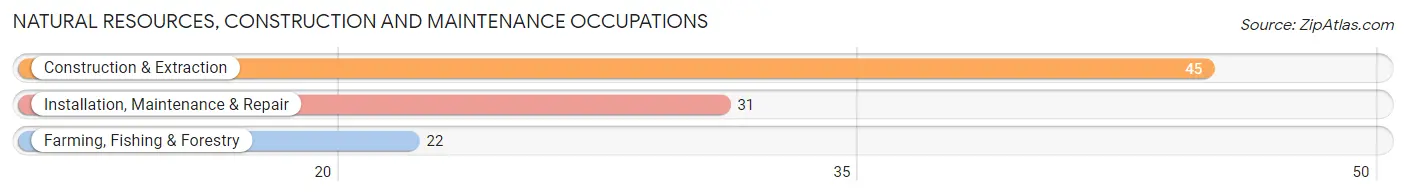
Natural Resources, Construction and Maintenance Occupations
The most common Natural Resources, Construction and Maintenance occupations in New Market are Construction & Extraction (45 | 4.6%), Installation, Maintenance & Repair (31 | 3.2%), and Farming, Fishing & Forestry (22 | 2.2%).
Natural Resources, Construction and Maintenance Occupations by Sex
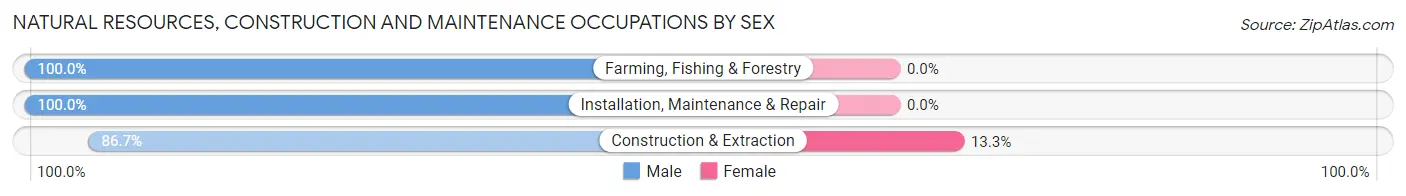
| Occupation | Male | Female |
| Farming, Fishing & Forestry | 22 (100.0%) | 0 (0.0%) |
| Construction & Extraction | 39 (86.7%) | 6 (13.3%) |
| Installation, Maintenance & Repair | 31 (100.0%) | 0 (0.0%) |
| Total (Category) | 92 (93.9%) | 6 (6.1%) |
| Total (Overall) | 582 (59.3%) | 399 (40.7%) |
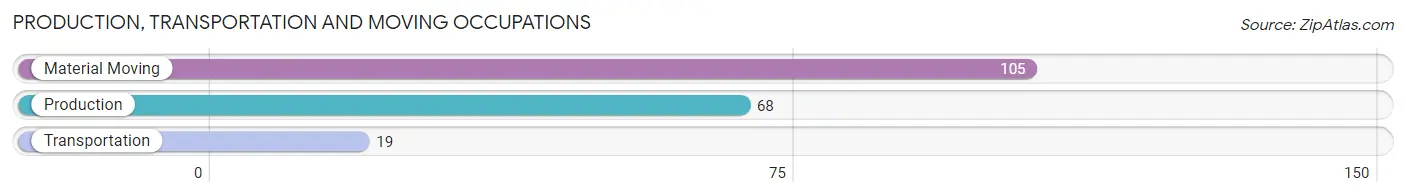
Production, Transportation and Moving Occupations
The most common Production, Transportation and Moving occupations in New Market are Material Moving (105 | 10.7%), Production (68 | 6.9%), and Transportation (19 | 1.9%).
Production, Transportation and Moving Occupations by Sex
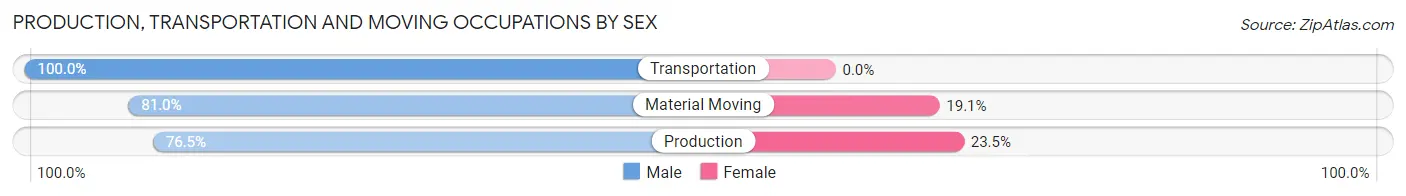
| Occupation | Male | Female |
| Production | 52 (76.5%) | 16 (23.5%) |
| Transportation | 19 (100.0%) | 0 (0.0%) |
| Material Moving | 85 (80.9%) | 20 (19.1%) |
| Total (Category) | 156 (81.2%) | 36 (18.8%) |
| Total (Overall) | 582 (59.3%) | 399 (40.7%) |
Employment Industries by Sex in New Market
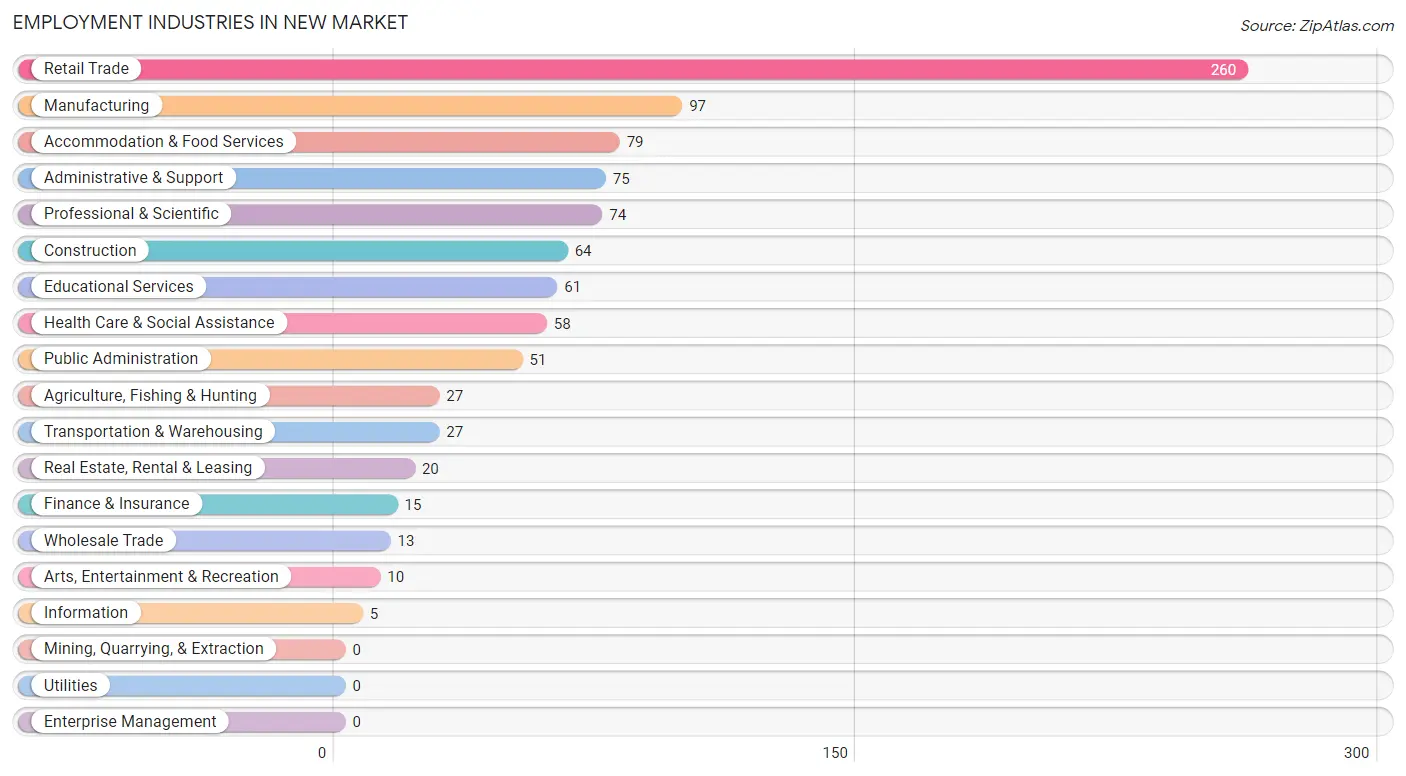
Employment Industries in New Market
The major employment industries in New Market include Retail Trade (260 | 26.5%), Manufacturing (97 | 9.9%), Accommodation & Food Services (79 | 8.1%), Administrative & Support (75 | 7.6%), and Professional & Scientific (74 | 7.5%).
Employment Industries by Sex in New Market
The New Market industries that see more men than women are Wholesale Trade (100.0%), Transportation & Warehousing (100.0%), and Information (100.0%), whereas the industries that tend to have a higher number of women are Health Care & Social Assistance (91.4%), Public Administration (54.9%), and Educational Services (54.1%).
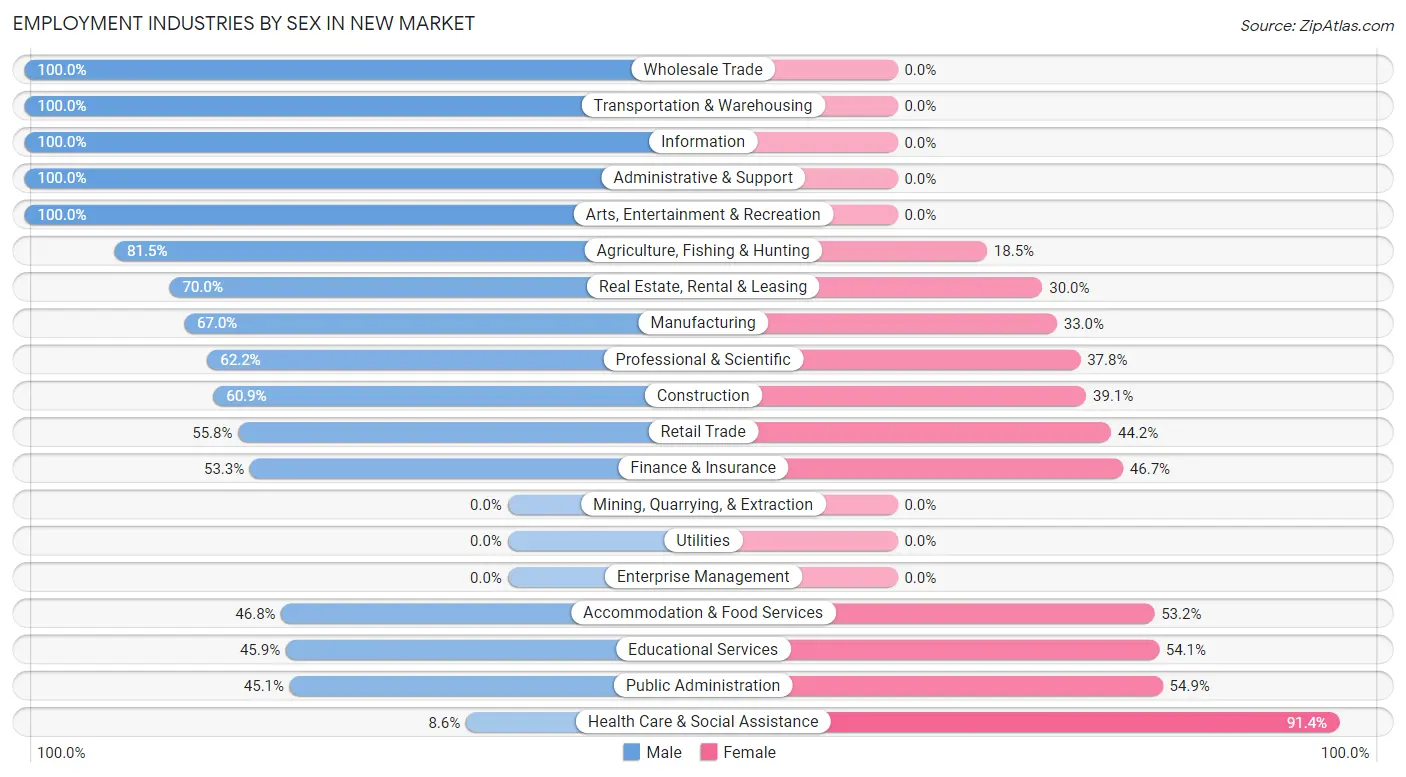
| Industry | Male | Female |
| Agriculture, Fishing & Hunting | 22 (81.5%) | 5 (18.5%) |
| Mining, Quarrying, & Extraction | 0 (0.0%) | 0 (0.0%) |
| Construction | 39 (60.9%) | 25 (39.1%) |
| Manufacturing | 65 (67.0%) | 32 (33.0%) |
| Wholesale Trade | 13 (100.0%) | 0 (0.0%) |
| Retail Trade | 145 (55.8%) | 115 (44.2%) |
| Transportation & Warehousing | 27 (100.0%) | 0 (0.0%) |
| Utilities | 0 (0.0%) | 0 (0.0%) |
| Information | 5 (100.0%) | 0 (0.0%) |
| Finance & Insurance | 8 (53.3%) | 7 (46.7%) |
| Real Estate, Rental & Leasing | 14 (70.0%) | 6 (30.0%) |
| Professional & Scientific | 46 (62.2%) | 28 (37.8%) |
| Enterprise Management | 0 (0.0%) | 0 (0.0%) |
| Administrative & Support | 75 (100.0%) | 0 (0.0%) |
| Educational Services | 28 (45.9%) | 33 (54.1%) |
| Health Care & Social Assistance | 5 (8.6%) | 53 (91.4%) |
| Arts, Entertainment & Recreation | 10 (100.0%) | 0 (0.0%) |
| Accommodation & Food Services | 37 (46.8%) | 42 (53.2%) |
| Public Administration | 23 (45.1%) | 28 (54.9%) |
| Total | 582 (59.3%) | 399 (40.7%) |
Education in New Market
School Enrollment in New Market
The most common levels of schooling among the 282 students in New Market are middle school (99 | 35.1%), elementary school (69 | 24.5%), and high school (52 | 18.4%).
| School Level | # Students | % Students |
| Nursery / Preschool | 0 | 0.0% |
| Kindergarten | 0 | 0.0% |
| Elementary School | 69 | 24.5% |
| Middle School | 99 | 35.1% |
| High School | 52 | 18.4% |
| College / Undergraduate | 31 | 11.0% |
| Graduate / Professional | 31 | 11.0% |
| Total | 282 | 100.0% |
School Enrollment by Age by Funding Source in New Market
Out of a total of 282 students who are enrolled in schools in New Market, 53 (18.8%) attend a private institution, while the remaining 229 (81.2%) are enrolled in public schools. The age group of 18 to 19 year olds has the highest likelihood of being enrolled in private schools, with 8 (53.3% in the age bracket) enrolled. Conversely, the age group of 20 to 24 year olds has the lowest likelihood of being enrolled in a private school, with 5 (100.0% in the age bracket) attending a public institution.
| Age Bracket | Public School | Private School |
| 3 to 4 Year Olds | 0 (0.0%) | 0 (0.0%) |
| 5 to 9 Year Old | 41 (75.9%) | 13 (24.1%) |
| 10 to 14 Year Olds | 106 (81.5%) | 24 (18.5%) |
| 15 to 17 Year Olds | 20 (71.4%) | 8 (28.6%) |
| 18 to 19 Year Olds | 7 (46.7%) | 8 (53.3%) |
| 20 to 24 Year Olds | 5 (100.0%) | 0 (0.0%) |
| 25 to 34 Year Olds | 16 (100.0%) | 0 (0.0%) |
| 35 Years and over | 34 (100.0%) | 0 (0.0%) |
| Total | 229 (81.2%) | 53 (18.8%) |
Educational Attainment by Field of Study in New Market
Business (101 | 23.1%), arts & humanities (75 | 17.1%), education (61 | 13.9%), liberal arts & history (55 | 12.6%), and science & technology (50 | 11.4%) are the most common fields of study among 438 individuals in New Market who have obtained a bachelor's degree or higher.
| Field of Study | # Graduates | % Graduates |
| Computers & Mathematics | 20 | 4.6% |
| Bio, Nature & Agricultural | 14 | 3.2% |
| Physical & Health Sciences | 7 | 1.6% |
| Psychology | 0 | 0.0% |
| Social Sciences | 36 | 8.2% |
| Engineering | 0 | 0.0% |
| Multidisciplinary Studies | 0 | 0.0% |
| Science & Technology | 50 | 11.4% |
| Business | 101 | 23.1% |
| Education | 61 | 13.9% |
| Literature & Languages | 3 | 0.7% |
| Liberal Arts & History | 55 | 12.6% |
| Visual & Performing Arts | 0 | 0.0% |
| Communications | 16 | 3.6% |
| Arts & Humanities | 75 | 17.1% |
| Total | 438 | 100.0% |
Transportation & Commute in New Market
Vehicle Availability by Sex in New Market
The most prevalent vehicle ownership categories in New Market are males with 2 vehicles (278, accounting for 47.8%) and females with 2 vehicles (137, making up 69.7%).
| Vehicles Available | Male | Female |
| No Vehicle | 0 (0.0%) | 0 (0.0%) |
| 1 Vehicle | 152 (26.1%) | 176 (44.1%) |
| 2 Vehicles | 278 (47.8%) | 137 (34.3%) |
| 3 Vehicles | 87 (14.9%) | 55 (13.8%) |
| 4 Vehicles | 10 (1.7%) | 0 (0.0%) |
| 5 or more Vehicles | 55 (9.5%) | 31 (7.8%) |
| Total | 582 (100.0%) | 399 (100.0%) |
Commute Time in New Market
The most frequently occuring commute durations in New Market are 30 to 34 minutes (169 commuters, 18.2%), 20 to 24 minutes (160 commuters, 17.3%), and 25 to 29 minutes (129 commuters, 13.9%).
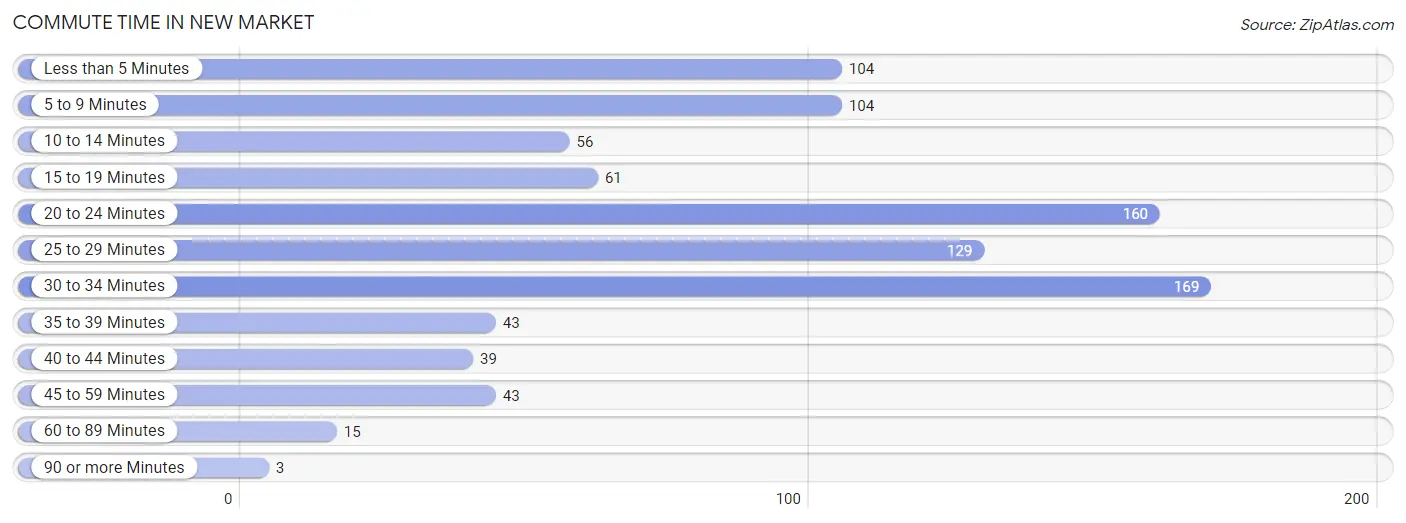
| Commute Time | # Commuters | % Commuters |
| Less than 5 Minutes | 104 | 11.2% |
| 5 to 9 Minutes | 104 | 11.2% |
| 10 to 14 Minutes | 56 | 6.0% |
| 15 to 19 Minutes | 61 | 6.6% |
| 20 to 24 Minutes | 160 | 17.3% |
| 25 to 29 Minutes | 129 | 13.9% |
| 30 to 34 Minutes | 169 | 18.2% |
| 35 to 39 Minutes | 43 | 4.6% |
| 40 to 44 Minutes | 39 | 4.2% |
| 45 to 59 Minutes | 43 | 4.6% |
| 60 to 89 Minutes | 15 | 1.6% |
| 90 or more Minutes | 3 | 0.3% |
Commute Time by Sex in New Market
The most common commute times in New Market are less than 5 minutes (104 commuters, 18.9%) for males and 30 to 34 minutes (118 commuters, 31.3%) for females.
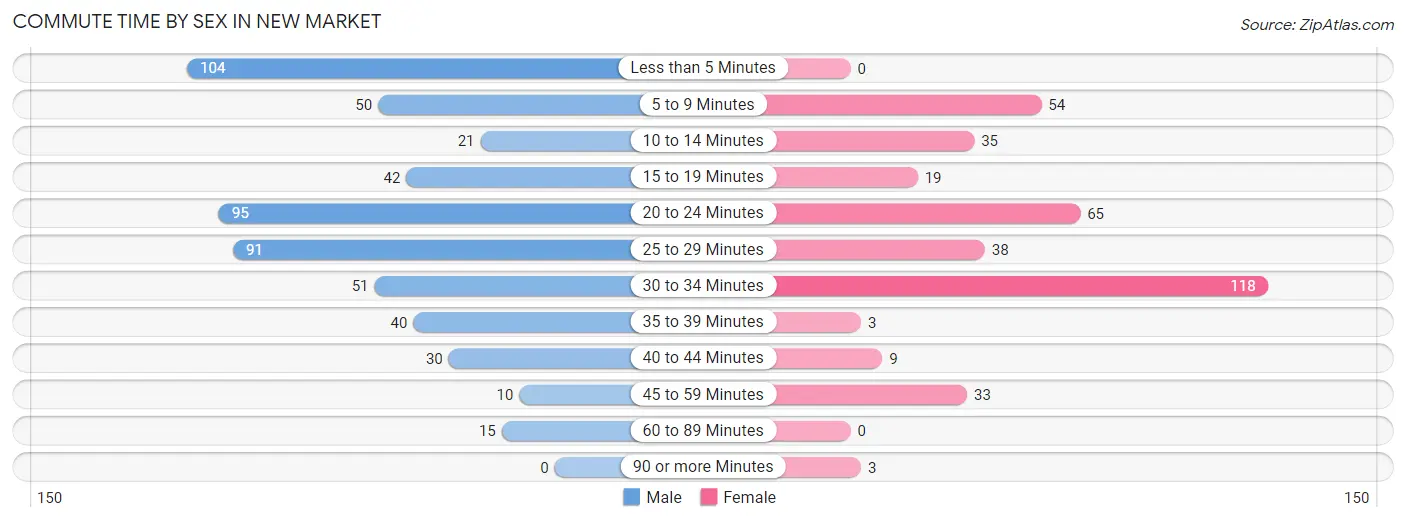
| Commute Time | Male | Female |
| Less than 5 Minutes | 104 (18.9%) | 0 (0.0%) |
| 5 to 9 Minutes | 50 (9.1%) | 54 (14.3%) |
| 10 to 14 Minutes | 21 (3.8%) | 35 (9.3%) |
| 15 to 19 Minutes | 42 (7.6%) | 19 (5.0%) |
| 20 to 24 Minutes | 95 (17.3%) | 65 (17.2%) |
| 25 to 29 Minutes | 91 (16.6%) | 38 (10.1%) |
| 30 to 34 Minutes | 51 (9.3%) | 118 (31.3%) |
| 35 to 39 Minutes | 40 (7.3%) | 3 (0.8%) |
| 40 to 44 Minutes | 30 (5.5%) | 9 (2.4%) |
| 45 to 59 Minutes | 10 (1.8%) | 33 (8.7%) |
| 60 to 89 Minutes | 15 (2.7%) | 0 (0.0%) |
| 90 or more Minutes | 0 (0.0%) | 3 (0.8%) |
Time of Departure to Work by Sex in New Market
The most frequent times of departure to work in New Market are 8:00 AM to 8:29 AM (166, 30.2%) for males and 7:30 AM to 7:59 AM (74, 19.6%) for females.
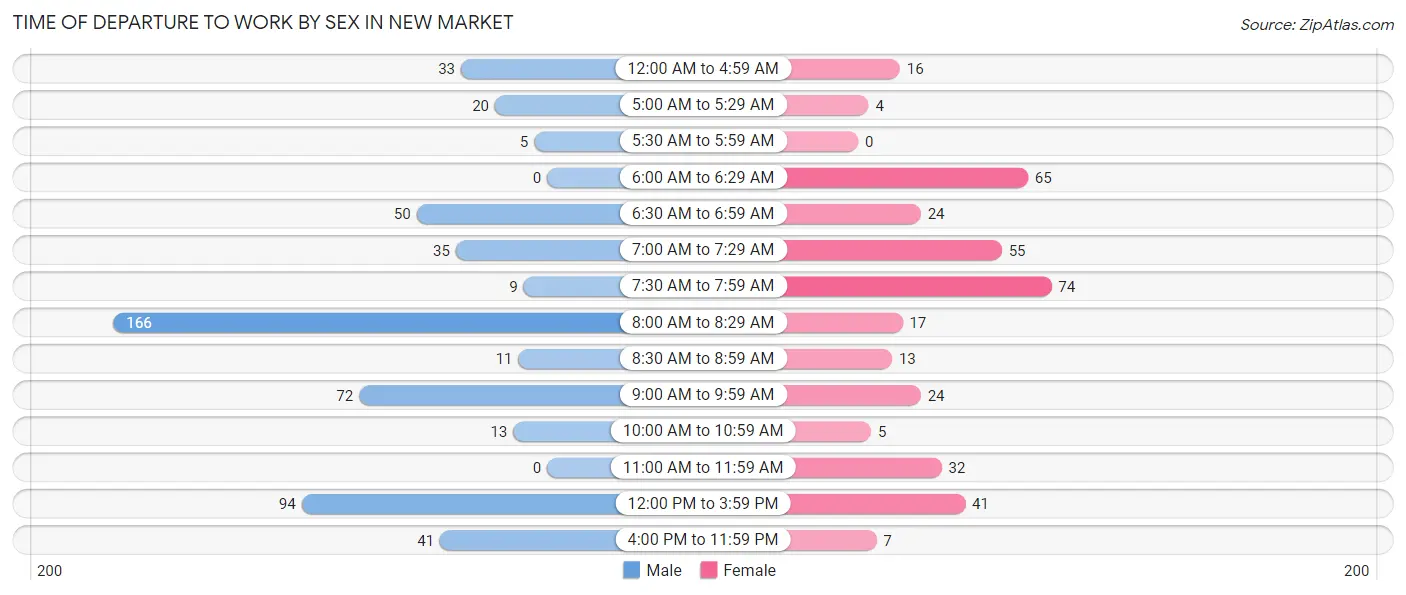
| Time of Departure | Male | Female |
| 12:00 AM to 4:59 AM | 33 (6.0%) | 16 (4.2%) |
| 5:00 AM to 5:29 AM | 20 (3.6%) | 4 (1.1%) |
| 5:30 AM to 5:59 AM | 5 (0.9%) | 0 (0.0%) |
| 6:00 AM to 6:29 AM | 0 (0.0%) | 65 (17.2%) |
| 6:30 AM to 6:59 AM | 50 (9.1%) | 24 (6.4%) |
| 7:00 AM to 7:29 AM | 35 (6.4%) | 55 (14.6%) |
| 7:30 AM to 7:59 AM | 9 (1.6%) | 74 (19.6%) |
| 8:00 AM to 8:29 AM | 166 (30.2%) | 17 (4.5%) |
| 8:30 AM to 8:59 AM | 11 (2.0%) | 13 (3.5%) |
| 9:00 AM to 9:59 AM | 72 (13.1%) | 24 (6.4%) |
| 10:00 AM to 10:59 AM | 13 (2.4%) | 5 (1.3%) |
| 11:00 AM to 11:59 AM | 0 (0.0%) | 32 (8.5%) |
| 12:00 PM to 3:59 PM | 94 (17.1%) | 41 (10.9%) |
| 4:00 PM to 11:59 PM | 41 (7.5%) | 7 (1.9%) |
| Total | 549 (100.0%) | 377 (100.0%) |
Housing Occupancy in New Market
Occupancy by Ownership in New Market
Of the total 1,041 dwellings in New Market, owner-occupied units account for 414 (39.8%), while renter-occupied units make up 627 (60.2%).
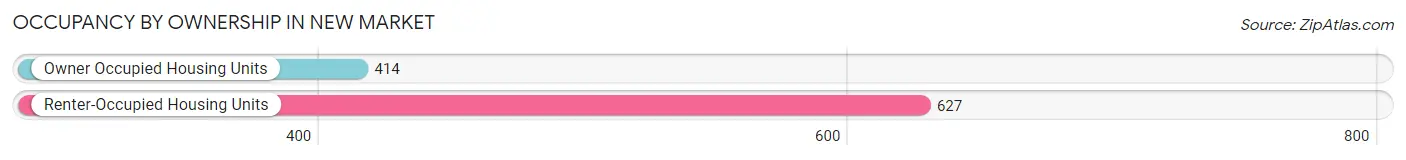
| Occupancy | # Housing Units | % Housing Units |
| Owner Occupied Housing Units | 414 | 39.8% |
| Renter-Occupied Housing Units | 627 | 60.2% |
| Total Occupied Housing Units | 1,041 | 100.0% |
Occupancy by Household Size in New Market
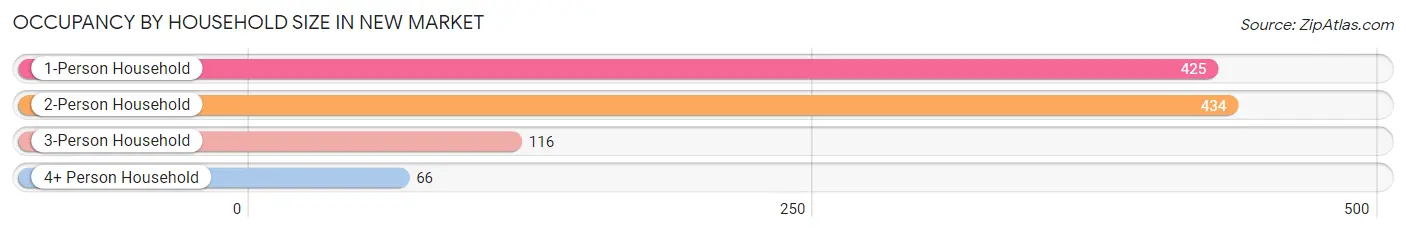
| Household Size | # Housing Units | % Housing Units |
| 1-Person Household | 425 | 40.8% |
| 2-Person Household | 434 | 41.7% |
| 3-Person Household | 116 | 11.1% |
| 4+ Person Household | 66 | 6.3% |
| Total Housing Units | 1,041 | 100.0% |
Occupancy by Ownership by Household Size in New Market
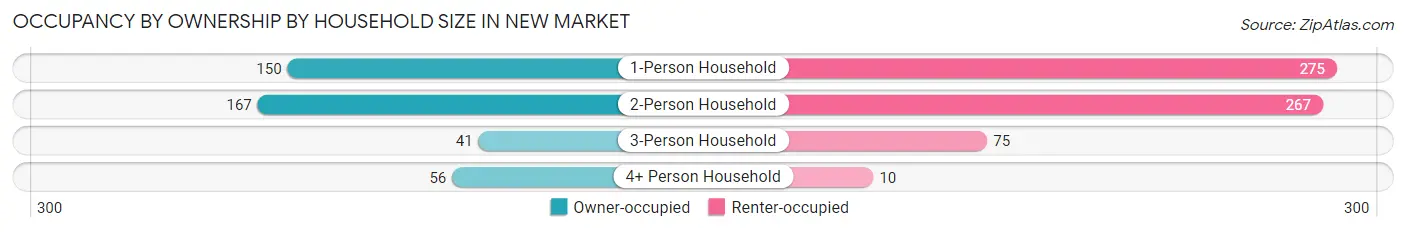
| Household Size | Owner-occupied | Renter-occupied |
| 1-Person Household | 150 (35.3%) | 275 (64.7%) |
| 2-Person Household | 167 (38.5%) | 267 (61.5%) |
| 3-Person Household | 41 (35.3%) | 75 (64.7%) |
| 4+ Person Household | 56 (84.9%) | 10 (15.1%) |
| Total Housing Units | 414 (39.8%) | 627 (60.2%) |
Occupancy by Educational Attainment in New Market
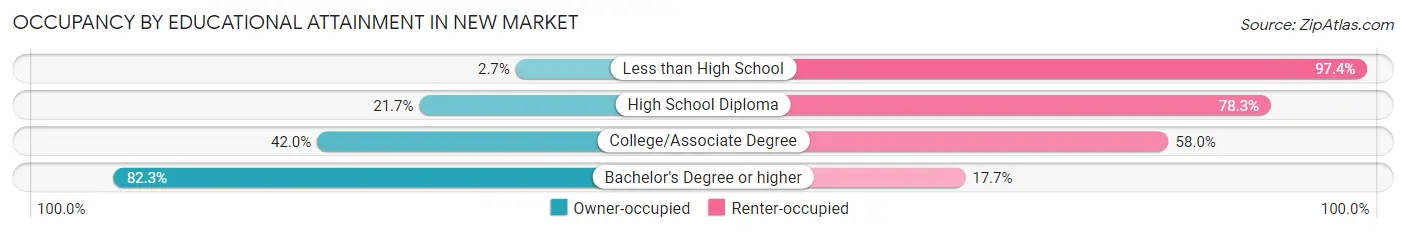
| Household Size | Owner-occupied | Renter-occupied |
| Less than High School | 3 (2.6%) | 110 (97.4%) |
| High School Diploma | 85 (21.7%) | 306 (78.3%) |
| College/Associate Degree | 121 (42.0%) | 167 (58.0%) |
| Bachelor's Degree or higher | 205 (82.3%) | 44 (17.7%) |
Occupancy by Age of Householder in New Market
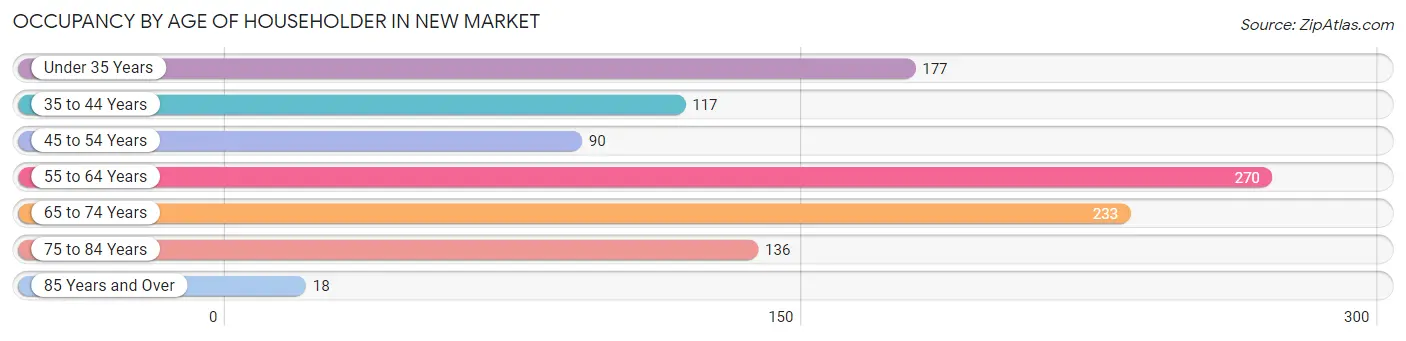
| Age Bracket | # Households | % Households |
| Under 35 Years | 177 | 17.0% |
| 35 to 44 Years | 117 | 11.2% |
| 45 to 54 Years | 90 | 8.6% |
| 55 to 64 Years | 270 | 25.9% |
| 65 to 74 Years | 233 | 22.4% |
| 75 to 84 Years | 136 | 13.1% |
| 85 Years and Over | 18 | 1.7% |
| Total | 1,041 | 100.0% |
Housing Finances in New Market
Median Income by Occupancy in New Market
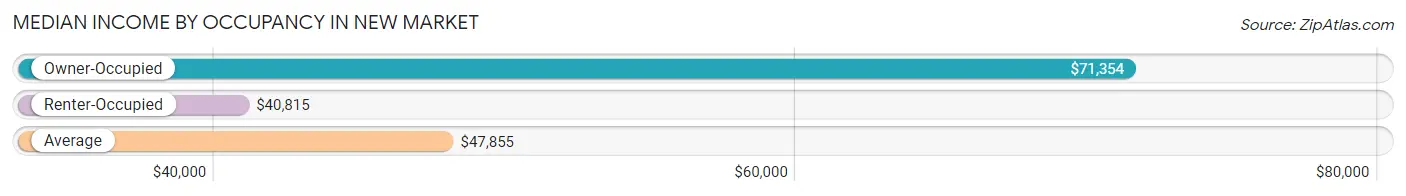
| Occupancy Type | # Households | Median Income |
| Owner-Occupied | 414 (39.8%) | $71,354 |
| Renter-Occupied | 627 (60.2%) | $40,815 |
| Average | 1,041 (100.0%) | $47,855 |
Occupancy by Householder Income Bracket in New Market
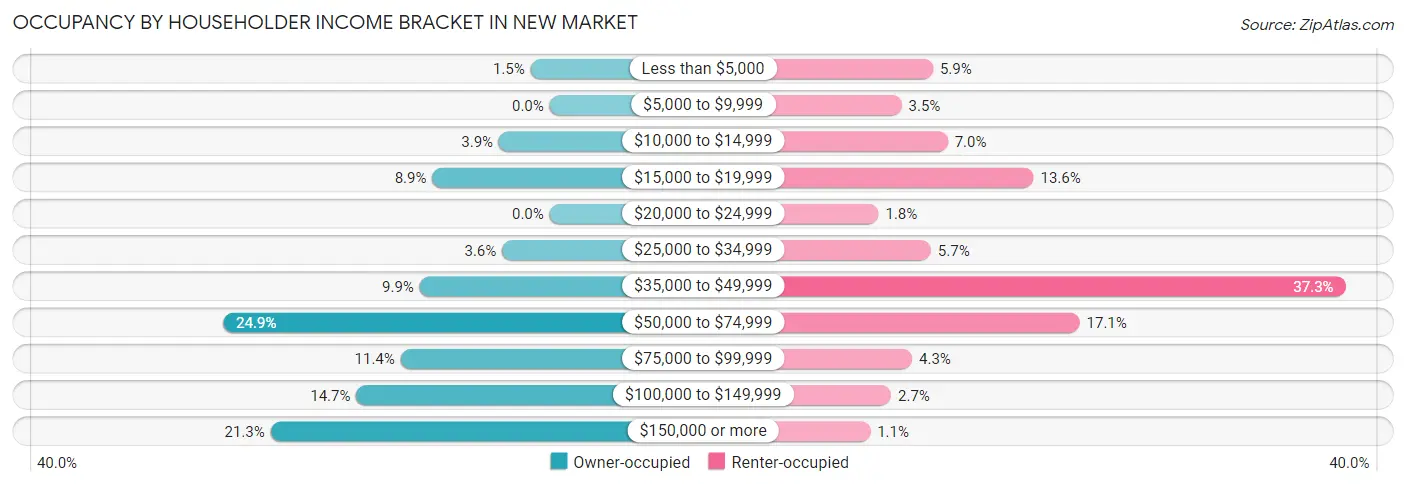
| Income Bracket | Owner-occupied | Renter-occupied |
| Less than $5,000 | 6 (1.5%) | 37 (5.9%) |
| $5,000 to $9,999 | 0 (0.0%) | 22 (3.5%) |
| $10,000 to $14,999 | 16 (3.9%) | 44 (7.0%) |
| $15,000 to $19,999 | 37 (8.9%) | 85 (13.6%) |
| $20,000 to $24,999 | 0 (0.0%) | 11 (1.8%) |
| $25,000 to $34,999 | 15 (3.6%) | 36 (5.7%) |
| $35,000 to $49,999 | 41 (9.9%) | 234 (37.3%) |
| $50,000 to $74,999 | 103 (24.9%) | 107 (17.1%) |
| $75,000 to $99,999 | 47 (11.4%) | 27 (4.3%) |
| $100,000 to $149,999 | 61 (14.7%) | 17 (2.7%) |
| $150,000 or more | 88 (21.3%) | 7 (1.1%) |
| Total | 414 (100.0%) | 627 (100.0%) |
Monthly Housing Cost Tiers in New Market
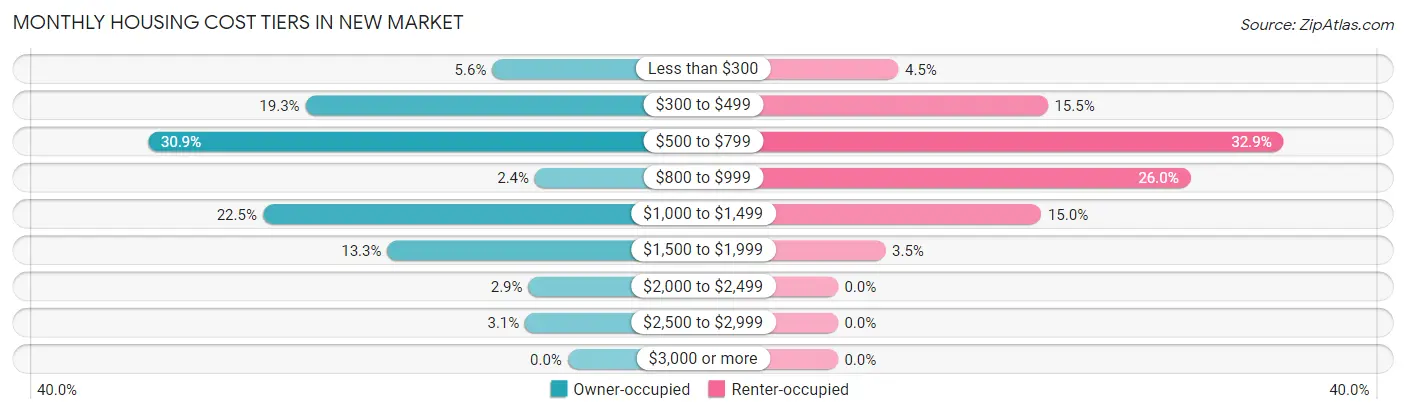
| Monthly Cost | Owner-occupied | Renter-occupied |
| Less than $300 | 23 (5.6%) | 28 (4.5%) |
| $300 to $499 | 80 (19.3%) | 97 (15.5%) |
| $500 to $799 | 128 (30.9%) | 206 (32.9%) |
| $800 to $999 | 10 (2.4%) | 163 (26.0%) |
| $1,000 to $1,499 | 93 (22.5%) | 94 (15.0%) |
| $1,500 to $1,999 | 55 (13.3%) | 22 (3.5%) |
| $2,000 to $2,499 | 12 (2.9%) | 0 (0.0%) |
| $2,500 to $2,999 | 13 (3.1%) | 0 (0.0%) |
| $3,000 or more | 0 (0.0%) | 0 (0.0%) |
| Total | 414 (100.0%) | 627 (100.0%) |
Physical Housing Characteristics in New Market
Housing Structures in New Market
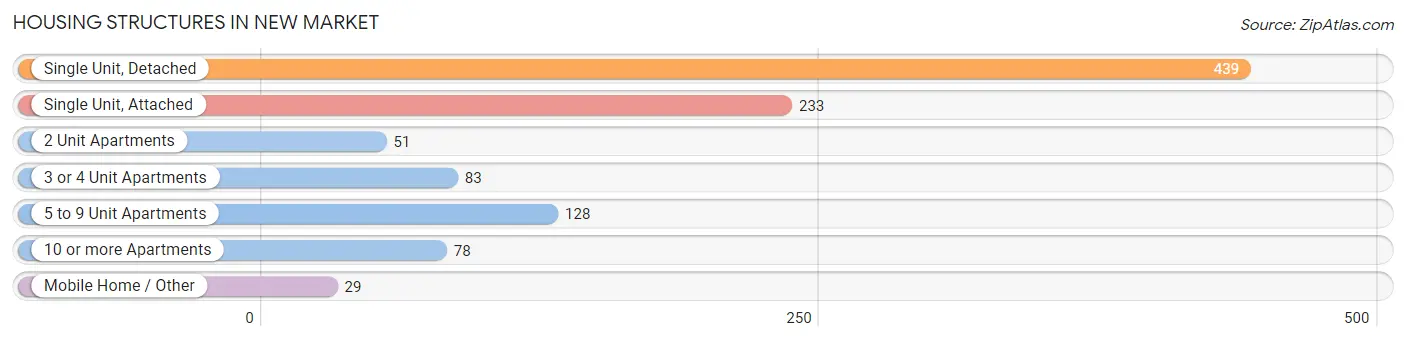
| Structure Type | # Housing Units | % Housing Units |
| Single Unit, Detached | 439 | 42.2% |
| Single Unit, Attached | 233 | 22.4% |
| 2 Unit Apartments | 51 | 4.9% |
| 3 or 4 Unit Apartments | 83 | 8.0% |
| 5 to 9 Unit Apartments | 128 | 12.3% |
| 10 or more Apartments | 78 | 7.5% |
| Mobile Home / Other | 29 | 2.8% |
| Total | 1,041 | 100.0% |
Housing Structures by Occupancy in New Market
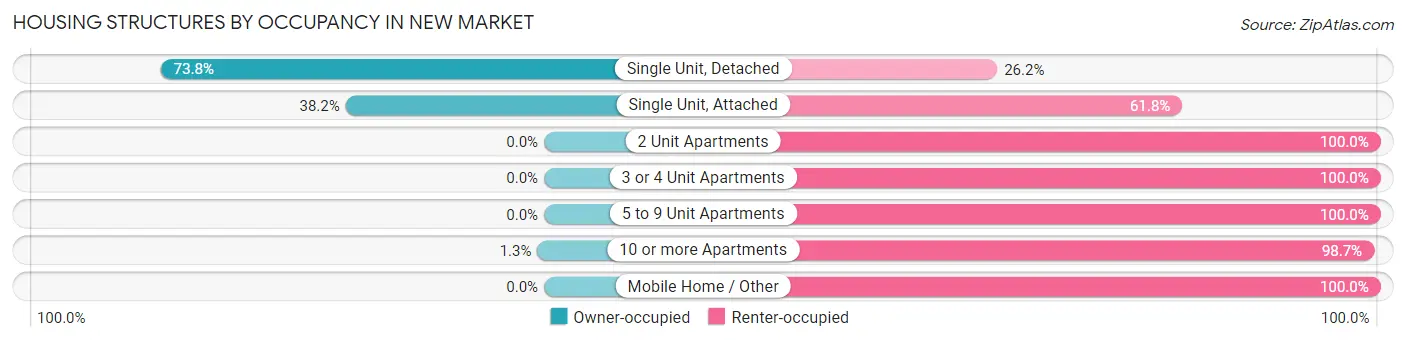
| Structure Type | Owner-occupied | Renter-occupied |
| Single Unit, Detached | 324 (73.8%) | 115 (26.2%) |
| Single Unit, Attached | 89 (38.2%) | 144 (61.8%) |
| 2 Unit Apartments | 0 (0.0%) | 51 (100.0%) |
| 3 or 4 Unit Apartments | 0 (0.0%) | 83 (100.0%) |
| 5 to 9 Unit Apartments | 0 (0.0%) | 128 (100.0%) |
| 10 or more Apartments | 1 (1.3%) | 77 (98.7%) |
| Mobile Home / Other | 0 (0.0%) | 29 (100.0%) |
| Total | 414 (39.8%) | 627 (60.2%) |
Housing Structures by Number of Rooms in New Market
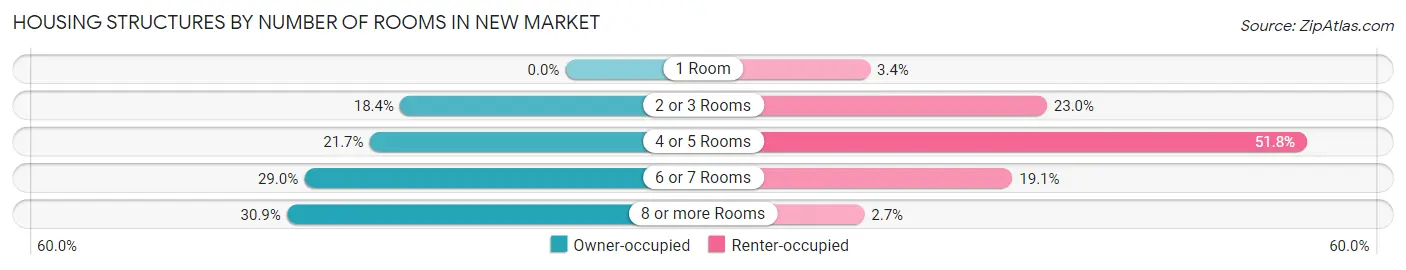
| Number of Rooms | Owner-occupied | Renter-occupied |
| 1 Room | 0 (0.0%) | 21 (3.4%) |
| 2 or 3 Rooms | 76 (18.4%) | 144 (23.0%) |
| 4 or 5 Rooms | 90 (21.7%) | 325 (51.8%) |
| 6 or 7 Rooms | 120 (29.0%) | 120 (19.1%) |
| 8 or more Rooms | 128 (30.9%) | 17 (2.7%) |
| Total | 414 (100.0%) | 627 (100.0%) |
Housing Structure by Heating Type in New Market
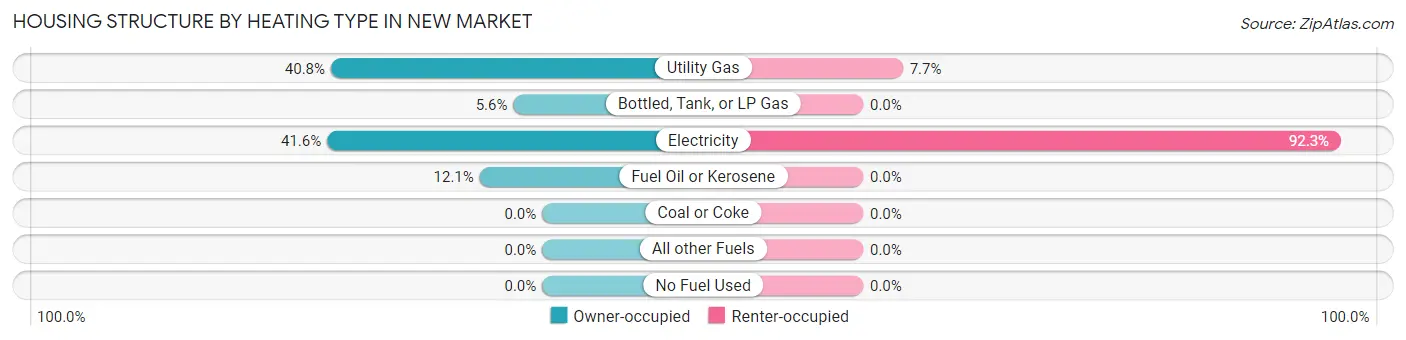
| Heating Type | Owner-occupied | Renter-occupied |
| Utility Gas | 169 (40.8%) | 48 (7.7%) |
| Bottled, Tank, or LP Gas | 23 (5.6%) | 0 (0.0%) |
| Electricity | 172 (41.5%) | 579 (92.3%) |
| Fuel Oil or Kerosene | 50 (12.1%) | 0 (0.0%) |
| Coal or Coke | 0 (0.0%) | 0 (0.0%) |
| All other Fuels | 0 (0.0%) | 0 (0.0%) |
| No Fuel Used | 0 (0.0%) | 0 (0.0%) |
| Total | 414 (100.0%) | 627 (100.0%) |
Household Vehicle Usage in New Market
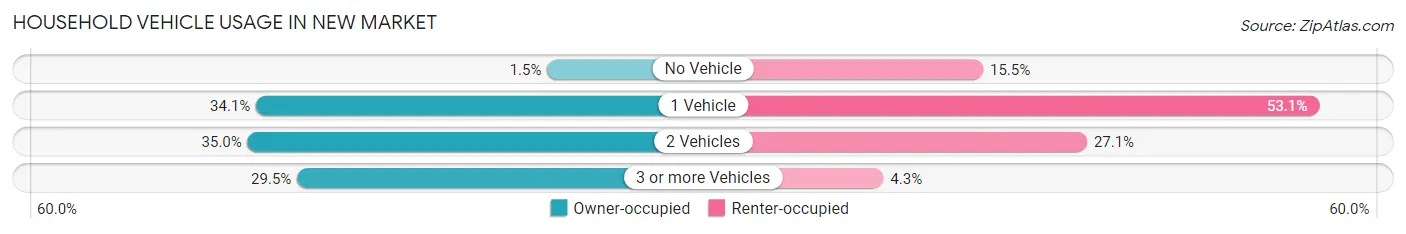
| Vehicles per Household | Owner-occupied | Renter-occupied |
| No Vehicle | 6 (1.5%) | 97 (15.5%) |
| 1 Vehicle | 141 (34.1%) | 333 (53.1%) |
| 2 Vehicles | 145 (35.0%) | 170 (27.1%) |
| 3 or more Vehicles | 122 (29.5%) | 27 (4.3%) |
| Total | 414 (100.0%) | 627 (100.0%) |
Real Estate & Mortgages in New Market
Real Estate and Mortgage Overview in New Market
| Characteristic | Without Mortgage | With Mortgage |
| Housing Units | 166 | 248 |
| Median Property Value | $316,000 | $212,500 |
| Median Household Income | $71,389 | $64 |
| Monthly Housing Costs | $515 | $0 |
| Real Estate Taxes | $1,924 | $10 |
Property Value by Mortgage Status in New Market
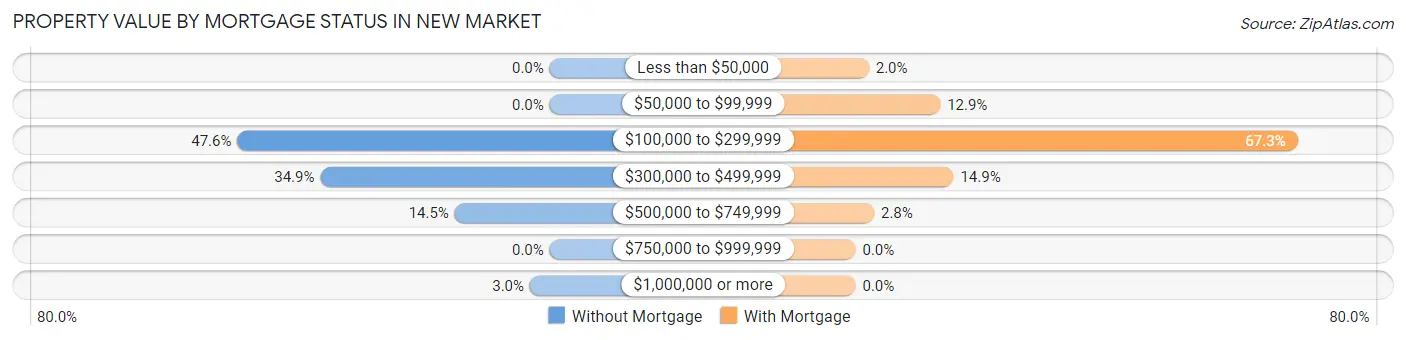
| Property Value | Without Mortgage | With Mortgage |
| Less than $50,000 | 0 (0.0%) | 5 (2.0%) |
| $50,000 to $99,999 | 0 (0.0%) | 32 (12.9%) |
| $100,000 to $299,999 | 79 (47.6%) | 167 (67.3%) |
| $300,000 to $499,999 | 58 (34.9%) | 37 (14.9%) |
| $500,000 to $749,999 | 24 (14.5%) | 7 (2.8%) |
| $750,000 to $999,999 | 0 (0.0%) | 0 (0.0%) |
| $1,000,000 or more | 5 (3.0%) | 0 (0.0%) |
| Total | 166 (100.0%) | 248 (100.0%) |
Household Income by Mortgage Status in New Market
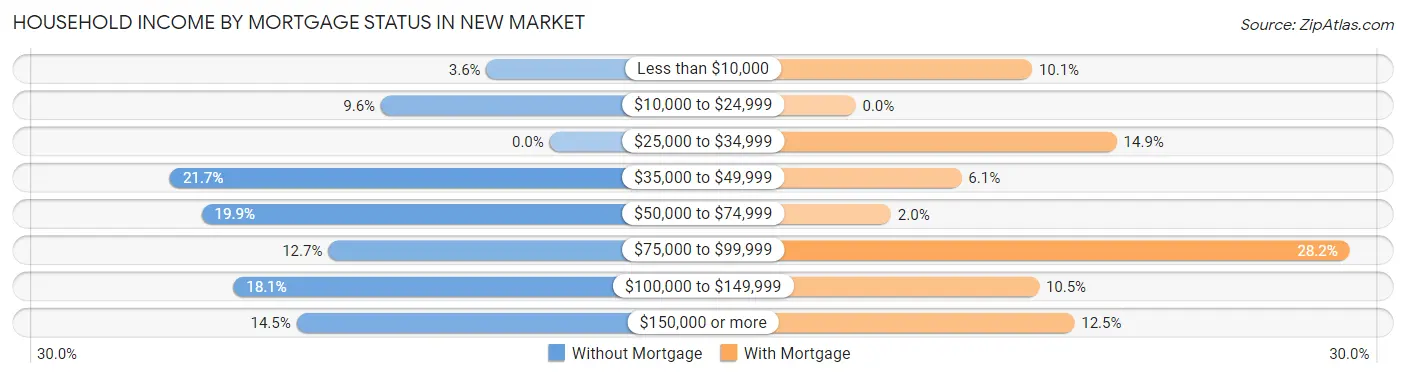
| Household Income | Without Mortgage | With Mortgage |
| Less than $10,000 | 6 (3.6%) | 25 (10.1%) |
| $10,000 to $24,999 | 16 (9.6%) | 0 (0.0%) |
| $25,000 to $34,999 | 0 (0.0%) | 37 (14.9%) |
| $35,000 to $49,999 | 36 (21.7%) | 15 (6.0%) |
| $50,000 to $74,999 | 33 (19.9%) | 5 (2.0%) |
| $75,000 to $99,999 | 21 (12.7%) | 70 (28.2%) |
| $100,000 to $149,999 | 30 (18.1%) | 26 (10.5%) |
| $150,000 or more | 24 (14.5%) | 31 (12.5%) |
| Total | 166 (100.0%) | 248 (100.0%) |
Property Value to Household Income Ratio in New Market
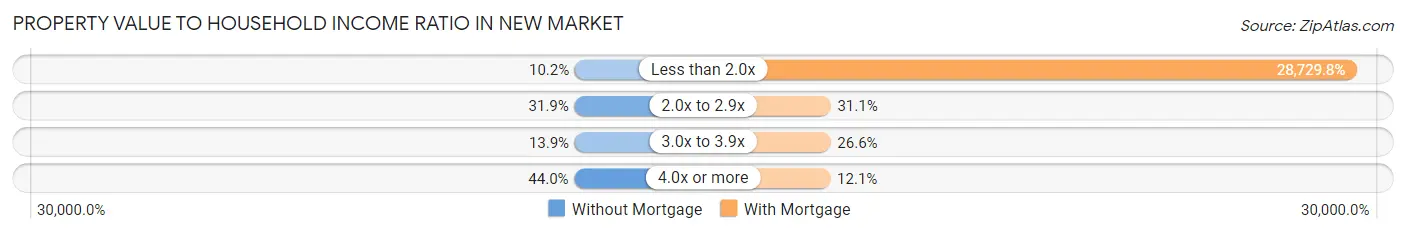
| Value-to-Income Ratio | Without Mortgage | With Mortgage |
| Less than 2.0x | 17 (10.2%) | 71,250 (28,729.8%) |
| 2.0x to 2.9x | 53 (31.9%) | 77 (31.0%) |
| 3.0x to 3.9x | 23 (13.9%) | 66 (26.6%) |
| 4.0x or more | 73 (44.0%) | 30 (12.1%) |
| Total | 166 (100.0%) | 248 (100.0%) |
Real Estate Taxes by Mortgage Status in New Market
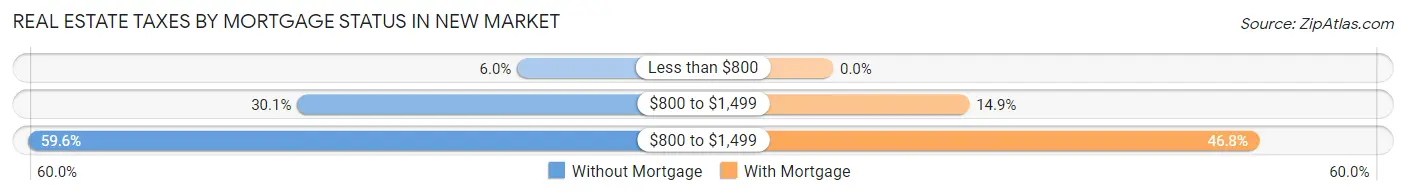
| Property Taxes | Without Mortgage | With Mortgage |
| Less than $800 | 10 (6.0%) | 0 (0.0%) |
| $800 to $1,499 | 50 (30.1%) | 37 (14.9%) |
| $800 to $1,499 | 99 (59.6%) | 116 (46.8%) |
| Total | 166 (100.0%) | 248 (100.0%) |
Health & Disability in New Market
Health Insurance Coverage by Age in New Market
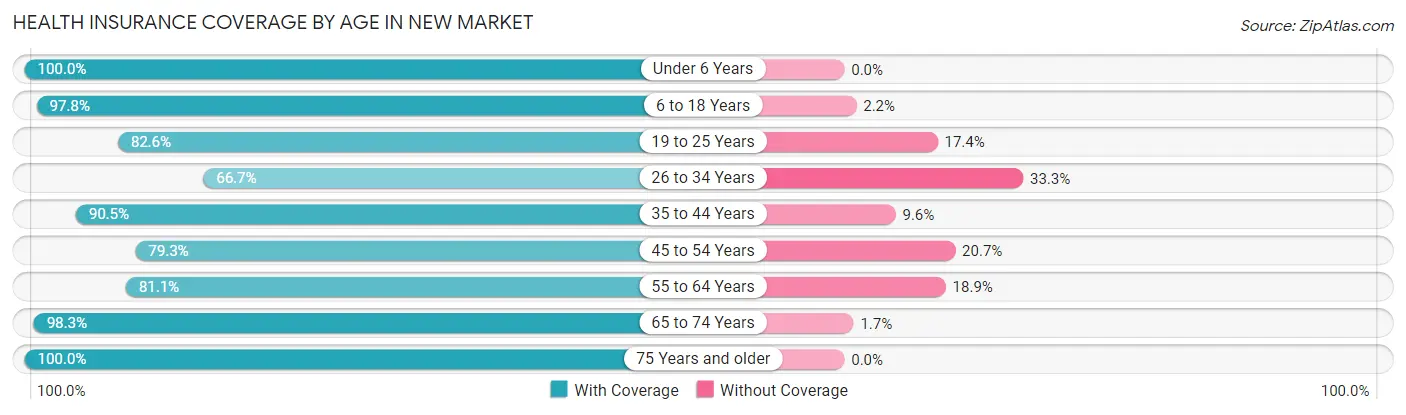
| Age Bracket | With Coverage | Without Coverage |
| Under 6 Years | 68 (100.0%) | 0 (0.0%) |
| 6 to 18 Years | 219 (97.8%) | 5 (2.2%) |
| 19 to 25 Years | 152 (82.6%) | 32 (17.4%) |
| 26 to 34 Years | 120 (66.7%) | 60 (33.3%) |
| 35 to 44 Years | 199 (90.4%) | 21 (9.6%) |
| 45 to 54 Years | 119 (79.3%) | 31 (20.7%) |
| 55 to 64 Years | 266 (81.1%) | 62 (18.9%) |
| 65 to 74 Years | 460 (98.3%) | 8 (1.7%) |
| 75 Years and older | 228 (100.0%) | 0 (0.0%) |
| Total | 1,831 (89.3%) | 219 (10.7%) |
Health Insurance Coverage by Citizenship Status in New Market
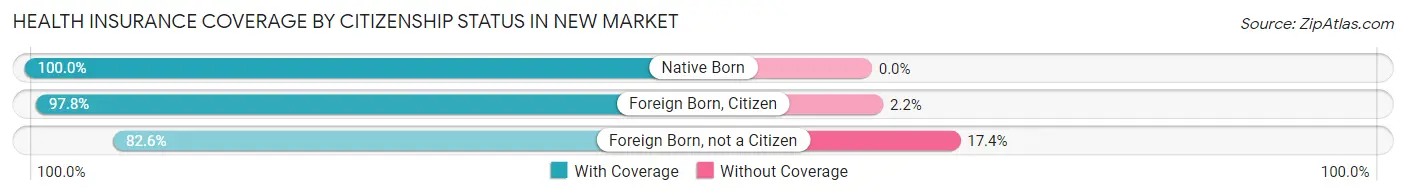
| Citizenship Status | With Coverage | Without Coverage |
| Native Born | 68 (100.0%) | 0 (0.0%) |
| Foreign Born, Citizen | 219 (97.8%) | 5 (2.2%) |
| Foreign Born, not a Citizen | 152 (82.6%) | 32 (17.4%) |
Health Insurance Coverage by Household Income in New Market
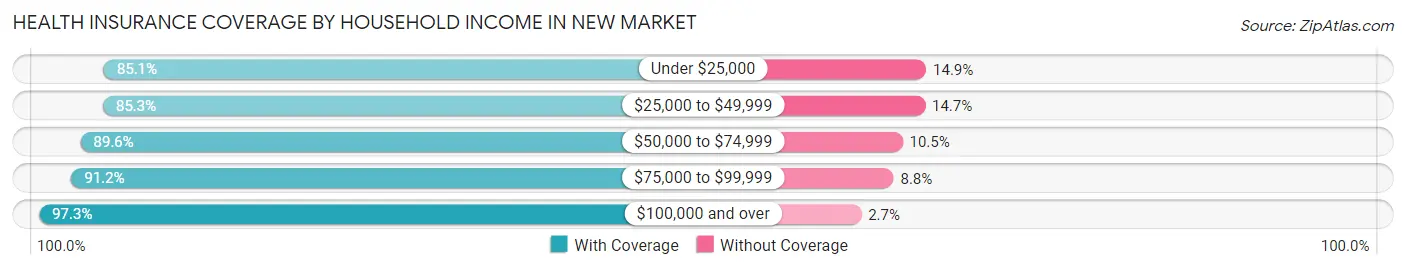
| Household Income | With Coverage | Without Coverage |
| Under $25,000 | 252 (85.1%) | 44 (14.9%) |
| $25,000 to $49,999 | 553 (85.3%) | 95 (14.7%) |
| $50,000 to $74,999 | 360 (89.5%) | 42 (10.4%) |
| $75,000 to $99,999 | 177 (91.2%) | 17 (8.8%) |
| $100,000 and over | 468 (97.3%) | 13 (2.7%) |
Public vs Private Health Insurance Coverage by Age in New Market
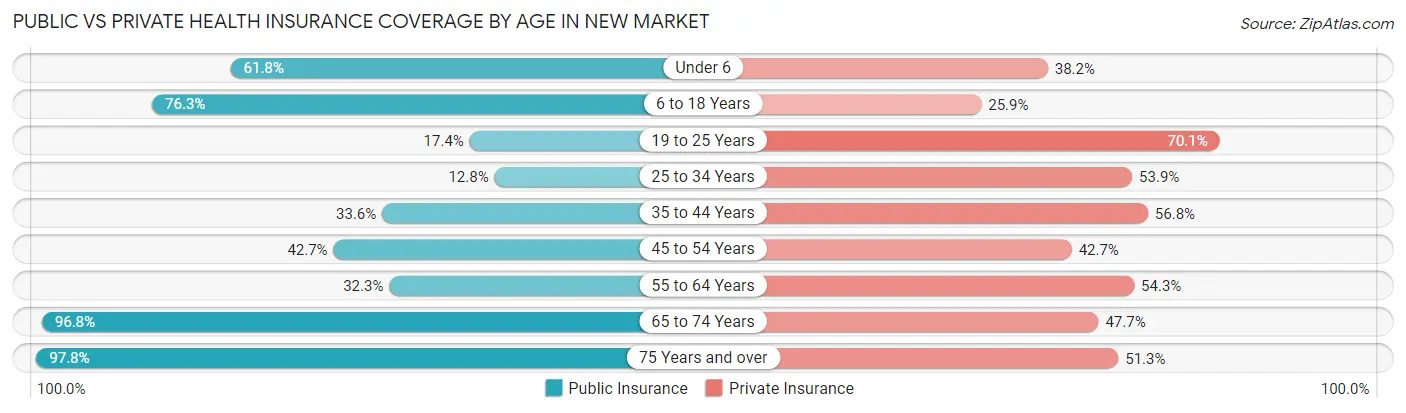
| Age Bracket | Public Insurance | Private Insurance |
| Under 6 | 42 (61.8%) | 26 (38.2%) |
| 6 to 18 Years | 171 (76.3%) | 58 (25.9%) |
| 19 to 25 Years | 32 (17.4%) | 129 (70.1%) |
| 25 to 34 Years | 23 (12.8%) | 97 (53.9%) |
| 35 to 44 Years | 74 (33.6%) | 125 (56.8%) |
| 45 to 54 Years | 64 (42.7%) | 64 (42.7%) |
| 55 to 64 Years | 106 (32.3%) | 178 (54.3%) |
| 65 to 74 Years | 453 (96.8%) | 223 (47.6%) |
| 75 Years and over | 223 (97.8%) | 117 (51.3%) |
| Total | 1,188 (58.0%) | 1,017 (49.6%) |
Disability Status by Sex by Age in New Market
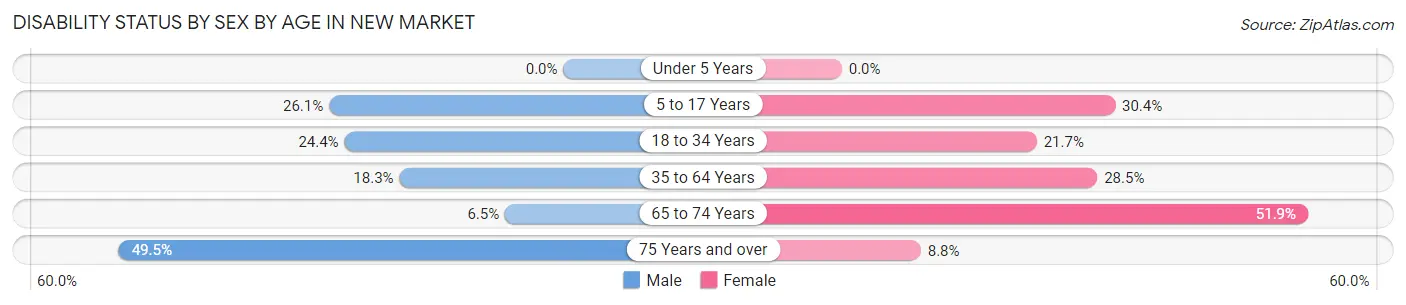
| Age Bracket | Male | Female |
| Under 5 Years | 0 (0.0%) | 0 (0.0%) |
| 5 to 17 Years | 30 (26.1%) | 35 (30.4%) |
| 18 to 34 Years | 59 (24.4%) | 28 (21.7%) |
| 35 to 64 Years | 44 (18.3%) | 130 (28.4%) |
| 65 to 74 Years | 15 (6.5%) | 123 (51.9%) |
| 75 Years and over | 51 (49.5%) | 11 (8.8%) |
Disability Class by Sex by Age in New Market
Disability Class: Hearing Difficulty
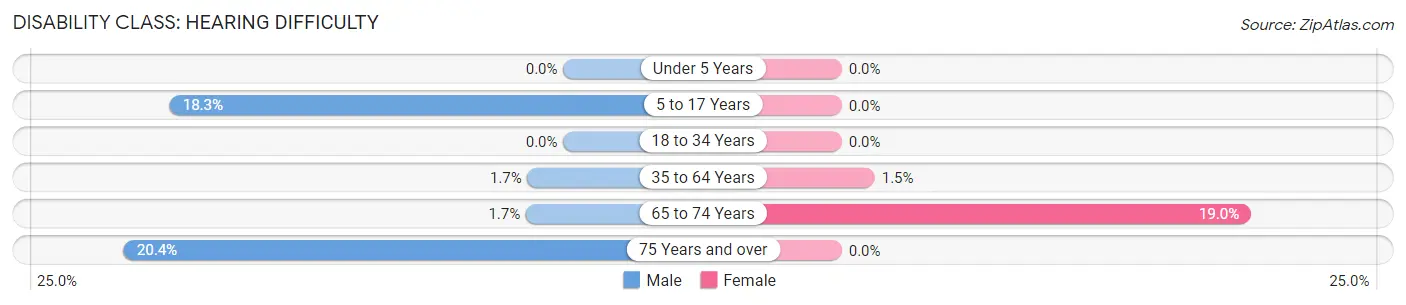
| Age Bracket | Male | Female |
| Under 5 Years | 0 (0.0%) | 0 (0.0%) |
| 5 to 17 Years | 21 (18.3%) | 0 (0.0%) |
| 18 to 34 Years | 0 (0.0%) | 0 (0.0%) |
| 35 to 64 Years | 4 (1.7%) | 7 (1.5%) |
| 65 to 74 Years | 4 (1.7%) | 45 (19.0%) |
| 75 Years and over | 21 (20.4%) | 0 (0.0%) |
Disability Class: Vision Difficulty
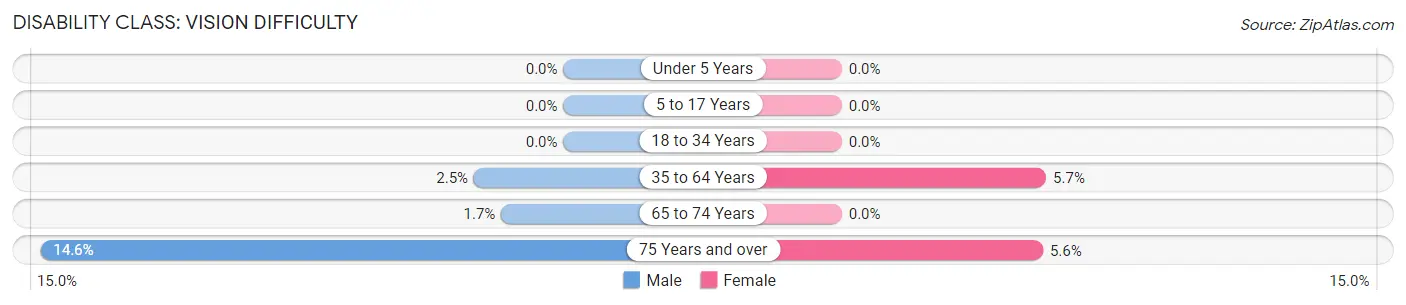
| Age Bracket | Male | Female |
| Under 5 Years | 0 (0.0%) | 0 (0.0%) |
| 5 to 17 Years | 0 (0.0%) | 0 (0.0%) |
| 18 to 34 Years | 0 (0.0%) | 0 (0.0%) |
| 35 to 64 Years | 6 (2.5%) | 26 (5.7%) |
| 65 to 74 Years | 4 (1.7%) | 0 (0.0%) |
| 75 Years and over | 15 (14.6%) | 7 (5.6%) |
Disability Class: Cognitive Difficulty

| Age Bracket | Male | Female |
| 5 to 17 Years | 30 (26.1%) | 35 (30.4%) |
| 18 to 34 Years | 59 (24.4%) | 28 (21.7%) |
| 35 to 64 Years | 14 (5.8%) | 51 (11.2%) |
| 65 to 74 Years | 4 (1.7%) | 25 (10.5%) |
| 75 Years and over | 37 (35.9%) | 7 (5.6%) |
Disability Class: Ambulatory Difficulty
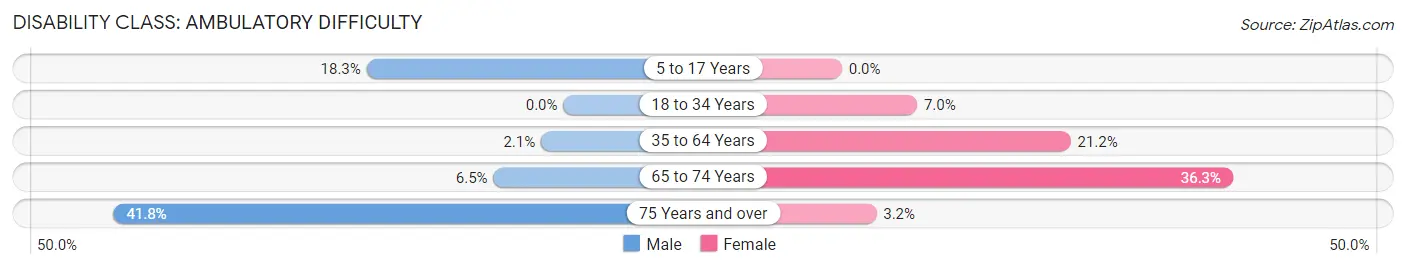
| Age Bracket | Male | Female |
| 5 to 17 Years | 21 (18.3%) | 0 (0.0%) |
| 18 to 34 Years | 0 (0.0%) | 9 (7.0%) |
| 35 to 64 Years | 5 (2.1%) | 97 (21.2%) |
| 65 to 74 Years | 15 (6.5%) | 86 (36.3%) |
| 75 Years and over | 43 (41.7%) | 4 (3.2%) |
Disability Class: Self-Care Difficulty
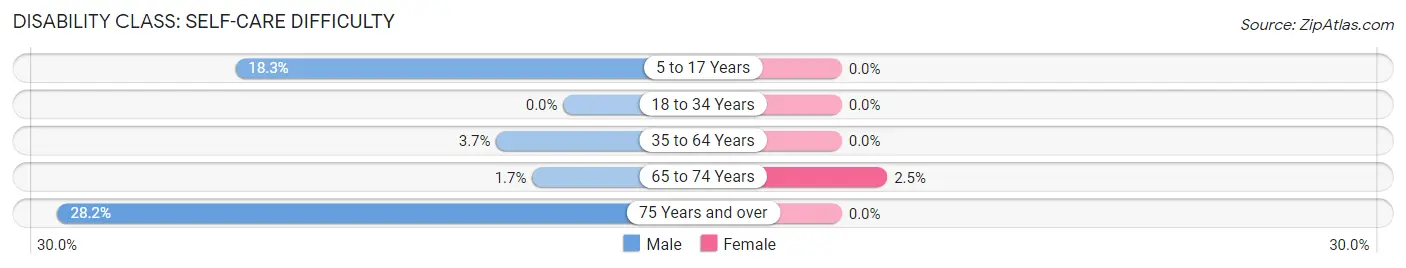
| Age Bracket | Male | Female |
| 5 to 17 Years | 21 (18.3%) | 0 (0.0%) |
| 18 to 34 Years | 0 (0.0%) | 0 (0.0%) |
| 35 to 64 Years | 9 (3.7%) | 0 (0.0%) |
| 65 to 74 Years | 4 (1.7%) | 6 (2.5%) |
| 75 Years and over | 29 (28.2%) | 0 (0.0%) |
Technology Access in New Market
Computing Device Access in New Market
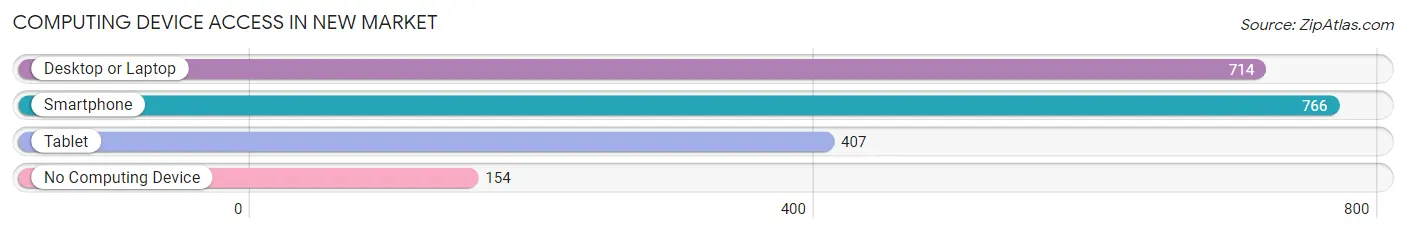
| Device Type | # Households | % Households |
| Desktop or Laptop | 714 | 68.6% |
| Smartphone | 766 | 73.6% |
| Tablet | 407 | 39.1% |
| No Computing Device | 154 | 14.8% |
| Total | 1,041 | 100.0% |
Internet Access in New Market
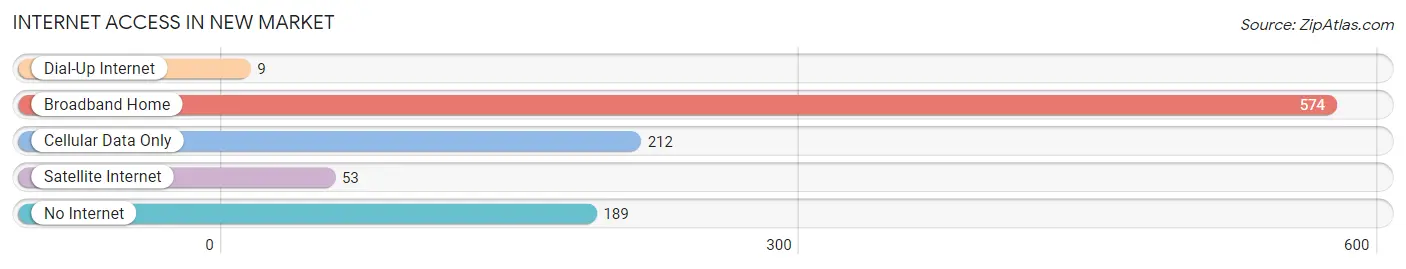
| Internet Type | # Households | % Households |
| Dial-Up Internet | 9 | 0.9% |
| Broadband Home | 574 | 55.1% |
| Cellular Data Only | 212 | 20.4% |
| Satellite Internet | 53 | 5.1% |
| No Internet | 189 | 18.2% |
| Total | 1,041 | 100.0% |
New Market Summary
New Market is a small town located in the Shenandoah Valley of Virginia, United States. It is situated in the northern part of Shenandoah County, approximately 75 miles northwest of Washington, D.C. The town is situated at the intersection of U.S. Route 11 and U.S. Route 211, and is the county seat of Shenandoah County. The population of New Market was 2,146 as of the 2010 census.
History
New Market was founded in 1792 by Peter Stephens, a German immigrant. The town was originally known as Stephensburg, but was later changed to New Market in 1817. The town was named after the nearby Battle of New Market, which took place in 1864 during the American Civil War. The battle was fought between Confederate and Union forces, and resulted in a Confederate victory.
The town was also the site of the New Market Race Track, which opened in 1891 and closed in 1941. The track was used for horse racing and was a popular destination for many years.
Geography
New Market is located in the northern part of Shenandoah County, approximately 75 miles northwest of Washington, D.C. The town is situated at the intersection of U.S. Route 11 and U.S. Route 211. The town is situated in the Shenandoah Valley, which is a large valley that runs through the Appalachian Mountains. The valley is known for its scenic beauty and is a popular destination for outdoor activities such as hiking, camping, and fishing.
The climate in New Market is humid subtropical, with hot summers and cold winters. The average annual temperature is 54°F, and the average annual precipitation is 40 inches.
Economy
The economy of New Market is largely based on agriculture and tourism. The town is home to several farms, which produce a variety of crops such as corn, soybeans, wheat, and hay. The town is also home to several wineries, which produce a variety of wines.
Tourism is also an important part of the economy of New Market. The town is home to several historic sites, such as the New Market Battlefield State Historical Park, which is a popular destination for visitors. The town is also home to several festivals and events, such as the New Market Heritage Festival, which is held annually in October.
Demographics
As of the 2010 census, the population of New Market was 2,146. The racial makeup of the town was 94.3% White, 2.2% African American, 0.3% Native American, 0.7% Asian, 0.1% Pacific Islander, 0.7% from other races, and 1.9% from two or more races. Hispanic or Latino of any race were 2.2% of the population.
The median household income in New Market was $45,938, and the median family income was $51,938. The per capita income in New Market was $20,938. About 8.3% of families and 10.2% of the population were below the poverty line, including 14.2% of those under age 18 and 8.3% of those age 65 or over.
Common Questions
What is Per Capita Income in New Market?
Per Capita income in New Market is $35,671.
What is the Median Family Income in New Market?
Median Family Income in New Market is $60,089.
What is the Median Household income in New Market?
Median Household Income in New Market is $47,855.
What is Income or Wage Gap in New Market?
Income or Wage Gap in New Market is 12.6%.
Women in New Market earn 87.4 cents for every dollar earned by a man.
What is Inequality or Gini Index in New Market?
Inequality or Gini Index in New Market is 0.50.
What is the Total Population of New Market?
Total Population of New Market is 2,162.
What is the Total Male Population of New Market?
Total Male Population of New Market is 952.
What is the Total Female Population of New Market?
Total Female Population of New Market is 1,210.
What is the Ratio of Males per 100 Females in New Market?
There are 78.68 Males per 100 Females in New Market.
What is the Ratio of Females per 100 Males in New Market?
There are 127.10 Females per 100 Males in New Market.
What is the Median Population Age in New Market?
Median Population Age in New Market is 57.3 Years.
What is the Average Family Size in New Market
Average Family Size in New Market is 2.6 People.
What is the Average Household Size in New Market
Average Household Size in New Market is 1.9 People.
How Large is the Labor Force in New Market?
There are 1,000 People in the Labor Forcein in New Market.
What is the Percentage of People in the Labor Force in New Market?
52.5% of People are in the Labor Force in New Market.
What is the Unemployment Rate in New Market?
Unemployment Rate in New Market is 1.9%.