Timberlake, VA Map & Demographics
Timberlake Map
Timberlake Overview
$35,530
PER CAPITA INCOME
$84,861
AVG FAMILY INCOME
$69,823
AVG HOUSEHOLD INCOME
21.0%
WAGE / INCOME GAP [ % ]
79.0¢/ $1
WAGE / INCOME GAP [ $ ]
0.37
INEQUALITY / GINI INDEX
12,999
TOTAL POPULATION
6,196
MALE POPULATION
6,803
FEMALE POPULATION
91.08
MALES / 100 FEMALES
109.80
FEMALES / 100 MALES
38.8
MEDIAN AGE
3.0
AVG FAMILY SIZE
2.5
AVG HOUSEHOLD SIZE
7,419
LABOR FORCE [ PEOPLE ]
68.0%
PERCENT IN LABOR FORCE
4.3%
UNEMPLOYMENT RATE
Timberlake Area Codes
Income in Timberlake
Income Overview in Timberlake
Per Capita Income in Timberlake is $35,530, while median incomes of families and households are $84,861 and $69,823 respectively.
| Characteristic | Number | Measure |
| Per Capita Income | 12,999 | $35,530 |
| Median Family Income | 3,226 | $84,861 |
| Mean Family Income | 3,226 | $101,532 |
| Median Household Income | 5,200 | $69,823 |
| Mean Household Income | 5,200 | $83,847 |
| Income Deficit | 3,226 | $0 |
| Wage / Income Gap (%) | 12,999 | 20.99% |
| Wage / Income Gap ($) | 12,999 | 79.01¢ per $1 |
| Gini / Inequality Index | 12,999 | 0.37 |
Earnings by Sex in Timberlake
Average Earnings in Timberlake are $38,974, $45,163 for men and $35,683 for women, a difference of 21.0%.
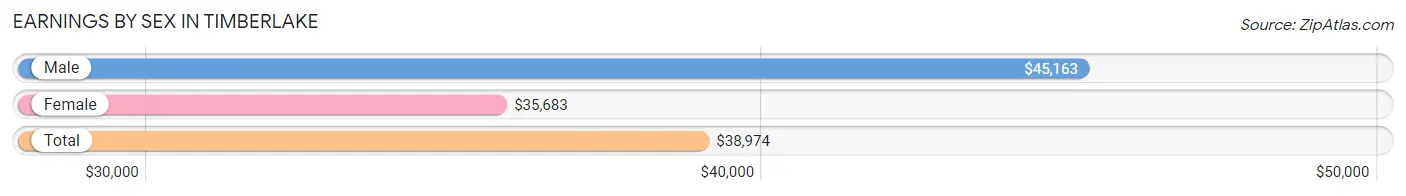
| Sex | Number | Average Earnings |
| Male | 3,844 (51.2%) | $45,163 |
| Female | 3,662 (48.8%) | $35,683 |
| Total | 7,506 (100.0%) | $38,974 |
Earnings by Sex by Income Bracket in Timberlake
The most common earnings brackets in Timberlake are $100,000+ for men (527 | 13.7%) and $55,000 to $64,999 for women (426 | 11.6%).
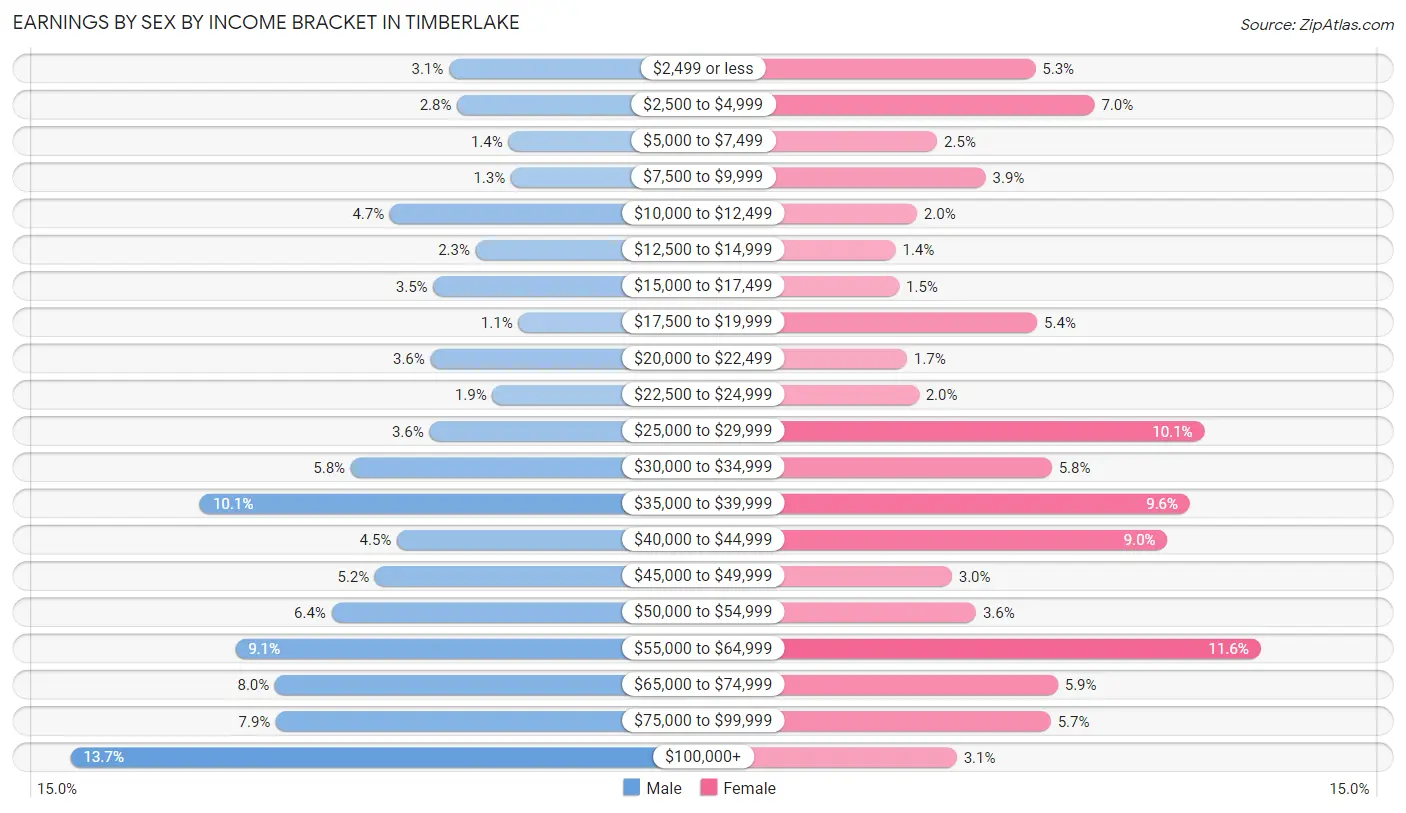
| Income | Male | Female |
| $2,499 or less | 118 (3.1%) | 194 (5.3%) |
| $2,500 to $4,999 | 109 (2.8%) | 255 (7.0%) |
| $5,000 to $7,499 | 54 (1.4%) | 93 (2.5%) |
| $7,500 to $9,999 | 51 (1.3%) | 143 (3.9%) |
| $10,000 to $12,499 | 182 (4.7%) | 72 (2.0%) |
| $12,500 to $14,999 | 89 (2.3%) | 50 (1.4%) |
| $15,000 to $17,499 | 135 (3.5%) | 54 (1.5%) |
| $17,500 to $19,999 | 43 (1.1%) | 196 (5.3%) |
| $20,000 to $22,499 | 138 (3.6%) | 62 (1.7%) |
| $22,500 to $24,999 | 71 (1.8%) | 74 (2.0%) |
| $25,000 to $29,999 | 139 (3.6%) | 368 (10.1%) |
| $30,000 to $34,999 | 224 (5.8%) | 211 (5.8%) |
| $35,000 to $39,999 | 387 (10.1%) | 353 (9.6%) |
| $40,000 to $44,999 | 174 (4.5%) | 330 (9.0%) |
| $45,000 to $49,999 | 198 (5.1%) | 108 (2.9%) |
| $50,000 to $54,999 | 245 (6.4%) | 133 (3.6%) |
| $55,000 to $64,999 | 349 (9.1%) | 426 (11.6%) |
| $65,000 to $74,999 | 306 (8.0%) | 217 (5.9%) |
| $75,000 to $99,999 | 305 (7.9%) | 210 (5.7%) |
| $100,000+ | 527 (13.7%) | 113 (3.1%) |
| Total | 3,844 (100.0%) | 3,662 (100.0%) |
Earnings by Sex by Educational Attainment in Timberlake
Average earnings in Timberlake are $52,111 for men and $42,146 for women, a difference of 19.1%. Men with an educational attainment of graduate degree enjoy the highest average annual earnings of $72,938, while those with high school diploma education earn the least with $39,529. Women with an educational attainment of graduate degree earn the most with the average annual earnings of $50,188, while those with less than high school education have the smallest earnings of $19,444.

| Educational Attainment | Male Income | Female Income |
| Less than High School | - | - |
| High School Diploma | $39,529 | $32,132 |
| College or Associate's Degree | $59,470 | $42,315 |
| Bachelor's Degree | $56,750 | $43,715 |
| Graduate Degree | $72,938 | $50,188 |
| Total | $52,111 | $42,146 |
Family Income in Timberlake
Family Income Brackets in Timberlake
According to the Timberlake family income data, there are 729 families falling into the $100,000 to $149,999 income range, which is the most common income bracket and makes up 22.6% of all families.
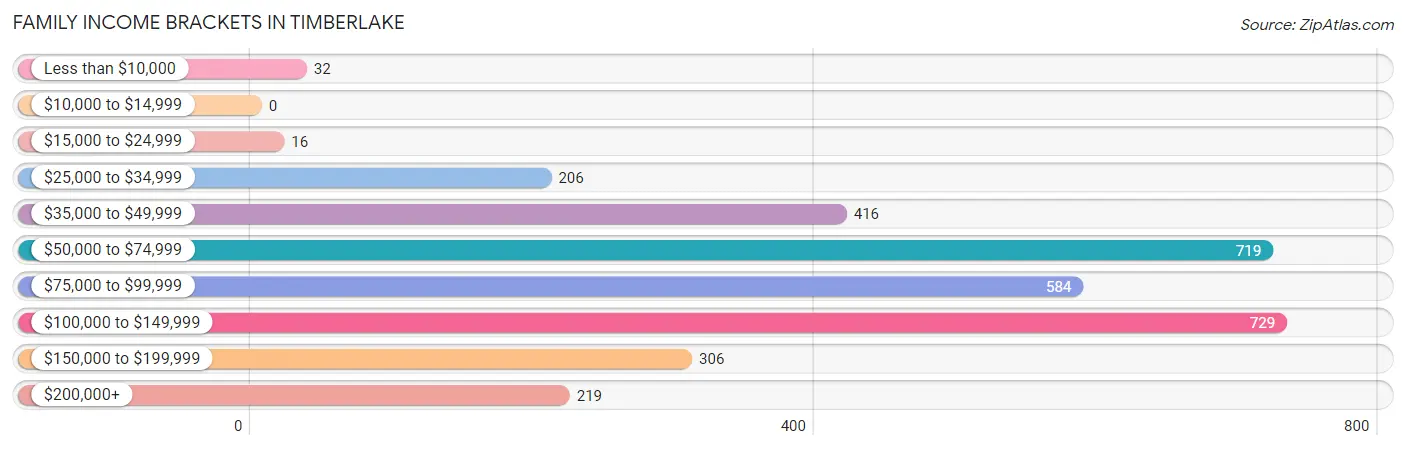
| Income Bracket | # Families | % Families |
| Less than $10,000 | 32 | 1.0% |
| $10,000 to $14,999 | 0 | 0.0% |
| $15,000 to $24,999 | 16 | 0.5% |
| $25,000 to $34,999 | 206 | 6.4% |
| $35,000 to $49,999 | 416 | 12.9% |
| $50,000 to $74,999 | 719 | 22.3% |
| $75,000 to $99,999 | 584 | 18.1% |
| $100,000 to $149,999 | 729 | 22.6% |
| $150,000 to $199,999 | 306 | 9.5% |
| $200,000+ | 219 | 6.8% |
Family Income by Famaliy Size in Timberlake
5-person families (310 | 9.6%) account for the highest median family income in Timberlake with $114,688 per family, while 2-person families (1,645 | 51.0%) have the highest median income of $34,658 per family member.
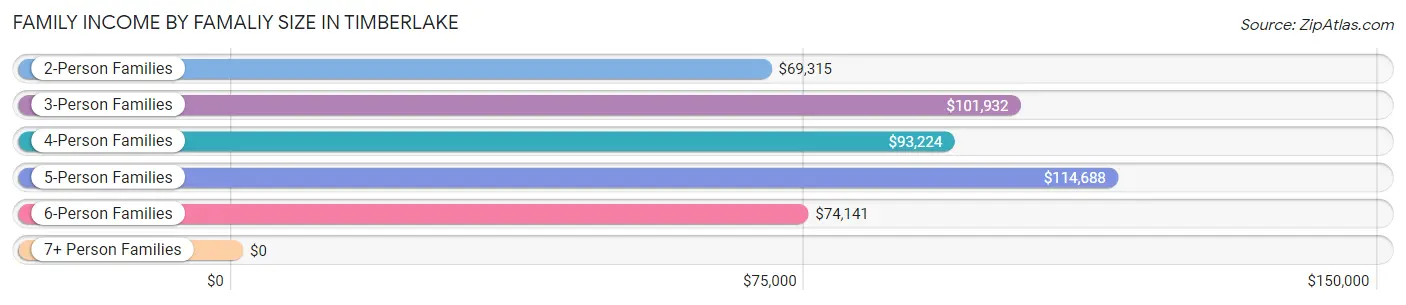
| Income Bracket | # Families | Median Income |
| 2-Person Families | 1,645 (51.0%) | $69,315 |
| 3-Person Families | 703 (21.8%) | $101,932 |
| 4-Person Families | 371 (11.5%) | $93,224 |
| 5-Person Families | 310 (9.6%) | $114,688 |
| 6-Person Families | 183 (5.7%) | $74,141 |
| 7+ Person Families | 14 (0.4%) | $0 |
| Total | 3,226 (100.0%) | $84,861 |
Family Income by Number of Earners in Timberlake
The median family income in Timberlake is $84,861, with families comprising 3+ earners (420) having the highest median family income of $146,591, while families with no earners (475) have the lowest median family income of $55,984, accounting for 13.0% and 14.7% of families, respectively.
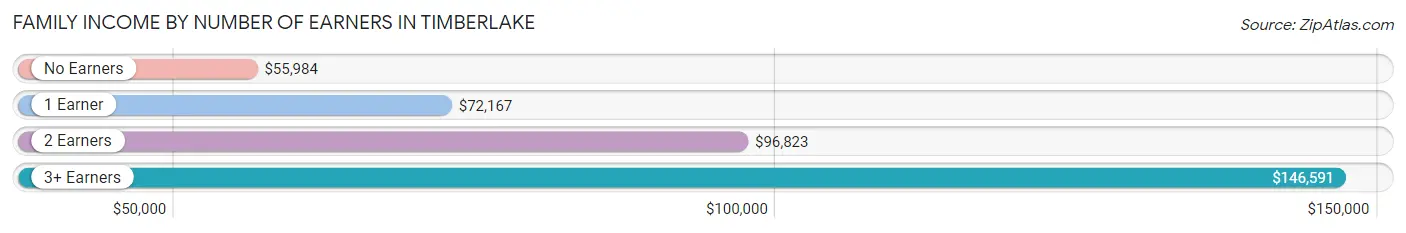
| Number of Earners | # Families | Median Income |
| No Earners | 475 (14.7%) | $55,984 |
| 1 Earner | 1,128 (35.0%) | $72,167 |
| 2 Earners | 1,203 (37.3%) | $96,823 |
| 3+ Earners | 420 (13.0%) | $146,591 |
| Total | 3,226 (100.0%) | $84,861 |
Household Income in Timberlake
Household Income Brackets in Timberlake
With 1,264 households falling in the category, the $50,000 to $74,999 income range is the most frequent in Timberlake, accounting for 24.3% of all households. In contrast, only 42 households (0.8%) fall into the $10,000 to $14,999 income bracket, making it the least populous group.
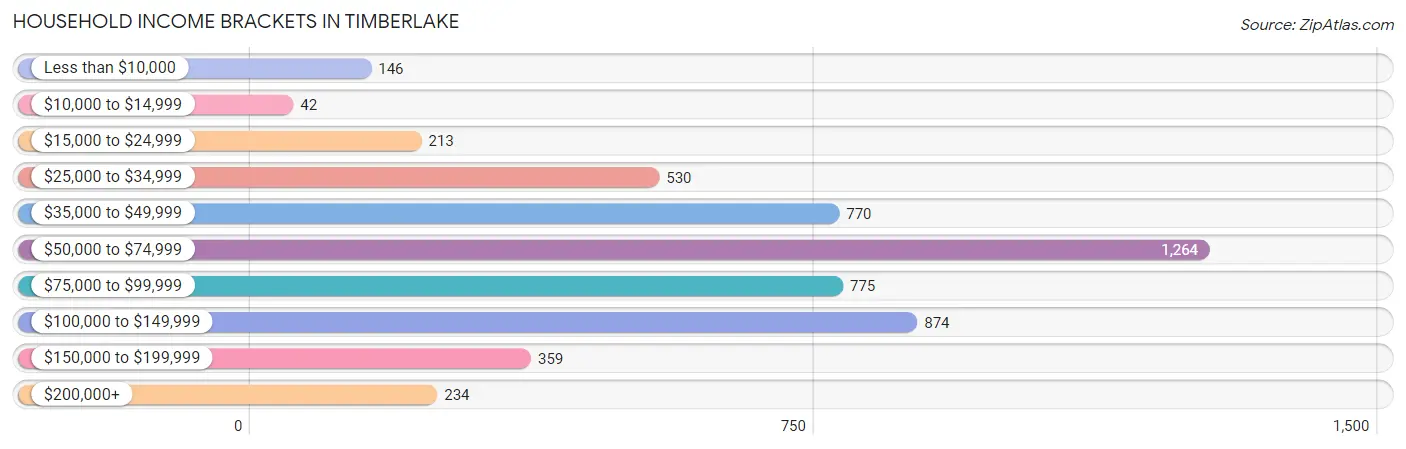
| Income Bracket | # Households | % Households |
| Less than $10,000 | 146 | 2.8% |
| $10,000 to $14,999 | 42 | 0.8% |
| $15,000 to $24,999 | 213 | 4.1% |
| $25,000 to $34,999 | 530 | 10.2% |
| $35,000 to $49,999 | 770 | 14.8% |
| $50,000 to $74,999 | 1,264 | 24.3% |
| $75,000 to $99,999 | 775 | 14.9% |
| $100,000 to $149,999 | 874 | 16.8% |
| $150,000 to $199,999 | 359 | 6.9% |
| $200,000+ | 234 | 4.5% |
Household Income by Householder Age in Timberlake
The median household income in Timberlake is $69,823, with the highest median household income of $74,826 found in the 45 to 64 years age bracket for the primary householder. A total of 1,923 households (37.0%) fall into this category. Meanwhile, the 15 to 24 years age bracket for the primary householder has the lowest median household income of $29,393, with 251 households (4.8%) in this group.
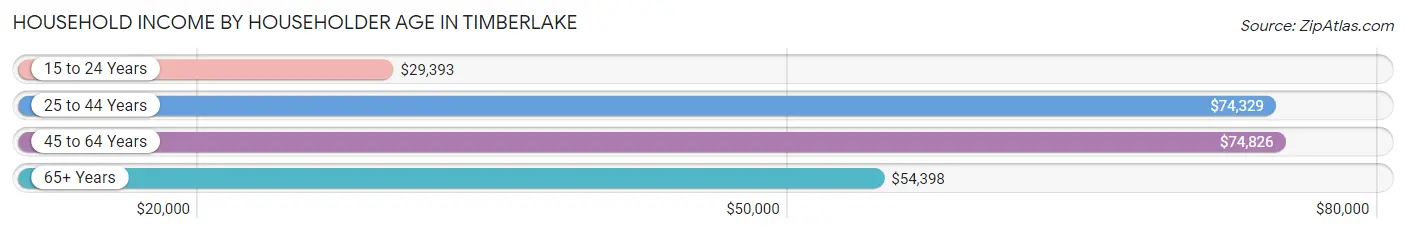
| Income Bracket | # Households | Median Income |
| 15 to 24 Years | 251 (4.8%) | $29,393 |
| 25 to 44 Years | 1,773 (34.1%) | $74,329 |
| 45 to 64 Years | 1,923 (37.0%) | $74,826 |
| 65+ Years | 1,253 (24.1%) | $54,398 |
| Total | 5,200 (100.0%) | $69,823 |
Poverty in Timberlake
Income Below Poverty by Sex and Age in Timberlake
With 8.7% poverty level for males and 7.7% for females among the residents of Timberlake, 16 and 17 year old males and 18 to 24 year old females are the most vulnerable to poverty, with 85 males (69.1%) and 261 females (31.3%) in their respective age groups living below the poverty level.
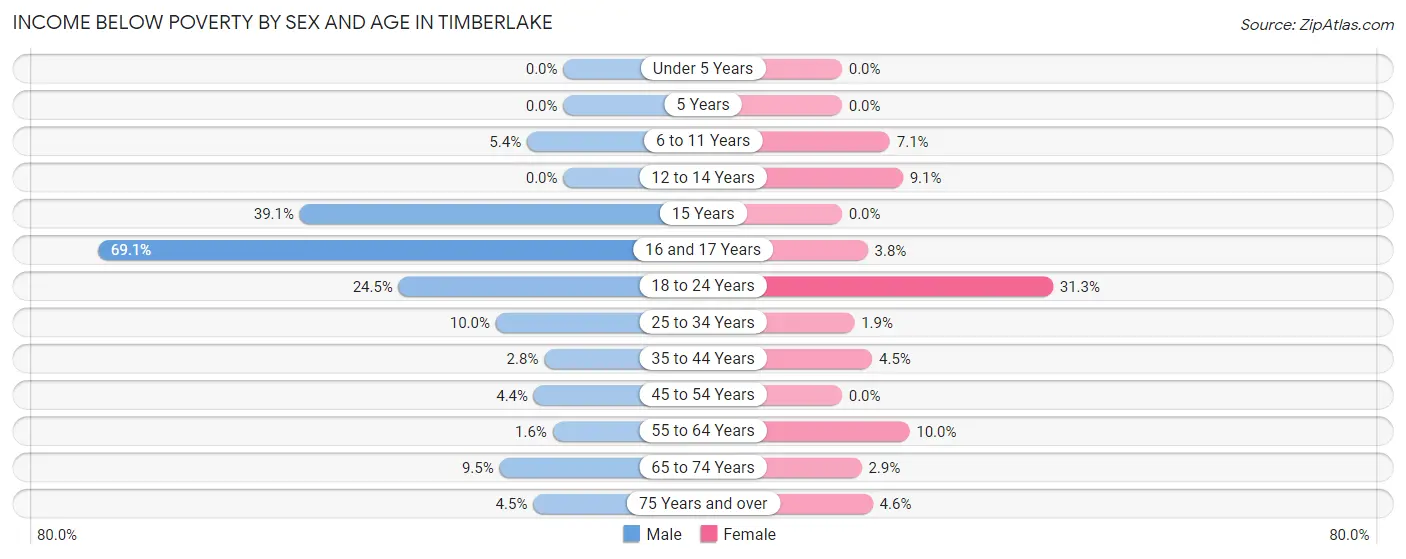
| Age Bracket | Male | Female |
| Under 5 Years | 0 (0.0%) | 0 (0.0%) |
| 5 Years | 0 (0.0%) | 0 (0.0%) |
| 6 to 11 Years | 29 (5.4%) | 34 (7.1%) |
| 12 to 14 Years | 0 (0.0%) | 21 (9.0%) |
| 15 Years | 9 (39.1%) | 0 (0.0%) |
| 16 and 17 Years | 85 (69.1%) | 9 (3.8%) |
| 18 to 24 Years | 178 (24.4%) | 261 (31.3%) |
| 25 to 34 Years | 98 (10.0%) | 16 (1.8%) |
| 35 to 44 Years | 27 (2.8%) | 36 (4.5%) |
| 45 to 54 Years | 36 (4.4%) | 0 (0.0%) |
| 55 to 64 Years | 11 (1.6%) | 97 (10.0%) |
| 65 to 74 Years | 49 (9.5%) | 17 (2.9%) |
| 75 Years and over | 17 (4.5%) | 28 (4.6%) |
| Total | 539 (8.7%) | 519 (7.7%) |
Income Above Poverty by Sex and Age in Timberlake
According to the poverty statistics in Timberlake, males aged under 5 years and females aged under 5 years are the age groups that are most secure financially, with 100.0% of males and 100.0% of females in these age groups living above the poverty line.
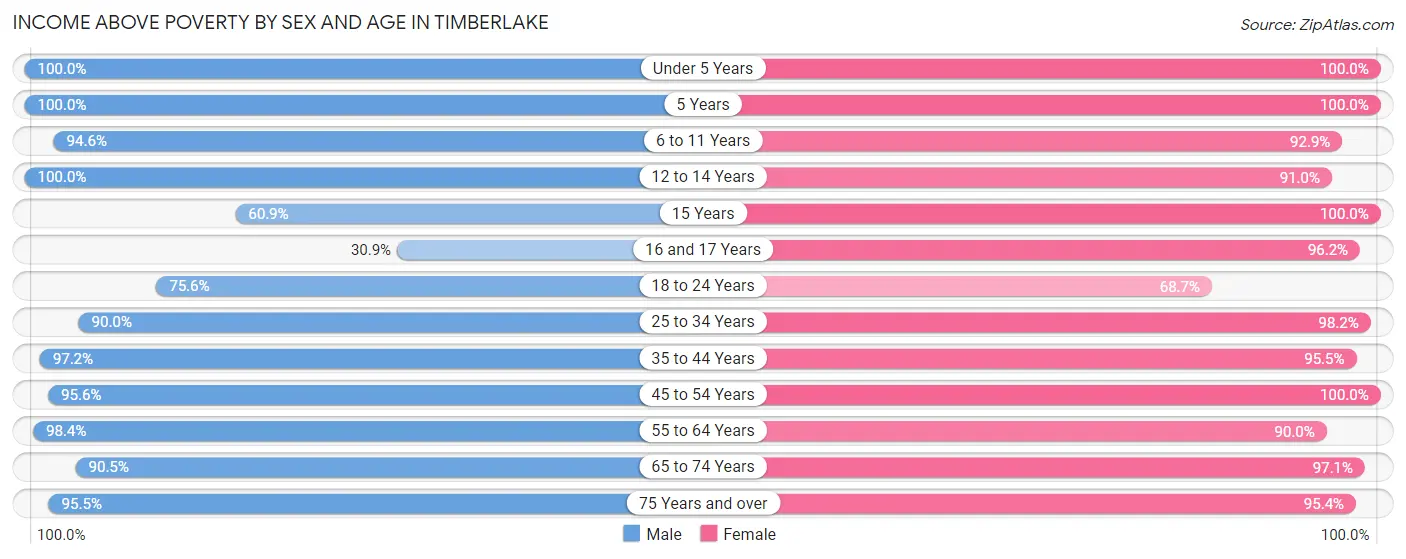
| Age Bracket | Male | Female |
| Under 5 Years | 253 (100.0%) | 259 (100.0%) |
| 5 Years | 78 (100.0%) | 69 (100.0%) |
| 6 to 11 Years | 508 (94.6%) | 443 (92.9%) |
| 12 to 14 Years | 90 (100.0%) | 211 (90.9%) |
| 15 Years | 14 (60.9%) | 71 (100.0%) |
| 16 and 17 Years | 38 (30.9%) | 226 (96.2%) |
| 18 to 24 Years | 550 (75.5%) | 572 (68.7%) |
| 25 to 34 Years | 879 (90.0%) | 849 (98.2%) |
| 35 to 44 Years | 924 (97.2%) | 764 (95.5%) |
| 45 to 54 Years | 785 (95.6%) | 740 (100.0%) |
| 55 to 64 Years | 686 (98.4%) | 871 (90.0%) |
| 65 to 74 Years | 468 (90.5%) | 565 (97.1%) |
| 75 Years and over | 363 (95.5%) | 583 (95.4%) |
| Total | 5,636 (91.3%) | 6,223 (92.3%) |
Income Below Poverty Among Married-Couple Families in Timberlake
The poverty statistics for married-couple families in Timberlake show that 1.3% or 32 of the total 2,525 families live below the poverty line. Families with 5 or more children have the highest poverty rate of 100.0%, comprising of 14 families. On the other hand, families with 1 or 2 children have the lowest poverty rate of 0.0%, which includes 0 families.
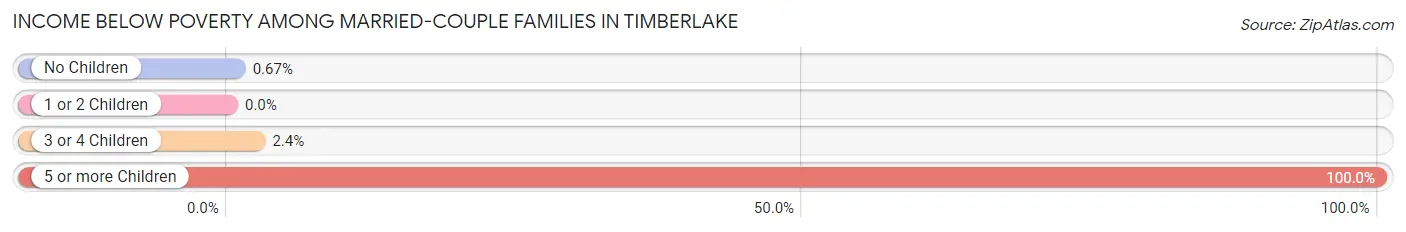
| Children | Above Poverty | Below Poverty |
| No Children | 1,477 (99.3%) | 10 (0.7%) |
| 1 or 2 Children | 689 (100.0%) | 0 (0.0%) |
| 3 or 4 Children | 327 (97.6%) | 8 (2.4%) |
| 5 or more Children | 0 (0.0%) | 14 (100.0%) |
| Total | 2,493 (98.7%) | 32 (1.3%) |
Income Below Poverty Among Single-Parent Households in Timberlake
According to the poverty data in Timberlake, 9.5% or 11 single-father households and 0.5% or 3 single-mother households are living below the poverty line. Among single-father households, those with no children have the highest poverty rate, with 11 households (13.4%) experiencing poverty. Likewise, among single-mother households, those with no children have the highest poverty rate, with 3 households (0.9%) falling below the poverty line.
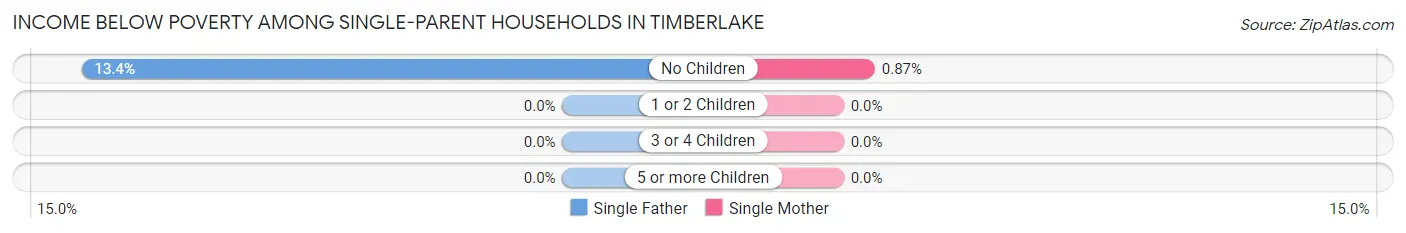
| Children | Single Father | Single Mother |
| No Children | 11 (13.4%) | 3 (0.9%) |
| 1 or 2 Children | 0 (0.0%) | 0 (0.0%) |
| 3 or 4 Children | 0 (0.0%) | 0 (0.0%) |
| 5 or more Children | 0 (0.0%) | 0 (0.0%) |
| Total | 11 (9.5%) | 3 (0.5%) |
Income Below Poverty Among Married-Couple vs Single-Parent Households in Timberlake
The poverty data for Timberlake shows that 32 of the married-couple family households (1.3%) and 14 of the single-parent households (2.0%) are living below the poverty level. Within the married-couple family households, those with 5 or more children have the highest poverty rate, with 14 households (100.0%) falling below the poverty line. Among the single-parent households, those with no children have the highest poverty rate, with 14 household (3.3%) living below poverty.
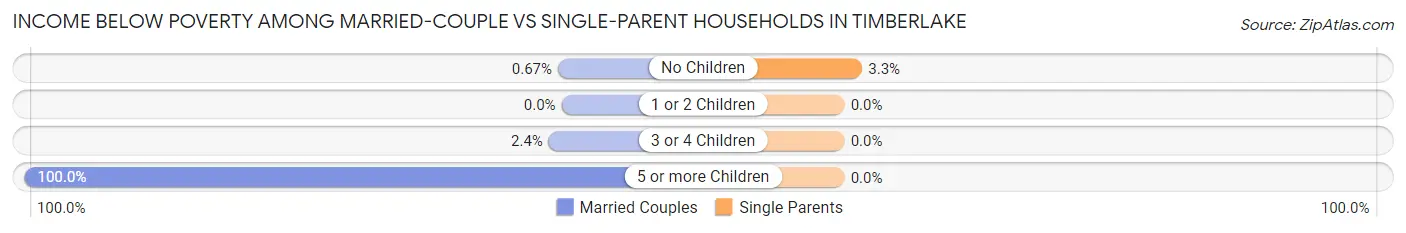
| Children | Married-Couple Families | Single-Parent Households |
| No Children | 10 (0.7%) | 14 (3.3%) |
| 1 or 2 Children | 0 (0.0%) | 0 (0.0%) |
| 3 or 4 Children | 8 (2.4%) | 0 (0.0%) |
| 5 or more Children | 14 (100.0%) | 0 (0.0%) |
| Total | 32 (1.3%) | 14 (2.0%) |
Race in Timberlake
The most populous races in Timberlake are White / Caucasian (10,158 | 78.1%), Black / African American (1,322 | 10.2%), and Two or more Races (981 | 7.5%).
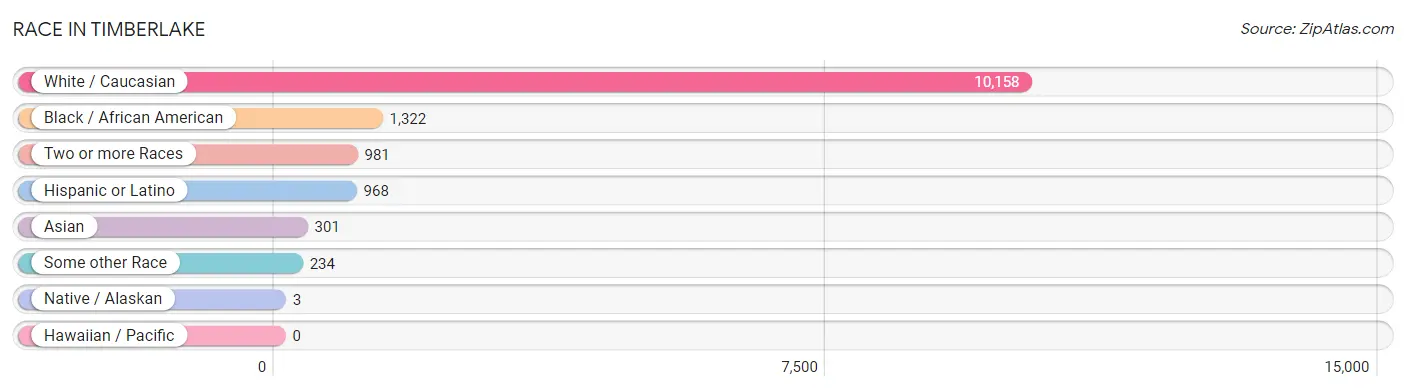
| Race | # Population | % Population |
| Asian | 301 | 2.3% |
| Black / African American | 1,322 | 10.2% |
| Hawaiian / Pacific | 0 | 0.0% |
| Hispanic or Latino | 968 | 7.4% |
| Native / Alaskan | 3 | 0.0% |
| White / Caucasian | 10,158 | 78.1% |
| Two or more Races | 981 | 7.5% |
| Some other Race | 234 | 1.8% |
| Total | 12,999 | 100.0% |
Ancestry in Timberlake
The most populous ancestries reported in Timberlake are American (1,752 | 13.5%), English (1,582 | 12.2%), German (1,231 | 9.5%), Irish (789 | 6.1%), and Scottish (608 | 4.7%), together accounting for 45.9% of all Timberlake residents.
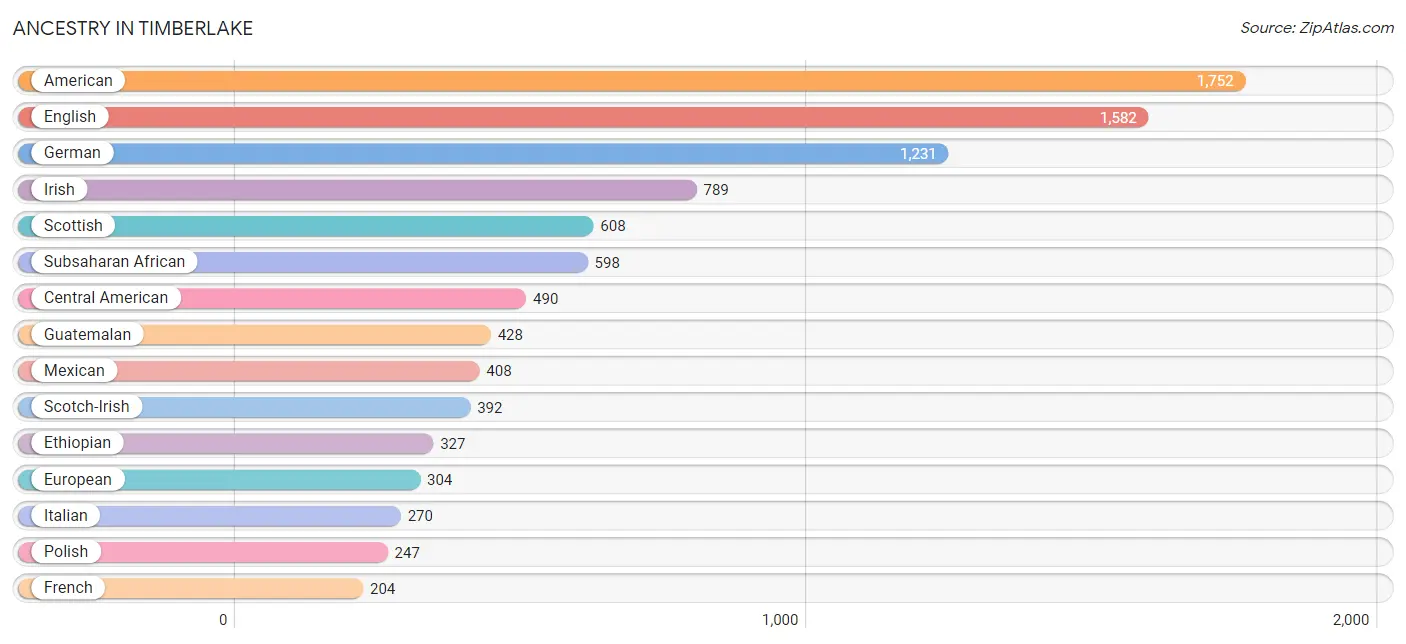
| Ancestry | # Population | % Population |
| African | 178 | 1.4% |
| American | 1,752 | 13.5% |
| Arab | 8 | 0.1% |
| Armenian | 4 | 0.0% |
| Austrian | 3 | 0.0% |
| Bahamian | 13 | 0.1% |
| Belgian | 10 | 0.1% |
| British | 32 | 0.3% |
| Burmese | 46 | 0.4% |
| Canadian | 13 | 0.1% |
| Central American | 490 | 3.8% |
| Costa Rican | 9 | 0.1% |
| Croatian | 14 | 0.1% |
| Czech | 49 | 0.4% |
| Czechoslovakian | 22 | 0.2% |
| Danish | 37 | 0.3% |
| Dominican | 4 | 0.0% |
| Dutch | 85 | 0.6% |
| Eastern European | 27 | 0.2% |
| English | 1,582 | 12.2% |
| Ethiopian | 327 | 2.5% |
| European | 304 | 2.3% |
| Finnish | 8 | 0.1% |
| French | 204 | 1.6% |
| French Canadian | 26 | 0.2% |
| German | 1,231 | 9.5% |
| Greek | 46 | 0.4% |
| Guatemalan | 428 | 3.3% |
| Haitian | 20 | 0.2% |
| Honduran | 32 | 0.3% |
| Hungarian | 34 | 0.3% |
| Indian (Asian) | 44 | 0.3% |
| Irish | 789 | 6.1% |
| Iroquois | 2 | 0.0% |
| Italian | 270 | 2.1% |
| Jamaican | 13 | 0.1% |
| Korean | 91 | 0.7% |
| Mexican | 408 | 3.1% |
| Nicaraguan | 7 | 0.1% |
| Nigerian | 93 | 0.7% |
| Northern European | 4 | 0.0% |
| Norwegian | 42 | 0.3% |
| Palestinian | 8 | 0.1% |
| Polish | 247 | 1.9% |
| Puerto Rican | 33 | 0.3% |
| Russian | 102 | 0.8% |
| Salvadoran | 14 | 0.1% |
| Scandinavian | 50 | 0.4% |
| Scotch-Irish | 392 | 3.0% |
| Scottish | 608 | 4.7% |
| Slovak | 7 | 0.1% |
| South American | 23 | 0.2% |
| Spanish | 10 | 0.1% |
| Sri Lankan | 189 | 1.5% |
| Subsaharan African | 598 | 4.6% |
| Swedish | 43 | 0.3% |
| Swiss | 39 | 0.3% |
| Thai | 62 | 0.5% |
| Ukrainian | 43 | 0.3% |
| Venezuelan | 23 | 0.2% |
| Welsh | 84 | 0.6% | View All 61 Rows |
Immigrants in Timberlake
The most numerous immigrant groups reported in Timberlake came from Latin America (485 | 3.7%), Central America (436 | 3.4%), Africa (341 | 2.6%), Eastern Africa (327 | 2.5%), and Ethiopia (327 | 2.5%), together accounting for 14.7% of all Timberlake residents.
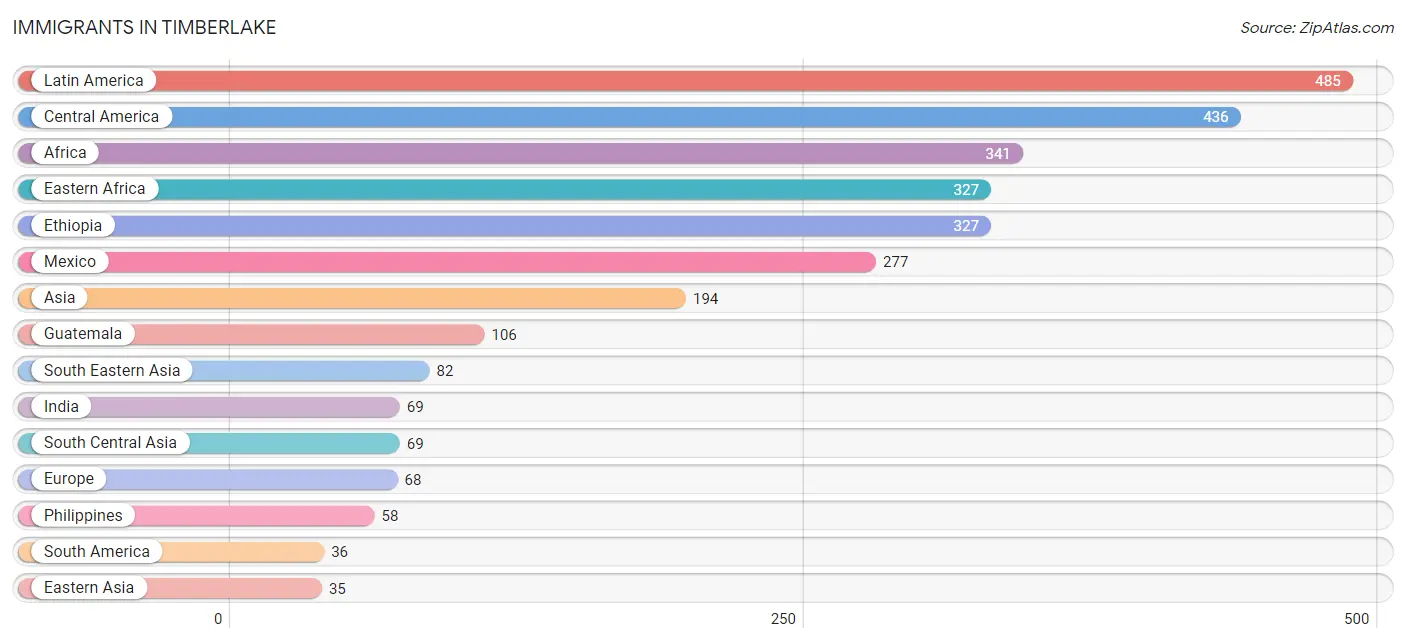
| Immigration Origin | # Population | % Population |
| Africa | 341 | 2.6% |
| Asia | 194 | 1.5% |
| Bahamas | 13 | 0.1% |
| Belgium | 10 | 0.1% |
| Brazil | 13 | 0.1% |
| Caribbean | 13 | 0.1% |
| Central America | 436 | 3.4% |
| China | 23 | 0.2% |
| Eastern Africa | 327 | 2.5% |
| Eastern Asia | 35 | 0.3% |
| Eastern Europe | 14 | 0.1% |
| El Salvador | 14 | 0.1% |
| Ethiopia | 327 | 2.5% |
| Europe | 68 | 0.5% |
| Germany | 10 | 0.1% |
| Guatemala | 106 | 0.8% |
| Honduras | 32 | 0.3% |
| India | 69 | 0.5% |
| Korea | 12 | 0.1% |
| Latin America | 485 | 3.7% |
| Mexico | 277 | 2.1% |
| Nicaragua | 7 | 0.1% |
| Nigeria | 14 | 0.1% |
| Northern Europe | 34 | 0.3% |
| Philippines | 58 | 0.4% |
| Russia | 14 | 0.1% |
| Scotland | 26 | 0.2% |
| South America | 36 | 0.3% |
| South Central Asia | 69 | 0.5% |
| South Eastern Asia | 82 | 0.6% |
| Venezuela | 23 | 0.2% |
| Vietnam | 24 | 0.2% |
| Western Africa | 14 | 0.1% |
| Western Europe | 20 | 0.2% | View All 34 Rows |
Sex and Age in Timberlake
Sex and Age in Timberlake
The most populous age groups in Timberlake are 20 to 24 Years (573 | 9.2%) for men and 15 to 19 Years (590 | 8.7%) for women.
| Age Bracket | Male | Female |
| Under 5 Years | 253 (4.1%) | 259 (3.8%) |
| 5 to 9 Years | 426 (6.9%) | 416 (6.1%) |
| 10 to 14 Years | 279 (4.5%) | 362 (5.3%) |
| 15 to 19 Years | 301 (4.9%) | 590 (8.7%) |
| 20 to 24 Years | 573 (9.2%) | 549 (8.1%) |
| 25 to 29 Years | 503 (8.1%) | 496 (7.3%) |
| 30 to 34 Years | 474 (7.6%) | 369 (5.4%) |
| 35 to 39 Years | 516 (8.3%) | 246 (3.6%) |
| 40 to 44 Years | 435 (7.0%) | 554 (8.1%) |
| 45 to 49 Years | 423 (6.8%) | 282 (4.2%) |
| 50 to 54 Years | 398 (6.4%) | 458 (6.7%) |
| 55 to 59 Years | 267 (4.3%) | 431 (6.3%) |
| 60 to 64 Years | 432 (7.0%) | 541 (8.0%) |
| 65 to 69 Years | 290 (4.7%) | 276 (4.1%) |
| 70 to 74 Years | 234 (3.8%) | 309 (4.5%) |
| 75 to 79 Years | 181 (2.9%) | 201 (2.9%) |
| 80 to 84 Years | 99 (1.6%) | 266 (3.9%) |
| 85 Years and over | 112 (1.8%) | 198 (2.9%) |
| Total | 6,196 (100.0%) | 6,803 (100.0%) |
Families and Households in Timberlake
Median Family Size in Timberlake
The median family size in Timberlake is 2.96 persons per family, with married-couple families (2,525 | 78.3%) accounting for the largest median family size of 3.07 persons per family. On the other hand, single female/mother families (585 | 18.1%) represent the smallest median family size with 2.56 persons per family.
| Family Type | # Families | Family Size |
| Married-Couple | 2,525 (78.3%) | 3.07 |
| Single Male/Father | 116 (3.6%) | 2.70 |
| Single Female/Mother | 585 (18.1%) | 2.56 |
| Total Families | 3,226 (100.0%) | 2.96 |
Median Household Size in Timberlake
The median household size in Timberlake is 2.48 persons per household, with married-couple households (2,525 | 48.6%) accounting for the largest median household size of 3.09 persons per household. non-family households (1,974 | 38.0%) represent the smallest median household size with 1.64 persons per household.
| Household Type | # Households | Household Size |
| Married-Couple | 2,525 (48.6%) | 3.09 |
| Single Male/Father | 116 (2.2%) | 2.95 |
| Single Female/Mother | 585 (11.3%) | 2.60 |
| Non-family | 1,974 (38.0%) | 1.64 |
| Total Households | 5,200 (100.0%) | 2.48 |
Household Size by Marriage Status in Timberlake
Out of a total of 5,200 households in Timberlake, 3,226 (62.0%) are family households, while 1,974 (38.0%) are nonfamily households. The most numerous type of family households are 2-person households, comprising 1,579, and the most common type of nonfamily households are 1-person households, comprising 1,362.
| Household Size | Family Households | Nonfamily Households |
| 1-Person Households | - | 1,362 (26.2%) |
| 2-Person Households | 1,579 (30.4%) | 499 (9.6%) |
| 3-Person Households | 758 (14.6%) | 77 (1.5%) |
| 4-Person Households | 378 (7.3%) | 0 (0.0%) |
| 5-Person Households | 314 (6.0%) | 36 (0.7%) |
| 6-Person Households | 183 (3.5%) | 0 (0.0%) |
| 7+ Person Households | 14 (0.3%) | 0 (0.0%) |
| Total | 3,226 (62.0%) | 1,974 (38.0%) |
Female Fertility in Timberlake
Fertility by Age in Timberlake
Average fertility rate in Timberlake is 73.0 births per 1,000 women. Women in the age bracket of 20 to 34 years have the highest fertility rate with 154.0 births per 1,000 women. Women in the age bracket of 20 to 34 years acount for 93.6% of all women with births.
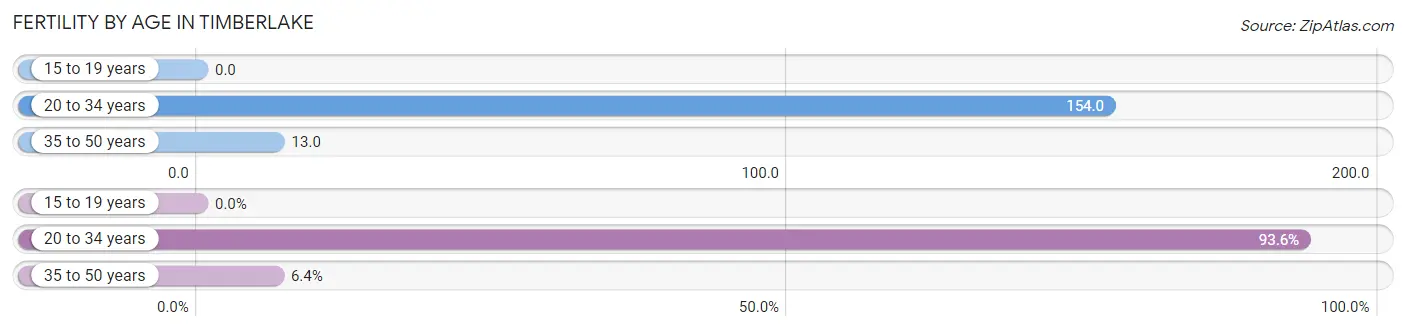
| Age Bracket | Women with Births | Births / 1,000 Women |
| 15 to 19 years | 0 (0.0%) | 0.0 |
| 20 to 34 years | 218 (93.6%) | 154.0 |
| 35 to 50 years | 15 (6.4%) | 13.0 |
| Total | 233 (100.0%) | 73.0 |
Fertility by Age by Marriage Status in Timberlake
94.8% of women with births (233) in Timberlake are married. The highest percentage of unmarried women with births falls into 20 to 34 years age bracket with 5.5% of them unmarried at the time of birth, while the lowest percentage of unmarried women with births belong to 35 to 50 years age bracket with 0.0% of them unmarried.
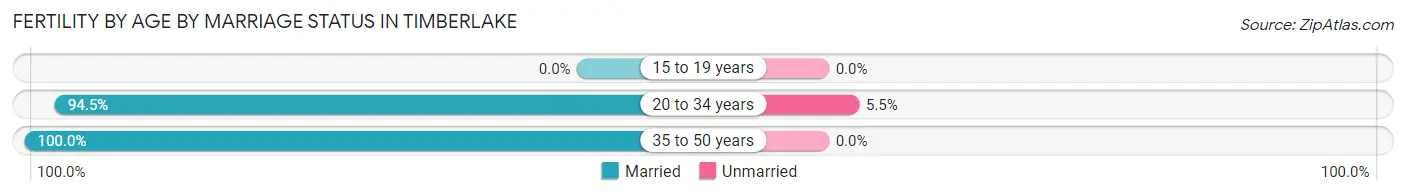
| Age Bracket | Married | Unmarried |
| 15 to 19 years | 0 (0.0%) | 0 (0.0%) |
| 20 to 34 years | 206 (94.5%) | 12 (5.5%) |
| 35 to 50 years | 15 (100.0%) | 0 (0.0%) |
| Total | 221 (94.9%) | 12 (5.1%) |
Fertility by Education in Timberlake
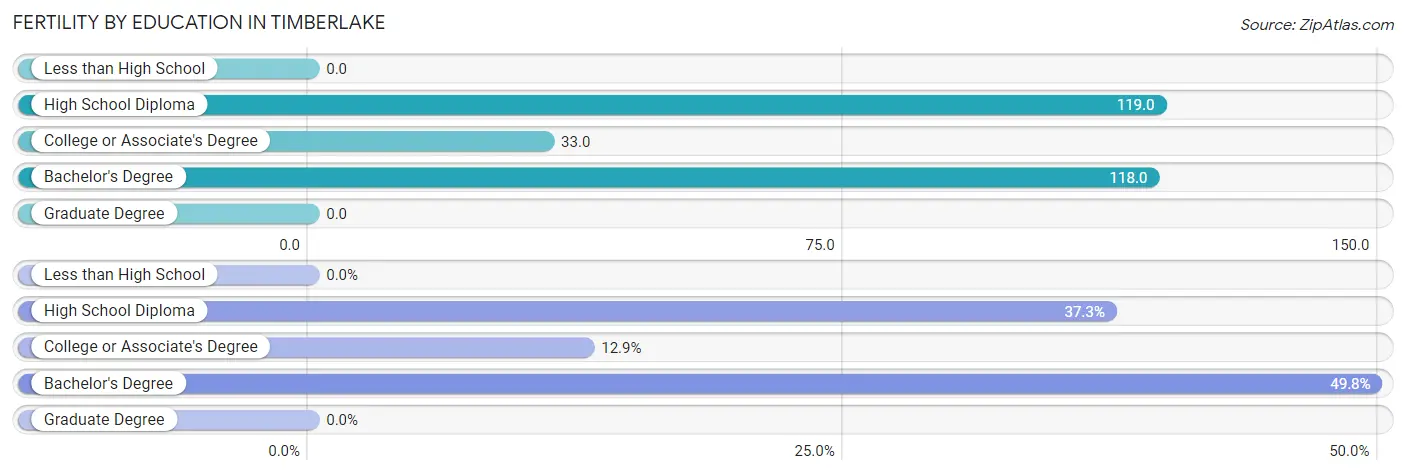
| Educational Attainment | Women with Births | Births / 1,000 Women |
| Less than High School | 0 (0.0%) | 0.0 |
| High School Diploma | 87 (37.3%) | 119.0 |
| College or Associate's Degree | 30 (12.9%) | 33.0 |
| Bachelor's Degree | 116 (49.8%) | 118.0 |
| Graduate Degree | 0 (0.0%) | 0.0 |
| Total | 233 (100.0%) | 73.0 |
Fertility by Education by Marriage Status in Timberlake
5.1% of women with births in Timberlake are unmarried. Women with the educational attainment of high school diploma are most likely to be married with 100.0% of them married at childbirth, while women with the educational attainment of bachelor's degree are least likely to be married with 10.3% of them unmarried at childbirth.
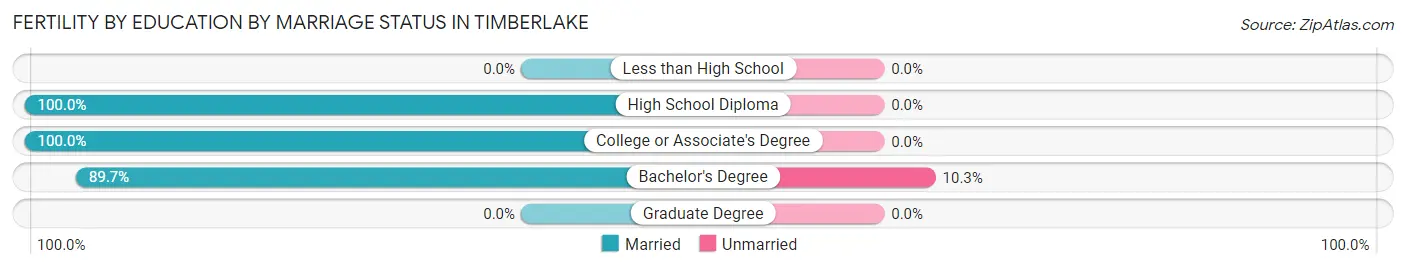
| Educational Attainment | Married | Unmarried |
| Less than High School | 0 (0.0%) | 0 (0.0%) |
| High School Diploma | 87 (100.0%) | 0 (0.0%) |
| College or Associate's Degree | 30 (100.0%) | 0 (0.0%) |
| Bachelor's Degree | 104 (89.7%) | 12 (10.3%) |
| Graduate Degree | 0 (0.0%) | 0 (0.0%) |
| Total | 221 (94.9%) | 12 (5.1%) |
Employment Characteristics in Timberlake
Employment by Class of Employer in Timberlake
Among the 7,052 employed individuals in Timberlake, private company employees (5,182 | 73.5%), not-for-profit organizations (974 | 13.8%), and local government employees (293 | 4.2%) make up the most common classes of employment.
| Employer Class | # Employees | % Employees |
| Private Company Employees | 5,182 | 73.5% |
| Self-Employed (Incorporated) | 196 | 2.8% |
| Self-Employed (Not Incorporated) | 148 | 2.1% |
| Not-for-profit Organizations | 974 | 13.8% |
| Local Government Employees | 293 | 4.2% |
| State Government Employees | 168 | 2.4% |
| Federal Government Employees | 91 | 1.3% |
| Unpaid Family Workers | 0 | 0.0% |
| Total | 7,052 | 100.0% |
Employment Status by Age in Timberlake
According to the labor force statistics for Timberlake, out of the total population over 16 years of age (10,910), 68.0% or 7,419 individuals are in the labor force, with 4.3% or 319 of them unemployed. The age group with the highest labor force participation rate is 20 to 24 years, with 97.1% or 1,089 individuals in the labor force. Within the labor force, the 16 to 19 years age range has the highest percentage of unemployed individuals, with 20.7% or 113 of them being unemployed.
| Age Bracket | In Labor Force | Unemployed |
| 16 to 19 Years | 547 (68.6%) | 113 (20.7%) |
| 20 to 24 Years | 1,089 (97.1%) | 54 (5.0%) |
| 25 to 29 Years | 906 (90.7%) | 30 (3.3%) |
| 30 to 34 Years | 646 (76.6%) | 0 (0.0%) |
| 35 to 44 Years | 1,511 (86.3%) | 51 (3.4%) |
| 45 to 54 Years | 1,413 (90.5%) | 13 (0.9%) |
| 55 to 59 Years | 539 (77.2%) | 34 (6.3%) |
| 60 to 64 Years | 461 (47.4%) | 0 (0.0%) |
| 65 to 74 Years | 243 (21.9%) | 26 (10.7%) |
| 75 Years and over | 62 (5.9%) | 0 (0.0%) |
| Total | 7,419 (68.0%) | 319 (4.3%) |
Employment Status by Educational Attainment in Timberlake
According to labor force statistics for Timberlake, 80.2% of individuals (5,474) out of the total population between 25 and 64 years of age (6,825) are in the labor force, with 2.4% or 131 of them being unemployed. The group with the highest labor force participation rate are those with the educational attainment of bachelor's degree or higher, with 87.5% or 2,038 individuals in the labor force. Within the labor force, individuals with less than high school education have the highest percentage of unemployment, with 19.1% or 26 of them being unemployed.
| Educational Attainment | In Labor Force | Unemployed |
| Less than High School | 136 (61.5%) | 42 (19.1%) |
| High School Diploma | 1,457 (76.5%) | 0 (0.0%) |
| College / Associate Degree | 1,845 (77.8%) | 78 (3.3%) |
| Bachelor's Degree or higher | 2,038 (87.5%) | 49 (2.1%) |
| Total | 5,474 (80.2%) | 164 (2.4%) |
Employment Occupations by Sex in Timberlake
Management, Business, Science and Arts Occupations
The most common Management, Business, Science and Arts occupations in Timberlake are Community & Social Service (720 | 10.2%), Management (615 | 8.7%), Business & Financial (503 | 7.1%), Computers, Engineering & Science (434 | 6.1%), and Health Diagnosing & Treating (359 | 5.1%).
Management, Business, Science and Arts Occupations by Sex
Within the Management, Business, Science and Arts occupations in Timberlake, the most male-oriented occupations are Life, Physical & Social Science (100.0%), Architecture & Engineering (94.1%), and Computers, Engineering & Science (85.0%), while the most female-oriented occupations are Health Diagnosing & Treating (89.1%), Health Technologists (88.1%), and Education Instruction & Library (65.0%).
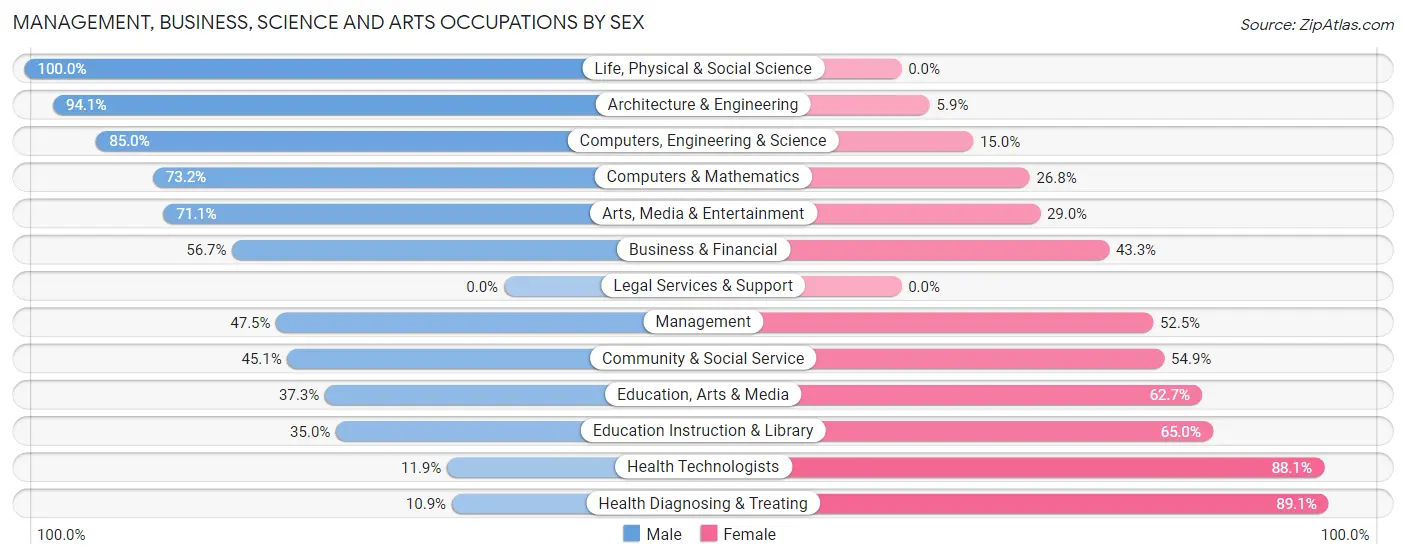
| Occupation | Male | Female |
| Management | 292 (47.5%) | 323 (52.5%) |
| Business & Financial | 285 (56.7%) | 218 (43.3%) |
| Computers, Engineering & Science | 369 (85.0%) | 65 (15.0%) |
| Computers & Mathematics | 145 (73.2%) | 53 (26.8%) |
| Architecture & Engineering | 190 (94.1%) | 12 (5.9%) |
| Life, Physical & Social Science | 34 (100.0%) | 0 (0.0%) |
| Community & Social Service | 325 (45.1%) | 395 (54.9%) |
| Education, Arts & Media | 72 (37.3%) | 121 (62.7%) |
| Legal Services & Support | 0 (0.0%) | 0 (0.0%) |
| Education Instruction & Library | 118 (35.0%) | 219 (65.0%) |
| Arts, Media & Entertainment | 135 (71.1%) | 55 (28.9%) |
| Health Diagnosing & Treating | 39 (10.9%) | 320 (89.1%) |
| Health Technologists | 28 (11.9%) | 208 (88.1%) |
| Total (Category) | 1,310 (49.8%) | 1,321 (50.2%) |
| Total (Overall) | 3,648 (51.4%) | 3,447 (48.6%) |
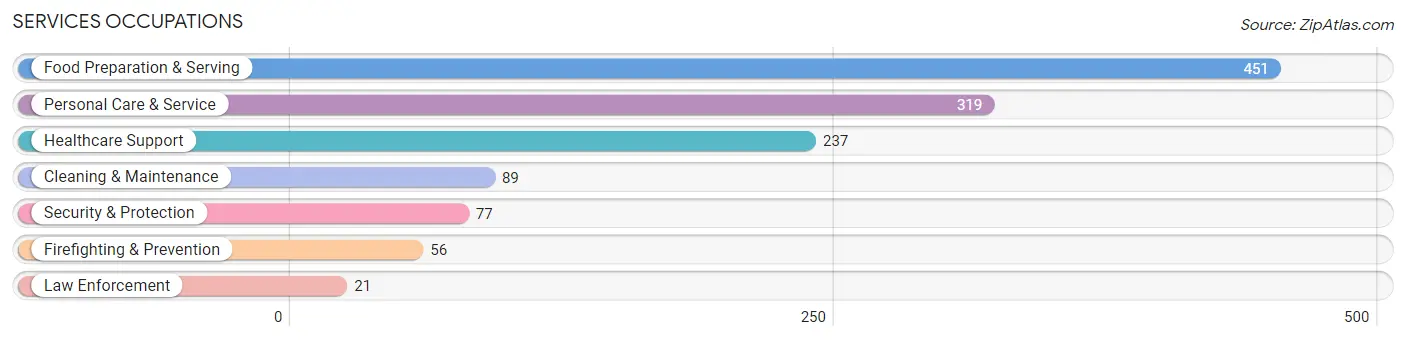
Services Occupations
The most common Services occupations in Timberlake are Food Preparation & Serving (451 | 6.4%), Personal Care & Service (319 | 4.5%), Healthcare Support (237 | 3.3%), Cleaning & Maintenance (89 | 1.3%), and Security & Protection (77 | 1.1%).
Services Occupations by Sex
Within the Services occupations in Timberlake, the most male-oriented occupations are Law Enforcement (100.0%), Cleaning & Maintenance (75.3%), and Food Preparation & Serving (56.8%), while the most female-oriented occupations are Healthcare Support (95.8%), Firefighting & Prevention (62.5%), and Personal Care & Service (50.2%).
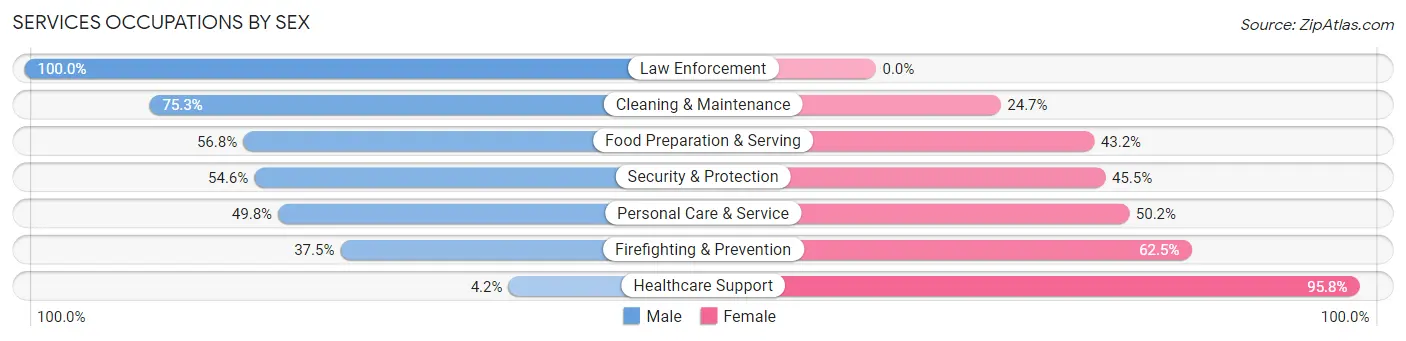
| Occupation | Male | Female |
| Healthcare Support | 10 (4.2%) | 227 (95.8%) |
| Security & Protection | 42 (54.5%) | 35 (45.5%) |
| Firefighting & Prevention | 21 (37.5%) | 35 (62.5%) |
| Law Enforcement | 21 (100.0%) | 0 (0.0%) |
| Food Preparation & Serving | 256 (56.8%) | 195 (43.2%) |
| Cleaning & Maintenance | 67 (75.3%) | 22 (24.7%) |
| Personal Care & Service | 159 (49.8%) | 160 (50.2%) |
| Total (Category) | 534 (45.5%) | 639 (54.5%) |
| Total (Overall) | 3,648 (51.4%) | 3,447 (48.6%) |
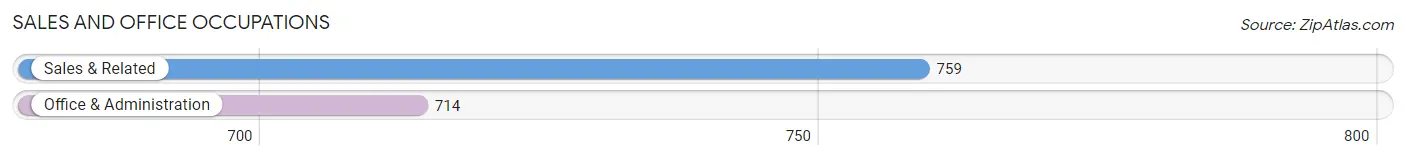
Sales and Office Occupations
The most common Sales and Office occupations in Timberlake are Sales & Related (759 | 10.7%), and Office & Administration (714 | 10.1%).
Sales and Office Occupations by Sex
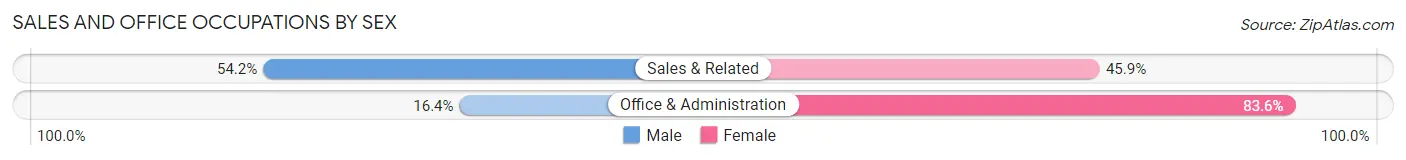
| Occupation | Male | Female |
| Sales & Related | 411 (54.1%) | 348 (45.9%) |
| Office & Administration | 117 (16.4%) | 597 (83.6%) |
| Total (Category) | 528 (35.8%) | 945 (64.1%) |
| Total (Overall) | 3,648 (51.4%) | 3,447 (48.6%) |
Natural Resources, Construction and Maintenance Occupations
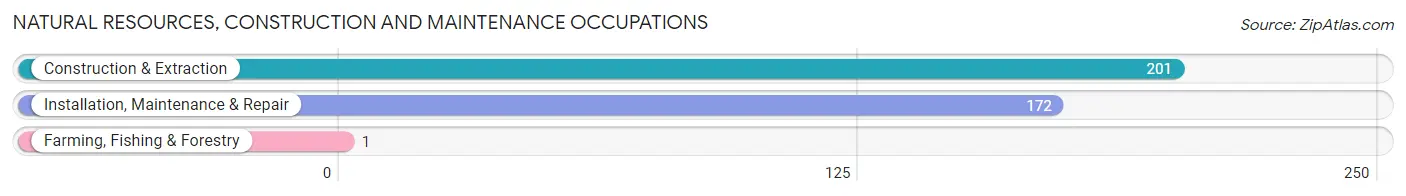
The most common Natural Resources, Construction and Maintenance occupations in Timberlake are Construction & Extraction (201 | 2.8%), Installation, Maintenance & Repair (172 | 2.4%), and Farming, Fishing & Forestry (1 | 0.0%).
Natural Resources, Construction and Maintenance Occupations by Sex
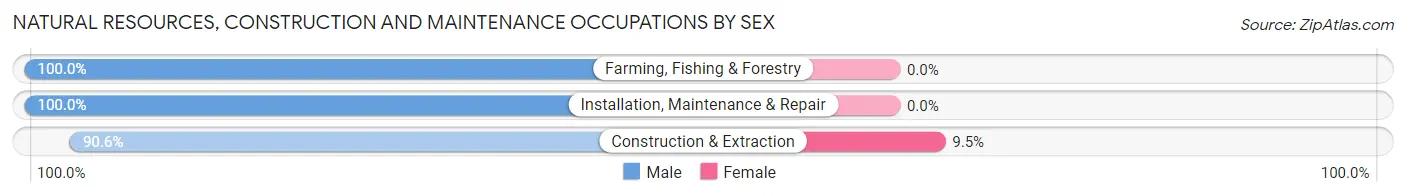
| Occupation | Male | Female |
| Farming, Fishing & Forestry | 1 (100.0%) | 0 (0.0%) |
| Construction & Extraction | 182 (90.5%) | 19 (9.5%) |
| Installation, Maintenance & Repair | 172 (100.0%) | 0 (0.0%) |
| Total (Category) | 355 (94.9%) | 19 (5.1%) |
| Total (Overall) | 3,648 (51.4%) | 3,447 (48.6%) |
Production, Transportation and Moving Occupations
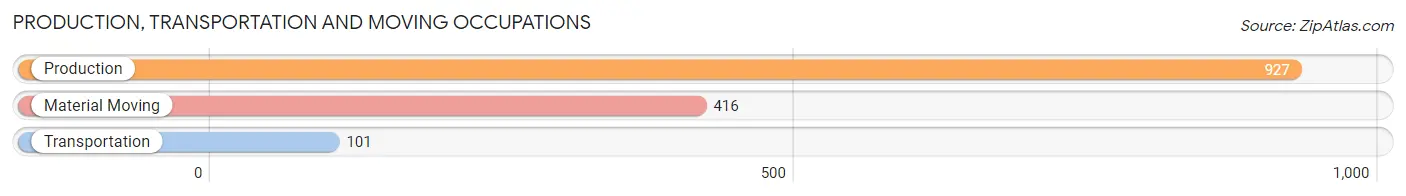
The most common Production, Transportation and Moving occupations in Timberlake are Production (927 | 13.1%), Material Moving (416 | 5.9%), and Transportation (101 | 1.4%).
Production, Transportation and Moving Occupations by Sex
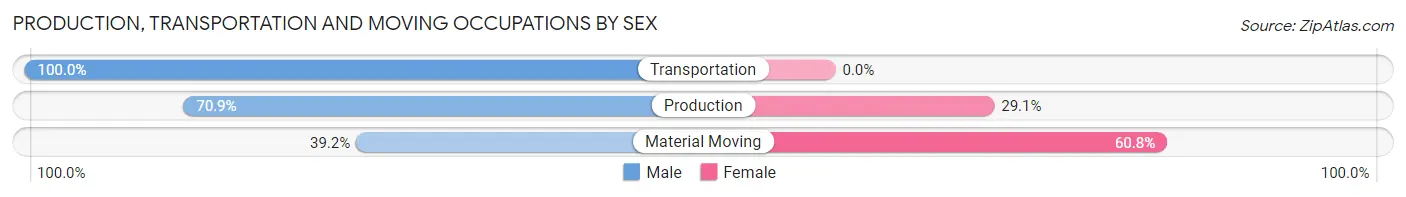
| Occupation | Male | Female |
| Production | 657 (70.9%) | 270 (29.1%) |
| Transportation | 101 (100.0%) | 0 (0.0%) |
| Material Moving | 163 (39.2%) | 253 (60.8%) |
| Total (Category) | 921 (63.8%) | 523 (36.2%) |
| Total (Overall) | 3,648 (51.4%) | 3,447 (48.6%) |
Employment Industries by Sex in Timberlake
Employment Industries in Timberlake
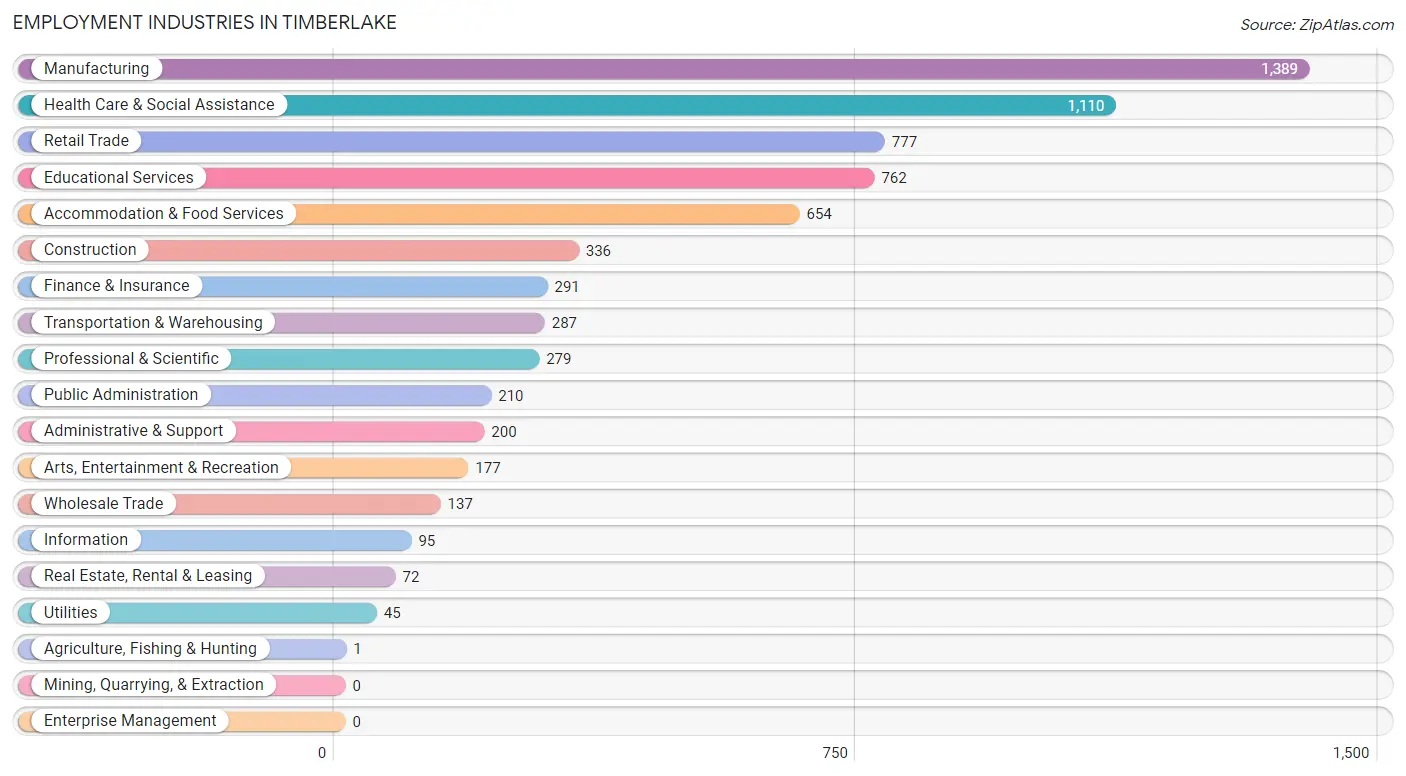
The major employment industries in Timberlake include Manufacturing (1,389 | 19.6%), Health Care & Social Assistance (1,110 | 15.6%), Retail Trade (777 | 11.0%), Educational Services (762 | 10.7%), and Accommodation & Food Services (654 | 9.2%).
Employment Industries by Sex in Timberlake
The Timberlake industries that see more men than women are Agriculture, Fishing & Hunting (100.0%), Construction (95.2%), and Information (93.7%), whereas the industries that tend to have a higher number of women are Real Estate, Rental & Leasing (100.0%), Health Care & Social Assistance (92.4%), and Finance & Insurance (64.9%).
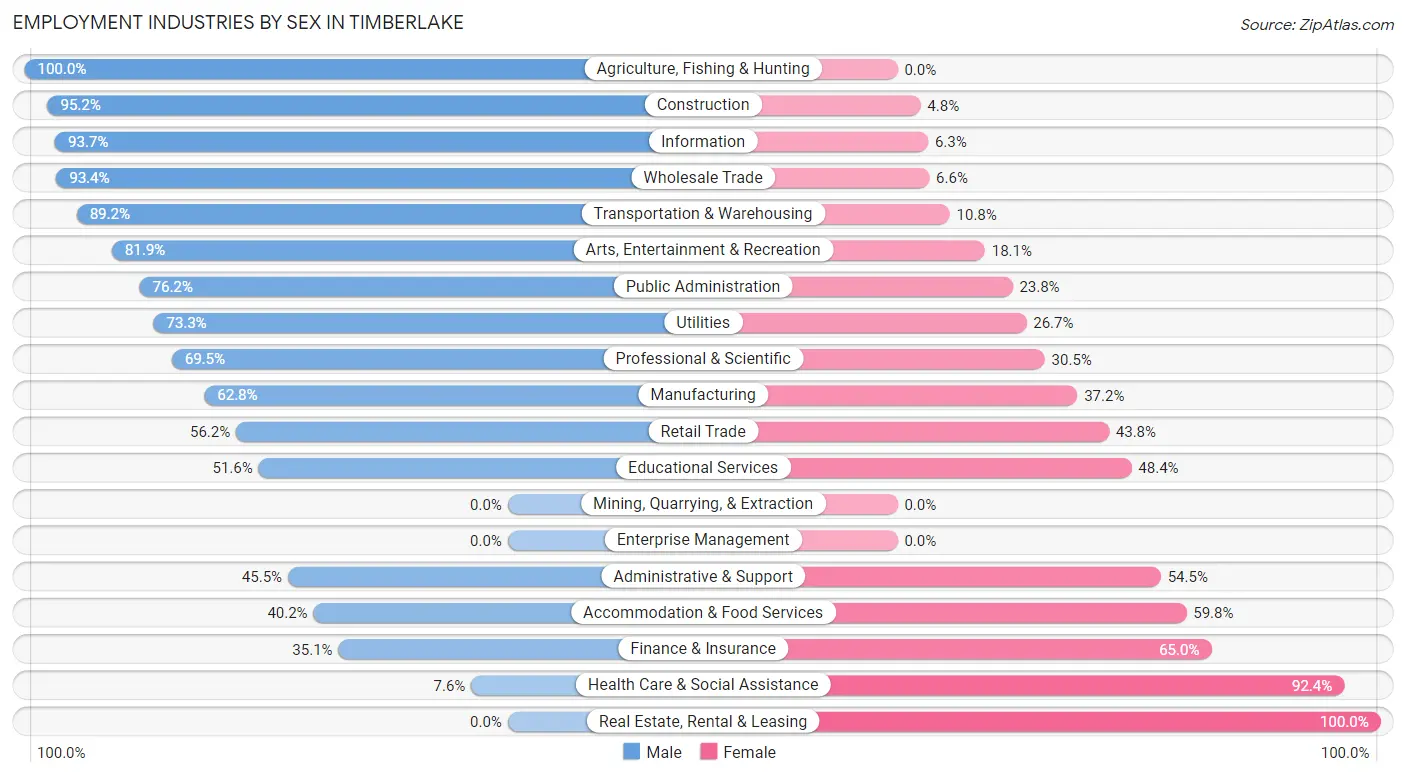
| Industry | Male | Female |
| Agriculture, Fishing & Hunting | 1 (100.0%) | 0 (0.0%) |
| Mining, Quarrying, & Extraction | 0 (0.0%) | 0 (0.0%) |
| Construction | 320 (95.2%) | 16 (4.8%) |
| Manufacturing | 872 (62.8%) | 517 (37.2%) |
| Wholesale Trade | 128 (93.4%) | 9 (6.6%) |
| Retail Trade | 437 (56.2%) | 340 (43.8%) |
| Transportation & Warehousing | 256 (89.2%) | 31 (10.8%) |
| Utilities | 33 (73.3%) | 12 (26.7%) |
| Information | 89 (93.7%) | 6 (6.3%) |
| Finance & Insurance | 102 (35.0%) | 189 (64.9%) |
| Real Estate, Rental & Leasing | 0 (0.0%) | 72 (100.0%) |
| Professional & Scientific | 194 (69.5%) | 85 (30.5%) |
| Enterprise Management | 0 (0.0%) | 0 (0.0%) |
| Administrative & Support | 91 (45.5%) | 109 (54.5%) |
| Educational Services | 393 (51.6%) | 369 (48.4%) |
| Health Care & Social Assistance | 84 (7.6%) | 1,026 (92.4%) |
| Arts, Entertainment & Recreation | 145 (81.9%) | 32 (18.1%) |
| Accommodation & Food Services | 263 (40.2%) | 391 (59.8%) |
| Public Administration | 160 (76.2%) | 50 (23.8%) |
| Total | 3,648 (51.4%) | 3,447 (48.6%) |
Education in Timberlake
School Enrollment in Timberlake
The most common levels of schooling among the 3,247 students in Timberlake are college / undergraduate (803 | 24.7%), elementary school (616 | 19.0%), and high school (578 | 17.8%).
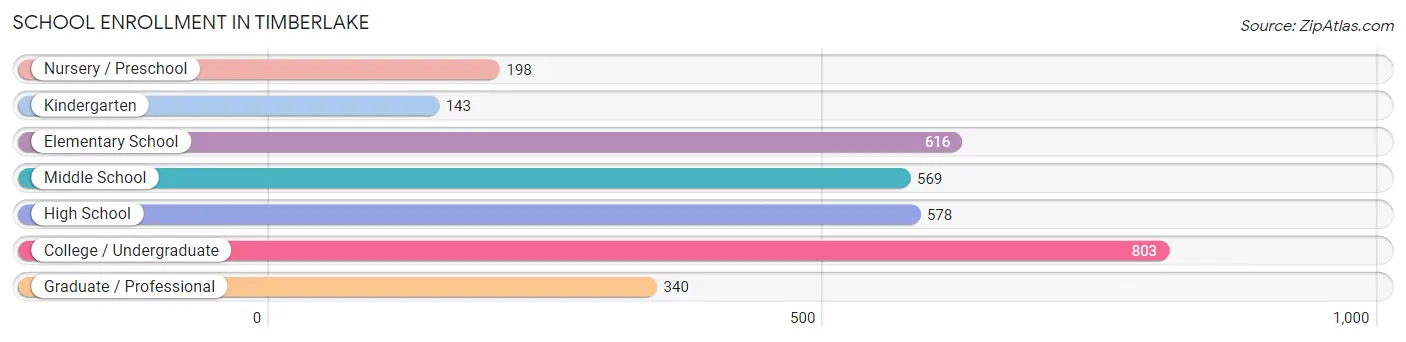
| School Level | # Students | % Students |
| Nursery / Preschool | 198 | 6.1% |
| Kindergarten | 143 | 4.4% |
| Elementary School | 616 | 19.0% |
| Middle School | 569 | 17.5% |
| High School | 578 | 17.8% |
| College / Undergraduate | 803 | 24.7% |
| Graduate / Professional | 340 | 10.5% |
| Total | 3,247 | 100.0% |
School Enrollment by Age by Funding Source in Timberlake
Out of a total of 3,247 students who are enrolled in schools in Timberlake, 1,322 (40.7%) attend a private institution, while the remaining 1,925 (59.3%) are enrolled in public schools. The age group of 20 to 24 year olds has the highest likelihood of being enrolled in private schools, with 419 (81.8% in the age bracket) enrolled. Conversely, the age group of 15 to 17 year olds has the lowest likelihood of being enrolled in a private school, with 366 (87.6% in the age bracket) attending a public institution.
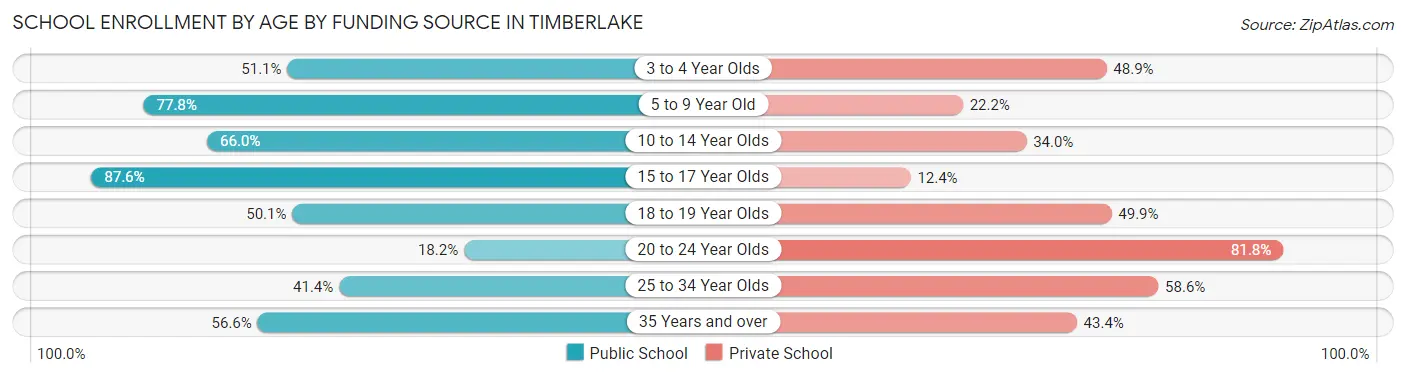
| Age Bracket | Public School | Private School |
| 3 to 4 Year Olds | 72 (51.1%) | 69 (48.9%) |
| 5 to 9 Year Old | 618 (77.8%) | 176 (22.2%) |
| 10 to 14 Year Olds | 396 (66.0%) | 204 (34.0%) |
| 15 to 17 Year Olds | 366 (87.6%) | 52 (12.4%) |
| 18 to 19 Year Olds | 178 (50.1%) | 177 (49.9%) |
| 20 to 24 Year Olds | 93 (18.2%) | 419 (81.8%) |
| 25 to 34 Year Olds | 111 (41.4%) | 157 (58.6%) |
| 35 Years and over | 90 (56.6%) | 69 (43.4%) |
| Total | 1,925 (59.3%) | 1,322 (40.7%) |
Educational Attainment by Field of Study in Timberlake
Business (549 | 17.7%), education (493 | 15.9%), science & technology (472 | 15.2%), arts & humanities (349 | 11.3%), and liberal arts & history (177 | 5.7%) are the most common fields of study among 3,102 individuals in Timberlake who have obtained a bachelor's degree or higher.
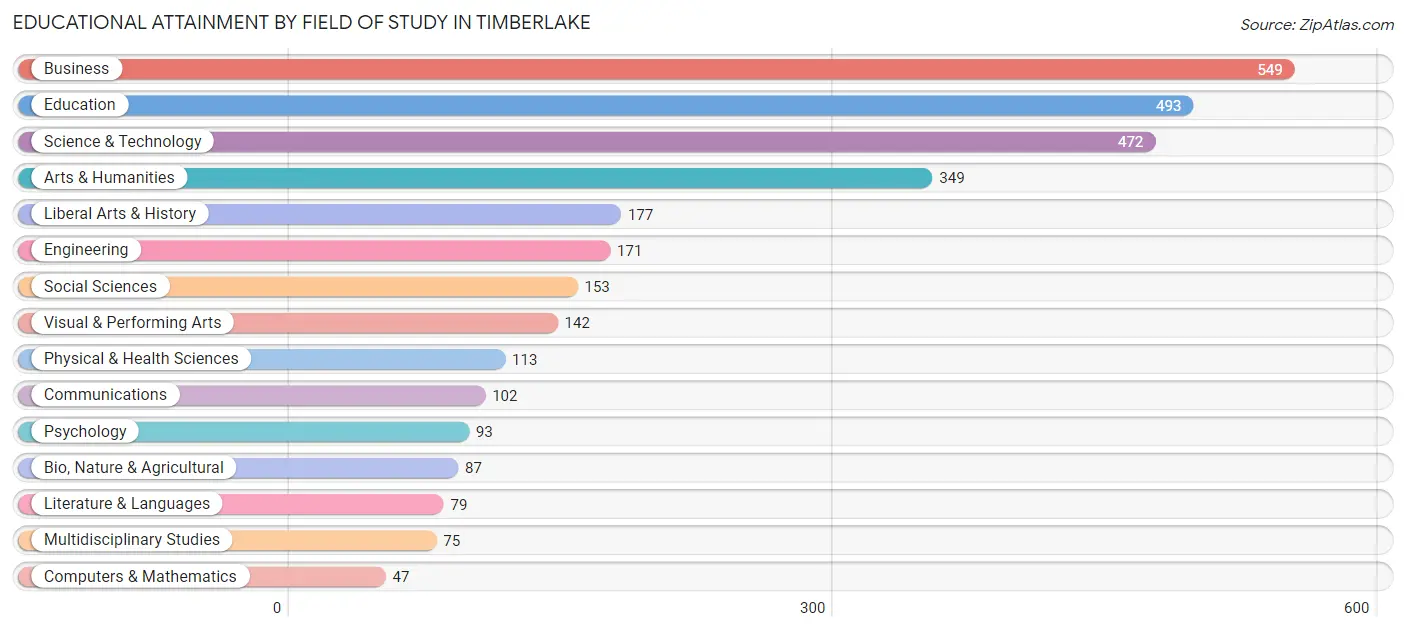
| Field of Study | # Graduates | % Graduates |
| Computers & Mathematics | 47 | 1.5% |
| Bio, Nature & Agricultural | 87 | 2.8% |
| Physical & Health Sciences | 113 | 3.6% |
| Psychology | 93 | 3.0% |
| Social Sciences | 153 | 4.9% |
| Engineering | 171 | 5.5% |
| Multidisciplinary Studies | 75 | 2.4% |
| Science & Technology | 472 | 15.2% |
| Business | 549 | 17.7% |
| Education | 493 | 15.9% |
| Literature & Languages | 79 | 2.5% |
| Liberal Arts & History | 177 | 5.7% |
| Visual & Performing Arts | 142 | 4.6% |
| Communications | 102 | 3.3% |
| Arts & Humanities | 349 | 11.3% |
| Total | 3,102 | 100.0% |
Transportation & Commute in Timberlake
Vehicle Availability by Sex in Timberlake
The most prevalent vehicle ownership categories in Timberlake are males with 2 vehicles (1,512, accounting for 41.8%) and females with 2 vehicles (1,515, making up 44.0%).
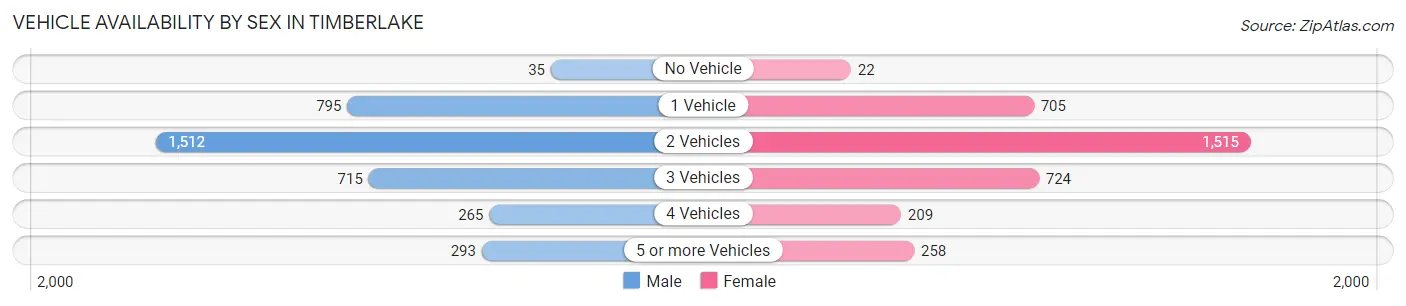
| Vehicles Available | Male | Female |
| No Vehicle | 35 (1.0%) | 22 (0.6%) |
| 1 Vehicle | 795 (22.0%) | 705 (20.5%) |
| 2 Vehicles | 1,512 (41.8%) | 1,515 (44.1%) |
| 3 Vehicles | 715 (19.8%) | 724 (21.1%) |
| 4 Vehicles | 265 (7.3%) | 209 (6.1%) |
| 5 or more Vehicles | 293 (8.1%) | 258 (7.5%) |
| Total | 3,615 (100.0%) | 3,433 (100.0%) |
Commute Time in Timberlake
The most frequently occuring commute durations in Timberlake are 15 to 19 minutes (1,538 commuters, 23.8%), 10 to 14 minutes (1,476 commuters, 22.9%), and 20 to 24 minutes (1,136 commuters, 17.6%).
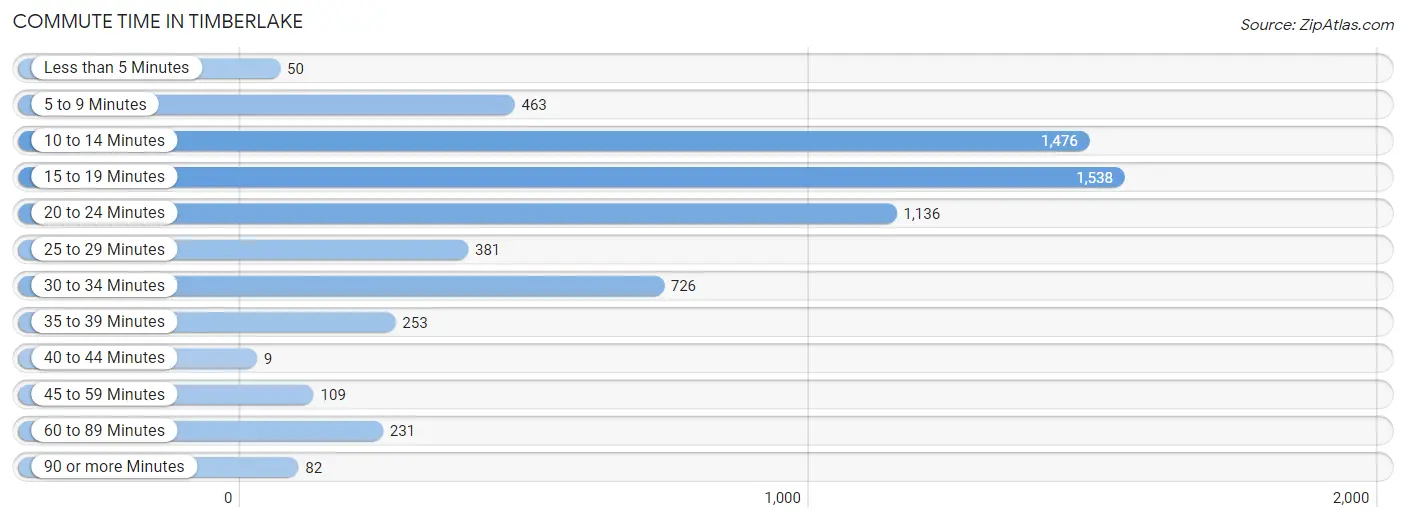
| Commute Time | # Commuters | % Commuters |
| Less than 5 Minutes | 50 | 0.8% |
| 5 to 9 Minutes | 463 | 7.2% |
| 10 to 14 Minutes | 1,476 | 22.9% |
| 15 to 19 Minutes | 1,538 | 23.8% |
| 20 to 24 Minutes | 1,136 | 17.6% |
| 25 to 29 Minutes | 381 | 5.9% |
| 30 to 34 Minutes | 726 | 11.3% |
| 35 to 39 Minutes | 253 | 3.9% |
| 40 to 44 Minutes | 9 | 0.1% |
| 45 to 59 Minutes | 109 | 1.7% |
| 60 to 89 Minutes | 231 | 3.6% |
| 90 or more Minutes | 82 | 1.3% |
Commute Time by Sex in Timberlake
The most common commute times in Timberlake are 15 to 19 minutes (948 commuters, 29.4%) for males and 10 to 14 minutes (871 commuters, 27.0%) for females.
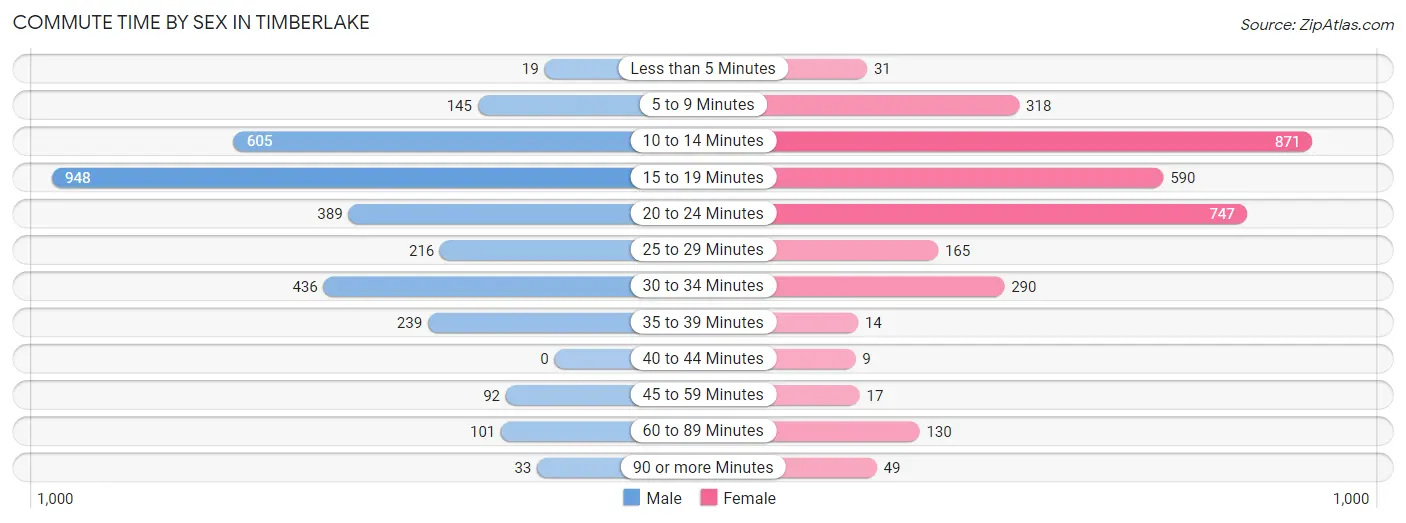
| Commute Time | Male | Female |
| Less than 5 Minutes | 19 (0.6%) | 31 (1.0%) |
| 5 to 9 Minutes | 145 (4.5%) | 318 (9.8%) |
| 10 to 14 Minutes | 605 (18.8%) | 871 (27.0%) |
| 15 to 19 Minutes | 948 (29.4%) | 590 (18.3%) |
| 20 to 24 Minutes | 389 (12.1%) | 747 (23.1%) |
| 25 to 29 Minutes | 216 (6.7%) | 165 (5.1%) |
| 30 to 34 Minutes | 436 (13.5%) | 290 (9.0%) |
| 35 to 39 Minutes | 239 (7.4%) | 14 (0.4%) |
| 40 to 44 Minutes | 0 (0.0%) | 9 (0.3%) |
| 45 to 59 Minutes | 92 (2.9%) | 17 (0.5%) |
| 60 to 89 Minutes | 101 (3.1%) | 130 (4.0%) |
| 90 or more Minutes | 33 (1.0%) | 49 (1.5%) |
Time of Departure to Work by Sex in Timberlake
The most frequent times of departure to work in Timberlake are 12:00 PM to 3:59 PM (559, 17.3%) for males and 7:30 AM to 7:59 AM (580, 17.9%) for females.
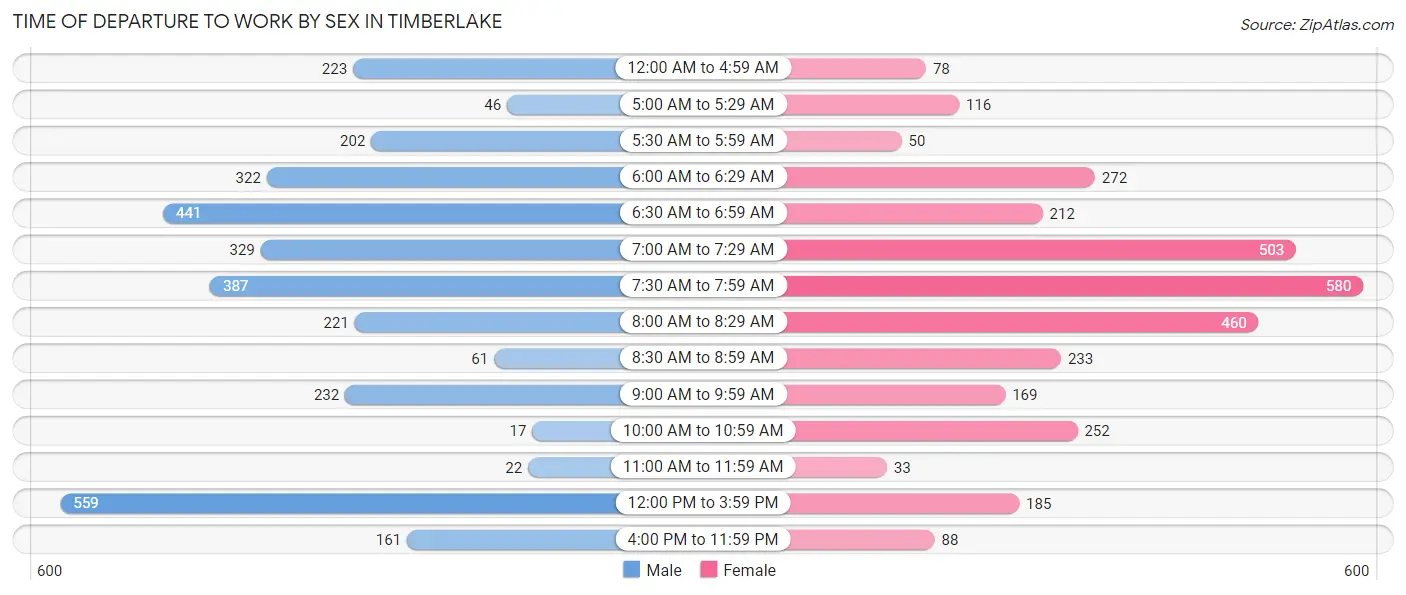
| Time of Departure | Male | Female |
| 12:00 AM to 4:59 AM | 223 (6.9%) | 78 (2.4%) |
| 5:00 AM to 5:29 AM | 46 (1.4%) | 116 (3.6%) |
| 5:30 AM to 5:59 AM | 202 (6.3%) | 50 (1.5%) |
| 6:00 AM to 6:29 AM | 322 (10.0%) | 272 (8.4%) |
| 6:30 AM to 6:59 AM | 441 (13.7%) | 212 (6.6%) |
| 7:00 AM to 7:29 AM | 329 (10.2%) | 503 (15.6%) |
| 7:30 AM to 7:59 AM | 387 (12.0%) | 580 (17.9%) |
| 8:00 AM to 8:29 AM | 221 (6.9%) | 460 (14.2%) |
| 8:30 AM to 8:59 AM | 61 (1.9%) | 233 (7.2%) |
| 9:00 AM to 9:59 AM | 232 (7.2%) | 169 (5.2%) |
| 10:00 AM to 10:59 AM | 17 (0.5%) | 252 (7.8%) |
| 11:00 AM to 11:59 AM | 22 (0.7%) | 33 (1.0%) |
| 12:00 PM to 3:59 PM | 559 (17.3%) | 185 (5.7%) |
| 4:00 PM to 11:59 PM | 161 (5.0%) | 88 (2.7%) |
| Total | 3,223 (100.0%) | 3,231 (100.0%) |
Housing Occupancy in Timberlake
Occupancy by Ownership in Timberlake
Of the total 5,200 dwellings in Timberlake, owner-occupied units account for 3,323 (63.9%), while renter-occupied units make up 1,877 (36.1%).
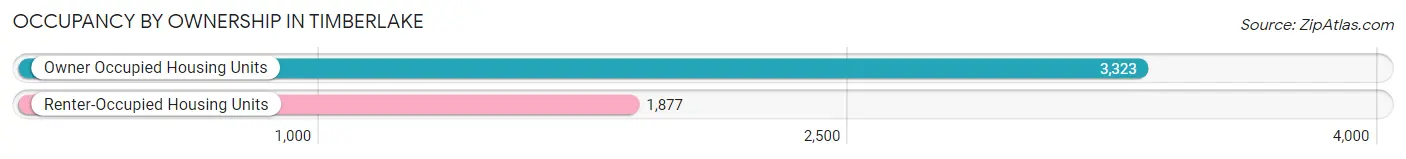
| Occupancy | # Housing Units | % Housing Units |
| Owner Occupied Housing Units | 3,323 | 63.9% |
| Renter-Occupied Housing Units | 1,877 | 36.1% |
| Total Occupied Housing Units | 5,200 | 100.0% |
Occupancy by Household Size in Timberlake
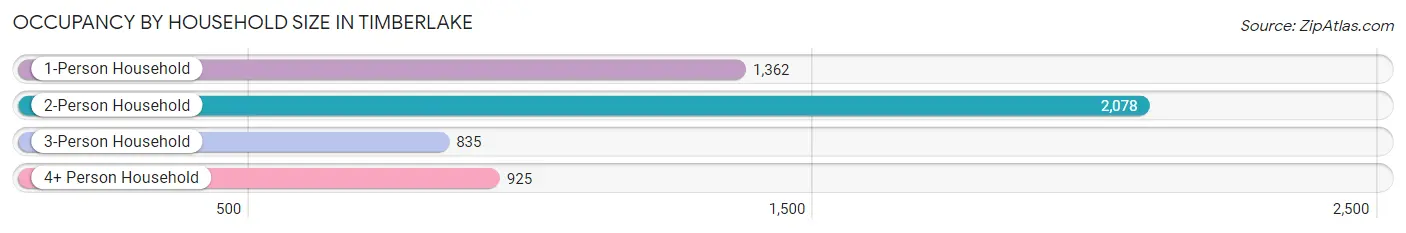
| Household Size | # Housing Units | % Housing Units |
| 1-Person Household | 1,362 | 26.2% |
| 2-Person Household | 2,078 | 40.0% |
| 3-Person Household | 835 | 16.1% |
| 4+ Person Household | 925 | 17.8% |
| Total Housing Units | 5,200 | 100.0% |
Occupancy by Ownership by Household Size in Timberlake
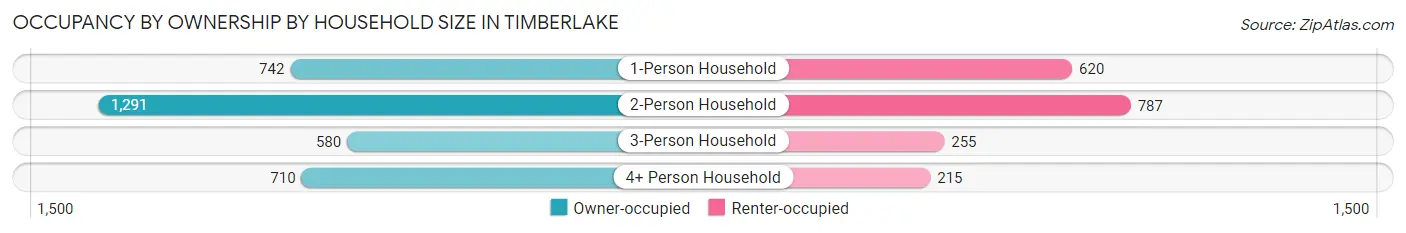
| Household Size | Owner-occupied | Renter-occupied |
| 1-Person Household | 742 (54.5%) | 620 (45.5%) |
| 2-Person Household | 1,291 (62.1%) | 787 (37.9%) |
| 3-Person Household | 580 (69.5%) | 255 (30.5%) |
| 4+ Person Household | 710 (76.8%) | 215 (23.2%) |
| Total Housing Units | 3,323 (63.9%) | 1,877 (36.1%) |
Occupancy by Educational Attainment in Timberlake
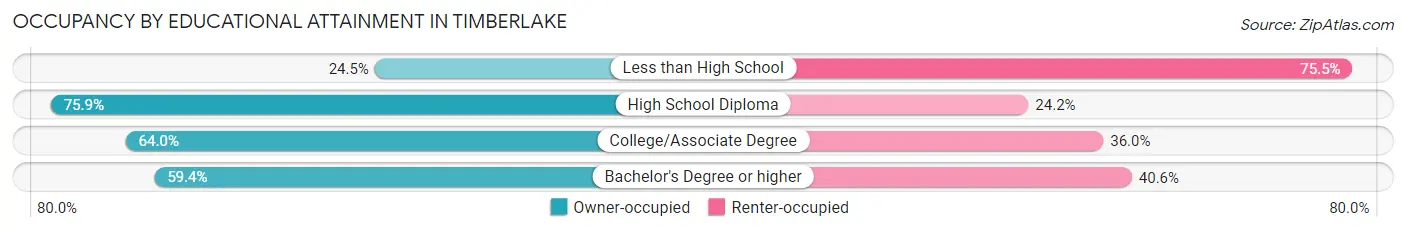
| Household Size | Owner-occupied | Renter-occupied |
| Less than High School | 46 (24.5%) | 142 (75.5%) |
| High School Diploma | 980 (75.8%) | 312 (24.1%) |
| College/Associate Degree | 1,211 (64.0%) | 682 (36.0%) |
| Bachelor's Degree or higher | 1,086 (59.4%) | 741 (40.6%) |
Occupancy by Age of Householder in Timberlake
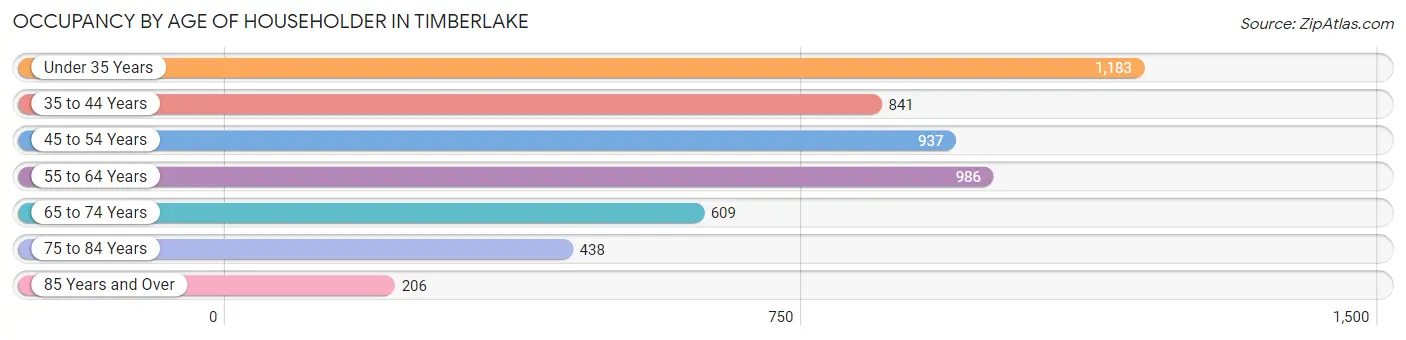
| Age Bracket | # Households | % Households |
| Under 35 Years | 1,183 | 22.8% |
| 35 to 44 Years | 841 | 16.2% |
| 45 to 54 Years | 937 | 18.0% |
| 55 to 64 Years | 986 | 19.0% |
| 65 to 74 Years | 609 | 11.7% |
| 75 to 84 Years | 438 | 8.4% |
| 85 Years and Over | 206 | 4.0% |
| Total | 5,200 | 100.0% |
Housing Finances in Timberlake
Median Income by Occupancy in Timberlake
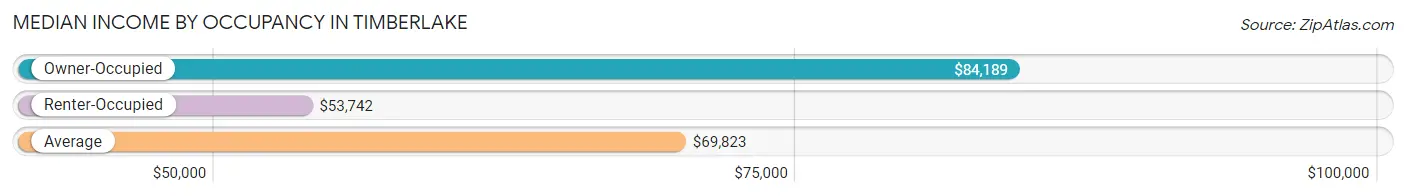
| Occupancy Type | # Households | Median Income |
| Owner-Occupied | 3,323 (63.9%) | $84,189 |
| Renter-Occupied | 1,877 (36.1%) | $53,742 |
| Average | 5,200 (100.0%) | $69,823 |
Occupancy by Householder Income Bracket in Timberlake
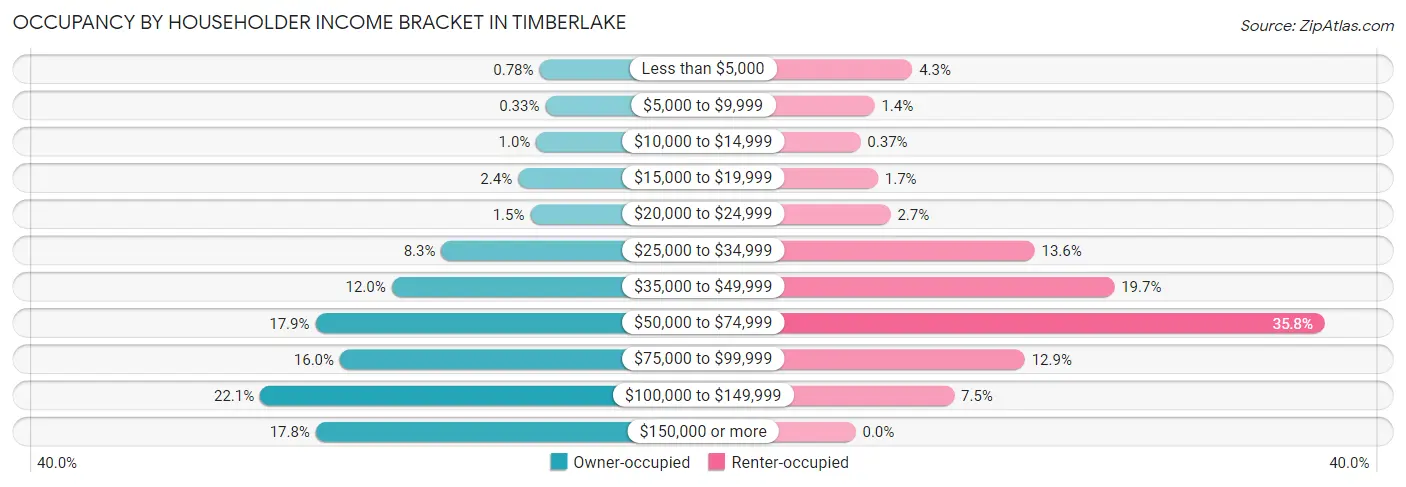
| Income Bracket | Owner-occupied | Renter-occupied |
| Less than $5,000 | 26 (0.8%) | 81 (4.3%) |
| $5,000 to $9,999 | 11 (0.3%) | 27 (1.4%) |
| $10,000 to $14,999 | 34 (1.0%) | 7 (0.4%) |
| $15,000 to $19,999 | 80 (2.4%) | 32 (1.7%) |
| $20,000 to $24,999 | 49 (1.5%) | 50 (2.7%) |
| $25,000 to $34,999 | 274 (8.3%) | 256 (13.6%) |
| $35,000 to $49,999 | 400 (12.0%) | 370 (19.7%) |
| $50,000 to $74,999 | 593 (17.8%) | 671 (35.7%) |
| $75,000 to $99,999 | 531 (16.0%) | 242 (12.9%) |
| $100,000 to $149,999 | 733 (22.1%) | 141 (7.5%) |
| $150,000 or more | 592 (17.8%) | 0 (0.0%) |
| Total | 3,323 (100.0%) | 1,877 (100.0%) |
Monthly Housing Cost Tiers in Timberlake
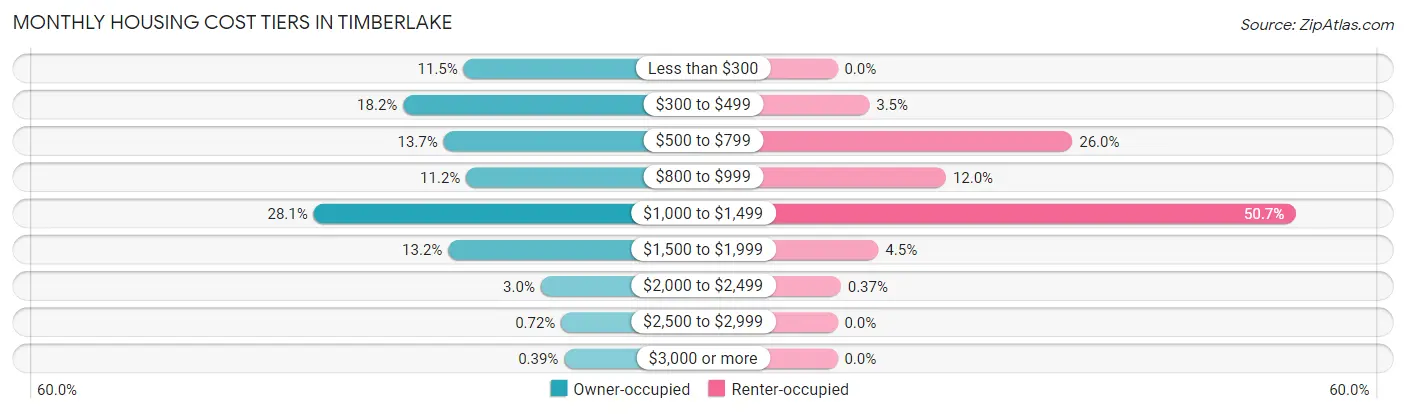
| Monthly Cost | Owner-occupied | Renter-occupied |
| Less than $300 | 382 (11.5%) | 0 (0.0%) |
| $300 to $499 | 604 (18.2%) | 66 (3.5%) |
| $500 to $799 | 456 (13.7%) | 487 (26.0%) |
| $800 to $999 | 373 (11.2%) | 225 (12.0%) |
| $1,000 to $1,499 | 933 (28.1%) | 951 (50.7%) |
| $1,500 to $1,999 | 439 (13.2%) | 85 (4.5%) |
| $2,000 to $2,499 | 99 (3.0%) | 7 (0.4%) |
| $2,500 to $2,999 | 24 (0.7%) | 0 (0.0%) |
| $3,000 or more | 13 (0.4%) | 0 (0.0%) |
| Total | 3,323 (100.0%) | 1,877 (100.0%) |
Physical Housing Characteristics in Timberlake
Housing Structures in Timberlake
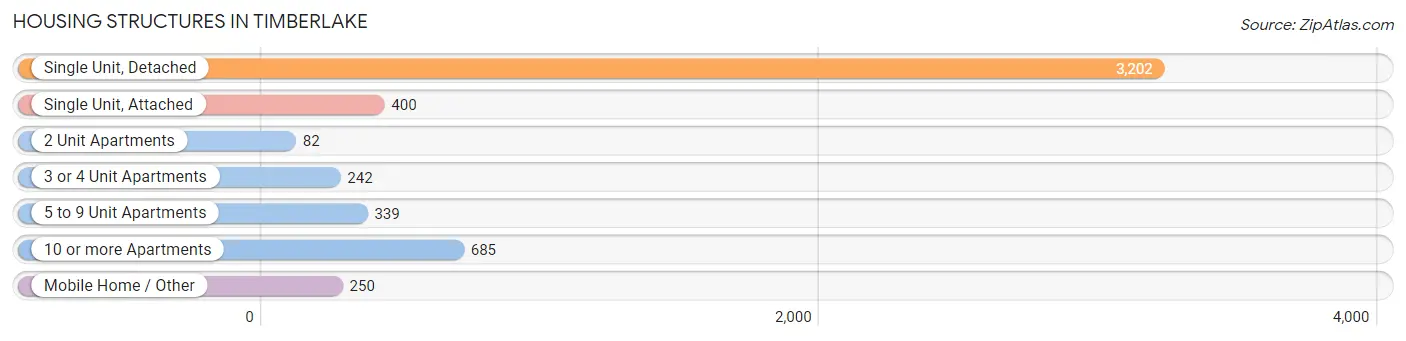
| Structure Type | # Housing Units | % Housing Units |
| Single Unit, Detached | 3,202 | 61.6% |
| Single Unit, Attached | 400 | 7.7% |
| 2 Unit Apartments | 82 | 1.6% |
| 3 or 4 Unit Apartments | 242 | 4.6% |
| 5 to 9 Unit Apartments | 339 | 6.5% |
| 10 or more Apartments | 685 | 13.2% |
| Mobile Home / Other | 250 | 4.8% |
| Total | 5,200 | 100.0% |
Housing Structures by Occupancy in Timberlake
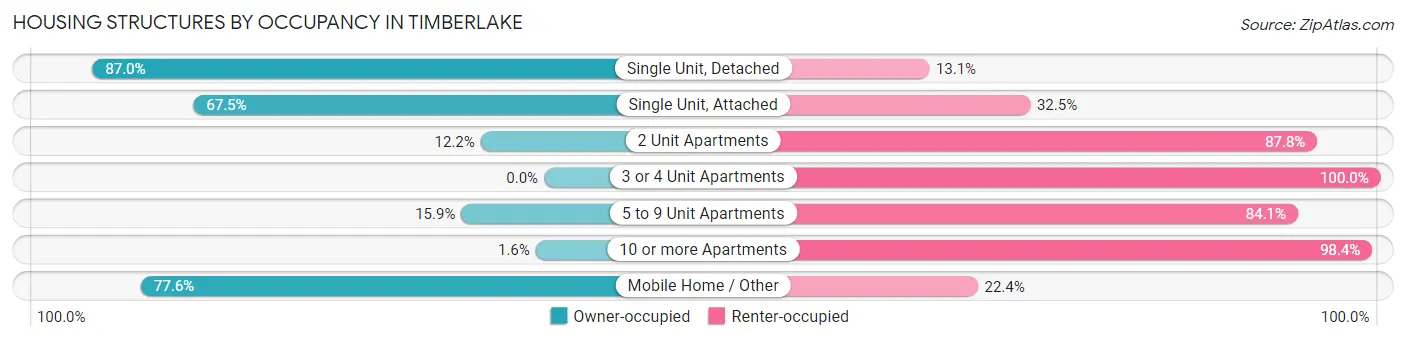
| Structure Type | Owner-occupied | Renter-occupied |
| Single Unit, Detached | 2,784 (87.0%) | 418 (13.1%) |
| Single Unit, Attached | 270 (67.5%) | 130 (32.5%) |
| 2 Unit Apartments | 10 (12.2%) | 72 (87.8%) |
| 3 or 4 Unit Apartments | 0 (0.0%) | 242 (100.0%) |
| 5 to 9 Unit Apartments | 54 (15.9%) | 285 (84.1%) |
| 10 or more Apartments | 11 (1.6%) | 674 (98.4%) |
| Mobile Home / Other | 194 (77.6%) | 56 (22.4%) |
| Total | 3,323 (63.9%) | 1,877 (36.1%) |
Housing Structures by Number of Rooms in Timberlake
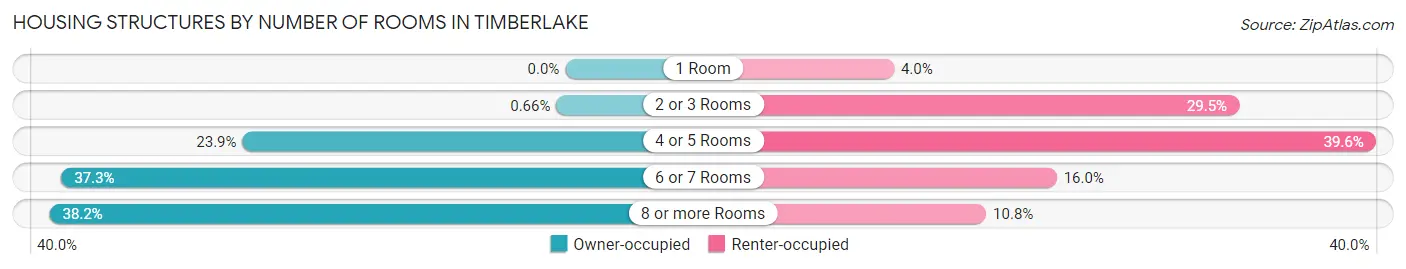
| Number of Rooms | Owner-occupied | Renter-occupied |
| 1 Room | 0 (0.0%) | 75 (4.0%) |
| 2 or 3 Rooms | 22 (0.7%) | 554 (29.5%) |
| 4 or 5 Rooms | 794 (23.9%) | 744 (39.6%) |
| 6 or 7 Rooms | 1,239 (37.3%) | 301 (16.0%) |
| 8 or more Rooms | 1,268 (38.2%) | 203 (10.8%) |
| Total | 3,323 (100.0%) | 1,877 (100.0%) |
Housing Structure by Heating Type in Timberlake
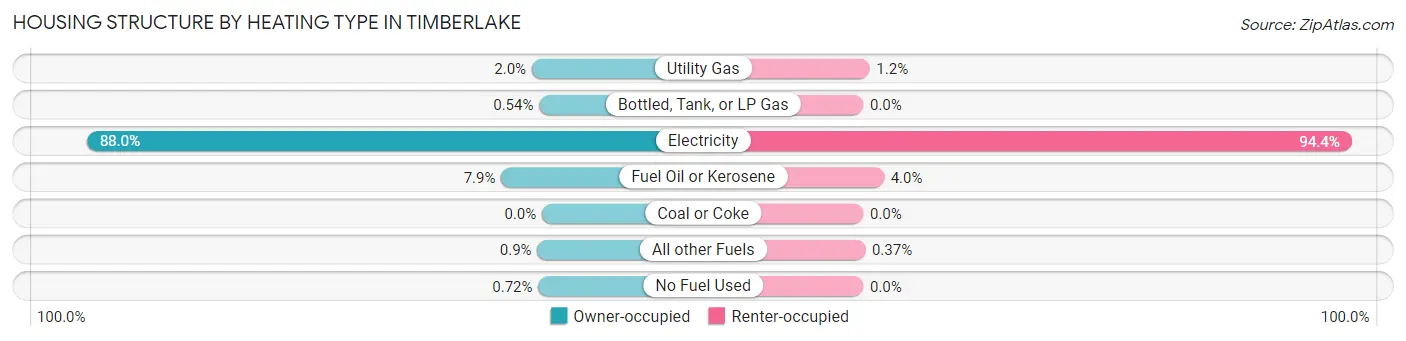
| Heating Type | Owner-occupied | Renter-occupied |
| Utility Gas | 65 (2.0%) | 23 (1.2%) |
| Bottled, Tank, or LP Gas | 18 (0.5%) | 0 (0.0%) |
| Electricity | 2,924 (88.0%) | 1,772 (94.4%) |
| Fuel Oil or Kerosene | 262 (7.9%) | 75 (4.0%) |
| Coal or Coke | 0 (0.0%) | 0 (0.0%) |
| All other Fuels | 30 (0.9%) | 7 (0.4%) |
| No Fuel Used | 24 (0.7%) | 0 (0.0%) |
| Total | 3,323 (100.0%) | 1,877 (100.0%) |
Household Vehicle Usage in Timberlake
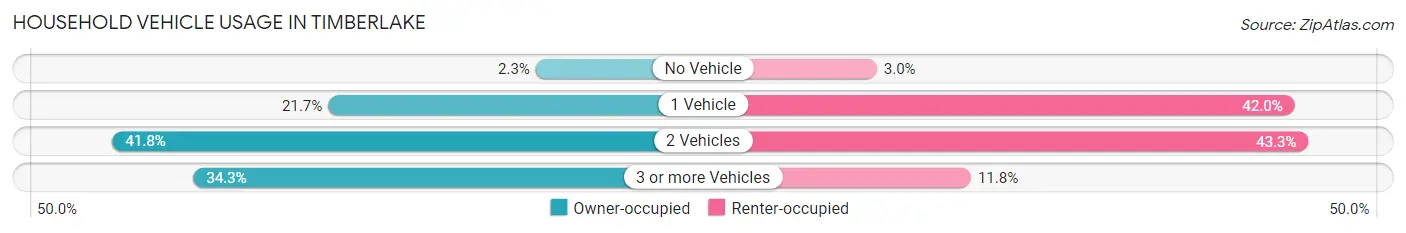
| Vehicles per Household | Owner-occupied | Renter-occupied |
| No Vehicle | 76 (2.3%) | 56 (3.0%) |
| 1 Vehicle | 720 (21.7%) | 788 (42.0%) |
| 2 Vehicles | 1,389 (41.8%) | 812 (43.3%) |
| 3 or more Vehicles | 1,138 (34.3%) | 221 (11.8%) |
| Total | 3,323 (100.0%) | 1,877 (100.0%) |
Real Estate & Mortgages in Timberlake
Real Estate and Mortgage Overview in Timberlake
| Characteristic | Without Mortgage | With Mortgage |
| Housing Units | 1,249 | 2,074 |
| Median Property Value | $204,700 | $226,800 |
| Median Household Income | $58,307 | $458 |
| Monthly Housing Costs | $376 | $13 |
| Real Estate Taxes | $943 | $63 |
Property Value by Mortgage Status in Timberlake
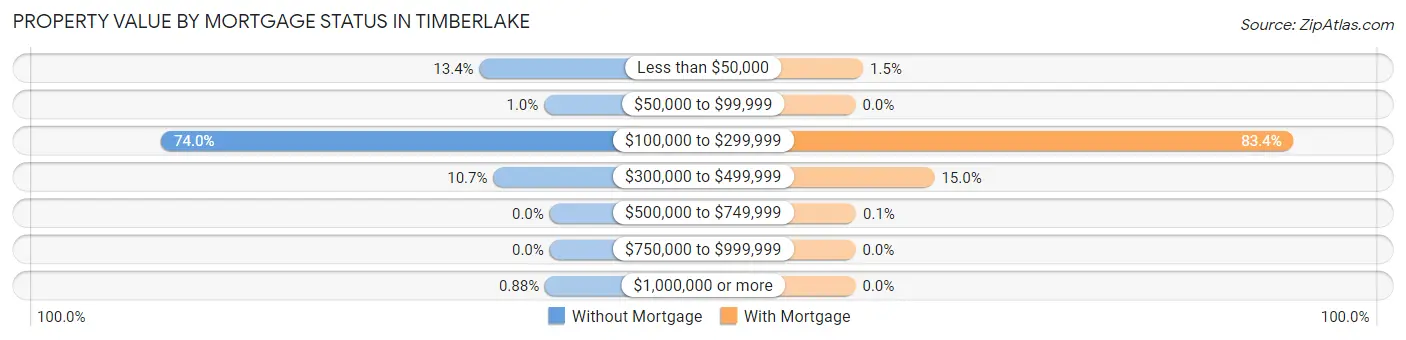
| Property Value | Without Mortgage | With Mortgage |
| Less than $50,000 | 167 (13.4%) | 30 (1.5%) |
| $50,000 to $99,999 | 13 (1.0%) | 0 (0.0%) |
| $100,000 to $299,999 | 924 (74.0%) | 1,730 (83.4%) |
| $300,000 to $499,999 | 134 (10.7%) | 312 (15.0%) |
| $500,000 to $749,999 | 0 (0.0%) | 2 (0.1%) |
| $750,000 to $999,999 | 0 (0.0%) | 0 (0.0%) |
| $1,000,000 or more | 11 (0.9%) | 0 (0.0%) |
| Total | 1,249 (100.0%) | 2,074 (100.0%) |
Household Income by Mortgage Status in Timberlake
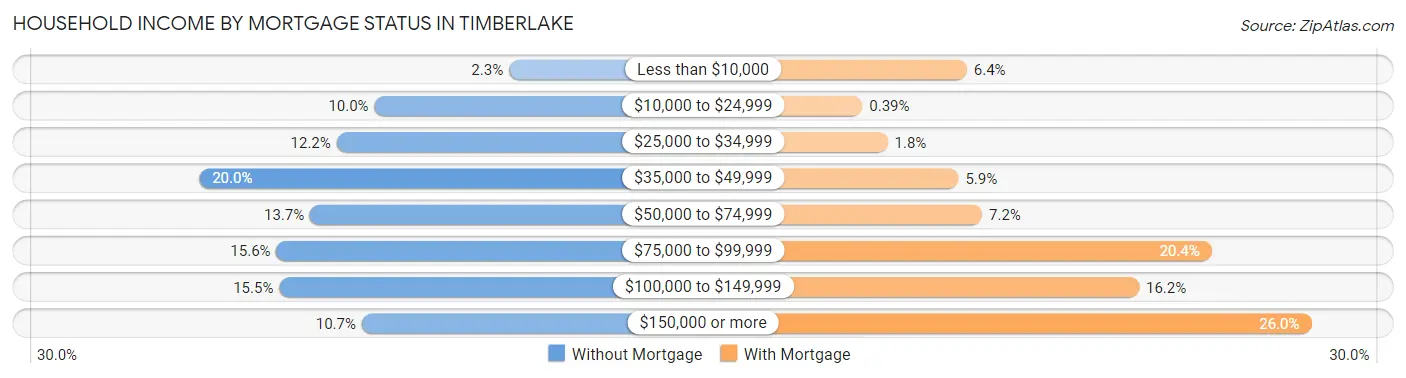
| Household Income | Without Mortgage | With Mortgage |
| Less than $10,000 | 29 (2.3%) | 132 (6.4%) |
| $10,000 to $24,999 | 125 (10.0%) | 8 (0.4%) |
| $25,000 to $34,999 | 152 (12.2%) | 38 (1.8%) |
| $35,000 to $49,999 | 250 (20.0%) | 122 (5.9%) |
| $50,000 to $74,999 | 171 (13.7%) | 150 (7.2%) |
| $75,000 to $99,999 | 195 (15.6%) | 422 (20.3%) |
| $100,000 to $149,999 | 193 (15.4%) | 336 (16.2%) |
| $150,000 or more | 134 (10.7%) | 540 (26.0%) |
| Total | 1,249 (100.0%) | 2,074 (100.0%) |
Property Value to Household Income Ratio in Timberlake
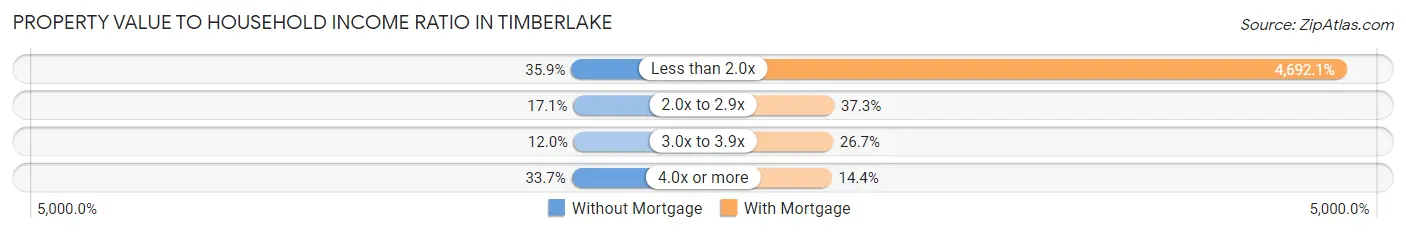
| Value-to-Income Ratio | Without Mortgage | With Mortgage |
| Less than 2.0x | 448 (35.9%) | 97,315 (4,692.1%) |
| 2.0x to 2.9x | 213 (17.1%) | 774 (37.3%) |
| 3.0x to 3.9x | 150 (12.0%) | 554 (26.7%) |
| 4.0x or more | 421 (33.7%) | 298 (14.4%) |
| Total | 1,249 (100.0%) | 2,074 (100.0%) |
Real Estate Taxes by Mortgage Status in Timberlake
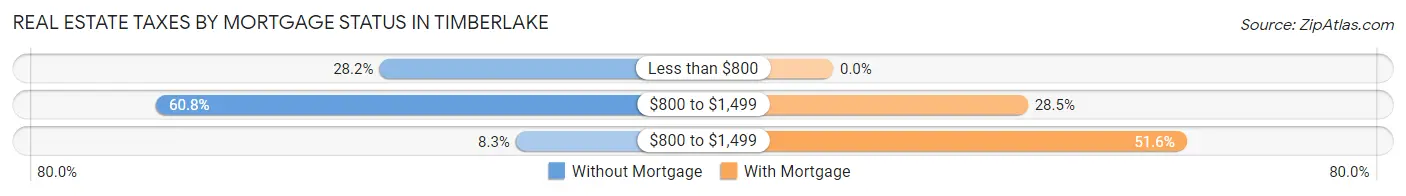
| Property Taxes | Without Mortgage | With Mortgage |
| Less than $800 | 352 (28.2%) | 0 (0.0%) |
| $800 to $1,499 | 759 (60.8%) | 590 (28.4%) |
| $800 to $1,499 | 103 (8.3%) | 1,071 (51.6%) |
| Total | 1,249 (100.0%) | 2,074 (100.0%) |
Health & Disability in Timberlake
Health Insurance Coverage by Age in Timberlake
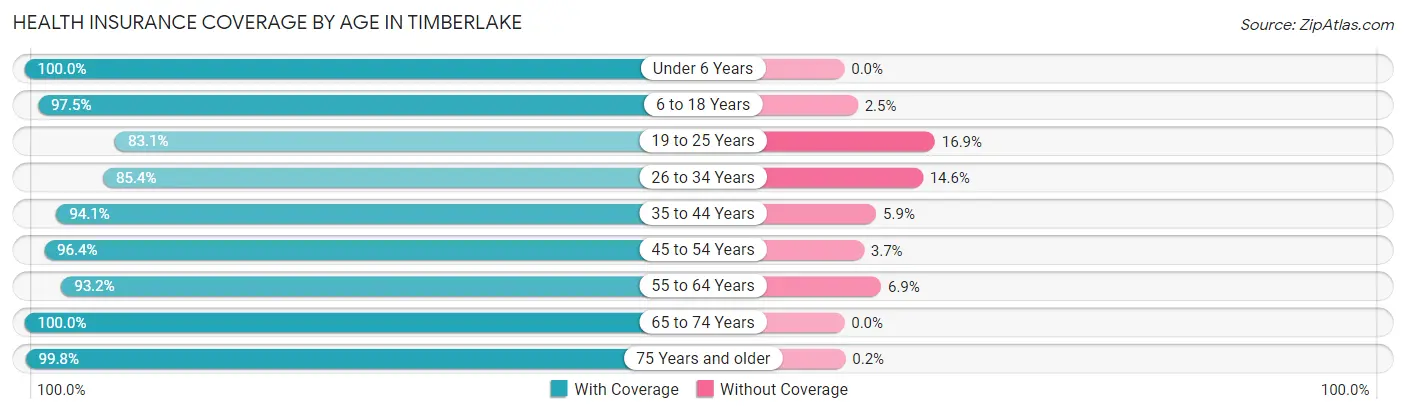
| Age Bracket | With Coverage | Without Coverage |
| Under 6 Years | 659 (100.0%) | 0 (0.0%) |
| 6 to 18 Years | 1,986 (97.5%) | 51 (2.5%) |
| 19 to 25 Years | 1,274 (83.1%) | 259 (16.9%) |
| 26 to 34 Years | 1,384 (85.4%) | 237 (14.6%) |
| 35 to 44 Years | 1,647 (94.1%) | 104 (5.9%) |
| 45 to 54 Years | 1,504 (96.4%) | 57 (3.6%) |
| 55 to 64 Years | 1,551 (93.1%) | 114 (6.9%) |
| 65 to 74 Years | 1,099 (100.0%) | 0 (0.0%) |
| 75 Years and older | 989 (99.8%) | 2 (0.2%) |
| Total | 12,093 (93.6%) | 824 (6.4%) |
Health Insurance Coverage by Citizenship Status in Timberlake
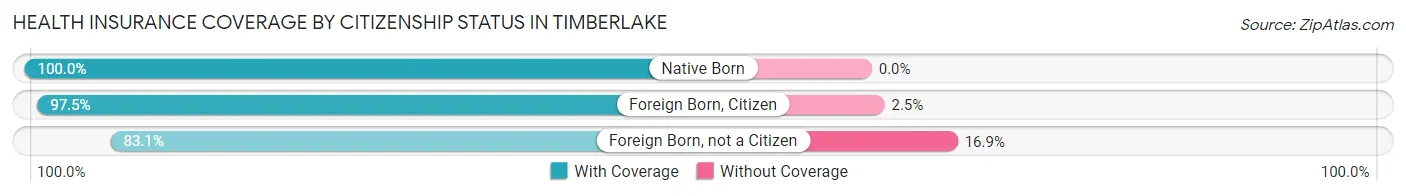
| Citizenship Status | With Coverage | Without Coverage |
| Native Born | 659 (100.0%) | 0 (0.0%) |
| Foreign Born, Citizen | 1,986 (97.5%) | 51 (2.5%) |
| Foreign Born, not a Citizen | 1,274 (83.1%) | 259 (16.9%) |
Health Insurance Coverage by Household Income in Timberlake
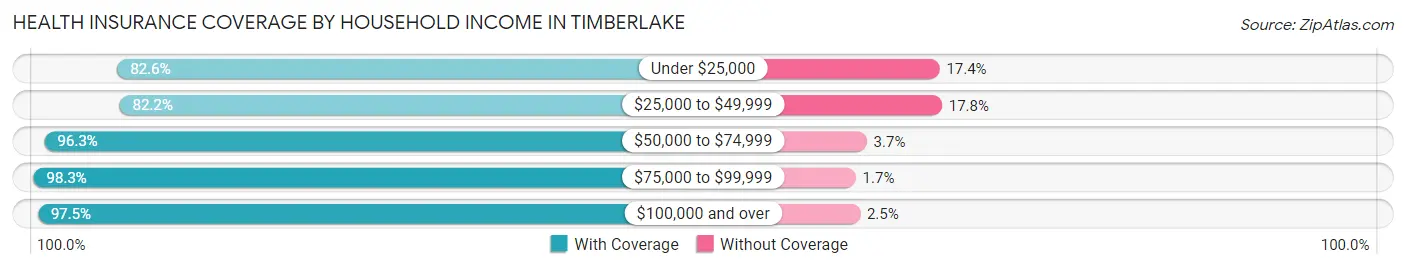
| Household Income | With Coverage | Without Coverage |
| Under $25,000 | 438 (82.6%) | 92 (17.4%) |
| $25,000 to $49,999 | 2,156 (82.2%) | 467 (17.8%) |
| $50,000 to $74,999 | 3,001 (96.3%) | 116 (3.7%) |
| $75,000 to $99,999 | 2,130 (98.3%) | 36 (1.7%) |
| $100,000 and over | 4,366 (97.5%) | 110 (2.5%) |
Public vs Private Health Insurance Coverage by Age in Timberlake
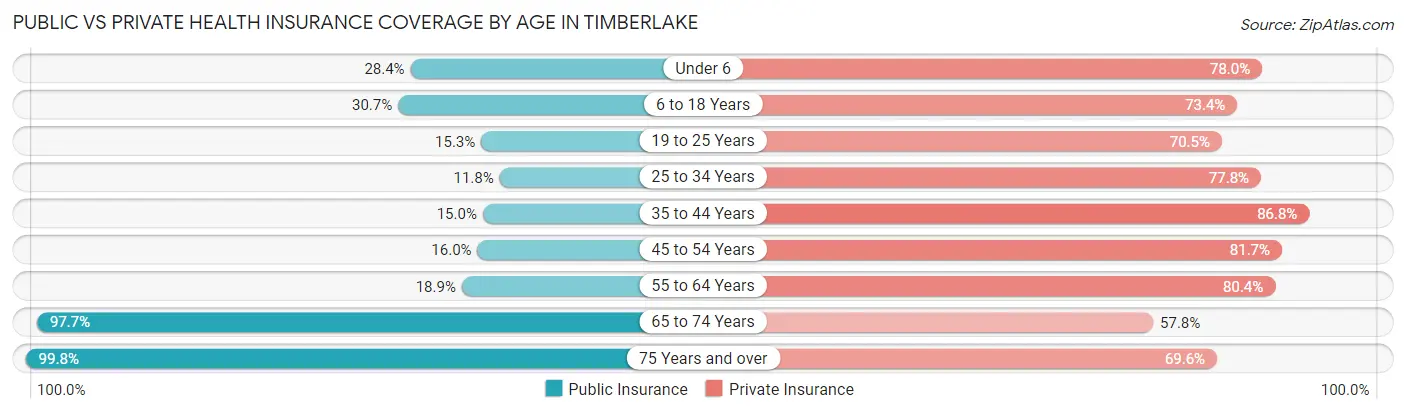
| Age Bracket | Public Insurance | Private Insurance |
| Under 6 | 187 (28.4%) | 514 (78.0%) |
| 6 to 18 Years | 625 (30.7%) | 1,495 (73.4%) |
| 19 to 25 Years | 234 (15.3%) | 1,081 (70.5%) |
| 25 to 34 Years | 192 (11.8%) | 1,261 (77.8%) |
| 35 to 44 Years | 262 (15.0%) | 1,519 (86.8%) |
| 45 to 54 Years | 249 (16.0%) | 1,275 (81.7%) |
| 55 to 64 Years | 314 (18.9%) | 1,339 (80.4%) |
| 65 to 74 Years | 1,074 (97.7%) | 635 (57.8%) |
| 75 Years and over | 989 (99.8%) | 690 (69.6%) |
| Total | 4,126 (31.9%) | 9,809 (75.9%) |
Disability Status by Sex by Age in Timberlake
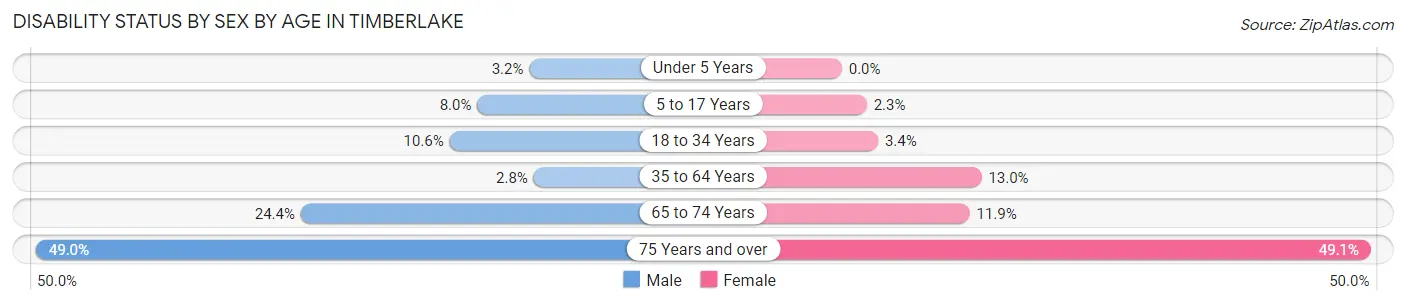
| Age Bracket | Male | Female |
| Under 5 Years | 8 (3.2%) | 0 (0.0%) |
| 5 to 17 Years | 68 (8.0%) | 25 (2.3%) |
| 18 to 34 Years | 180 (10.6%) | 57 (3.4%) |
| 35 to 64 Years | 68 (2.8%) | 325 (13.0%) |
| 65 to 74 Years | 126 (24.4%) | 69 (11.9%) |
| 75 Years and over | 186 (48.9%) | 300 (49.1%) |
Disability Class by Sex by Age in Timberlake
Disability Class: Hearing Difficulty
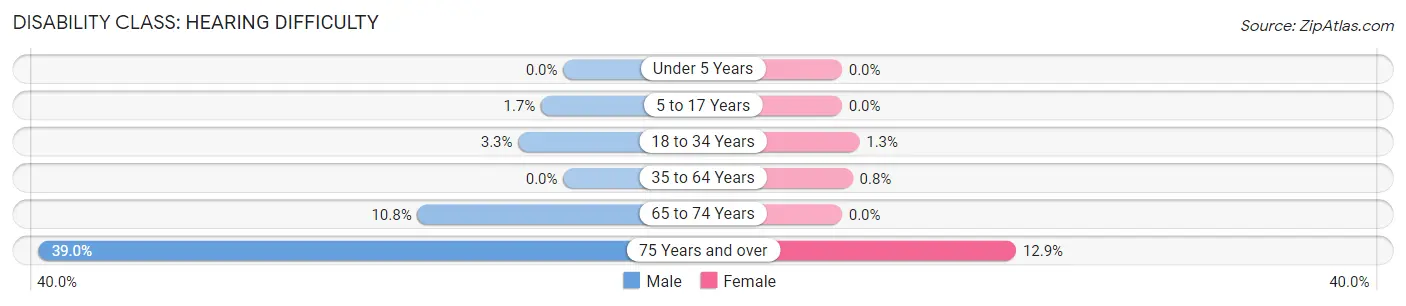
| Age Bracket | Male | Female |
| Under 5 Years | 0 (0.0%) | 0 (0.0%) |
| 5 to 17 Years | 14 (1.7%) | 0 (0.0%) |
| 18 to 34 Years | 57 (3.3%) | 22 (1.3%) |
| 35 to 64 Years | 0 (0.0%) | 20 (0.8%) |
| 65 to 74 Years | 56 (10.8%) | 0 (0.0%) |
| 75 Years and over | 148 (39.0%) | 79 (12.9%) |
Disability Class: Vision Difficulty
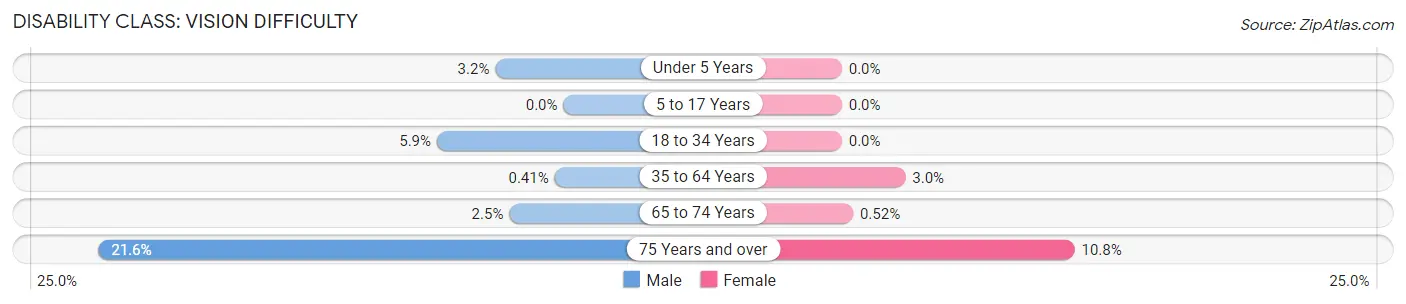
| Age Bracket | Male | Female |
| Under 5 Years | 8 (3.2%) | 0 (0.0%) |
| 5 to 17 Years | 0 (0.0%) | 0 (0.0%) |
| 18 to 34 Years | 100 (5.9%) | 0 (0.0%) |
| 35 to 64 Years | 10 (0.4%) | 74 (2.9%) |
| 65 to 74 Years | 13 (2.5%) | 3 (0.5%) |
| 75 Years and over | 82 (21.6%) | 66 (10.8%) |
Disability Class: Cognitive Difficulty
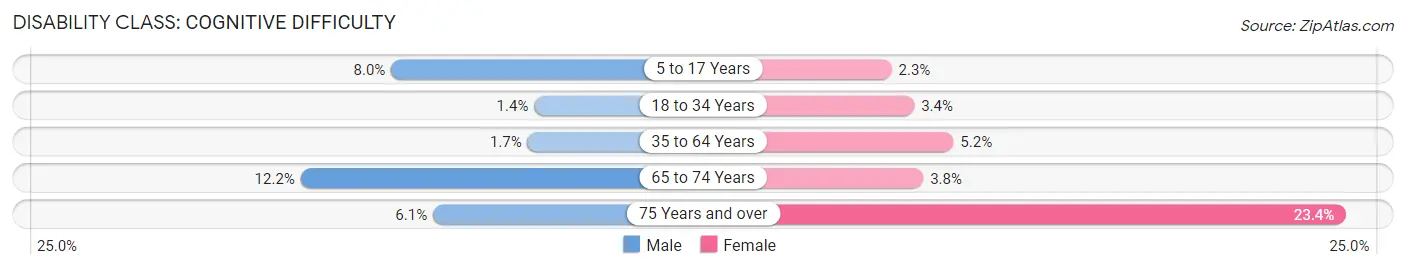
| Age Bracket | Male | Female |
| 5 to 17 Years | 68 (8.0%) | 25 (2.3%) |
| 18 to 34 Years | 23 (1.3%) | 57 (3.4%) |
| 35 to 64 Years | 41 (1.7%) | 130 (5.2%) |
| 65 to 74 Years | 63 (12.2%) | 22 (3.8%) |
| 75 Years and over | 23 (6.0%) | 143 (23.4%) |
Disability Class: Ambulatory Difficulty
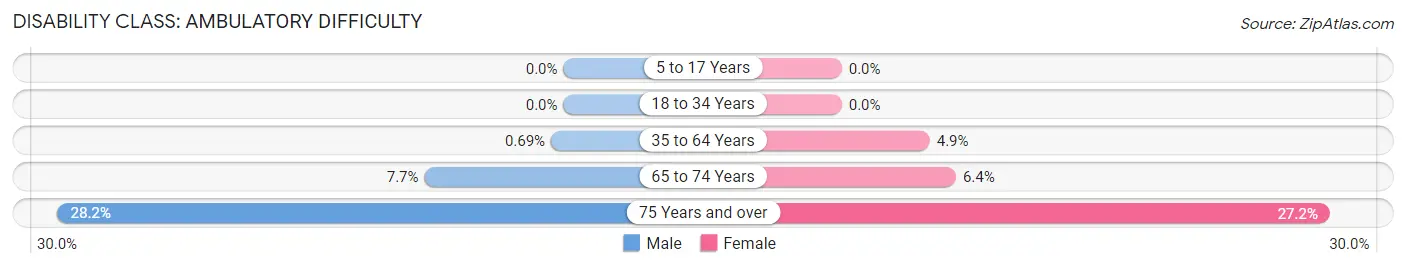
| Age Bracket | Male | Female |
| 5 to 17 Years | 0 (0.0%) | 0 (0.0%) |
| 18 to 34 Years | 0 (0.0%) | 0 (0.0%) |
| 35 to 64 Years | 17 (0.7%) | 123 (4.9%) |
| 65 to 74 Years | 40 (7.7%) | 37 (6.4%) |
| 75 Years and over | 107 (28.2%) | 166 (27.2%) |
Disability Class: Self-Care Difficulty
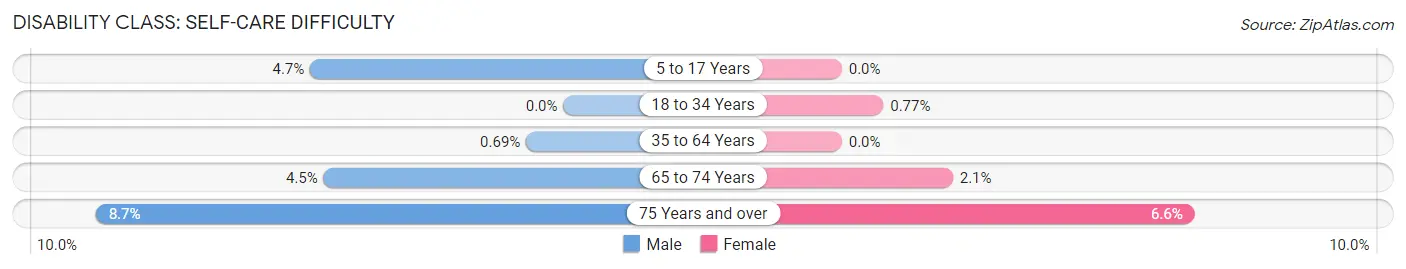
| Age Bracket | Male | Female |
| 5 to 17 Years | 40 (4.7%) | 0 (0.0%) |
| 18 to 34 Years | 0 (0.0%) | 13 (0.8%) |
| 35 to 64 Years | 17 (0.7%) | 0 (0.0%) |
| 65 to 74 Years | 23 (4.4%) | 12 (2.1%) |
| 75 Years and over | 33 (8.7%) | 40 (6.6%) |
Technology Access in Timberlake
Computing Device Access in Timberlake
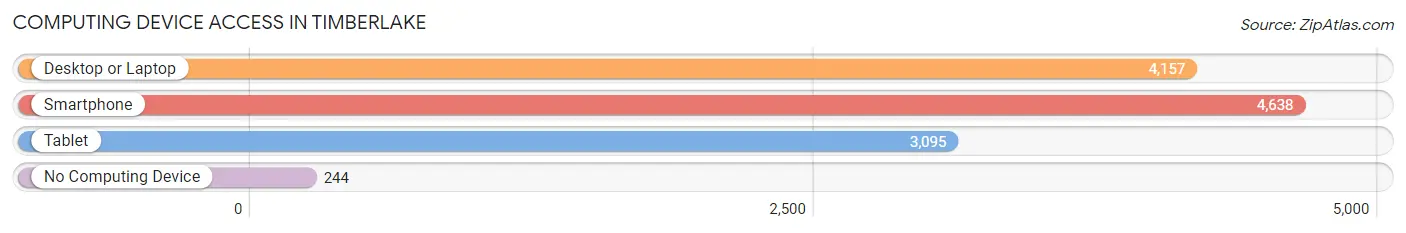
| Device Type | # Households | % Households |
| Desktop or Laptop | 4,157 | 79.9% |
| Smartphone | 4,638 | 89.2% |
| Tablet | 3,095 | 59.5% |
| No Computing Device | 244 | 4.7% |
| Total | 5,200 | 100.0% |
Internet Access in Timberlake
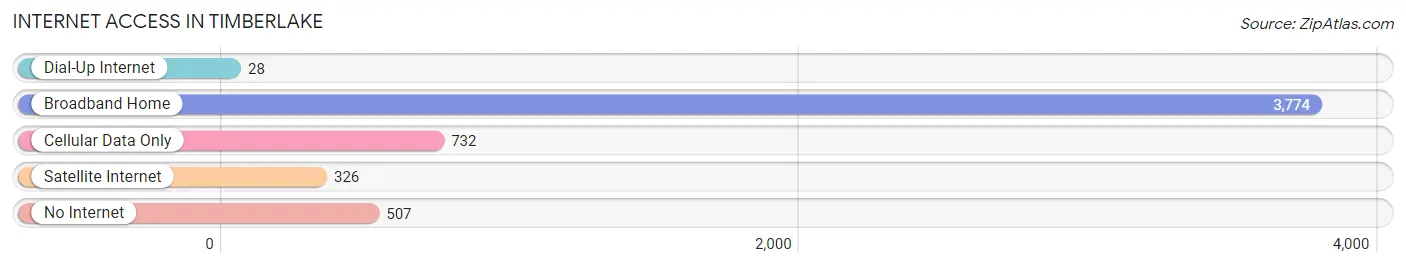
| Internet Type | # Households | % Households |
| Dial-Up Internet | 28 | 0.5% |
| Broadband Home | 3,774 | 72.6% |
| Cellular Data Only | 732 | 14.1% |
| Satellite Internet | 326 | 6.3% |
| No Internet | 507 | 9.8% |
| Total | 5,200 | 100.0% |
Timberlake Summary
Timberlake, Virginia is a small town located in Campbell County, Virginia. It is situated on the banks of the James River, and is part of the Lynchburg Metropolitan Statistical Area. The town has a population of approximately 1,000 people, and is known for its rural charm and small-town atmosphere.
History
Timberlake was first settled in the late 1700s by a group of settlers from Pennsylvania. The town was originally known as “Timberlake’s Crossroads”, and was named after the nearby Timberlake Creek. The town was officially incorporated in 1883, and was named after the creek.
The town was an important stop on the Lynchburg and Durham Railroad, which ran from Lynchburg to Durham, North Carolina. The railroad was an important part of the town’s economy, and helped to bring in new businesses and residents.
In the early 1900s, the town was home to a number of businesses, including a general store, a blacksmith shop, a sawmill, and a gristmill. The town also had a post office, a school, and a church.
Geography
Timberlake is located in the foothills of the Blue Ridge Mountains, and is surrounded by rolling hills and forests. The town is situated on the banks of the James River, and is part of the Lynchburg Metropolitan Statistical Area.
The town is located approximately 25 miles south of Lynchburg, and is accessible via US Route 29. The nearest major cities are Roanoke and Charlottesville, both of which are located approximately 90 miles away.
Economy
The economy of Timberlake is largely based on agriculture and forestry. The town is home to a number of farms, and the surrounding area is known for its production of tobacco, corn, and hay. The town also has a number of small businesses, including a general store, a hardware store, and a restaurant.
Demographics
As of the 2010 census, the population of Timberlake was 1,000 people. The town is predominantly white, with approximately 95% of the population being white. The median household income is $45,000, and the median home value is $150,000.
The town is served by the Campbell County Public Schools system, and is home to a number of churches. The town also has a number of recreational activities, including fishing, hunting, and camping.
Conclusion
Timberlake, Virginia is a small town located in Campbell County, Virginia. It is situated on the banks of the James River, and is part of the Lynchburg Metropolitan Statistical Area. The town has a population of approximately 1,000 people, and is known for its rural charm and small-town atmosphere. The economy of Timberlake is largely based on agriculture and forestry, and the town is served by the Campbell County Public Schools system. The town is predominantly white, with approximately 95% of the population being white. Timberlake is a great place to live, work, and raise a family, and is a great example of a small town in Virginia.
Common Questions
What is Per Capita Income in Timberlake?
Per Capita income in Timberlake is $35,530.
What is the Median Family Income in Timberlake?
Median Family Income in Timberlake is $84,861.
What is the Median Household income in Timberlake?
Median Household Income in Timberlake is $69,823.
What is Income or Wage Gap in Timberlake?
Income or Wage Gap in Timberlake is 21.0%.
Women in Timberlake earn 79.0 cents for every dollar earned by a man.
What is Inequality or Gini Index in Timberlake?
Inequality or Gini Index in Timberlake is 0.37.
What is the Total Population of Timberlake?
Total Population of Timberlake is 12,999.
What is the Total Male Population of Timberlake?
Total Male Population of Timberlake is 6,196.
What is the Total Female Population of Timberlake?
Total Female Population of Timberlake is 6,803.
What is the Ratio of Males per 100 Females in Timberlake?
There are 91.08 Males per 100 Females in Timberlake.
What is the Ratio of Females per 100 Males in Timberlake?
There are 109.80 Females per 100 Males in Timberlake.
What is the Median Population Age in Timberlake?
Median Population Age in Timberlake is 38.8 Years.
What is the Average Family Size in Timberlake
Average Family Size in Timberlake is 3.0 People.
What is the Average Household Size in Timberlake
Average Household Size in Timberlake is 2.5 People.
How Large is the Labor Force in Timberlake?
There are 7,419 People in the Labor Forcein in Timberlake.
What is the Percentage of People in the Labor Force in Timberlake?
68.0% of People are in the Labor Force in Timberlake.
What is the Unemployment Rate in Timberlake?
Unemployment Rate in Timberlake is 4.3%.