White Stone, VA Map & Demographics
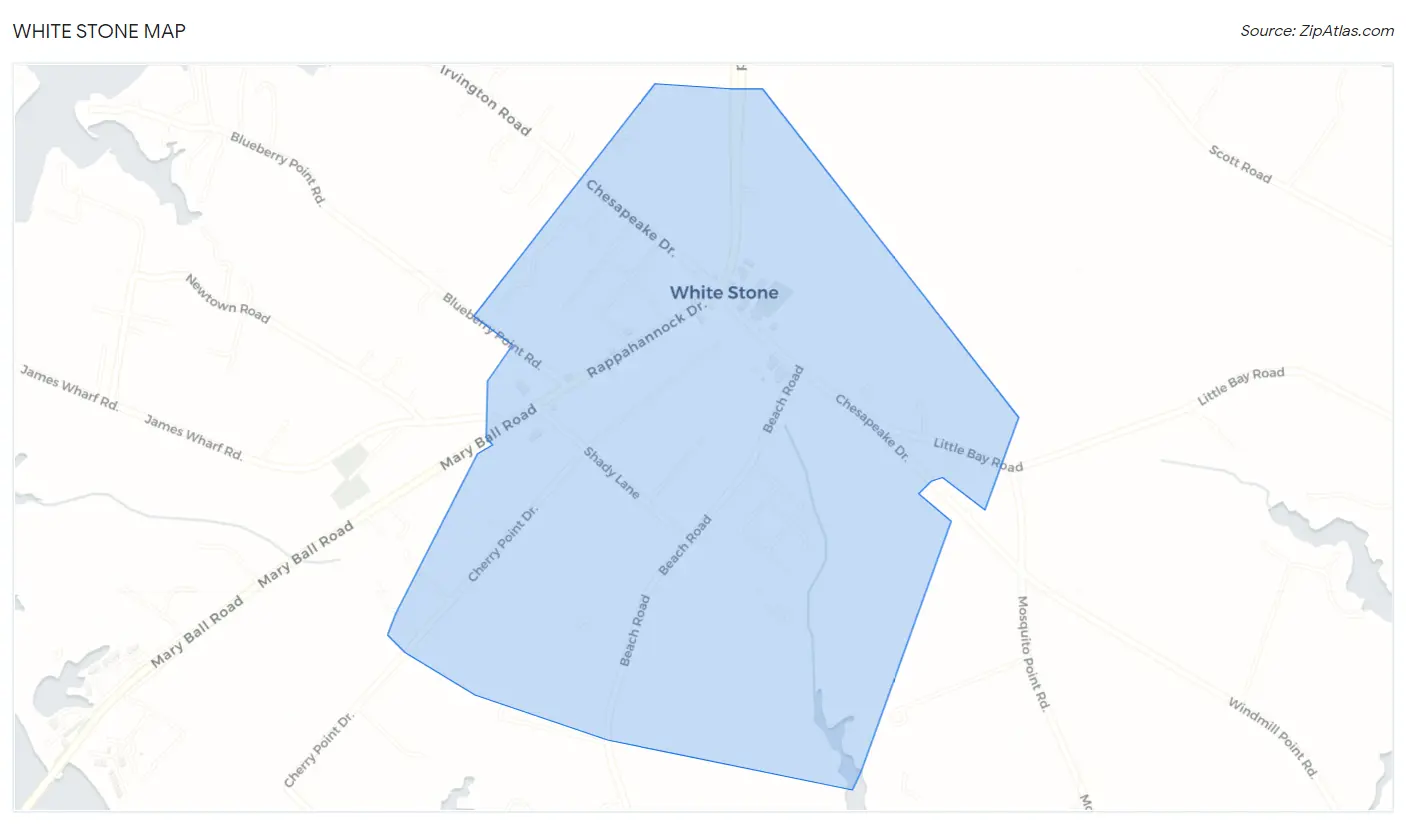
White Stone Map
White Stone Overview
$33,126
PER CAPITA INCOME
$62,292
AVG FAMILY INCOME
$47,917
AVG HOUSEHOLD INCOME
53.5%
WAGE / INCOME GAP [ % ]
46.5¢/ $1
WAGE / INCOME GAP [ $ ]
$7,100
FAMILY INCOME DEFICIT
0.40
INEQUALITY / GINI INDEX
311
TOTAL POPULATION
161
MALE POPULATION
150
FEMALE POPULATION
107.33
MALES / 100 FEMALES
93.17
FEMALES / 100 MALES
50.3
MEDIAN AGE
2.8
AVG FAMILY SIZE
2.0
AVG HOUSEHOLD SIZE
173
LABOR FORCE [ PEOPLE ]
67.3%
PERCENT IN LABOR FORCE
8.1%
UNEMPLOYMENT RATE
White Stone Zip Codes
White Stone Area Codes
Income in White Stone
Income Overview in White Stone
Per Capita Income in White Stone is $33,126, while median incomes of families and households are $62,292 and $47,917 respectively.
| Characteristic | Number | Measure |
| Per Capita Income | 311 | $33,126 |
| Median Family Income | 70 | $62,292 |
| Mean Family Income | 70 | $81,064 |
| Median Household Income | 156 | $47,917 |
| Mean Household Income | 156 | $63,165 |
| Income Deficit | 70 | $7,100 |
| Wage / Income Gap (%) | 311 | 53.52% |
| Wage / Income Gap ($) | 311 | 46.48¢ per $1 |
| Gini / Inequality Index | 311 | 0.40 |
Earnings by Sex in White Stone
Average Earnings in White Stone are $28,854, $45,179 for men and $21,000 for women, a difference of 53.5%.
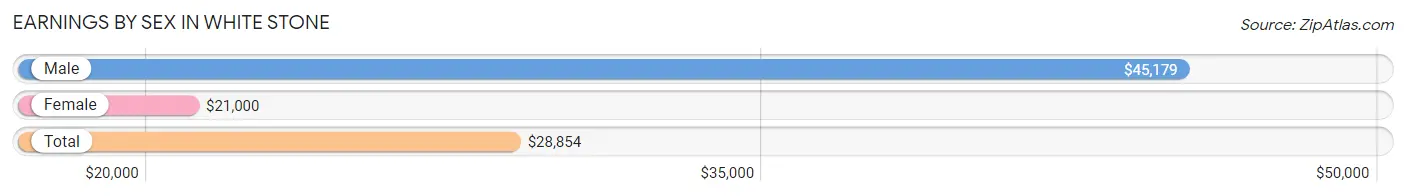
| Sex | Number | Average Earnings |
| Male | 91 (50.8%) | $45,179 |
| Female | 88 (49.2%) | $21,000 |
| Total | 179 (100.0%) | $28,854 |
Earnings by Sex by Income Bracket in White Stone
The most common earnings brackets in White Stone are $25,000 to $29,999 for men (16 | 17.6%) and $17,500 to $19,999 for women (12 | 13.6%).
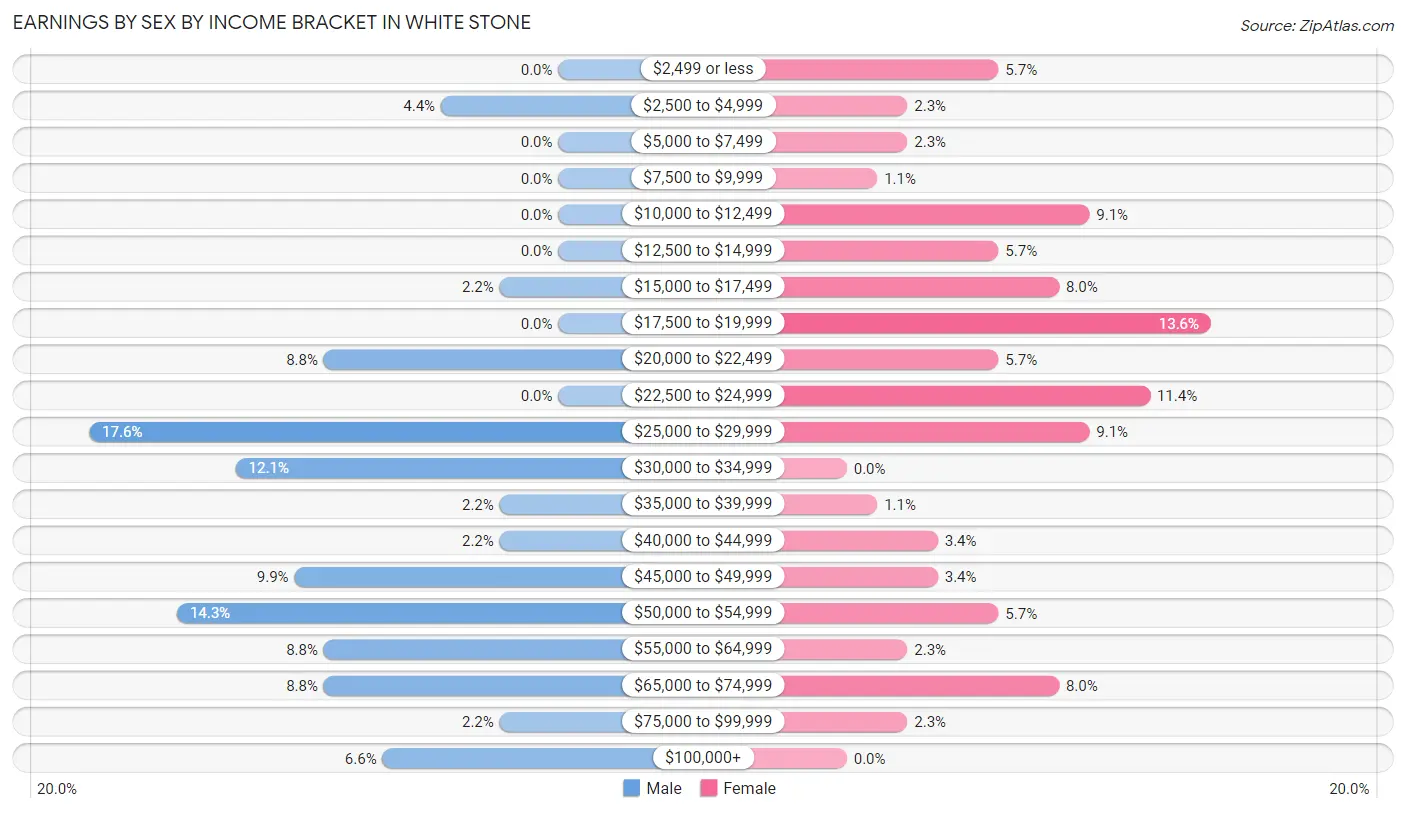
| Income | Male | Female |
| $2,499 or less | 0 (0.0%) | 5 (5.7%) |
| $2,500 to $4,999 | 4 (4.4%) | 2 (2.3%) |
| $5,000 to $7,499 | 0 (0.0%) | 2 (2.3%) |
| $7,500 to $9,999 | 0 (0.0%) | 1 (1.1%) |
| $10,000 to $12,499 | 0 (0.0%) | 8 (9.1%) |
| $12,500 to $14,999 | 0 (0.0%) | 5 (5.7%) |
| $15,000 to $17,499 | 2 (2.2%) | 7 (8.0%) |
| $17,500 to $19,999 | 0 (0.0%) | 12 (13.6%) |
| $20,000 to $22,499 | 8 (8.8%) | 5 (5.7%) |
| $22,500 to $24,999 | 0 (0.0%) | 10 (11.4%) |
| $25,000 to $29,999 | 16 (17.6%) | 8 (9.1%) |
| $30,000 to $34,999 | 11 (12.1%) | 0 (0.0%) |
| $35,000 to $39,999 | 2 (2.2%) | 1 (1.1%) |
| $40,000 to $44,999 | 2 (2.2%) | 3 (3.4%) |
| $45,000 to $49,999 | 9 (9.9%) | 3 (3.4%) |
| $50,000 to $54,999 | 13 (14.3%) | 5 (5.7%) |
| $55,000 to $64,999 | 8 (8.8%) | 2 (2.3%) |
| $65,000 to $74,999 | 8 (8.8%) | 7 (8.0%) |
| $75,000 to $99,999 | 2 (2.2%) | 2 (2.3%) |
| $100,000+ | 6 (6.6%) | 0 (0.0%) |
| Total | 91 (100.0%) | 88 (100.0%) |
Earnings by Sex by Educational Attainment in White Stone
Average earnings in White Stone are $45,536 for men and $19,792 for women, a difference of 56.5%. Men with an educational attainment of less than high school enjoy the highest average annual earnings of $50,385, while those with college or associate's degree education earn the least with $26,071. Women with an educational attainment of bachelor's degree earn the most with the average annual earnings of $70,833, while those with college or associate's degree education have the smallest earnings of $17,917.
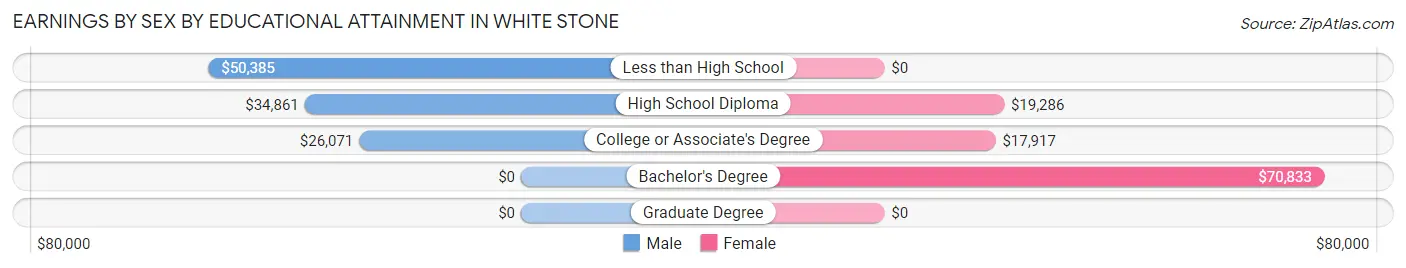
| Educational Attainment | Male Income | Female Income |
| Less than High School | $50,385 | $0 |
| High School Diploma | $34,861 | $19,286 |
| College or Associate's Degree | $26,071 | $17,917 |
| Bachelor's Degree | - | - |
| Graduate Degree | - | - |
| Total | $45,536 | $19,792 |
Family Income in White Stone
Family Income Brackets in White Stone
According to the White Stone family income data, there are 19 families falling into the $50,000 to $74,999 income range, which is the most common income bracket and makes up 27.1% of all families.
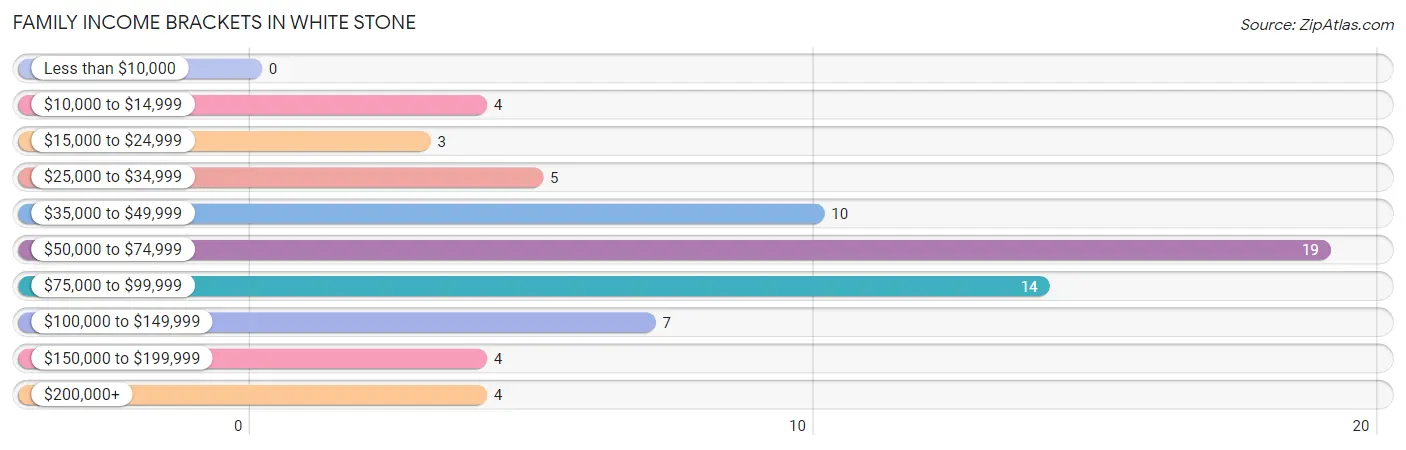
| Income Bracket | # Families | % Families |
| Less than $10,000 | 0 | 0.0% |
| $10,000 to $14,999 | 4 | 5.7% |
| $15,000 to $24,999 | 3 | 4.3% |
| $25,000 to $34,999 | 5 | 7.1% |
| $35,000 to $49,999 | 10 | 14.3% |
| $50,000 to $74,999 | 19 | 27.1% |
| $75,000 to $99,999 | 14 | 20.0% |
| $100,000 to $149,999 | 7 | 10.0% |
| $150,000 to $199,999 | 4 | 5.7% |
| $200,000+ | 4 | 5.7% |
Family Income by Famaliy Size in White Stone
3-person families (24 | 34.3%) account for the highest median family income in White Stone with $62,222 per family, while 2-person families (39 | 55.7%) have the highest median income of $30,208 per family member.
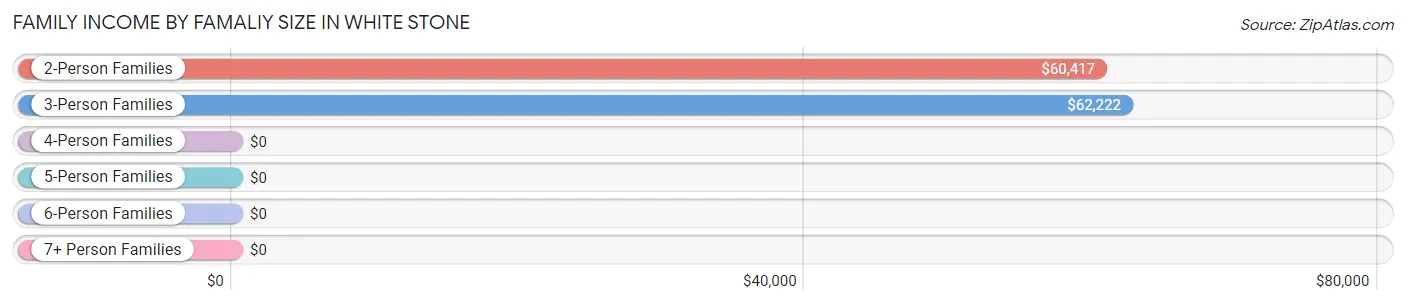
| Income Bracket | # Families | Median Income |
| 2-Person Families | 39 (55.7%) | $60,417 |
| 3-Person Families | 24 (34.3%) | $62,222 |
| 4-Person Families | 2 (2.9%) | $0 |
| 5-Person Families | 0 (0.0%) | $0 |
| 6-Person Families | 0 (0.0%) | $0 |
| 7+ Person Families | 5 (7.1%) | $0 |
| Total | 70 (100.0%) | $62,292 |
Family Income by Number of Earners in White Stone
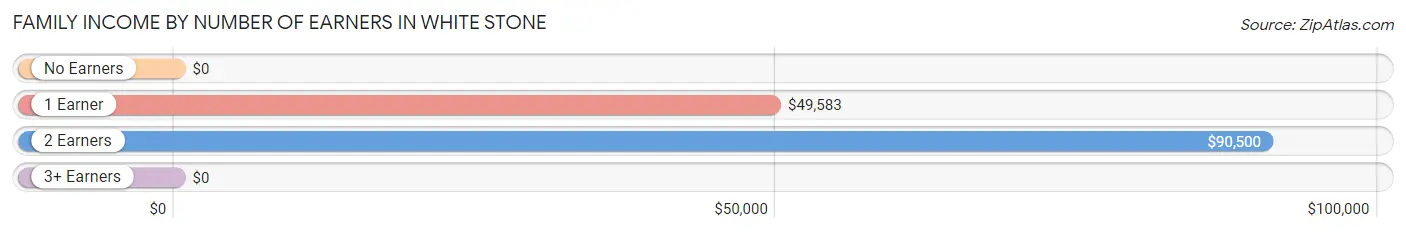
| Number of Earners | # Families | Median Income |
| No Earners | 7 (10.0%) | $0 |
| 1 Earner | 23 (32.9%) | $49,583 |
| 2 Earners | 38 (54.3%) | $90,500 |
| 3+ Earners | 2 (2.9%) | $0 |
| Total | 70 (100.0%) | $62,292 |
Household Income in White Stone
Household Income Brackets in White Stone
With 39 households falling in the category, the $25,000 to $34,999 income range is the most frequent in White Stone, accounting for 25.0% of all households. In contrast, only 3 households (1.9%) fall into the less than $10,000 income bracket, making it the least populous group.
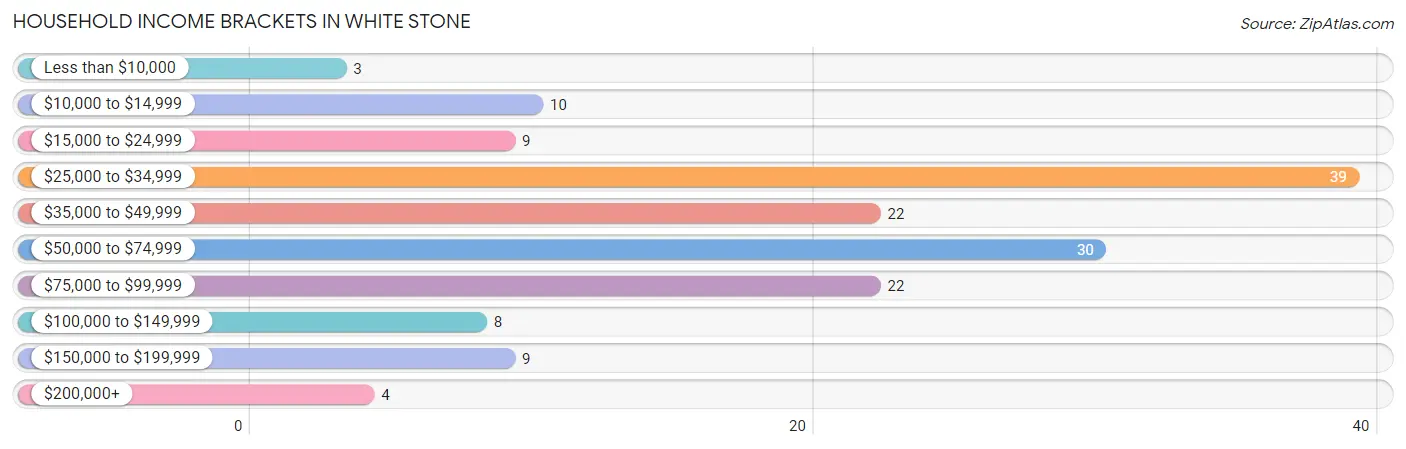
| Income Bracket | # Households | % Households |
| Less than $10,000 | 3 | 1.9% |
| $10,000 to $14,999 | 10 | 6.4% |
| $15,000 to $24,999 | 9 | 5.8% |
| $25,000 to $34,999 | 39 | 25.0% |
| $35,000 to $49,999 | 22 | 14.1% |
| $50,000 to $74,999 | 30 | 19.2% |
| $75,000 to $99,999 | 22 | 14.1% |
| $100,000 to $149,999 | 8 | 5.1% |
| $150,000 to $199,999 | 9 | 5.8% |
| $200,000+ | 4 | 2.6% |
Household Income by Householder Age in White Stone
The median household income in White Stone is $47,917, with the highest median household income of $71,667 found in the 25 to 44 years age bracket for the primary householder. A total of 30 households (19.2%) fall into this category.
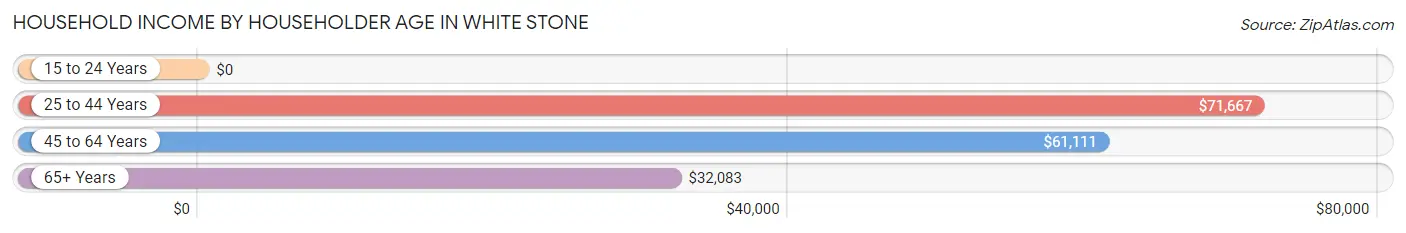
| Income Bracket | # Households | Median Income |
| 15 to 24 Years | 0 (0.0%) | $0 |
| 25 to 44 Years | 30 (19.2%) | $71,667 |
| 45 to 64 Years | 58 (37.2%) | $61,111 |
| 65+ Years | 68 (43.6%) | $32,083 |
| Total | 156 (100.0%) | $47,917 |
Poverty in White Stone
Income Below Poverty by Sex and Age in White Stone
With 5.6% poverty level for males and 14.0% for females among the residents of White Stone, under 5 year old males and 16 and 17 year old females are the most vulnerable to poverty, with 2 males (40.0%) and 3 females (100.0%) in their respective age groups living below the poverty level.
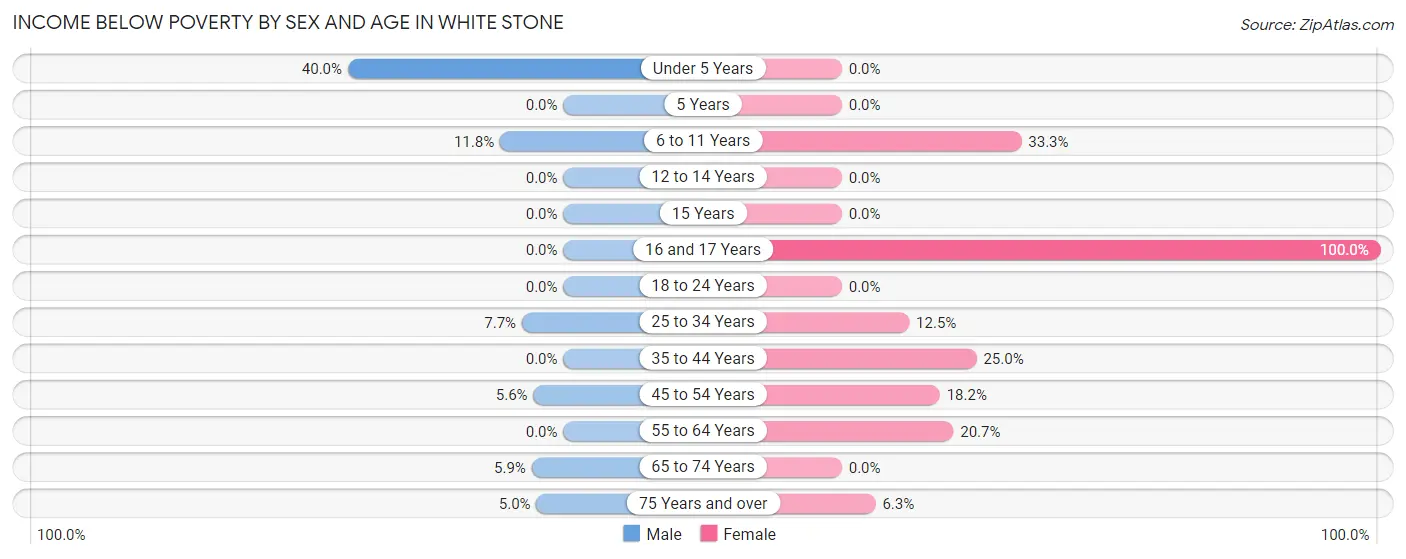
| Age Bracket | Male | Female |
| Under 5 Years | 2 (40.0%) | 0 (0.0%) |
| 5 Years | 0 (0.0%) | 0 (0.0%) |
| 6 to 11 Years | 2 (11.8%) | 4 (33.3%) |
| 12 to 14 Years | 0 (0.0%) | 0 (0.0%) |
| 15 Years | 0 (0.0%) | 0 (0.0%) |
| 16 and 17 Years | 0 (0.0%) | 3 (100.0%) |
| 18 to 24 Years | 0 (0.0%) | 0 (0.0%) |
| 25 to 34 Years | 2 (7.7%) | 2 (12.5%) |
| 35 to 44 Years | 0 (0.0%) | 3 (25.0%) |
| 45 to 54 Years | 1 (5.6%) | 2 (18.2%) |
| 55 to 64 Years | 0 (0.0%) | 6 (20.7%) |
| 65 to 74 Years | 1 (5.9%) | 0 (0.0%) |
| 75 Years and over | 1 (5.0%) | 1 (6.2%) |
| Total | 9 (5.6%) | 21 (14.0%) |
Income Above Poverty by Sex and Age in White Stone
According to the poverty statistics in White Stone, males aged 5 years and females aged 5 years are the age groups that are most secure financially, with 100.0% of males and 100.0% of females in these age groups living above the poverty line.
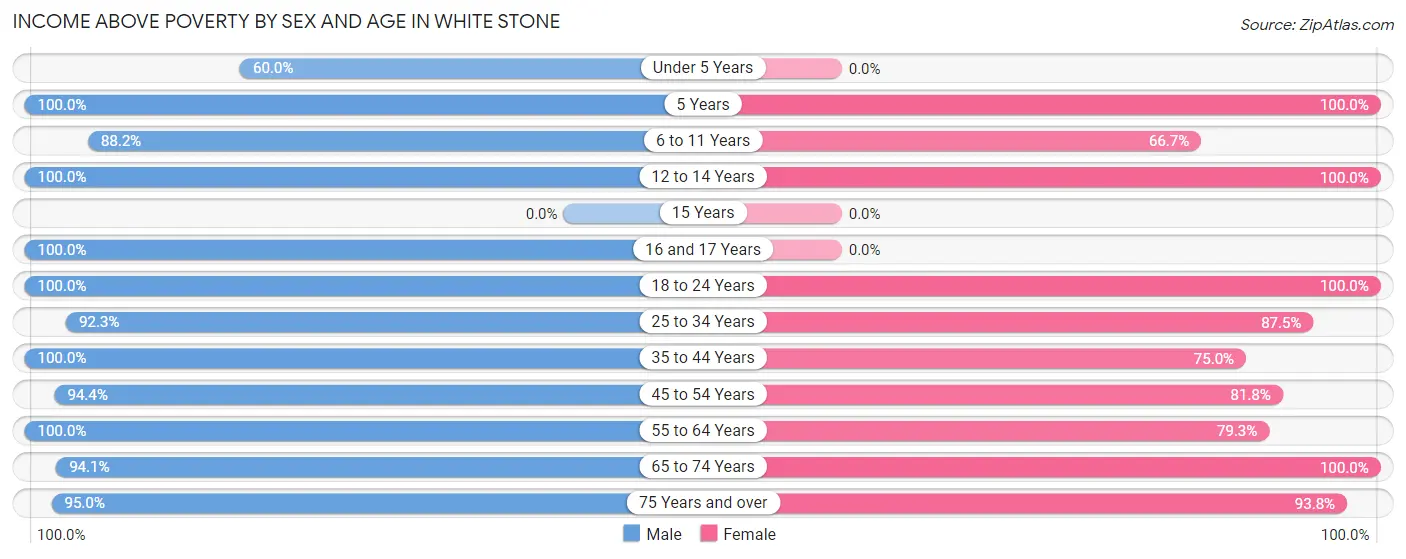
| Age Bracket | Male | Female |
| Under 5 Years | 3 (60.0%) | 0 (0.0%) |
| 5 Years | 6 (100.0%) | 3 (100.0%) |
| 6 to 11 Years | 15 (88.2%) | 8 (66.7%) |
| 12 to 14 Years | 4 (100.0%) | 7 (100.0%) |
| 15 Years | 0 (0.0%) | 0 (0.0%) |
| 16 and 17 Years | 1 (100.0%) | 0 (0.0%) |
| 18 to 24 Years | 1 (100.0%) | 12 (100.0%) |
| 25 to 34 Years | 24 (92.3%) | 14 (87.5%) |
| 35 to 44 Years | 20 (100.0%) | 9 (75.0%) |
| 45 to 54 Years | 17 (94.4%) | 9 (81.8%) |
| 55 to 64 Years | 26 (100.0%) | 23 (79.3%) |
| 65 to 74 Years | 16 (94.1%) | 29 (100.0%) |
| 75 Years and over | 19 (95.0%) | 15 (93.8%) |
| Total | 152 (94.4%) | 129 (86.0%) |
Income Below Poverty Among Married-Couple Families in White Stone
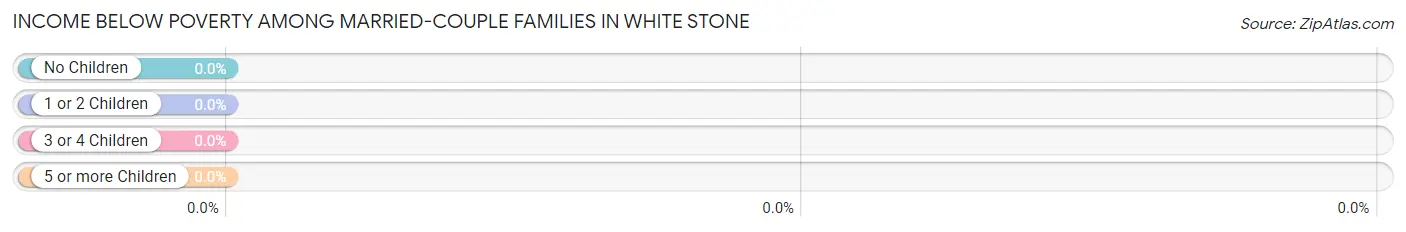
| Children | Above Poverty | Below Poverty |
| No Children | 27 (100.0%) | 0 (0.0%) |
| 1 or 2 Children | 13 (100.0%) | 0 (0.0%) |
| 3 or 4 Children | 5 (100.0%) | 0 (0.0%) |
| 5 or more Children | 0 (0.0%) | 0 (0.0%) |
| Total | 45 (100.0%) | 0 (0.0%) |
Income Below Poverty Among Single-Parent Households in White Stone
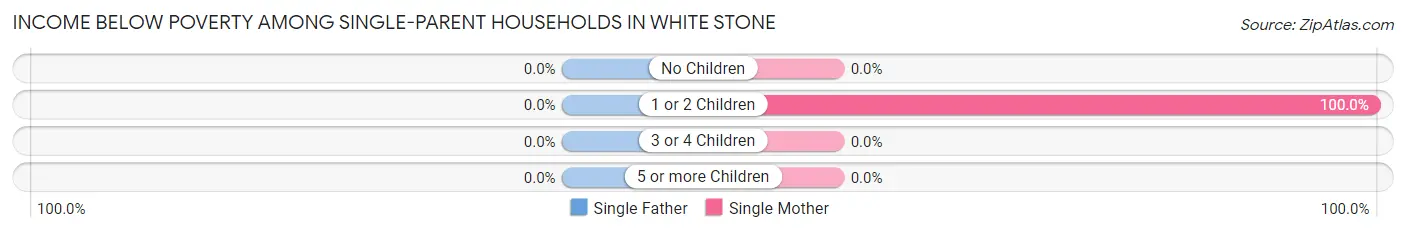
| Children | Single Father | Single Mother |
| No Children | 0 (0.0%) | 0 (0.0%) |
| 1 or 2 Children | 0 (0.0%) | 6 (100.0%) |
| 3 or 4 Children | 0 (0.0%) | 0 (0.0%) |
| 5 or more Children | 0 (0.0%) | 0 (0.0%) |
| Total | 0 (0.0%) | 6 (33.3%) |
Income Below Poverty Among Married-Couple vs Single-Parent Households in White Stone
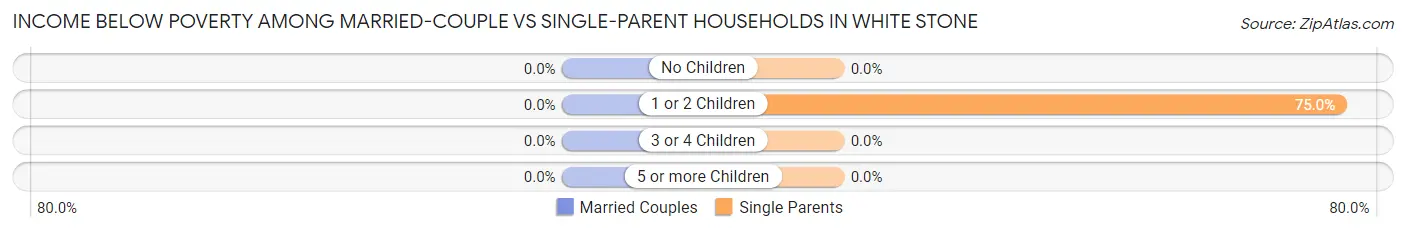
| Children | Married-Couple Families | Single-Parent Households |
| No Children | 0 (0.0%) | 0 (0.0%) |
| 1 or 2 Children | 0 (0.0%) | 6 (75.0%) |
| 3 or 4 Children | 0 (0.0%) | 0 (0.0%) |
| 5 or more Children | 0 (0.0%) | 0 (0.0%) |
| Total | 0 (0.0%) | 6 (24.0%) |
Race in White Stone
The most populous races in White Stone are White / Caucasian (201 | 64.6%), Black / African American (88 | 28.3%), and Two or more Races (16 | 5.1%).
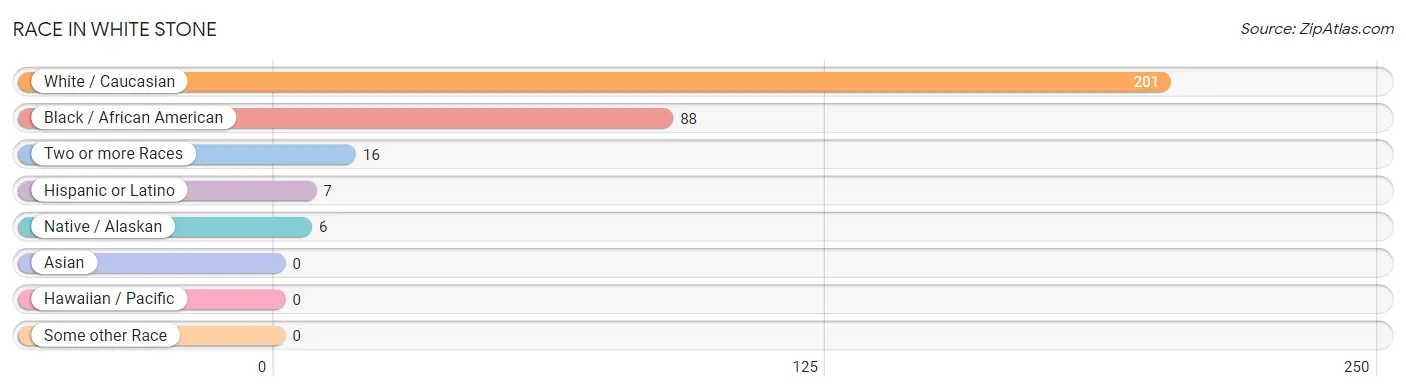
| Race | # Population | % Population |
| Asian | 0 | 0.0% |
| Black / African American | 88 | 28.3% |
| Hawaiian / Pacific | 0 | 0.0% |
| Hispanic or Latino | 7 | 2.2% |
| Native / Alaskan | 6 | 1.9% |
| White / Caucasian | 201 | 64.6% |
| Two or more Races | 16 | 5.1% |
| Some other Race | 0 | 0.0% |
| Total | 311 | 100.0% |
Ancestry in White Stone
The most populous ancestries reported in White Stone are English (51 | 16.4%), American (44 | 14.1%), German (29 | 9.3%), Irish (14 | 4.5%), and Scottish (8 | 2.6%), together accounting for 46.9% of all White Stone residents.
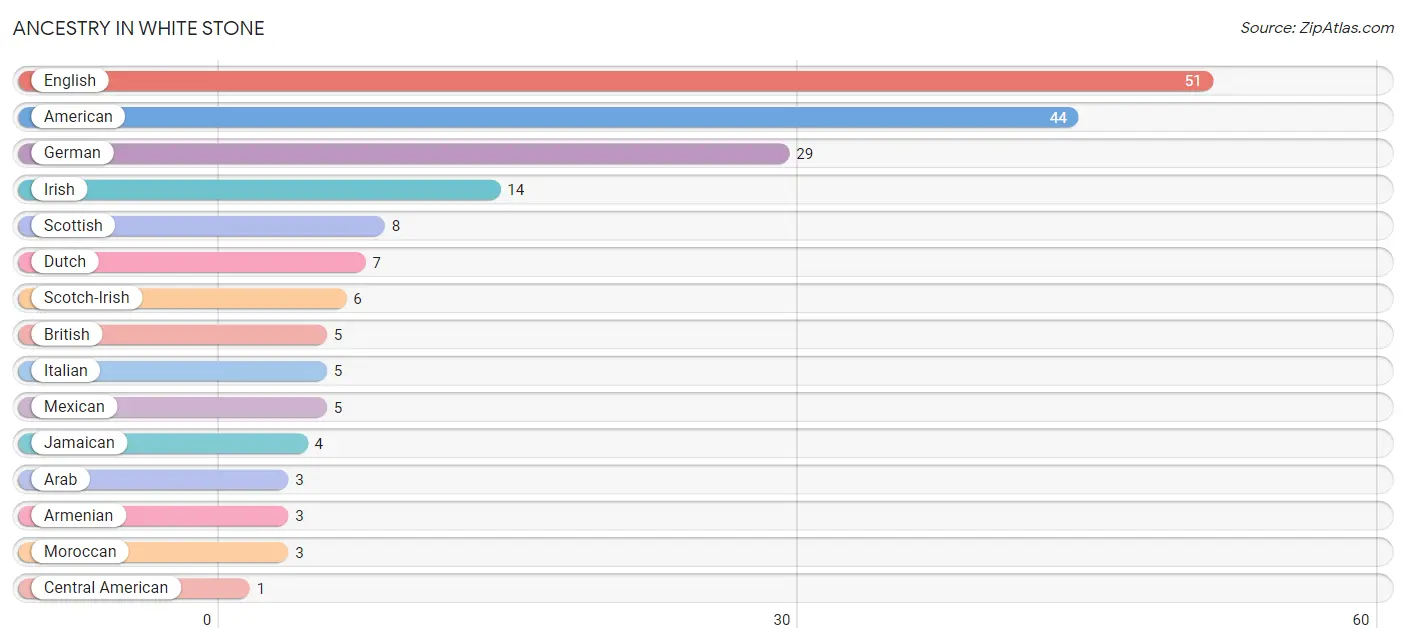
| Ancestry | # Population | % Population |
| American | 44 | 14.1% |
| Arab | 3 | 1.0% |
| Armenian | 3 | 1.0% |
| British | 5 | 1.6% |
| Central American | 1 | 0.3% |
| Cuban | 1 | 0.3% |
| Dutch | 7 | 2.2% |
| English | 51 | 16.4% |
| German | 29 | 9.3% |
| Guatemalan | 1 | 0.3% |
| Irish | 14 | 4.5% |
| Italian | 5 | 1.6% |
| Jamaican | 4 | 1.3% |
| Mexican | 5 | 1.6% |
| Moroccan | 3 | 1.0% |
| Scotch-Irish | 6 | 1.9% |
| Scottish | 8 | 2.6% |
| Swedish | 1 | 0.3% | View All 18 Rows |
Immigrants in White Stone
The most numerous immigrant groups reported in White Stone came from Latin America (10 | 3.2%), Central America (6 | 1.9%), Caribbean (4 | 1.3%), Jamaica (4 | 1.3%), and Mexico (4 | 1.3%), together accounting for 9.0% of all White Stone residents.
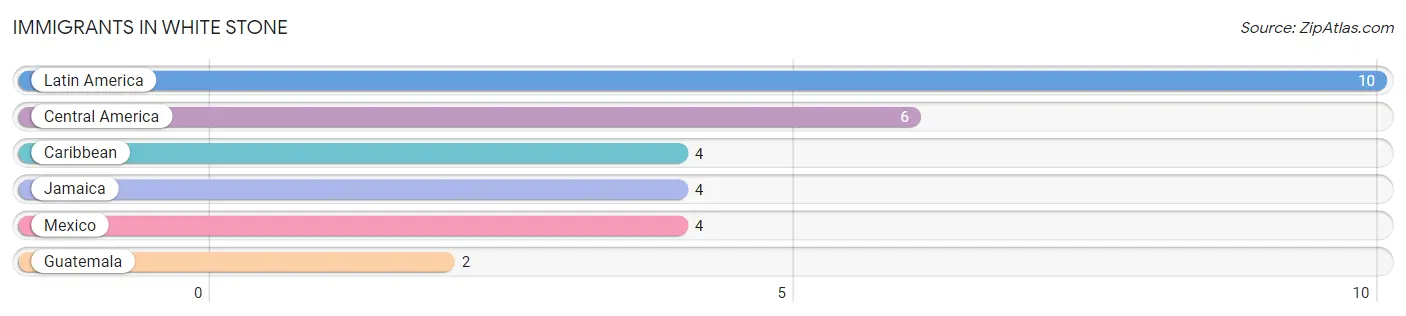
| Immigration Origin | # Population | % Population |
| Caribbean | 4 | 1.3% |
| Central America | 6 | 1.9% |
| Guatemala | 2 | 0.6% |
| Jamaica | 4 | 1.3% |
| Latin America | 10 | 3.2% |
| Mexico | 4 | 1.3% | View All 6 Rows |
Sex and Age in White Stone
Sex and Age in White Stone
The most populous age groups in White Stone are 5 to 9 Years (20 | 12.4%) for men and 55 to 59 Years (24 | 16.0%) for women.
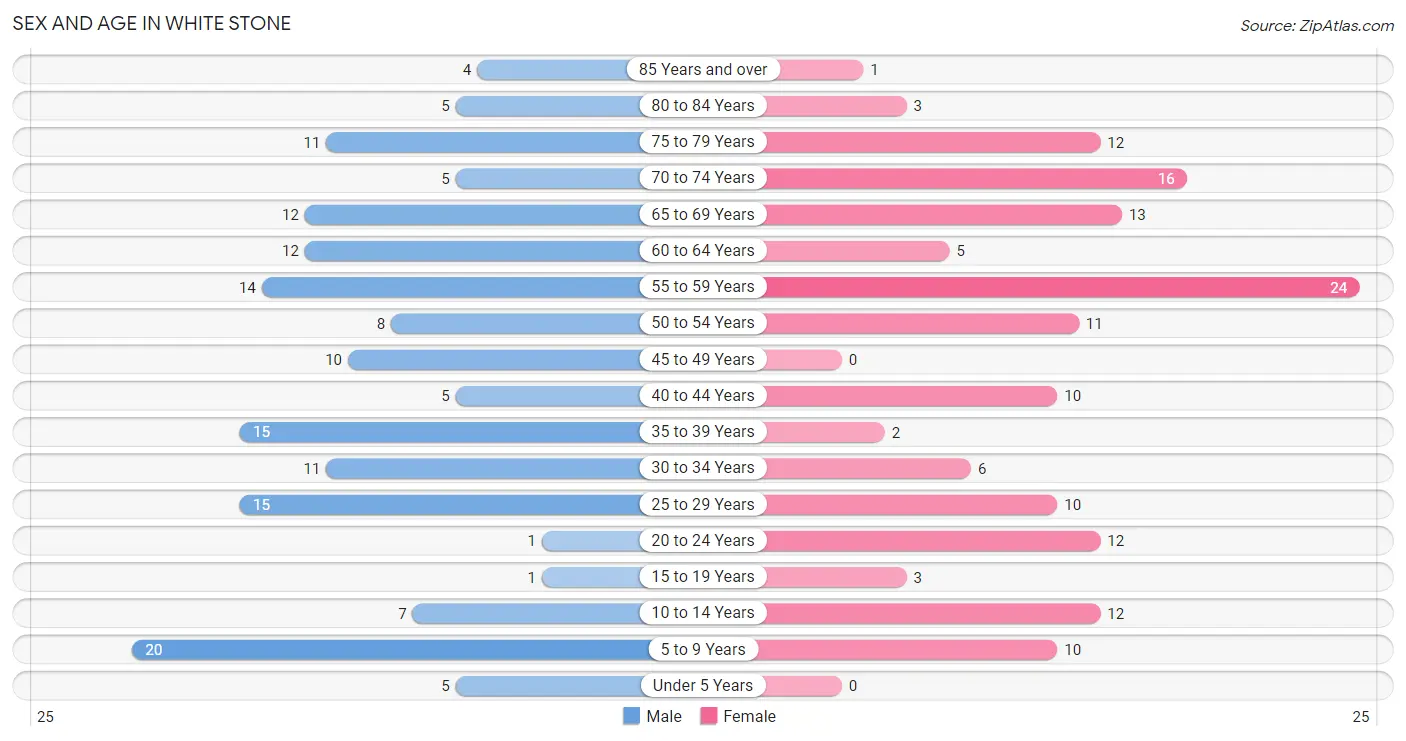
| Age Bracket | Male | Female |
| Under 5 Years | 5 (3.1%) | 0 (0.0%) |
| 5 to 9 Years | 20 (12.4%) | 10 (6.7%) |
| 10 to 14 Years | 7 (4.3%) | 12 (8.0%) |
| 15 to 19 Years | 1 (0.6%) | 3 (2.0%) |
| 20 to 24 Years | 1 (0.6%) | 12 (8.0%) |
| 25 to 29 Years | 15 (9.3%) | 10 (6.7%) |
| 30 to 34 Years | 11 (6.8%) | 6 (4.0%) |
| 35 to 39 Years | 15 (9.3%) | 2 (1.3%) |
| 40 to 44 Years | 5 (3.1%) | 10 (6.7%) |
| 45 to 49 Years | 10 (6.2%) | 0 (0.0%) |
| 50 to 54 Years | 8 (5.0%) | 11 (7.3%) |
| 55 to 59 Years | 14 (8.7%) | 24 (16.0%) |
| 60 to 64 Years | 12 (7.4%) | 5 (3.3%) |
| 65 to 69 Years | 12 (7.4%) | 13 (8.7%) |
| 70 to 74 Years | 5 (3.1%) | 16 (10.7%) |
| 75 to 79 Years | 11 (6.8%) | 12 (8.0%) |
| 80 to 84 Years | 5 (3.1%) | 3 (2.0%) |
| 85 Years and over | 4 (2.5%) | 1 (0.7%) |
| Total | 161 (100.0%) | 150 (100.0%) |
Families and Households in White Stone
Median Family Size in White Stone
The median family size in White Stone is 2.84 persons per family, with married-couple families (45 | 64.3%) accounting for the largest median family size of 2.96 persons per family. On the other hand, single male/father families (7 | 10.0%) represent the smallest median family size with 2.57 persons per family.
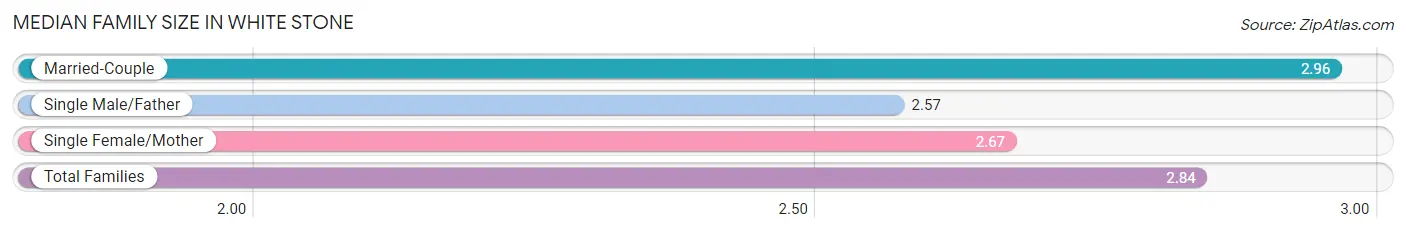
| Family Type | # Families | Family Size |
| Married-Couple | 45 (64.3%) | 2.96 |
| Single Male/Father | 7 (10.0%) | 2.57 |
| Single Female/Mother | 18 (25.7%) | 2.67 |
| Total Families | 70 (100.0%) | 2.84 |
Median Household Size in White Stone
The median household size in White Stone is 1.99 persons per household, with married-couple households (45 | 28.8%) accounting for the largest median household size of 3 persons per household. non-family households (86 | 55.1%) represent the smallest median household size with 1.24 persons per household.
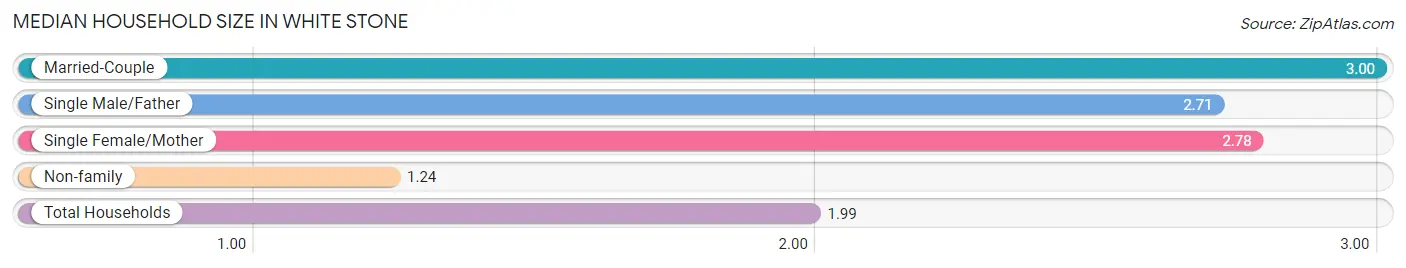
| Household Type | # Households | Household Size |
| Married-Couple | 45 (28.8%) | 3.00 |
| Single Male/Father | 7 (4.5%) | 2.71 |
| Single Female/Mother | 18 (11.5%) | 2.78 |
| Non-family | 86 (55.1%) | 1.24 |
| Total Households | 156 (100.0%) | 1.99 |
Household Size by Marriage Status in White Stone
Out of a total of 156 households in White Stone, 70 (44.9%) are family households, while 86 (55.1%) are nonfamily households. The most numerous type of family households are 2-person households, comprising 38, and the most common type of nonfamily households are 1-person households, comprising 78.
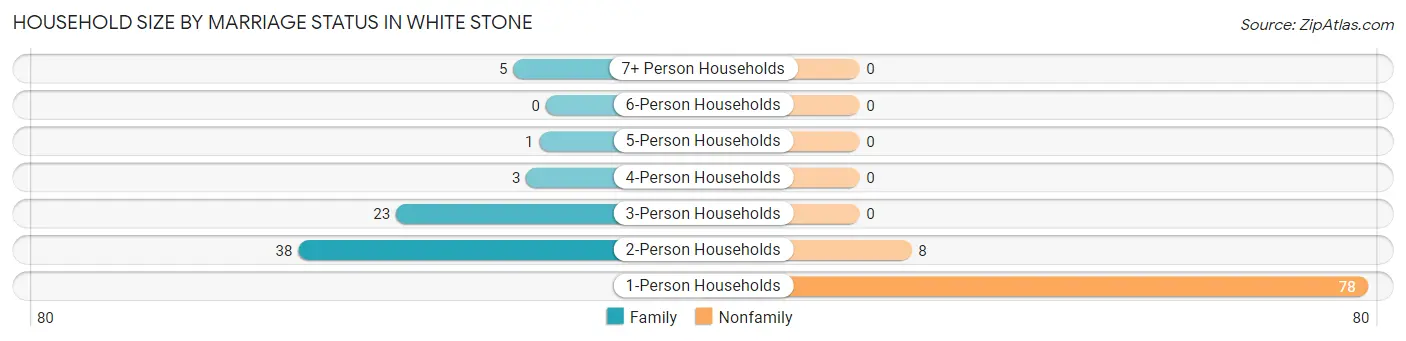
| Household Size | Family Households | Nonfamily Households |
| 1-Person Households | - | 78 (50.0%) |
| 2-Person Households | 38 (24.4%) | 8 (5.1%) |
| 3-Person Households | 23 (14.7%) | 0 (0.0%) |
| 4-Person Households | 3 (1.9%) | 0 (0.0%) |
| 5-Person Households | 1 (0.6%) | 0 (0.0%) |
| 6-Person Households | 0 (0.0%) | 0 (0.0%) |
| 7+ Person Households | 5 (3.2%) | 0 (0.0%) |
| Total | 70 (44.9%) | 86 (55.1%) |
Female Fertility in White Stone
Fertility by Age in White Stone
Average fertility rate in White Stone is 111.0 births per 1,000 women. Women in the age bracket of 35 to 50 years have the highest fertility rate with 143.0 births per 1,000 women. Women in the age bracket of 20 to 34 years acount for 60.0% of all women with births.
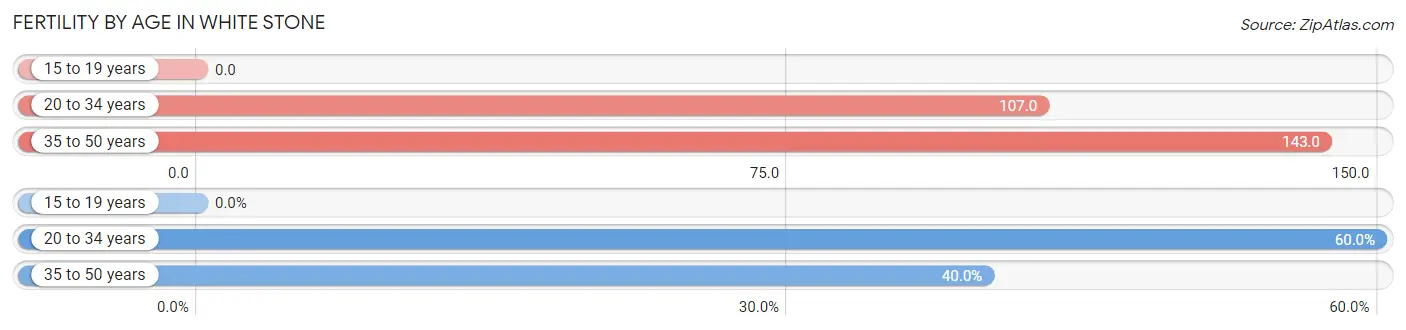
| Age Bracket | Women with Births | Births / 1,000 Women |
| 15 to 19 years | 0 (0.0%) | 0.0 |
| 20 to 34 years | 3 (60.0%) | 107.0 |
| 35 to 50 years | 2 (40.0%) | 143.0 |
| Total | 5 (100.0%) | 111.0 |
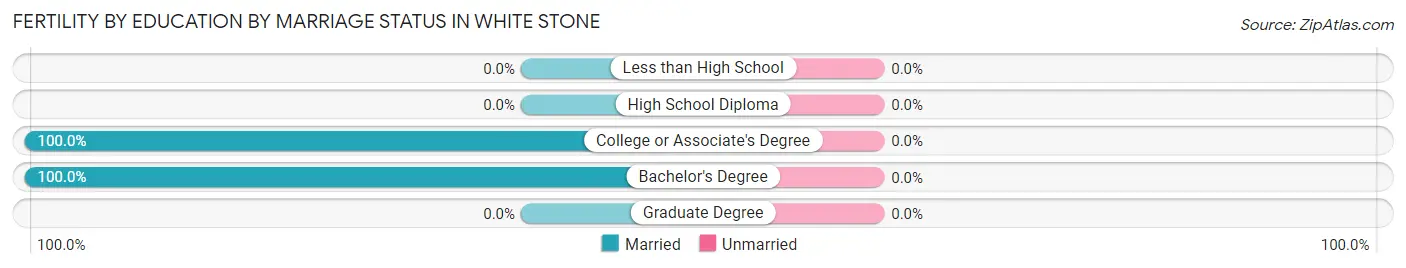
Fertility by Age by Marriage Status in White Stone
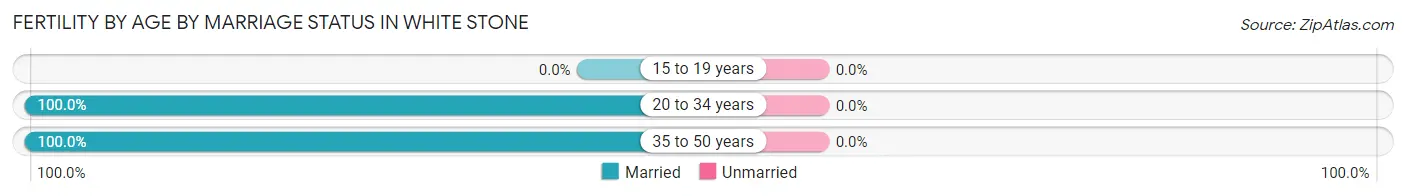
| Age Bracket | Married | Unmarried |
| 15 to 19 years | 0 (0.0%) | 0 (0.0%) |
| 20 to 34 years | 3 (100.0%) | 0 (0.0%) |
| 35 to 50 years | 2 (100.0%) | 0 (0.0%) |
| Total | 5 (100.0%) | 0 (0.0%) |
Fertility by Education in White Stone
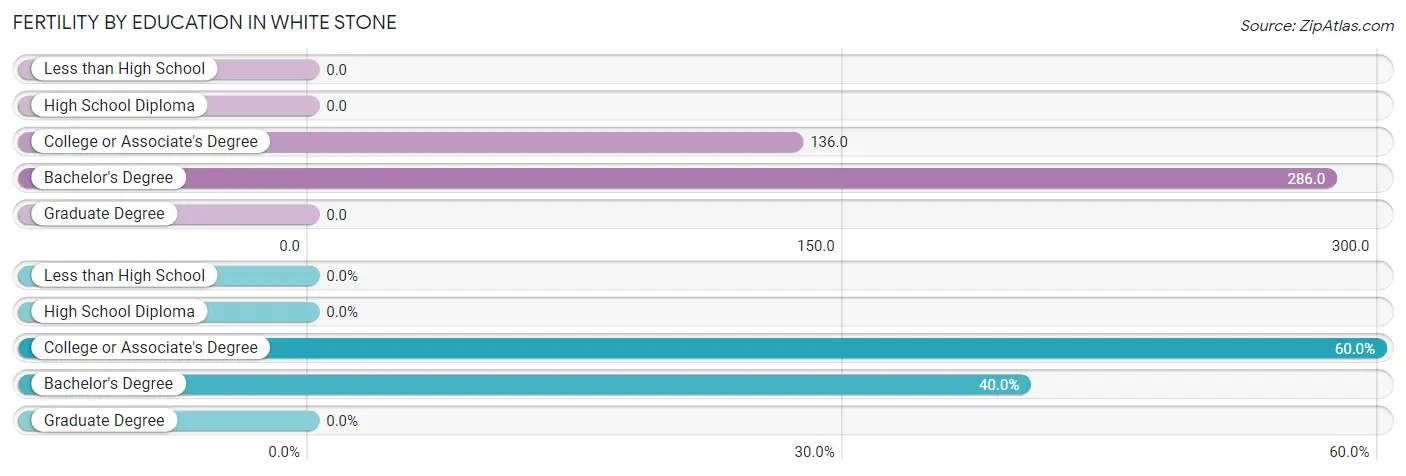
| Educational Attainment | Women with Births | Births / 1,000 Women |
| Less than High School | 0 (0.0%) | 0.0 |
| High School Diploma | 0 (0.0%) | 0.0 |
| College or Associate's Degree | 3 (60.0%) | 136.0 |
| Bachelor's Degree | 2 (40.0%) | 286.0 |
| Graduate Degree | 0 (0.0%) | 0.0 |
| Total | 5 (100.0%) | 111.0 |
Fertility by Education by Marriage Status in White Stone
| Educational Attainment | Married | Unmarried |
| Less than High School | 0 (0.0%) | 0 (0.0%) |
| High School Diploma | 0 (0.0%) | 0 (0.0%) |
| College or Associate's Degree | 3 (100.0%) | 0 (0.0%) |
| Bachelor's Degree | 2 (100.0%) | 0 (0.0%) |
| Graduate Degree | 0 (0.0%) | 0 (0.0%) |
| Total | 5 (100.0%) | 0 (0.0%) |
Employment Characteristics in White Stone
Employment by Class of Employer in White Stone
Among the 154 employed individuals in White Stone, private company employees (113 | 73.4%), not-for-profit organizations (15 | 9.7%), and self-employed (not incorporated) (11 | 7.1%) make up the most common classes of employment.
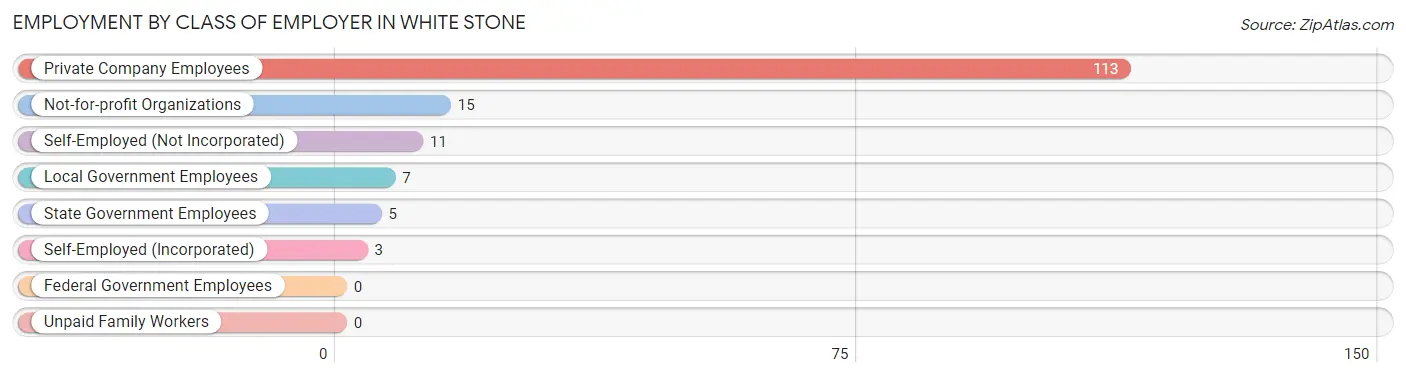
| Employer Class | # Employees | % Employees |
| Private Company Employees | 113 | 73.4% |
| Self-Employed (Incorporated) | 3 | 1.9% |
| Self-Employed (Not Incorporated) | 11 | 7.1% |
| Not-for-profit Organizations | 15 | 9.7% |
| Local Government Employees | 7 | 4.5% |
| State Government Employees | 5 | 3.3% |
| Federal Government Employees | 0 | 0.0% |
| Unpaid Family Workers | 0 | 0.0% |
| Total | 154 | 100.0% |
Employment Status by Age in White Stone
According to the labor force statistics for White Stone, out of the total population over 16 years of age (257), 67.3% or 173 individuals are in the labor force, with 8.1% or 14 of them unemployed. The age group with the highest labor force participation rate is 20 to 24 years, with 100.0% or 13 individuals in the labor force. Within the labor force, the 55 to 59 years age range has the highest percentage of unemployed individuals, with 26.9% or 7 of them being unemployed.
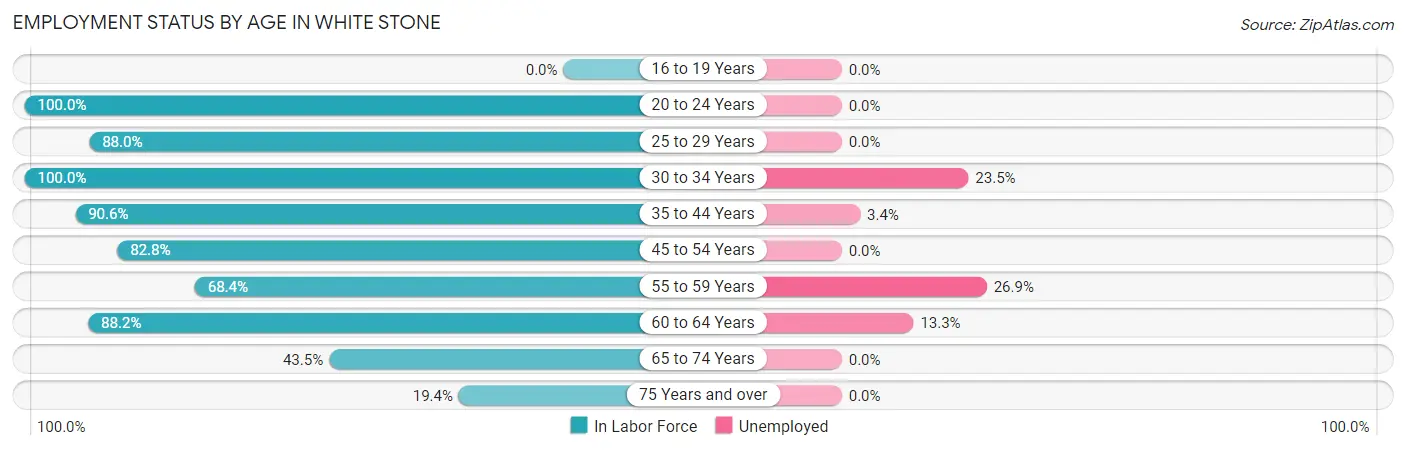
| Age Bracket | In Labor Force | Unemployed |
| 16 to 19 Years | 0 (0.0%) | 0 (0.0%) |
| 20 to 24 Years | 13 (100.0%) | 0 (0.0%) |
| 25 to 29 Years | 22 (88.0%) | 0 (0.0%) |
| 30 to 34 Years | 17 (100.0%) | 4 (23.5%) |
| 35 to 44 Years | 29 (90.6%) | 1 (3.4%) |
| 45 to 54 Years | 24 (82.8%) | 0 (0.0%) |
| 55 to 59 Years | 26 (68.4%) | 7 (26.9%) |
| 60 to 64 Years | 15 (88.2%) | 2 (13.3%) |
| 65 to 74 Years | 20 (43.5%) | 0 (0.0%) |
| 75 Years and over | 7 (19.4%) | 0 (0.0%) |
| Total | 173 (67.3%) | 14 (8.1%) |
Employment Status by Educational Attainment in White Stone
According to labor force statistics for White Stone, 84.2% of individuals (133) out of the total population between 25 and 64 years of age (158) are in the labor force, with 10.5% or 14 of them being unemployed. The group with the highest labor force participation rate are those with the educational attainment of less than high school, with 100.0% or 32 individuals in the labor force. Within the labor force, individuals with high school diploma education have the highest percentage of unemployment, with 26.5% or 9 of them being unemployed.
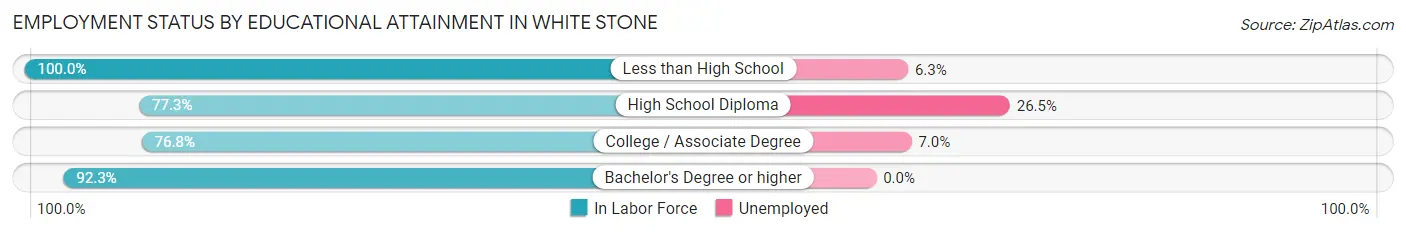
| Educational Attainment | In Labor Force | Unemployed |
| Less than High School | 32 (100.0%) | 2 (6.3%) |
| High School Diploma | 34 (77.3%) | 12 (26.5%) |
| College / Associate Degree | 43 (76.8%) | 4 (7.0%) |
| Bachelor's Degree or higher | 24 (92.3%) | 0 (0.0%) |
| Total | 133 (84.2%) | 17 (10.5%) |
Employment Occupations by Sex in White Stone
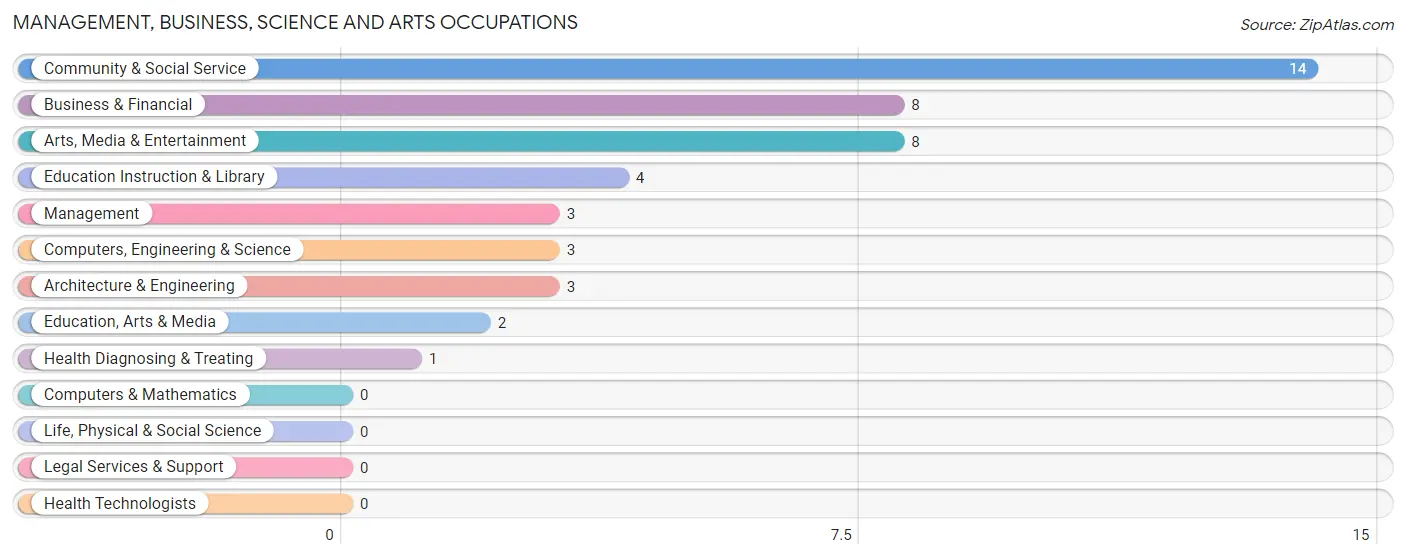
Management, Business, Science and Arts Occupations
The most common Management, Business, Science and Arts occupations in White Stone are Community & Social Service (14 | 8.8%), Business & Financial (8 | 5.0%), Arts, Media & Entertainment (8 | 5.0%), Education Instruction & Library (4 | 2.5%), and Management (3 | 1.9%).
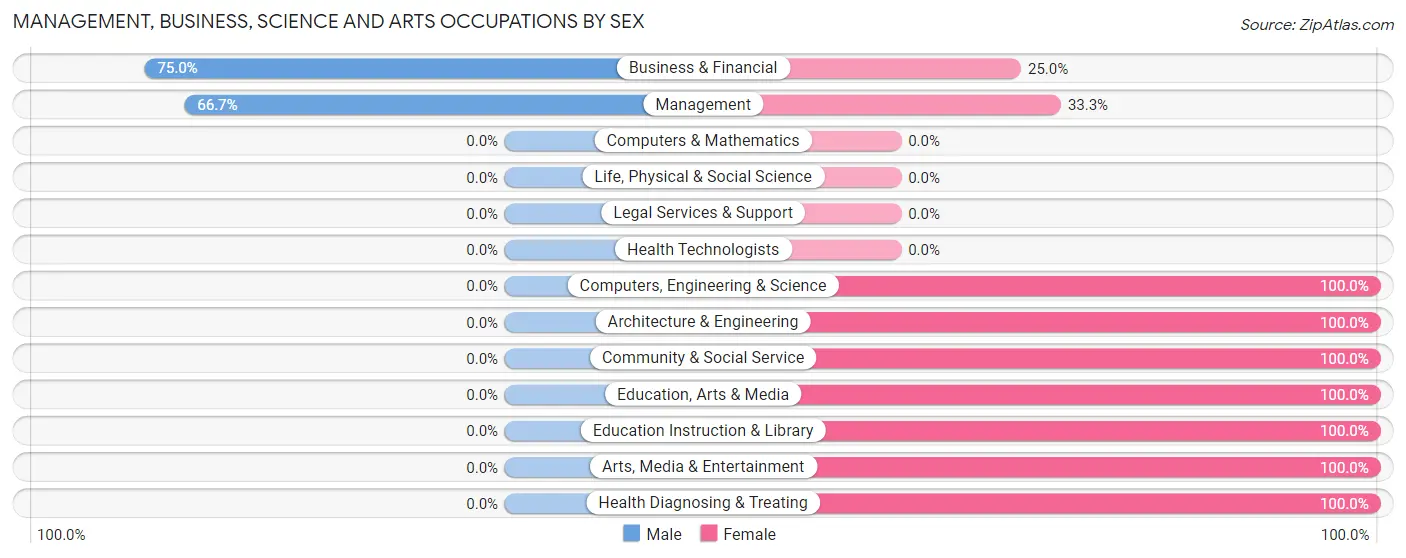
Management, Business, Science and Arts Occupations by Sex
Within the Management, Business, Science and Arts occupations in White Stone, the most male-oriented occupations are Business & Financial (75.0%), and Management (66.7%), while the most female-oriented occupations are Computers, Engineering & Science (100.0%), Architecture & Engineering (100.0%), and Community & Social Service (100.0%).
| Occupation | Male | Female |
| Management | 2 (66.7%) | 1 (33.3%) |
| Business & Financial | 6 (75.0%) | 2 (25.0%) |
| Computers, Engineering & Science | 0 (0.0%) | 3 (100.0%) |
| Computers & Mathematics | 0 (0.0%) | 0 (0.0%) |
| Architecture & Engineering | 0 (0.0%) | 3 (100.0%) |
| Life, Physical & Social Science | 0 (0.0%) | 0 (0.0%) |
| Community & Social Service | 0 (0.0%) | 14 (100.0%) |
| Education, Arts & Media | 0 (0.0%) | 2 (100.0%) |
| Legal Services & Support | 0 (0.0%) | 0 (0.0%) |
| Education Instruction & Library | 0 (0.0%) | 4 (100.0%) |
| Arts, Media & Entertainment | 0 (0.0%) | 8 (100.0%) |
| Health Diagnosing & Treating | 0 (0.0%) | 1 (100.0%) |
| Health Technologists | 0 (0.0%) | 0 (0.0%) |
| Total (Category) | 8 (27.6%) | 21 (72.4%) |
| Total (Overall) | 84 (52.8%) | 75 (47.2%) |
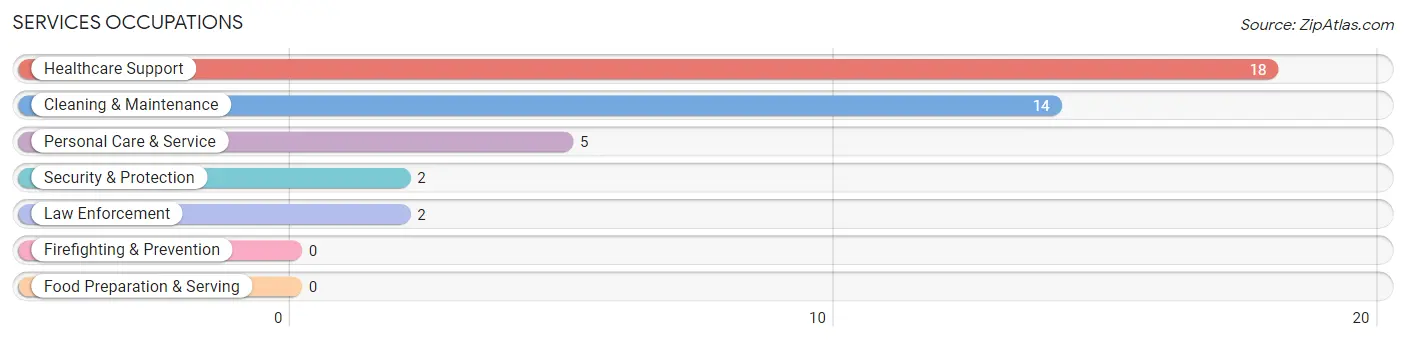
Services Occupations
The most common Services occupations in White Stone are Healthcare Support (18 | 11.3%), Cleaning & Maintenance (14 | 8.8%), Personal Care & Service (5 | 3.1%), Security & Protection (2 | 1.3%), and Law Enforcement (2 | 1.3%).
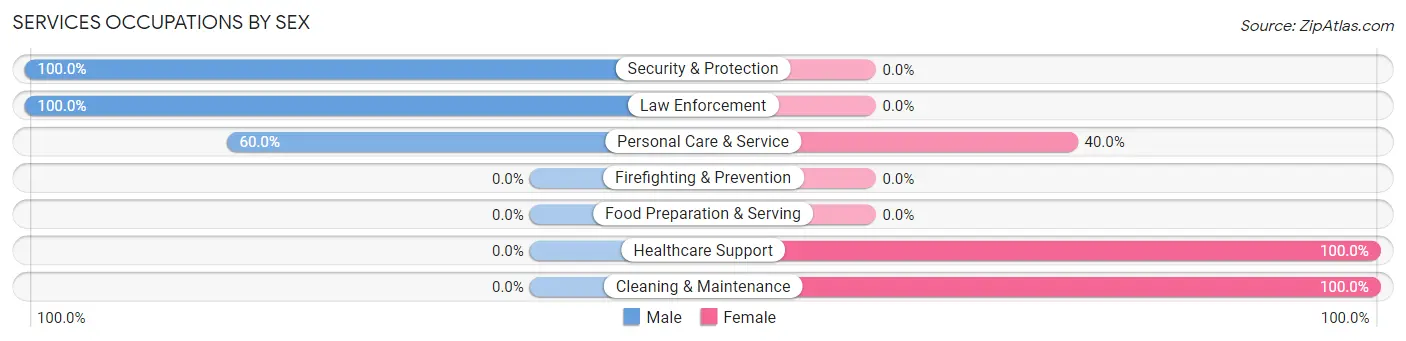
Services Occupations by Sex
Within the Services occupations in White Stone, the most male-oriented occupations are Security & Protection (100.0%), Law Enforcement (100.0%), and Personal Care & Service (60.0%), while the most female-oriented occupations are Healthcare Support (100.0%), Cleaning & Maintenance (100.0%), and Personal Care & Service (40.0%).
| Occupation | Male | Female |
| Healthcare Support | 0 (0.0%) | 18 (100.0%) |
| Security & Protection | 2 (100.0%) | 0 (0.0%) |
| Firefighting & Prevention | 0 (0.0%) | 0 (0.0%) |
| Law Enforcement | 2 (100.0%) | 0 (0.0%) |
| Food Preparation & Serving | 0 (0.0%) | 0 (0.0%) |
| Cleaning & Maintenance | 0 (0.0%) | 14 (100.0%) |
| Personal Care & Service | 3 (60.0%) | 2 (40.0%) |
| Total (Category) | 5 (12.8%) | 34 (87.2%) |
| Total (Overall) | 84 (52.8%) | 75 (47.2%) |
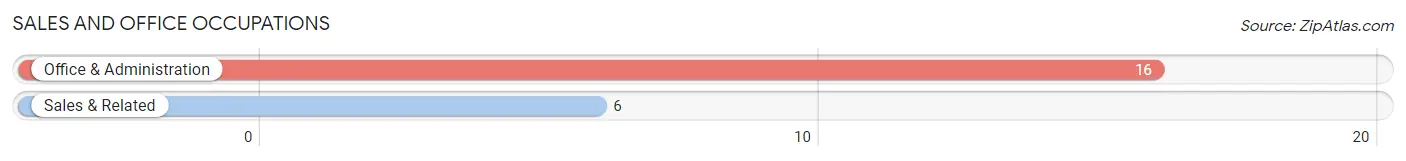
Sales and Office Occupations
The most common Sales and Office occupations in White Stone are Office & Administration (16 | 10.1%), and Sales & Related (6 | 3.8%).
Sales and Office Occupations by Sex
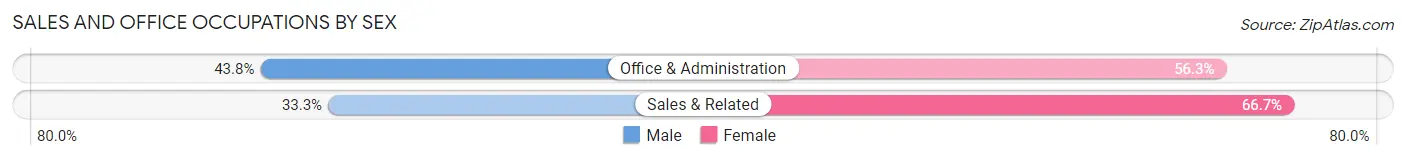
| Occupation | Male | Female |
| Sales & Related | 2 (33.3%) | 4 (66.7%) |
| Office & Administration | 7 (43.8%) | 9 (56.2%) |
| Total (Category) | 9 (40.9%) | 13 (59.1%) |
| Total (Overall) | 84 (52.8%) | 75 (47.2%) |
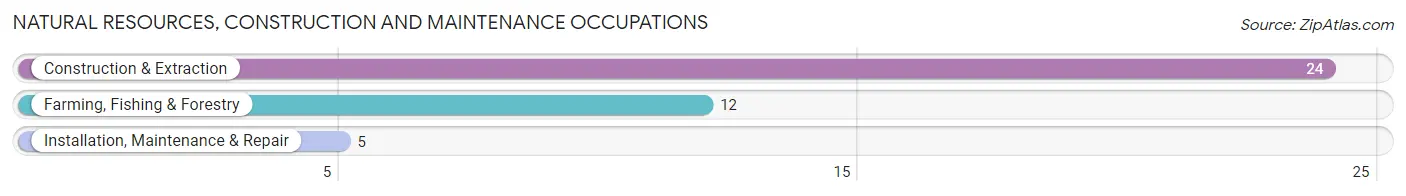
Natural Resources, Construction and Maintenance Occupations
The most common Natural Resources, Construction and Maintenance occupations in White Stone are Construction & Extraction (24 | 15.1%), Farming, Fishing & Forestry (12 | 7.5%), and Installation, Maintenance & Repair (5 | 3.1%).
Natural Resources, Construction and Maintenance Occupations by Sex
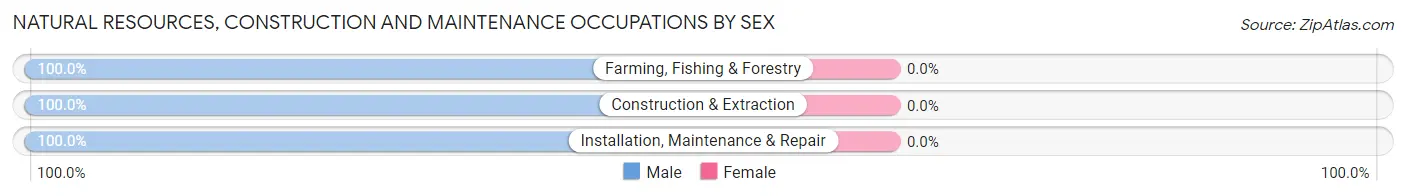
| Occupation | Male | Female |
| Farming, Fishing & Forestry | 12 (100.0%) | 0 (0.0%) |
| Construction & Extraction | 24 (100.0%) | 0 (0.0%) |
| Installation, Maintenance & Repair | 5 (100.0%) | 0 (0.0%) |
| Total (Category) | 41 (100.0%) | 0 (0.0%) |
| Total (Overall) | 84 (52.8%) | 75 (47.2%) |
Production, Transportation and Moving Occupations
The most common Production, Transportation and Moving occupations in White Stone are Transportation (14 | 8.8%), Production (7 | 4.4%), and Material Moving (7 | 4.4%).
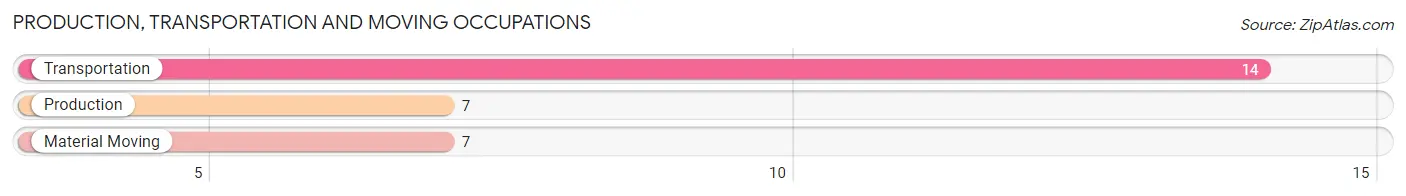
Production, Transportation and Moving Occupations by Sex
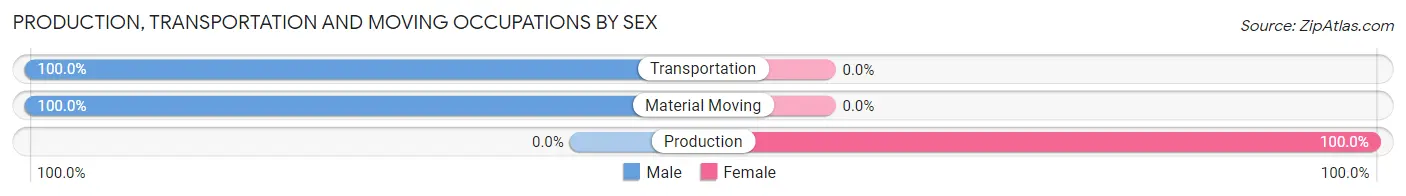
| Occupation | Male | Female |
| Production | 0 (0.0%) | 7 (100.0%) |
| Transportation | 14 (100.0%) | 0 (0.0%) |
| Material Moving | 7 (100.0%) | 0 (0.0%) |
| Total (Category) | 21 (75.0%) | 7 (25.0%) |
| Total (Overall) | 84 (52.8%) | 75 (47.2%) |
Employment Industries by Sex in White Stone
Employment Industries in White Stone
The major employment industries in White Stone include Construction (27 | 17.0%), Retail Trade (21 | 13.2%), Health Care & Social Assistance (19 | 11.9%), Transportation & Warehousing (13 | 8.2%), and Agriculture, Fishing & Hunting (12 | 7.5%).
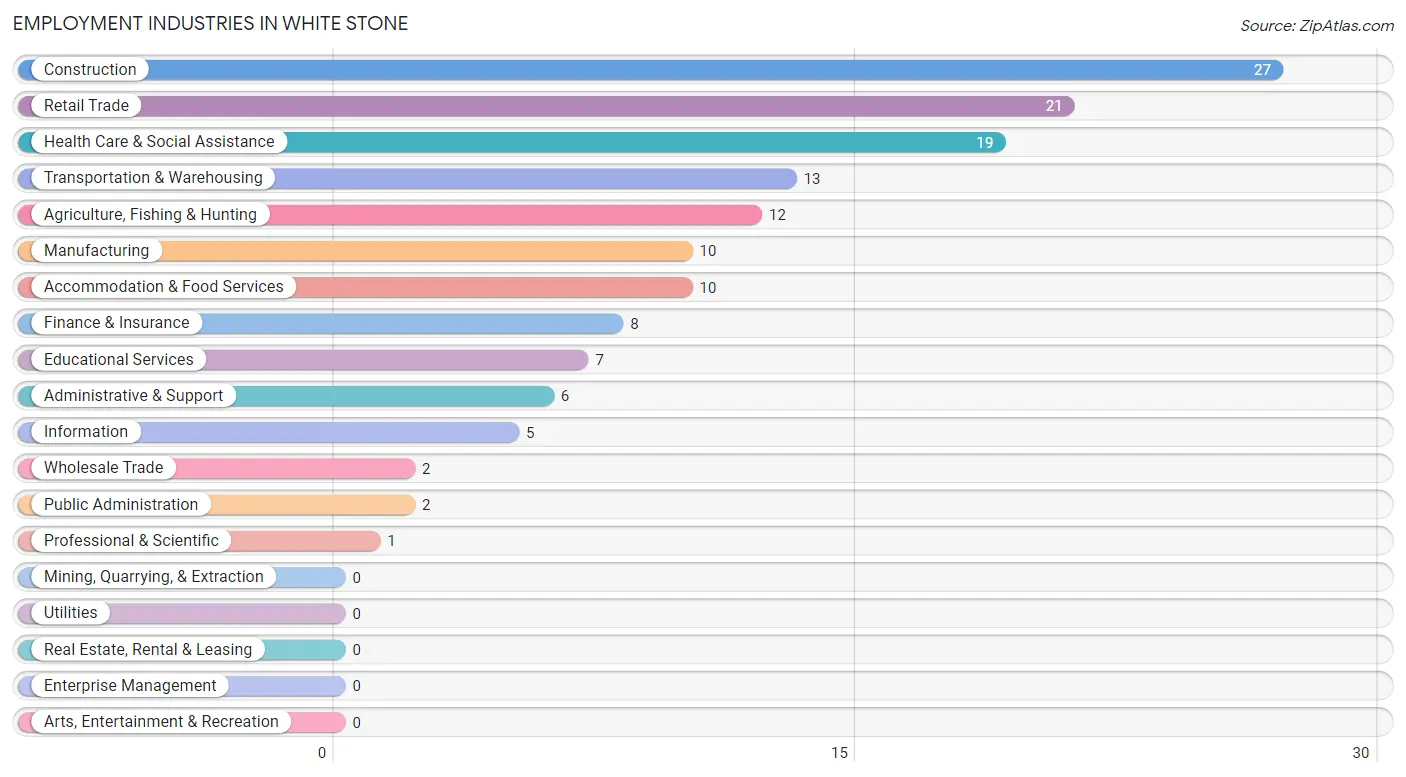
Employment Industries by Sex in White Stone
The White Stone industries that see more men than women are Agriculture, Fishing & Hunting (100.0%), Construction (100.0%), and Wholesale Trade (100.0%), whereas the industries that tend to have a higher number of women are Information (100.0%), Professional & Scientific (100.0%), and Administrative & Support (100.0%).
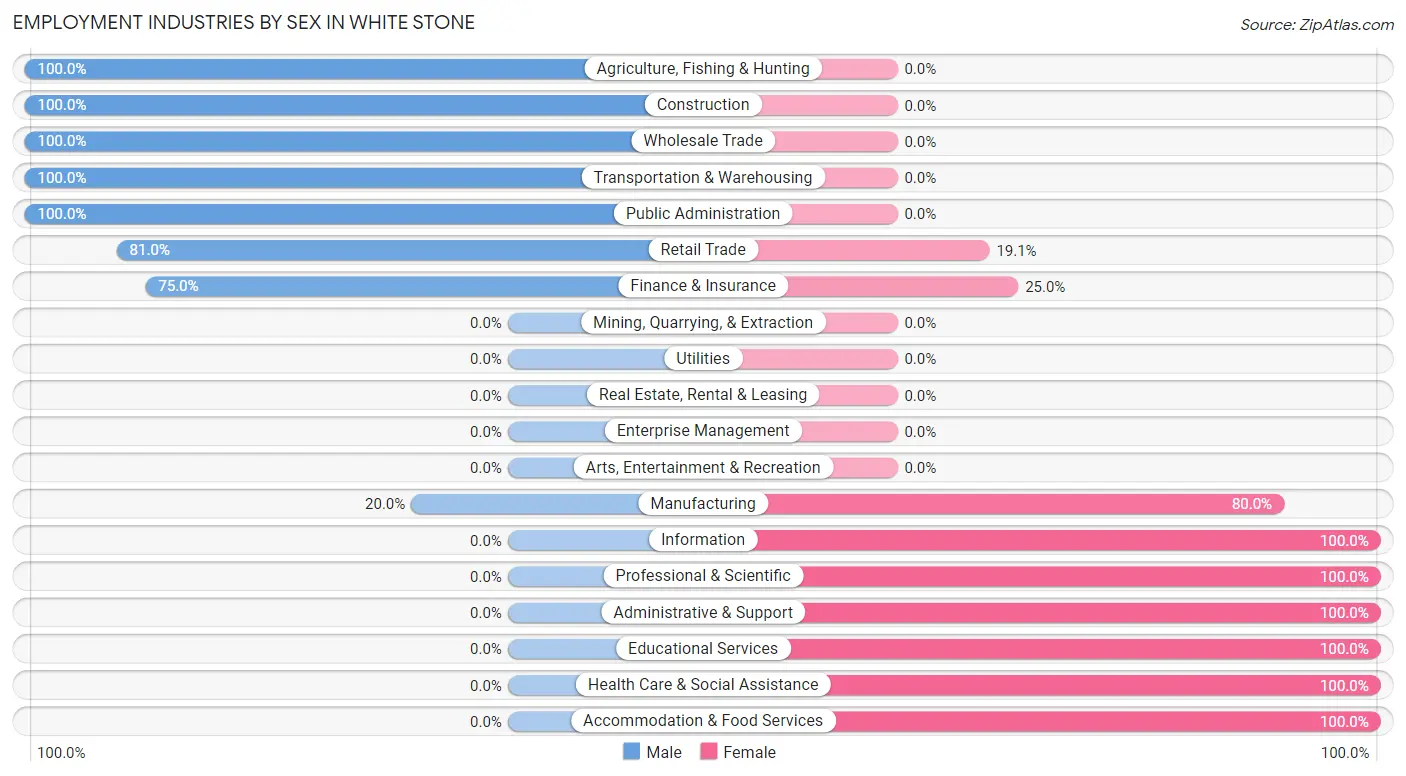
| Industry | Male | Female |
| Agriculture, Fishing & Hunting | 12 (100.0%) | 0 (0.0%) |
| Mining, Quarrying, & Extraction | 0 (0.0%) | 0 (0.0%) |
| Construction | 27 (100.0%) | 0 (0.0%) |
| Manufacturing | 2 (20.0%) | 8 (80.0%) |
| Wholesale Trade | 2 (100.0%) | 0 (0.0%) |
| Retail Trade | 17 (80.9%) | 4 (19.1%) |
| Transportation & Warehousing | 13 (100.0%) | 0 (0.0%) |
| Utilities | 0 (0.0%) | 0 (0.0%) |
| Information | 0 (0.0%) | 5 (100.0%) |
| Finance & Insurance | 6 (75.0%) | 2 (25.0%) |
| Real Estate, Rental & Leasing | 0 (0.0%) | 0 (0.0%) |
| Professional & Scientific | 0 (0.0%) | 1 (100.0%) |
| Enterprise Management | 0 (0.0%) | 0 (0.0%) |
| Administrative & Support | 0 (0.0%) | 6 (100.0%) |
| Educational Services | 0 (0.0%) | 7 (100.0%) |
| Health Care & Social Assistance | 0 (0.0%) | 19 (100.0%) |
| Arts, Entertainment & Recreation | 0 (0.0%) | 0 (0.0%) |
| Accommodation & Food Services | 0 (0.0%) | 10 (100.0%) |
| Public Administration | 2 (100.0%) | 0 (0.0%) |
| Total | 84 (52.8%) | 75 (47.2%) |
Education in White Stone
School Enrollment in White Stone
The most common levels of schooling among the 55 students in White Stone are elementary school (19 | 34.5%), middle school (17 | 30.9%), and kindergarten (11 | 20.0%).
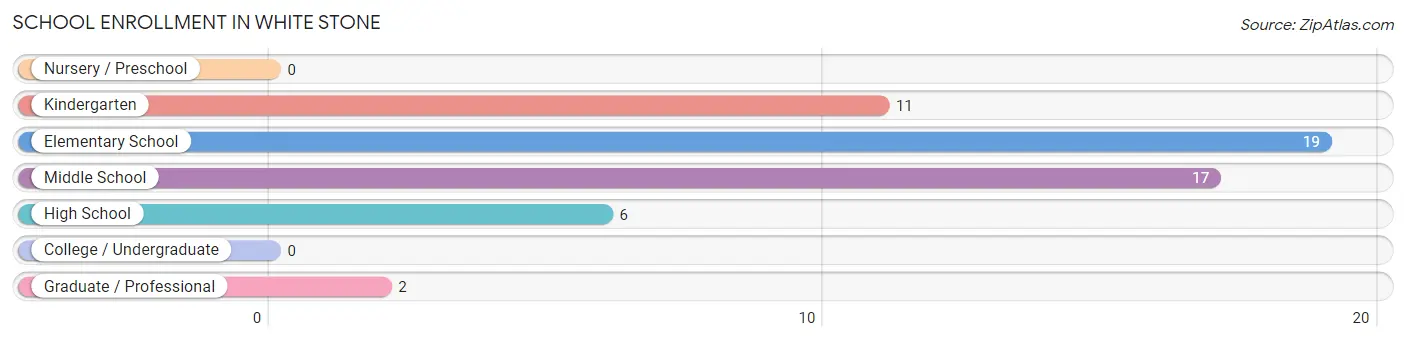
| School Level | # Students | % Students |
| Nursery / Preschool | 0 | 0.0% |
| Kindergarten | 11 | 20.0% |
| Elementary School | 19 | 34.5% |
| Middle School | 17 | 30.9% |
| High School | 6 | 10.9% |
| College / Undergraduate | 0 | 0.0% |
| Graduate / Professional | 2 | 3.6% |
| Total | 55 | 100.0% |
School Enrollment by Age by Funding Source in White Stone
Out of a total of 55 students who are enrolled in schools in White Stone, 2 (3.6%) attend a private institution, while the remaining 53 (96.4%) are enrolled in public schools. The age group of 25 to 34 year olds has the highest likelihood of being enrolled in private schools, with 2 (100.0% in the age bracket) enrolled. Conversely, the age group of 5 to 9 year old has the lowest likelihood of being enrolled in a private school, with 30 (100.0% in the age bracket) attending a public institution.
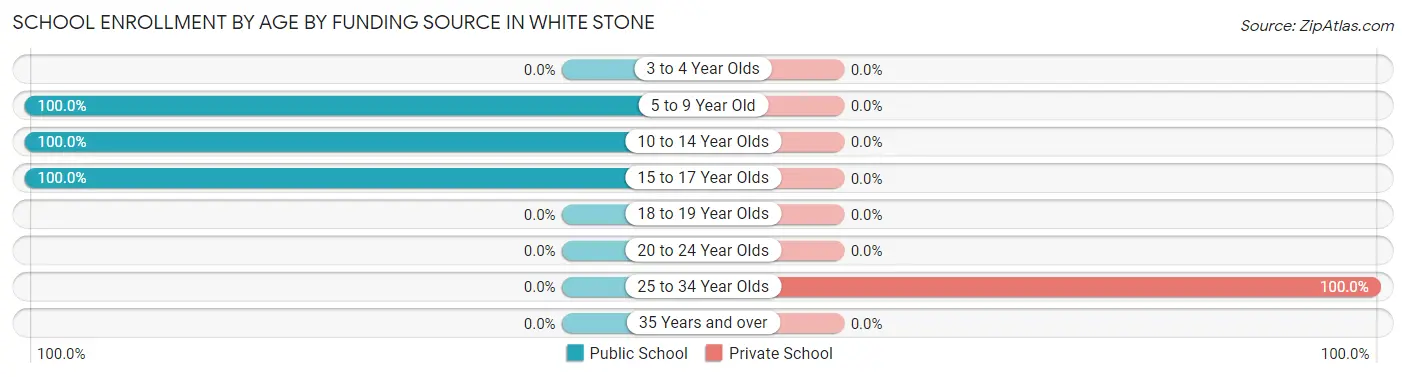
| Age Bracket | Public School | Private School |
| 3 to 4 Year Olds | 0 (0.0%) | 0 (0.0%) |
| 5 to 9 Year Old | 30 (100.0%) | 0 (0.0%) |
| 10 to 14 Year Olds | 19 (100.0%) | 0 (0.0%) |
| 15 to 17 Year Olds | 4 (100.0%) | 0 (0.0%) |
| 18 to 19 Year Olds | 0 (0.0%) | 0 (0.0%) |
| 20 to 24 Year Olds | 0 (0.0%) | 0 (0.0%) |
| 25 to 34 Year Olds | 0 (0.0%) | 2 (100.0%) |
| 35 Years and over | 0 (0.0%) | 0 (0.0%) |
| Total | 53 (96.4%) | 2 (3.6%) |
Educational Attainment by Field of Study in White Stone
Liberal arts & history (7 | 17.5%), business (6 | 15.0%), education (6 | 15.0%), literature & languages (5 | 12.5%), and communications (5 | 12.5%) are the most common fields of study among 40 individuals in White Stone who have obtained a bachelor's degree or higher.
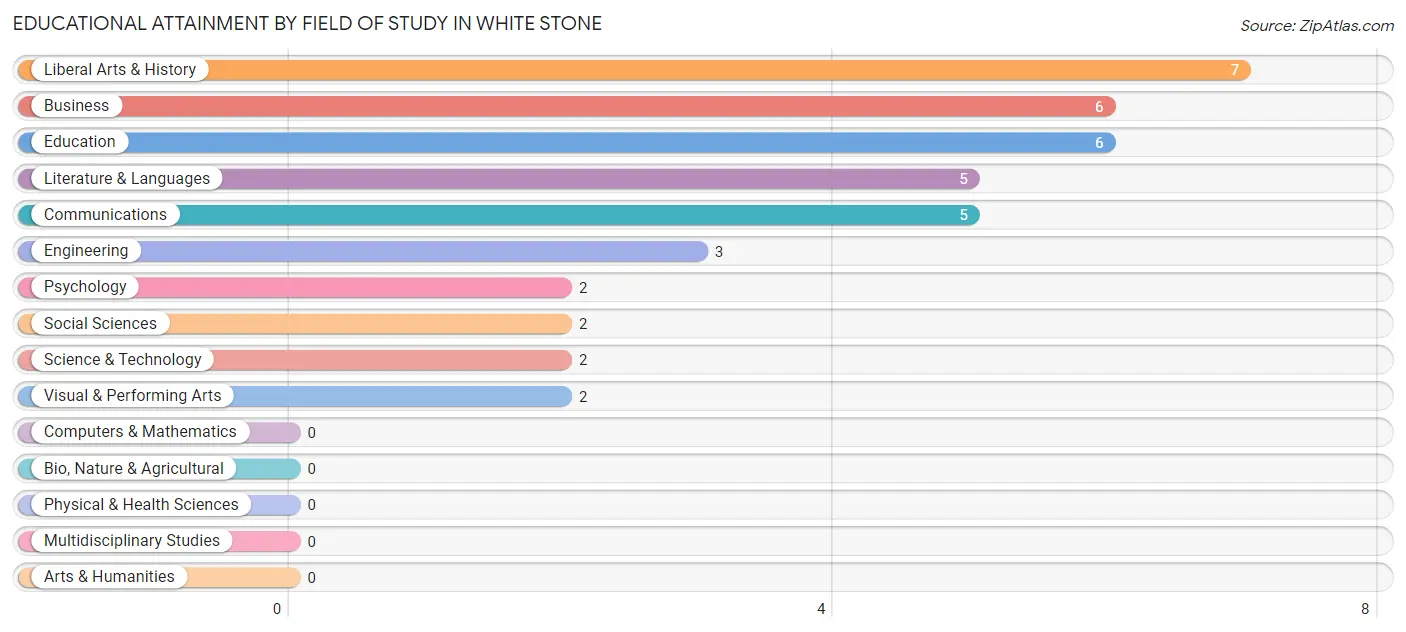
| Field of Study | # Graduates | % Graduates |
| Computers & Mathematics | 0 | 0.0% |
| Bio, Nature & Agricultural | 0 | 0.0% |
| Physical & Health Sciences | 0 | 0.0% |
| Psychology | 2 | 5.0% |
| Social Sciences | 2 | 5.0% |
| Engineering | 3 | 7.5% |
| Multidisciplinary Studies | 0 | 0.0% |
| Science & Technology | 2 | 5.0% |
| Business | 6 | 15.0% |
| Education | 6 | 15.0% |
| Literature & Languages | 5 | 12.5% |
| Liberal Arts & History | 7 | 17.5% |
| Visual & Performing Arts | 2 | 5.0% |
| Communications | 5 | 12.5% |
| Arts & Humanities | 0 | 0.0% |
| Total | 40 | 100.0% |
Transportation & Commute in White Stone
Vehicle Availability by Sex in White Stone
The most prevalent vehicle ownership categories in White Stone are males with 3 vehicles (50, accounting for 59.5%) and females with 3 vehicles (16, making up 71.4%).
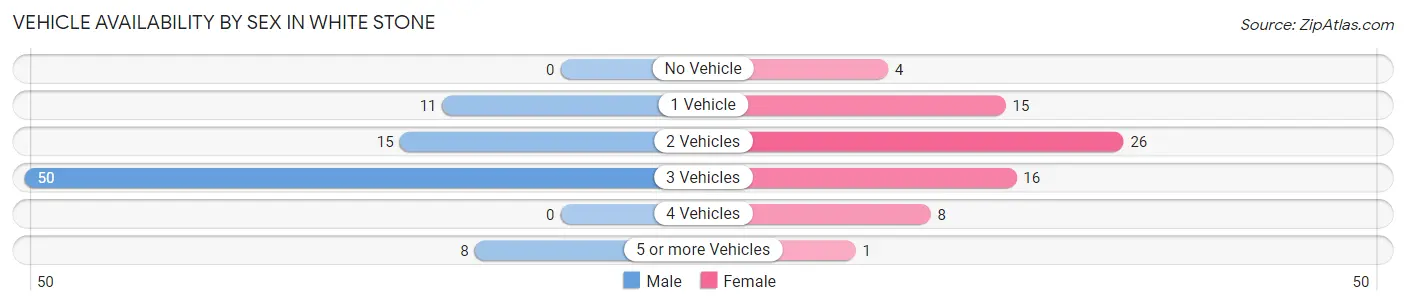
| Vehicles Available | Male | Female |
| No Vehicle | 0 (0.0%) | 4 (5.7%) |
| 1 Vehicle | 11 (13.1%) | 15 (21.4%) |
| 2 Vehicles | 15 (17.9%) | 26 (37.1%) |
| 3 Vehicles | 50 (59.5%) | 16 (22.9%) |
| 4 Vehicles | 0 (0.0%) | 8 (11.4%) |
| 5 or more Vehicles | 8 (9.5%) | 1 (1.4%) |
| Total | 84 (100.0%) | 70 (100.0%) |
Commute Time in White Stone
The most frequently occuring commute durations in White Stone are 10 to 14 minutes (36 commuters, 25.0%), 30 to 34 minutes (25 commuters, 17.4%), and 15 to 19 minutes (22 commuters, 15.3%).
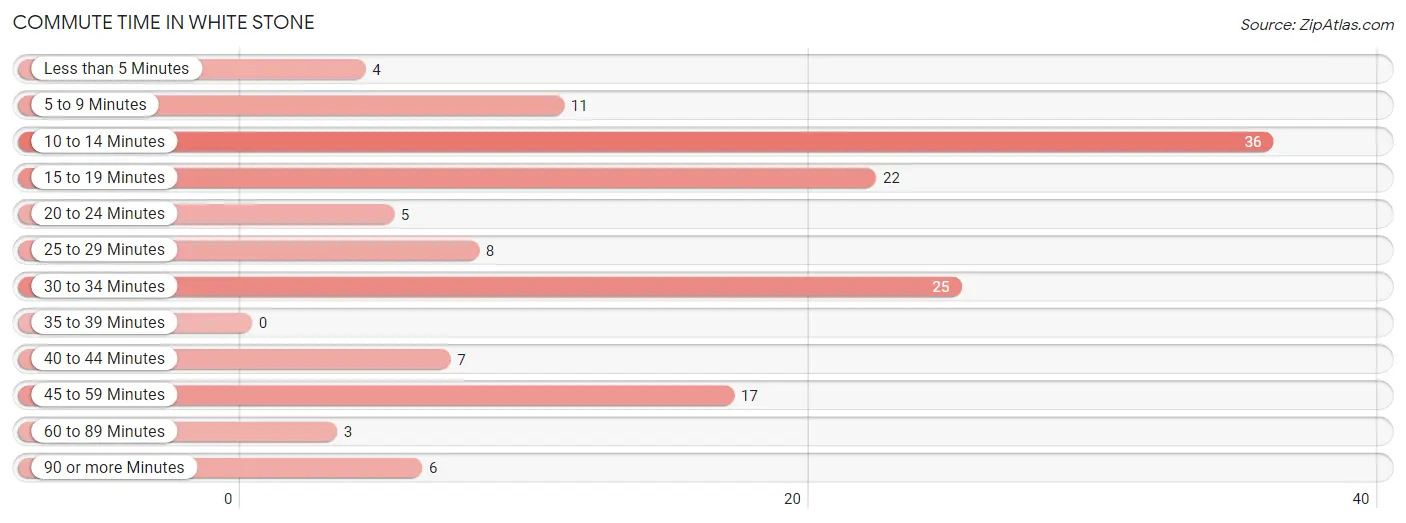
| Commute Time | # Commuters | % Commuters |
| Less than 5 Minutes | 4 | 2.8% |
| 5 to 9 Minutes | 11 | 7.6% |
| 10 to 14 Minutes | 36 | 25.0% |
| 15 to 19 Minutes | 22 | 15.3% |
| 20 to 24 Minutes | 5 | 3.5% |
| 25 to 29 Minutes | 8 | 5.6% |
| 30 to 34 Minutes | 25 | 17.4% |
| 35 to 39 Minutes | 0 | 0.0% |
| 40 to 44 Minutes | 7 | 4.9% |
| 45 to 59 Minutes | 17 | 11.8% |
| 60 to 89 Minutes | 3 | 2.1% |
| 90 or more Minutes | 6 | 4.2% |
Commute Time by Sex in White Stone
The most common commute times in White Stone are 10 to 14 minutes (17 commuters, 20.2%) for males and 10 to 14 minutes (19 commuters, 31.7%) for females.
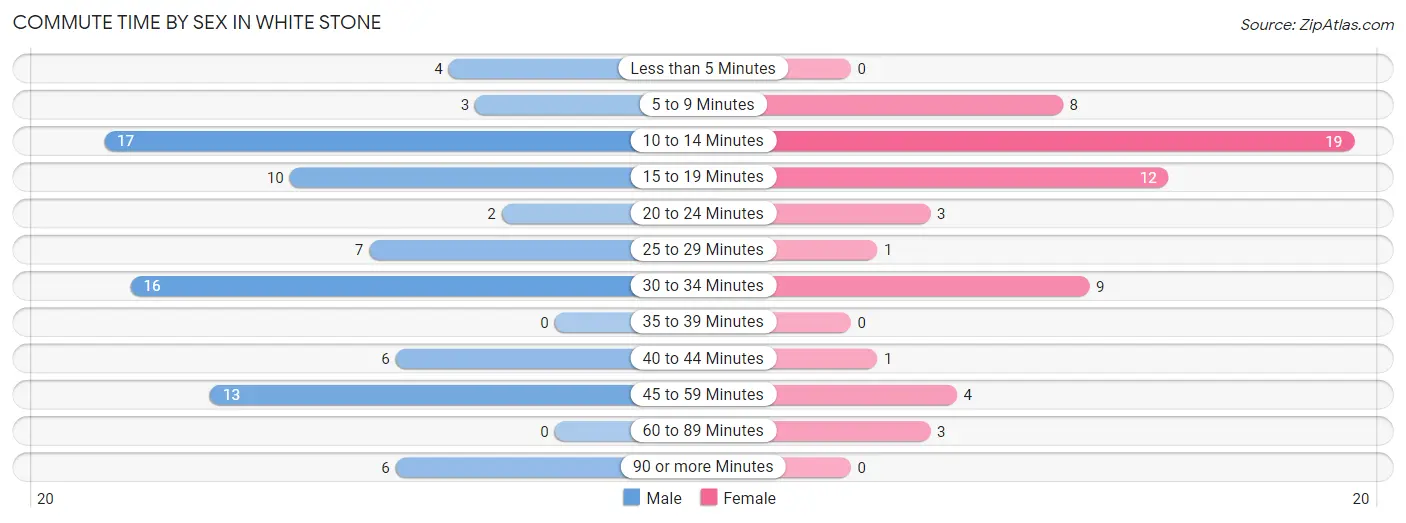
| Commute Time | Male | Female |
| Less than 5 Minutes | 4 (4.8%) | 0 (0.0%) |
| 5 to 9 Minutes | 3 (3.6%) | 8 (13.3%) |
| 10 to 14 Minutes | 17 (20.2%) | 19 (31.7%) |
| 15 to 19 Minutes | 10 (11.9%) | 12 (20.0%) |
| 20 to 24 Minutes | 2 (2.4%) | 3 (5.0%) |
| 25 to 29 Minutes | 7 (8.3%) | 1 (1.7%) |
| 30 to 34 Minutes | 16 (19.1%) | 9 (15.0%) |
| 35 to 39 Minutes | 0 (0.0%) | 0 (0.0%) |
| 40 to 44 Minutes | 6 (7.1%) | 1 (1.7%) |
| 45 to 59 Minutes | 13 (15.5%) | 4 (6.7%) |
| 60 to 89 Minutes | 0 (0.0%) | 3 (5.0%) |
| 90 or more Minutes | 6 (7.1%) | 0 (0.0%) |
Time of Departure to Work by Sex in White Stone
The most frequent times of departure to work in White Stone are 6:30 AM to 6:59 AM (20, 23.8%) for males and 7:30 AM to 7:59 AM (9, 15.0%) for females.
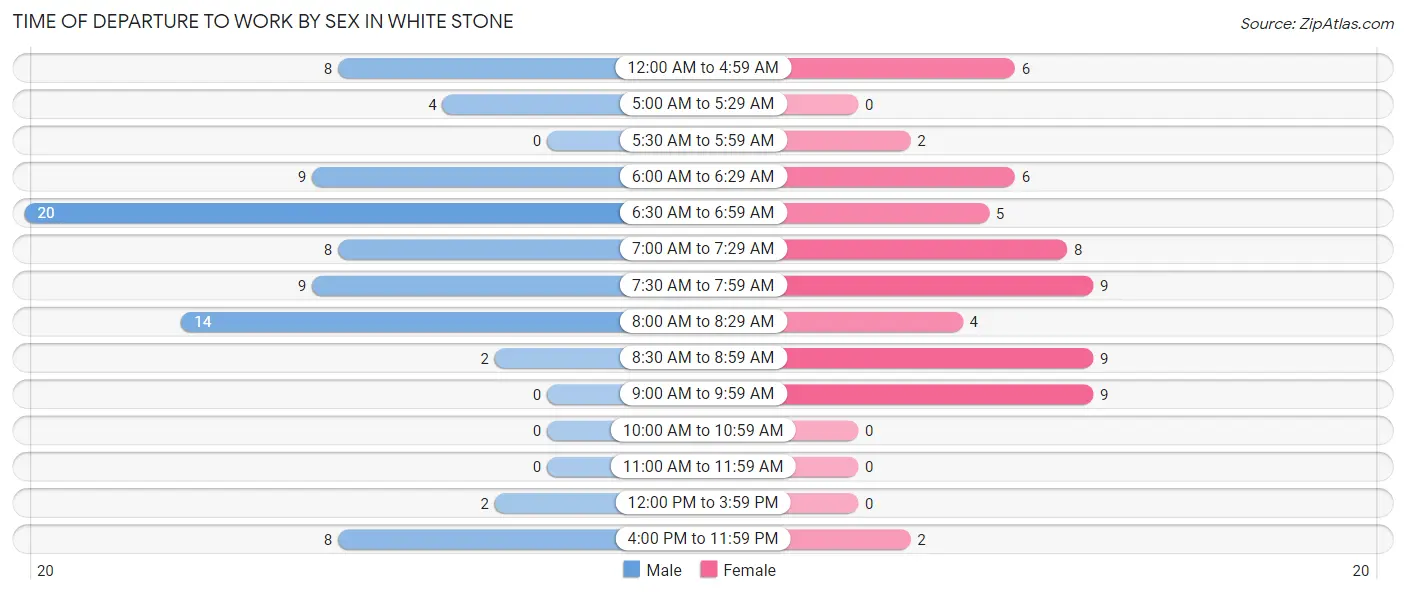
| Time of Departure | Male | Female |
| 12:00 AM to 4:59 AM | 8 (9.5%) | 6 (10.0%) |
| 5:00 AM to 5:29 AM | 4 (4.8%) | 0 (0.0%) |
| 5:30 AM to 5:59 AM | 0 (0.0%) | 2 (3.3%) |
| 6:00 AM to 6:29 AM | 9 (10.7%) | 6 (10.0%) |
| 6:30 AM to 6:59 AM | 20 (23.8%) | 5 (8.3%) |
| 7:00 AM to 7:29 AM | 8 (9.5%) | 8 (13.3%) |
| 7:30 AM to 7:59 AM | 9 (10.7%) | 9 (15.0%) |
| 8:00 AM to 8:29 AM | 14 (16.7%) | 4 (6.7%) |
| 8:30 AM to 8:59 AM | 2 (2.4%) | 9 (15.0%) |
| 9:00 AM to 9:59 AM | 0 (0.0%) | 9 (15.0%) |
| 10:00 AM to 10:59 AM | 0 (0.0%) | 0 (0.0%) |
| 11:00 AM to 11:59 AM | 0 (0.0%) | 0 (0.0%) |
| 12:00 PM to 3:59 PM | 2 (2.4%) | 0 (0.0%) |
| 4:00 PM to 11:59 PM | 8 (9.5%) | 2 (3.3%) |
| Total | 84 (100.0%) | 60 (100.0%) |
Housing Occupancy in White Stone
Occupancy by Ownership in White Stone
Of the total 156 dwellings in White Stone, owner-occupied units account for 99 (63.5%), while renter-occupied units make up 57 (36.5%).
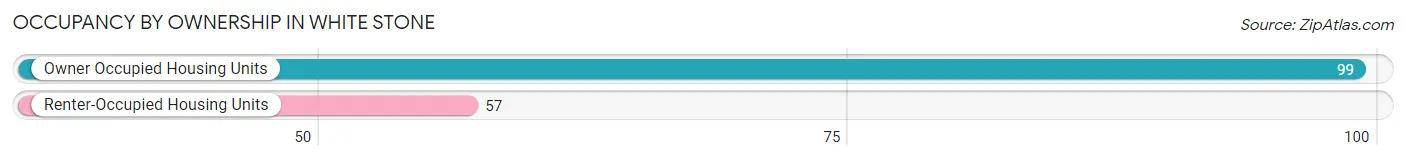
| Occupancy | # Housing Units | % Housing Units |
| Owner Occupied Housing Units | 99 | 63.5% |
| Renter-Occupied Housing Units | 57 | 36.5% |
| Total Occupied Housing Units | 156 | 100.0% |
Occupancy by Household Size in White Stone
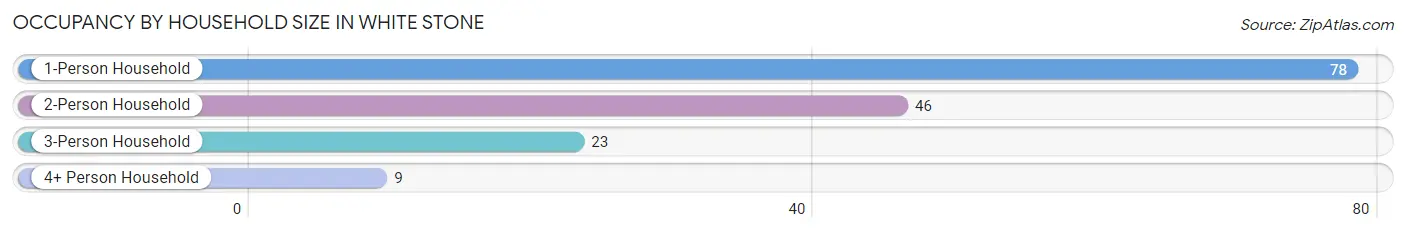
| Household Size | # Housing Units | % Housing Units |
| 1-Person Household | 78 | 50.0% |
| 2-Person Household | 46 | 29.5% |
| 3-Person Household | 23 | 14.7% |
| 4+ Person Household | 9 | 5.8% |
| Total Housing Units | 156 | 100.0% |
Occupancy by Ownership by Household Size in White Stone
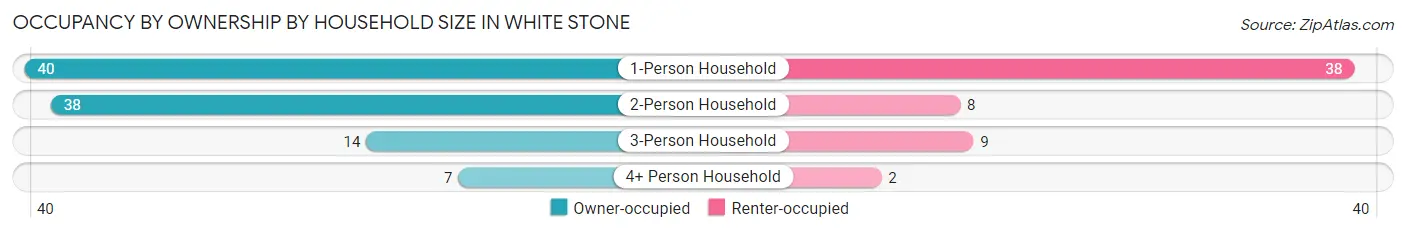
| Household Size | Owner-occupied | Renter-occupied |
| 1-Person Household | 40 (51.3%) | 38 (48.7%) |
| 2-Person Household | 38 (82.6%) | 8 (17.4%) |
| 3-Person Household | 14 (60.9%) | 9 (39.1%) |
| 4+ Person Household | 7 (77.8%) | 2 (22.2%) |
| Total Housing Units | 99 (63.5%) | 57 (36.5%) |
Occupancy by Educational Attainment in White Stone
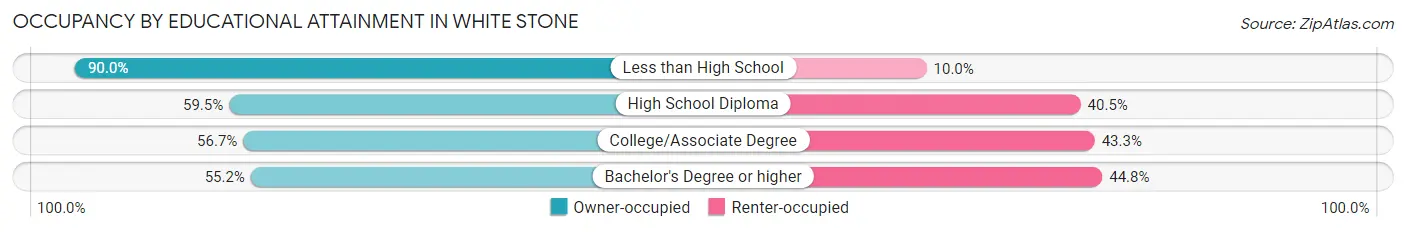
| Household Size | Owner-occupied | Renter-occupied |
| Less than High School | 27 (90.0%) | 3 (10.0%) |
| High School Diploma | 22 (59.5%) | 15 (40.5%) |
| College/Associate Degree | 34 (56.7%) | 26 (43.3%) |
| Bachelor's Degree or higher | 16 (55.2%) | 13 (44.8%) |
Occupancy by Age of Householder in White Stone
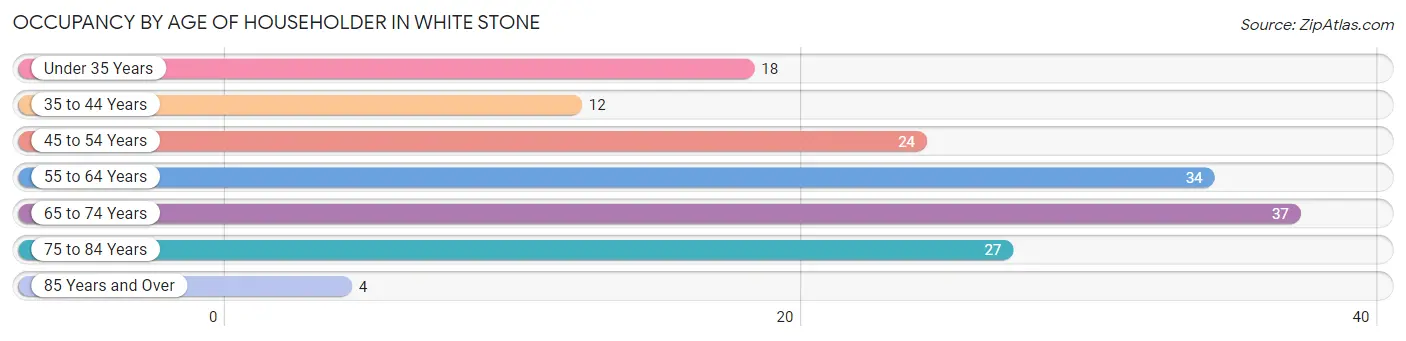
| Age Bracket | # Households | % Households |
| Under 35 Years | 18 | 11.5% |
| 35 to 44 Years | 12 | 7.7% |
| 45 to 54 Years | 24 | 15.4% |
| 55 to 64 Years | 34 | 21.8% |
| 65 to 74 Years | 37 | 23.7% |
| 75 to 84 Years | 27 | 17.3% |
| 85 Years and Over | 4 | 2.6% |
| Total | 156 | 100.0% |
Housing Finances in White Stone
Median Income by Occupancy in White Stone
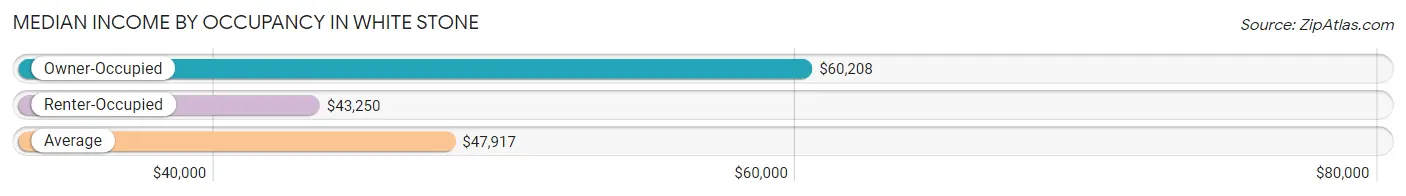
| Occupancy Type | # Households | Median Income |
| Owner-Occupied | 99 (63.5%) | $60,208 |
| Renter-Occupied | 57 (36.5%) | $43,250 |
| Average | 156 (100.0%) | $47,917 |
Occupancy by Householder Income Bracket in White Stone
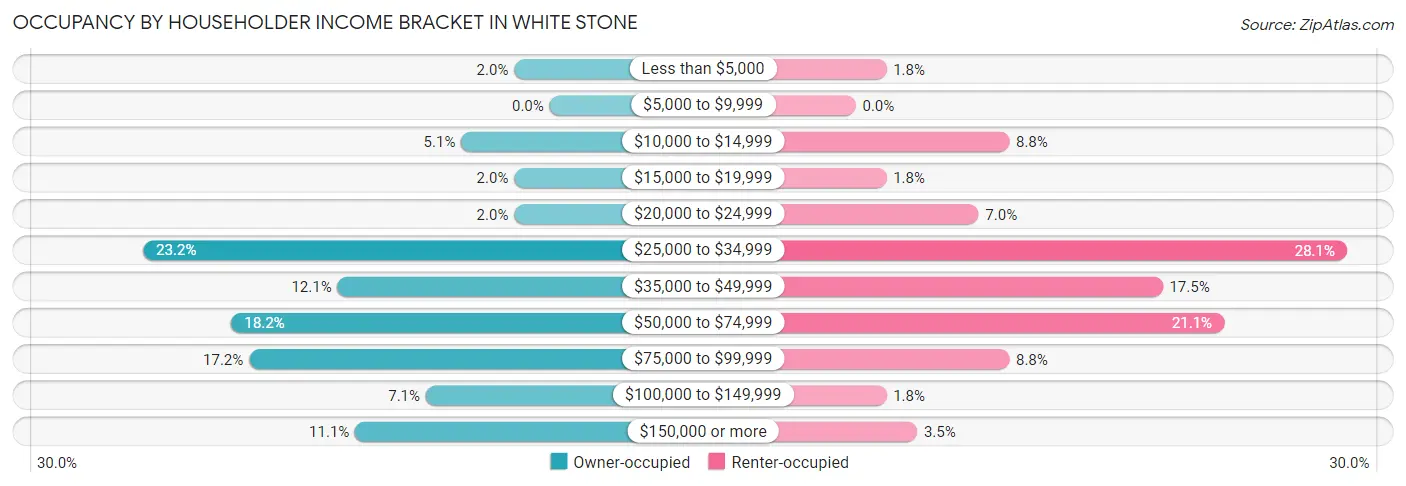
| Income Bracket | Owner-occupied | Renter-occupied |
| Less than $5,000 | 2 (2.0%) | 1 (1.8%) |
| $5,000 to $9,999 | 0 (0.0%) | 0 (0.0%) |
| $10,000 to $14,999 | 5 (5.1%) | 5 (8.8%) |
| $15,000 to $19,999 | 2 (2.0%) | 1 (1.8%) |
| $20,000 to $24,999 | 2 (2.0%) | 4 (7.0%) |
| $25,000 to $34,999 | 23 (23.2%) | 16 (28.1%) |
| $35,000 to $49,999 | 12 (12.1%) | 10 (17.5%) |
| $50,000 to $74,999 | 18 (18.2%) | 12 (21.0%) |
| $75,000 to $99,999 | 17 (17.2%) | 5 (8.8%) |
| $100,000 to $149,999 | 7 (7.1%) | 1 (1.8%) |
| $150,000 or more | 11 (11.1%) | 2 (3.5%) |
| Total | 99 (100.0%) | 57 (100.0%) |
Monthly Housing Cost Tiers in White Stone
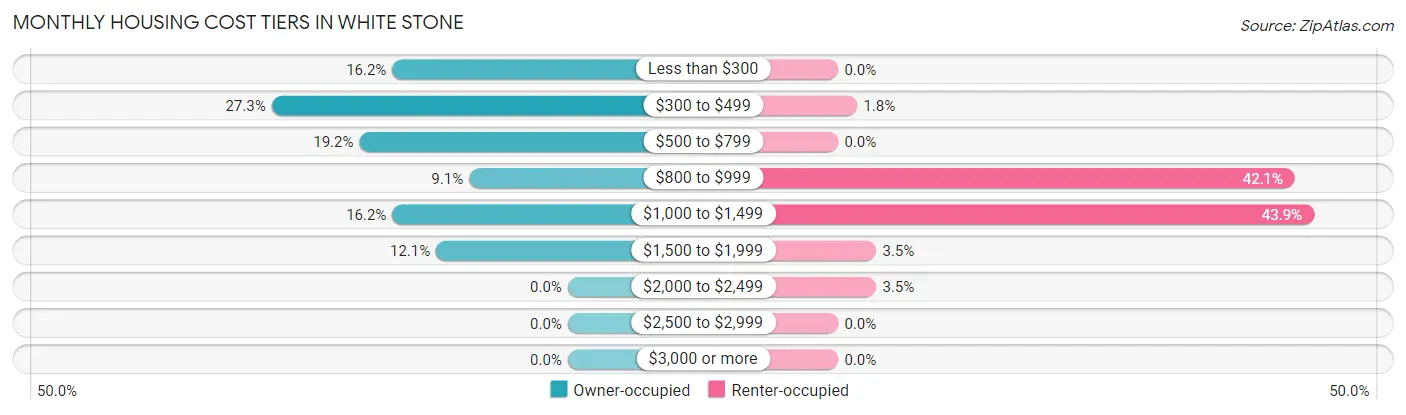
| Monthly Cost | Owner-occupied | Renter-occupied |
| Less than $300 | 16 (16.2%) | 0 (0.0%) |
| $300 to $499 | 27 (27.3%) | 1 (1.8%) |
| $500 to $799 | 19 (19.2%) | 0 (0.0%) |
| $800 to $999 | 9 (9.1%) | 24 (42.1%) |
| $1,000 to $1,499 | 16 (16.2%) | 25 (43.9%) |
| $1,500 to $1,999 | 12 (12.1%) | 2 (3.5%) |
| $2,000 to $2,499 | 0 (0.0%) | 2 (3.5%) |
| $2,500 to $2,999 | 0 (0.0%) | 0 (0.0%) |
| $3,000 or more | 0 (0.0%) | 0 (0.0%) |
| Total | 99 (100.0%) | 57 (100.0%) |
Physical Housing Characteristics in White Stone
Housing Structures in White Stone
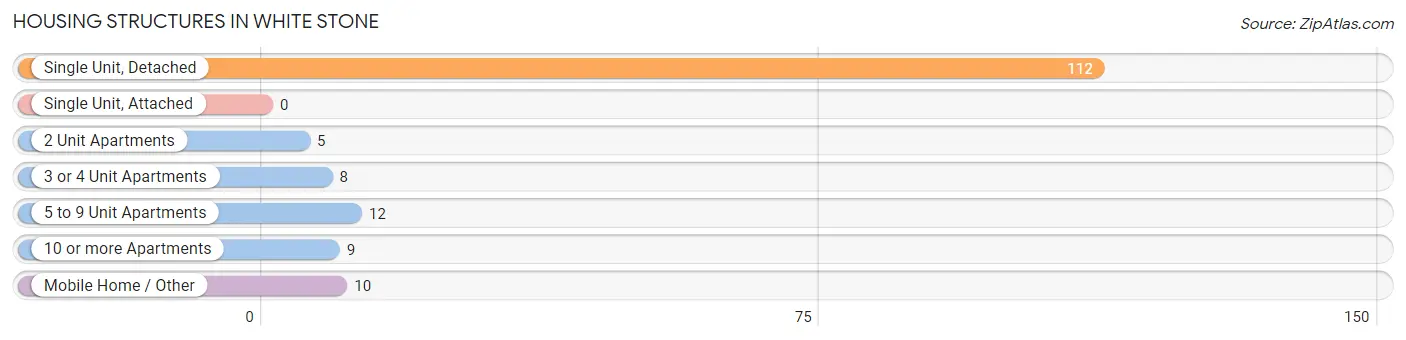
| Structure Type | # Housing Units | % Housing Units |
| Single Unit, Detached | 112 | 71.8% |
| Single Unit, Attached | 0 | 0.0% |
| 2 Unit Apartments | 5 | 3.2% |
| 3 or 4 Unit Apartments | 8 | 5.1% |
| 5 to 9 Unit Apartments | 12 | 7.7% |
| 10 or more Apartments | 9 | 5.8% |
| Mobile Home / Other | 10 | 6.4% |
| Total | 156 | 100.0% |
Housing Structures by Occupancy in White Stone
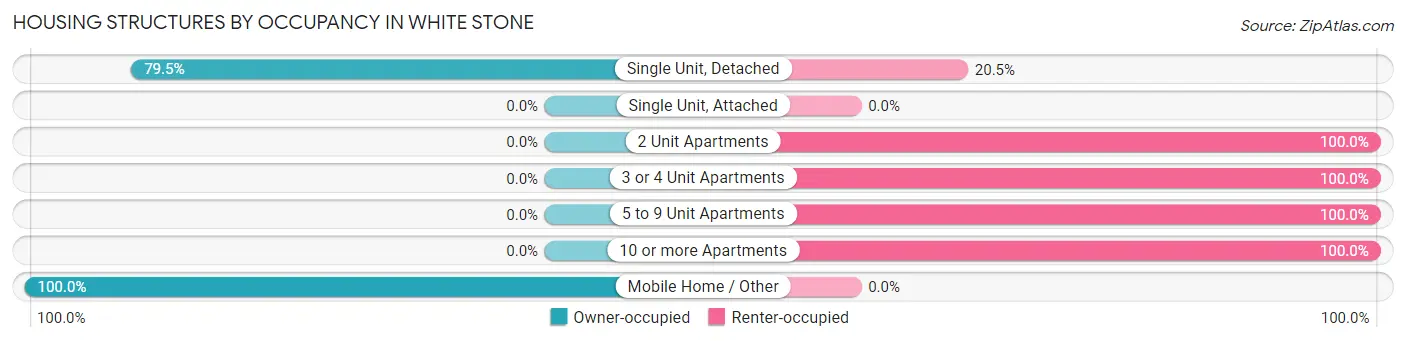
| Structure Type | Owner-occupied | Renter-occupied |
| Single Unit, Detached | 89 (79.5%) | 23 (20.5%) |
| Single Unit, Attached | 0 (0.0%) | 0 (0.0%) |
| 2 Unit Apartments | 0 (0.0%) | 5 (100.0%) |
| 3 or 4 Unit Apartments | 0 (0.0%) | 8 (100.0%) |
| 5 to 9 Unit Apartments | 0 (0.0%) | 12 (100.0%) |
| 10 or more Apartments | 0 (0.0%) | 9 (100.0%) |
| Mobile Home / Other | 10 (100.0%) | 0 (0.0%) |
| Total | 99 (63.5%) | 57 (36.5%) |
Housing Structures by Number of Rooms in White Stone
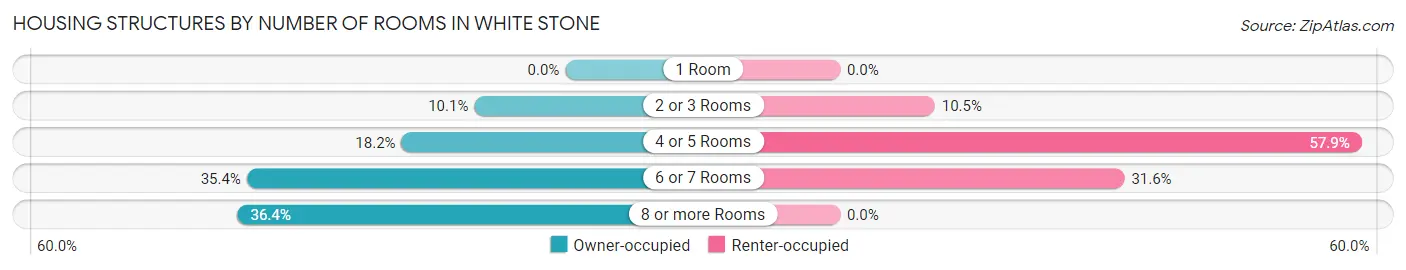
| Number of Rooms | Owner-occupied | Renter-occupied |
| 1 Room | 0 (0.0%) | 0 (0.0%) |
| 2 or 3 Rooms | 10 (10.1%) | 6 (10.5%) |
| 4 or 5 Rooms | 18 (18.2%) | 33 (57.9%) |
| 6 or 7 Rooms | 35 (35.3%) | 18 (31.6%) |
| 8 or more Rooms | 36 (36.4%) | 0 (0.0%) |
| Total | 99 (100.0%) | 57 (100.0%) |
Housing Structure by Heating Type in White Stone
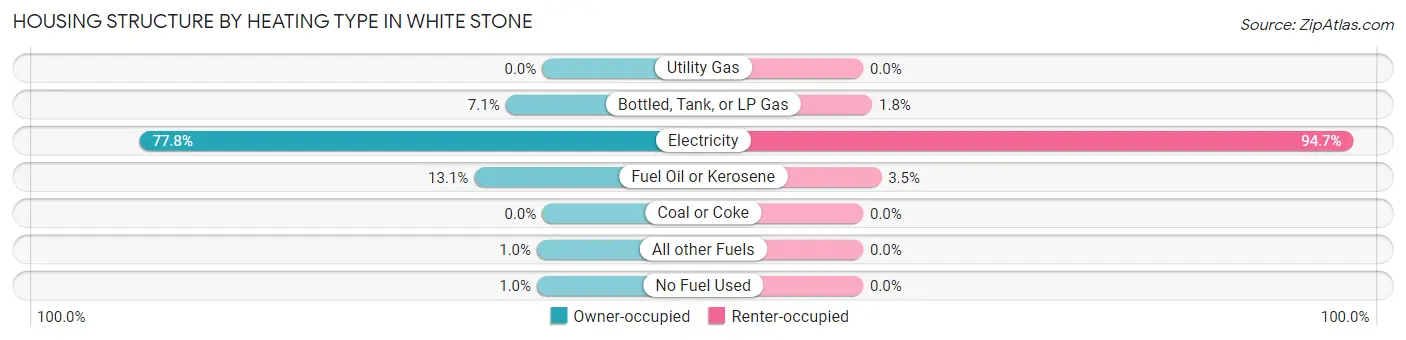
| Heating Type | Owner-occupied | Renter-occupied |
| Utility Gas | 0 (0.0%) | 0 (0.0%) |
| Bottled, Tank, or LP Gas | 7 (7.1%) | 1 (1.8%) |
| Electricity | 77 (77.8%) | 54 (94.7%) |
| Fuel Oil or Kerosene | 13 (13.1%) | 2 (3.5%) |
| Coal or Coke | 0 (0.0%) | 0 (0.0%) |
| All other Fuels | 1 (1.0%) | 0 (0.0%) |
| No Fuel Used | 1 (1.0%) | 0 (0.0%) |
| Total | 99 (100.0%) | 57 (100.0%) |
Household Vehicle Usage in White Stone
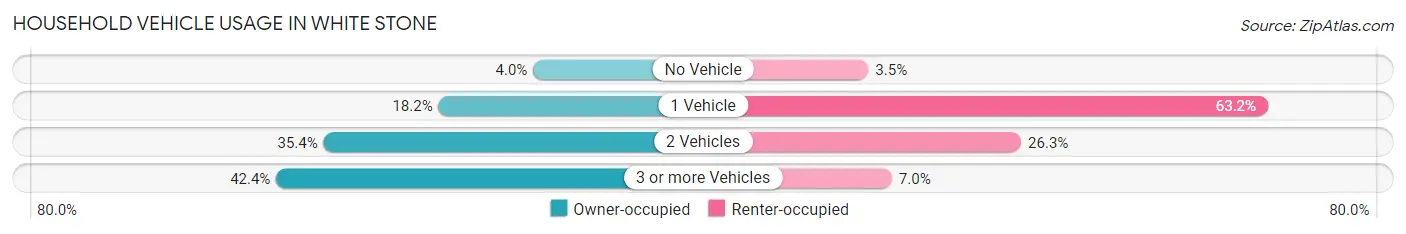
| Vehicles per Household | Owner-occupied | Renter-occupied |
| No Vehicle | 4 (4.0%) | 2 (3.5%) |
| 1 Vehicle | 18 (18.2%) | 36 (63.2%) |
| 2 Vehicles | 35 (35.3%) | 15 (26.3%) |
| 3 or more Vehicles | 42 (42.4%) | 4 (7.0%) |
| Total | 99 (100.0%) | 57 (100.0%) |
Real Estate & Mortgages in White Stone
Real Estate and Mortgage Overview in White Stone
| Characteristic | Without Mortgage | With Mortgage |
| Housing Units | 53 | 46 |
| Median Property Value | $185,400 | $175,000 |
| Median Household Income | $36,250 | $4 |
| Monthly Housing Costs | $381 | $0 |
| Real Estate Taxes | $820 | $0 |
Property Value by Mortgage Status in White Stone
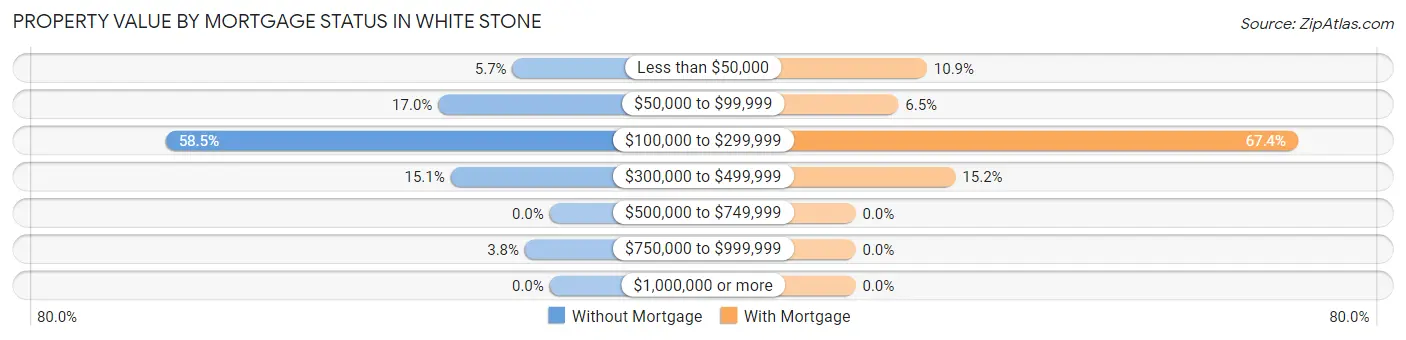
| Property Value | Without Mortgage | With Mortgage |
| Less than $50,000 | 3 (5.7%) | 5 (10.9%) |
| $50,000 to $99,999 | 9 (17.0%) | 3 (6.5%) |
| $100,000 to $299,999 | 31 (58.5%) | 31 (67.4%) |
| $300,000 to $499,999 | 8 (15.1%) | 7 (15.2%) |
| $500,000 to $749,999 | 0 (0.0%) | 0 (0.0%) |
| $750,000 to $999,999 | 2 (3.8%) | 0 (0.0%) |
| $1,000,000 or more | 0 (0.0%) | 0 (0.0%) |
| Total | 53 (100.0%) | 46 (100.0%) |
Household Income by Mortgage Status in White Stone
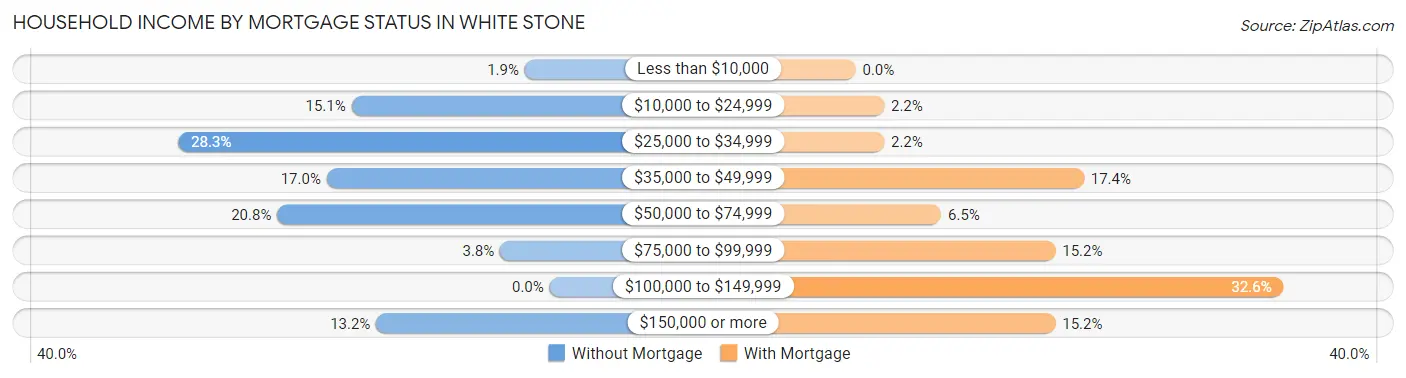
| Household Income | Without Mortgage | With Mortgage |
| Less than $10,000 | 1 (1.9%) | 0 (0.0%) |
| $10,000 to $24,999 | 8 (15.1%) | 1 (2.2%) |
| $25,000 to $34,999 | 15 (28.3%) | 1 (2.2%) |
| $35,000 to $49,999 | 9 (17.0%) | 8 (17.4%) |
| $50,000 to $74,999 | 11 (20.7%) | 3 (6.5%) |
| $75,000 to $99,999 | 2 (3.8%) | 7 (15.2%) |
| $100,000 to $149,999 | 0 (0.0%) | 15 (32.6%) |
| $150,000 or more | 7 (13.2%) | 7 (15.2%) |
| Total | 53 (100.0%) | 46 (100.0%) |
Property Value to Household Income Ratio in White Stone
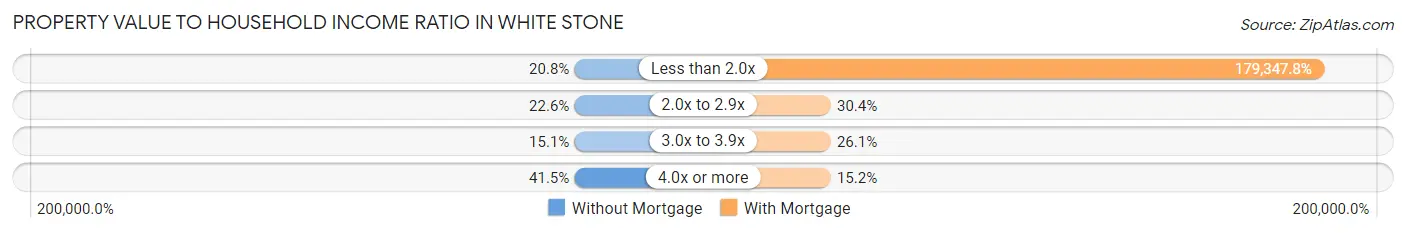
| Value-to-Income Ratio | Without Mortgage | With Mortgage |
| Less than 2.0x | 11 (20.7%) | 82,500 (179,347.8%) |
| 2.0x to 2.9x | 12 (22.6%) | 14 (30.4%) |
| 3.0x to 3.9x | 8 (15.1%) | 12 (26.1%) |
| 4.0x or more | 22 (41.5%) | 7 (15.2%) |
| Total | 53 (100.0%) | 46 (100.0%) |
Real Estate Taxes by Mortgage Status in White Stone
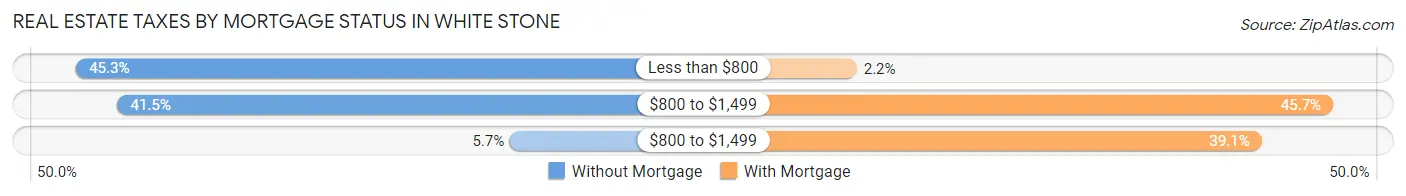
| Property Taxes | Without Mortgage | With Mortgage |
| Less than $800 | 24 (45.3%) | 1 (2.2%) |
| $800 to $1,499 | 22 (41.5%) | 21 (45.7%) |
| $800 to $1,499 | 3 (5.7%) | 18 (39.1%) |
| Total | 53 (100.0%) | 46 (100.0%) |
Health & Disability in White Stone
Health Insurance Coverage by Age in White Stone
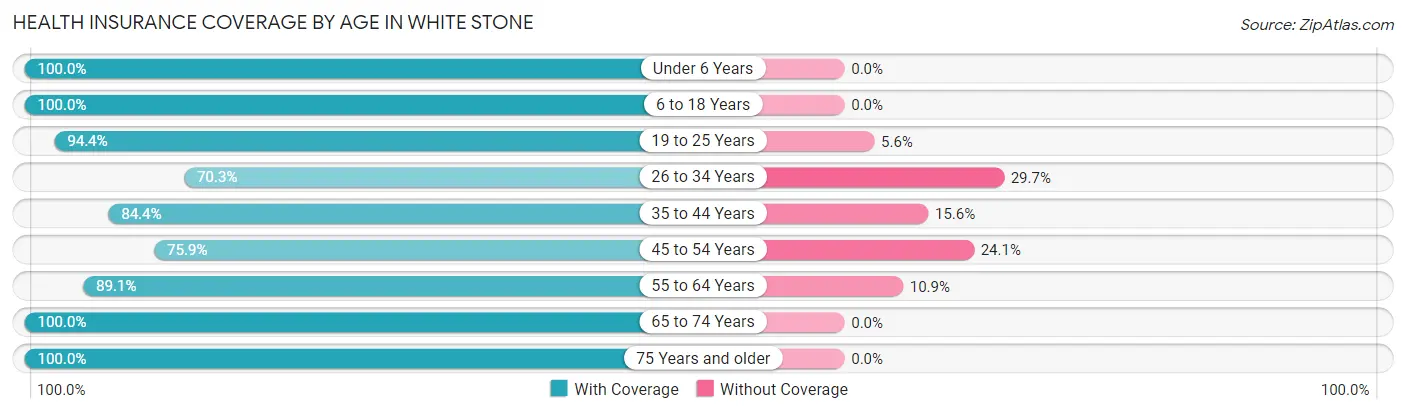
| Age Bracket | With Coverage | Without Coverage |
| Under 6 Years | 14 (100.0%) | 0 (0.0%) |
| 6 to 18 Years | 44 (100.0%) | 0 (0.0%) |
| 19 to 25 Years | 17 (94.4%) | 1 (5.6%) |
| 26 to 34 Years | 26 (70.3%) | 11 (29.7%) |
| 35 to 44 Years | 27 (84.4%) | 5 (15.6%) |
| 45 to 54 Years | 22 (75.9%) | 7 (24.1%) |
| 55 to 64 Years | 49 (89.1%) | 6 (10.9%) |
| 65 to 74 Years | 46 (100.0%) | 0 (0.0%) |
| 75 Years and older | 36 (100.0%) | 0 (0.0%) |
| Total | 281 (90.3%) | 30 (9.7%) |
Health Insurance Coverage by Citizenship Status in White Stone
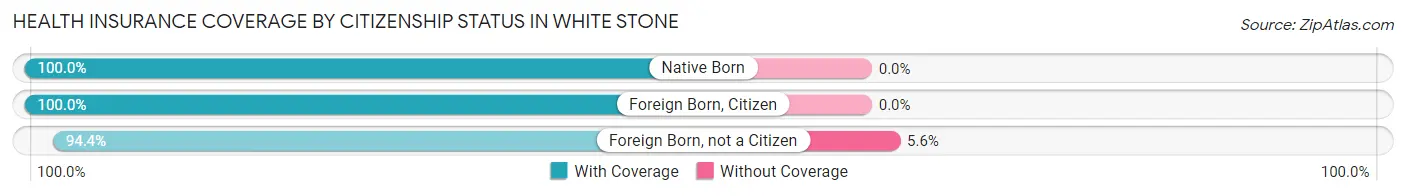
| Citizenship Status | With Coverage | Without Coverage |
| Native Born | 14 (100.0%) | 0 (0.0%) |
| Foreign Born, Citizen | 44 (100.0%) | 0 (0.0%) |
| Foreign Born, not a Citizen | 17 (94.4%) | 1 (5.6%) |
Health Insurance Coverage by Household Income in White Stone
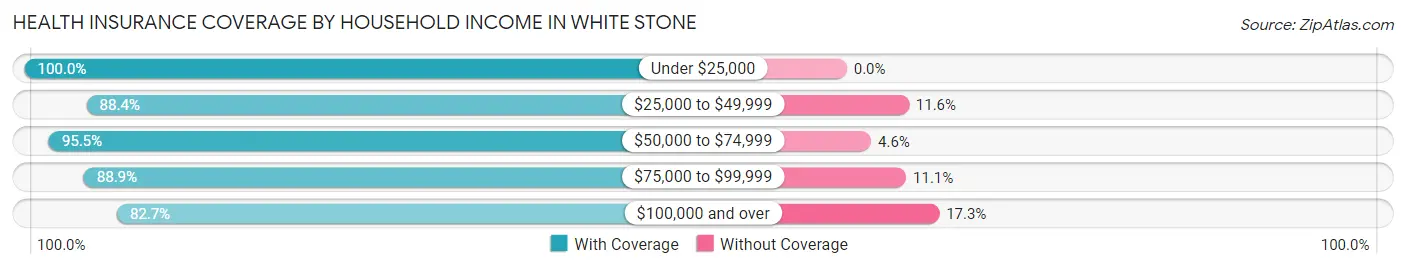
| Household Income | With Coverage | Without Coverage |
| Under $25,000 | 35 (100.0%) | 0 (0.0%) |
| $25,000 to $49,999 | 76 (88.4%) | 10 (11.6%) |
| $50,000 to $74,999 | 63 (95.5%) | 3 (4.5%) |
| $75,000 to $99,999 | 64 (88.9%) | 8 (11.1%) |
| $100,000 and over | 43 (82.7%) | 9 (17.3%) |
Public vs Private Health Insurance Coverage by Age in White Stone
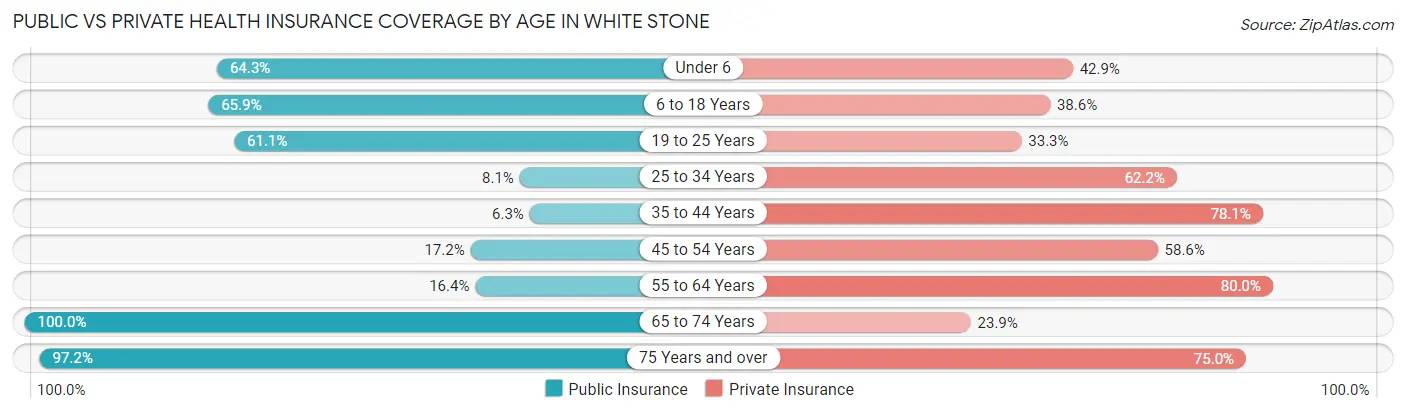
| Age Bracket | Public Insurance | Private Insurance |
| Under 6 | 9 (64.3%) | 6 (42.9%) |
| 6 to 18 Years | 29 (65.9%) | 17 (38.6%) |
| 19 to 25 Years | 11 (61.1%) | 6 (33.3%) |
| 25 to 34 Years | 3 (8.1%) | 23 (62.2%) |
| 35 to 44 Years | 2 (6.2%) | 25 (78.1%) |
| 45 to 54 Years | 5 (17.2%) | 17 (58.6%) |
| 55 to 64 Years | 9 (16.4%) | 44 (80.0%) |
| 65 to 74 Years | 46 (100.0%) | 11 (23.9%) |
| 75 Years and over | 35 (97.2%) | 27 (75.0%) |
| Total | 149 (47.9%) | 176 (56.6%) |
Disability Status by Sex by Age in White Stone
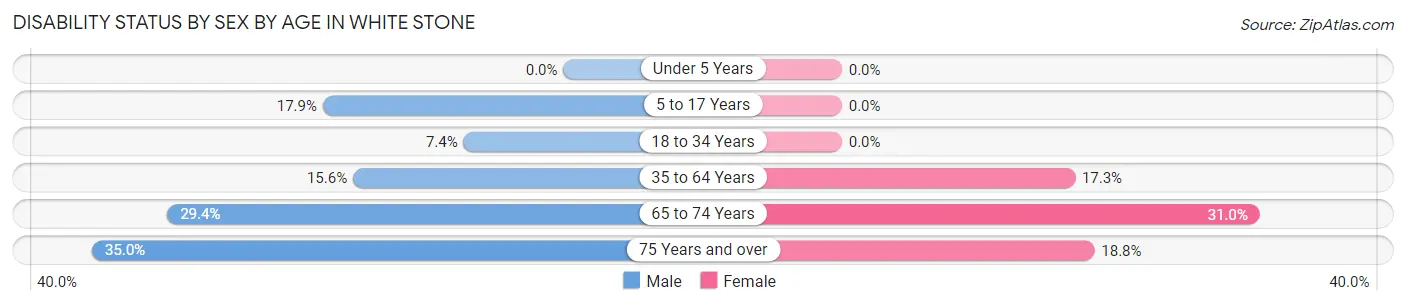
| Age Bracket | Male | Female |
| Under 5 Years | 0 (0.0%) | 0 (0.0%) |
| 5 to 17 Years | 5 (17.9%) | 0 (0.0%) |
| 18 to 34 Years | 2 (7.4%) | 0 (0.0%) |
| 35 to 64 Years | 10 (15.6%) | 9 (17.3%) |
| 65 to 74 Years | 5 (29.4%) | 9 (31.0%) |
| 75 Years and over | 7 (35.0%) | 3 (18.8%) |
Disability Class by Sex by Age in White Stone
Disability Class: Hearing Difficulty
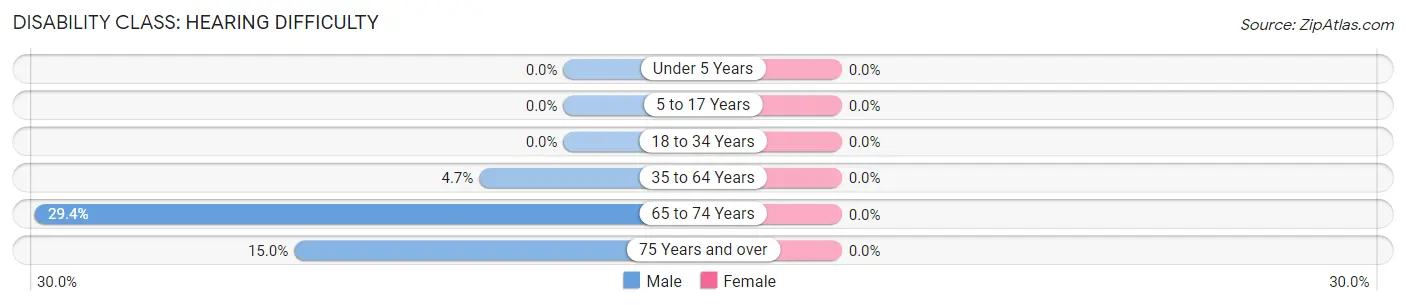
| Age Bracket | Male | Female |
| Under 5 Years | 0 (0.0%) | 0 (0.0%) |
| 5 to 17 Years | 0 (0.0%) | 0 (0.0%) |
| 18 to 34 Years | 0 (0.0%) | 0 (0.0%) |
| 35 to 64 Years | 3 (4.7%) | 0 (0.0%) |
| 65 to 74 Years | 5 (29.4%) | 0 (0.0%) |
| 75 Years and over | 3 (15.0%) | 0 (0.0%) |
Disability Class: Vision Difficulty
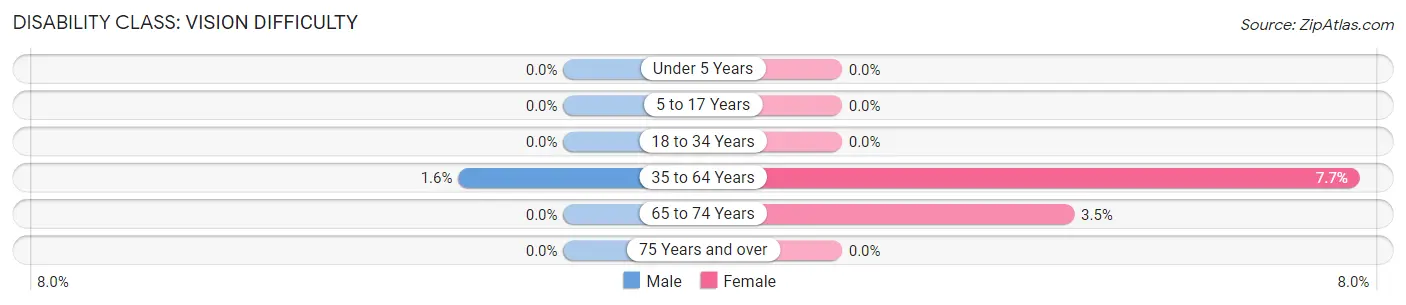
| Age Bracket | Male | Female |
| Under 5 Years | 0 (0.0%) | 0 (0.0%) |
| 5 to 17 Years | 0 (0.0%) | 0 (0.0%) |
| 18 to 34 Years | 0 (0.0%) | 0 (0.0%) |
| 35 to 64 Years | 1 (1.6%) | 4 (7.7%) |
| 65 to 74 Years | 0 (0.0%) | 1 (3.5%) |
| 75 Years and over | 0 (0.0%) | 0 (0.0%) |
Disability Class: Cognitive Difficulty
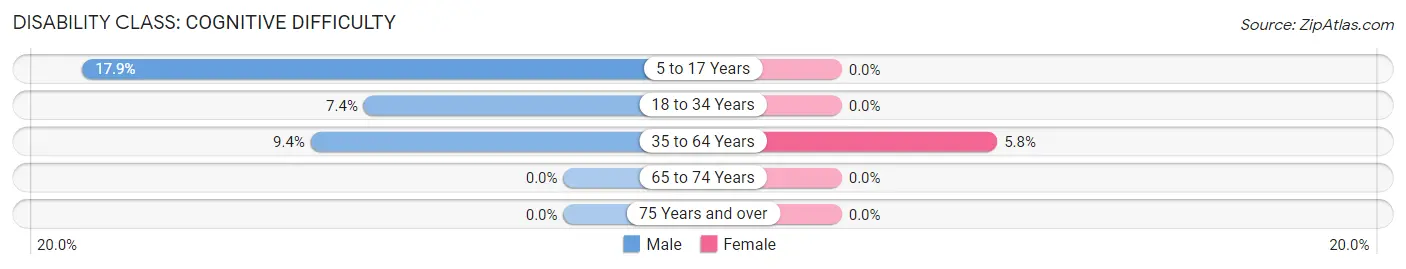
| Age Bracket | Male | Female |
| 5 to 17 Years | 5 (17.9%) | 0 (0.0%) |
| 18 to 34 Years | 2 (7.4%) | 0 (0.0%) |
| 35 to 64 Years | 6 (9.4%) | 3 (5.8%) |
| 65 to 74 Years | 0 (0.0%) | 0 (0.0%) |
| 75 Years and over | 0 (0.0%) | 0 (0.0%) |
Disability Class: Ambulatory Difficulty
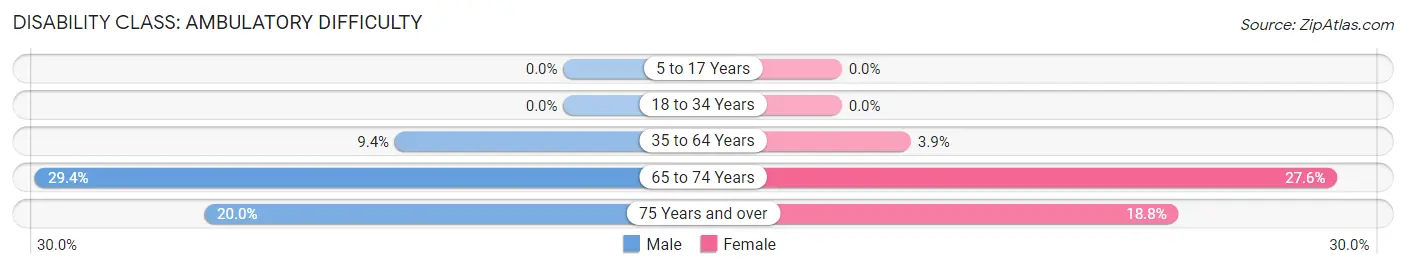
| Age Bracket | Male | Female |
| 5 to 17 Years | 0 (0.0%) | 0 (0.0%) |
| 18 to 34 Years | 0 (0.0%) | 0 (0.0%) |
| 35 to 64 Years | 6 (9.4%) | 2 (3.8%) |
| 65 to 74 Years | 5 (29.4%) | 8 (27.6%) |
| 75 Years and over | 4 (20.0%) | 3 (18.8%) |
Disability Class: Self-Care Difficulty
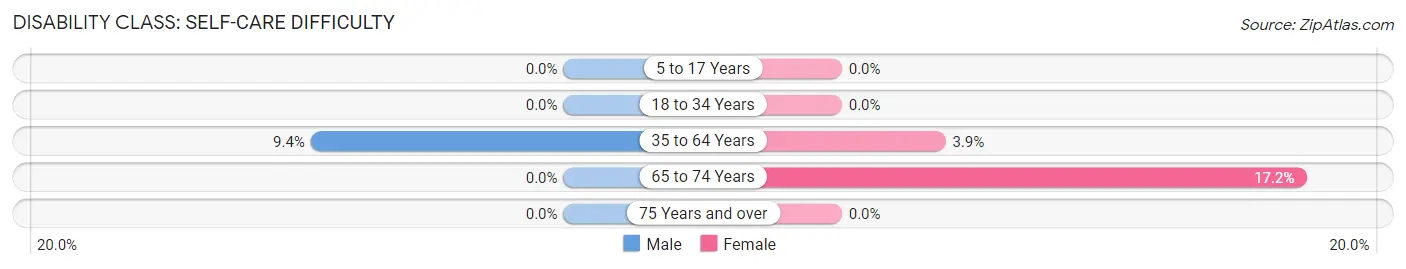
| Age Bracket | Male | Female |
| 5 to 17 Years | 0 (0.0%) | 0 (0.0%) |
| 18 to 34 Years | 0 (0.0%) | 0 (0.0%) |
| 35 to 64 Years | 6 (9.4%) | 2 (3.8%) |
| 65 to 74 Years | 0 (0.0%) | 5 (17.2%) |
| 75 Years and over | 0 (0.0%) | 0 (0.0%) |
Technology Access in White Stone
Computing Device Access in White Stone
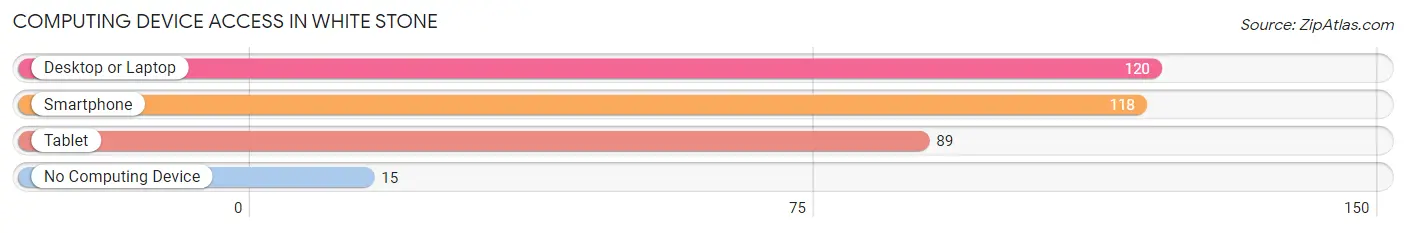
| Device Type | # Households | % Households |
| Desktop or Laptop | 120 | 76.9% |
| Smartphone | 118 | 75.6% |
| Tablet | 89 | 57.1% |
| No Computing Device | 15 | 9.6% |
| Total | 156 | 100.0% |
Internet Access in White Stone
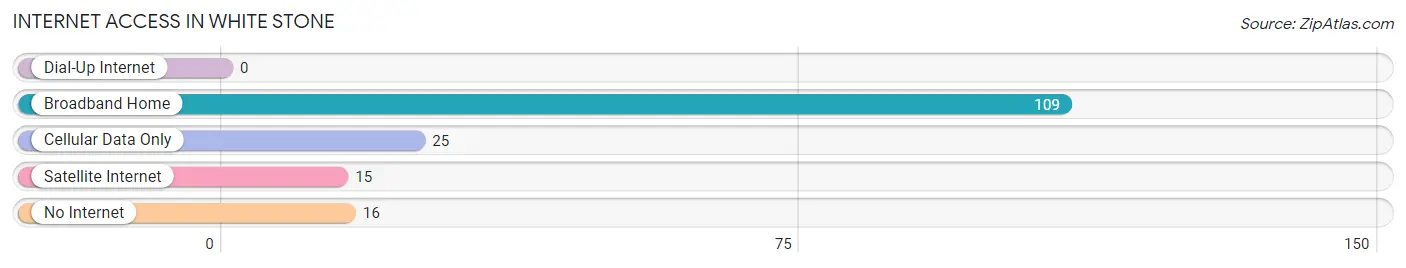
| Internet Type | # Households | % Households |
| Dial-Up Internet | 0 | 0.0% |
| Broadband Home | 109 | 69.9% |
| Cellular Data Only | 25 | 16.0% |
| Satellite Internet | 15 | 9.6% |
| No Internet | 16 | 10.3% |
| Total | 156 | 100.0% |
White Stone Summary
White Stone is a small town located in Lancaster County, Virginia. It is situated on the Chesapeake Bay, just south of the Rappahannock River. The town has a population of 1,541 as of the 2010 census.
History
White Stone was first settled in the early 1700s by English colonists. The town was originally known as White Stone Point, and was part of the Northern Neck Proprietary, a large land grant given to seven Englishmen by King Charles II in 1649. The town was officially incorporated in 1742.
During the American Revolution, White Stone was a major port for the British Navy. The town was also the site of a major battle between the British and American forces in 1781. The British were defeated and the town was burned to the ground.
After the war, White Stone was rebuilt and became a major port for the Chesapeake Bay oyster industry. The town was also a popular destination for wealthy vacationers from the North. In the late 19th century, the town became a popular resort destination for wealthy families from Washington, D.C. and Baltimore.
Geography
White Stone is located in Lancaster County, Virginia. It is situated on the Chesapeake Bay, just south of the Rappahannock River. The town is bordered by the towns of Kilmarnock, Irvington, and Weems. The town is located on a peninsula, with the Chesapeake Bay to the east and the Rappahannock River to the west.
The town has a total area of 1.2 square miles, all of which is land. The town is located in a humid subtropical climate zone, with hot, humid summers and mild winters.
Economy
White Stone’s economy is largely based on tourism and the seafood industry. The town is home to several seafood restaurants, as well as a number of marinas and boatyards. The town is also home to a number of bed and breakfasts, as well as a few small shops and galleries.
The town is also home to a number of oyster farms, which produce oysters for the local seafood industry. The town is also home to a number of charter fishing boats, which offer fishing trips for tourists.
Demographics
As of the 2010 census, White Stone had a population of 1,541. The racial makeup of the town was 94.3% White, 2.3% African American, 0.3% Native American, 0.7% Asian, 0.1% Pacific Islander, 0.7% from other races, and 1.6% from two or more races. Hispanic or Latino of any race were 2.3% of the population.
The median income for a household in White Stone was $45,938, and the median income for a family was $50,000. The per capita income for the town was $25,938. About 8.3% of families and 10.2% of the population were below the poverty line, including 14.3% of those under age 18 and 5.3% of those age 65 or over.
Common Questions
What is Per Capita Income in White Stone?
Per Capita income in White Stone is $33,126.
What is the Median Family Income in White Stone?
Median Family Income in White Stone is $62,292.
What is the Median Household income in White Stone?
Median Household Income in White Stone is $47,917.
What is Income or Wage Gap in White Stone?
Income or Wage Gap in White Stone is 53.5%.
Women in White Stone earn 46.5 cents for every dollar earned by a man.
What is Family Income Deficit in White Stone?
Family Income Deficit in White Stone is $7,100.
Families that are below poverty line in White Stone earn $7,100 less on average than the poverty threshold level.
What is Inequality or Gini Index in White Stone?
Inequality or Gini Index in White Stone is 0.40.
What is the Total Population of White Stone?
Total Population of White Stone is 311.
What is the Total Male Population of White Stone?
Total Male Population of White Stone is 161.
What is the Total Female Population of White Stone?
Total Female Population of White Stone is 150.
What is the Ratio of Males per 100 Females in White Stone?
There are 107.33 Males per 100 Females in White Stone.
What is the Ratio of Females per 100 Males in White Stone?
There are 93.17 Females per 100 Males in White Stone.
What is the Median Population Age in White Stone?
Median Population Age in White Stone is 50.3 Years.
What is the Average Family Size in White Stone
Average Family Size in White Stone is 2.8 People.
What is the Average Household Size in White Stone
Average Household Size in White Stone is 2.0 People.
How Large is the Labor Force in White Stone?
There are 173 People in the Labor Forcein in White Stone.
What is the Percentage of People in the Labor Force in White Stone?
67.3% of People are in the Labor Force in White Stone.
What is the Unemployment Rate in White Stone?
Unemployment Rate in White Stone is 8.1%.