Hybla Valley, VA Map & Demographics
Hybla Valley Map
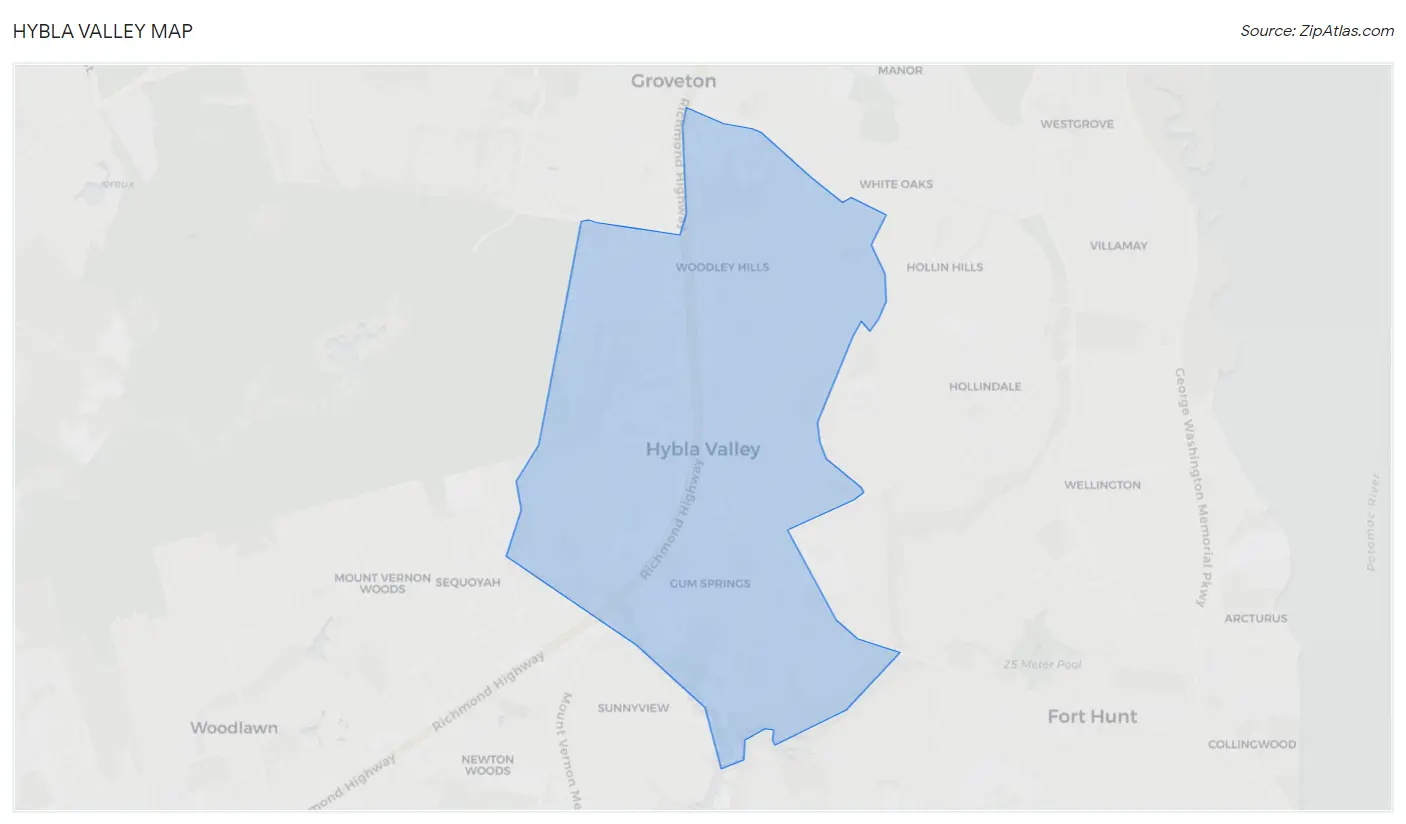
Hybla Valley Overview
$32,050
PER CAPITA INCOME
$69,244
AVG FAMILY INCOME
$65,843
AVG HOUSEHOLD INCOME
14.7%
WAGE / INCOME GAP [ % ]
85.3¢/ $1
WAGE / INCOME GAP [ $ ]
$14,076
FAMILY INCOME DEFICIT
0.48
INEQUALITY / GINI INDEX
18,104
TOTAL POPULATION
8,318
MALE POPULATION
9,786
FEMALE POPULATION
85.00
MALES / 100 FEMALES
117.65
FEMALES / 100 MALES
33.0
MEDIAN AGE
3.8
AVG FAMILY SIZE
3.1
AVG HOUSEHOLD SIZE
8,845
LABOR FORCE [ PEOPLE ]
67.1%
PERCENT IN LABOR FORCE
6.4%
UNEMPLOYMENT RATE
Income in Hybla Valley
Income Overview in Hybla Valley
Per Capita Income in Hybla Valley is $32,050, while median incomes of families and households are $69,244 and $65,843 respectively.
| Characteristic | Number | Measure |
| Per Capita Income | 18,104 | $32,050 |
| Median Family Income | 4,131 | $69,244 |
| Mean Family Income | 4,131 | $104,450 |
| Median Household Income | 5,751 | $65,843 |
| Mean Household Income | 5,751 | $95,808 |
| Income Deficit | 4,131 | $14,076 |
| Wage / Income Gap (%) | 18,104 | 14.74% |
| Wage / Income Gap ($) | 18,104 | 85.26¢ per $1 |
| Gini / Inequality Index | 18,104 | 0.48 |
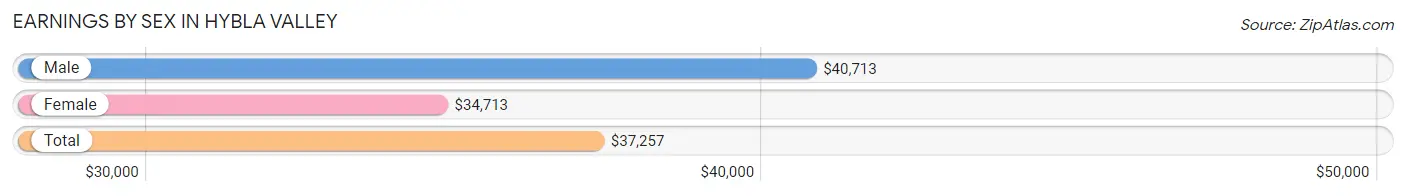
Earnings by Sex in Hybla Valley
Average Earnings in Hybla Valley are $37,257, $40,713 for men and $34,713 for women, a difference of 14.7%.
| Sex | Number | Average Earnings |
| Male | 4,534 (49.4%) | $40,713 |
| Female | 4,644 (50.6%) | $34,713 |
| Total | 9,178 (100.0%) | $37,257 |
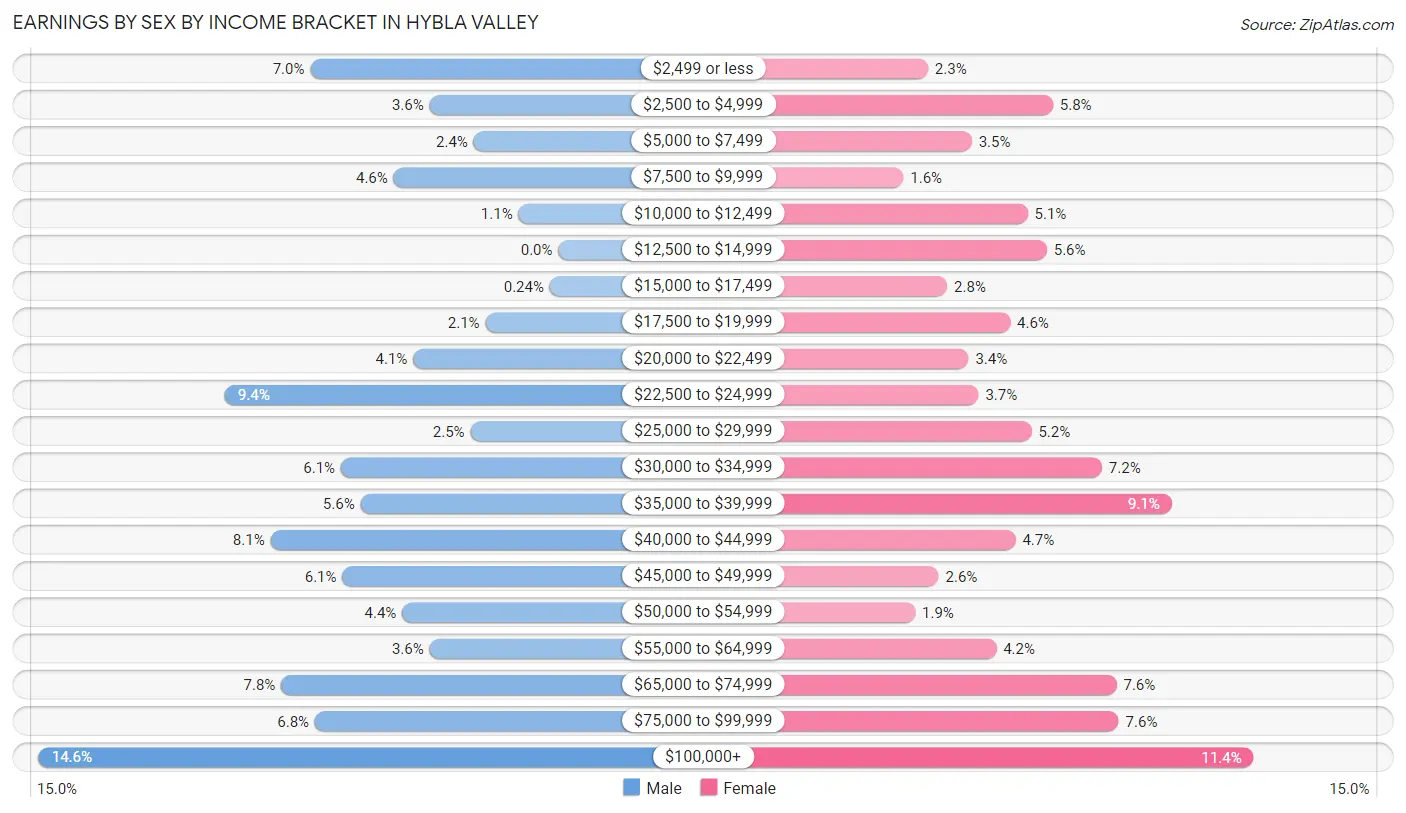
Earnings by Sex by Income Bracket in Hybla Valley
The most common earnings brackets in Hybla Valley are $100,000+ for men (662 | 14.6%) and $100,000+ for women (531 | 11.4%).
| Income | Male | Female |
| $2,499 or less | 316 (7.0%) | 106 (2.3%) |
| $2,500 to $4,999 | 164 (3.6%) | 269 (5.8%) |
| $5,000 to $7,499 | 108 (2.4%) | 163 (3.5%) |
| $7,500 to $9,999 | 210 (4.6%) | 74 (1.6%) |
| $10,000 to $12,499 | 51 (1.1%) | 236 (5.1%) |
| $12,500 to $14,999 | 0 (0.0%) | 261 (5.6%) |
| $15,000 to $17,499 | 11 (0.2%) | 131 (2.8%) |
| $17,500 to $19,999 | 93 (2.1%) | 213 (4.6%) |
| $20,000 to $22,499 | 185 (4.1%) | 159 (3.4%) |
| $22,500 to $24,999 | 425 (9.4%) | 172 (3.7%) |
| $25,000 to $29,999 | 112 (2.5%) | 241 (5.2%) |
| $30,000 to $34,999 | 277 (6.1%) | 333 (7.2%) |
| $35,000 to $39,999 | 252 (5.6%) | 424 (9.1%) |
| $40,000 to $44,999 | 367 (8.1%) | 220 (4.7%) |
| $45,000 to $49,999 | 275 (6.1%) | 120 (2.6%) |
| $50,000 to $54,999 | 199 (4.4%) | 89 (1.9%) |
| $55,000 to $64,999 | 164 (3.6%) | 195 (4.2%) |
| $65,000 to $74,999 | 353 (7.8%) | 352 (7.6%) |
| $75,000 to $99,999 | 310 (6.8%) | 355 (7.6%) |
| $100,000+ | 662 (14.6%) | 531 (11.4%) |
| Total | 4,534 (100.0%) | 4,644 (100.0%) |
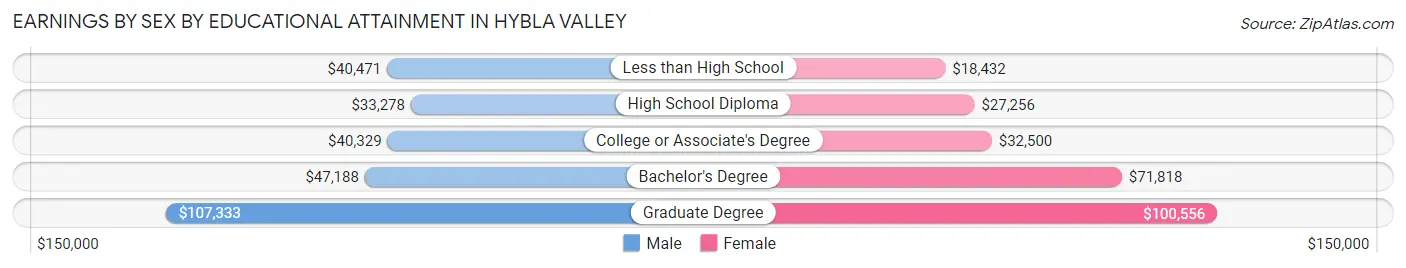
Earnings by Sex by Educational Attainment in Hybla Valley
Average earnings in Hybla Valley are $41,736 for men and $36,381 for women, a difference of 12.8%. Men with an educational attainment of graduate degree enjoy the highest average annual earnings of $107,333, while those with high school diploma education earn the least with $33,278. Women with an educational attainment of graduate degree earn the most with the average annual earnings of $100,556, while those with less than high school education have the smallest earnings of $18,432.
| Educational Attainment | Male Income | Female Income |
| Less than High School | $40,471 | $18,432 |
| High School Diploma | $33,278 | $27,256 |
| College or Associate's Degree | $40,329 | $32,500 |
| Bachelor's Degree | $47,188 | $71,818 |
| Graduate Degree | $107,333 | $100,556 |
| Total | $41,736 | $36,381 |
Family Income in Hybla Valley
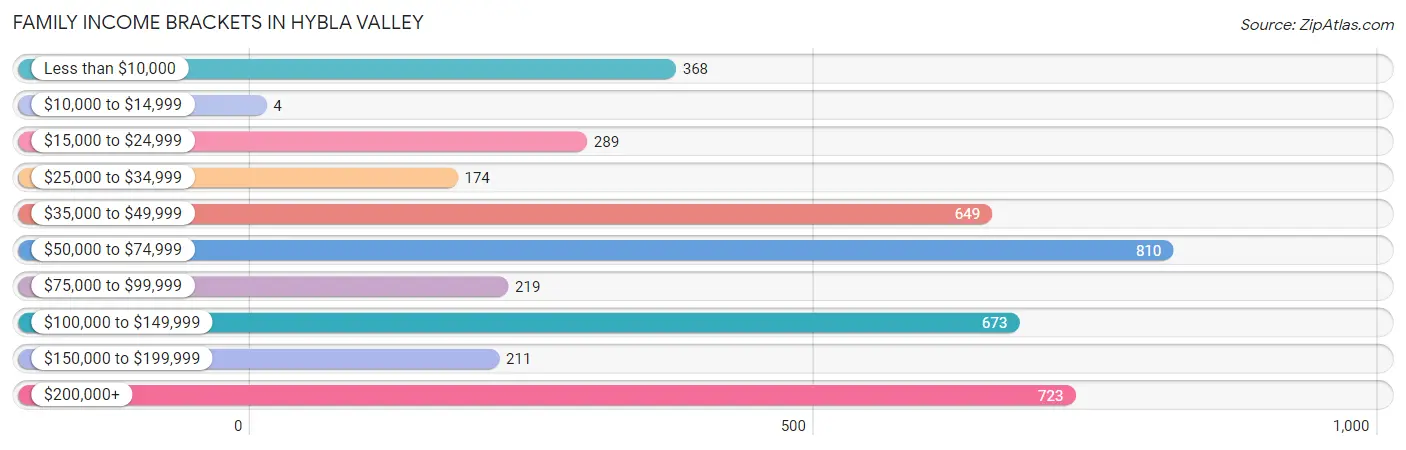
Family Income Brackets in Hybla Valley
According to the Hybla Valley family income data, there are 810 families falling into the $50,000 to $74,999 income range, which is the most common income bracket and makes up 19.6% of all families. Conversely, the $10,000 to $14,999 income bracket is the least frequent group with only 4 families (0.1%) belonging to this category.
| Income Bracket | # Families | % Families |
| Less than $10,000 | 368 | 8.9% |
| $10,000 to $14,999 | 4 | 0.1% |
| $15,000 to $24,999 | 289 | 7.0% |
| $25,000 to $34,999 | 174 | 4.2% |
| $35,000 to $49,999 | 649 | 15.7% |
| $50,000 to $74,999 | 810 | 19.6% |
| $75,000 to $99,999 | 219 | 5.3% |
| $100,000 to $149,999 | 673 | 16.3% |
| $150,000 to $199,999 | 211 | 5.1% |
| $200,000+ | 723 | 17.5% |
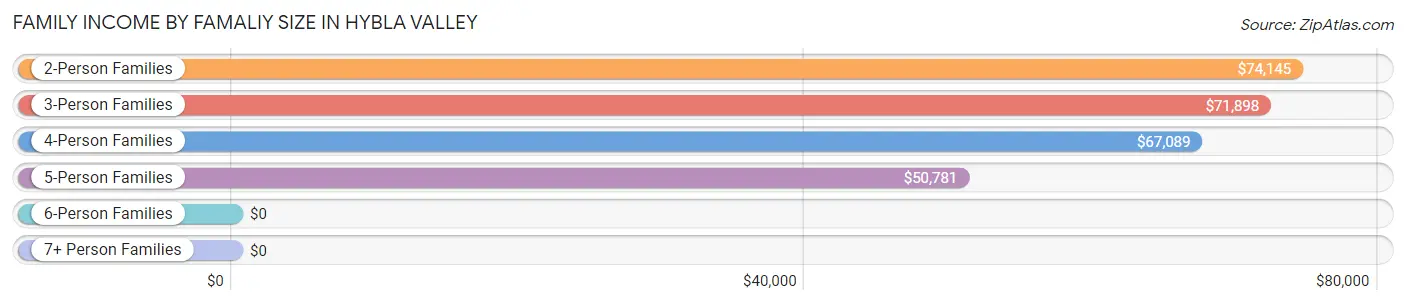
Family Income by Famaliy Size in Hybla Valley
2-person families (1,473 | 35.7%) account for the highest median family income in Hybla Valley with $74,145 per family, while 2-person families (1,473 | 35.7%) have the highest median income of $37,072 per family member.
| Income Bracket | # Families | Median Income |
| 2-Person Families | 1,473 (35.7%) | $74,145 |
| 3-Person Families | 837 (20.3%) | $71,898 |
| 4-Person Families | 1,036 (25.1%) | $67,089 |
| 5-Person Families | 559 (13.5%) | $50,781 |
| 6-Person Families | 121 (2.9%) | $0 |
| 7+ Person Families | 105 (2.5%) | $0 |
| Total | 4,131 (100.0%) | $69,244 |
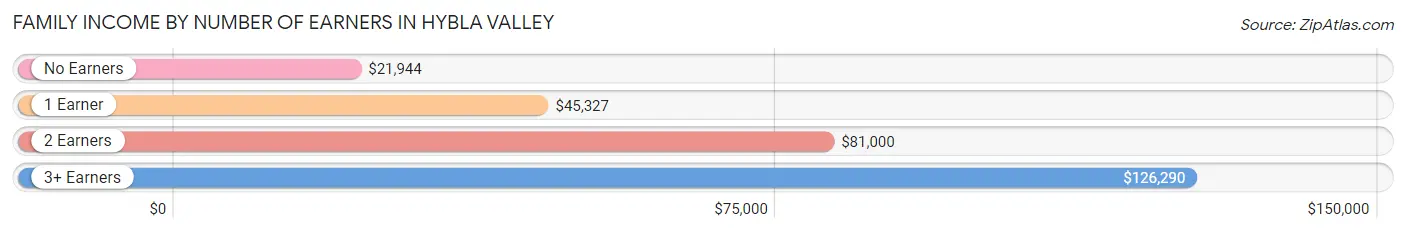
Family Income by Number of Earners in Hybla Valley
The median family income in Hybla Valley is $69,244, with families comprising 3+ earners (611) having the highest median family income of $126,290, while families with no earners (364) have the lowest median family income of $21,944, accounting for 14.8% and 8.8% of families, respectively.
| Number of Earners | # Families | Median Income |
| No Earners | 364 (8.8%) | $21,944 |
| 1 Earner | 1,422 (34.4%) | $45,327 |
| 2 Earners | 1,734 (42.0%) | $81,000 |
| 3+ Earners | 611 (14.8%) | $126,290 |
| Total | 4,131 (100.0%) | $69,244 |
Household Income in Hybla Valley
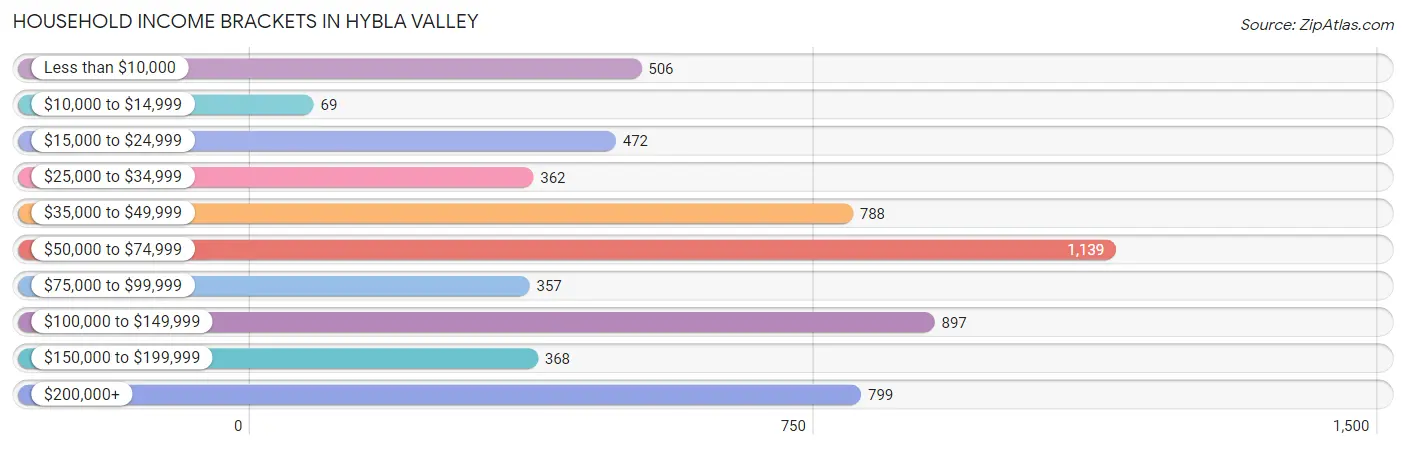
Household Income Brackets in Hybla Valley
With 1,139 households falling in the category, the $50,000 to $74,999 income range is the most frequent in Hybla Valley, accounting for 19.8% of all households. In contrast, only 69 households (1.2%) fall into the $10,000 to $14,999 income bracket, making it the least populous group.
| Income Bracket | # Households | % Households |
| Less than $10,000 | 506 | 8.8% |
| $10,000 to $14,999 | 69 | 1.2% |
| $15,000 to $24,999 | 472 | 8.2% |
| $25,000 to $34,999 | 362 | 6.3% |
| $35,000 to $49,999 | 788 | 13.7% |
| $50,000 to $74,999 | 1,139 | 19.8% |
| $75,000 to $99,999 | 357 | 6.2% |
| $100,000 to $149,999 | 897 | 15.6% |
| $150,000 to $199,999 | 368 | 6.4% |
| $200,000+ | 799 | 13.9% |
Household Income by Householder Age in Hybla Valley
The median household income in Hybla Valley is $65,843, with the highest median household income of $216,509 found in the 15 to 24 years age bracket for the primary householder. A total of 129 households (2.2%) fall into this category. Meanwhile, the 65+ years age bracket for the primary householder has the lowest median household income of $0, with 1,004 households (17.5%) in this group.
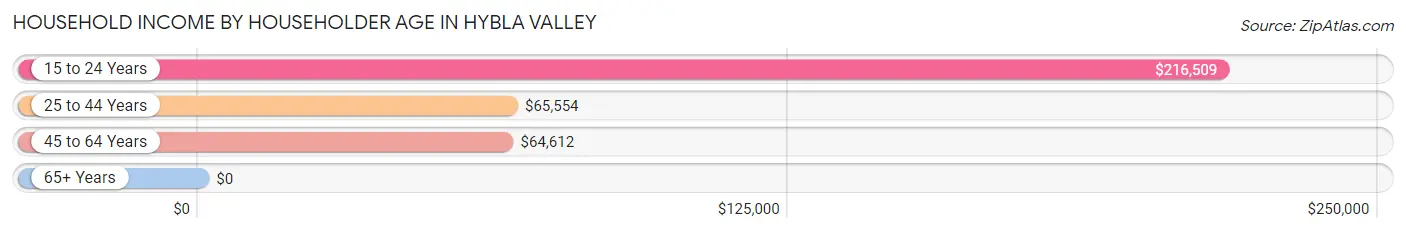
| Income Bracket | # Households | Median Income |
| 15 to 24 Years | 129 (2.2%) | $216,509 |
| 25 to 44 Years | 2,357 (41.0%) | $65,554 |
| 45 to 64 Years | 2,261 (39.3%) | $64,612 |
| 65+ Years | 1,004 (17.5%) | $0 |
| Total | 5,751 (100.0%) | $65,843 |
Poverty in Hybla Valley
Income Below Poverty by Sex and Age in Hybla Valley
With 18.0% poverty level for males and 17.0% for females among the residents of Hybla Valley, 15 year old males and 12 to 14 year old females are the most vulnerable to poverty, with 73 males (47.4%) and 102 females (96.2%) in their respective age groups living below the poverty level.
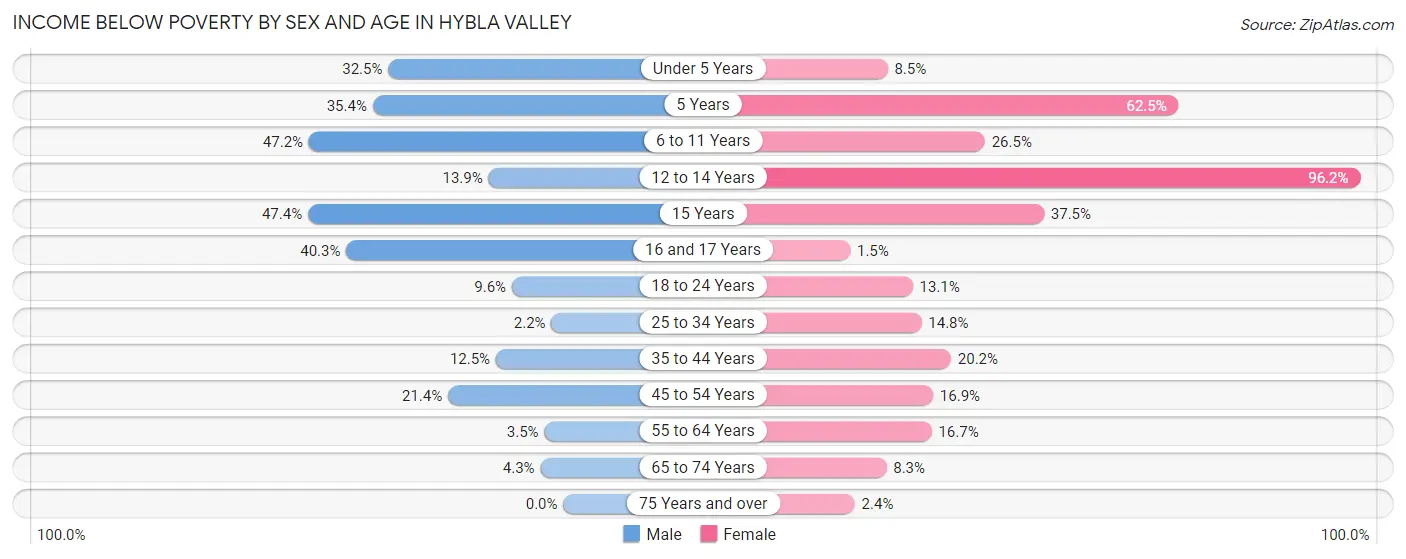
| Age Bracket | Male | Female |
| Under 5 Years | 234 (32.5%) | 100 (8.5%) |
| 5 Years | 23 (35.4%) | 70 (62.5%) |
| 6 to 11 Years | 469 (47.2%) | 264 (26.5%) |
| 12 to 14 Years | 35 (13.9%) | 102 (96.2%) |
| 15 Years | 73 (47.4%) | 87 (37.5%) |
| 16 and 17 Years | 141 (40.3%) | 4 (1.5%) |
| 18 to 24 Years | 93 (9.6%) | 112 (13.1%) |
| 25 to 34 Years | 21 (2.2%) | 197 (14.8%) |
| 35 to 44 Years | 145 (12.5%) | 241 (20.2%) |
| 45 to 54 Years | 195 (21.4%) | 171 (16.9%) |
| 55 to 64 Years | 31 (3.5%) | 203 (16.7%) |
| 65 to 74 Years | 27 (4.3%) | 59 (8.3%) |
| 75 Years and over | 0 (0.0%) | 8 (2.4%) |
| Total | 1,487 (18.0%) | 1,618 (17.0%) |
Income Above Poverty by Sex and Age in Hybla Valley
According to the poverty statistics in Hybla Valley, males aged 75 years and over and females aged 16 and 17 years are the age groups that are most secure financially, with 100.0% of males and 98.5% of females in these age groups living above the poverty line.
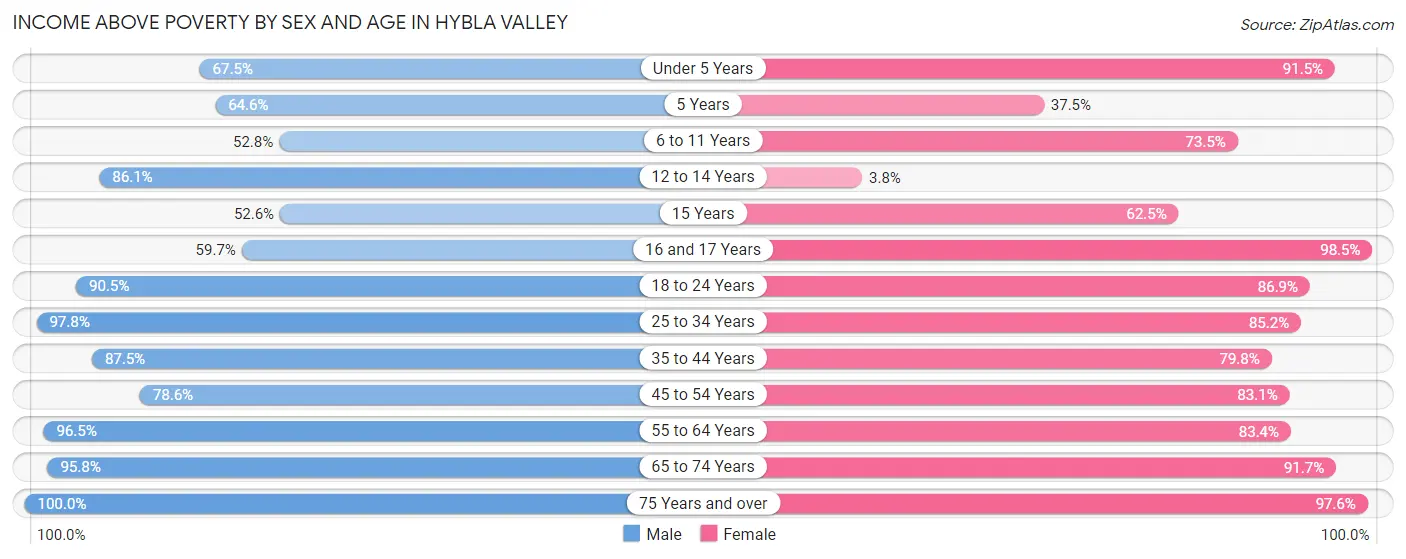
| Age Bracket | Male | Female |
| Under 5 Years | 486 (67.5%) | 1,079 (91.5%) |
| 5 Years | 42 (64.6%) | 42 (37.5%) |
| 6 to 11 Years | 524 (52.8%) | 731 (73.5%) |
| 12 to 14 Years | 217 (86.1%) | 4 (3.8%) |
| 15 Years | 81 (52.6%) | 145 (62.5%) |
| 16 and 17 Years | 209 (59.7%) | 258 (98.5%) |
| 18 to 24 Years | 881 (90.4%) | 741 (86.9%) |
| 25 to 34 Years | 929 (97.8%) | 1,137 (85.2%) |
| 35 to 44 Years | 1,014 (87.5%) | 950 (79.8%) |
| 45 to 54 Years | 716 (78.6%) | 840 (83.1%) |
| 55 to 64 Years | 852 (96.5%) | 1,016 (83.4%) |
| 65 to 74 Years | 608 (95.8%) | 655 (91.7%) |
| 75 Years and over | 201 (100.0%) | 327 (97.6%) |
| Total | 6,760 (82.0%) | 7,925 (83.1%) |
Income Below Poverty Among Married-Couple Families in Hybla Valley
The poverty statistics for married-couple families in Hybla Valley show that 10.4% or 295 of the total 2,843 families live below the poverty line. Families with 3 or 4 children have the highest poverty rate of 16.0%, comprising of 30 families. On the other hand, families with no children have the lowest poverty rate of 5.4%, which includes 82 families.
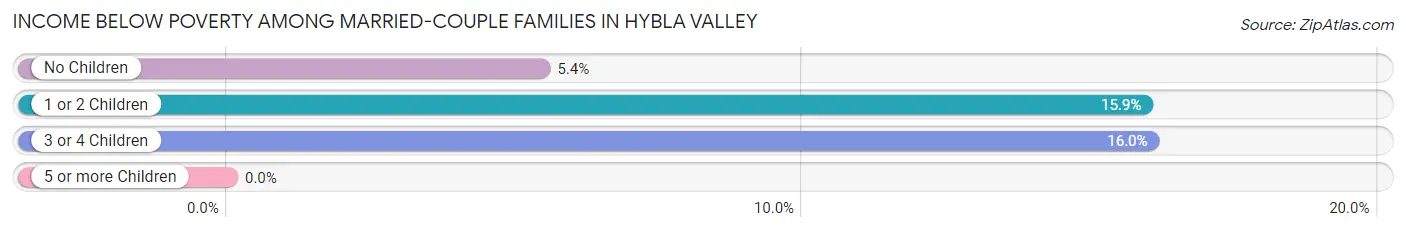
| Children | Above Poverty | Below Poverty |
| No Children | 1,425 (94.6%) | 82 (5.4%) |
| 1 or 2 Children | 966 (84.1%) | 183 (15.9%) |
| 3 or 4 Children | 157 (84.0%) | 30 (16.0%) |
| 5 or more Children | 0 (0.0%) | 0 (0.0%) |
| Total | 2,548 (89.6%) | 295 (10.4%) |
Income Below Poverty Among Single-Parent Households in Hybla Valley
According to the poverty data in Hybla Valley, 16.7% or 57 single-father households and 30.8% or 292 single-mother households are living below the poverty line. Among single-father households, those with 1 or 2 children have the highest poverty rate, with 47 households (19.2%) experiencing poverty. Likewise, among single-mother households, those with 5 or more children have the highest poverty rate, with 121 households (100.0%) falling below the poverty line.
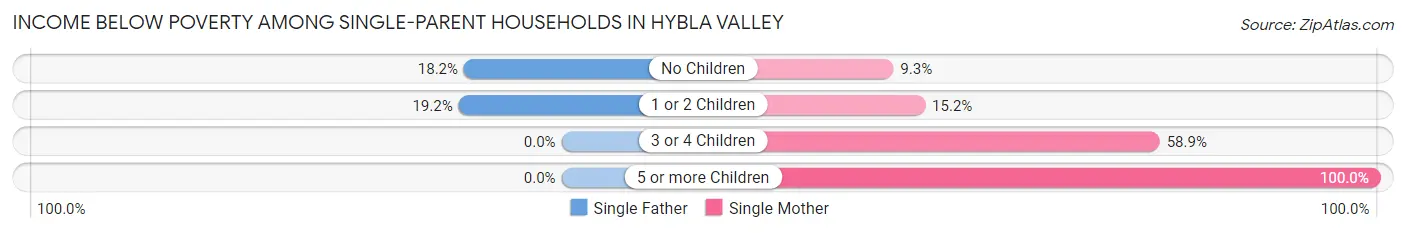
| Children | Single Father | Single Mother |
| No Children | 10 (18.2%) | 25 (9.3%) |
| 1 or 2 Children | 47 (19.2%) | 63 (15.2%) |
| 3 or 4 Children | 0 (0.0%) | 83 (58.9%) |
| 5 or more Children | 0 (0.0%) | 121 (100.0%) |
| Total | 57 (16.7%) | 292 (30.8%) |
Income Below Poverty Among Married-Couple vs Single-Parent Households in Hybla Valley
The poverty data for Hybla Valley shows that 295 of the married-couple family households (10.4%) and 349 of the single-parent households (27.1%) are living below the poverty level. Within the married-couple family households, those with 3 or 4 children have the highest poverty rate, with 30 households (16.0%) falling below the poverty line. Among the single-parent households, those with 5 or more children have the highest poverty rate, with 121 household (100.0%) living below poverty.
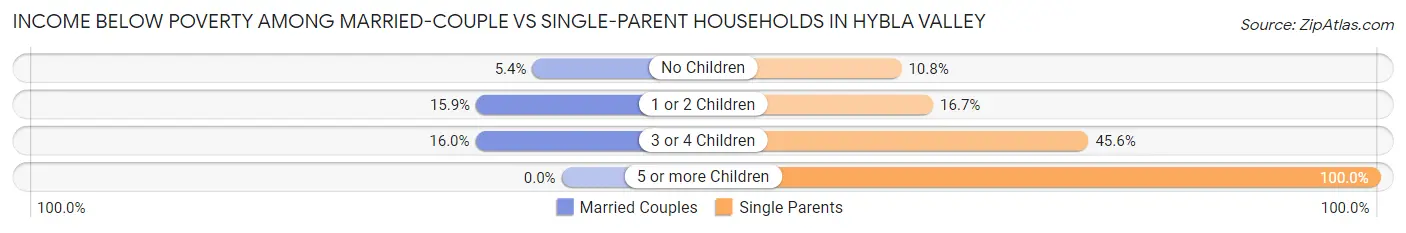
| Children | Married-Couple Families | Single-Parent Households |
| No Children | 82 (5.4%) | 35 (10.8%) |
| 1 or 2 Children | 183 (15.9%) | 110 (16.7%) |
| 3 or 4 Children | 30 (16.0%) | 83 (45.6%) |
| 5 or more Children | 0 (0.0%) | 121 (100.0%) |
| Total | 295 (10.4%) | 349 (27.1%) |
Race in Hybla Valley
The most populous races in Hybla Valley are White / Caucasian (7,344 | 40.6%), Hispanic or Latino (6,436 | 35.5%), and Black / African American (5,247 | 29.0%).
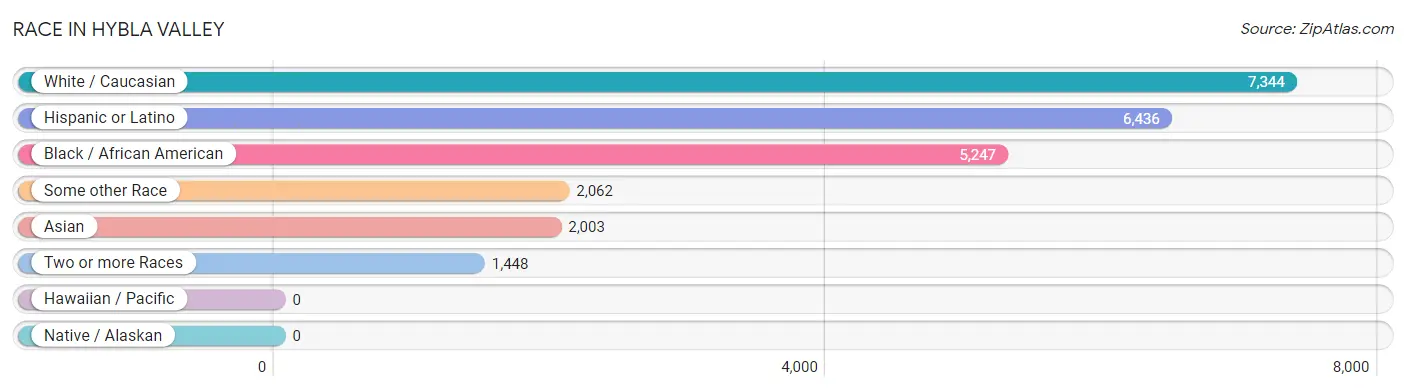
| Race | # Population | % Population |
| Asian | 2,003 | 11.1% |
| Black / African American | 5,247 | 29.0% |
| Hawaiian / Pacific | 0 | 0.0% |
| Hispanic or Latino | 6,436 | 35.5% |
| Native / Alaskan | 0 | 0.0% |
| White / Caucasian | 7,344 | 40.6% |
| Two or more Races | 1,448 | 8.0% |
| Some other Race | 2,062 | 11.4% |
| Total | 18,104 | 100.0% |
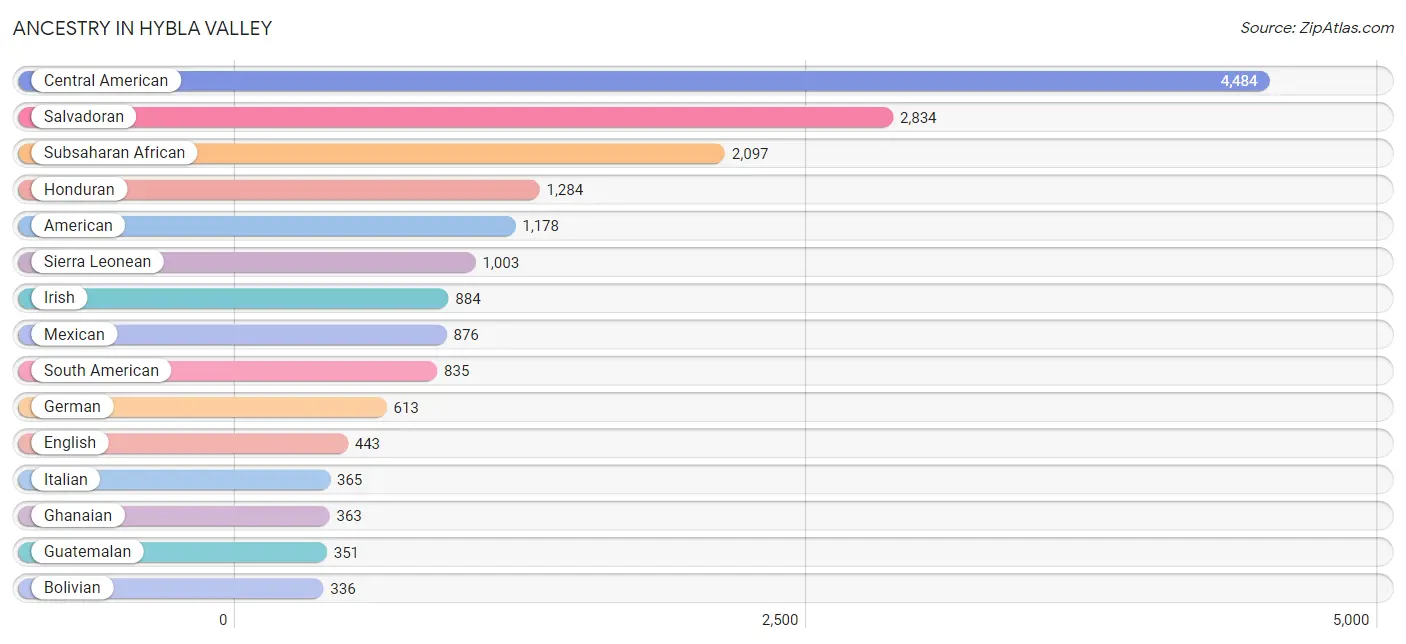
Ancestry in Hybla Valley
The most populous ancestries reported in Hybla Valley are Central American (4,484 | 24.8%), Salvadoran (2,834 | 15.7%), Subsaharan African (2,097 | 11.6%), Honduran (1,284 | 7.1%), and American (1,178 | 6.5%), together accounting for 65.6% of all Hybla Valley residents.
| Ancestry | # Population | % Population |
| African | 164 | 0.9% |
| American | 1,178 | 6.5% |
| Arab | 286 | 1.6% |
| Argentinean | 23 | 0.1% |
| Bhutanese | 167 | 0.9% |
| Blackfeet | 29 | 0.2% |
| Bolivian | 336 | 1.9% |
| Brazilian | 12 | 0.1% |
| British | 19 | 0.1% |
| British West Indian | 27 | 0.2% |
| Burmese | 193 | 1.1% |
| Cape Verdean | 150 | 0.8% |
| Central American | 4,484 | 24.8% |
| Central American Indian | 40 | 0.2% |
| Cherokee | 53 | 0.3% |
| Colombian | 236 | 1.3% |
| Croatian | 61 | 0.3% |
| Danish | 27 | 0.2% |
| Dominican | 87 | 0.5% |
| Dutch | 94 | 0.5% |
| Eastern European | 16 | 0.1% |
| Ecuadorian | 9 | 0.1% |
| Egyptian | 50 | 0.3% |
| English | 443 | 2.5% |
| Ethiopian | 256 | 1.4% |
| European | 64 | 0.4% |
| Finnish | 3 | 0.0% |
| French | 202 | 1.1% |
| German | 613 | 3.4% |
| Ghanaian | 363 | 2.0% |
| Greek | 59 | 0.3% |
| Guatemalan | 351 | 1.9% |
| Haitian | 21 | 0.1% |
| Honduran | 1,284 | 7.1% |
| Indian (Asian) | 74 | 0.4% |
| Irish | 884 | 4.9% |
| Italian | 365 | 2.0% |
| Korean | 129 | 0.7% |
| Lebanese | 58 | 0.3% |
| Lithuanian | 10 | 0.1% |
| Malaysian | 36 | 0.2% |
| Mexican | 876 | 4.8% |
| Mexican American Indian | 27 | 0.2% |
| Mongolian | 47 | 0.3% |
| Moroccan | 40 | 0.2% |
| Nigerian | 19 | 0.1% |
| Norwegian | 57 | 0.3% |
| Pakistani | 54 | 0.3% |
| Panamanian | 15 | 0.1% |
| Peruvian | 189 | 1.0% |
| Polish | 288 | 1.6% |
| Pueblo | 15 | 0.1% |
| Puerto Rican | 18 | 0.1% |
| Romanian | 42 | 0.2% |
| Russian | 15 | 0.1% |
| Salvadoran | 2,834 | 15.7% |
| Samoan | 3 | 0.0% |
| Scotch-Irish | 84 | 0.5% |
| Scottish | 241 | 1.3% |
| Sierra Leonean | 1,003 | 5.5% |
| Slovak | 10 | 0.1% |
| Somali | 34 | 0.2% |
| South African | 47 | 0.3% |
| South American | 835 | 4.6% |
| Spaniard | 34 | 0.2% |
| Spanish | 35 | 0.2% |
| Sri Lankan | 195 | 1.1% |
| Subsaharan African | 2,097 | 11.6% |
| Sudanese | 12 | 0.1% |
| Swedish | 26 | 0.1% |
| Thai | 274 | 1.5% |
| Trinidadian and Tobagonian | 19 | 0.1% |
| Ukrainian | 11 | 0.1% |
| Venezuelan | 42 | 0.2% |
| Vietnamese | 120 | 0.7% |
| Welsh | 66 | 0.4% |
| West Indian | 19 | 0.1% | View All 77 Rows |
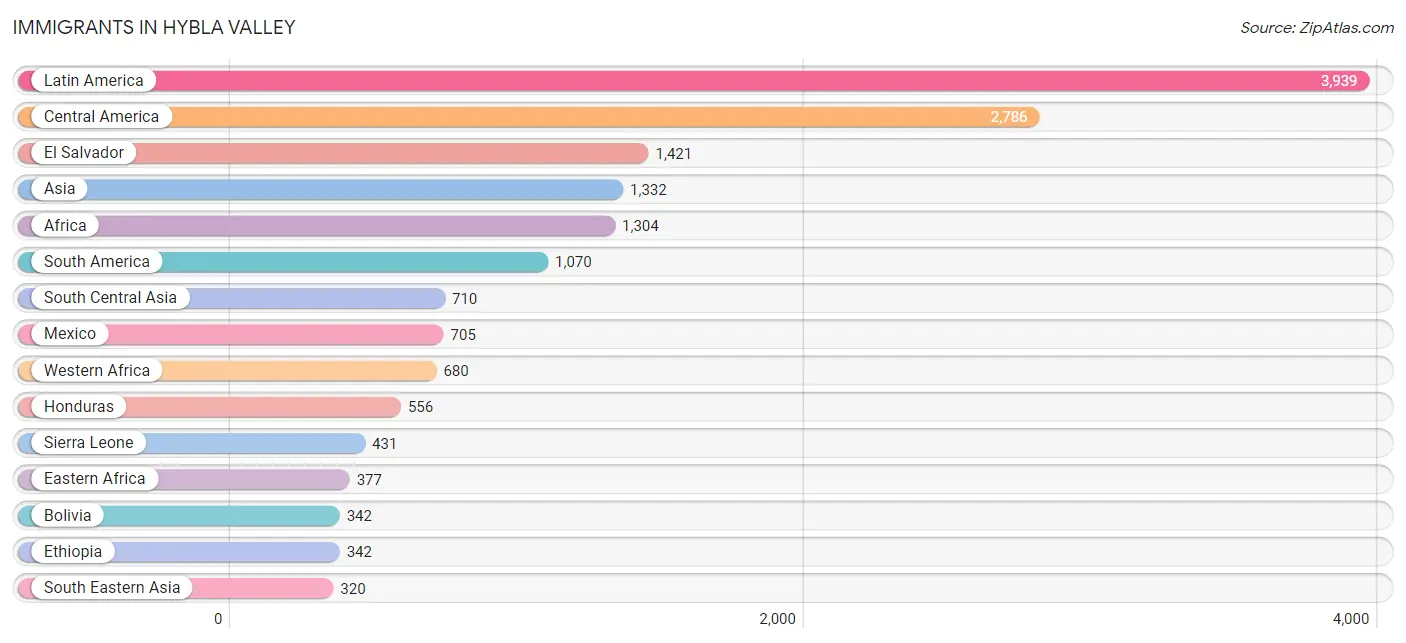
Immigrants in Hybla Valley
The most numerous immigrant groups reported in Hybla Valley came from Latin America (3,939 | 21.8%), Central America (2,786 | 15.4%), El Salvador (1,421 | 7.9%), Asia (1,332 | 7.4%), and Africa (1,304 | 7.2%), together accounting for 59.6% of all Hybla Valley residents.
| Immigration Origin | # Population | % Population |
| Africa | 1,304 | 7.2% |
| Argentina | 81 | 0.4% |
| Asia | 1,332 | 7.4% |
| Bangladesh | 154 | 0.9% |
| Bolivia | 342 | 1.9% |
| Caribbean | 83 | 0.5% |
| Central America | 2,786 | 15.4% |
| China | 18 | 0.1% |
| Colombia | 165 | 0.9% |
| Dominican Republic | 16 | 0.1% |
| Eastern Africa | 377 | 2.1% |
| Eastern Asia | 254 | 1.4% |
| Eastern Europe | 44 | 0.2% |
| Egypt | 81 | 0.4% |
| El Salvador | 1,421 | 7.9% |
| Eritrea | 1 | 0.0% |
| Ethiopia | 342 | 1.9% |
| Europe | 44 | 0.2% |
| Ghana | 249 | 1.4% |
| Guatemala | 89 | 0.5% |
| Guyana | 9 | 0.1% |
| Haiti | 21 | 0.1% |
| Honduras | 556 | 3.1% |
| India | 184 | 1.0% |
| Iran | 6 | 0.0% |
| Japan | 90 | 0.5% |
| Korea | 146 | 0.8% |
| Laos | 15 | 0.1% |
| Latin America | 3,939 | 21.8% |
| Lebanon | 20 | 0.1% |
| Malaysia | 47 | 0.3% |
| Mexico | 705 | 3.9% |
| Middle Africa | 64 | 0.4% |
| Morocco | 26 | 0.1% |
| Nepal | 66 | 0.4% |
| Northern Africa | 124 | 0.7% |
| Oceania | 3 | 0.0% |
| Pakistan | 300 | 1.7% |
| Panama | 15 | 0.1% |
| Peru | 179 | 1.0% |
| Philippines | 98 | 0.5% |
| Poland | 2 | 0.0% |
| Romania | 27 | 0.2% |
| Russia | 15 | 0.1% |
| Sierra Leone | 431 | 2.4% |
| Somalia | 34 | 0.2% |
| South Africa | 30 | 0.2% |
| South America | 1,070 | 5.9% |
| South Central Asia | 710 | 3.9% |
| South Eastern Asia | 320 | 1.8% |
| Sudan | 17 | 0.1% |
| Syria | 28 | 0.2% |
| Taiwan | 18 | 0.1% |
| Thailand | 47 | 0.3% |
| Trinidad and Tobago | 19 | 0.1% |
| Venezuela | 294 | 1.6% |
| Vietnam | 113 | 0.6% |
| Western Africa | 680 | 3.8% |
| Western Asia | 48 | 0.3% |
| Zaire | 64 | 0.4% | View All 60 Rows |
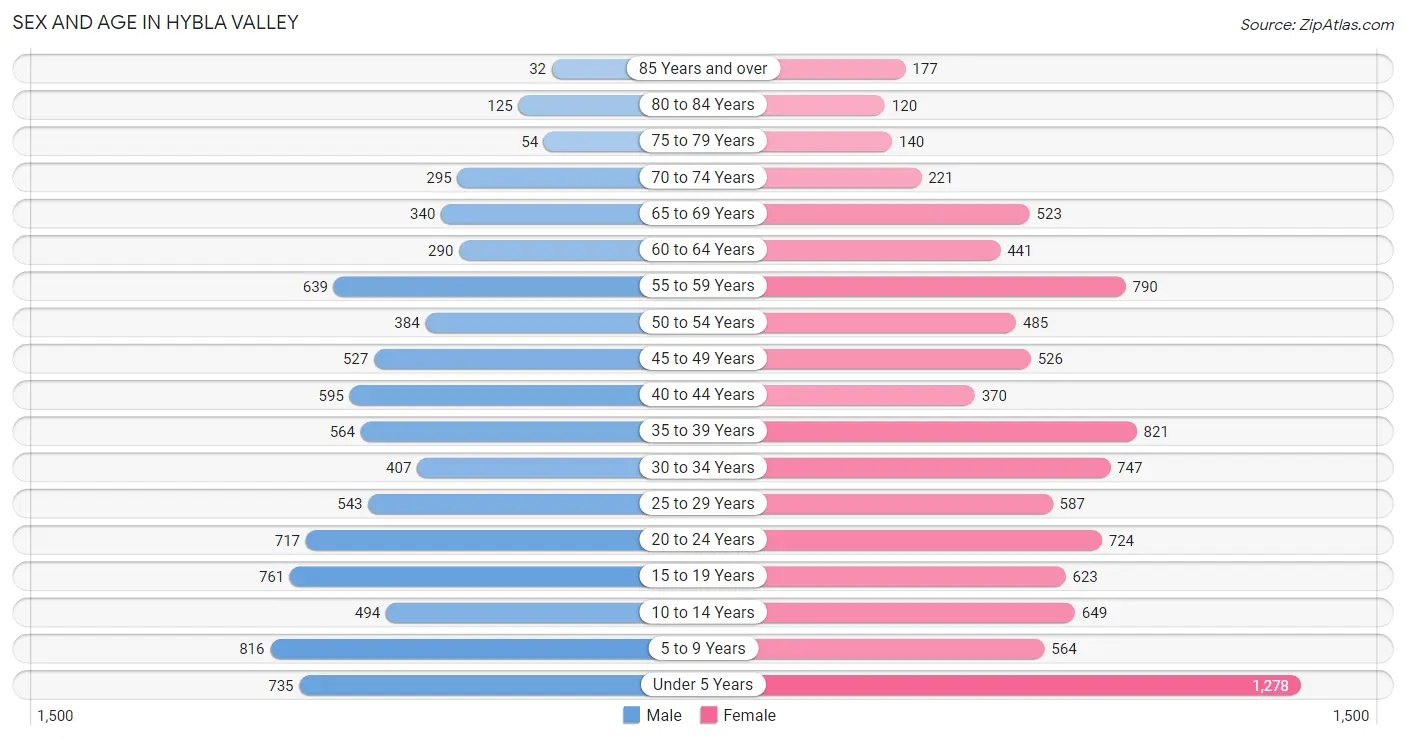
Sex and Age in Hybla Valley
Sex and Age in Hybla Valley
The most populous age groups in Hybla Valley are 5 to 9 Years (816 | 9.8%) for men and Under 5 Years (1,278 | 13.1%) for women.
| Age Bracket | Male | Female |
| Under 5 Years | 735 (8.8%) | 1,278 (13.1%) |
| 5 to 9 Years | 816 (9.8%) | 564 (5.8%) |
| 10 to 14 Years | 494 (5.9%) | 649 (6.6%) |
| 15 to 19 Years | 761 (9.1%) | 623 (6.4%) |
| 20 to 24 Years | 717 (8.6%) | 724 (7.4%) |
| 25 to 29 Years | 543 (6.5%) | 587 (6.0%) |
| 30 to 34 Years | 407 (4.9%) | 747 (7.6%) |
| 35 to 39 Years | 564 (6.8%) | 821 (8.4%) |
| 40 to 44 Years | 595 (7.1%) | 370 (3.8%) |
| 45 to 49 Years | 527 (6.3%) | 526 (5.4%) |
| 50 to 54 Years | 384 (4.6%) | 485 (5.0%) |
| 55 to 59 Years | 639 (7.7%) | 790 (8.1%) |
| 60 to 64 Years | 290 (3.5%) | 441 (4.5%) |
| 65 to 69 Years | 340 (4.1%) | 523 (5.3%) |
| 70 to 74 Years | 295 (3.5%) | 221 (2.3%) |
| 75 to 79 Years | 54 (0.6%) | 140 (1.4%) |
| 80 to 84 Years | 125 (1.5%) | 120 (1.2%) |
| 85 Years and over | 32 (0.4%) | 177 (1.8%) |
| Total | 8,318 (100.0%) | 9,786 (100.0%) |
Families and Households in Hybla Valley
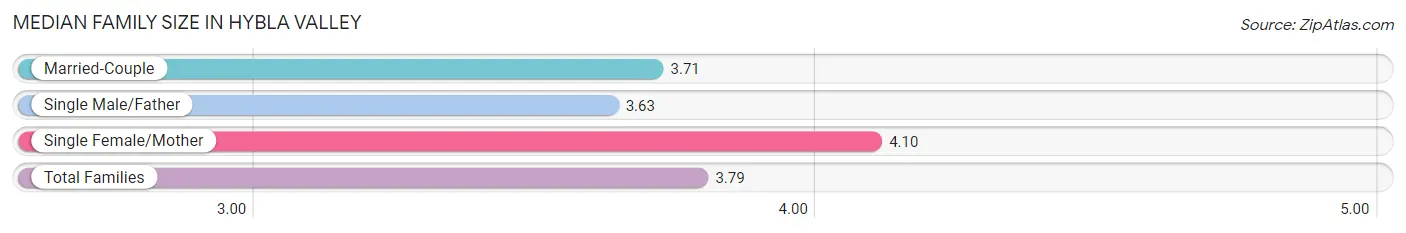
Median Family Size in Hybla Valley
The median family size in Hybla Valley is 3.79 persons per family, with single female/mother families (947 | 22.9%) accounting for the largest median family size of 4.1 persons per family. On the other hand, single male/father families (341 | 8.3%) represent the smallest median family size with 3.63 persons per family.
| Family Type | # Families | Family Size |
| Married-Couple | 2,843 (68.8%) | 3.71 |
| Single Male/Father | 341 (8.3%) | 3.63 |
| Single Female/Mother | 947 (22.9%) | 4.10 |
| Total Families | 4,131 (100.0%) | 3.79 |
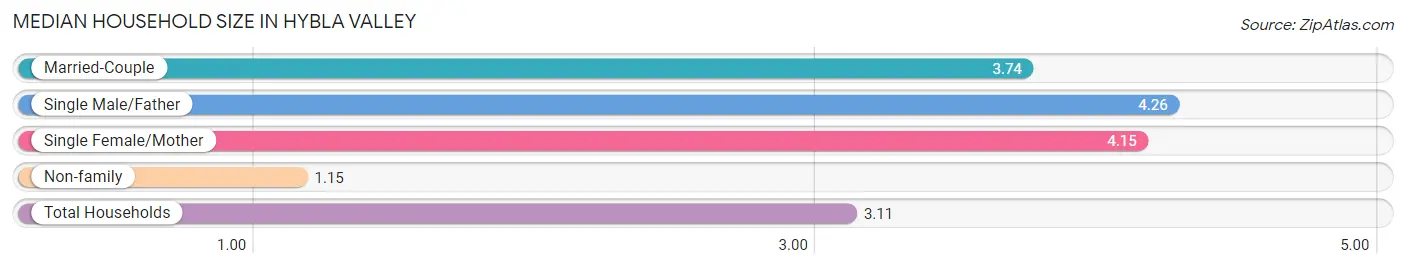
Median Household Size in Hybla Valley
The median household size in Hybla Valley is 3.11 persons per household, with single male/father households (341 | 5.9%) accounting for the largest median household size of 4.26 persons per household. non-family households (1,620 | 28.2%) represent the smallest median household size with 1.15 persons per household.
| Household Type | # Households | Household Size |
| Married-Couple | 2,843 (49.4%) | 3.74 |
| Single Male/Father | 341 (5.9%) | 4.26 |
| Single Female/Mother | 947 (16.5%) | 4.15 |
| Non-family | 1,620 (28.2%) | 1.15 |
| Total Households | 5,751 (100.0%) | 3.11 |
Household Size by Marriage Status in Hybla Valley
Out of a total of 5,751 households in Hybla Valley, 4,131 (71.8%) are family households, while 1,620 (28.2%) are nonfamily households. The most numerous type of family households are 2-person households, comprising 1,406, and the most common type of nonfamily households are 1-person households, comprising 1,438.
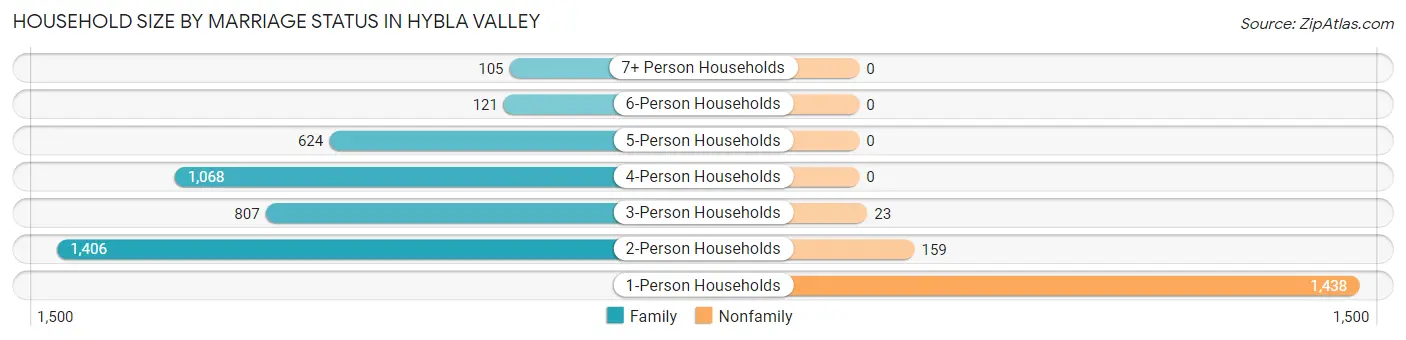
| Household Size | Family Households | Nonfamily Households |
| 1-Person Households | - | 1,438 (25.0%) |
| 2-Person Households | 1,406 (24.4%) | 159 (2.8%) |
| 3-Person Households | 807 (14.0%) | 23 (0.4%) |
| 4-Person Households | 1,068 (18.6%) | 0 (0.0%) |
| 5-Person Households | 624 (10.8%) | 0 (0.0%) |
| 6-Person Households | 121 (2.1%) | 0 (0.0%) |
| 7+ Person Households | 105 (1.8%) | 0 (0.0%) |
| Total | 4,131 (71.8%) | 1,620 (28.2%) |
Female Fertility in Hybla Valley
Fertility by Age in Hybla Valley
Average fertility rate in Hybla Valley is 58.0 births per 1,000 women. Women in the age bracket of 20 to 34 years have the highest fertility rate with 119.0 births per 1,000 women. Women in the age bracket of 20 to 34 years acount for 94.6% of all women with births.
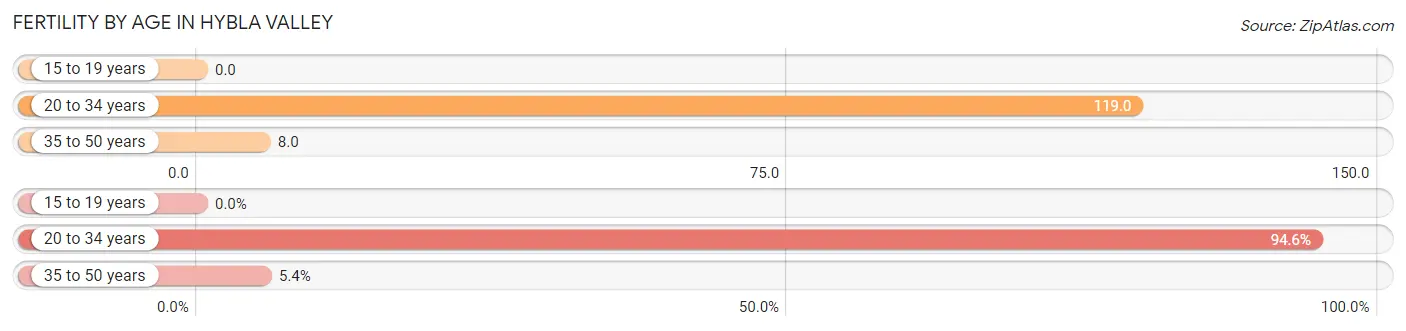
| Age Bracket | Women with Births | Births / 1,000 Women |
| 15 to 19 years | 0 (0.0%) | 0.0 |
| 20 to 34 years | 244 (94.6%) | 119.0 |
| 35 to 50 years | 14 (5.4%) | 8.0 |
| Total | 258 (100.0%) | 58.0 |
Fertility by Age by Marriage Status in Hybla Valley
60.1% of women with births (258) in Hybla Valley are married. The highest percentage of unmarried women with births falls into 20 to 34 years age bracket with 42.2% of them unmarried at the time of birth, while the lowest percentage of unmarried women with births belong to 35 to 50 years age bracket with 0.0% of them unmarried.
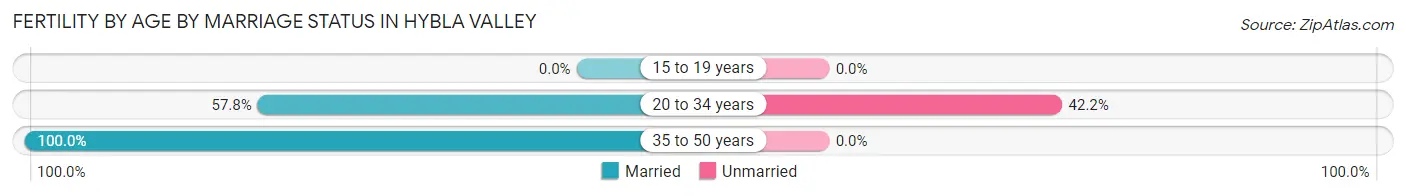
| Age Bracket | Married | Unmarried |
| 15 to 19 years | 0 (0.0%) | 0 (0.0%) |
| 20 to 34 years | 141 (57.8%) | 103 (42.2%) |
| 35 to 50 years | 14 (100.0%) | 0 (0.0%) |
| Total | 155 (60.1%) | 103 (39.9%) |
Fertility by Education in Hybla Valley
Average fertility rate in Hybla Valley is 58.0 births per 1,000 women. Women with the education attainment of graduate degree have the highest fertility rate of 126.0 births per 1,000 women, while women with the education attainment of college or associate's degree have the lowest fertility at 27.0 births per 1,000 women. Women with the education attainment of high school diploma represent 39.9% of all women with births.
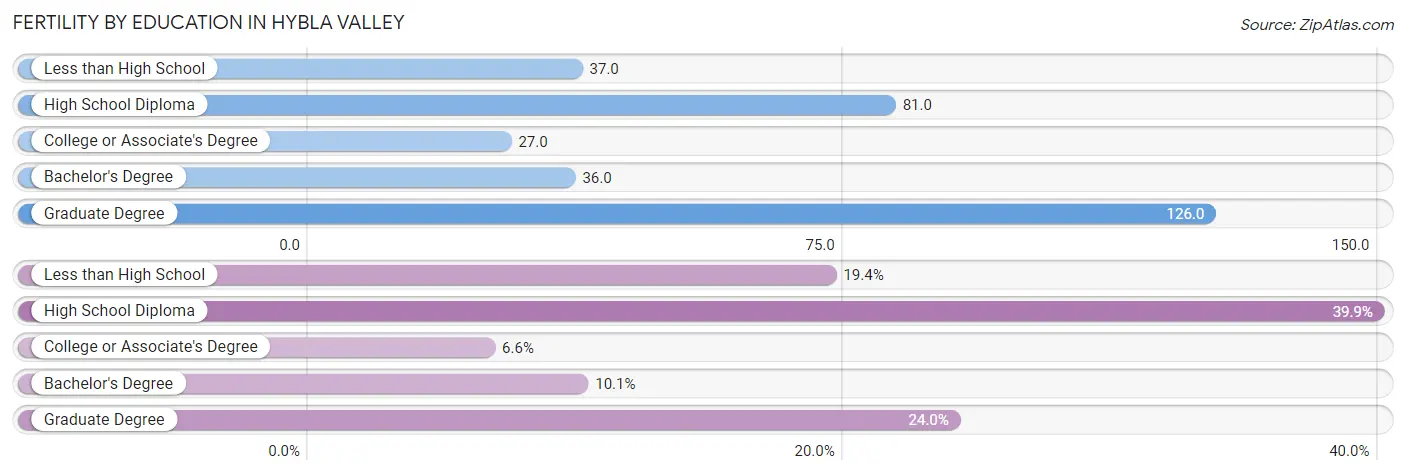
| Educational Attainment | Women with Births | Births / 1,000 Women |
| Less than High School | 50 (19.4%) | 37.0 |
| High School Diploma | 103 (39.9%) | 81.0 |
| College or Associate's Degree | 17 (6.6%) | 27.0 |
| Bachelor's Degree | 26 (10.1%) | 36.0 |
| Graduate Degree | 62 (24.0%) | 126.0 |
| Total | 258 (100.0%) | 58.0 |
Fertility by Education by Marriage Status in Hybla Valley
39.9% of women with births in Hybla Valley are unmarried. Women with the educational attainment of less than high school are most likely to be married with 100.0% of them married at childbirth, while women with the educational attainment of high school diploma are least likely to be married with 100.0% of them unmarried at childbirth.
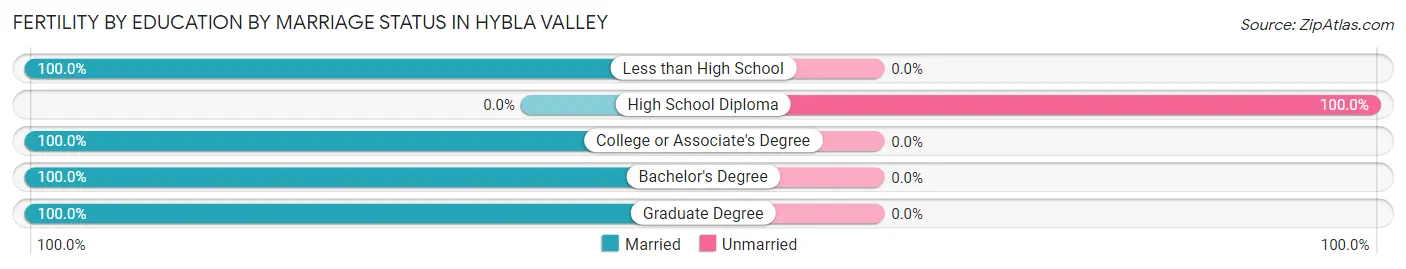
| Educational Attainment | Married | Unmarried |
| Less than High School | 50 (100.0%) | 0 (0.0%) |
| High School Diploma | 0 (0.0%) | 103 (100.0%) |
| College or Associate's Degree | 17 (100.0%) | 0 (0.0%) |
| Bachelor's Degree | 26 (100.0%) | 0 (0.0%) |
| Graduate Degree | 62 (100.0%) | 0 (0.0%) |
| Total | 155 (60.1%) | 103 (39.9%) |
Employment Characteristics in Hybla Valley
Employment by Class of Employer in Hybla Valley
Among the 8,200 employed individuals in Hybla Valley, private company employees (4,874 | 59.4%), federal government employees (1,086 | 13.2%), and not-for-profit organizations (1,028 | 12.5%) make up the most common classes of employment.
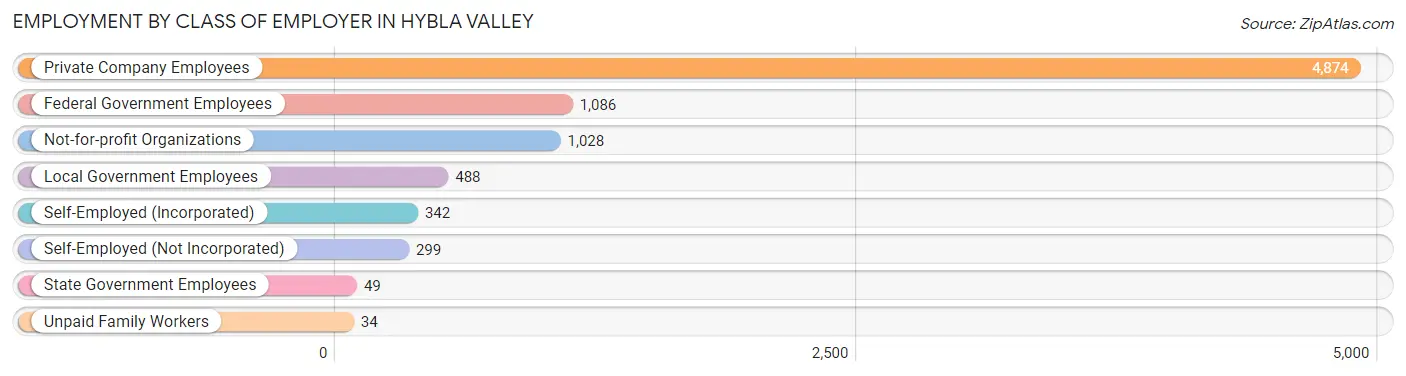
| Employer Class | # Employees | % Employees |
| Private Company Employees | 4,874 | 59.4% |
| Self-Employed (Incorporated) | 342 | 4.2% |
| Self-Employed (Not Incorporated) | 299 | 3.6% |
| Not-for-profit Organizations | 1,028 | 12.5% |
| Local Government Employees | 488 | 5.9% |
| State Government Employees | 49 | 0.6% |
| Federal Government Employees | 1,086 | 13.2% |
| Unpaid Family Workers | 34 | 0.4% |
| Total | 8,200 | 100.0% |
Employment Status by Age in Hybla Valley
According to the labor force statistics for Hybla Valley, out of the total population over 16 years of age (13,182), 67.1% or 8,845 individuals are in the labor force, with 6.4% or 566 of them unemployed. The age group with the highest labor force participation rate is 35 to 44 years, with 90.3% or 2,122 individuals in the labor force. Within the labor force, the 16 to 19 years age range has the highest percentage of unemployed individuals, with 30.8% or 44 of them being unemployed.
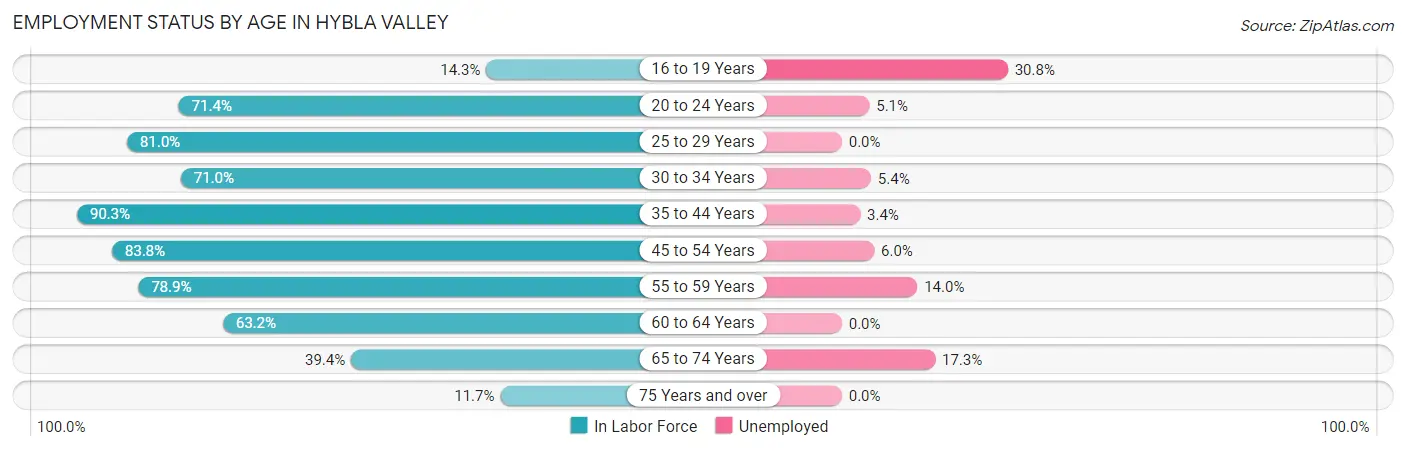
| Age Bracket | In Labor Force | Unemployed |
| 16 to 19 Years | 143 (14.3%) | 44 (30.8%) |
| 20 to 24 Years | 1,029 (71.4%) | 52 (5.1%) |
| 25 to 29 Years | 915 (81.0%) | 0 (0.0%) |
| 30 to 34 Years | 819 (71.0%) | 44 (5.4%) |
| 35 to 44 Years | 2,122 (90.3%) | 72 (3.4%) |
| 45 to 54 Years | 1,611 (83.8%) | 97 (6.0%) |
| 55 to 59 Years | 1,127 (78.9%) | 158 (14.0%) |
| 60 to 64 Years | 462 (63.2%) | 0 (0.0%) |
| 65 to 74 Years | 543 (39.4%) | 94 (17.3%) |
| 75 Years and over | 76 (11.7%) | 0 (0.0%) |
| Total | 8,845 (67.1%) | 566 (6.4%) |
Employment Status by Educational Attainment in Hybla Valley
According to labor force statistics for Hybla Valley, 81.0% of individuals (7,060) out of the total population between 25 and 64 years of age (8,716) are in the labor force, with 5.3% or 374 of them being unemployed. The group with the highest labor force participation rate are those with the educational attainment of bachelor's degree or higher, with 86.8% or 2,664 individuals in the labor force. Within the labor force, individuals with bachelor's degree or higher education have the highest percentage of unemployment, with 7.2% or 192 of them being unemployed.
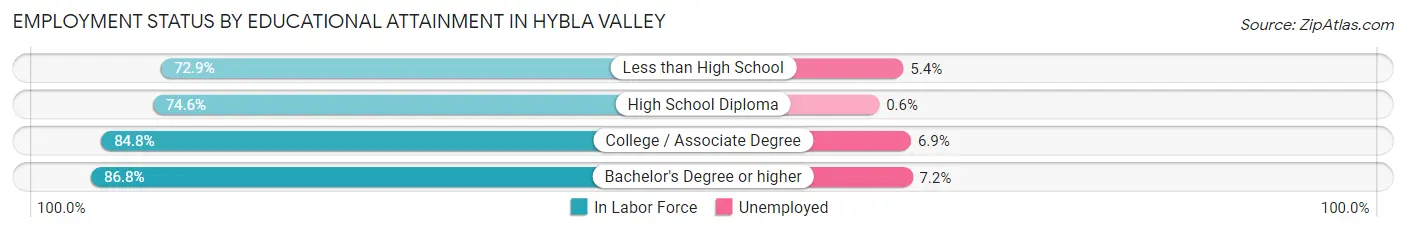
| Educational Attainment | In Labor Force | Unemployed |
| Less than High School | 1,103 (72.9%) | 82 (5.4%) |
| High School Diploma | 1,577 (74.6%) | 13 (0.6%) |
| College / Associate Degree | 1,713 (84.8%) | 139 (6.9%) |
| Bachelor's Degree or higher | 2,664 (86.8%) | 221 (7.2%) |
| Total | 7,060 (81.0%) | 462 (5.3%) |
Employment Occupations by Sex in Hybla Valley
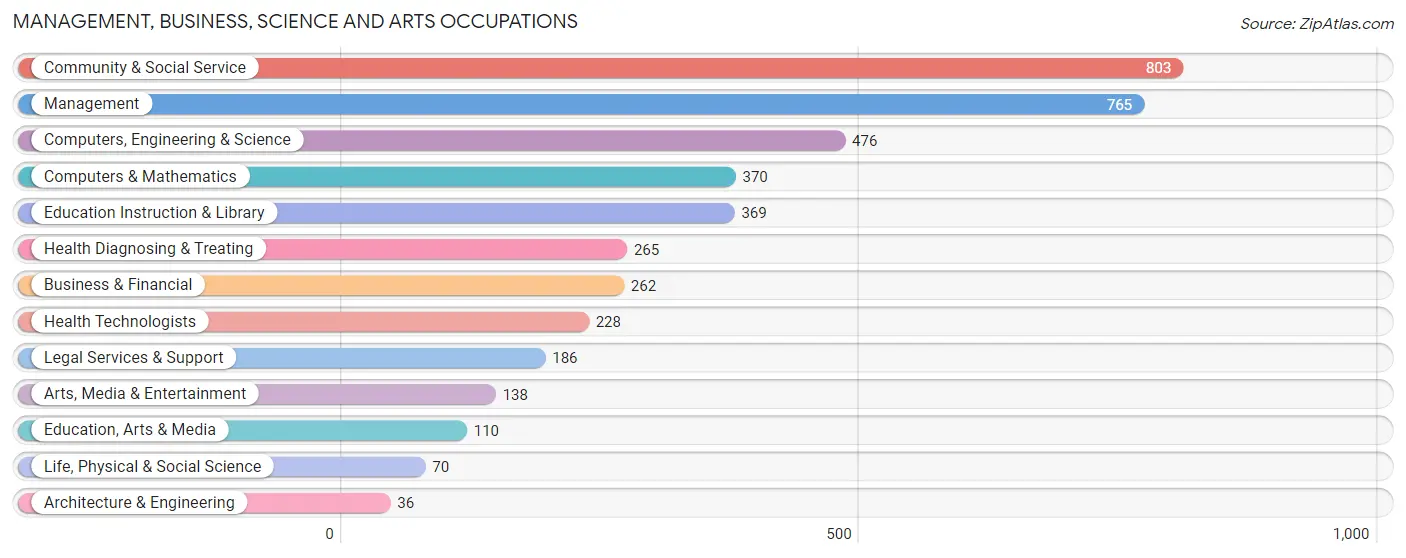
Management, Business, Science and Arts Occupations
The most common Management, Business, Science and Arts occupations in Hybla Valley are Community & Social Service (803 | 10.0%), Management (765 | 9.5%), Computers, Engineering & Science (476 | 5.9%), Computers & Mathematics (370 | 4.6%), and Education Instruction & Library (369 | 4.6%).
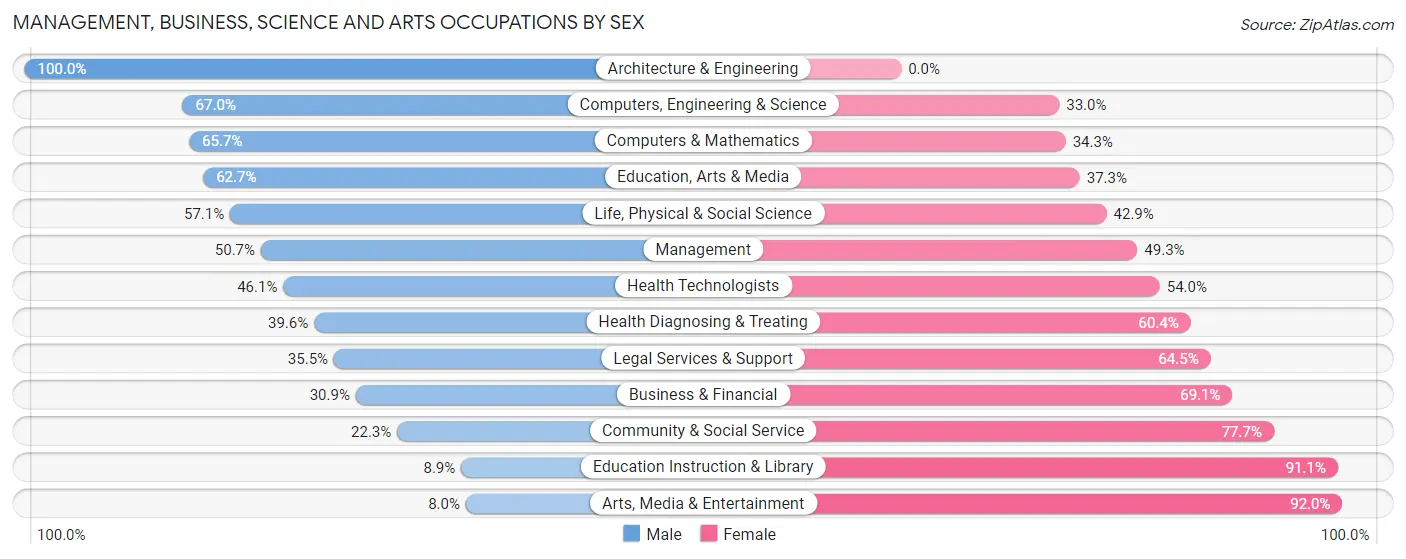
Management, Business, Science and Arts Occupations by Sex
Within the Management, Business, Science and Arts occupations in Hybla Valley, the most male-oriented occupations are Architecture & Engineering (100.0%), Computers, Engineering & Science (67.0%), and Computers & Mathematics (65.7%), while the most female-oriented occupations are Arts, Media & Entertainment (92.0%), Education Instruction & Library (91.1%), and Community & Social Service (77.7%).
| Occupation | Male | Female |
| Management | 388 (50.7%) | 377 (49.3%) |
| Business & Financial | 81 (30.9%) | 181 (69.1%) |
| Computers, Engineering & Science | 319 (67.0%) | 157 (33.0%) |
| Computers & Mathematics | 243 (65.7%) | 127 (34.3%) |
| Architecture & Engineering | 36 (100.0%) | 0 (0.0%) |
| Life, Physical & Social Science | 40 (57.1%) | 30 (42.9%) |
| Community & Social Service | 179 (22.3%) | 624 (77.7%) |
| Education, Arts & Media | 69 (62.7%) | 41 (37.3%) |
| Legal Services & Support | 66 (35.5%) | 120 (64.5%) |
| Education Instruction & Library | 33 (8.9%) | 336 (91.1%) |
| Arts, Media & Entertainment | 11 (8.0%) | 127 (92.0%) |
| Health Diagnosing & Treating | 105 (39.6%) | 160 (60.4%) |
| Health Technologists | 105 (46.1%) | 123 (53.9%) |
| Total (Category) | 1,072 (41.7%) | 1,499 (58.3%) |
| Total (Overall) | 3,664 (45.5%) | 4,388 (54.5%) |
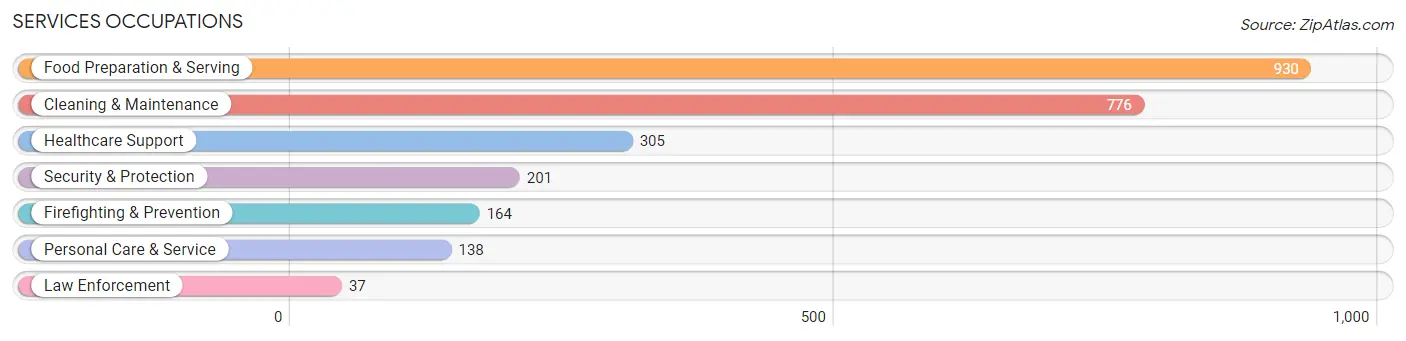
Services Occupations
The most common Services occupations in Hybla Valley are Food Preparation & Serving (930 | 11.6%), Cleaning & Maintenance (776 | 9.6%), Healthcare Support (305 | 3.8%), Security & Protection (201 | 2.5%), and Firefighting & Prevention (164 | 2.0%).
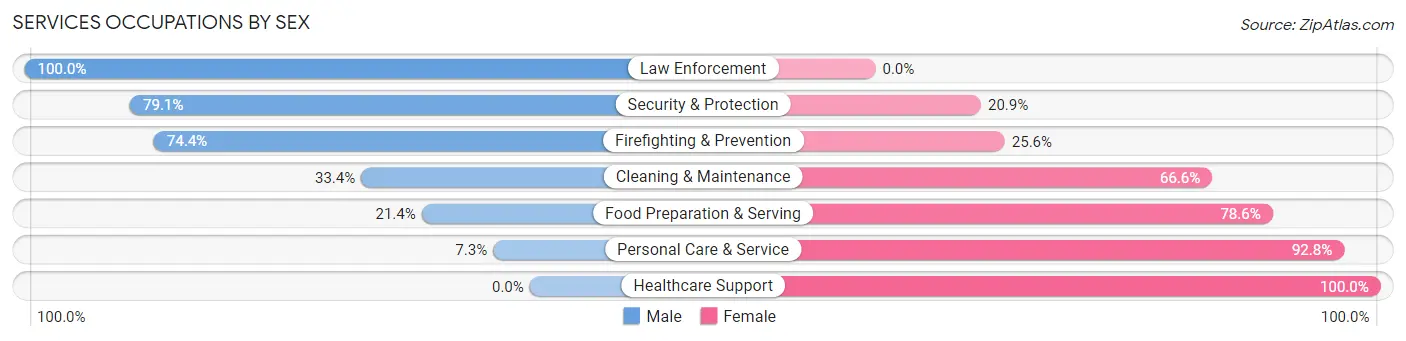
Services Occupations by Sex
Within the Services occupations in Hybla Valley, the most male-oriented occupations are Law Enforcement (100.0%), Security & Protection (79.1%), and Firefighting & Prevention (74.4%), while the most female-oriented occupations are Healthcare Support (100.0%), Personal Care & Service (92.7%), and Food Preparation & Serving (78.6%).
| Occupation | Male | Female |
| Healthcare Support | 0 (0.0%) | 305 (100.0%) |
| Security & Protection | 159 (79.1%) | 42 (20.9%) |
| Firefighting & Prevention | 122 (74.4%) | 42 (25.6%) |
| Law Enforcement | 37 (100.0%) | 0 (0.0%) |
| Food Preparation & Serving | 199 (21.4%) | 731 (78.6%) |
| Cleaning & Maintenance | 259 (33.4%) | 517 (66.6%) |
| Personal Care & Service | 10 (7.2%) | 128 (92.7%) |
| Total (Category) | 627 (26.7%) | 1,723 (73.3%) |
| Total (Overall) | 3,664 (45.5%) | 4,388 (54.5%) |
Sales and Office Occupations
The most common Sales and Office occupations in Hybla Valley are Office & Administration (692 | 8.6%), and Sales & Related (645 | 8.0%).
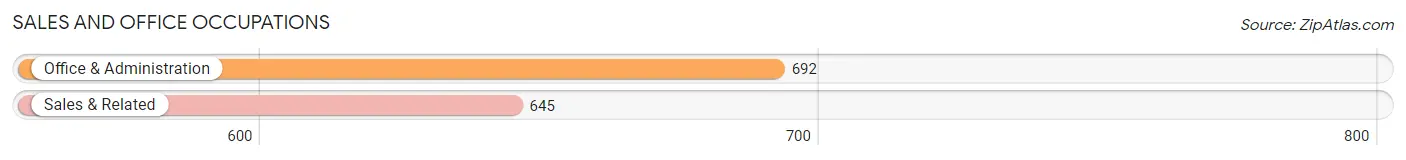
Sales and Office Occupations by Sex
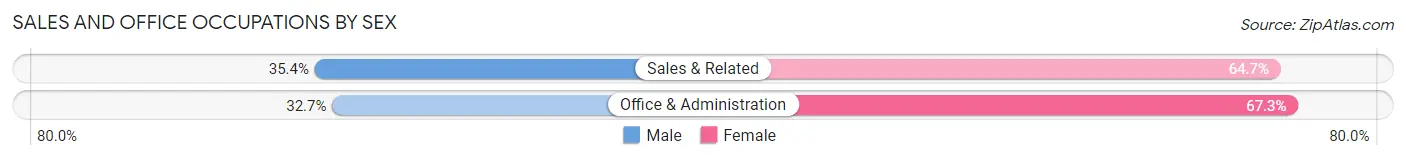
| Occupation | Male | Female |
| Sales & Related | 228 (35.3%) | 417 (64.6%) |
| Office & Administration | 226 (32.7%) | 466 (67.3%) |
| Total (Category) | 454 (34.0%) | 883 (66.0%) |
| Total (Overall) | 3,664 (45.5%) | 4,388 (54.5%) |
Natural Resources, Construction and Maintenance Occupations
The most common Natural Resources, Construction and Maintenance occupations in Hybla Valley are Construction & Extraction (914 | 11.4%), and Installation, Maintenance & Repair (200 | 2.5%).
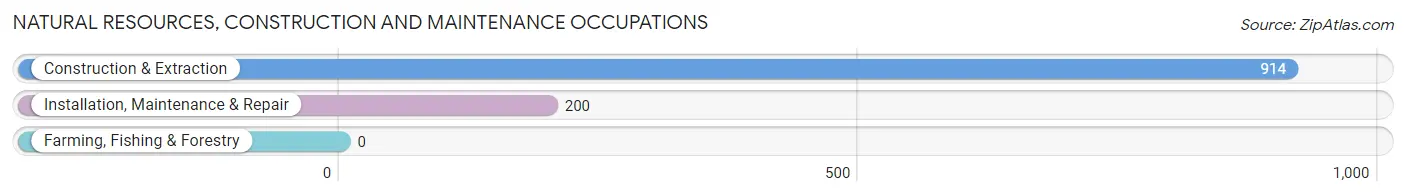
Natural Resources, Construction and Maintenance Occupations by Sex
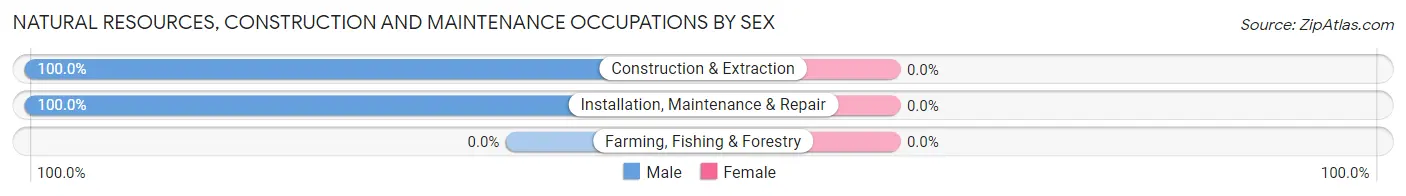
| Occupation | Male | Female |
| Farming, Fishing & Forestry | 0 (0.0%) | 0 (0.0%) |
| Construction & Extraction | 914 (100.0%) | 0 (0.0%) |
| Installation, Maintenance & Repair | 200 (100.0%) | 0 (0.0%) |
| Total (Category) | 1,114 (100.0%) | 0 (0.0%) |
| Total (Overall) | 3,664 (45.5%) | 4,388 (54.5%) |
Production, Transportation and Moving Occupations
The most common Production, Transportation and Moving occupations in Hybla Valley are Transportation (430 | 5.3%), Production (127 | 1.6%), and Material Moving (123 | 1.5%).
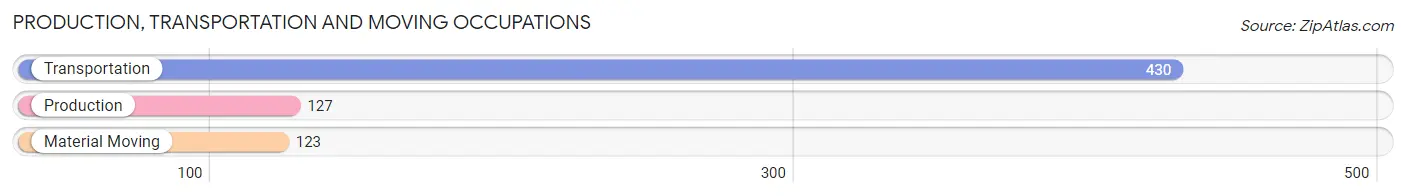
Production, Transportation and Moving Occupations by Sex
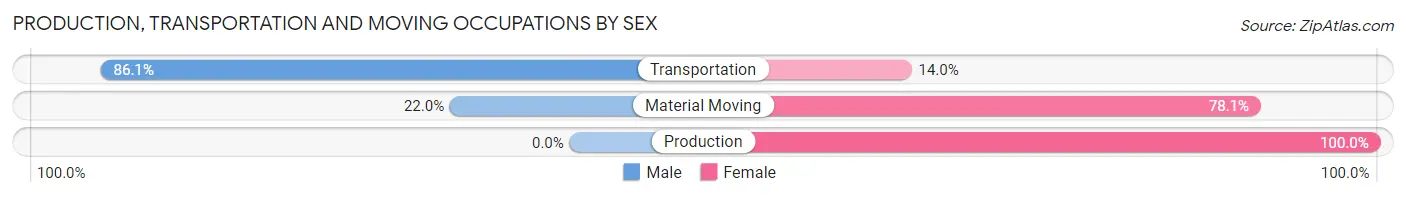
| Occupation | Male | Female |
| Production | 0 (0.0%) | 127 (100.0%) |
| Transportation | 370 (86.1%) | 60 (14.0%) |
| Material Moving | 27 (22.0%) | 96 (78.0%) |
| Total (Category) | 397 (58.4%) | 283 (41.6%) |
| Total (Overall) | 3,664 (45.5%) | 4,388 (54.5%) |
Employment Industries by Sex in Hybla Valley
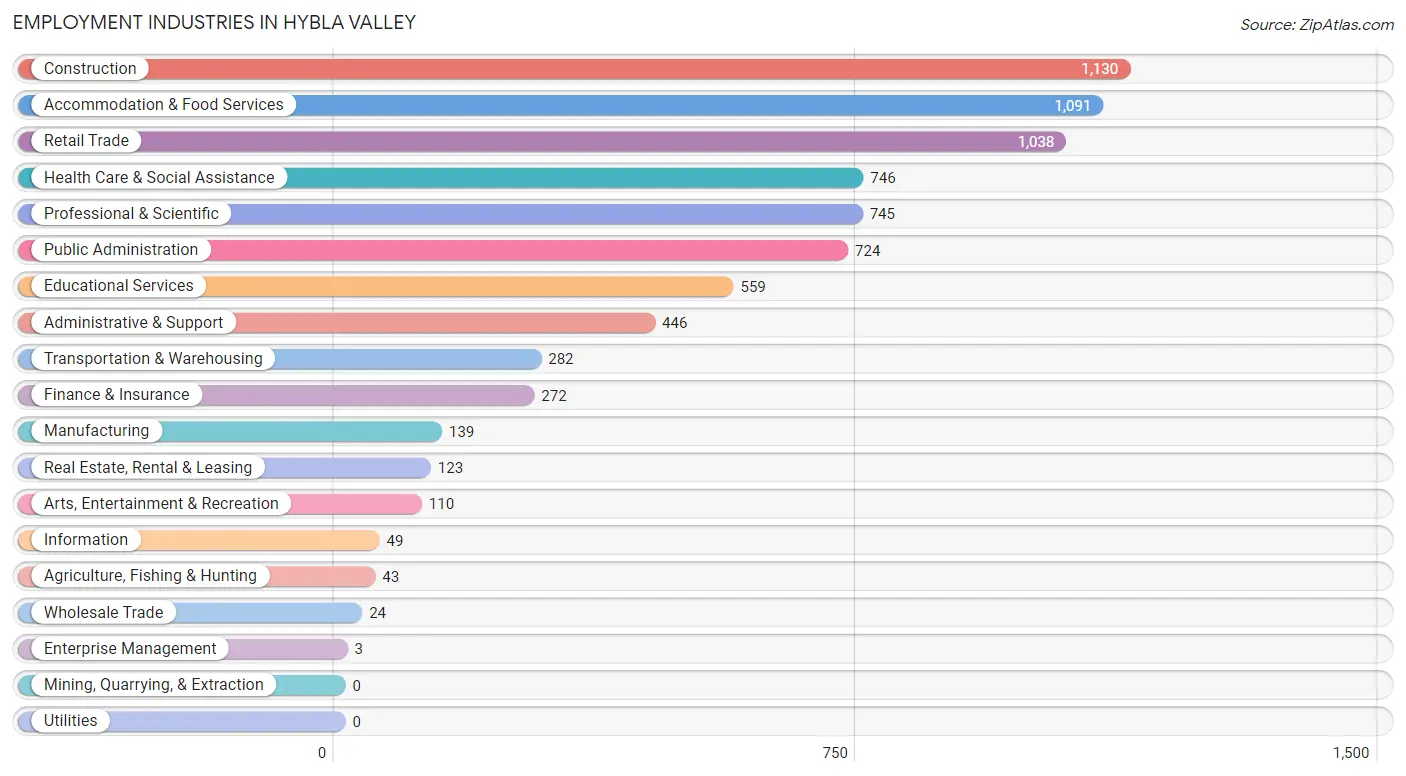
Employment Industries in Hybla Valley
The major employment industries in Hybla Valley include Construction (1,130 | 14.0%), Accommodation & Food Services (1,091 | 13.6%), Retail Trade (1,038 | 12.9%), Health Care & Social Assistance (746 | 9.3%), and Professional & Scientific (745 | 9.2%).
Employment Industries by Sex in Hybla Valley
The Hybla Valley industries that see more men than women are Agriculture, Fishing & Hunting (100.0%), Wholesale Trade (100.0%), and Transportation & Warehousing (100.0%), whereas the industries that tend to have a higher number of women are Manufacturing (100.0%), Enterprise Management (100.0%), and Health Care & Social Assistance (86.1%).
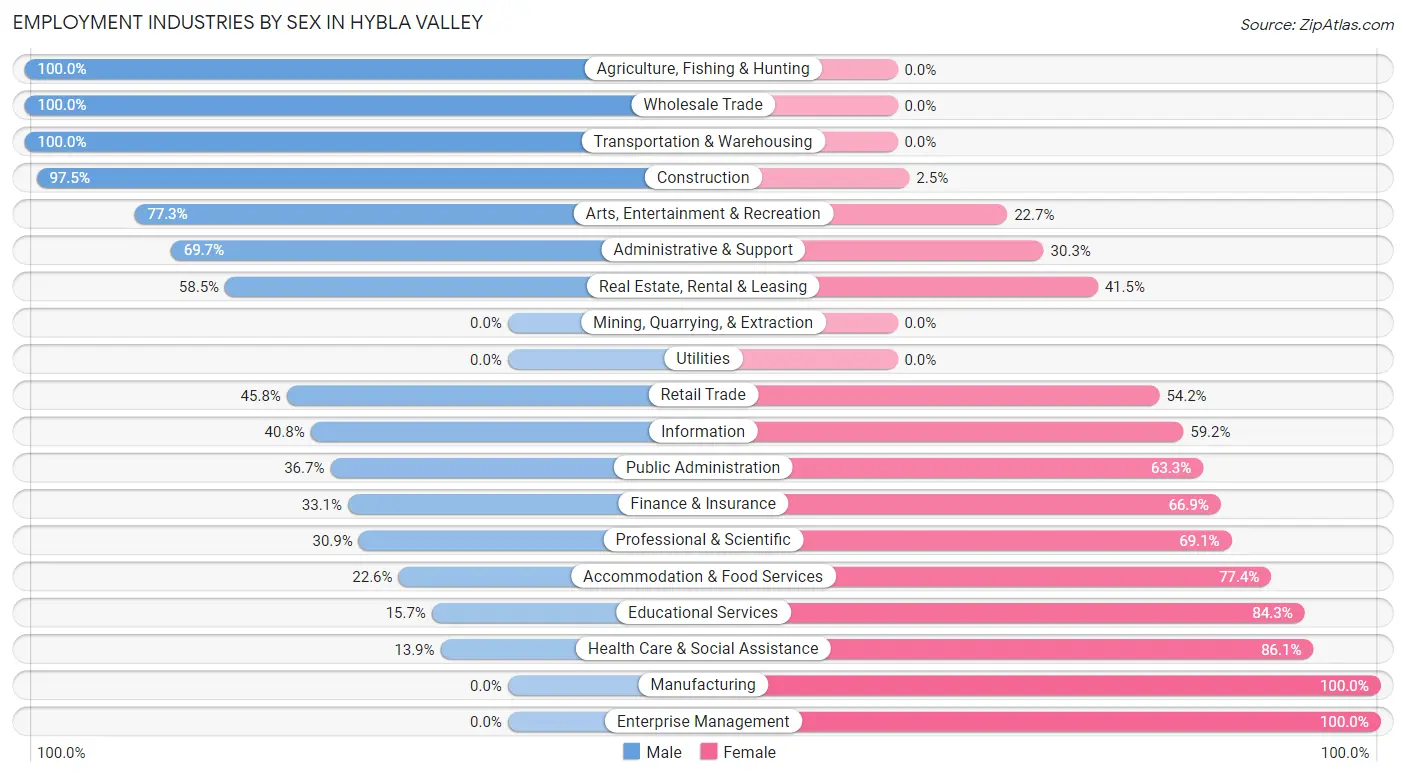
| Industry | Male | Female |
| Agriculture, Fishing & Hunting | 43 (100.0%) | 0 (0.0%) |
| Mining, Quarrying, & Extraction | 0 (0.0%) | 0 (0.0%) |
| Construction | 1,102 (97.5%) | 28 (2.5%) |
| Manufacturing | 0 (0.0%) | 139 (100.0%) |
| Wholesale Trade | 24 (100.0%) | 0 (0.0%) |
| Retail Trade | 475 (45.8%) | 563 (54.2%) |
| Transportation & Warehousing | 282 (100.0%) | 0 (0.0%) |
| Utilities | 0 (0.0%) | 0 (0.0%) |
| Information | 20 (40.8%) | 29 (59.2%) |
| Finance & Insurance | 90 (33.1%) | 182 (66.9%) |
| Real Estate, Rental & Leasing | 72 (58.5%) | 51 (41.5%) |
| Professional & Scientific | 230 (30.9%) | 515 (69.1%) |
| Enterprise Management | 0 (0.0%) | 3 (100.0%) |
| Administrative & Support | 311 (69.7%) | 135 (30.3%) |
| Educational Services | 88 (15.7%) | 471 (84.3%) |
| Health Care & Social Assistance | 104 (13.9%) | 642 (86.1%) |
| Arts, Entertainment & Recreation | 85 (77.3%) | 25 (22.7%) |
| Accommodation & Food Services | 247 (22.6%) | 844 (77.4%) |
| Public Administration | 266 (36.7%) | 458 (63.3%) |
| Total | 3,664 (45.5%) | 4,388 (54.5%) |
Education in Hybla Valley
School Enrollment in Hybla Valley
The most common levels of schooling among the 4,733 students in Hybla Valley are high school (1,475 | 31.2%), elementary school (1,275 | 26.9%), and middle school (786 | 16.6%).
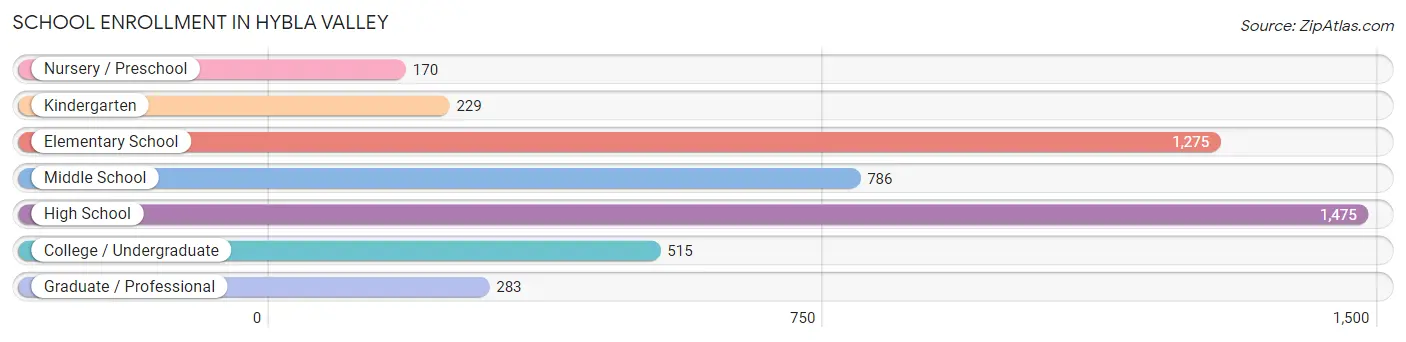
| School Level | # Students | % Students |
| Nursery / Preschool | 170 | 3.6% |
| Kindergarten | 229 | 4.8% |
| Elementary School | 1,275 | 26.9% |
| Middle School | 786 | 16.6% |
| High School | 1,475 | 31.2% |
| College / Undergraduate | 515 | 10.9% |
| Graduate / Professional | 283 | 6.0% |
| Total | 4,733 | 100.0% |
School Enrollment by Age by Funding Source in Hybla Valley
Out of a total of 4,733 students who are enrolled in schools in Hybla Valley, 710 (15.0%) attend a private institution, while the remaining 4,023 (85.0%) are enrolled in public schools. The age group of 3 to 4 year olds has the highest likelihood of being enrolled in private schools, with 158 (100.0% in the age bracket) enrolled. Conversely, the age group of 18 to 19 year olds has the lowest likelihood of being enrolled in a private school, with 275 (93.9% in the age bracket) attending a public institution.
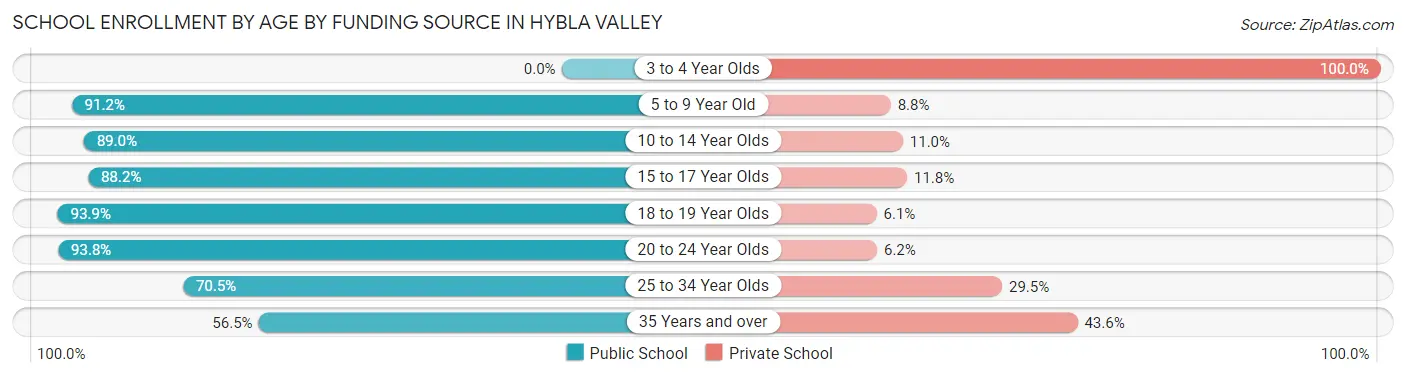
| Age Bracket | Public School | Private School |
| 3 to 4 Year Olds | 0 (0.0%) | 158 (100.0%) |
| 5 to 9 Year Old | 1,219 (91.2%) | 117 (8.8%) |
| 10 to 14 Year Olds | 1,001 (89.0%) | 124 (11.0%) |
| 15 to 17 Year Olds | 814 (88.2%) | 109 (11.8%) |
| 18 to 19 Year Olds | 275 (93.9%) | 18 (6.1%) |
| 20 to 24 Year Olds | 423 (93.8%) | 28 (6.2%) |
| 25 to 34 Year Olds | 184 (70.5%) | 77 (29.5%) |
| 35 Years and over | 105 (56.5%) | 81 (43.5%) |
| Total | 4,023 (85.0%) | 710 (15.0%) |
Educational Attainment by Field of Study in Hybla Valley
Business (855 | 21.0%), social sciences (706 | 17.4%), arts & humanities (433 | 10.6%), engineering (407 | 10.0%), and psychology (257 | 6.3%) are the most common fields of study among 4,064 individuals in Hybla Valley who have obtained a bachelor's degree or higher.
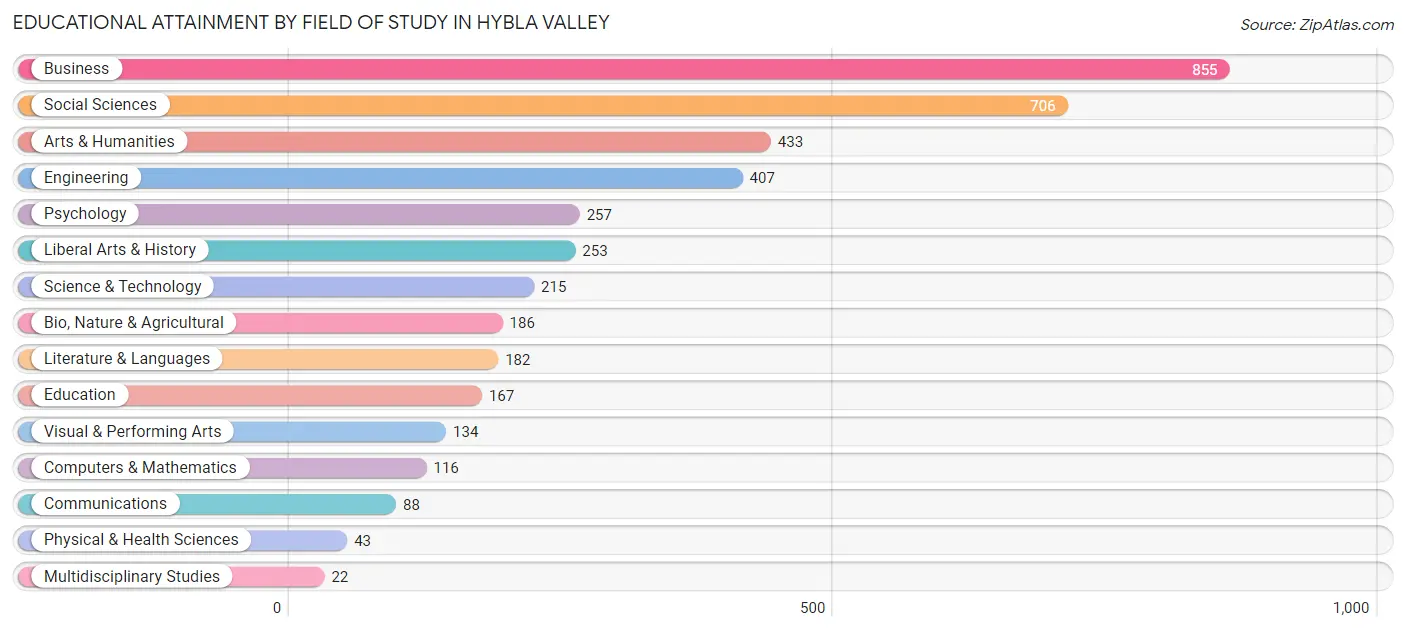
| Field of Study | # Graduates | % Graduates |
| Computers & Mathematics | 116 | 2.9% |
| Bio, Nature & Agricultural | 186 | 4.6% |
| Physical & Health Sciences | 43 | 1.1% |
| Psychology | 257 | 6.3% |
| Social Sciences | 706 | 17.4% |
| Engineering | 407 | 10.0% |
| Multidisciplinary Studies | 22 | 0.5% |
| Science & Technology | 215 | 5.3% |
| Business | 855 | 21.0% |
| Education | 167 | 4.1% |
| Literature & Languages | 182 | 4.5% |
| Liberal Arts & History | 253 | 6.2% |
| Visual & Performing Arts | 134 | 3.3% |
| Communications | 88 | 2.2% |
| Arts & Humanities | 433 | 10.6% |
| Total | 4,064 | 100.0% |
Transportation & Commute in Hybla Valley
Vehicle Availability by Sex in Hybla Valley
The most prevalent vehicle ownership categories in Hybla Valley are males with 2 vehicles (1,454, accounting for 38.0%) and females with 2 vehicles (1,525, making up 33.3%).
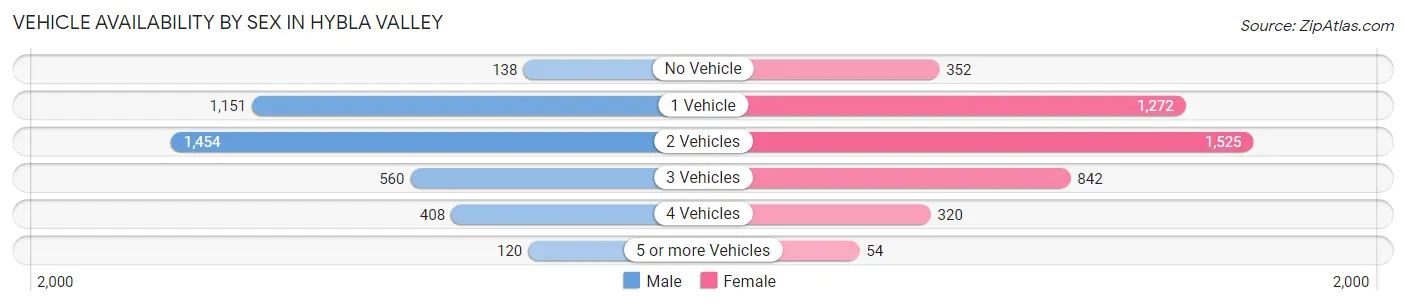
| Vehicles Available | Male | Female |
| No Vehicle | 138 (3.6%) | 352 (8.1%) |
| 1 Vehicle | 1,151 (30.0%) | 1,272 (29.1%) |
| 2 Vehicles | 1,454 (38.0%) | 1,525 (34.9%) |
| 3 Vehicles | 560 (14.6%) | 842 (19.3%) |
| 4 Vehicles | 408 (10.6%) | 320 (7.3%) |
| 5 or more Vehicles | 120 (3.1%) | 54 (1.2%) |
| Total | 3,831 (100.0%) | 4,365 (100.0%) |
Commute Time in Hybla Valley
The most frequently occuring commute durations in Hybla Valley are 30 to 34 minutes (1,181 commuters, 15.5%), 20 to 24 minutes (1,050 commuters, 13.8%), and 45 to 59 minutes (999 commuters, 13.1%).
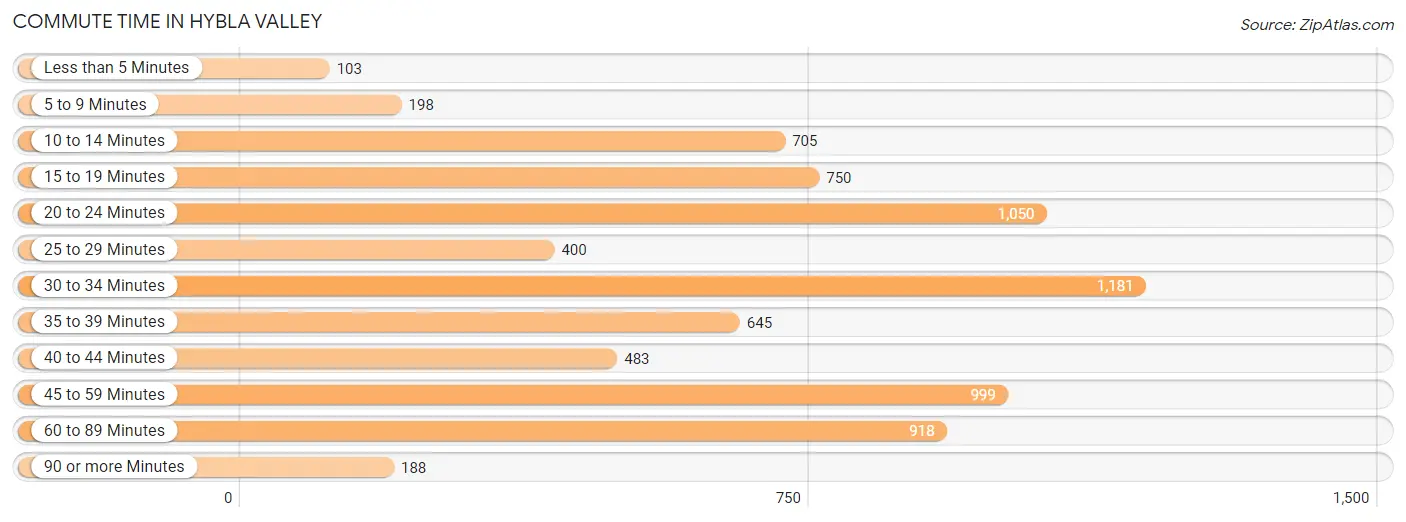
| Commute Time | # Commuters | % Commuters |
| Less than 5 Minutes | 103 | 1.3% |
| 5 to 9 Minutes | 198 | 2.6% |
| 10 to 14 Minutes | 705 | 9.2% |
| 15 to 19 Minutes | 750 | 9.8% |
| 20 to 24 Minutes | 1,050 | 13.8% |
| 25 to 29 Minutes | 400 | 5.2% |
| 30 to 34 Minutes | 1,181 | 15.5% |
| 35 to 39 Minutes | 645 | 8.5% |
| 40 to 44 Minutes | 483 | 6.3% |
| 45 to 59 Minutes | 999 | 13.1% |
| 60 to 89 Minutes | 918 | 12.0% |
| 90 or more Minutes | 188 | 2.5% |
Commute Time by Sex in Hybla Valley
The most common commute times in Hybla Valley are 45 to 59 minutes (540 commuters, 15.0%) for males and 30 to 34 minutes (848 commuters, 21.0%) for females.
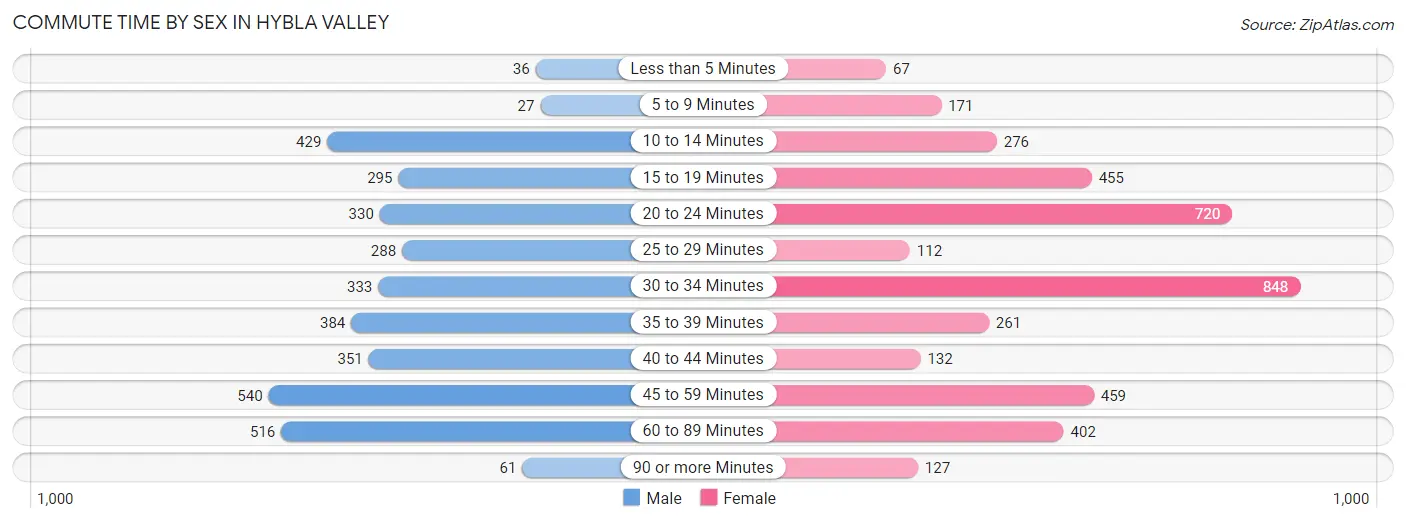
| Commute Time | Male | Female |
| Less than 5 Minutes | 36 (1.0%) | 67 (1.7%) |
| 5 to 9 Minutes | 27 (0.7%) | 171 (4.2%) |
| 10 to 14 Minutes | 429 (11.9%) | 276 (6.9%) |
| 15 to 19 Minutes | 295 (8.2%) | 455 (11.3%) |
| 20 to 24 Minutes | 330 (9.2%) | 720 (17.9%) |
| 25 to 29 Minutes | 288 (8.0%) | 112 (2.8%) |
| 30 to 34 Minutes | 333 (9.3%) | 848 (21.0%) |
| 35 to 39 Minutes | 384 (10.7%) | 261 (6.5%) |
| 40 to 44 Minutes | 351 (9.8%) | 132 (3.3%) |
| 45 to 59 Minutes | 540 (15.0%) | 459 (11.4%) |
| 60 to 89 Minutes | 516 (14.4%) | 402 (10.0%) |
| 90 or more Minutes | 61 (1.7%) | 127 (3.2%) |
Time of Departure to Work by Sex in Hybla Valley
The most frequent times of departure to work in Hybla Valley are 6:00 AM to 6:29 AM (590, 16.4%) for males and 6:30 AM to 6:59 AM (709, 17.6%) for females.
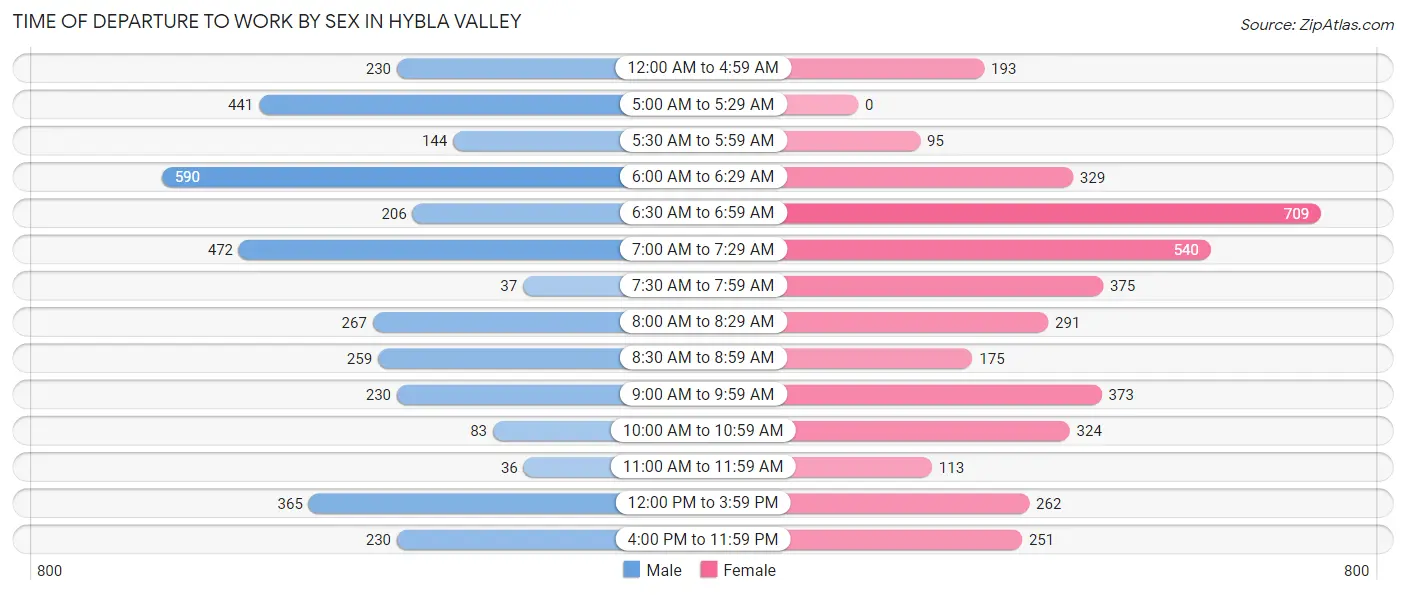
| Time of Departure | Male | Female |
| 12:00 AM to 4:59 AM | 230 (6.4%) | 193 (4.8%) |
| 5:00 AM to 5:29 AM | 441 (12.3%) | 0 (0.0%) |
| 5:30 AM to 5:59 AM | 144 (4.0%) | 95 (2.4%) |
| 6:00 AM to 6:29 AM | 590 (16.4%) | 329 (8.2%) |
| 6:30 AM to 6:59 AM | 206 (5.7%) | 709 (17.6%) |
| 7:00 AM to 7:29 AM | 472 (13.2%) | 540 (13.4%) |
| 7:30 AM to 7:59 AM | 37 (1.0%) | 375 (9.3%) |
| 8:00 AM to 8:29 AM | 267 (7.4%) | 291 (7.2%) |
| 8:30 AM to 8:59 AM | 259 (7.2%) | 175 (4.3%) |
| 9:00 AM to 9:59 AM | 230 (6.4%) | 373 (9.3%) |
| 10:00 AM to 10:59 AM | 83 (2.3%) | 324 (8.0%) |
| 11:00 AM to 11:59 AM | 36 (1.0%) | 113 (2.8%) |
| 12:00 PM to 3:59 PM | 365 (10.2%) | 262 (6.5%) |
| 4:00 PM to 11:59 PM | 230 (6.4%) | 251 (6.2%) |
| Total | 3,590 (100.0%) | 4,030 (100.0%) |
Housing Occupancy in Hybla Valley
Occupancy by Ownership in Hybla Valley
Of the total 5,751 dwellings in Hybla Valley, owner-occupied units account for 2,432 (42.3%), while renter-occupied units make up 3,319 (57.7%).
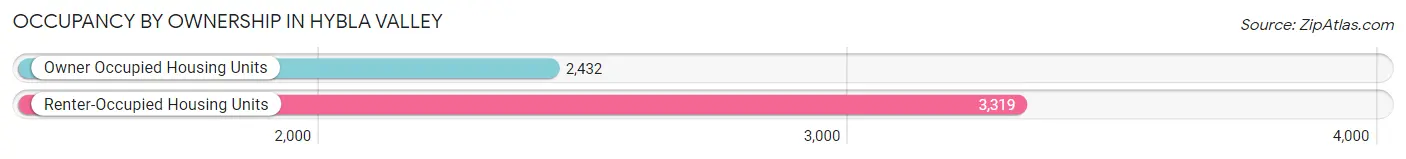
| Occupancy | # Housing Units | % Housing Units |
| Owner Occupied Housing Units | 2,432 | 42.3% |
| Renter-Occupied Housing Units | 3,319 | 57.7% |
| Total Occupied Housing Units | 5,751 | 100.0% |
Occupancy by Household Size in Hybla Valley
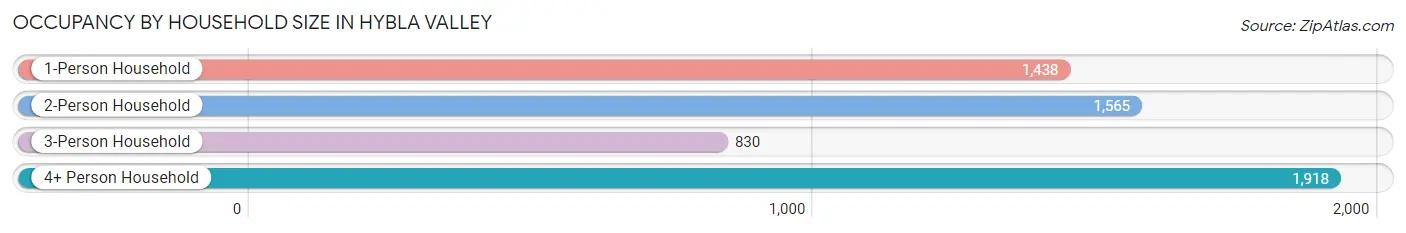
| Household Size | # Housing Units | % Housing Units |
| 1-Person Household | 1,438 | 25.0% |
| 2-Person Household | 1,565 | 27.2% |
| 3-Person Household | 830 | 14.4% |
| 4+ Person Household | 1,918 | 33.4% |
| Total Housing Units | 5,751 | 100.0% |
Occupancy by Ownership by Household Size in Hybla Valley
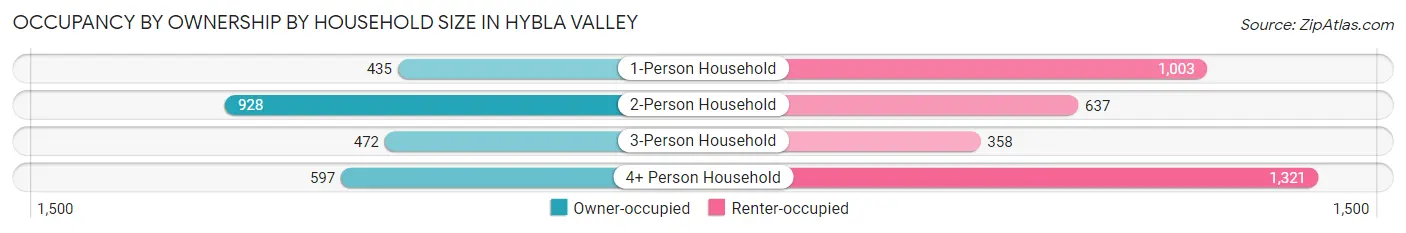
| Household Size | Owner-occupied | Renter-occupied |
| 1-Person Household | 435 (30.2%) | 1,003 (69.8%) |
| 2-Person Household | 928 (59.3%) | 637 (40.7%) |
| 3-Person Household | 472 (56.9%) | 358 (43.1%) |
| 4+ Person Household | 597 (31.1%) | 1,321 (68.9%) |
| Total Housing Units | 2,432 (42.3%) | 3,319 (57.7%) |
Occupancy by Educational Attainment in Hybla Valley
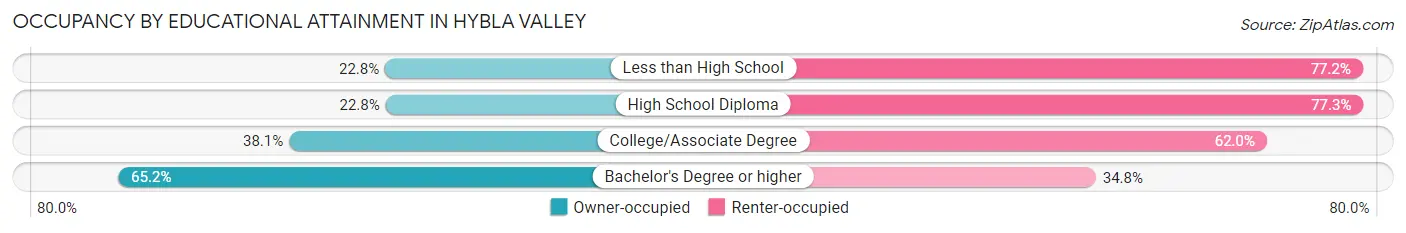
| Household Size | Owner-occupied | Renter-occupied |
| Less than High School | 221 (22.8%) | 747 (77.2%) |
| High School Diploma | 304 (22.8%) | 1,032 (77.2%) |
| College/Associate Degree | 476 (38.1%) | 775 (62.0%) |
| Bachelor's Degree or higher | 1,431 (65.2%) | 765 (34.8%) |
Occupancy by Age of Householder in Hybla Valley
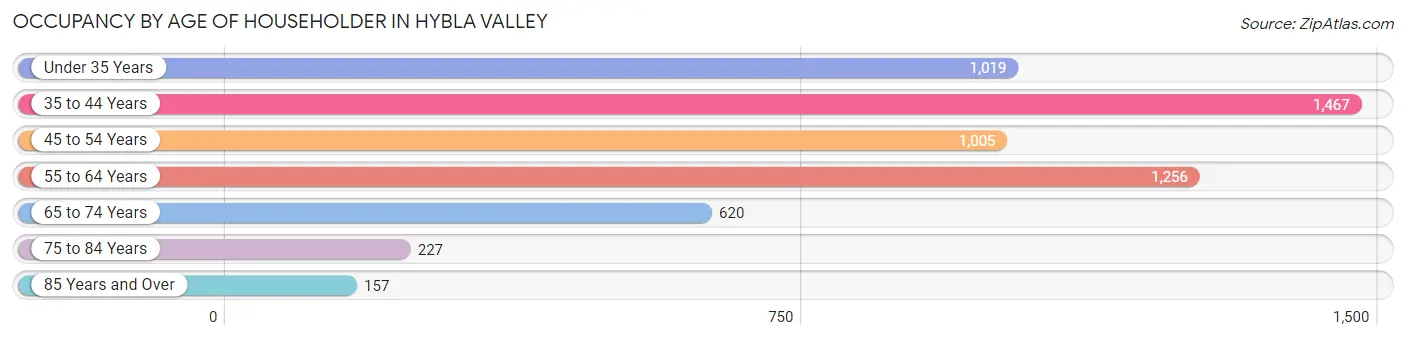
| Age Bracket | # Households | % Households |
| Under 35 Years | 1,019 | 17.7% |
| 35 to 44 Years | 1,467 | 25.5% |
| 45 to 54 Years | 1,005 | 17.5% |
| 55 to 64 Years | 1,256 | 21.8% |
| 65 to 74 Years | 620 | 10.8% |
| 75 to 84 Years | 227 | 4.0% |
| 85 Years and Over | 157 | 2.7% |
| Total | 5,751 | 100.0% |
Housing Finances in Hybla Valley
Median Income by Occupancy in Hybla Valley
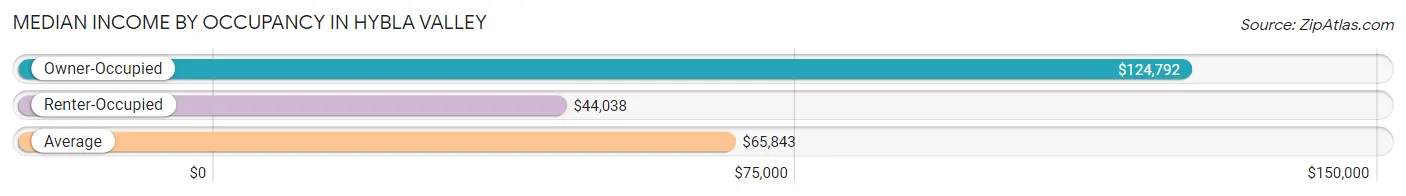
| Occupancy Type | # Households | Median Income |
| Owner-Occupied | 2,432 (42.3%) | $124,792 |
| Renter-Occupied | 3,319 (57.7%) | $44,038 |
| Average | 5,751 (100.0%) | $65,843 |
Occupancy by Householder Income Bracket in Hybla Valley
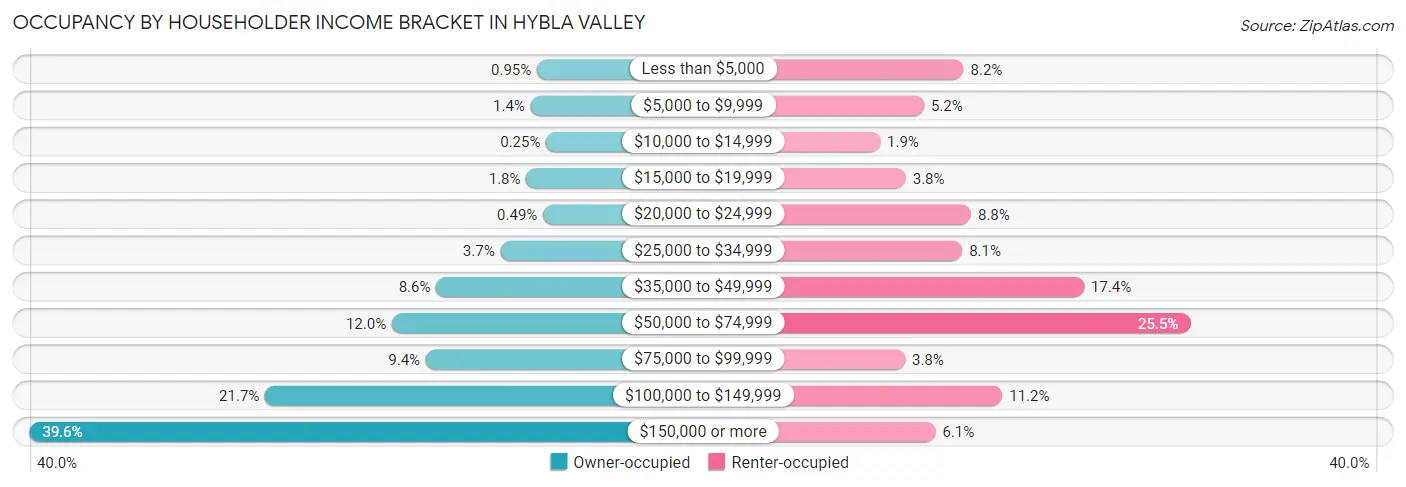
| Income Bracket | Owner-occupied | Renter-occupied |
| Less than $5,000 | 23 (0.9%) | 273 (8.2%) |
| $5,000 to $9,999 | 35 (1.4%) | 173 (5.2%) |
| $10,000 to $14,999 | 6 (0.3%) | 62 (1.9%) |
| $15,000 to $19,999 | 43 (1.8%) | 127 (3.8%) |
| $20,000 to $24,999 | 12 (0.5%) | 292 (8.8%) |
| $25,000 to $34,999 | 91 (3.7%) | 270 (8.1%) |
| $35,000 to $49,999 | 210 (8.6%) | 578 (17.4%) |
| $50,000 to $74,999 | 292 (12.0%) | 846 (25.5%) |
| $75,000 to $99,999 | 229 (9.4%) | 125 (3.8%) |
| $100,000 to $149,999 | 527 (21.7%) | 371 (11.2%) |
| $150,000 or more | 964 (39.6%) | 202 (6.1%) |
| Total | 2,432 (100.0%) | 3,319 (100.0%) |
Monthly Housing Cost Tiers in Hybla Valley
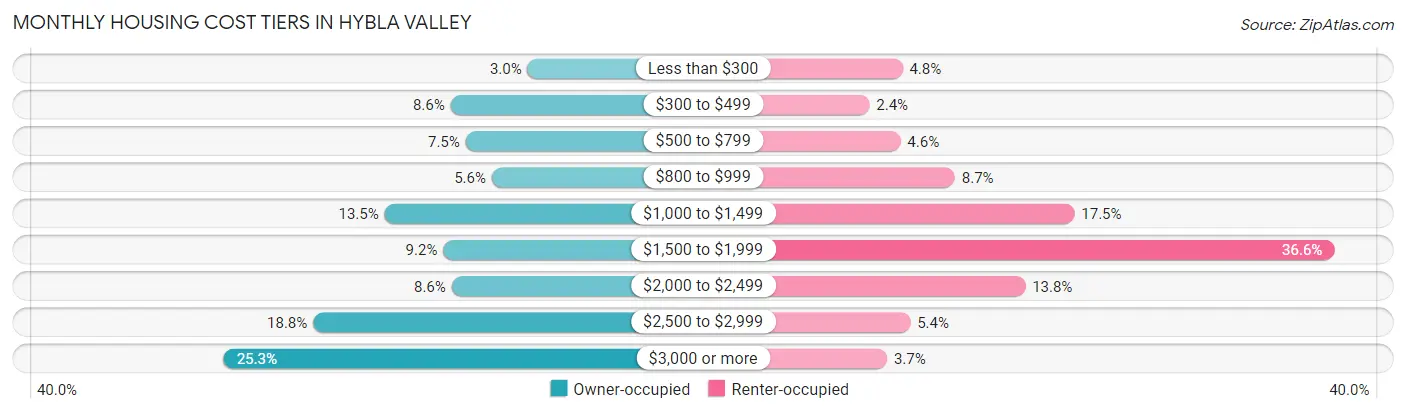
| Monthly Cost | Owner-occupied | Renter-occupied |
| Less than $300 | 72 (3.0%) | 159 (4.8%) |
| $300 to $499 | 210 (8.6%) | 78 (2.4%) |
| $500 to $799 | 183 (7.5%) | 154 (4.6%) |
| $800 to $999 | 136 (5.6%) | 287 (8.6%) |
| $1,000 to $1,499 | 328 (13.5%) | 579 (17.4%) |
| $1,500 to $1,999 | 223 (9.2%) | 1,214 (36.6%) |
| $2,000 to $2,499 | 208 (8.6%) | 459 (13.8%) |
| $2,500 to $2,999 | 456 (18.8%) | 178 (5.4%) |
| $3,000 or more | 616 (25.3%) | 121 (3.6%) |
| Total | 2,432 (100.0%) | 3,319 (100.0%) |
Physical Housing Characteristics in Hybla Valley
Housing Structures in Hybla Valley
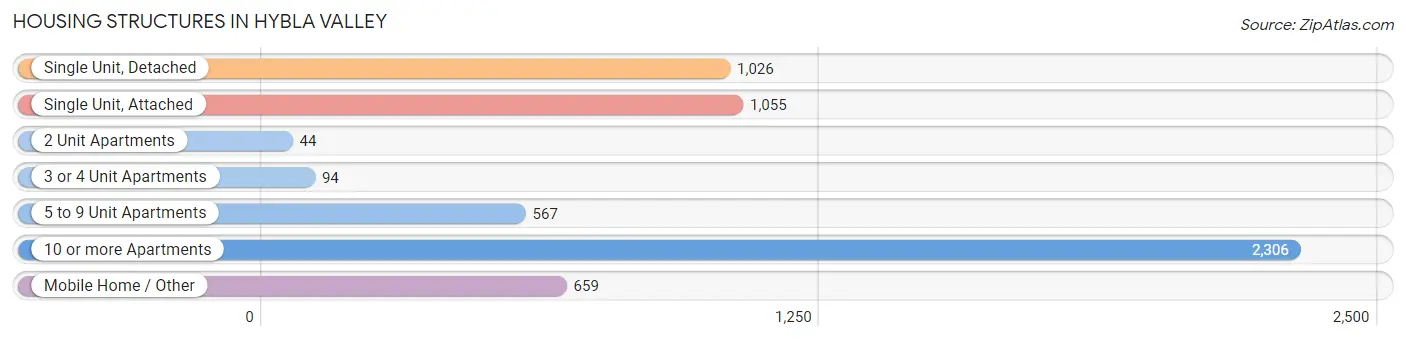
| Structure Type | # Housing Units | % Housing Units |
| Single Unit, Detached | 1,026 | 17.8% |
| Single Unit, Attached | 1,055 | 18.3% |
| 2 Unit Apartments | 44 | 0.8% |
| 3 or 4 Unit Apartments | 94 | 1.6% |
| 5 to 9 Unit Apartments | 567 | 9.9% |
| 10 or more Apartments | 2,306 | 40.1% |
| Mobile Home / Other | 659 | 11.5% |
| Total | 5,751 | 100.0% |
Housing Structures by Occupancy in Hybla Valley
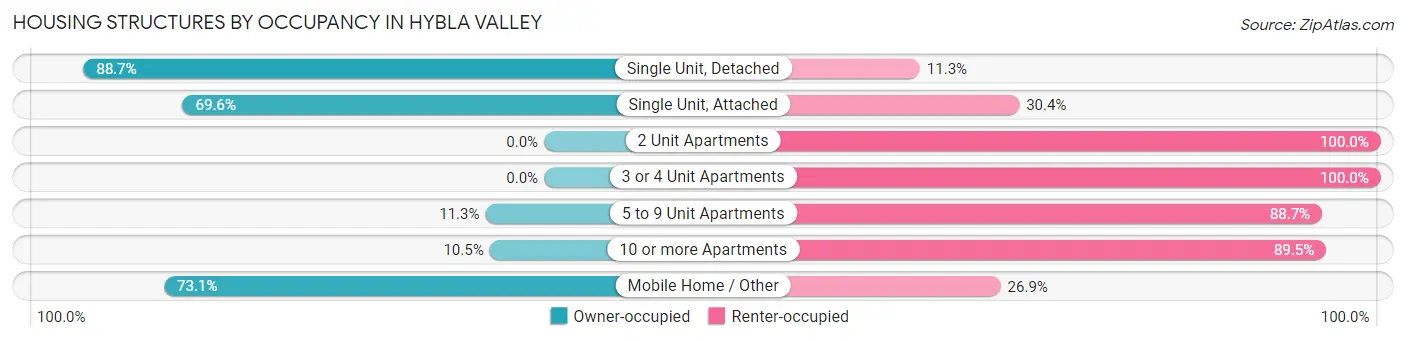
| Structure Type | Owner-occupied | Renter-occupied |
| Single Unit, Detached | 910 (88.7%) | 116 (11.3%) |
| Single Unit, Attached | 734 (69.6%) | 321 (30.4%) |
| 2 Unit Apartments | 0 (0.0%) | 44 (100.0%) |
| 3 or 4 Unit Apartments | 0 (0.0%) | 94 (100.0%) |
| 5 to 9 Unit Apartments | 64 (11.3%) | 503 (88.7%) |
| 10 or more Apartments | 242 (10.5%) | 2,064 (89.5%) |
| Mobile Home / Other | 482 (73.1%) | 177 (26.9%) |
| Total | 2,432 (42.3%) | 3,319 (57.7%) |
Housing Structures by Number of Rooms in Hybla Valley
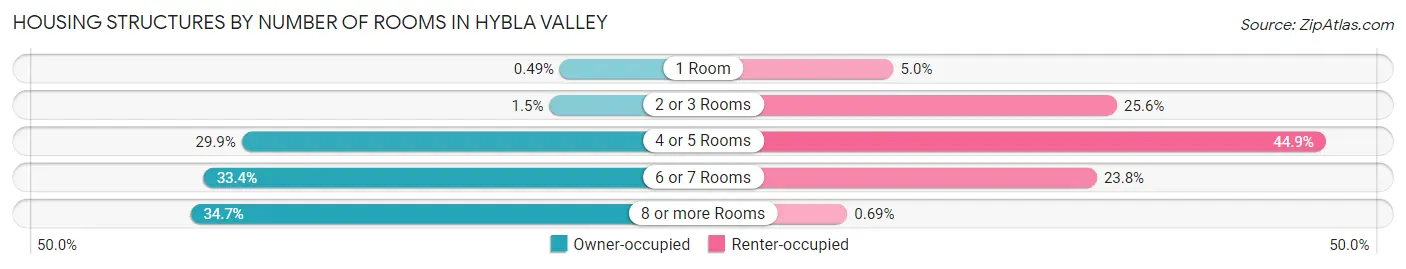
| Number of Rooms | Owner-occupied | Renter-occupied |
| 1 Room | 12 (0.5%) | 165 (5.0%) |
| 2 or 3 Rooms | 36 (1.5%) | 851 (25.6%) |
| 4 or 5 Rooms | 728 (29.9%) | 1,491 (44.9%) |
| 6 or 7 Rooms | 813 (33.4%) | 789 (23.8%) |
| 8 or more Rooms | 843 (34.7%) | 23 (0.7%) |
| Total | 2,432 (100.0%) | 3,319 (100.0%) |
Housing Structure by Heating Type in Hybla Valley
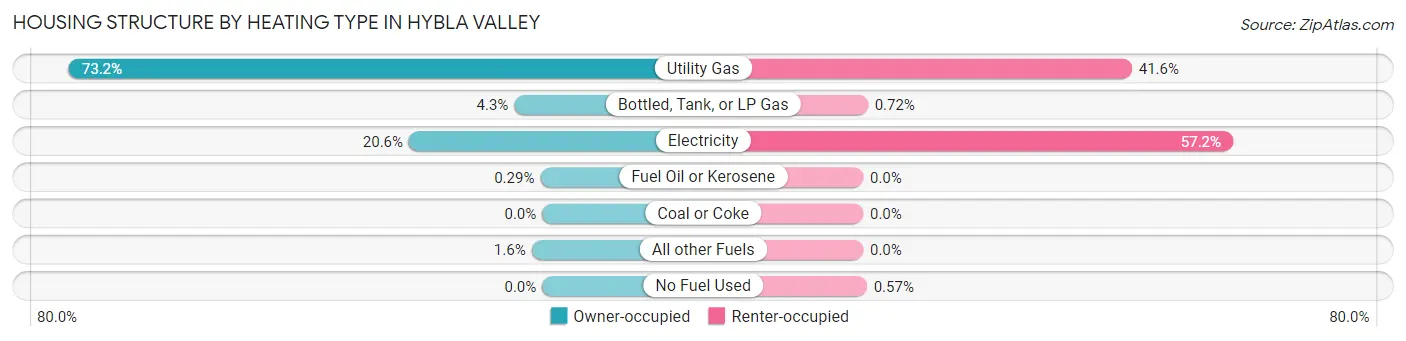
| Heating Type | Owner-occupied | Renter-occupied |
| Utility Gas | 1,779 (73.2%) | 1,379 (41.5%) |
| Bottled, Tank, or LP Gas | 105 (4.3%) | 24 (0.7%) |
| Electricity | 501 (20.6%) | 1,897 (57.2%) |
| Fuel Oil or Kerosene | 7 (0.3%) | 0 (0.0%) |
| Coal or Coke | 0 (0.0%) | 0 (0.0%) |
| All other Fuels | 40 (1.6%) | 0 (0.0%) |
| No Fuel Used | 0 (0.0%) | 19 (0.6%) |
| Total | 2,432 (100.0%) | 3,319 (100.0%) |
Household Vehicle Usage in Hybla Valley
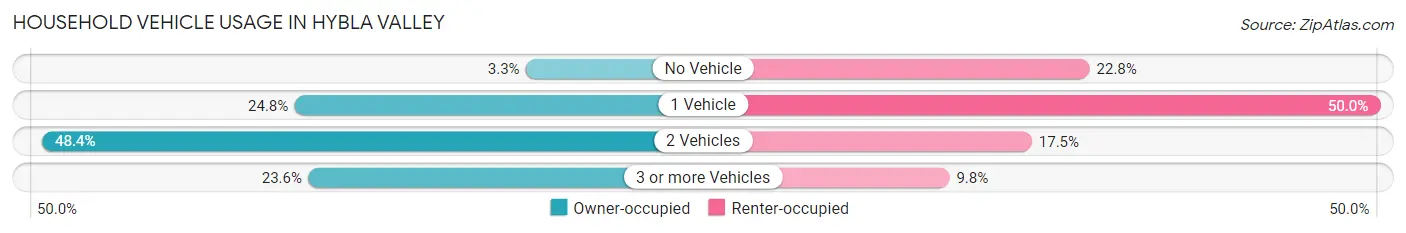
| Vehicles per Household | Owner-occupied | Renter-occupied |
| No Vehicle | 79 (3.3%) | 758 (22.8%) |
| 1 Vehicle | 604 (24.8%) | 1,658 (49.9%) |
| 2 Vehicles | 1,176 (48.4%) | 579 (17.4%) |
| 3 or more Vehicles | 573 (23.6%) | 324 (9.8%) |
| Total | 2,432 (100.0%) | 3,319 (100.0%) |
Real Estate & Mortgages in Hybla Valley
Real Estate and Mortgage Overview in Hybla Valley
| Characteristic | Without Mortgage | With Mortgage |
| Housing Units | 792 | 1,640 |
| Median Property Value | - | - |
| Median Household Income | $75,234 | $872 |
| Monthly Housing Costs | $797 | $616 |
| Real Estate Taxes | $1,946 | $94 |
Property Value by Mortgage Status in Hybla Valley
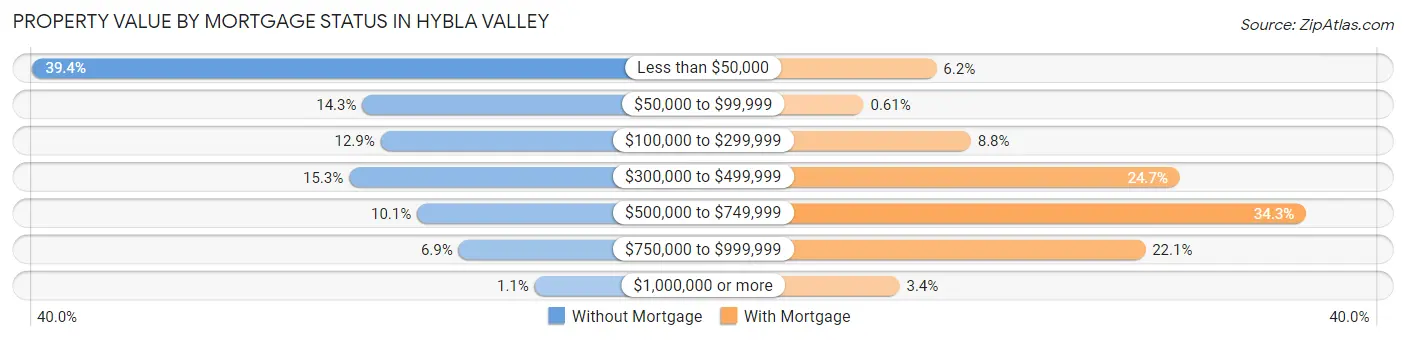
| Property Value | Without Mortgage | With Mortgage |
| Less than $50,000 | 312 (39.4%) | 101 (6.2%) |
| $50,000 to $99,999 | 113 (14.3%) | 10 (0.6%) |
| $100,000 to $299,999 | 102 (12.9%) | 144 (8.8%) |
| $300,000 to $499,999 | 121 (15.3%) | 405 (24.7%) |
| $500,000 to $749,999 | 80 (10.1%) | 563 (34.3%) |
| $750,000 to $999,999 | 55 (6.9%) | 362 (22.1%) |
| $1,000,000 or more | 9 (1.1%) | 55 (3.4%) |
| Total | 792 (100.0%) | 1,640 (100.0%) |
Household Income by Mortgage Status in Hybla Valley
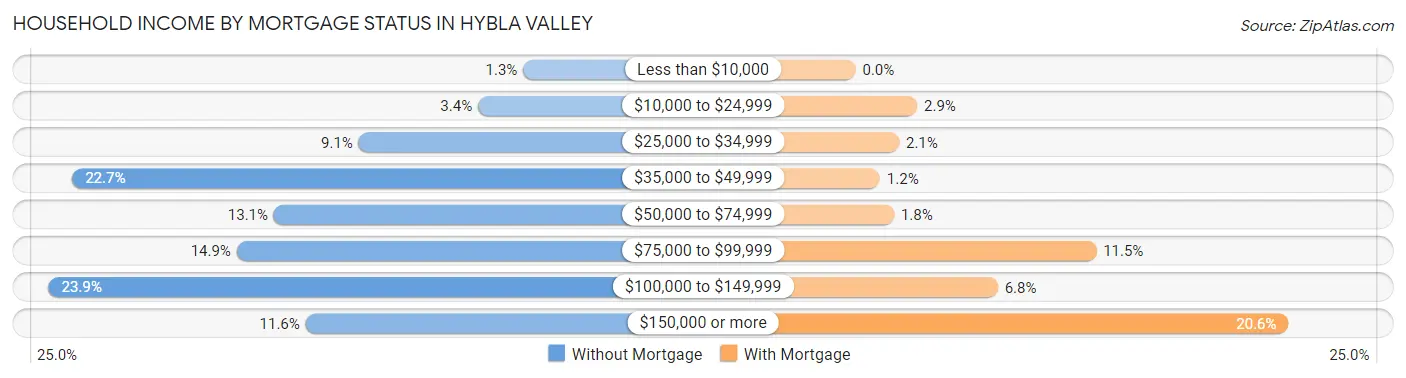
| Household Income | Without Mortgage | With Mortgage |
| Less than $10,000 | 10 (1.3%) | 0 (0.0%) |
| $10,000 to $24,999 | 27 (3.4%) | 48 (2.9%) |
| $25,000 to $34,999 | 72 (9.1%) | 34 (2.1%) |
| $35,000 to $49,999 | 180 (22.7%) | 19 (1.2%) |
| $50,000 to $74,999 | 104 (13.1%) | 30 (1.8%) |
| $75,000 to $99,999 | 118 (14.9%) | 188 (11.5%) |
| $100,000 to $149,999 | 189 (23.9%) | 111 (6.8%) |
| $150,000 or more | 92 (11.6%) | 338 (20.6%) |
| Total | 792 (100.0%) | 1,640 (100.0%) |
Property Value to Household Income Ratio in Hybla Valley
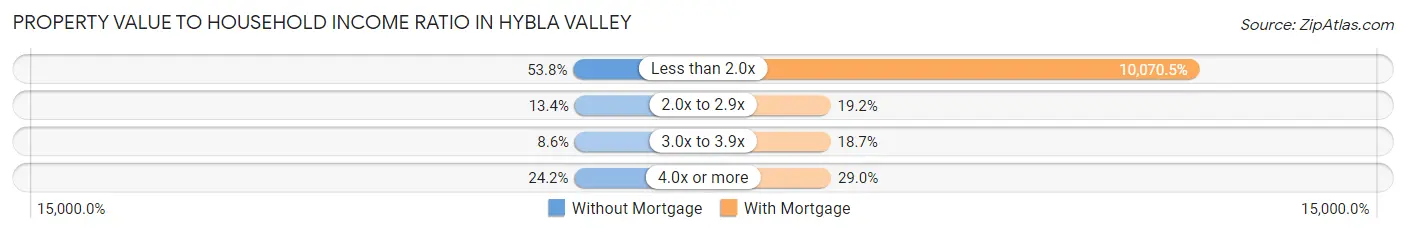
| Value-to-Income Ratio | Without Mortgage | With Mortgage |
| Less than 2.0x | 426 (53.8%) | 165,156 (10,070.5%) |
| 2.0x to 2.9x | 106 (13.4%) | 314 (19.2%) |
| 3.0x to 3.9x | 68 (8.6%) | 307 (18.7%) |
| 4.0x or more | 192 (24.2%) | 476 (29.0%) |
| Total | 792 (100.0%) | 1,640 (100.0%) |
Real Estate Taxes by Mortgage Status in Hybla Valley
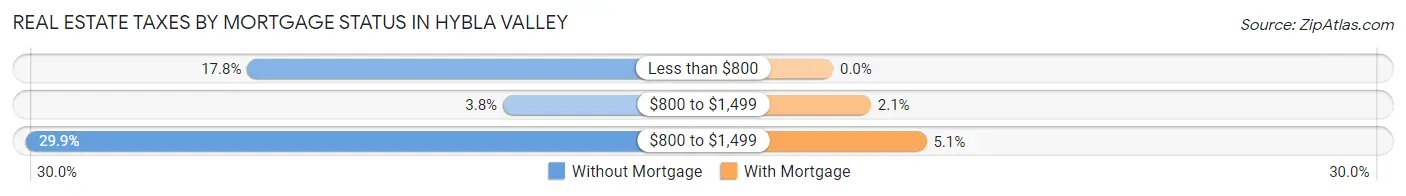
| Property Taxes | Without Mortgage | With Mortgage |
| Less than $800 | 141 (17.8%) | 0 (0.0%) |
| $800 to $1,499 | 30 (3.8%) | 34 (2.1%) |
| $800 to $1,499 | 237 (29.9%) | 84 (5.1%) |
| Total | 792 (100.0%) | 1,640 (100.0%) |
Health & Disability in Hybla Valley
Health Insurance Coverage by Age in Hybla Valley
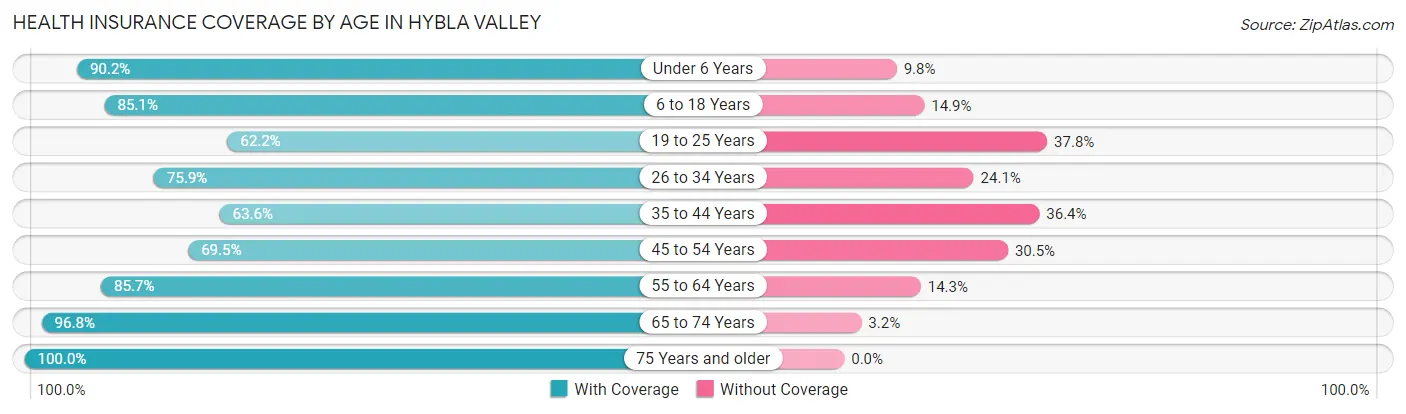
| Age Bracket | With Coverage | Without Coverage |
| Under 6 Years | 1,976 (90.2%) | 214 (9.8%) |
| 6 to 18 Years | 3,040 (85.1%) | 533 (14.9%) |
| 19 to 25 Years | 1,124 (62.2%) | 684 (37.8%) |
| 26 to 34 Years | 1,526 (75.9%) | 485 (24.1%) |
| 35 to 44 Years | 1,411 (63.6%) | 807 (36.4%) |
| 45 to 54 Years | 1,302 (69.5%) | 572 (30.5%) |
| 55 to 64 Years | 1,802 (85.7%) | 300 (14.3%) |
| 65 to 74 Years | 1,306 (96.8%) | 43 (3.2%) |
| 75 Years and older | 536 (100.0%) | 0 (0.0%) |
| Total | 14,023 (79.4%) | 3,638 (20.6%) |
Health Insurance Coverage by Citizenship Status in Hybla Valley
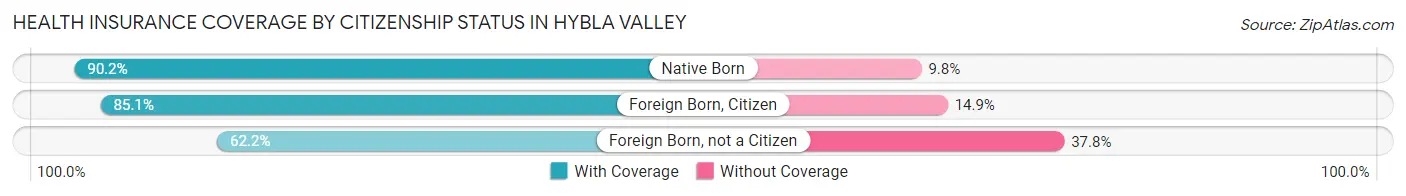
| Citizenship Status | With Coverage | Without Coverage |
| Native Born | 1,976 (90.2%) | 214 (9.8%) |
| Foreign Born, Citizen | 3,040 (85.1%) | 533 (14.9%) |
| Foreign Born, not a Citizen | 1,124 (62.2%) | 684 (37.8%) |
Health Insurance Coverage by Household Income in Hybla Valley
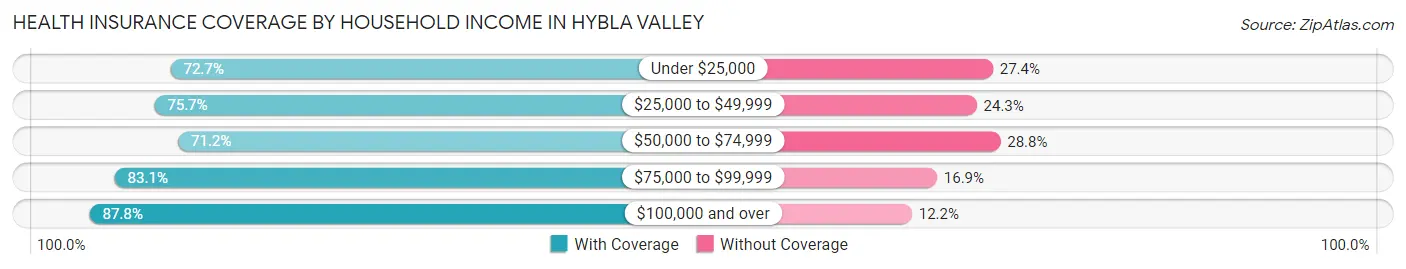
| Household Income | With Coverage | Without Coverage |
| Under $25,000 | 2,253 (72.7%) | 848 (27.4%) |
| $25,000 to $49,999 | 2,605 (75.7%) | 837 (24.3%) |
| $50,000 to $74,999 | 2,408 (71.2%) | 972 (28.8%) |
| $75,000 to $99,999 | 655 (83.1%) | 133 (16.9%) |
| $100,000 and over | 6,081 (87.8%) | 843 (12.2%) |
Public vs Private Health Insurance Coverage by Age in Hybla Valley

| Age Bracket | Public Insurance | Private Insurance |
| Under 6 | 1,413 (64.5%) | 563 (25.7%) |
| 6 to 18 Years | 2,003 (56.1%) | 1,296 (36.3%) |
| 19 to 25 Years | 390 (21.6%) | 745 (41.2%) |
| 25 to 34 Years | 316 (15.7%) | 1,210 (60.2%) |
| 35 to 44 Years | 219 (9.9%) | 1,317 (59.4%) |
| 45 to 54 Years | 377 (20.1%) | 972 (51.9%) |
| 55 to 64 Years | 421 (20.0%) | 1,485 (70.7%) |
| 65 to 74 Years | 1,194 (88.5%) | 963 (71.4%) |
| 75 Years and over | 536 (100.0%) | 300 (56.0%) |
| Total | 6,869 (38.9%) | 8,851 (50.1%) |
Disability Status by Sex by Age in Hybla Valley
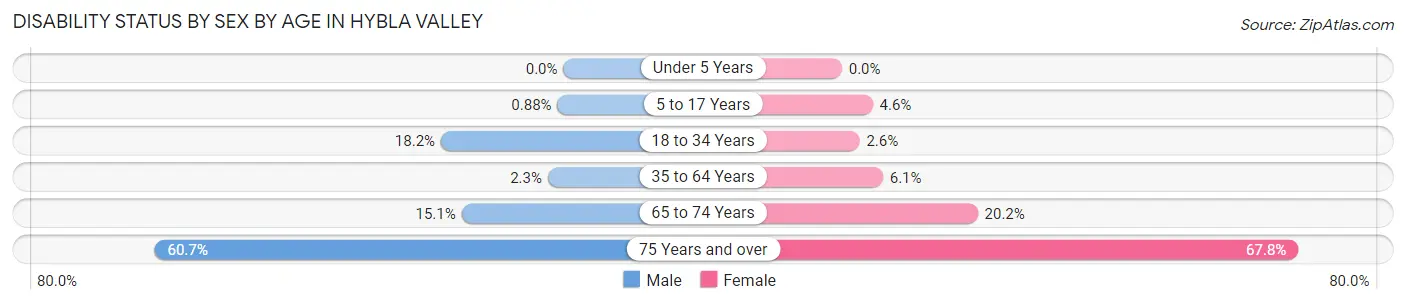
| Age Bracket | Male | Female |
| Under 5 Years | 0 (0.0%) | 0 (0.0%) |
| 5 to 17 Years | 16 (0.9%) | 78 (4.6%) |
| 18 to 34 Years | 340 (18.2%) | 57 (2.6%) |
| 35 to 64 Years | 65 (2.3%) | 206 (6.1%) |
| 65 to 74 Years | 96 (15.1%) | 144 (20.2%) |
| 75 Years and over | 122 (60.7%) | 227 (67.8%) |
Disability Class by Sex by Age in Hybla Valley
Disability Class: Hearing Difficulty
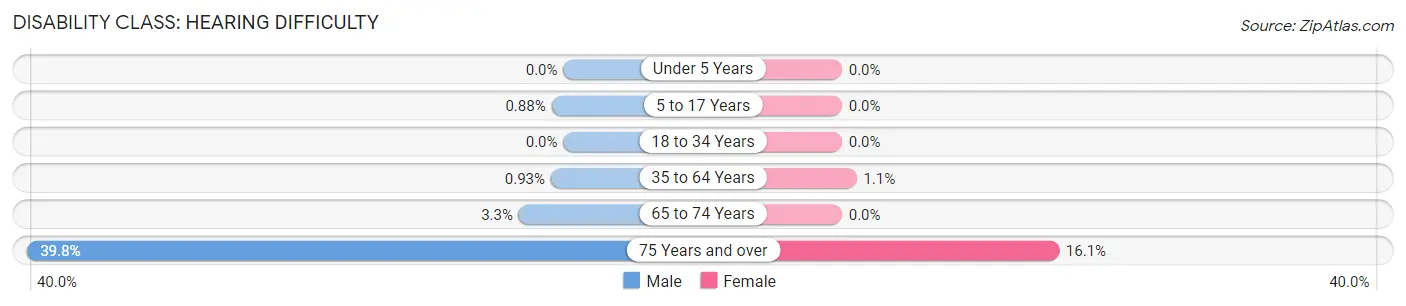
| Age Bracket | Male | Female |
| Under 5 Years | 0 (0.0%) | 0 (0.0%) |
| 5 to 17 Years | 16 (0.9%) | 0 (0.0%) |
| 18 to 34 Years | 0 (0.0%) | 0 (0.0%) |
| 35 to 64 Years | 26 (0.9%) | 37 (1.1%) |
| 65 to 74 Years | 21 (3.3%) | 0 (0.0%) |
| 75 Years and over | 80 (39.8%) | 54 (16.1%) |
Disability Class: Vision Difficulty
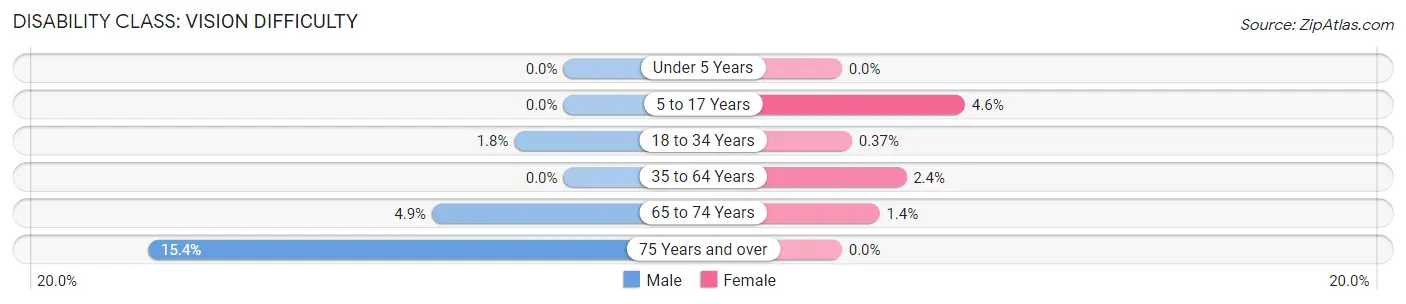
| Age Bracket | Male | Female |
| Under 5 Years | 0 (0.0%) | 0 (0.0%) |
| 5 to 17 Years | 0 (0.0%) | 78 (4.6%) |
| 18 to 34 Years | 34 (1.8%) | 8 (0.4%) |
| 35 to 64 Years | 0 (0.0%) | 81 (2.4%) |
| 65 to 74 Years | 31 (4.9%) | 10 (1.4%) |
| 75 Years and over | 31 (15.4%) | 0 (0.0%) |
Disability Class: Cognitive Difficulty
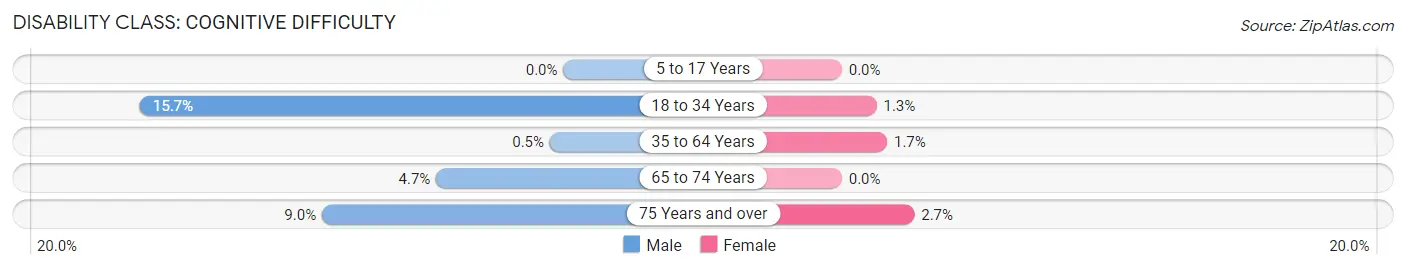
| Age Bracket | Male | Female |
| 5 to 17 Years | 0 (0.0%) | 0 (0.0%) |
| 18 to 34 Years | 294 (15.7%) | 28 (1.3%) |
| 35 to 64 Years | 14 (0.5%) | 57 (1.7%) |
| 65 to 74 Years | 30 (4.7%) | 0 (0.0%) |
| 75 Years and over | 18 (9.0%) | 9 (2.7%) |
Disability Class: Ambulatory Difficulty
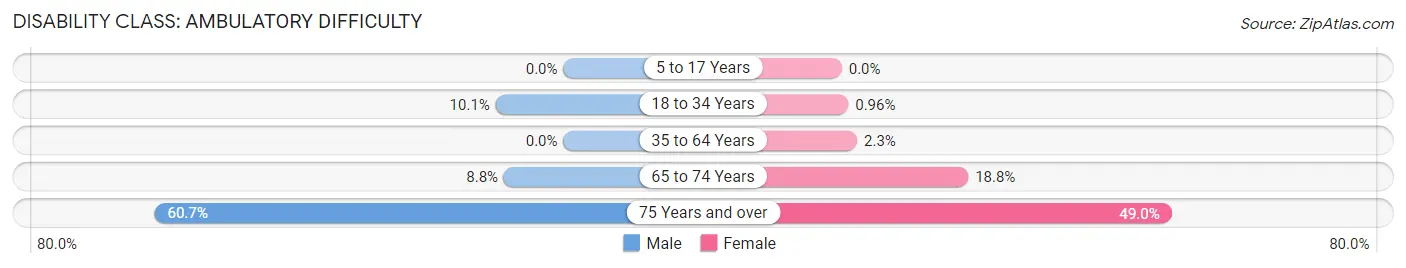
| Age Bracket | Male | Female |
| 5 to 17 Years | 0 (0.0%) | 0 (0.0%) |
| 18 to 34 Years | 188 (10.1%) | 21 (1.0%) |
| 35 to 64 Years | 0 (0.0%) | 77 (2.3%) |
| 65 to 74 Years | 56 (8.8%) | 134 (18.8%) |
| 75 Years and over | 122 (60.7%) | 164 (49.0%) |
Disability Class: Self-Care Difficulty
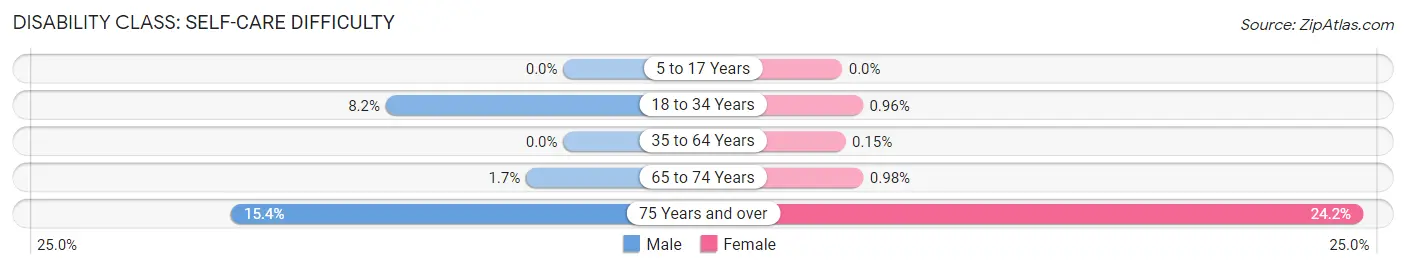
| Age Bracket | Male | Female |
| 5 to 17 Years | 0 (0.0%) | 0 (0.0%) |
| 18 to 34 Years | 154 (8.2%) | 21 (1.0%) |
| 35 to 64 Years | 0 (0.0%) | 5 (0.2%) |
| 65 to 74 Years | 11 (1.7%) | 7 (1.0%) |
| 75 Years and over | 31 (15.4%) | 81 (24.2%) |
Technology Access in Hybla Valley
Computing Device Access in Hybla Valley
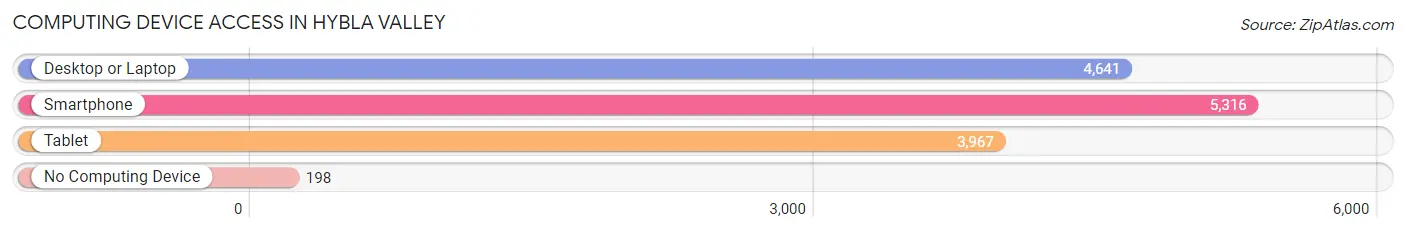
| Device Type | # Households | % Households |
| Desktop or Laptop | 4,641 | 80.7% |
| Smartphone | 5,316 | 92.4% |
| Tablet | 3,967 | 69.0% |
| No Computing Device | 198 | 3.4% |
| Total | 5,751 | 100.0% |
Internet Access in Hybla Valley
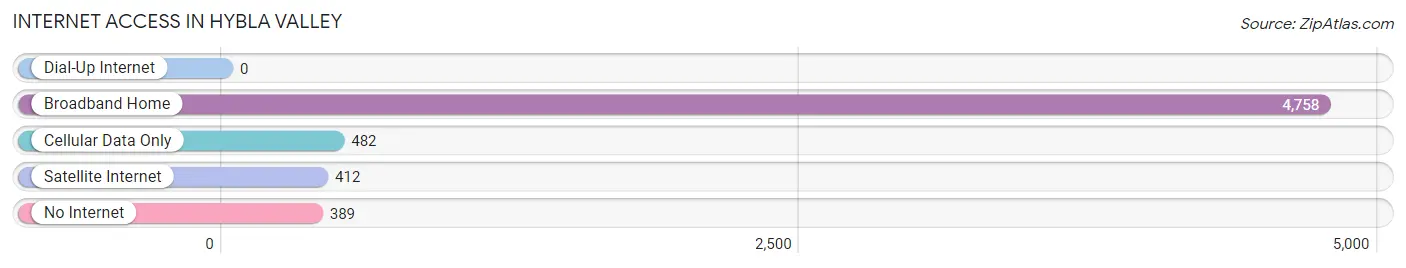
| Internet Type | # Households | % Households |
| Dial-Up Internet | 0 | 0.0% |
| Broadband Home | 4,758 | 82.7% |
| Cellular Data Only | 482 | 8.4% |
| Satellite Internet | 412 | 7.2% |
| No Internet | 389 | 6.8% |
| Total | 5,751 | 100.0% |
Hybla Valley Summary
Hybla Valley is a census-designated place (CDP) located in Fairfax County, Virginia. It is situated in the southeastern portion of the county, approximately 15 miles south of Washington, D.C. The population of Hybla Valley was estimated to be 15,845 in 2019.
History
Hybla Valley was first settled in the late 1700s by the Hybla family, who were of German descent. The family owned a large tract of land in the area, which was known as Hybla Valley Farm. The area was primarily used for farming and raising livestock. In the early 1900s, the area began to develop as a residential community. The first post office was established in the area in 1908.
In the 1950s, the area began to experience rapid growth due to its proximity to Washington, D.C. and the development of the Washington Metro. The area was officially designated as a census-designated place in 1980.
Geography
Hybla Valley is located in southeastern Fairfax County, Virginia. It is situated approximately 15 miles south of Washington, D.C. The area is bordered by the cities of Alexandria and Fairfax to the north, and the towns of Franconia and Lorton to the south.
The area is primarily composed of residential neighborhoods, with some commercial and industrial development. The area is served by the Washington Metro, with the Huntington station located in the center of the CDP.
Economy
The economy of Hybla Valley is primarily driven by the service industry. The area is home to a number of restaurants, retail stores, and other businesses. The area is also home to a number of government contractors, including Northrop Grumman and Lockheed Martin.
Demographics
The population of Hybla Valley was estimated to be 15,845 in 2019. The population is primarily composed of white (77.3%) and African American (14.2%) residents. The median household income is $90,945, and the median home value is $521,000. The area is served by the Fairfax County Public Schools system.
Common Questions
What is Per Capita Income in Hybla Valley?
Per Capita income in Hybla Valley is $32,050.
What is the Median Family Income in Hybla Valley?
Median Family Income in Hybla Valley is $69,244.
What is the Median Household income in Hybla Valley?
Median Household Income in Hybla Valley is $65,843.
What is Income or Wage Gap in Hybla Valley?
Income or Wage Gap in Hybla Valley is 14.7%.
Women in Hybla Valley earn 85.3 cents for every dollar earned by a man.
What is Family Income Deficit in Hybla Valley?
Family Income Deficit in Hybla Valley is $14,076.
Families that are below poverty line in Hybla Valley earn $14,076 less on average than the poverty threshold level.
What is Inequality or Gini Index in Hybla Valley?
Inequality or Gini Index in Hybla Valley is 0.48.
What is the Total Population of Hybla Valley?
Total Population of Hybla Valley is 18,104.
What is the Total Male Population of Hybla Valley?
Total Male Population of Hybla Valley is 8,318.
What is the Total Female Population of Hybla Valley?
Total Female Population of Hybla Valley is 9,786.
What is the Ratio of Males per 100 Females in Hybla Valley?
There are 85.00 Males per 100 Females in Hybla Valley.
What is the Ratio of Females per 100 Males in Hybla Valley?
There are 117.65 Females per 100 Males in Hybla Valley.
What is the Median Population Age in Hybla Valley?
Median Population Age in Hybla Valley is 33.0 Years.
What is the Average Family Size in Hybla Valley
Average Family Size in Hybla Valley is 3.8 People.
What is the Average Household Size in Hybla Valley
Average Household Size in Hybla Valley is 3.1 People.
How Large is the Labor Force in Hybla Valley?
There are 8,845 People in the Labor Forcein in Hybla Valley.
What is the Percentage of People in the Labor Force in Hybla Valley?
67.1% of People are in the Labor Force in Hybla Valley.
What is the Unemployment Rate in Hybla Valley?
Unemployment Rate in Hybla Valley is 6.4%.