Sudley, VA Map & Demographics
Sudley Map
Sudley Overview
$30,488
PER CAPITA INCOME
$85,568
AVG FAMILY INCOME
$87,628
AVG HOUSEHOLD INCOME
43.3%
WAGE / INCOME GAP [ % ]
56.7¢/ $1
WAGE / INCOME GAP [ $ ]
0.37
INEQUALITY / GINI INDEX
19,289
TOTAL POPULATION
10,320
MALE POPULATION
8,969
FEMALE POPULATION
115.06
MALES / 100 FEMALES
86.91
FEMALES / 100 MALES
33.4
MEDIAN AGE
4.0
AVG FAMILY SIZE
3.5
AVG HOUSEHOLD SIZE
10,327
LABOR FORCE [ PEOPLE ]
73.3%
PERCENT IN LABOR FORCE
4.0%
UNEMPLOYMENT RATE
Income in Sudley
Income Overview in Sudley
Per Capita Income in Sudley is $30,488, while median incomes of families and households are $85,568 and $87,628 respectively.
| Characteristic | Number | Measure |
| Per Capita Income | 19,289 | $30,488 |
| Median Family Income | 3,832 | $85,568 |
| Mean Family Income | 3,832 | $103,609 |
| Median Household Income | 5,415 | $87,628 |
| Mean Household Income | 5,415 | $101,252 |
| Income Deficit | 3,832 | $0 |
| Wage / Income Gap (%) | 19,289 | 43.32% |
| Wage / Income Gap ($) | 19,289 | 56.68¢ per $1 |
| Gini / Inequality Index | 19,289 | 0.37 |
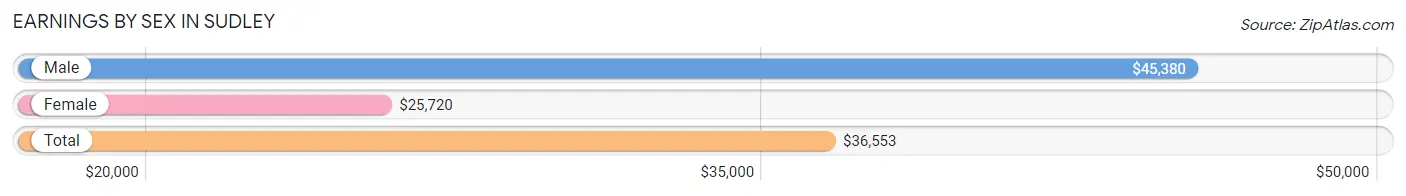
Earnings by Sex in Sudley
Average Earnings in Sudley are $36,553, $45,380 for men and $25,720 for women, a difference of 43.3%.
| Sex | Number | Average Earnings |
| Male | 6,336 (60.8%) | $45,380 |
| Female | 4,085 (39.2%) | $25,720 |
| Total | 10,421 (100.0%) | $36,553 |
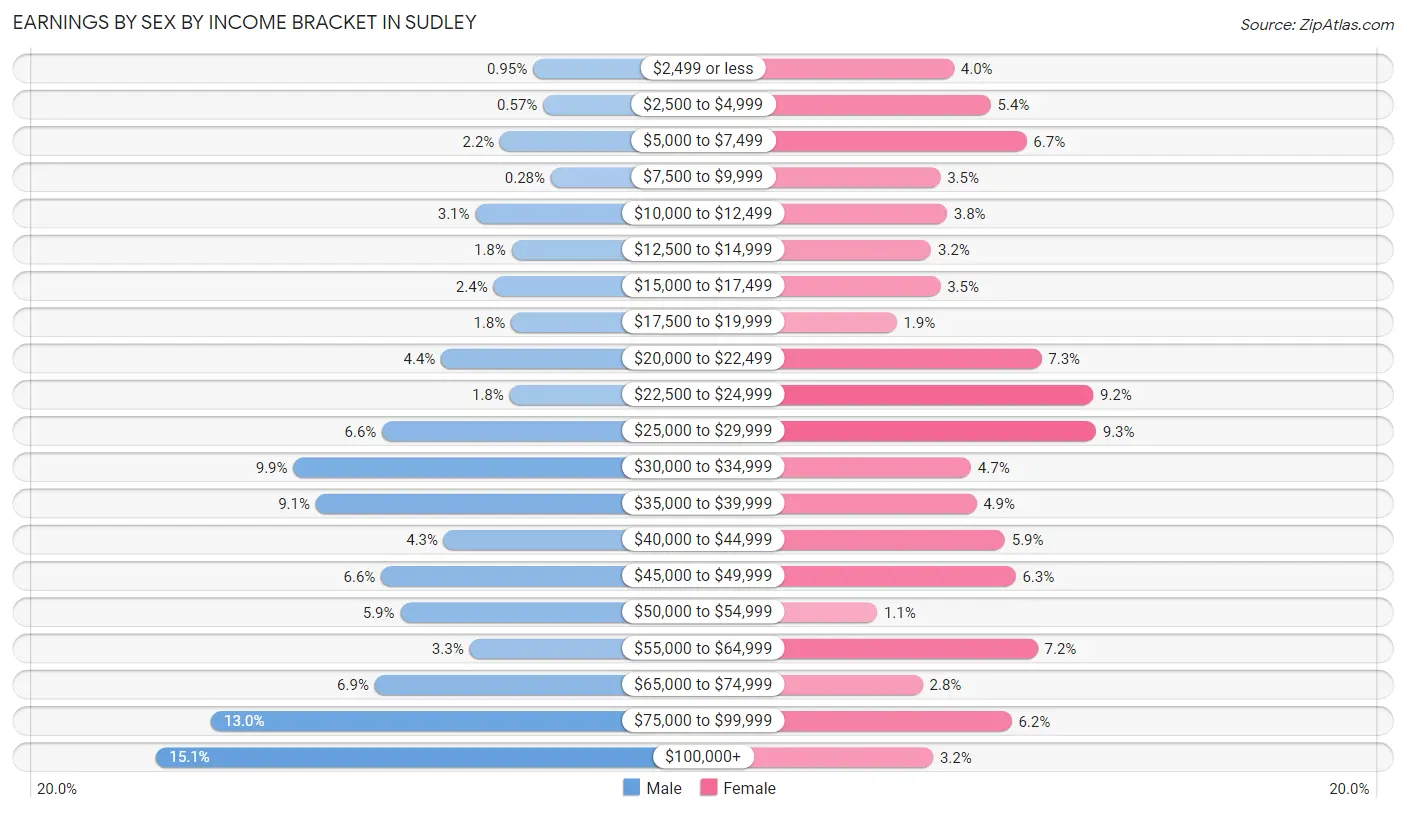
Earnings by Sex by Income Bracket in Sudley
The most common earnings brackets in Sudley are $100,000+ for men (954 | 15.1%) and $25,000 to $29,999 for women (381 | 9.3%).
| Income | Male | Female |
| $2,499 or less | 60 (0.9%) | 164 (4.0%) |
| $2,500 to $4,999 | 36 (0.6%) | 220 (5.4%) |
| $5,000 to $7,499 | 138 (2.2%) | 275 (6.7%) |
| $7,500 to $9,999 | 18 (0.3%) | 143 (3.5%) |
| $10,000 to $12,499 | 197 (3.1%) | 153 (3.7%) |
| $12,500 to $14,999 | 111 (1.8%) | 129 (3.2%) |
| $15,000 to $17,499 | 154 (2.4%) | 143 (3.5%) |
| $17,500 to $19,999 | 112 (1.8%) | 76 (1.9%) |
| $20,000 to $22,499 | 278 (4.4%) | 298 (7.3%) |
| $22,500 to $24,999 | 116 (1.8%) | 377 (9.2%) |
| $25,000 to $29,999 | 418 (6.6%) | 381 (9.3%) |
| $30,000 to $34,999 | 629 (9.9%) | 190 (4.6%) |
| $35,000 to $39,999 | 576 (9.1%) | 198 (4.9%) |
| $40,000 to $44,999 | 272 (4.3%) | 242 (5.9%) |
| $45,000 to $49,999 | 421 (6.6%) | 258 (6.3%) |
| $50,000 to $54,999 | 375 (5.9%) | 46 (1.1%) |
| $55,000 to $64,999 | 211 (3.3%) | 292 (7.1%) |
| $65,000 to $74,999 | 436 (6.9%) | 116 (2.8%) |
| $75,000 to $99,999 | 824 (13.0%) | 252 (6.2%) |
| $100,000+ | 954 (15.1%) | 132 (3.2%) |
| Total | 6,336 (100.0%) | 4,085 (100.0%) |
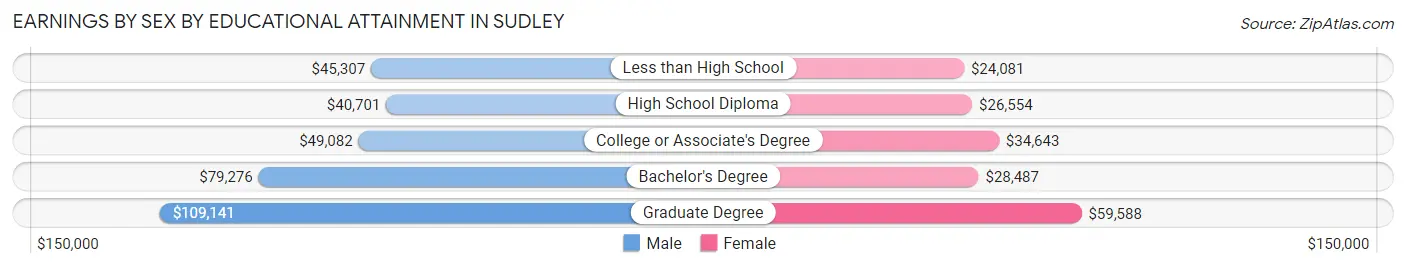
Earnings by Sex by Educational Attainment in Sudley
Average earnings in Sudley are $50,088 for men and $29,061 for women, a difference of 42.0%. Men with an educational attainment of graduate degree enjoy the highest average annual earnings of $109,141, while those with high school diploma education earn the least with $40,701. Women with an educational attainment of graduate degree earn the most with the average annual earnings of $59,588, while those with less than high school education have the smallest earnings of $24,081.
| Educational Attainment | Male Income | Female Income |
| Less than High School | $45,307 | $24,081 |
| High School Diploma | $40,701 | $26,554 |
| College or Associate's Degree | $49,082 | $34,643 |
| Bachelor's Degree | $79,276 | $28,487 |
| Graduate Degree | $109,141 | $59,588 |
| Total | $50,088 | $29,061 |
Family Income in Sudley
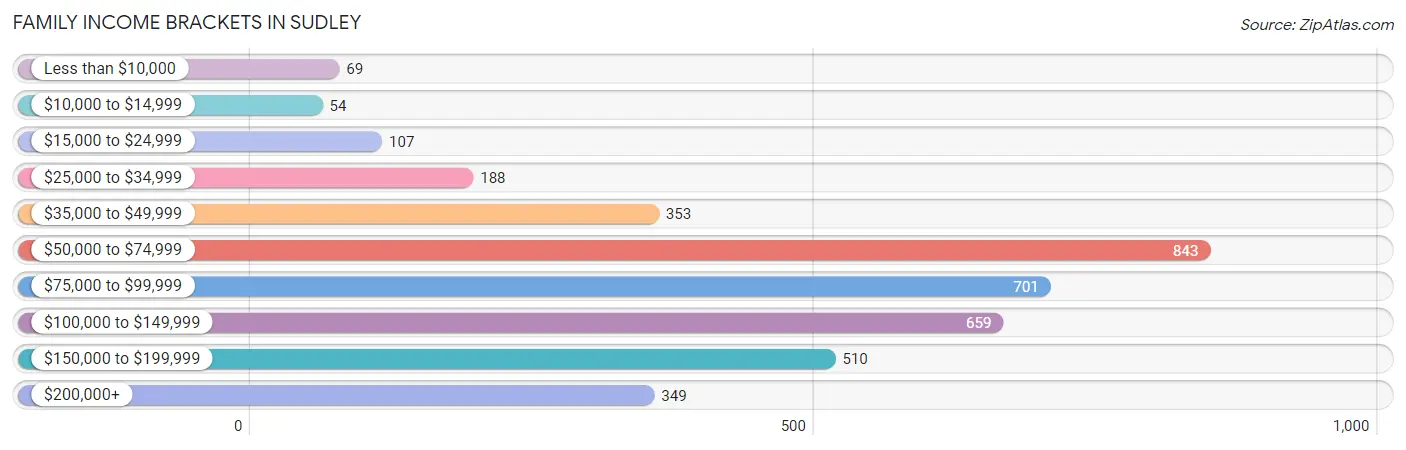
Family Income Brackets in Sudley
According to the Sudley family income data, there are 843 families falling into the $50,000 to $74,999 income range, which is the most common income bracket and makes up 22.0% of all families. Conversely, the $10,000 to $14,999 income bracket is the least frequent group with only 54 families (1.4%) belonging to this category.
| Income Bracket | # Families | % Families |
| Less than $10,000 | 69 | 1.8% |
| $10,000 to $14,999 | 54 | 1.4% |
| $15,000 to $24,999 | 107 | 2.8% |
| $25,000 to $34,999 | 188 | 4.9% |
| $35,000 to $49,999 | 353 | 9.2% |
| $50,000 to $74,999 | 843 | 22.0% |
| $75,000 to $99,999 | 701 | 18.3% |
| $100,000 to $149,999 | 659 | 17.2% |
| $150,000 to $199,999 | 510 | 13.3% |
| $200,000+ | 349 | 9.1% |
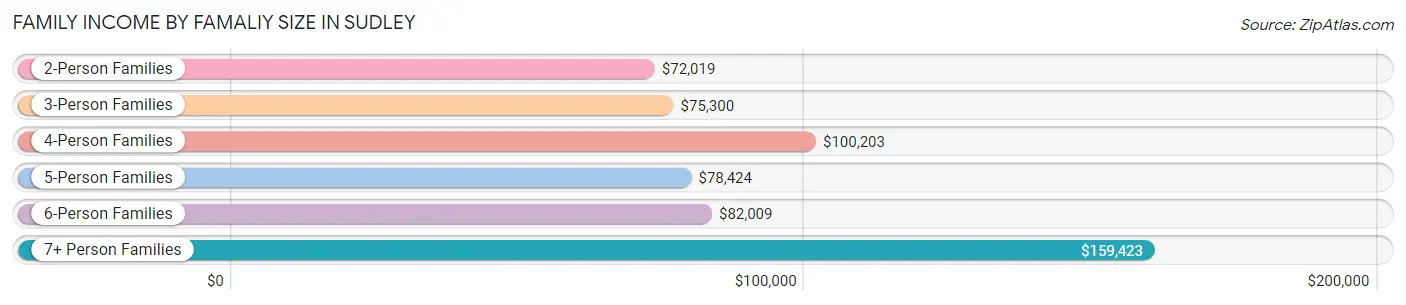
Family Income by Famaliy Size in Sudley
7+ person families (142 | 3.7%) account for the highest median family income in Sudley with $159,423 per family, while 2-person families (828 | 21.6%) have the highest median income of $36,010 per family member.
| Income Bracket | # Families | Median Income |
| 2-Person Families | 828 (21.6%) | $72,019 |
| 3-Person Families | 932 (24.3%) | $75,300 |
| 4-Person Families | 1,068 (27.9%) | $100,203 |
| 5-Person Families | 399 (10.4%) | $78,424 |
| 6-Person Families | 463 (12.1%) | $82,009 |
| 7+ Person Families | 142 (3.7%) | $159,423 |
| Total | 3,832 (100.0%) | $85,568 |
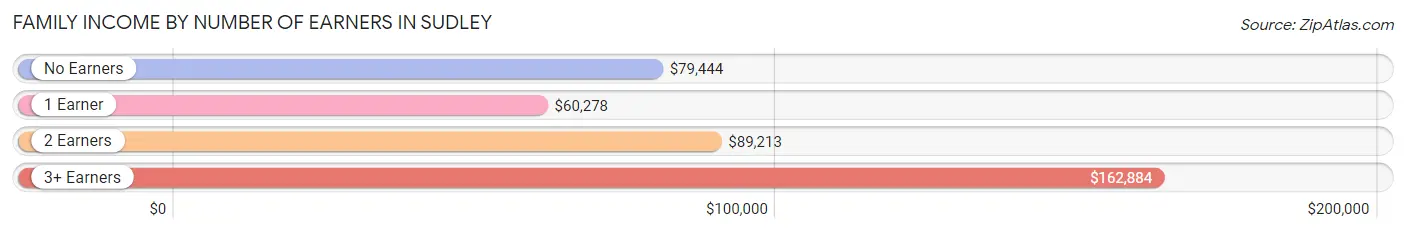
Family Income by Number of Earners in Sudley
The median family income in Sudley is $85,568, with families comprising 3+ earners (563) having the highest median family income of $162,884, while families with 1 earner (1,078) have the lowest median family income of $60,278, accounting for 14.7% and 28.1% of families, respectively.
| Number of Earners | # Families | Median Income |
| No Earners | 170 (4.4%) | $79,444 |
| 1 Earner | 1,078 (28.1%) | $60,278 |
| 2 Earners | 2,021 (52.7%) | $89,213 |
| 3+ Earners | 563 (14.7%) | $162,884 |
| Total | 3,832 (100.0%) | $85,568 |
Household Income in Sudley
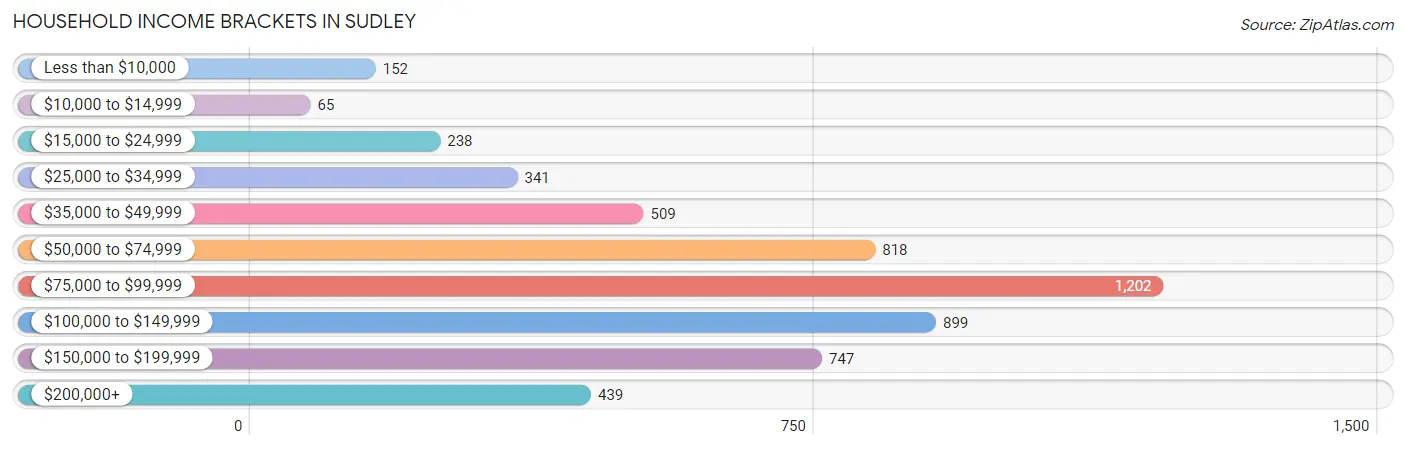
Household Income Brackets in Sudley
With 1,202 households falling in the category, the $75,000 to $99,999 income range is the most frequent in Sudley, accounting for 22.2% of all households. In contrast, only 65 households (1.2%) fall into the $10,000 to $14,999 income bracket, making it the least populous group.
| Income Bracket | # Households | % Households |
| Less than $10,000 | 152 | 2.8% |
| $10,000 to $14,999 | 65 | 1.2% |
| $15,000 to $24,999 | 238 | 4.4% |
| $25,000 to $34,999 | 341 | 6.3% |
| $35,000 to $49,999 | 509 | 9.4% |
| $50,000 to $74,999 | 818 | 15.1% |
| $75,000 to $99,999 | 1,202 | 22.2% |
| $100,000 to $149,999 | 899 | 16.6% |
| $150,000 to $199,999 | 747 | 13.8% |
| $200,000+ | 439 | 8.1% |
Household Income by Householder Age in Sudley
The median household income in Sudley is $87,628, with the highest median household income of $95,563 found in the 45 to 64 years age bracket for the primary householder. A total of 1,875 households (34.6%) fall into this category. Meanwhile, the 15 to 24 years age bracket for the primary householder has the lowest median household income of $0, with 100 households (1.8%) in this group.
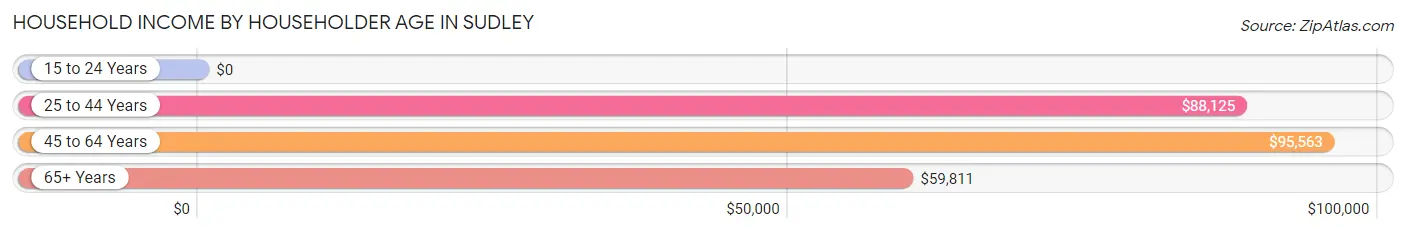
| Income Bracket | # Households | Median Income |
| 15 to 24 Years | 100 (1.8%) | $0 |
| 25 to 44 Years | 2,551 (47.1%) | $88,125 |
| 45 to 64 Years | 1,875 (34.6%) | $95,563 |
| 65+ Years | 889 (16.4%) | $59,811 |
| Total | 5,415 (100.0%) | $87,628 |
Poverty in Sudley
Income Below Poverty by Sex and Age in Sudley
With 4.4% poverty level for males and 11.4% for females among the residents of Sudley, 16 and 17 year old males and 16 and 17 year old females are the most vulnerable to poverty, with 69 males (42.1%) and 29 females (26.9%) in their respective age groups living below the poverty level.
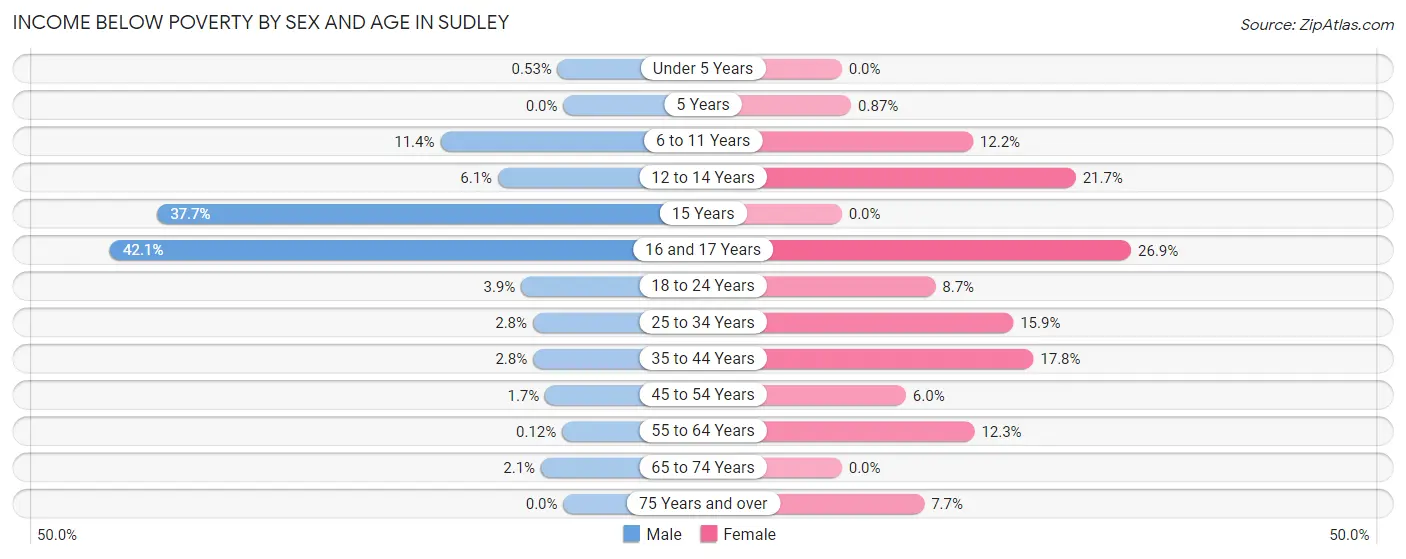
| Age Bracket | Male | Female |
| Under 5 Years | 5 (0.5%) | 0 (0.0%) |
| 5 Years | 0 (0.0%) | 1 (0.9%) |
| 6 to 11 Years | 107 (11.4%) | 103 (12.2%) |
| 12 to 14 Years | 25 (6.1%) | 117 (21.7%) |
| 15 Years | 75 (37.7%) | 0 (0.0%) |
| 16 and 17 Years | 69 (42.1%) | 29 (26.9%) |
| 18 to 24 Years | 30 (3.9%) | 50 (8.7%) |
| 25 to 34 Years | 46 (2.8%) | 244 (15.9%) |
| 35 to 44 Years | 50 (2.8%) | 266 (17.8%) |
| 45 to 54 Years | 24 (1.7%) | 56 (5.9%) |
| 55 to 64 Years | 1 (0.1%) | 96 (12.3%) |
| 65 to 74 Years | 12 (2.1%) | 0 (0.0%) |
| 75 Years and over | 0 (0.0%) | 31 (7.6%) |
| Total | 444 (4.4%) | 993 (11.4%) |
Income Above Poverty by Sex and Age in Sudley
According to the poverty statistics in Sudley, males aged 5 years and females aged under 5 years are the age groups that are most secure financially, with 100.0% of males and 100.0% of females in these age groups living above the poverty line.
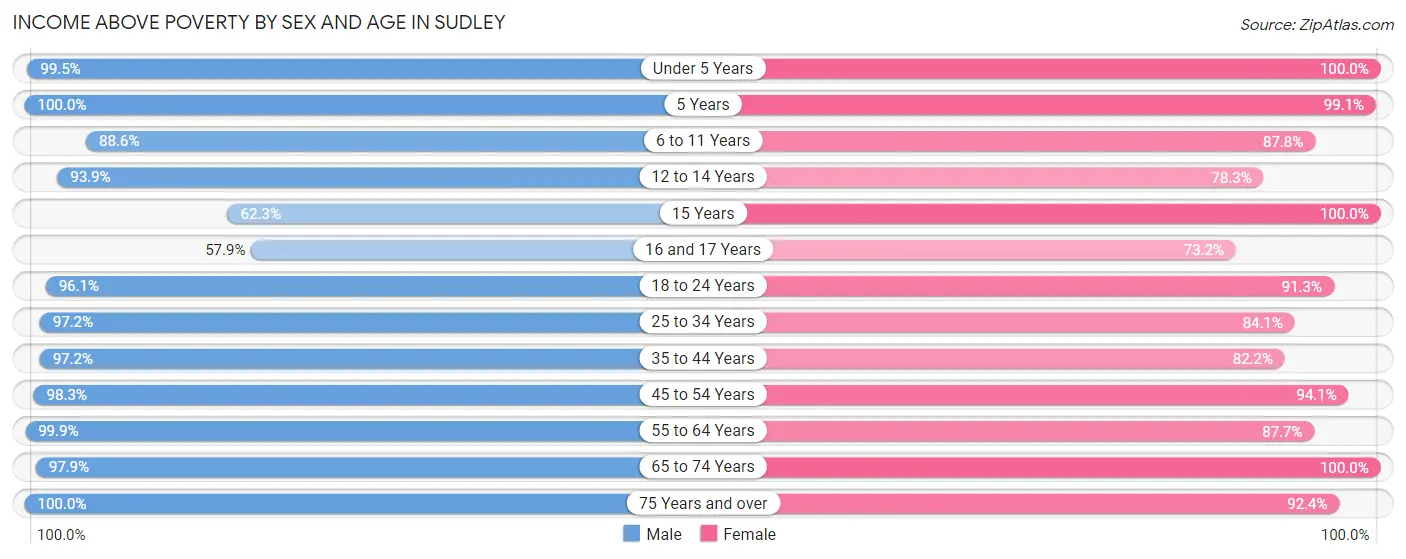
| Age Bracket | Male | Female |
| Under 5 Years | 936 (99.5%) | 682 (100.0%) |
| 5 Years | 128 (100.0%) | 114 (99.1%) |
| 6 to 11 Years | 830 (88.6%) | 743 (87.8%) |
| 12 to 14 Years | 387 (93.9%) | 422 (78.3%) |
| 15 Years | 124 (62.3%) | 52 (100.0%) |
| 16 and 17 Years | 95 (57.9%) | 79 (73.2%) |
| 18 to 24 Years | 736 (96.1%) | 526 (91.3%) |
| 25 to 34 Years | 1,581 (97.2%) | 1,290 (84.1%) |
| 35 to 44 Years | 1,731 (97.2%) | 1,230 (82.2%) |
| 45 to 54 Years | 1,392 (98.3%) | 885 (94.1%) |
| 55 to 64 Years | 826 (99.9%) | 684 (87.7%) |
| 65 to 74 Years | 566 (97.9%) | 670 (100.0%) |
| 75 Years and over | 377 (100.0%) | 374 (92.3%) |
| Total | 9,709 (95.6%) | 7,751 (88.6%) |
Income Below Poverty Among Married-Couple Families in Sudley
The poverty statistics for married-couple families in Sudley show that 2.1% or 56 of the total 2,636 families live below the poverty line. Families with 3 or 4 children have the highest poverty rate of 12.5%, comprising of 44 families. On the other hand, families with 1 or 2 children have the lowest poverty rate of 0.0%, which includes 0 families.
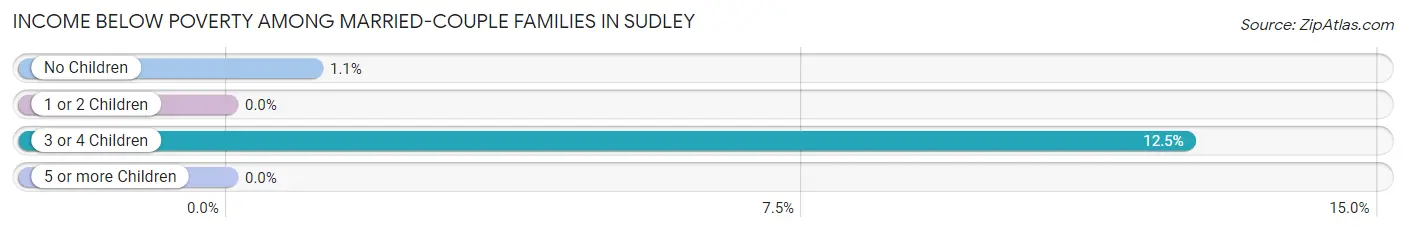
| Children | Above Poverty | Below Poverty |
| No Children | 1,066 (98.9%) | 12 (1.1%) |
| 1 or 2 Children | 1,179 (100.0%) | 0 (0.0%) |
| 3 or 4 Children | 308 (87.5%) | 44 (12.5%) |
| 5 or more Children | 27 (100.0%) | 0 (0.0%) |
| Total | 2,580 (97.9%) | 56 (2.1%) |
Income Below Poverty Among Single-Parent Households in Sudley
According to the poverty data in Sudley, 3.1% or 19 single-father households and 24.2% or 142 single-mother households are living below the poverty line. Among single-father households, those with no children have the highest poverty rate, with 19 households (7.5%) experiencing poverty. Likewise, among single-mother households, those with 3 or 4 children have the highest poverty rate, with 50 households (52.1%) falling below the poverty line.
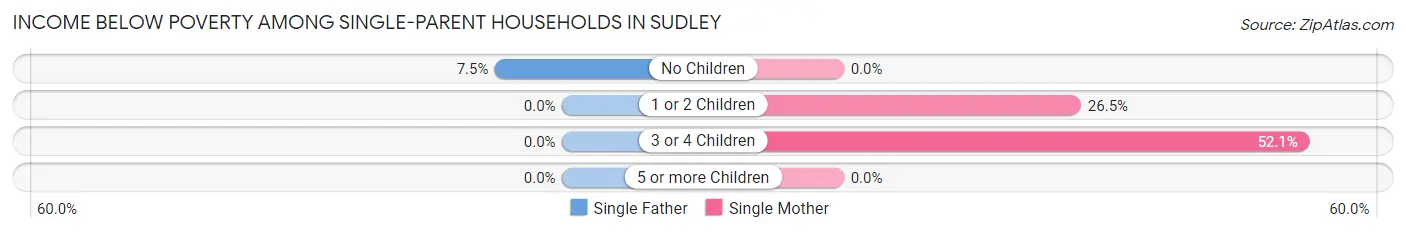
| Children | Single Father | Single Mother |
| No Children | 19 (7.5%) | 0 (0.0%) |
| 1 or 2 Children | 0 (0.0%) | 92 (26.5%) |
| 3 or 4 Children | 0 (0.0%) | 50 (52.1%) |
| 5 or more Children | 0 (0.0%) | 0 (0.0%) |
| Total | 19 (3.1%) | 142 (24.2%) |
Income Below Poverty Among Married-Couple vs Single-Parent Households in Sudley
The poverty data for Sudley shows that 56 of the married-couple family households (2.1%) and 161 of the single-parent households (13.5%) are living below the poverty level. Within the married-couple family households, those with 3 or 4 children have the highest poverty rate, with 44 households (12.5%) falling below the poverty line. Among the single-parent households, those with 3 or 4 children have the highest poverty rate, with 50 household (20.7%) living below poverty.
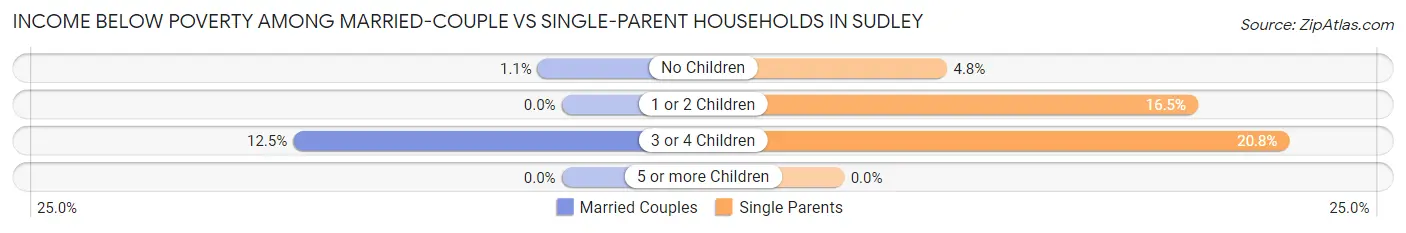
| Children | Married-Couple Families | Single-Parent Households |
| No Children | 12 (1.1%) | 19 (4.8%) |
| 1 or 2 Children | 0 (0.0%) | 92 (16.5%) |
| 3 or 4 Children | 44 (12.5%) | 50 (20.7%) |
| 5 or more Children | 0 (0.0%) | 0 (0.0%) |
| Total | 56 (2.1%) | 161 (13.5%) |
Race in Sudley
The most populous races in Sudley are Hispanic or Latino (11,256 | 58.4%), White / Caucasian (10,886 | 56.4%), and Two or more Races (2,559 | 13.3%).
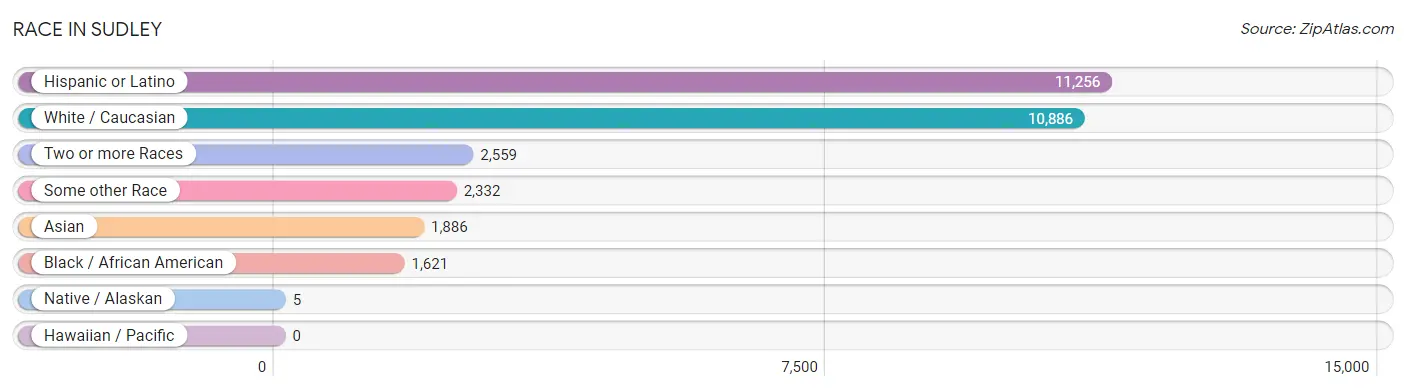
| Race | # Population | % Population |
| Asian | 1,886 | 9.8% |
| Black / African American | 1,621 | 8.4% |
| Hawaiian / Pacific | 0 | 0.0% |
| Hispanic or Latino | 11,256 | 58.4% |
| Native / Alaskan | 5 | 0.0% |
| White / Caucasian | 10,886 | 56.4% |
| Two or more Races | 2,559 | 13.3% |
| Some other Race | 2,332 | 12.1% |
| Total | 19,289 | 100.0% |
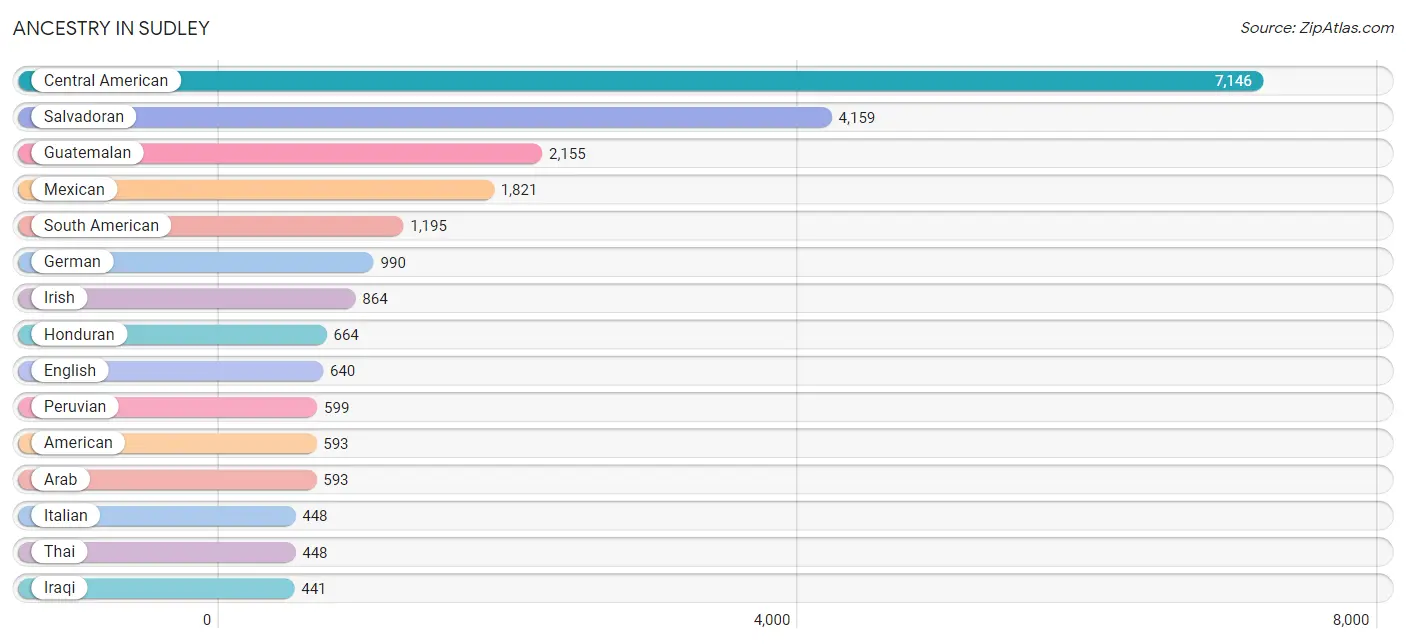
Ancestry in Sudley
The most populous ancestries reported in Sudley are Central American (7,146 | 37.0%), Salvadoran (4,159 | 21.6%), Guatemalan (2,155 | 11.2%), Mexican (1,821 | 9.4%), and South American (1,195 | 6.2%), together accounting for 85.4% of all Sudley residents.
| Ancestry | # Population | % Population |
| Afghan | 97 | 0.5% |
| African | 90 | 0.5% |
| American | 593 | 3.1% |
| Arab | 593 | 3.1% |
| Argentinean | 108 | 0.6% |
| Armenian | 25 | 0.1% |
| Bhutanese | 7 | 0.0% |
| Bolivian | 180 | 0.9% |
| British West Indian | 24 | 0.1% |
| Burmese | 171 | 0.9% |
| Central American | 7,146 | 37.0% |
| Colombian | 36 | 0.2% |
| Czech | 53 | 0.3% |
| Dutch | 9 | 0.1% |
| Eastern European | 9 | 0.1% |
| Ecuadorian | 272 | 1.4% |
| English | 640 | 3.3% |
| Ethiopian | 37 | 0.2% |
| European | 255 | 1.3% |
| French | 141 | 0.7% |
| German | 990 | 5.1% |
| Ghanaian | 55 | 0.3% |
| Greek | 92 | 0.5% |
| Guatemalan | 2,155 | 11.2% |
| Honduran | 664 | 3.4% |
| Hungarian | 18 | 0.1% |
| Indian (Asian) | 6 | 0.0% |
| Iraqi | 441 | 2.3% |
| Irish | 864 | 4.5% |
| Italian | 448 | 2.3% |
| Jamaican | 204 | 1.1% |
| Jordanian | 16 | 0.1% |
| Kenyan | 120 | 0.6% |
| Korean | 181 | 0.9% |
| Lumbee | 5 | 0.0% |
| Mexican | 1,821 | 9.4% |
| Nicaraguan | 168 | 0.9% |
| Norwegian | 117 | 0.6% |
| Peruvian | 599 | 3.1% |
| Polish | 67 | 0.4% |
| Puerto Rican | 319 | 1.7% |
| Romanian | 155 | 0.8% |
| Russian | 280 | 1.5% |
| Salvadoran | 4,159 | 21.6% |
| Scotch-Irish | 49 | 0.3% |
| Scottish | 96 | 0.5% |
| Slavic | 79 | 0.4% |
| Slovak | 107 | 0.5% |
| South American | 1,195 | 6.2% |
| Spaniard | 256 | 1.3% |
| Spanish | 173 | 0.9% |
| Sri Lankan | 128 | 0.7% |
| Subsaharan African | 318 | 1.7% |
| Sudanese | 7 | 0.0% |
| Swedish | 54 | 0.3% |
| Swiss | 9 | 0.1% |
| Syrian | 49 | 0.3% |
| Thai | 448 | 2.3% |
| Trinidadian and Tobagonian | 49 | 0.3% |
| Turkish | 22 | 0.1% |
| Vietnamese | 235 | 1.2% | View All 61 Rows |
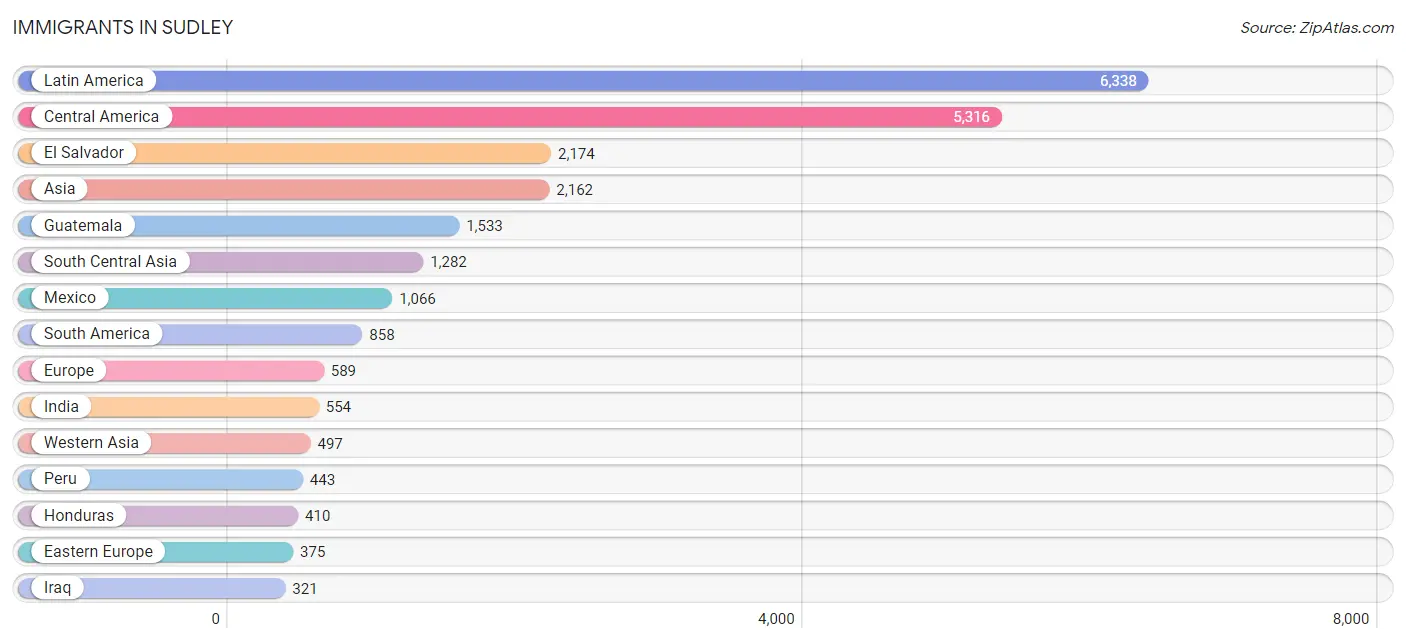
Immigrants in Sudley
The most numerous immigrant groups reported in Sudley came from Latin America (6,338 | 32.9%), Central America (5,316 | 27.6%), El Salvador (2,174 | 11.3%), Asia (2,162 | 11.2%), and Guatemala (1,533 | 8.0%), together accounting for 90.9% of all Sudley residents.
| Immigration Origin | # Population | % Population |
| Afghanistan | 119 | 0.6% |
| Africa | 293 | 1.5% |
| Argentina | 28 | 0.2% |
| Asia | 2,162 | 11.2% |
| Bangladesh | 178 | 0.9% |
| Bolivia | 99 | 0.5% |
| Caribbean | 164 | 0.9% |
| Central America | 5,316 | 27.6% |
| Colombia | 16 | 0.1% |
| Czechoslovakia | 77 | 0.4% |
| Eastern Africa | 98 | 0.5% |
| Eastern Asia | 115 | 0.6% |
| Eastern Europe | 375 | 1.9% |
| Ecuador | 272 | 1.4% |
| El Salvador | 2,174 | 11.3% |
| Ethiopia | 37 | 0.2% |
| Europe | 589 | 3.0% |
| Germany | 18 | 0.1% |
| Ghana | 109 | 0.6% |
| Greece | 24 | 0.1% |
| Guatemala | 1,533 | 8.0% |
| Honduras | 410 | 2.1% |
| India | 554 | 2.9% |
| Iraq | 321 | 1.7% |
| Jamaica | 91 | 0.5% |
| Jordan | 16 | 0.1% |
| Kenya | 61 | 0.3% |
| Korea | 115 | 0.6% |
| Kuwait | 39 | 0.2% |
| Latin America | 6,338 | 32.9% |
| Mexico | 1,066 | 5.5% |
| Nepal | 192 | 1.0% |
| Nicaragua | 133 | 0.7% |
| Northern Africa | 73 | 0.4% |
| Northern Europe | 19 | 0.1% |
| Pakistan | 152 | 0.8% |
| Peru | 443 | 2.3% |
| Philippines | 127 | 0.7% |
| Romania | 67 | 0.4% |
| Russia | 231 | 1.2% |
| South America | 858 | 4.4% |
| South Central Asia | 1,282 | 6.7% |
| South Eastern Asia | 268 | 1.4% |
| Southern Europe | 177 | 0.9% |
| Spain | 153 | 0.8% |
| Sudan | 7 | 0.0% |
| Syria | 29 | 0.2% |
| Thailand | 13 | 0.1% |
| Trinidad and Tobago | 49 | 0.3% |
| Uzbekistan | 87 | 0.4% |
| Vietnam | 128 | 0.7% |
| Western Africa | 118 | 0.6% |
| Western Asia | 497 | 2.6% |
| Western Europe | 18 | 0.1% | View All 54 Rows |
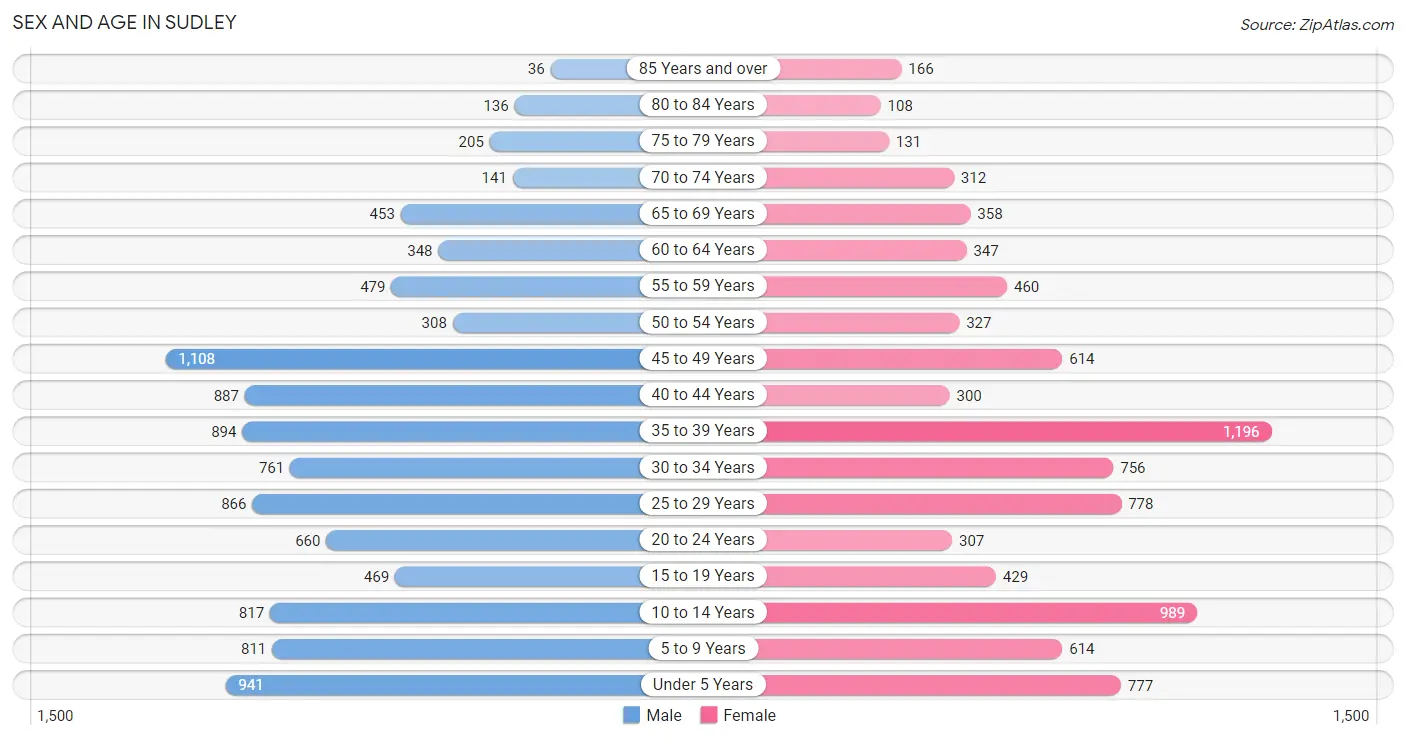
Sex and Age in Sudley
Sex and Age in Sudley
The most populous age groups in Sudley are 45 to 49 Years (1,108 | 10.7%) for men and 35 to 39 Years (1,196 | 13.3%) for women.
| Age Bracket | Male | Female |
| Under 5 Years | 941 (9.1%) | 777 (8.7%) |
| 5 to 9 Years | 811 (7.9%) | 614 (6.9%) |
| 10 to 14 Years | 817 (7.9%) | 989 (11.0%) |
| 15 to 19 Years | 469 (4.5%) | 429 (4.8%) |
| 20 to 24 Years | 660 (6.4%) | 307 (3.4%) |
| 25 to 29 Years | 866 (8.4%) | 778 (8.7%) |
| 30 to 34 Years | 761 (7.4%) | 756 (8.4%) |
| 35 to 39 Years | 894 (8.7%) | 1,196 (13.3%) |
| 40 to 44 Years | 887 (8.6%) | 300 (3.3%) |
| 45 to 49 Years | 1,108 (10.7%) | 614 (6.9%) |
| 50 to 54 Years | 308 (3.0%) | 327 (3.6%) |
| 55 to 59 Years | 479 (4.6%) | 460 (5.1%) |
| 60 to 64 Years | 348 (3.4%) | 347 (3.9%) |
| 65 to 69 Years | 453 (4.4%) | 358 (4.0%) |
| 70 to 74 Years | 141 (1.4%) | 312 (3.5%) |
| 75 to 79 Years | 205 (2.0%) | 131 (1.5%) |
| 80 to 84 Years | 136 (1.3%) | 108 (1.2%) |
| 85 Years and over | 36 (0.4%) | 166 (1.8%) |
| Total | 10,320 (100.0%) | 8,969 (100.0%) |
Families and Households in Sudley
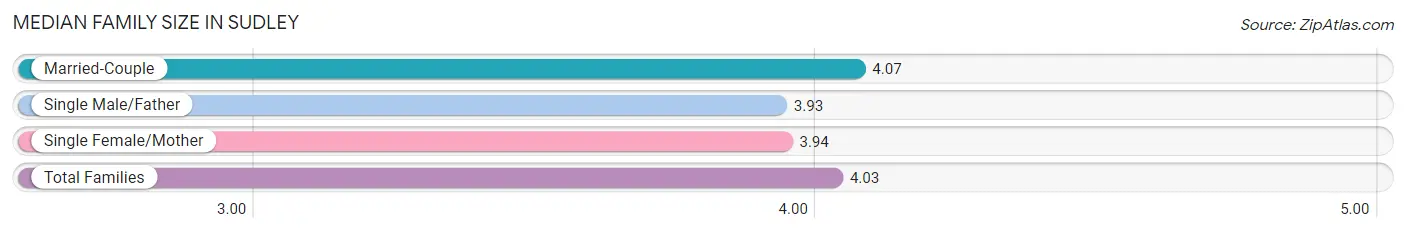
Median Family Size in Sudley
The median family size in Sudley is 4.03 persons per family, with married-couple families (2,636 | 68.8%) accounting for the largest median family size of 4.07 persons per family. On the other hand, single male/father families (609 | 15.9%) represent the smallest median family size with 3.93 persons per family.
| Family Type | # Families | Family Size |
| Married-Couple | 2,636 (68.8%) | 4.07 |
| Single Male/Father | 609 (15.9%) | 3.93 |
| Single Female/Mother | 587 (15.3%) | 3.94 |
| Total Families | 3,832 (100.0%) | 4.03 |
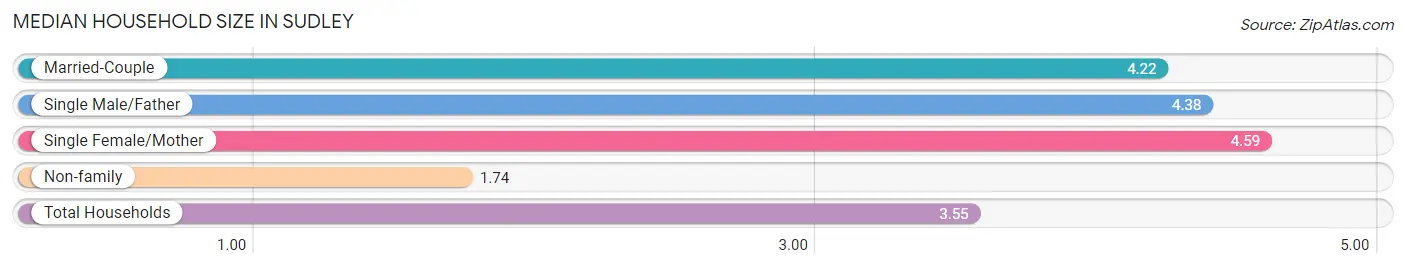
Median Household Size in Sudley
The median household size in Sudley is 3.55 persons per household, with single female/mother households (587 | 10.8%) accounting for the largest median household size of 4.59 persons per household. non-family households (1,583 | 29.2%) represent the smallest median household size with 1.74 persons per household.
| Household Type | # Households | Household Size |
| Married-Couple | 2,636 (48.7%) | 4.22 |
| Single Male/Father | 609 (11.3%) | 4.38 |
| Single Female/Mother | 587 (10.8%) | 4.59 |
| Non-family | 1,583 (29.2%) | 1.74 |
| Total Households | 5,415 (100.0%) | 3.55 |
Household Size by Marriage Status in Sudley
Out of a total of 5,415 households in Sudley, 3,832 (70.8%) are family households, while 1,583 (29.2%) are nonfamily households. The most numerous type of family households are 4-person households, comprising 1,038, and the most common type of nonfamily households are 1-person households, comprising 1,271.
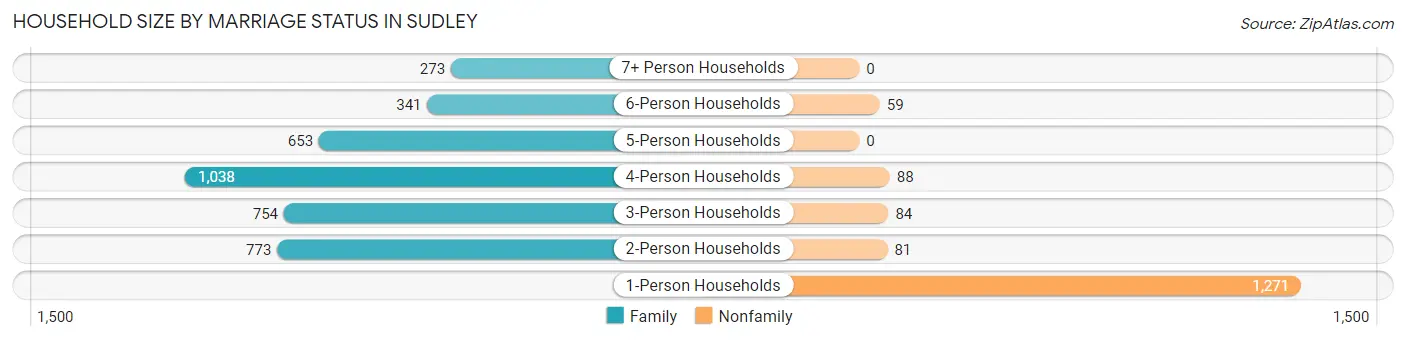
| Household Size | Family Households | Nonfamily Households |
| 1-Person Households | - | 1,271 (23.5%) |
| 2-Person Households | 773 (14.3%) | 81 (1.5%) |
| 3-Person Households | 754 (13.9%) | 84 (1.5%) |
| 4-Person Households | 1,038 (19.2%) | 88 (1.6%) |
| 5-Person Households | 653 (12.1%) | 0 (0.0%) |
| 6-Person Households | 341 (6.3%) | 59 (1.1%) |
| 7+ Person Households | 273 (5.0%) | 0 (0.0%) |
| Total | 3,832 (70.8%) | 1,583 (29.2%) |
Female Fertility in Sudley
Fertility by Age in Sudley
Average fertility rate in Sudley is 87.0 births per 1,000 women. Women in the age bracket of 35 to 50 years have the highest fertility rate with 112.0 births per 1,000 women. Women in the age bracket of 35 to 50 years acount for 62.6% of all women with births.
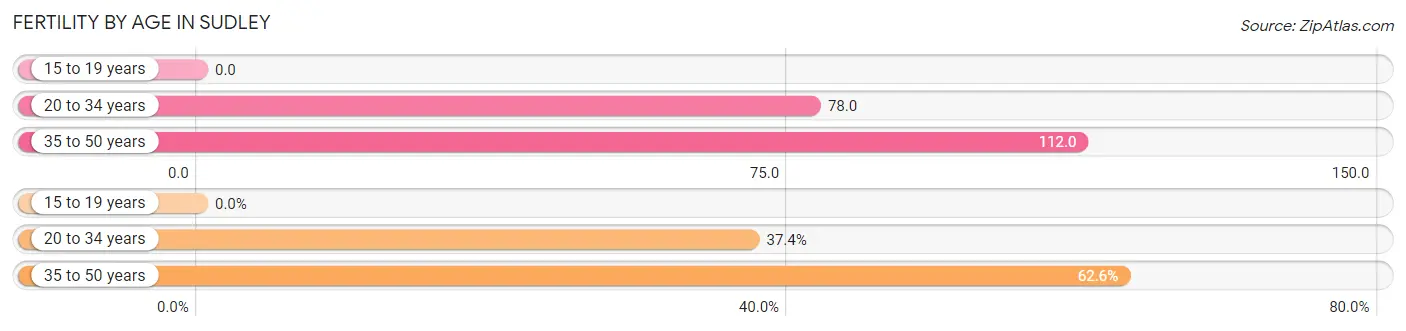
| Age Bracket | Women with Births | Births / 1,000 Women |
| 15 to 19 years | 0 (0.0%) | 0.0 |
| 20 to 34 years | 143 (37.4%) | 78.0 |
| 35 to 50 years | 239 (62.6%) | 112.0 |
| Total | 382 (100.0%) | 87.0 |
Fertility by Age by Marriage Status in Sudley
57.6% of women with births (382) in Sudley are married. The highest percentage of unmarried women with births falls into 20 to 34 years age bracket with 93.0% of them unmarried at the time of birth, while the lowest percentage of unmarried women with births belong to 35 to 50 years age bracket with 12.1% of them unmarried.
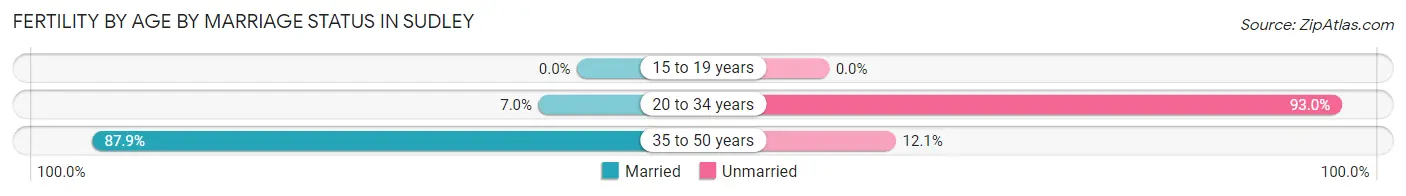
| Age Bracket | Married | Unmarried |
| 15 to 19 years | 0 (0.0%) | 0 (0.0%) |
| 20 to 34 years | 10 (7.0%) | 133 (93.0%) |
| 35 to 50 years | 210 (87.9%) | 29 (12.1%) |
| Total | 220 (57.6%) | 162 (42.4%) |
Fertility by Education in Sudley
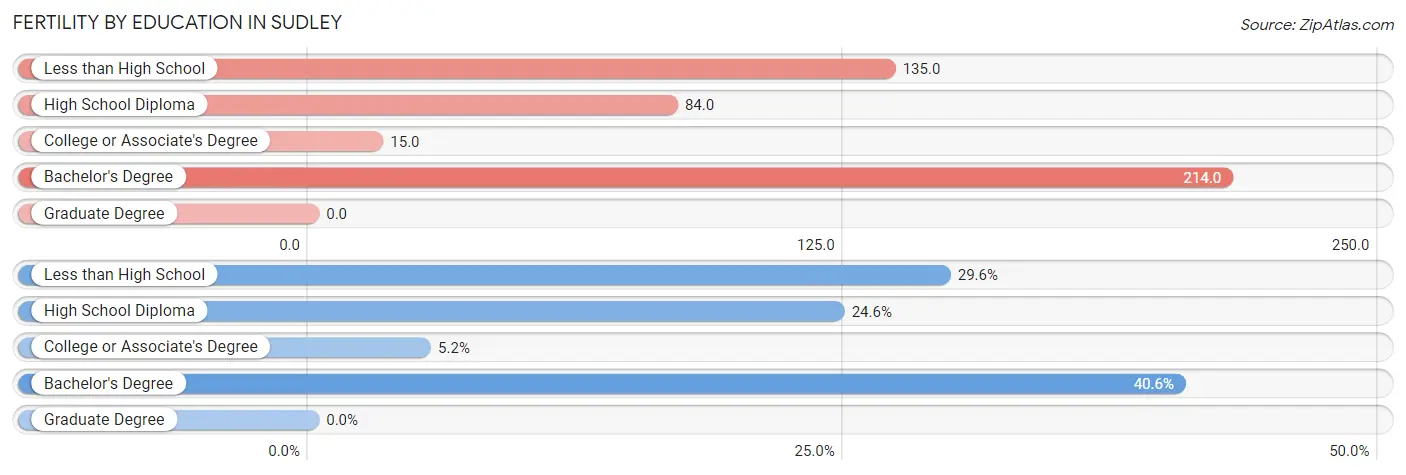
| Educational Attainment | Women with Births | Births / 1,000 Women |
| Less than High School | 113 (29.6%) | 135.0 |
| High School Diploma | 94 (24.6%) | 84.0 |
| College or Associate's Degree | 20 (5.2%) | 15.0 |
| Bachelor's Degree | 155 (40.6%) | 214.0 |
| Graduate Degree | 0 (0.0%) | 0.0 |
| Total | 382 (100.0%) | 87.0 |
Fertility by Education by Marriage Status in Sudley
42.4% of women with births in Sudley are unmarried. Women with the educational attainment of bachelor's degree are most likely to be married with 100.0% of them married at childbirth, while women with the educational attainment of less than high school are least likely to be married with 100.0% of them unmarried at childbirth.
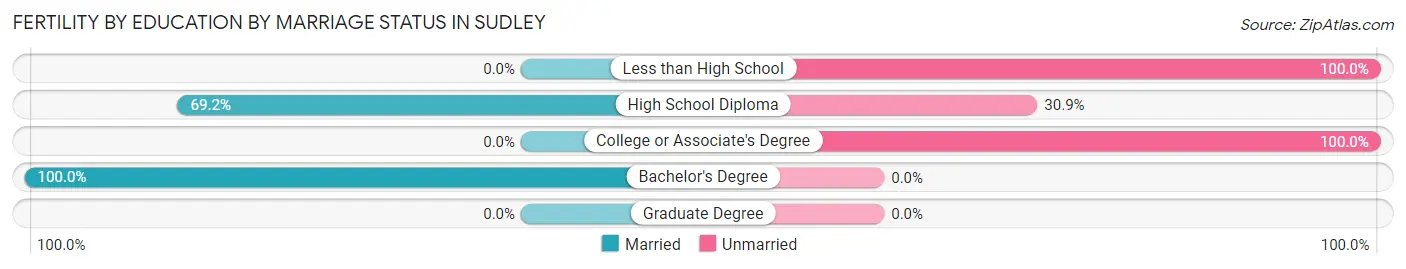
| Educational Attainment | Married | Unmarried |
| Less than High School | 0 (0.0%) | 113 (100.0%) |
| High School Diploma | 65 (69.2%) | 29 (30.8%) |
| College or Associate's Degree | 0 (0.0%) | 20 (100.0%) |
| Bachelor's Degree | 155 (100.0%) | 0 (0.0%) |
| Graduate Degree | 0 (0.0%) | 0 (0.0%) |
| Total | 220 (57.6%) | 162 (42.4%) |
Employment Characteristics in Sudley
Employment by Class of Employer in Sudley
Among the 9,595 employed individuals in Sudley, private company employees (7,497 | 78.1%), local government employees (644 | 6.7%), and federal government employees (496 | 5.2%) make up the most common classes of employment.
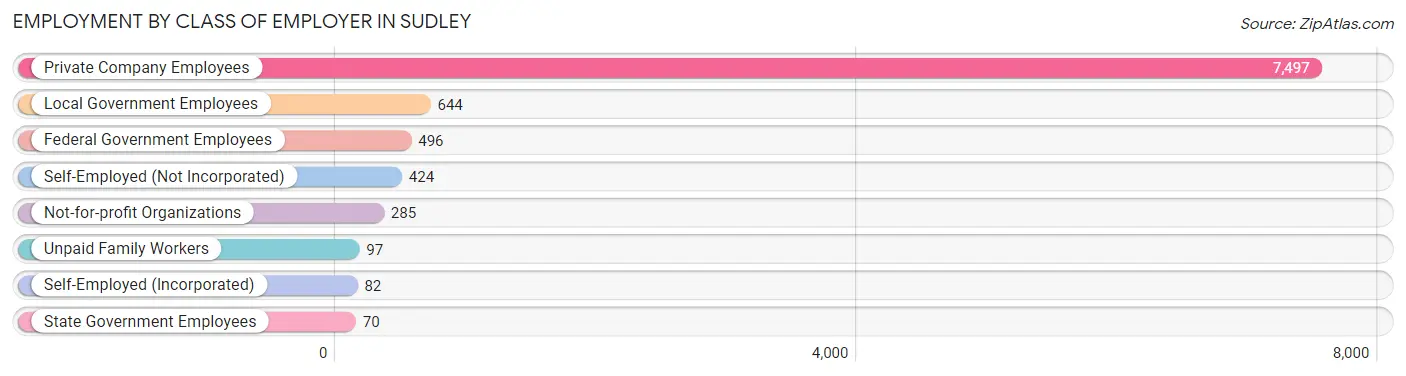
| Employer Class | # Employees | % Employees |
| Private Company Employees | 7,497 | 78.1% |
| Self-Employed (Incorporated) | 82 | 0.9% |
| Self-Employed (Not Incorporated) | 424 | 4.4% |
| Not-for-profit Organizations | 285 | 3.0% |
| Local Government Employees | 644 | 6.7% |
| State Government Employees | 70 | 0.7% |
| Federal Government Employees | 496 | 5.2% |
| Unpaid Family Workers | 97 | 1.0% |
| Total | 9,595 | 100.0% |
Employment Status by Age in Sudley
According to the labor force statistics for Sudley, out of the total population over 16 years of age (14,089), 73.3% or 10,327 individuals are in the labor force, with 4.0% or 413 of them unemployed. The age group with the highest labor force participation rate is 25 to 29 years, with 92.8% or 1,526 individuals in the labor force. Within the labor force, the 35 to 44 years age range has the highest percentage of unemployed individuals, with 6.1% or 172 of them being unemployed.
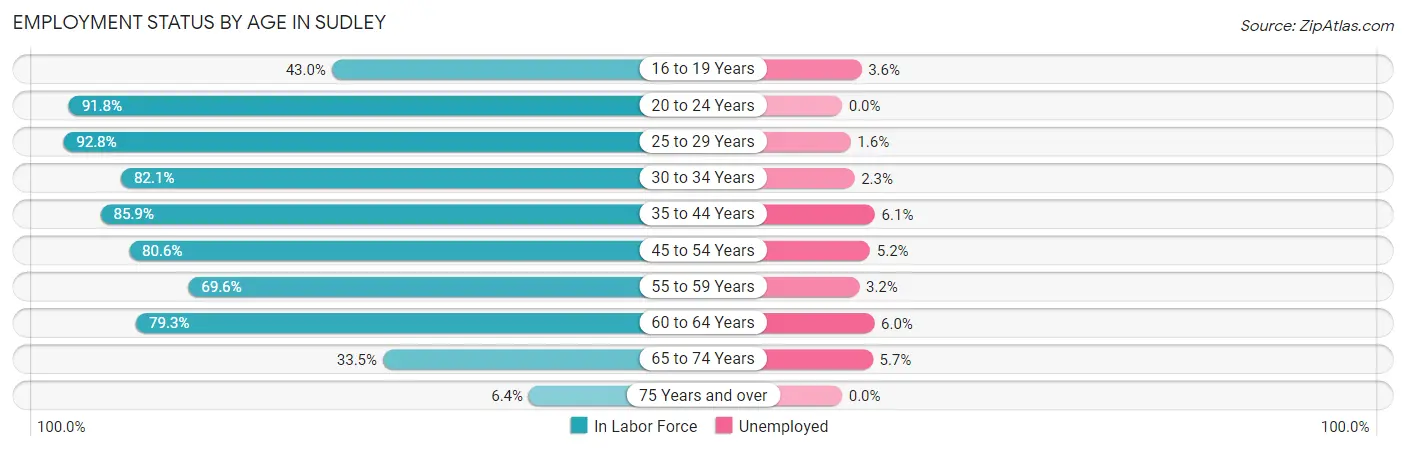
| Age Bracket | In Labor Force | Unemployed |
| 16 to 19 Years | 278 (43.0%) | 10 (3.6%) |
| 20 to 24 Years | 888 (91.8%) | 0 (0.0%) |
| 25 to 29 Years | 1,526 (92.8%) | 24 (1.6%) |
| 30 to 34 Years | 1,245 (82.1%) | 29 (2.3%) |
| 35 to 44 Years | 2,815 (85.9%) | 172 (6.1%) |
| 45 to 54 Years | 1,900 (80.6%) | 99 (5.2%) |
| 55 to 59 Years | 654 (69.6%) | 21 (3.2%) |
| 60 to 64 Years | 551 (79.3%) | 33 (6.0%) |
| 65 to 74 Years | 423 (33.5%) | 24 (5.7%) |
| 75 Years and over | 50 (6.4%) | 0 (0.0%) |
| Total | 10,327 (73.3%) | 413 (4.0%) |
Employment Status by Educational Attainment in Sudley
According to labor force statistics for Sudley, 83.3% of individuals (8,687) out of the total population between 25 and 64 years of age (10,429) are in the labor force, with 4.4% or 382 of them being unemployed. The group with the highest labor force participation rate are those with the educational attainment of college / associate degree, with 87.3% or 2,123 individuals in the labor force. Within the labor force, individuals with high school diploma education have the highest percentage of unemployment, with 10.4% or 260 of them being unemployed.
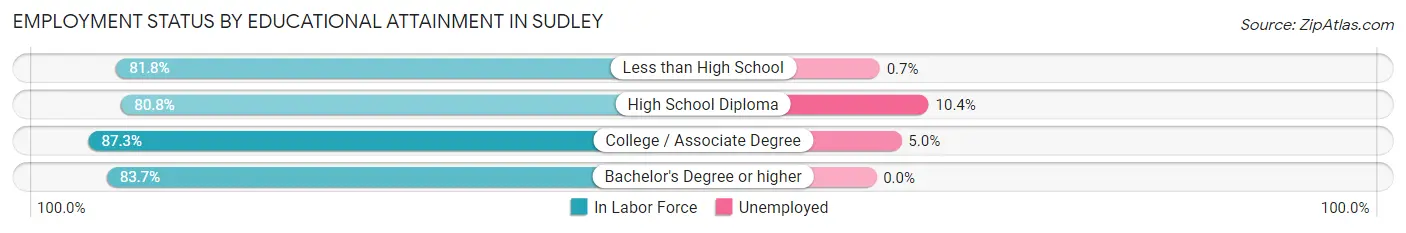
| Educational Attainment | In Labor Force | Unemployed |
| Less than High School | 1,674 (81.8%) | 14 (0.7%) |
| High School Diploma | 2,497 (80.8%) | 321 (10.4%) |
| College / Associate Degree | 2,123 (87.3%) | 122 (5.0%) |
| Bachelor's Degree or higher | 2,395 (83.7%) | 0 (0.0%) |
| Total | 8,687 (83.3%) | 459 (4.4%) |
Employment Occupations by Sex in Sudley
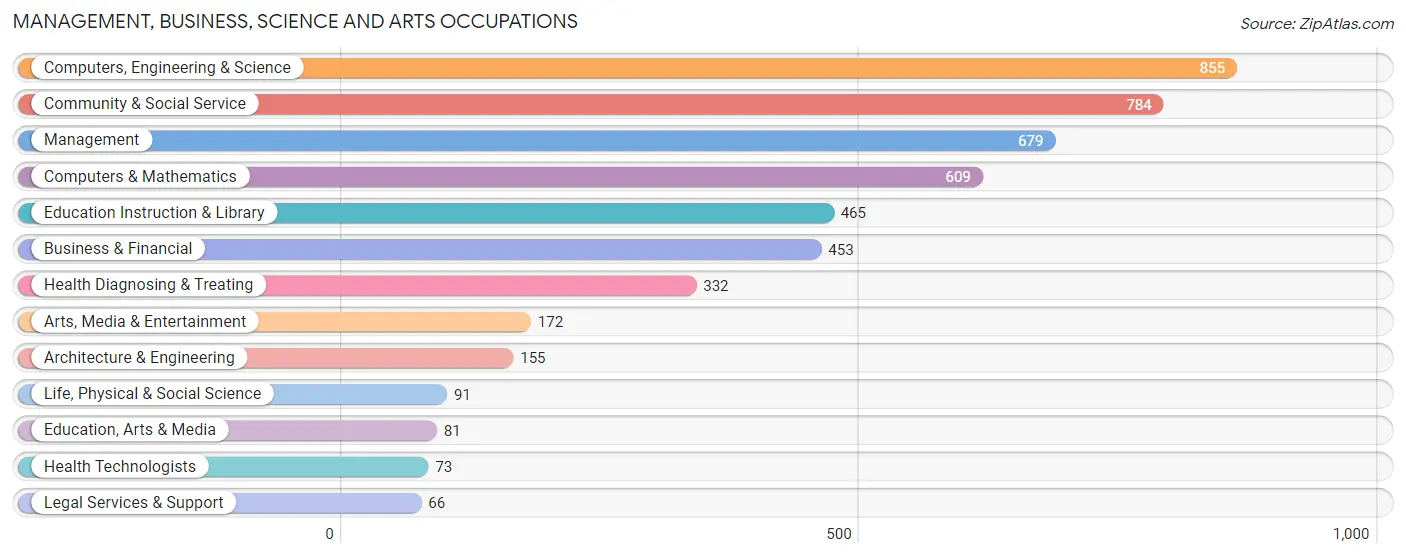
Management, Business, Science and Arts Occupations
The most common Management, Business, Science and Arts occupations in Sudley are Computers, Engineering & Science (855 | 8.6%), Community & Social Service (784 | 7.9%), Management (679 | 6.9%), Computers & Mathematics (609 | 6.1%), and Education Instruction & Library (465 | 4.7%).
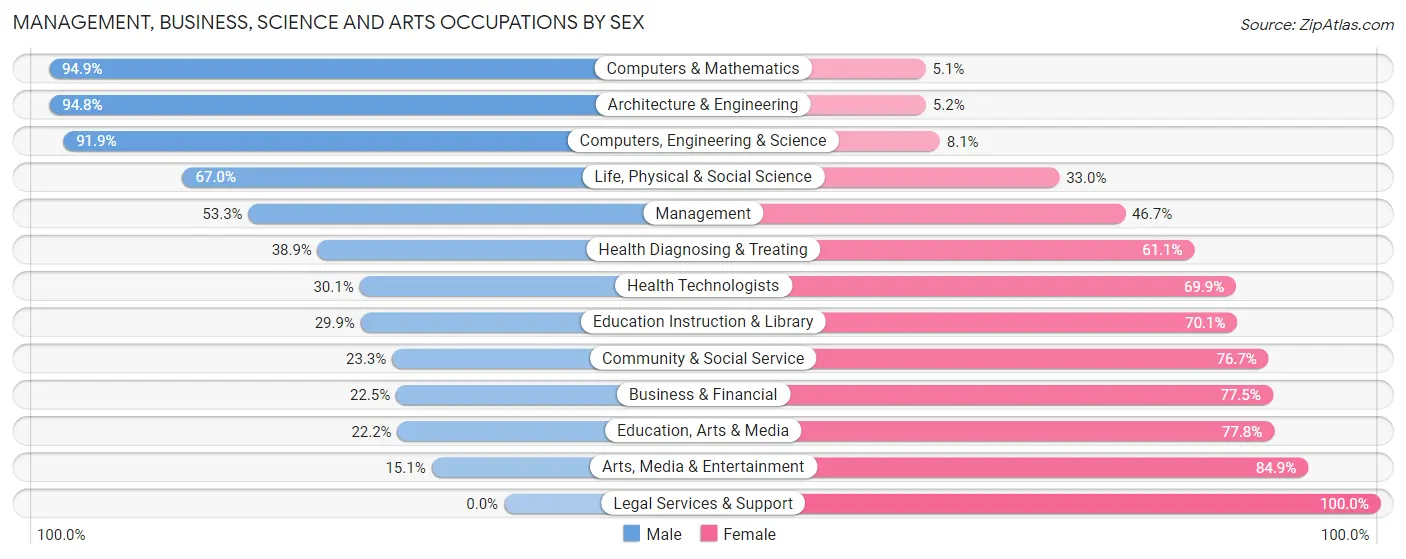
Management, Business, Science and Arts Occupations by Sex
Within the Management, Business, Science and Arts occupations in Sudley, the most male-oriented occupations are Computers & Mathematics (94.9%), Architecture & Engineering (94.8%), and Computers, Engineering & Science (91.9%), while the most female-oriented occupations are Legal Services & Support (100.0%), Arts, Media & Entertainment (84.9%), and Education, Arts & Media (77.8%).
| Occupation | Male | Female |
| Management | 362 (53.3%) | 317 (46.7%) |
| Business & Financial | 102 (22.5%) | 351 (77.5%) |
| Computers, Engineering & Science | 786 (91.9%) | 69 (8.1%) |
| Computers & Mathematics | 578 (94.9%) | 31 (5.1%) |
| Architecture & Engineering | 147 (94.8%) | 8 (5.2%) |
| Life, Physical & Social Science | 61 (67.0%) | 30 (33.0%) |
| Community & Social Service | 183 (23.3%) | 601 (76.7%) |
| Education, Arts & Media | 18 (22.2%) | 63 (77.8%) |
| Legal Services & Support | 0 (0.0%) | 66 (100.0%) |
| Education Instruction & Library | 139 (29.9%) | 326 (70.1%) |
| Arts, Media & Entertainment | 26 (15.1%) | 146 (84.9%) |
| Health Diagnosing & Treating | 129 (38.9%) | 203 (61.1%) |
| Health Technologists | 22 (30.1%) | 51 (69.9%) |
| Total (Category) | 1,562 (50.3%) | 1,541 (49.7%) |
| Total (Overall) | 6,136 (61.9%) | 3,781 (38.1%) |
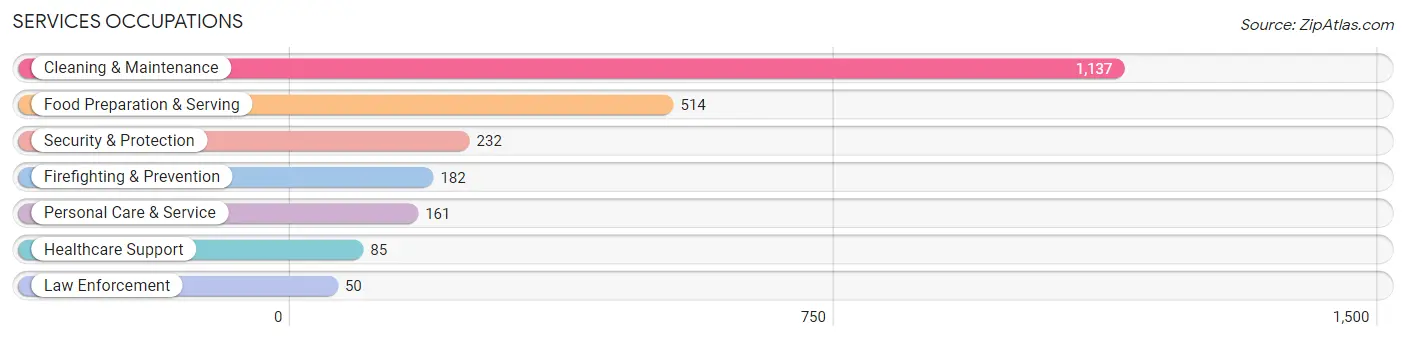
Services Occupations
The most common Services occupations in Sudley are Cleaning & Maintenance (1,137 | 11.5%), Food Preparation & Serving (514 | 5.2%), Security & Protection (232 | 2.3%), Firefighting & Prevention (182 | 1.8%), and Personal Care & Service (161 | 1.6%).
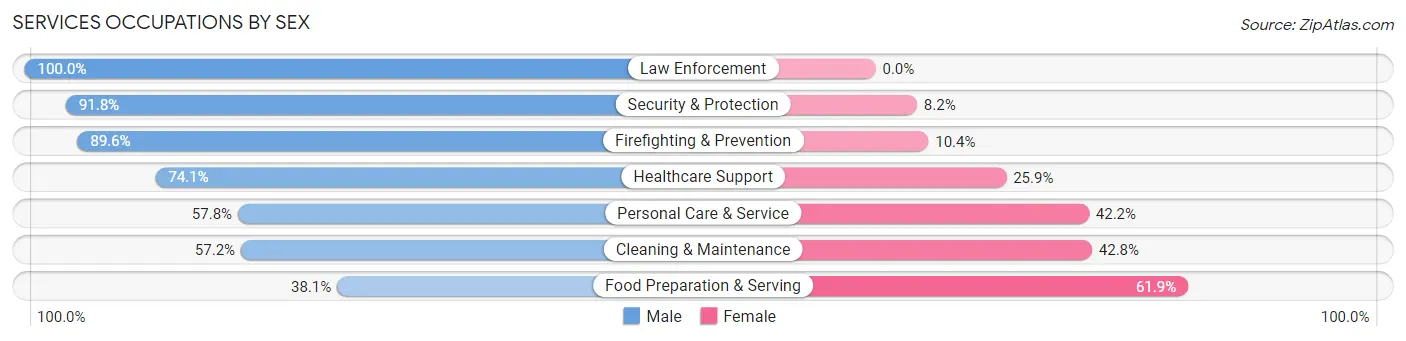
Services Occupations by Sex
Within the Services occupations in Sudley, the most male-oriented occupations are Law Enforcement (100.0%), Security & Protection (91.8%), and Firefighting & Prevention (89.6%), while the most female-oriented occupations are Food Preparation & Serving (61.9%), Cleaning & Maintenance (42.8%), and Personal Care & Service (42.2%).
| Occupation | Male | Female |
| Healthcare Support | 63 (74.1%) | 22 (25.9%) |
| Security & Protection | 213 (91.8%) | 19 (8.2%) |
| Firefighting & Prevention | 163 (89.6%) | 19 (10.4%) |
| Law Enforcement | 50 (100.0%) | 0 (0.0%) |
| Food Preparation & Serving | 196 (38.1%) | 318 (61.9%) |
| Cleaning & Maintenance | 650 (57.2%) | 487 (42.8%) |
| Personal Care & Service | 93 (57.8%) | 68 (42.2%) |
| Total (Category) | 1,215 (57.1%) | 914 (42.9%) |
| Total (Overall) | 6,136 (61.9%) | 3,781 (38.1%) |
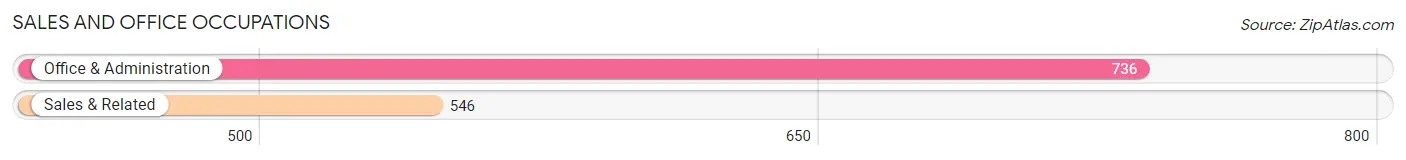
Sales and Office Occupations
The most common Sales and Office occupations in Sudley are Office & Administration (736 | 7.4%), and Sales & Related (546 | 5.5%).
Sales and Office Occupations by Sex
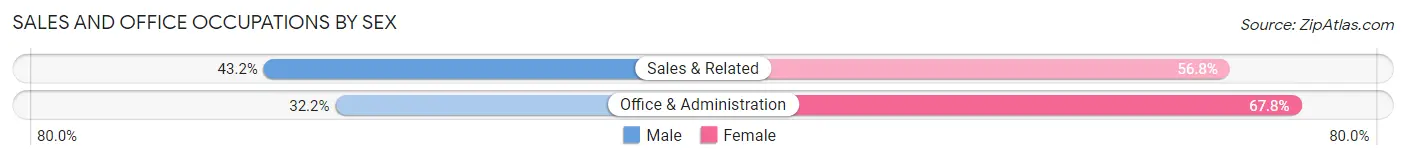
| Occupation | Male | Female |
| Sales & Related | 236 (43.2%) | 310 (56.8%) |
| Office & Administration | 237 (32.2%) | 499 (67.8%) |
| Total (Category) | 473 (36.9%) | 809 (63.1%) |
| Total (Overall) | 6,136 (61.9%) | 3,781 (38.1%) |
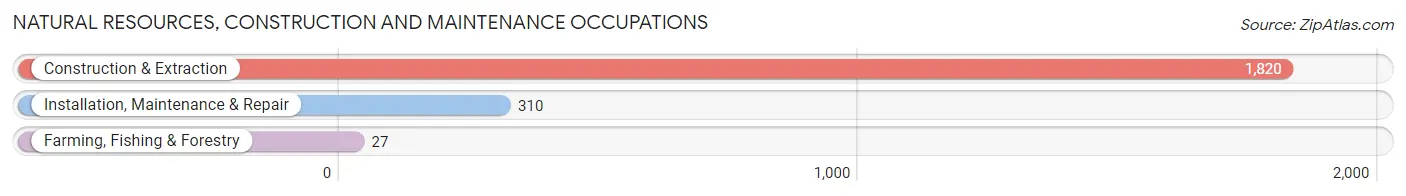
Natural Resources, Construction and Maintenance Occupations
The most common Natural Resources, Construction and Maintenance occupations in Sudley are Construction & Extraction (1,820 | 18.3%), Installation, Maintenance & Repair (310 | 3.1%), and Farming, Fishing & Forestry (27 | 0.3%).
Natural Resources, Construction and Maintenance Occupations by Sex
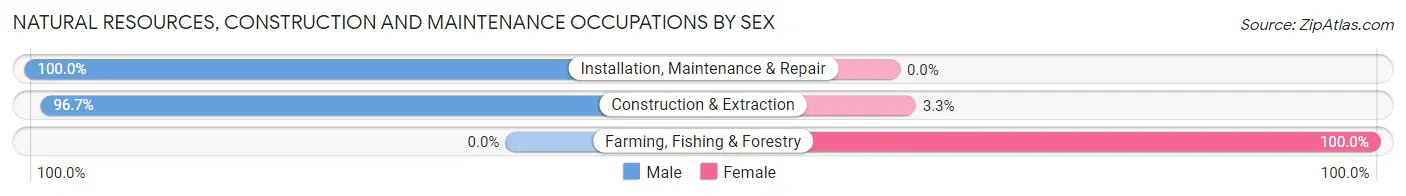
| Occupation | Male | Female |
| Farming, Fishing & Forestry | 0 (0.0%) | 27 (100.0%) |
| Construction & Extraction | 1,760 (96.7%) | 60 (3.3%) |
| Installation, Maintenance & Repair | 310 (100.0%) | 0 (0.0%) |
| Total (Category) | 2,070 (96.0%) | 87 (4.0%) |
| Total (Overall) | 6,136 (61.9%) | 3,781 (38.1%) |
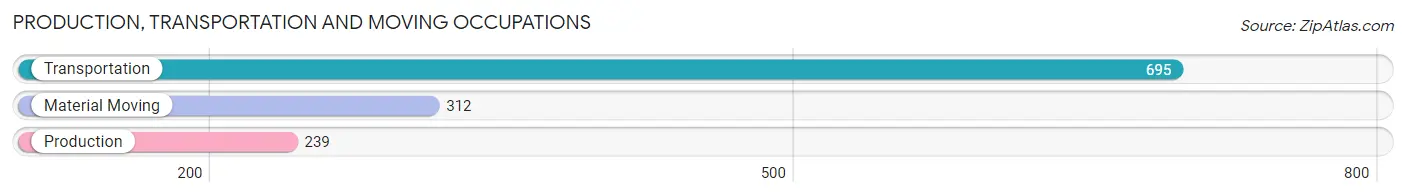
Production, Transportation and Moving Occupations
The most common Production, Transportation and Moving occupations in Sudley are Transportation (695 | 7.0%), Material Moving (312 | 3.2%), and Production (239 | 2.4%).
Production, Transportation and Moving Occupations by Sex
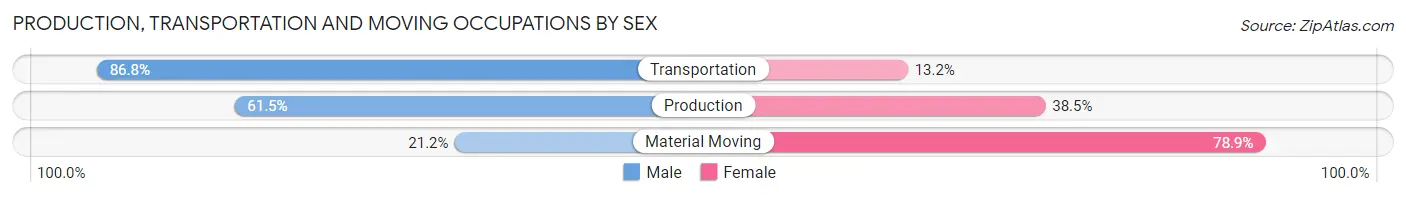
| Occupation | Male | Female |
| Production | 147 (61.5%) | 92 (38.5%) |
| Transportation | 603 (86.8%) | 92 (13.2%) |
| Material Moving | 66 (21.1%) | 246 (78.8%) |
| Total (Category) | 816 (65.5%) | 430 (34.5%) |
| Total (Overall) | 6,136 (61.9%) | 3,781 (38.1%) |
Employment Industries by Sex in Sudley
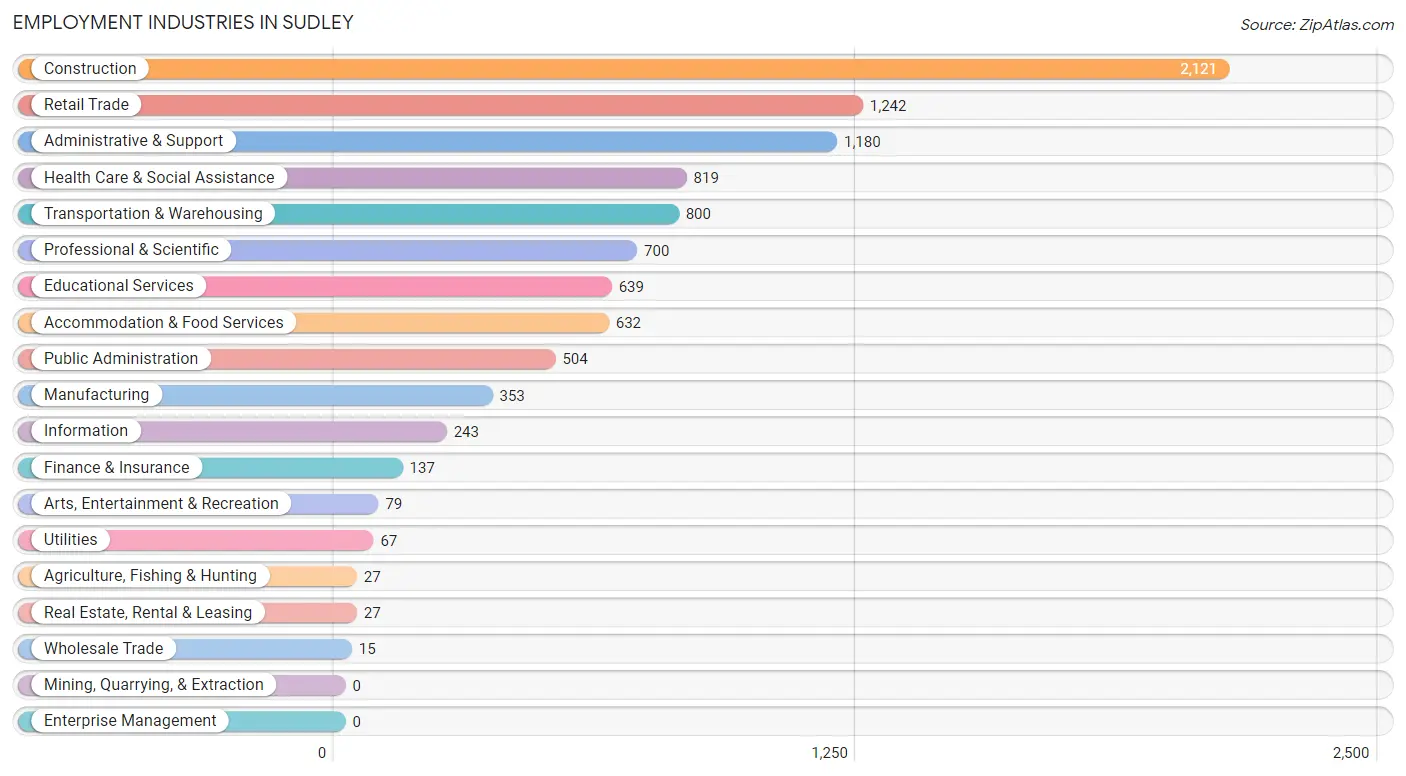
Employment Industries in Sudley
The major employment industries in Sudley include Construction (2,121 | 21.4%), Retail Trade (1,242 | 12.5%), Administrative & Support (1,180 | 11.9%), Health Care & Social Assistance (819 | 8.3%), and Transportation & Warehousing (800 | 8.1%).
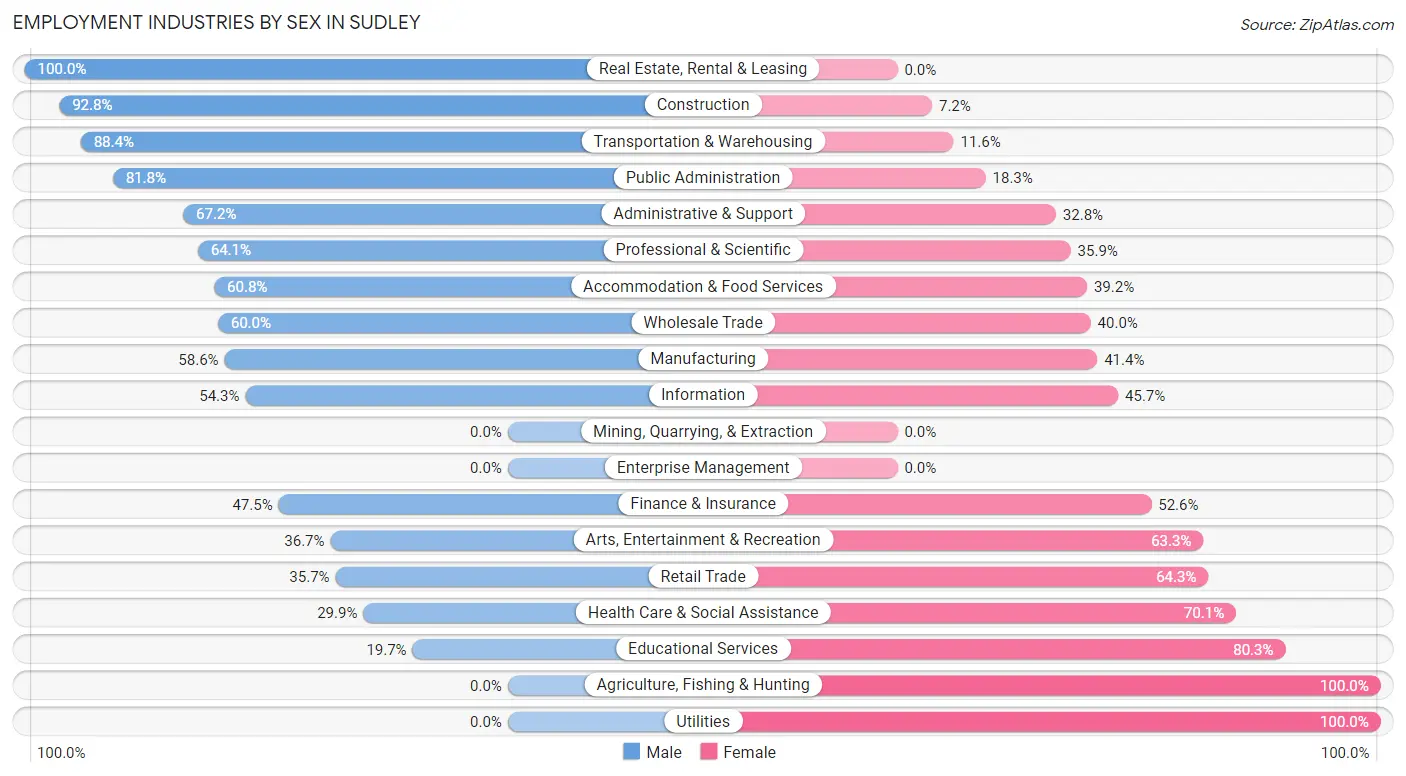
Employment Industries by Sex in Sudley
The Sudley industries that see more men than women are Real Estate, Rental & Leasing (100.0%), Construction (92.8%), and Transportation & Warehousing (88.4%), whereas the industries that tend to have a higher number of women are Agriculture, Fishing & Hunting (100.0%), Utilities (100.0%), and Educational Services (80.3%).
| Industry | Male | Female |
| Agriculture, Fishing & Hunting | 0 (0.0%) | 27 (100.0%) |
| Mining, Quarrying, & Extraction | 0 (0.0%) | 0 (0.0%) |
| Construction | 1,969 (92.8%) | 152 (7.2%) |
| Manufacturing | 207 (58.6%) | 146 (41.4%) |
| Wholesale Trade | 9 (60.0%) | 6 (40.0%) |
| Retail Trade | 443 (35.7%) | 799 (64.3%) |
| Transportation & Warehousing | 707 (88.4%) | 93 (11.6%) |
| Utilities | 0 (0.0%) | 67 (100.0%) |
| Information | 132 (54.3%) | 111 (45.7%) |
| Finance & Insurance | 65 (47.4%) | 72 (52.5%) |
| Real Estate, Rental & Leasing | 27 (100.0%) | 0 (0.0%) |
| Professional & Scientific | 449 (64.1%) | 251 (35.9%) |
| Enterprise Management | 0 (0.0%) | 0 (0.0%) |
| Administrative & Support | 793 (67.2%) | 387 (32.8%) |
| Educational Services | 126 (19.7%) | 513 (80.3%) |
| Health Care & Social Assistance | 245 (29.9%) | 574 (70.1%) |
| Arts, Entertainment & Recreation | 29 (36.7%) | 50 (63.3%) |
| Accommodation & Food Services | 384 (60.8%) | 248 (39.2%) |
| Public Administration | 412 (81.8%) | 92 (18.2%) |
| Total | 6,136 (61.9%) | 3,781 (38.1%) |
Education in Sudley
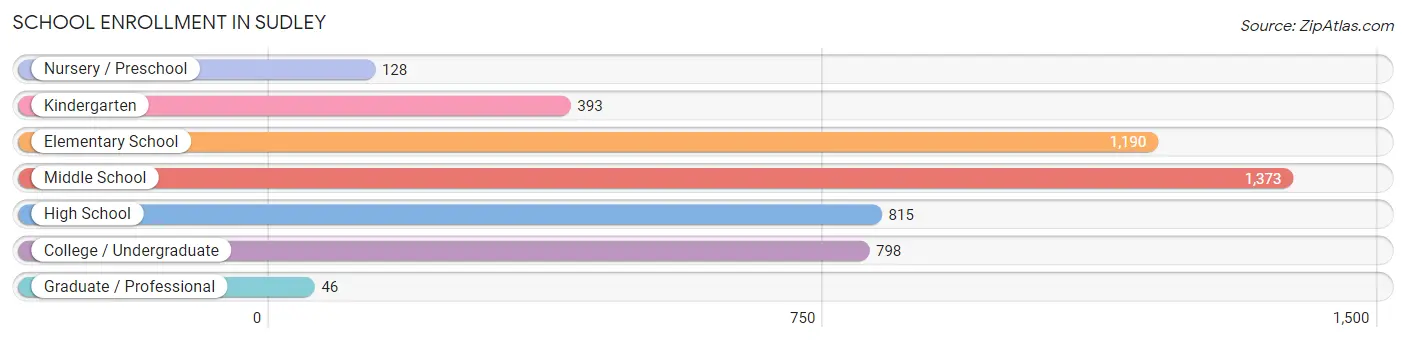
School Enrollment in Sudley
The most common levels of schooling among the 4,743 students in Sudley are middle school (1,373 | 28.9%), elementary school (1,190 | 25.1%), and high school (815 | 17.2%).
| School Level | # Students | % Students |
| Nursery / Preschool | 128 | 2.7% |
| Kindergarten | 393 | 8.3% |
| Elementary School | 1,190 | 25.1% |
| Middle School | 1,373 | 28.9% |
| High School | 815 | 17.2% |
| College / Undergraduate | 798 | 16.8% |
| Graduate / Professional | 46 | 1.0% |
| Total | 4,743 | 100.0% |
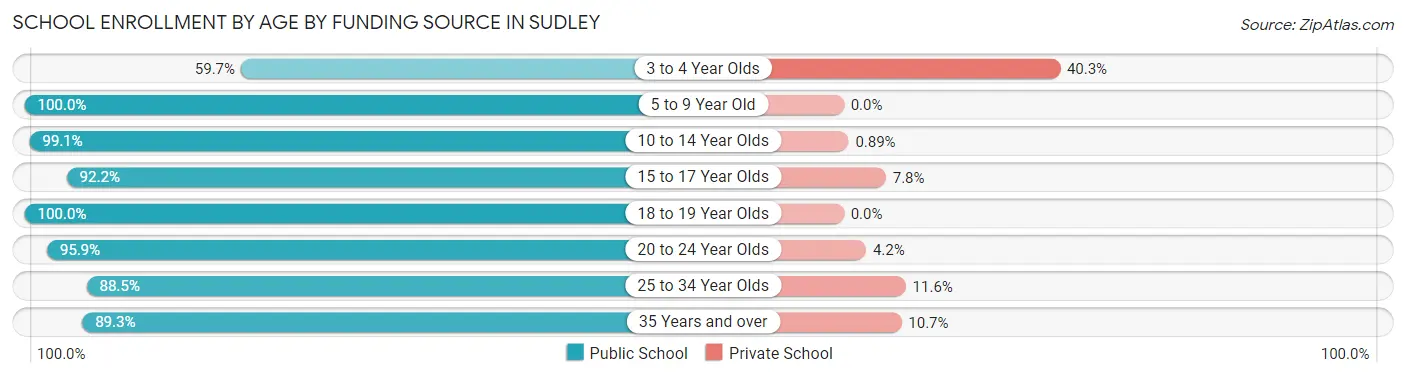
School Enrollment by Age by Funding Source in Sudley
Out of a total of 4,743 students who are enrolled in schools in Sudley, 180 (3.8%) attend a private institution, while the remaining 4,563 (96.2%) are enrolled in public schools. The age group of 3 to 4 year olds has the highest likelihood of being enrolled in private schools, with 58 (40.3% in the age bracket) enrolled. Conversely, the age group of 5 to 9 year old has the lowest likelihood of being enrolled in a private school, with 1,347 (100.0% in the age bracket) attending a public institution.
| Age Bracket | Public School | Private School |
| 3 to 4 Year Olds | 86 (59.7%) | 58 (40.3%) |
| 5 to 9 Year Old | 1,347 (100.0%) | 0 (0.0%) |
| 10 to 14 Year Olds | 1,790 (99.1%) | 16 (0.9%) |
| 15 to 17 Year Olds | 482 (92.2%) | 41 (7.8%) |
| 18 to 19 Year Olds | 213 (100.0%) | 0 (0.0%) |
| 20 to 24 Year Olds | 208 (95.9%) | 9 (4.2%) |
| 25 to 34 Year Olds | 222 (88.4%) | 29 (11.6%) |
| 35 Years and over | 216 (89.3%) | 26 (10.7%) |
| Total | 4,563 (96.2%) | 180 (3.8%) |
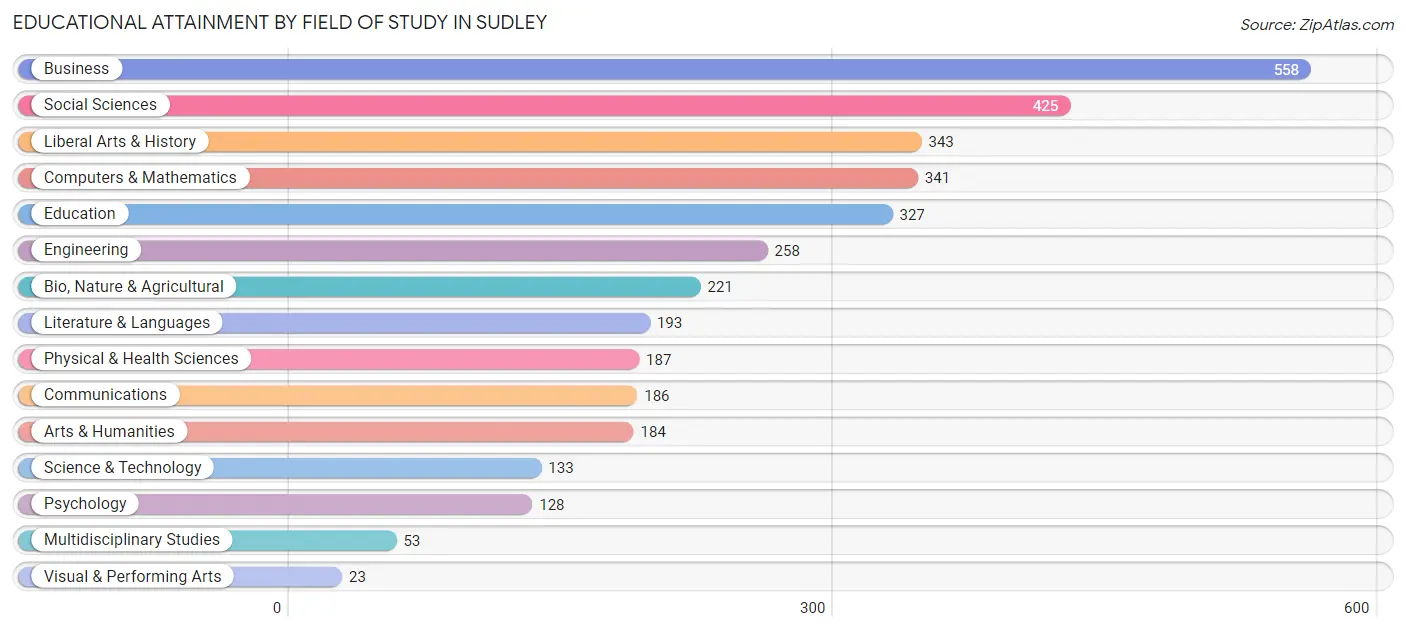
Educational Attainment by Field of Study in Sudley
Business (558 | 15.7%), social sciences (425 | 11.9%), liberal arts & history (343 | 9.6%), computers & mathematics (341 | 9.6%), and education (327 | 9.2%) are the most common fields of study among 3,560 individuals in Sudley who have obtained a bachelor's degree or higher.
| Field of Study | # Graduates | % Graduates |
| Computers & Mathematics | 341 | 9.6% |
| Bio, Nature & Agricultural | 221 | 6.2% |
| Physical & Health Sciences | 187 | 5.2% |
| Psychology | 128 | 3.6% |
| Social Sciences | 425 | 11.9% |
| Engineering | 258 | 7.2% |
| Multidisciplinary Studies | 53 | 1.5% |
| Science & Technology | 133 | 3.7% |
| Business | 558 | 15.7% |
| Education | 327 | 9.2% |
| Literature & Languages | 193 | 5.4% |
| Liberal Arts & History | 343 | 9.6% |
| Visual & Performing Arts | 23 | 0.6% |
| Communications | 186 | 5.2% |
| Arts & Humanities | 184 | 5.2% |
| Total | 3,560 | 100.0% |
Transportation & Commute in Sudley
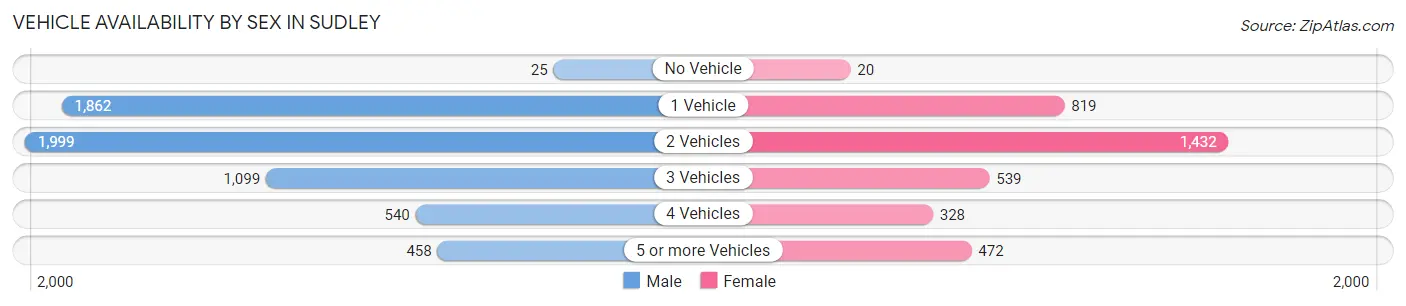
Vehicle Availability by Sex in Sudley
The most prevalent vehicle ownership categories in Sudley are males with 2 vehicles (1,999, accounting for 33.4%) and females with 2 vehicles (1,432, making up 55.4%).
| Vehicles Available | Male | Female |
| No Vehicle | 25 (0.4%) | 20 (0.5%) |
| 1 Vehicle | 1,862 (31.1%) | 819 (22.7%) |
| 2 Vehicles | 1,999 (33.4%) | 1,432 (39.7%) |
| 3 Vehicles | 1,099 (18.4%) | 539 (14.9%) |
| 4 Vehicles | 540 (9.0%) | 328 (9.1%) |
| 5 or more Vehicles | 458 (7.7%) | 472 (13.1%) |
| Total | 5,983 (100.0%) | 3,610 (100.0%) |
Commute Time in Sudley
The most frequently occuring commute durations in Sudley are 15 to 19 minutes (1,355 commuters, 15.6%), 60 to 89 minutes (1,101 commuters, 12.7%), and 30 to 34 minutes (1,001 commuters, 11.5%).
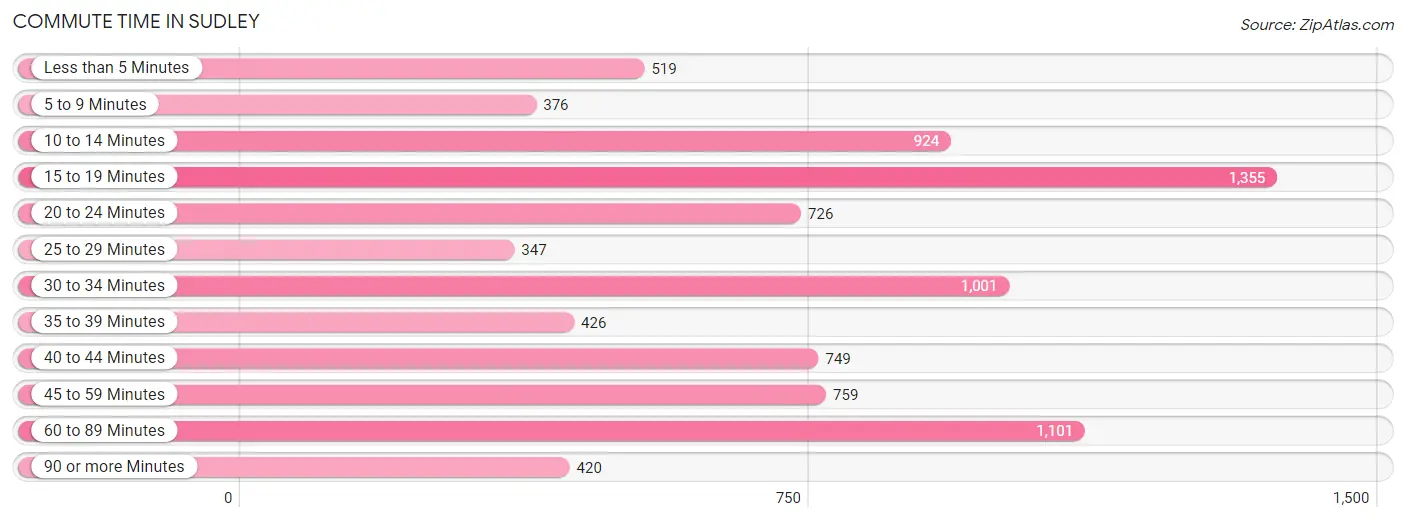
| Commute Time | # Commuters | % Commuters |
| Less than 5 Minutes | 519 | 6.0% |
| 5 to 9 Minutes | 376 | 4.3% |
| 10 to 14 Minutes | 924 | 10.6% |
| 15 to 19 Minutes | 1,355 | 15.6% |
| 20 to 24 Minutes | 726 | 8.3% |
| 25 to 29 Minutes | 347 | 4.0% |
| 30 to 34 Minutes | 1,001 | 11.5% |
| 35 to 39 Minutes | 426 | 4.9% |
| 40 to 44 Minutes | 749 | 8.6% |
| 45 to 59 Minutes | 759 | 8.7% |
| 60 to 89 Minutes | 1,101 | 12.7% |
| 90 or more Minutes | 420 | 4.8% |
Commute Time by Sex in Sudley
The most common commute times in Sudley are 60 to 89 minutes (870 commuters, 15.2%) for males and 15 to 19 minutes (522 commuters, 17.5%) for females.
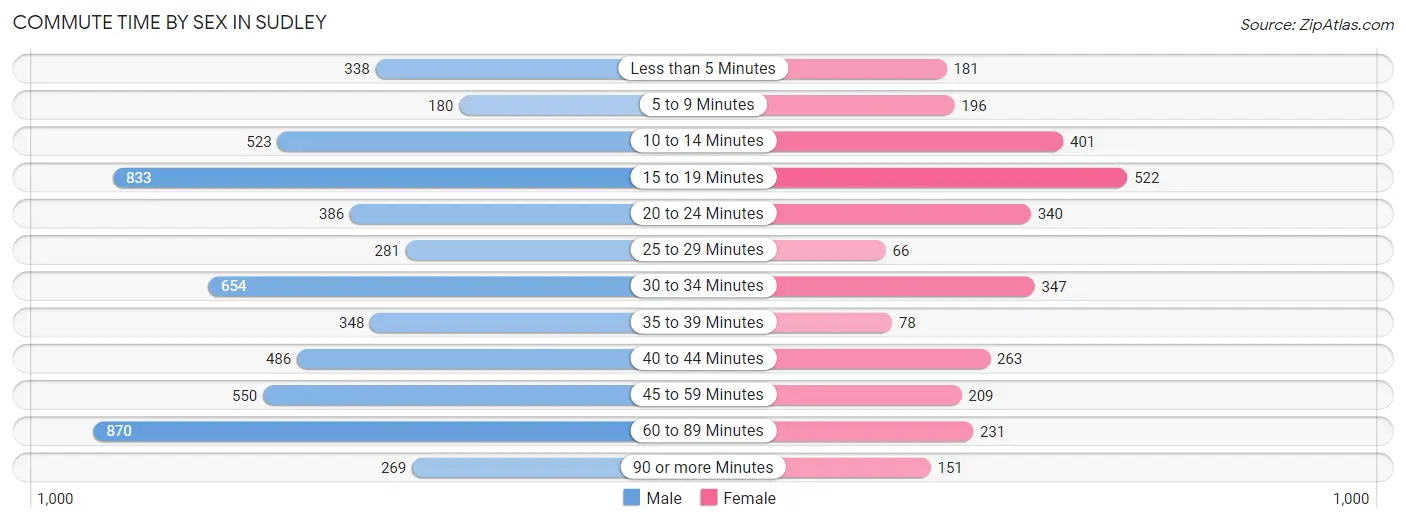
| Commute Time | Male | Female |
| Less than 5 Minutes | 338 (5.9%) | 181 (6.1%) |
| 5 to 9 Minutes | 180 (3.2%) | 196 (6.6%) |
| 10 to 14 Minutes | 523 (9.1%) | 401 (13.4%) |
| 15 to 19 Minutes | 833 (14.6%) | 522 (17.5%) |
| 20 to 24 Minutes | 386 (6.8%) | 340 (11.4%) |
| 25 to 29 Minutes | 281 (4.9%) | 66 (2.2%) |
| 30 to 34 Minutes | 654 (11.4%) | 347 (11.6%) |
| 35 to 39 Minutes | 348 (6.1%) | 78 (2.6%) |
| 40 to 44 Minutes | 486 (8.5%) | 263 (8.8%) |
| 45 to 59 Minutes | 550 (9.6%) | 209 (7.0%) |
| 60 to 89 Minutes | 870 (15.2%) | 231 (7.7%) |
| 90 or more Minutes | 269 (4.7%) | 151 (5.1%) |
Time of Departure to Work by Sex in Sudley
The most frequent times of departure to work in Sudley are 6:00 AM to 6:29 AM (1,042, 18.2%) for males and 6:00 AM to 6:29 AM (631, 21.1%) for females.
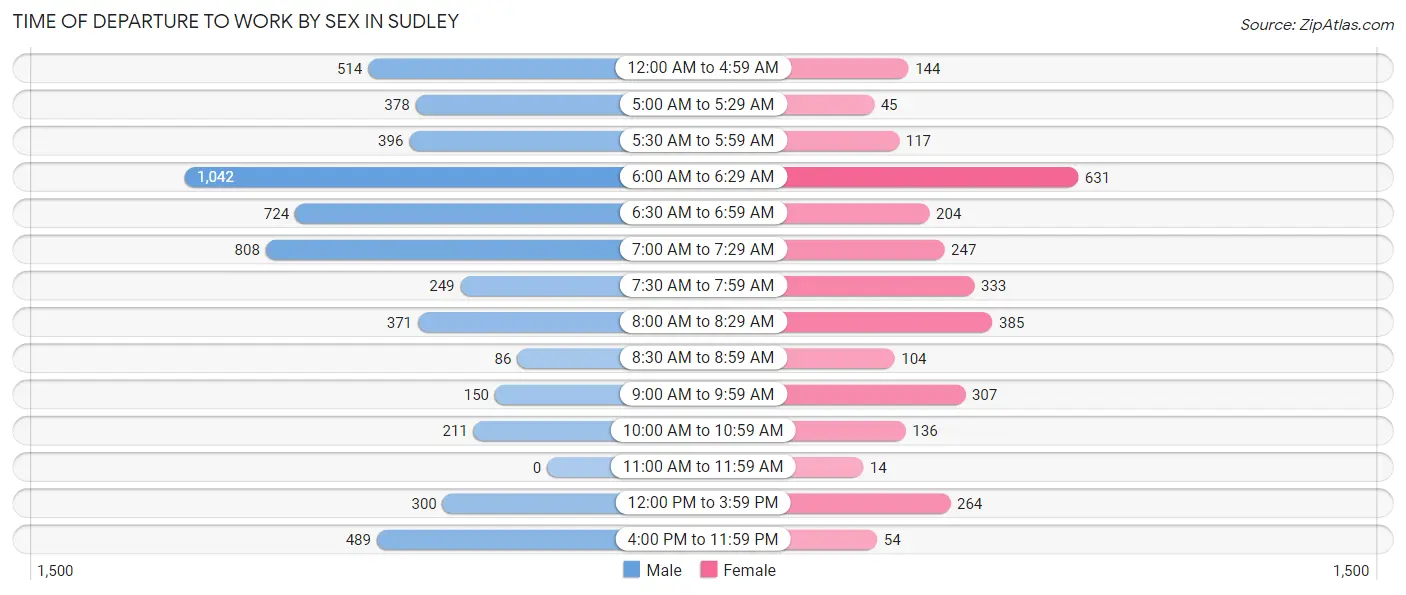
| Time of Departure | Male | Female |
| 12:00 AM to 4:59 AM | 514 (9.0%) | 144 (4.8%) |
| 5:00 AM to 5:29 AM | 378 (6.6%) | 45 (1.5%) |
| 5:30 AM to 5:59 AM | 396 (6.9%) | 117 (3.9%) |
| 6:00 AM to 6:29 AM | 1,042 (18.2%) | 631 (21.1%) |
| 6:30 AM to 6:59 AM | 724 (12.7%) | 204 (6.8%) |
| 7:00 AM to 7:29 AM | 808 (14.1%) | 247 (8.3%) |
| 7:30 AM to 7:59 AM | 249 (4.3%) | 333 (11.2%) |
| 8:00 AM to 8:29 AM | 371 (6.5%) | 385 (12.9%) |
| 8:30 AM to 8:59 AM | 86 (1.5%) | 104 (3.5%) |
| 9:00 AM to 9:59 AM | 150 (2.6%) | 307 (10.3%) |
| 10:00 AM to 10:59 AM | 211 (3.7%) | 136 (4.6%) |
| 11:00 AM to 11:59 AM | 0 (0.0%) | 14 (0.5%) |
| 12:00 PM to 3:59 PM | 300 (5.2%) | 264 (8.8%) |
| 4:00 PM to 11:59 PM | 489 (8.6%) | 54 (1.8%) |
| Total | 5,718 (100.0%) | 2,985 (100.0%) |
Housing Occupancy in Sudley
Occupancy by Ownership in Sudley
Of the total 5,415 dwellings in Sudley, owner-occupied units account for 3,258 (60.2%), while renter-occupied units make up 2,157 (39.8%).
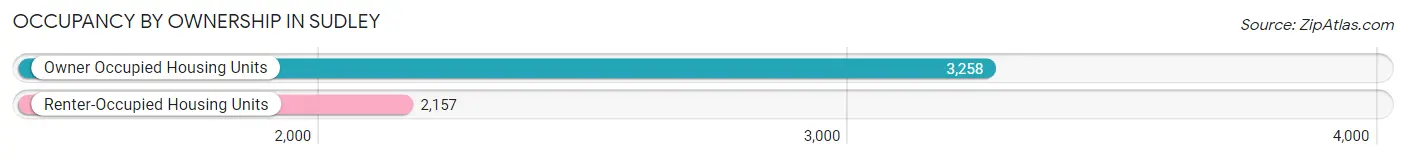
| Occupancy | # Housing Units | % Housing Units |
| Owner Occupied Housing Units | 3,258 | 60.2% |
| Renter-Occupied Housing Units | 2,157 | 39.8% |
| Total Occupied Housing Units | 5,415 | 100.0% |
Occupancy by Household Size in Sudley
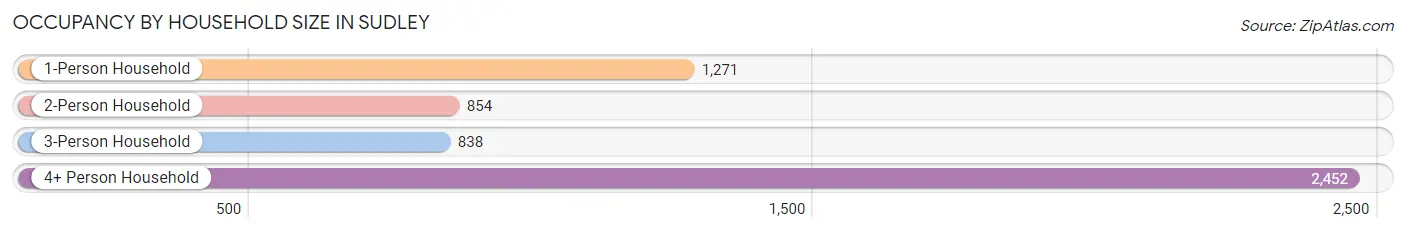
| Household Size | # Housing Units | % Housing Units |
| 1-Person Household | 1,271 | 23.5% |
| 2-Person Household | 854 | 15.8% |
| 3-Person Household | 838 | 15.5% |
| 4+ Person Household | 2,452 | 45.3% |
| Total Housing Units | 5,415 | 100.0% |
Occupancy by Ownership by Household Size in Sudley
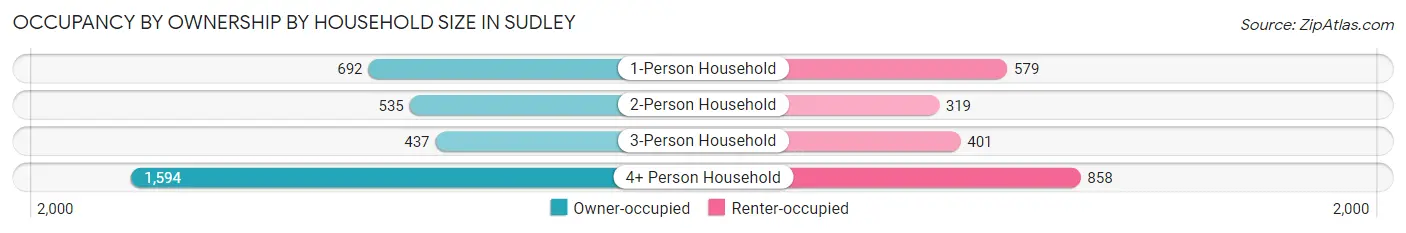
| Household Size | Owner-occupied | Renter-occupied |
| 1-Person Household | 692 (54.4%) | 579 (45.6%) |
| 2-Person Household | 535 (62.6%) | 319 (37.3%) |
| 3-Person Household | 437 (52.1%) | 401 (47.8%) |
| 4+ Person Household | 1,594 (65.0%) | 858 (35.0%) |
| Total Housing Units | 3,258 (60.2%) | 2,157 (39.8%) |
Occupancy by Educational Attainment in Sudley
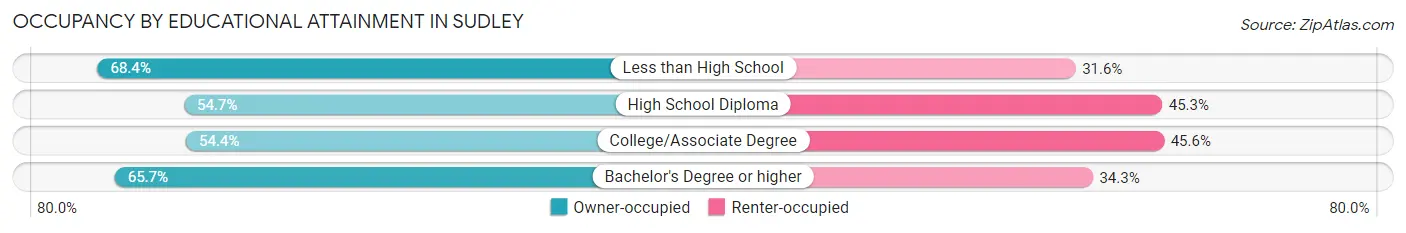
| Household Size | Owner-occupied | Renter-occupied |
| Less than High School | 557 (68.4%) | 257 (31.6%) |
| High School Diploma | 826 (54.7%) | 684 (45.3%) |
| College/Associate Degree | 749 (54.4%) | 628 (45.6%) |
| Bachelor's Degree or higher | 1,126 (65.7%) | 588 (34.3%) |
Occupancy by Age of Householder in Sudley
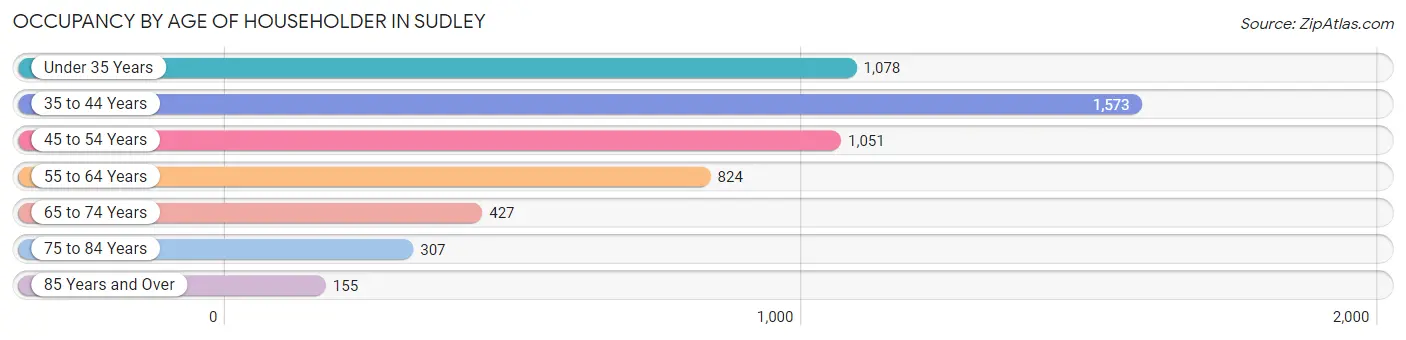
| Age Bracket | # Households | % Households |
| Under 35 Years | 1,078 | 19.9% |
| 35 to 44 Years | 1,573 | 29.0% |
| 45 to 54 Years | 1,051 | 19.4% |
| 55 to 64 Years | 824 | 15.2% |
| 65 to 74 Years | 427 | 7.9% |
| 75 to 84 Years | 307 | 5.7% |
| 85 Years and Over | 155 | 2.9% |
| Total | 5,415 | 100.0% |
Housing Finances in Sudley
Median Income by Occupancy in Sudley
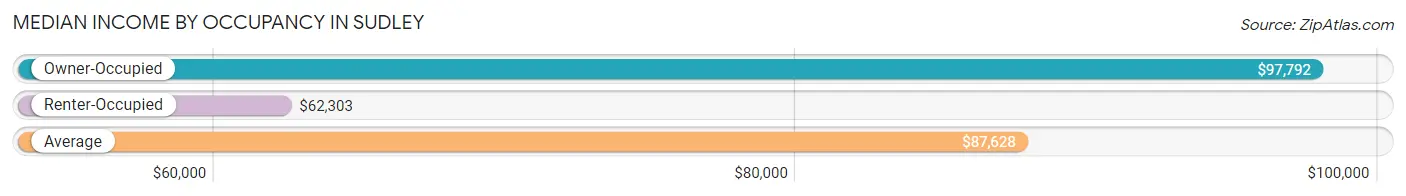
| Occupancy Type | # Households | Median Income |
| Owner-Occupied | 3,258 (60.2%) | $97,792 |
| Renter-Occupied | 2,157 (39.8%) | $62,303 |
| Average | 5,415 (100.0%) | $87,628 |
Occupancy by Householder Income Bracket in Sudley
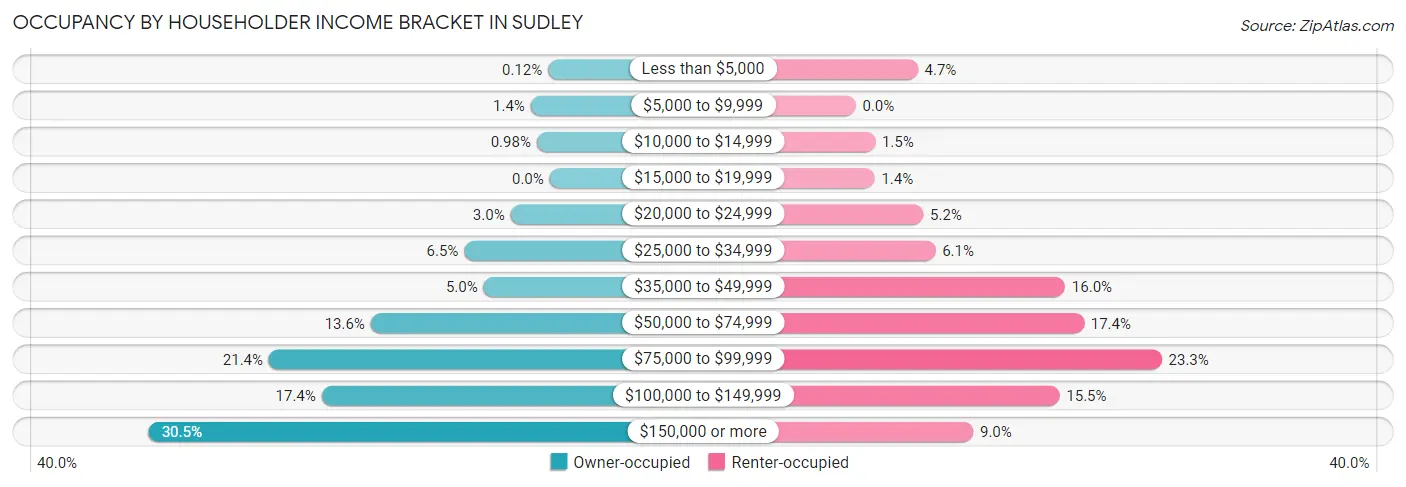
| Income Bracket | Owner-occupied | Renter-occupied |
| Less than $5,000 | 4 (0.1%) | 102 (4.7%) |
| $5,000 to $9,999 | 47 (1.4%) | 0 (0.0%) |
| $10,000 to $14,999 | 32 (1.0%) | 32 (1.5%) |
| $15,000 to $19,999 | 0 (0.0%) | 31 (1.4%) |
| $20,000 to $24,999 | 97 (3.0%) | 111 (5.1%) |
| $25,000 to $34,999 | 212 (6.5%) | 131 (6.1%) |
| $35,000 to $49,999 | 164 (5.0%) | 344 (16.0%) |
| $50,000 to $74,999 | 444 (13.6%) | 375 (17.4%) |
| $75,000 to $99,999 | 697 (21.4%) | 503 (23.3%) |
| $100,000 to $149,999 | 566 (17.4%) | 335 (15.5%) |
| $150,000 or more | 995 (30.5%) | 193 (8.9%) |
| Total | 3,258 (100.0%) | 2,157 (100.0%) |
Monthly Housing Cost Tiers in Sudley
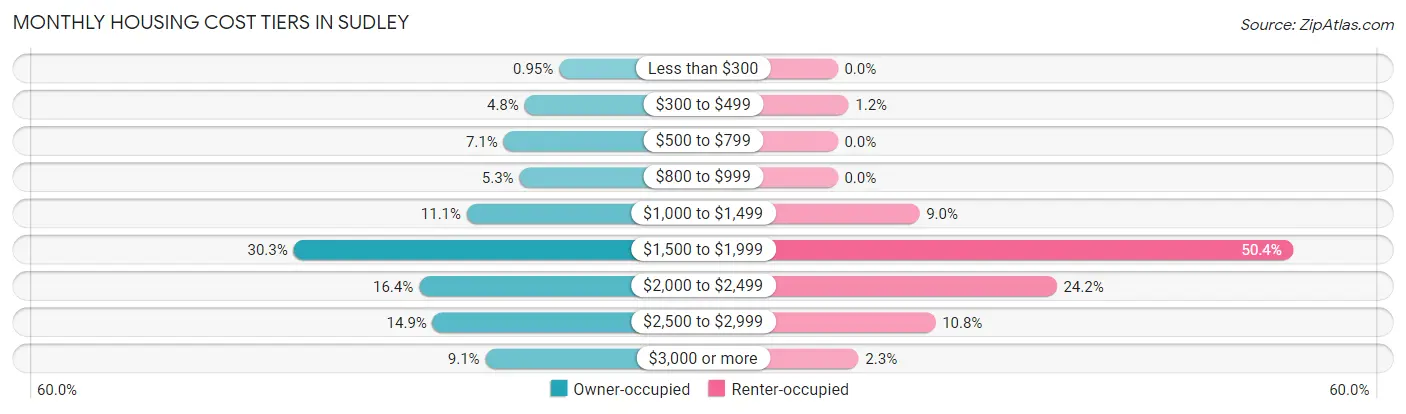
| Monthly Cost | Owner-occupied | Renter-occupied |
| Less than $300 | 31 (0.9%) | 0 (0.0%) |
| $300 to $499 | 155 (4.8%) | 26 (1.2%) |
| $500 to $799 | 231 (7.1%) | 0 (0.0%) |
| $800 to $999 | 174 (5.3%) | 0 (0.0%) |
| $1,000 to $1,499 | 363 (11.1%) | 195 (9.0%) |
| $1,500 to $1,999 | 987 (30.3%) | 1,087 (50.4%) |
| $2,000 to $2,499 | 535 (16.4%) | 522 (24.2%) |
| $2,500 to $2,999 | 486 (14.9%) | 233 (10.8%) |
| $3,000 or more | 296 (9.1%) | 50 (2.3%) |
| Total | 3,258 (100.0%) | 2,157 (100.0%) |
Physical Housing Characteristics in Sudley
Housing Structures in Sudley
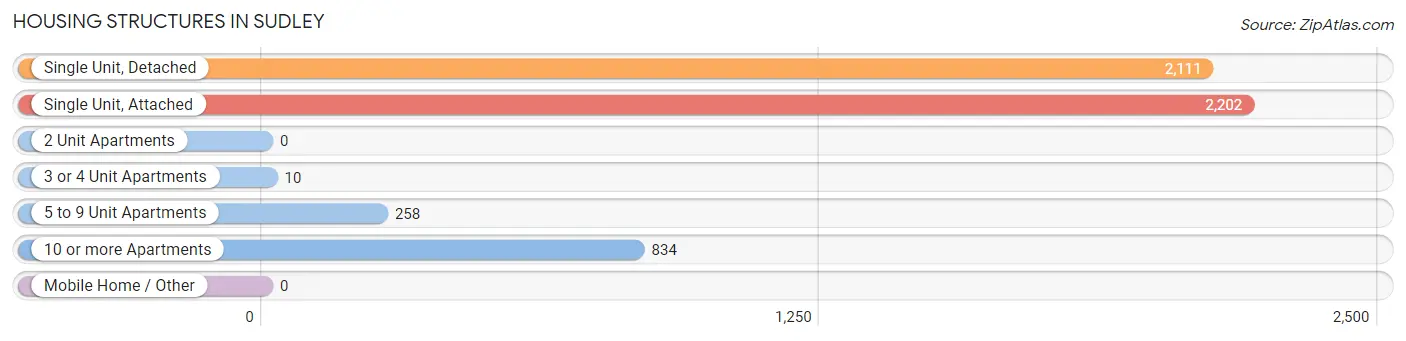
| Structure Type | # Housing Units | % Housing Units |
| Single Unit, Detached | 2,111 | 39.0% |
| Single Unit, Attached | 2,202 | 40.7% |
| 2 Unit Apartments | 0 | 0.0% |
| 3 or 4 Unit Apartments | 10 | 0.2% |
| 5 to 9 Unit Apartments | 258 | 4.8% |
| 10 or more Apartments | 834 | 15.4% |
| Mobile Home / Other | 0 | 0.0% |
| Total | 5,415 | 100.0% |
Housing Structures by Occupancy in Sudley
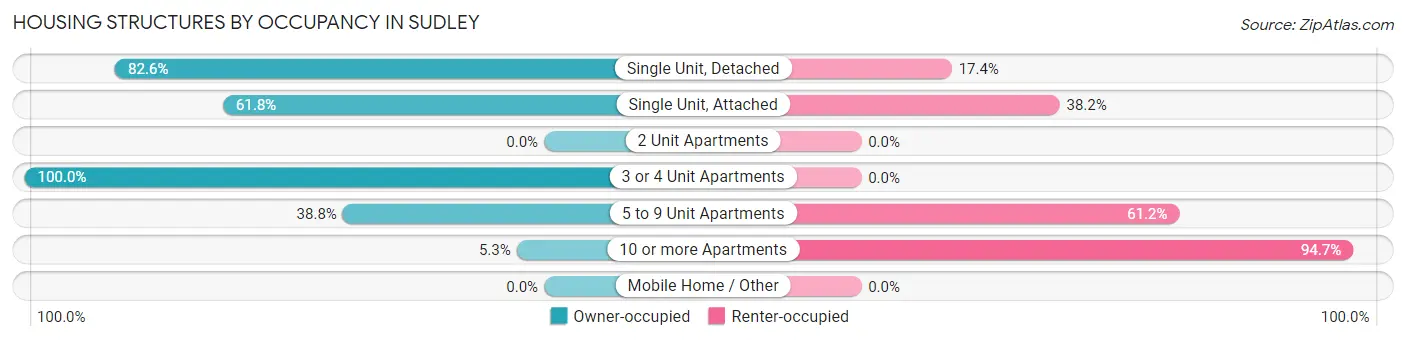
| Structure Type | Owner-occupied | Renter-occupied |
| Single Unit, Detached | 1,743 (82.6%) | 368 (17.4%) |
| Single Unit, Attached | 1,361 (61.8%) | 841 (38.2%) |
| 2 Unit Apartments | 0 (0.0%) | 0 (0.0%) |
| 3 or 4 Unit Apartments | 10 (100.0%) | 0 (0.0%) |
| 5 to 9 Unit Apartments | 100 (38.8%) | 158 (61.2%) |
| 10 or more Apartments | 44 (5.3%) | 790 (94.7%) |
| Mobile Home / Other | 0 (0.0%) | 0 (0.0%) |
| Total | 3,258 (60.2%) | 2,157 (39.8%) |
Housing Structures by Number of Rooms in Sudley
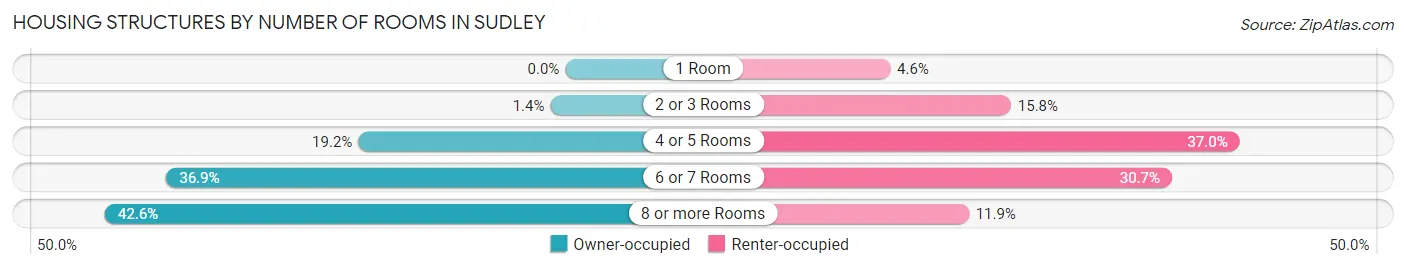
| Number of Rooms | Owner-occupied | Renter-occupied |
| 1 Room | 0 (0.0%) | 100 (4.6%) |
| 2 or 3 Rooms | 45 (1.4%) | 341 (15.8%) |
| 4 or 5 Rooms | 624 (19.2%) | 797 (36.9%) |
| 6 or 7 Rooms | 1,202 (36.9%) | 662 (30.7%) |
| 8 or more Rooms | 1,387 (42.6%) | 257 (11.9%) |
| Total | 3,258 (100.0%) | 2,157 (100.0%) |
Housing Structure by Heating Type in Sudley
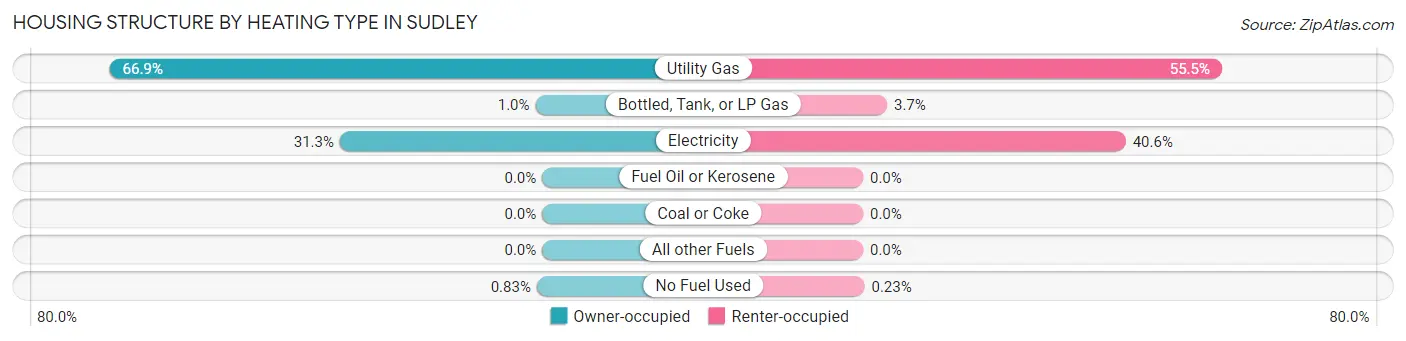
| Heating Type | Owner-occupied | Renter-occupied |
| Utility Gas | 2,178 (66.8%) | 1,196 (55.4%) |
| Bottled, Tank, or LP Gas | 34 (1.0%) | 80 (3.7%) |
| Electricity | 1,019 (31.3%) | 876 (40.6%) |
| Fuel Oil or Kerosene | 0 (0.0%) | 0 (0.0%) |
| Coal or Coke | 0 (0.0%) | 0 (0.0%) |
| All other Fuels | 0 (0.0%) | 0 (0.0%) |
| No Fuel Used | 27 (0.8%) | 5 (0.2%) |
| Total | 3,258 (100.0%) | 2,157 (100.0%) |
Household Vehicle Usage in Sudley
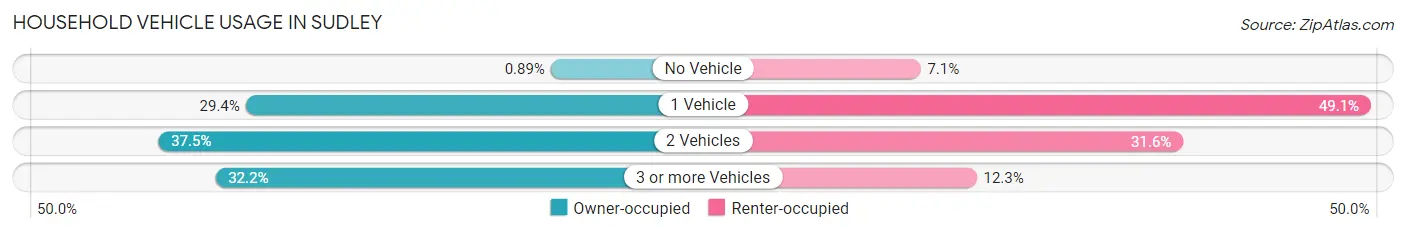
| Vehicles per Household | Owner-occupied | Renter-occupied |
| No Vehicle | 29 (0.9%) | 152 (7.0%) |
| 1 Vehicle | 957 (29.4%) | 1,059 (49.1%) |
| 2 Vehicles | 1,223 (37.5%) | 681 (31.6%) |
| 3 or more Vehicles | 1,049 (32.2%) | 265 (12.3%) |
| Total | 3,258 (100.0%) | 2,157 (100.0%) |
Real Estate & Mortgages in Sudley
Real Estate and Mortgage Overview in Sudley
| Characteristic | Without Mortgage | With Mortgage |
| Housing Units | 555 | 2,703 |
| Median Property Value | $434,800 | $380,000 |
| Median Household Income | $102,361 | $789 |
| Monthly Housing Costs | $652 | $296 |
| Real Estate Taxes | $4,306 | $141 |
Property Value by Mortgage Status in Sudley
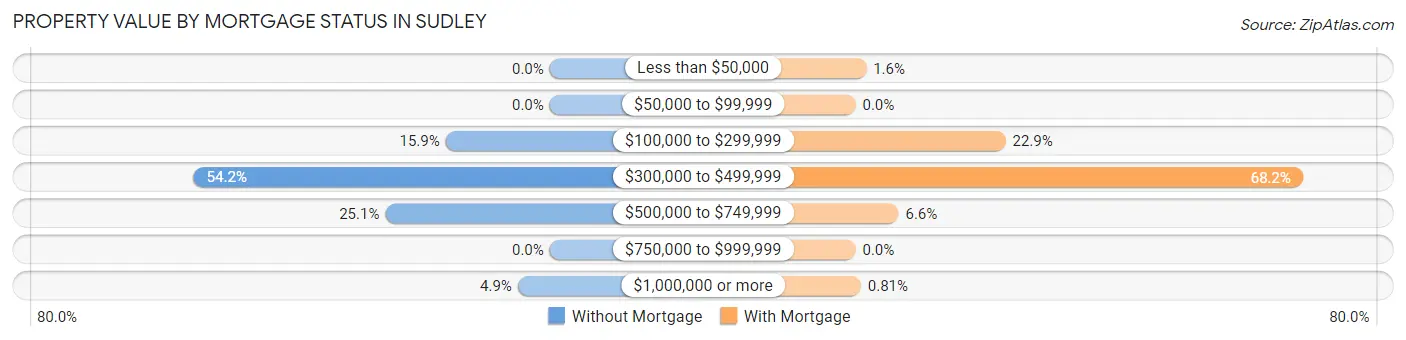
| Property Value | Without Mortgage | With Mortgage |
| Less than $50,000 | 0 (0.0%) | 44 (1.6%) |
| $50,000 to $99,999 | 0 (0.0%) | 0 (0.0%) |
| $100,000 to $299,999 | 88 (15.9%) | 618 (22.9%) |
| $300,000 to $499,999 | 301 (54.2%) | 1,842 (68.1%) |
| $500,000 to $749,999 | 139 (25.1%) | 177 (6.6%) |
| $750,000 to $999,999 | 0 (0.0%) | 0 (0.0%) |
| $1,000,000 or more | 27 (4.9%) | 22 (0.8%) |
| Total | 555 (100.0%) | 2,703 (100.0%) |
Household Income by Mortgage Status in Sudley
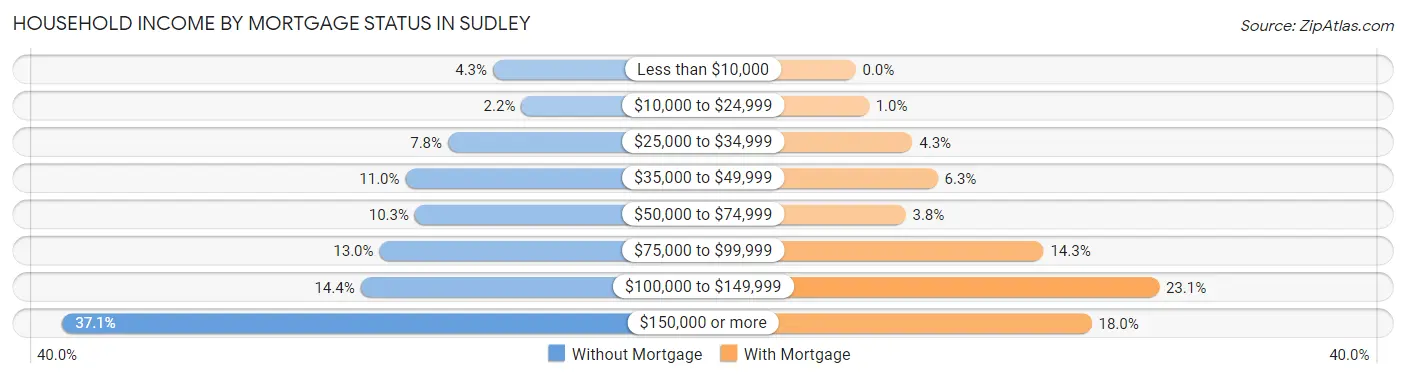
| Household Income | Without Mortgage | With Mortgage |
| Less than $10,000 | 24 (4.3%) | 0 (0.0%) |
| $10,000 to $24,999 | 12 (2.2%) | 27 (1.0%) |
| $25,000 to $34,999 | 43 (7.7%) | 117 (4.3%) |
| $35,000 to $49,999 | 61 (11.0%) | 169 (6.2%) |
| $50,000 to $74,999 | 57 (10.3%) | 103 (3.8%) |
| $75,000 to $99,999 | 72 (13.0%) | 387 (14.3%) |
| $100,000 to $149,999 | 80 (14.4%) | 625 (23.1%) |
| $150,000 or more | 206 (37.1%) | 486 (18.0%) |
| Total | 555 (100.0%) | 2,703 (100.0%) |
Property Value to Household Income Ratio in Sudley
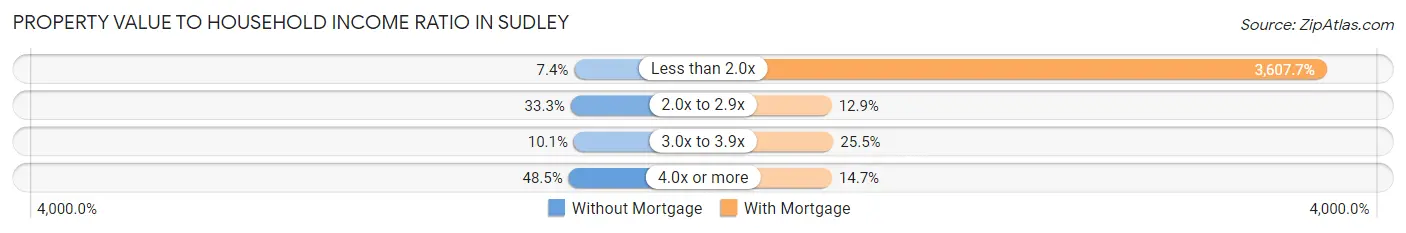
| Value-to-Income Ratio | Without Mortgage | With Mortgage |
| Less than 2.0x | 41 (7.4%) | 97,516 (3,607.7%) |
| 2.0x to 2.9x | 185 (33.3%) | 348 (12.9%) |
| 3.0x to 3.9x | 56 (10.1%) | 689 (25.5%) |
| 4.0x or more | 269 (48.5%) | 396 (14.6%) |
| Total | 555 (100.0%) | 2,703 (100.0%) |
Real Estate Taxes by Mortgage Status in Sudley
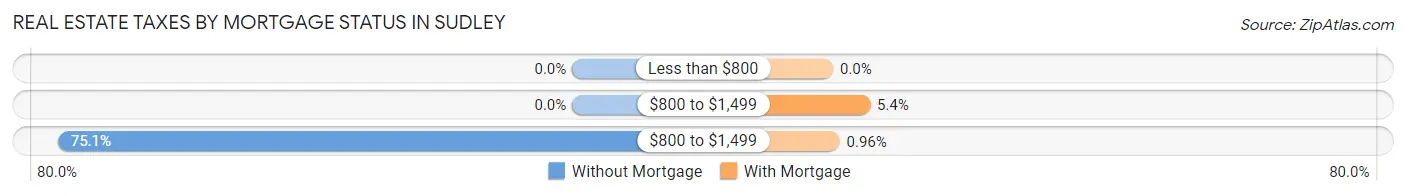
| Property Taxes | Without Mortgage | With Mortgage |
| Less than $800 | 0 (0.0%) | 0 (0.0%) |
| $800 to $1,499 | 0 (0.0%) | 146 (5.4%) |
| $800 to $1,499 | 417 (75.1%) | 26 (1.0%) |
| Total | 555 (100.0%) | 2,703 (100.0%) |
Health & Disability in Sudley
Health Insurance Coverage by Age in Sudley
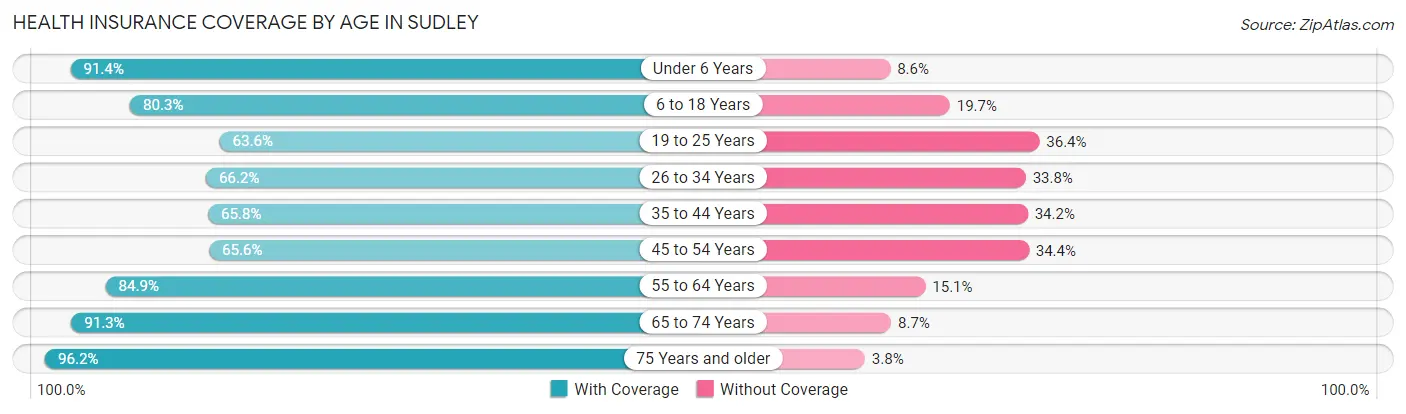
| Age Bracket | With Coverage | Without Coverage |
| Under 6 Years | 1,793 (91.4%) | 168 (8.6%) |
| 6 to 18 Years | 2,927 (80.3%) | 717 (19.7%) |
| 19 to 25 Years | 1,114 (63.6%) | 637 (36.4%) |
| 26 to 34 Years | 1,733 (66.2%) | 886 (33.8%) |
| 35 to 44 Years | 2,156 (65.8%) | 1,121 (34.2%) |
| 45 to 54 Years | 1,546 (65.6%) | 811 (34.4%) |
| 55 to 64 Years | 1,364 (84.9%) | 243 (15.1%) |
| 65 to 74 Years | 1,139 (91.3%) | 109 (8.7%) |
| 75 Years and older | 752 (96.2%) | 30 (3.8%) |
| Total | 14,524 (75.5%) | 4,722 (24.5%) |
Health Insurance Coverage by Citizenship Status in Sudley
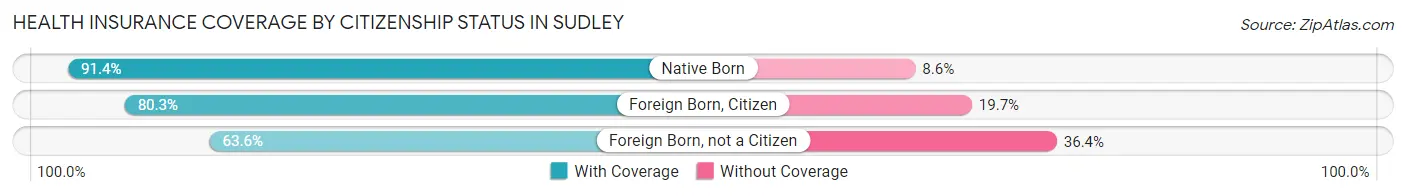
| Citizenship Status | With Coverage | Without Coverage |
| Native Born | 1,793 (91.4%) | 168 (8.6%) |
| Foreign Born, Citizen | 2,927 (80.3%) | 717 (19.7%) |
| Foreign Born, not a Citizen | 1,114 (63.6%) | 637 (36.4%) |
Health Insurance Coverage by Household Income in Sudley
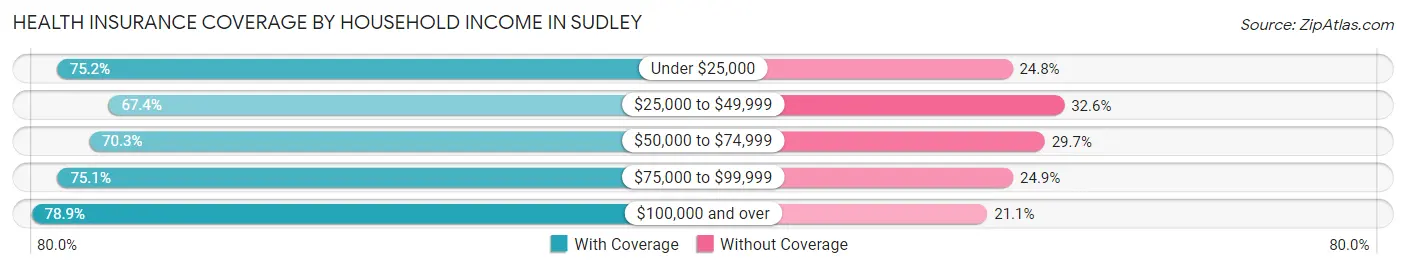
| Household Income | With Coverage | Without Coverage |
| Under $25,000 | 657 (75.2%) | 217 (24.8%) |
| $25,000 to $49,999 | 1,353 (67.4%) | 654 (32.6%) |
| $50,000 to $74,999 | 1,742 (70.3%) | 735 (29.7%) |
| $75,000 to $99,999 | 3,676 (75.1%) | 1,221 (24.9%) |
| $100,000 and over | 7,094 (78.9%) | 1,893 (21.1%) |
Public vs Private Health Insurance Coverage by Age in Sudley
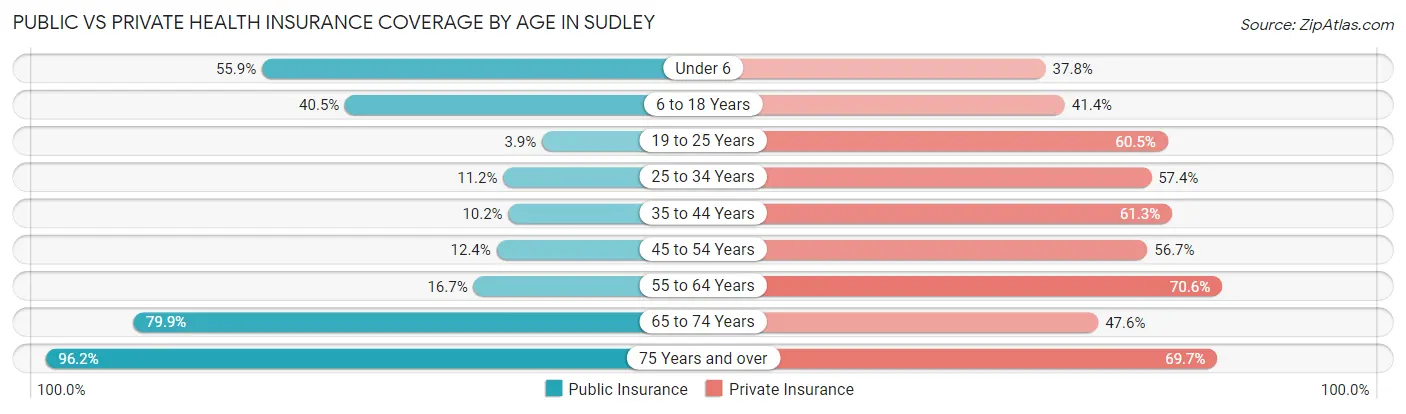
| Age Bracket | Public Insurance | Private Insurance |
| Under 6 | 1,097 (55.9%) | 742 (37.8%) |
| 6 to 18 Years | 1,476 (40.5%) | 1,509 (41.4%) |
| 19 to 25 Years | 69 (3.9%) | 1,059 (60.5%) |
| 25 to 34 Years | 292 (11.2%) | 1,504 (57.4%) |
| 35 to 44 Years | 334 (10.2%) | 2,008 (61.3%) |
| 45 to 54 Years | 292 (12.4%) | 1,337 (56.7%) |
| 55 to 64 Years | 268 (16.7%) | 1,134 (70.6%) |
| 65 to 74 Years | 997 (79.9%) | 594 (47.6%) |
| 75 Years and over | 752 (96.2%) | 545 (69.7%) |
| Total | 5,577 (29.0%) | 10,432 (54.2%) |
Disability Status by Sex by Age in Sudley
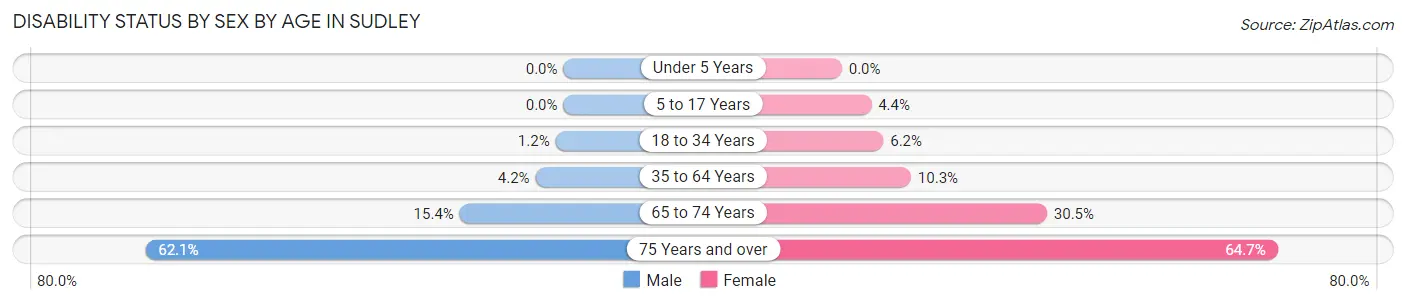
| Age Bracket | Male | Female |
| Under 5 Years | 0 (0.0%) | 0 (0.0%) |
| 5 to 17 Years | 0 (0.0%) | 77 (4.4%) |
| 18 to 34 Years | 28 (1.2%) | 130 (6.2%) |
| 35 to 64 Years | 167 (4.2%) | 330 (10.3%) |
| 65 to 74 Years | 89 (15.4%) | 204 (30.4%) |
| 75 Years and over | 234 (62.1%) | 262 (64.7%) |
Disability Class by Sex by Age in Sudley
Disability Class: Hearing Difficulty
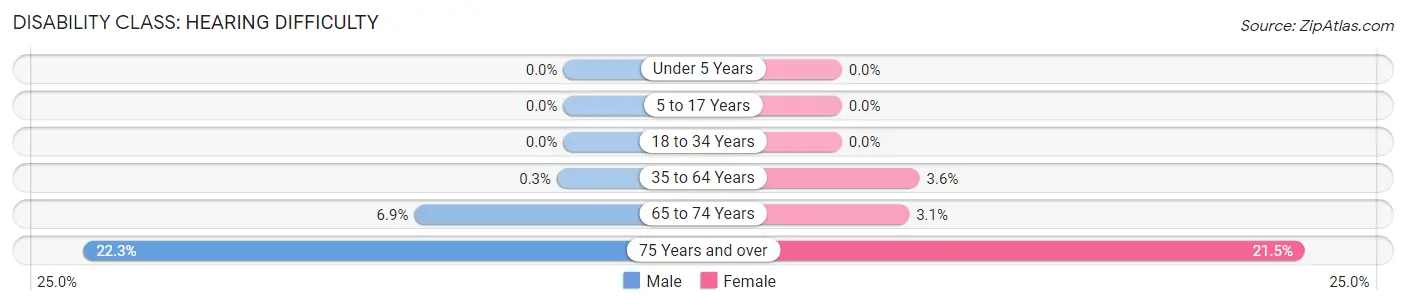
| Age Bracket | Male | Female |
| Under 5 Years | 0 (0.0%) | 0 (0.0%) |
| 5 to 17 Years | 0 (0.0%) | 0 (0.0%) |
| 18 to 34 Years | 0 (0.0%) | 0 (0.0%) |
| 35 to 64 Years | 12 (0.3%) | 116 (3.6%) |
| 65 to 74 Years | 40 (6.9%) | 21 (3.1%) |
| 75 Years and over | 84 (22.3%) | 87 (21.5%) |
Disability Class: Vision Difficulty
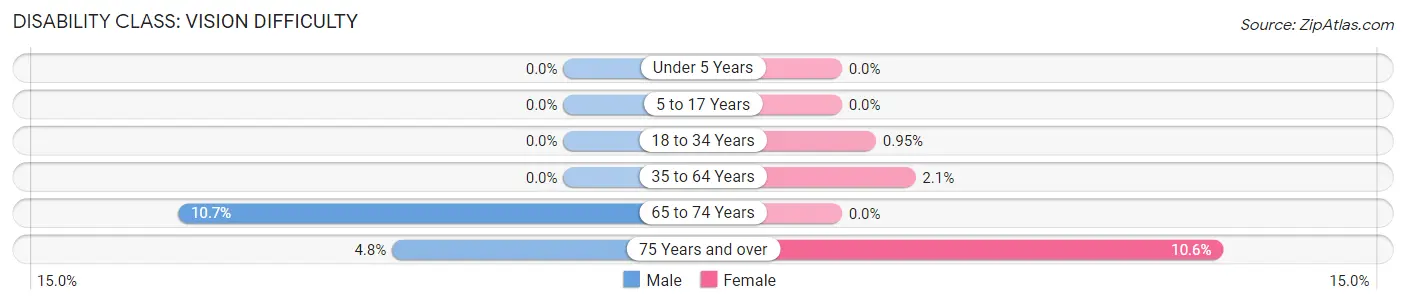
| Age Bracket | Male | Female |
| Under 5 Years | 0 (0.0%) | 0 (0.0%) |
| 5 to 17 Years | 0 (0.0%) | 0 (0.0%) |
| 18 to 34 Years | 0 (0.0%) | 20 (0.9%) |
| 35 to 64 Years | 0 (0.0%) | 66 (2.1%) |
| 65 to 74 Years | 62 (10.7%) | 0 (0.0%) |
| 75 Years and over | 18 (4.8%) | 43 (10.6%) |
Disability Class: Cognitive Difficulty
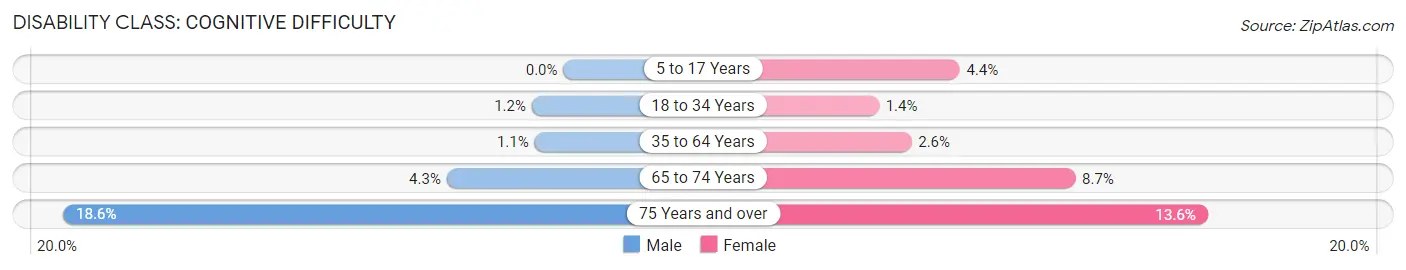
| Age Bracket | Male | Female |
| 5 to 17 Years | 0 (0.0%) | 77 (4.4%) |
| 18 to 34 Years | 28 (1.2%) | 29 (1.4%) |
| 35 to 64 Years | 43 (1.1%) | 83 (2.6%) |
| 65 to 74 Years | 25 (4.3%) | 58 (8.7%) |
| 75 Years and over | 70 (18.6%) | 55 (13.6%) |
Disability Class: Ambulatory Difficulty
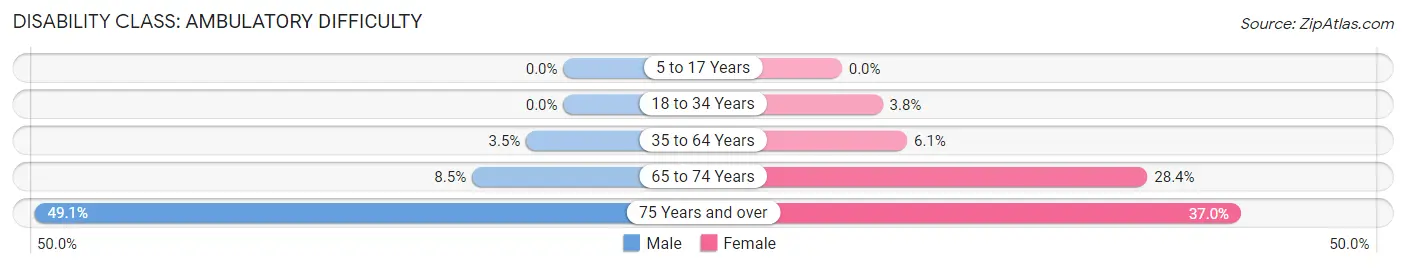
| Age Bracket | Male | Female |
| 5 to 17 Years | 0 (0.0%) | 0 (0.0%) |
| 18 to 34 Years | 0 (0.0%) | 80 (3.8%) |
| 35 to 64 Years | 139 (3.5%) | 195 (6.1%) |
| 65 to 74 Years | 49 (8.5%) | 190 (28.4%) |
| 75 Years and over | 185 (49.1%) | 150 (37.0%) |
Disability Class: Self-Care Difficulty
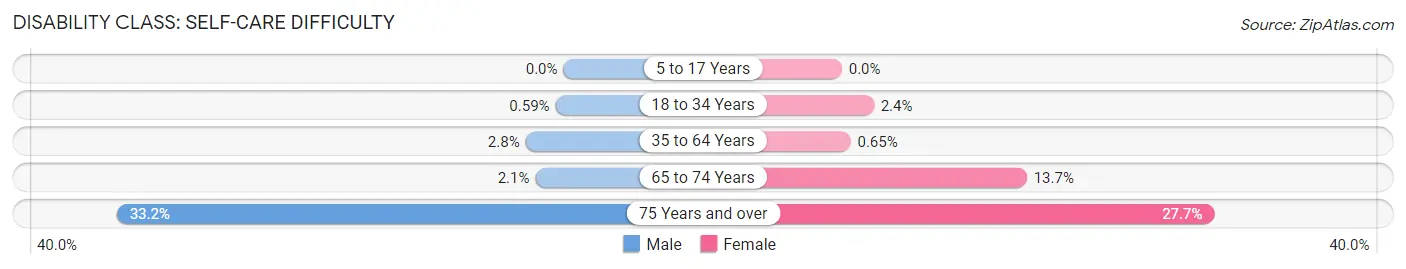
| Age Bracket | Male | Female |
| 5 to 17 Years | 0 (0.0%) | 0 (0.0%) |
| 18 to 34 Years | 14 (0.6%) | 50 (2.4%) |
| 35 to 64 Years | 113 (2.8%) | 21 (0.6%) |
| 65 to 74 Years | 12 (2.1%) | 92 (13.7%) |
| 75 Years and over | 125 (33.2%) | 112 (27.7%) |
Technology Access in Sudley
Computing Device Access in Sudley
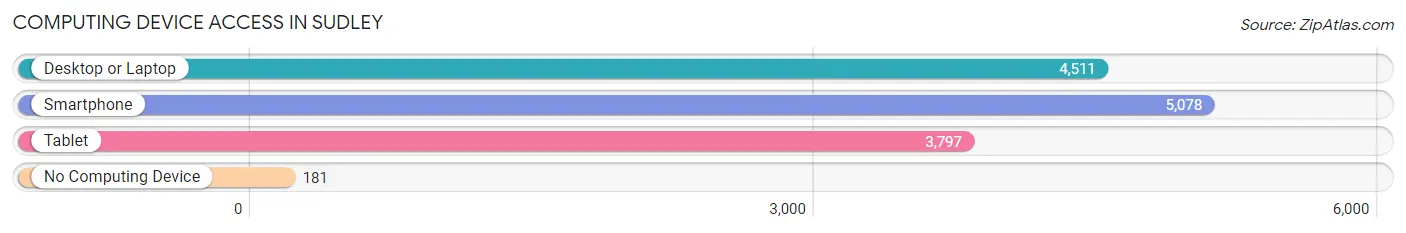
| Device Type | # Households | % Households |
| Desktop or Laptop | 4,511 | 83.3% |
| Smartphone | 5,078 | 93.8% |
| Tablet | 3,797 | 70.1% |
| No Computing Device | 181 | 3.3% |
| Total | 5,415 | 100.0% |
Internet Access in Sudley
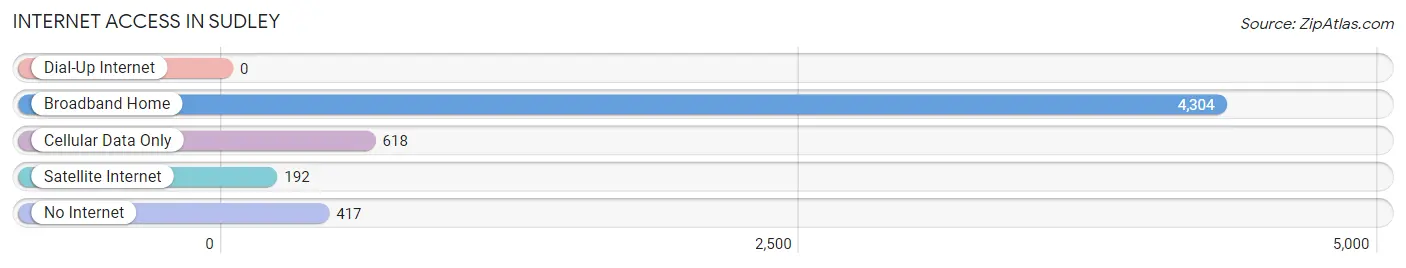
| Internet Type | # Households | % Households |
| Dial-Up Internet | 0 | 0.0% |
| Broadband Home | 4,304 | 79.5% |
| Cellular Data Only | 618 | 11.4% |
| Satellite Internet | 192 | 3.5% |
| No Internet | 417 | 7.7% |
| Total | 5,415 | 100.0% |
Sudley Summary
Sudley is a census-designated place (CDP) located in Prince William County, Virginia. It is situated in the northern part of the county, approximately 25 miles southwest of Washington, D.C. The population of Sudley was 8,845 at the 2010 census.
History
Sudley was first settled in the early 1700s by the Sudley family, who were among the first settlers in the area. The family owned a large tract of land in the area, which was eventually divided up and sold off. The area was known as Sudley Springs until the late 1800s, when it was renamed Sudley.
In the late 1800s, the area began to develop as a residential community. The first post office was established in 1891, and the first school was built in 1895. The area continued to grow throughout the 20th century, and by the 2000 census, the population had grown to 8,845.
Geography
Sudley is located at 38°44'25" North, 77°30'45" West (38.740278, -77.5125). According to the United States Census Bureau, the CDP has a total area of 4.2 square miles, all of it land.
Economy
Sudley is primarily a residential community, with most of its residents commuting to nearby cities for work. The area is home to several small businesses, including restaurants, retail stores, and professional services.
Demographics
As of the 2010 census, there were 8,845 people, 3,093 households, and 2,521 families residing in the CDP. The population density was 2,097.3 people per square mile. The racial makeup of the CDP was 68.2% White, 17.3% African American, 0.4% Native American, 8.2% Asian, 0.1% Pacific Islander, 2.2% from other races, and 3.7% from two or more races. Hispanic or Latino of any race were 6.2% of the population.
The median income for a household in the CDP was $90,945, and the median income for a family was $97,945. Males had a median income of $63,958 versus $45,958 for females. The per capita income for the CDP was $35,945. About 2.2% of families and 3.2% of the population were below the poverty line, including 4.2% of those under age 18 and 2.2% of those age 65 or over.
Common Questions
What is Per Capita Income in Sudley?
Per Capita income in Sudley is $30,488.
What is the Median Family Income in Sudley?
Median Family Income in Sudley is $85,568.
What is the Median Household income in Sudley?
Median Household Income in Sudley is $87,628.
What is Income or Wage Gap in Sudley?
Income or Wage Gap in Sudley is 43.3%.
Women in Sudley earn 56.7 cents for every dollar earned by a man.
What is Inequality or Gini Index in Sudley?
Inequality or Gini Index in Sudley is 0.37.
What is the Total Population of Sudley?
Total Population of Sudley is 19,289.
What is the Total Male Population of Sudley?
Total Male Population of Sudley is 10,320.
What is the Total Female Population of Sudley?
Total Female Population of Sudley is 8,969.
What is the Ratio of Males per 100 Females in Sudley?
There are 115.06 Males per 100 Females in Sudley.
What is the Ratio of Females per 100 Males in Sudley?
There are 86.91 Females per 100 Males in Sudley.
What is the Median Population Age in Sudley?
Median Population Age in Sudley is 33.4 Years.
What is the Average Family Size in Sudley
Average Family Size in Sudley is 4.0 People.
What is the Average Household Size in Sudley
Average Household Size in Sudley is 3.5 People.
How Large is the Labor Force in Sudley?
There are 10,327 People in the Labor Forcein in Sudley.
What is the Percentage of People in the Labor Force in Sudley?
73.3% of People are in the Labor Force in Sudley.
What is the Unemployment Rate in Sudley?
Unemployment Rate in Sudley is 4.0%.