Floyd, VA Map & Demographics
Floyd Map
Floyd Overview
$33,372
PER CAPITA INCOME
$81,484
AVG FAMILY INCOME
$59,567
AVG HOUSEHOLD INCOME
39.3%
WAGE / INCOME GAP [ % ]
60.7¢/ $1
WAGE / INCOME GAP [ $ ]
$5,923
FAMILY INCOME DEFICIT
0.40
INEQUALITY / GINI INDEX
570
TOTAL POPULATION
218
MALE POPULATION
352
FEMALE POPULATION
61.93
MALES / 100 FEMALES
161.47
FEMALES / 100 MALES
51.1
MEDIAN AGE
3.0
AVG FAMILY SIZE
2.2
AVG HOUSEHOLD SIZE
283
LABOR FORCE [ PEOPLE ]
58.7%
PERCENT IN LABOR FORCE
3.2%
UNEMPLOYMENT RATE
Floyd Zip Codes
Floyd Area Codes
Income in Floyd
Income Overview in Floyd
Per Capita Income in Floyd is $33,372, while median incomes of families and households are $81,484 and $59,567 respectively.
| Characteristic | Number | Measure |
| Per Capita Income | 570 | $33,372 |
| Median Family Income | 145 | $81,484 |
| Mean Family Income | 145 | $90,812 |
| Median Household Income | 253 | $59,567 |
| Mean Household Income | 253 | $74,409 |
| Income Deficit | 145 | $5,923 |
| Wage / Income Gap (%) | 570 | 39.34% |
| Wage / Income Gap ($) | 570 | 60.66¢ per $1 |
| Gini / Inequality Index | 570 | 0.40 |
Earnings by Sex in Floyd
Average Earnings in Floyd are $39,464, $54,063 for men and $32,794 for women, a difference of 39.3%.
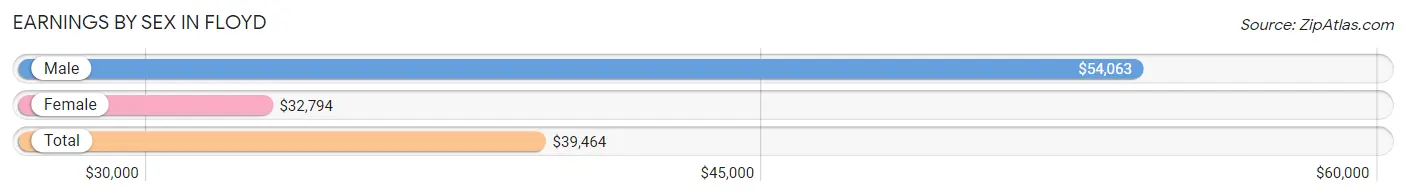
| Sex | Number | Average Earnings |
| Male | 135 (47.0%) | $54,063 |
| Female | 152 (53.0%) | $32,794 |
| Total | 287 (100.0%) | $39,464 |
Earnings by Sex by Income Bracket in Floyd
The most common earnings brackets in Floyd are $55,000 to $64,999 for men (28 | 20.7%) and $25,000 to $29,999 for women (32 | 21.0%).
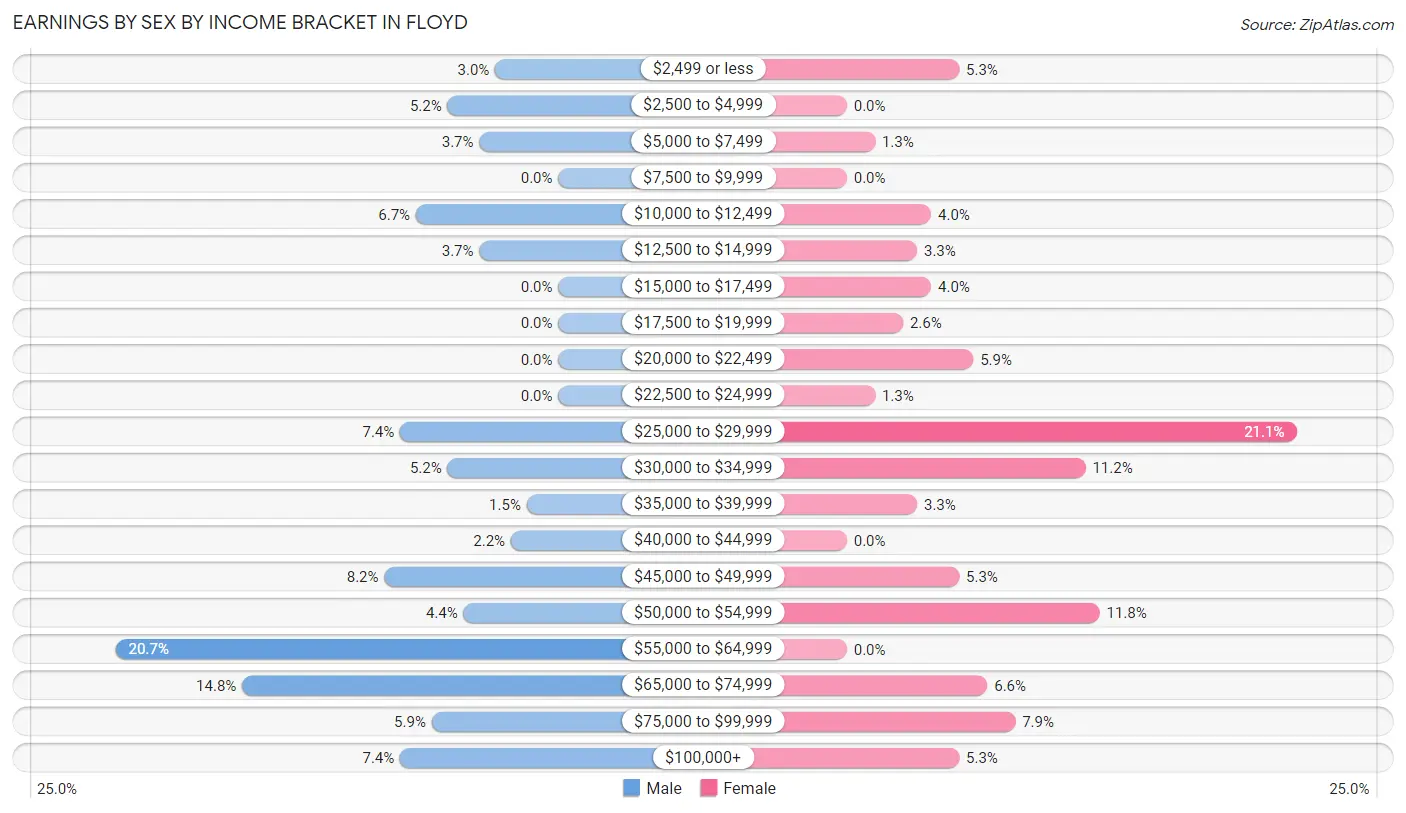
| Income | Male | Female |
| $2,499 or less | 4 (3.0%) | 8 (5.3%) |
| $2,500 to $4,999 | 7 (5.2%) | 0 (0.0%) |
| $5,000 to $7,499 | 5 (3.7%) | 2 (1.3%) |
| $7,500 to $9,999 | 0 (0.0%) | 0 (0.0%) |
| $10,000 to $12,499 | 9 (6.7%) | 6 (4.0%) |
| $12,500 to $14,999 | 5 (3.7%) | 5 (3.3%) |
| $15,000 to $17,499 | 0 (0.0%) | 6 (4.0%) |
| $17,500 to $19,999 | 0 (0.0%) | 4 (2.6%) |
| $20,000 to $22,499 | 0 (0.0%) | 9 (5.9%) |
| $22,500 to $24,999 | 0 (0.0%) | 2 (1.3%) |
| $25,000 to $29,999 | 10 (7.4%) | 32 (21.0%) |
| $30,000 to $34,999 | 7 (5.2%) | 17 (11.2%) |
| $35,000 to $39,999 | 2 (1.5%) | 5 (3.3%) |
| $40,000 to $44,999 | 3 (2.2%) | 0 (0.0%) |
| $45,000 to $49,999 | 11 (8.2%) | 8 (5.3%) |
| $50,000 to $54,999 | 6 (4.4%) | 18 (11.8%) |
| $55,000 to $64,999 | 28 (20.7%) | 0 (0.0%) |
| $65,000 to $74,999 | 20 (14.8%) | 10 (6.6%) |
| $75,000 to $99,999 | 8 (5.9%) | 12 (7.9%) |
| $100,000+ | 10 (7.4%) | 8 (5.3%) |
| Total | 135 (100.0%) | 152 (100.0%) |
Earnings by Sex by Educational Attainment in Floyd
Average earnings in Floyd are $55,357 for men and $33,897 for women, a difference of 38.8%. Men with an educational attainment of graduate degree enjoy the highest average annual earnings of $56,528, while those with high school diploma education earn the least with $46,806. Women with an educational attainment of bachelor's degree earn the most with the average annual earnings of $51,094, while those with high school diploma education have the smallest earnings of $16,875.
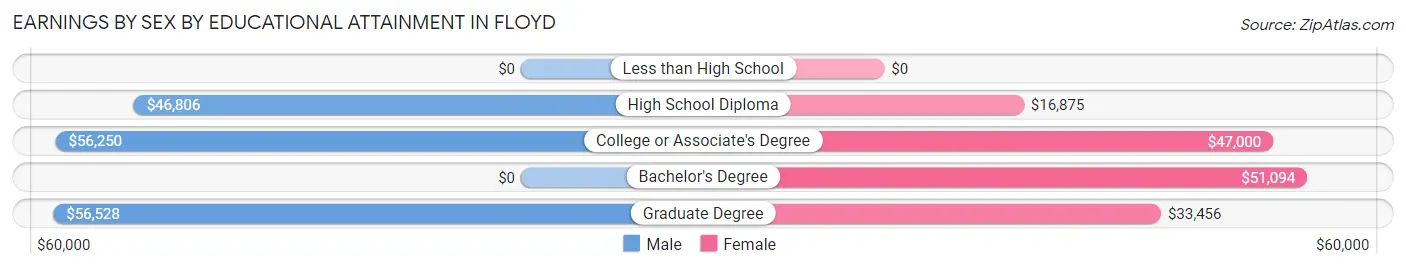
| Educational Attainment | Male Income | Female Income |
| Less than High School | - | - |
| High School Diploma | $46,806 | $16,875 |
| College or Associate's Degree | $56,250 | $47,000 |
| Bachelor's Degree | - | - |
| Graduate Degree | $56,528 | $33,456 |
| Total | $55,357 | $33,897 |
Family Income in Floyd
Family Income Brackets in Floyd
According to the Floyd family income data, there are 30 families falling into the $100,000 to $149,999 income range, which is the most common income bracket and makes up 20.7% of all families.
| Income Bracket | # Families | % Families |
| Less than $10,000 | 0 | 0.0% |
| $10,000 to $14,999 | 8 | 5.5% |
| $15,000 to $24,999 | 5 | 3.4% |
| $25,000 to $34,999 | 17 | 11.7% |
| $35,000 to $49,999 | 15 | 10.3% |
| $50,000 to $74,999 | 17 | 11.7% |
| $75,000 to $99,999 | 25 | 17.2% |
| $100,000 to $149,999 | 30 | 20.7% |
| $150,000 to $199,999 | 11 | 7.6% |
| $200,000+ | 17 | 11.7% |
Family Income by Famaliy Size in Floyd
5-person families (17 | 11.7%) account for the highest median family income in Floyd with $84,750 per family, while 2-person families (79 | 54.5%) have the highest median income of $40,125 per family member.
| Income Bracket | # Families | Median Income |
| 2-Person Families | 79 (54.5%) | $80,250 |
| 3-Person Families | 24 (16.6%) | $0 |
| 4-Person Families | 25 (17.2%) | $0 |
| 5-Person Families | 17 (11.7%) | $84,750 |
| 6-Person Families | 0 (0.0%) | $0 |
| 7+ Person Families | 0 (0.0%) | $0 |
| Total | 145 (100.0%) | $81,484 |
Family Income by Number of Earners in Floyd
| Number of Earners | # Families | Median Income |
| No Earners | 26 (17.9%) | $0 |
| 1 Earner | 26 (17.9%) | $43,750 |
| 2 Earners | 78 (53.8%) | $103,625 |
| 3+ Earners | 15 (10.3%) | $59,375 |
| Total | 145 (100.0%) | $81,484 |
Household Income in Floyd
Household Income Brackets in Floyd
With 53 households falling in the category, the $50,000 to $74,999 income range is the most frequent in Floyd, accounting for 20.9% of all households. In contrast, only 1 households (0.4%) fall into the less than $10,000 income bracket, making it the least populous group.
| Income Bracket | # Households | % Households |
| Less than $10,000 | 1 | 0.4% |
| $10,000 to $14,999 | 16 | 6.3% |
| $15,000 to $24,999 | 29 | 11.5% |
| $25,000 to $34,999 | 34 | 13.4% |
| $35,000 to $49,999 | 20 | 7.9% |
| $50,000 to $74,999 | 53 | 20.9% |
| $75,000 to $99,999 | 31 | 12.3% |
| $100,000 to $149,999 | 41 | 16.2% |
| $150,000 to $199,999 | 11 | 4.3% |
| $200,000+ | 17 | 6.7% |
Household Income by Householder Age in Floyd
The median household income in Floyd is $59,567, with the highest median household income of $81,250 found in the 25 to 44 years age bracket for the primary householder. A total of 61 households (24.1%) fall into this category. Meanwhile, the 15 to 24 years age bracket for the primary householder has the lowest median household income of $0, with 4 households (1.6%) in this group.
| Income Bracket | # Households | Median Income |
| 15 to 24 Years | 4 (1.6%) | $0 |
| 25 to 44 Years | 61 (24.1%) | $81,250 |
| 45 to 64 Years | 87 (34.4%) | $59,375 |
| 65+ Years | 101 (39.9%) | $55,625 |
| Total | 253 (100.0%) | $59,567 |
Poverty in Floyd
Income Below Poverty by Sex and Age in Floyd
With 9.6% poverty level for males and 7.7% for females among the residents of Floyd, 12 to 14 year old males and 45 to 54 year old females are the most vulnerable to poverty, with 17 males (70.8%) and 8 females (23.5%) in their respective age groups living below the poverty level.
| Age Bracket | Male | Female |
| Under 5 Years | 0 (0.0%) | 0 (0.0%) |
| 5 Years | 0 (0.0%) | 0 (0.0%) |
| 6 to 11 Years | 0 (0.0%) | 0 (0.0%) |
| 12 to 14 Years | 17 (70.8%) | 3 (18.8%) |
| 15 Years | 0 (0.0%) | 0 (0.0%) |
| 16 and 17 Years | 0 (0.0%) | 0 (0.0%) |
| 18 to 24 Years | 0 (0.0%) | 2 (7.7%) |
| 25 to 34 Years | 3 (23.1%) | 3 (16.7%) |
| 35 to 44 Years | 0 (0.0%) | 3 (7.0%) |
| 45 to 54 Years | 0 (0.0%) | 8 (23.5%) |
| 55 to 64 Years | 0 (0.0%) | 3 (5.8%) |
| 65 to 74 Years | 0 (0.0%) | 5 (8.6%) |
| 75 Years and over | 1 (9.1%) | 0 (0.0%) |
| Total | 21 (9.6%) | 27 (7.7%) |
Income Above Poverty by Sex and Age in Floyd
According to the poverty statistics in Floyd, males aged under 5 years and females aged under 5 years are the age groups that are most secure financially, with 100.0% of males and 100.0% of females in these age groups living above the poverty line.
| Age Bracket | Male | Female |
| Under 5 Years | 7 (100.0%) | 13 (100.0%) |
| 5 Years | 0 (0.0%) | 12 (100.0%) |
| 6 to 11 Years | 0 (0.0%) | 6 (100.0%) |
| 12 to 14 Years | 7 (29.2%) | 13 (81.2%) |
| 15 Years | 0 (0.0%) | 10 (100.0%) |
| 16 and 17 Years | 9 (100.0%) | 16 (100.0%) |
| 18 to 24 Years | 21 (100.0%) | 24 (92.3%) |
| 25 to 34 Years | 10 (76.9%) | 15 (83.3%) |
| 35 to 44 Years | 30 (100.0%) | 40 (93.0%) |
| 45 to 54 Years | 26 (100.0%) | 26 (76.5%) |
| 55 to 64 Years | 36 (100.0%) | 49 (94.2%) |
| 65 to 74 Years | 41 (100.0%) | 53 (91.4%) |
| 75 Years and over | 10 (90.9%) | 48 (100.0%) |
| Total | 197 (90.4%) | 325 (92.3%) |
Income Below Poverty Among Married-Couple Families in Floyd
| Children | Above Poverty | Below Poverty |
| No Children | 67 (100.0%) | 0 (0.0%) |
| 1 or 2 Children | 31 (100.0%) | 0 (0.0%) |
| 3 or 4 Children | 8 (100.0%) | 0 (0.0%) |
| 5 or more Children | 0 (0.0%) | 0 (0.0%) |
| Total | 106 (100.0%) | 0 (0.0%) |
Income Below Poverty Among Single-Parent Households in Floyd
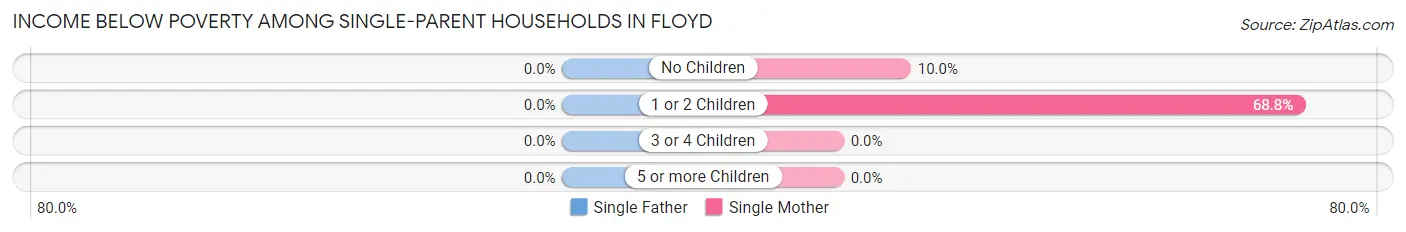
| Children | Single Father | Single Mother |
| No Children | 0 (0.0%) | 2 (10.0%) |
| 1 or 2 Children | 0 (0.0%) | 11 (68.8%) |
| 3 or 4 Children | 0 (0.0%) | 0 (0.0%) |
| 5 or more Children | 0 (0.0%) | 0 (0.0%) |
| Total | 0 (0.0%) | 13 (36.1%) |
Income Below Poverty Among Married-Couple vs Single-Parent Households in Floyd
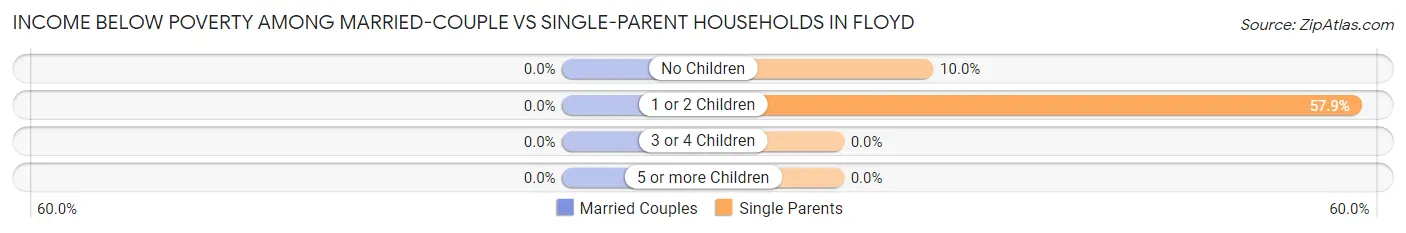
| Children | Married-Couple Families | Single-Parent Households |
| No Children | 0 (0.0%) | 2 (10.0%) |
| 1 or 2 Children | 0 (0.0%) | 11 (57.9%) |
| 3 or 4 Children | 0 (0.0%) | 0 (0.0%) |
| 5 or more Children | 0 (0.0%) | 0 (0.0%) |
| Total | 0 (0.0%) | 13 (33.3%) |
Race in Floyd
The most populous races in Floyd are White / Caucasian (535 | 93.9%), Hispanic or Latino (73 | 12.8%), and Some other Race (22 | 3.9%).
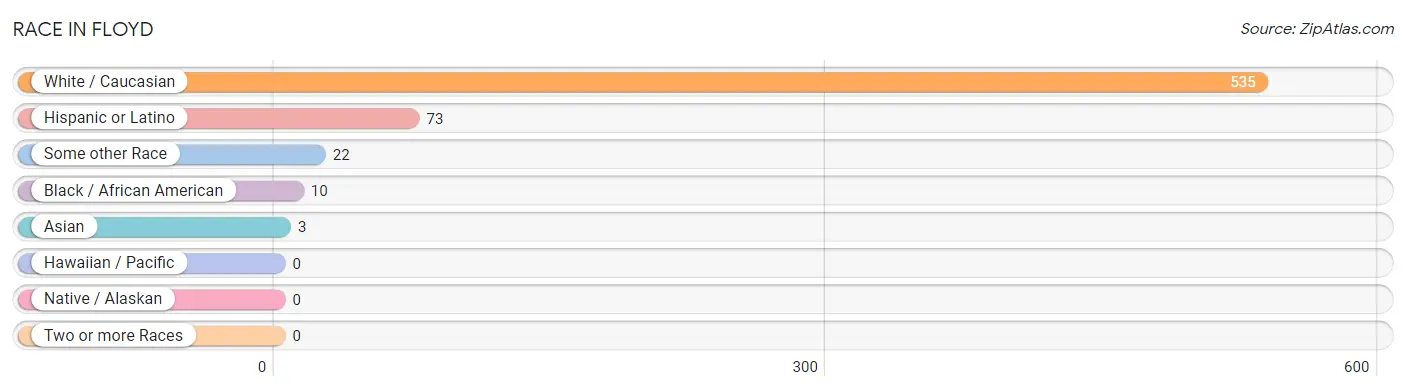
| Race | # Population | % Population |
| Asian | 3 | 0.5% |
| Black / African American | 10 | 1.8% |
| Hawaiian / Pacific | 0 | 0.0% |
| Hispanic or Latino | 73 | 12.8% |
| Native / Alaskan | 0 | 0.0% |
| White / Caucasian | 535 | 93.9% |
| Two or more Races | 0 | 0.0% |
| Some other Race | 22 | 3.9% |
| Total | 570 | 100.0% |
Ancestry in Floyd
The most populous ancestries reported in Floyd are American (89 | 15.6%), German (84 | 14.7%), English (73 | 12.8%), Irish (66 | 11.6%), and Mexican (48 | 8.4%), together accounting for 63.2% of all Floyd residents.
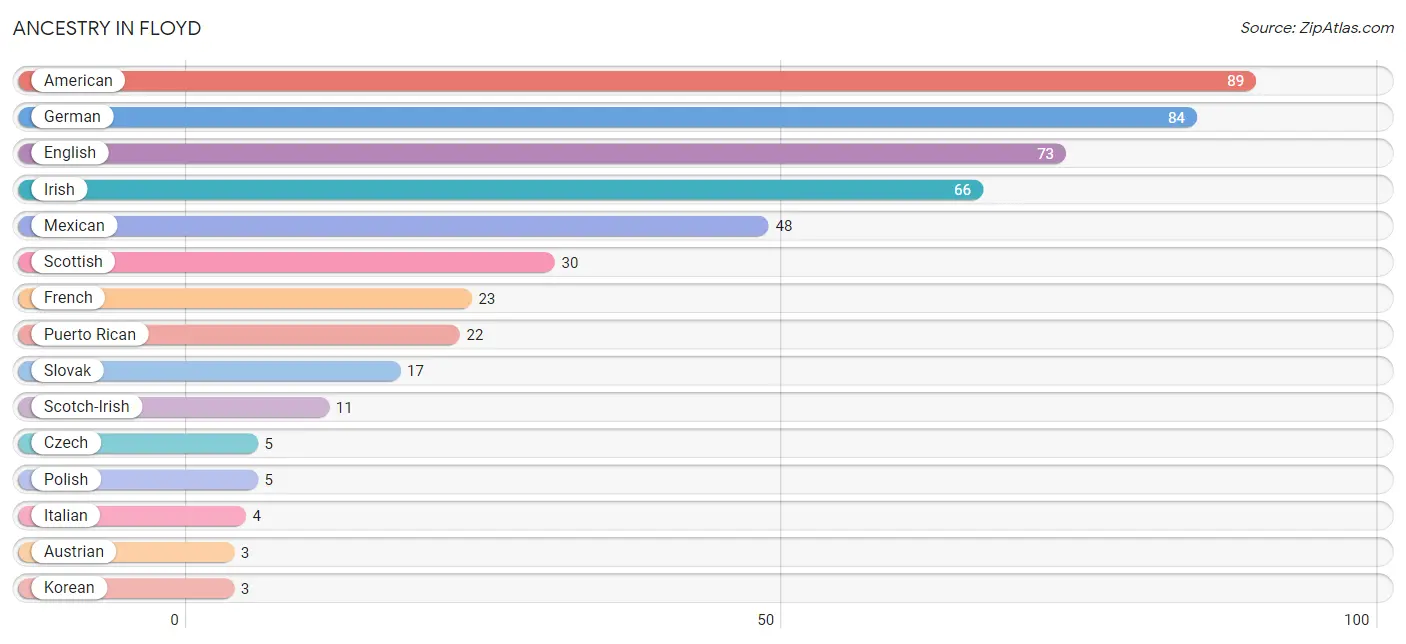
| Ancestry | # Population | % Population |
| American | 89 | 15.6% |
| Austrian | 3 | 0.5% |
| Czech | 5 | 0.9% |
| English | 73 | 12.8% |
| French | 23 | 4.0% |
| German | 84 | 14.7% |
| Irish | 66 | 11.6% |
| Italian | 4 | 0.7% |
| Korean | 3 | 0.5% |
| Mexican | 48 | 8.4% |
| Polish | 5 | 0.9% |
| Puerto Rican | 22 | 3.9% |
| Scandinavian | 3 | 0.5% |
| Scotch-Irish | 11 | 1.9% |
| Scottish | 30 | 5.3% |
| Slovak | 17 | 3.0% |
| Welsh | 3 | 0.5% | View All 17 Rows |
Immigrants in Floyd
The most numerous immigrant groups reported in Floyd came from Latin America (25 | 4.4%), Central America (22 | 3.9%), Mexico (22 | 3.9%), Bolivia (3 | 0.5%), and South America (3 | 0.5%), together accounting for 13.2% of all Floyd residents.
| Immigration Origin | # Population | % Population |
| Bolivia | 3 | 0.5% |
| Central America | 22 | 3.9% |
| Latin America | 25 | 4.4% |
| Mexico | 22 | 3.9% |
| South America | 3 | 0.5% | View All 5 Rows |
Sex and Age in Floyd
Sex and Age in Floyd
The most populous age groups in Floyd are 55 to 59 Years (32 | 14.7%) for men and 65 to 69 Years (37 | 10.5%) for women.
| Age Bracket | Male | Female |
| Under 5 Years | 7 (3.2%) | 13 (3.7%) |
| 5 to 9 Years | 0 (0.0%) | 12 (3.4%) |
| 10 to 14 Years | 24 (11.0%) | 22 (6.2%) |
| 15 to 19 Years | 14 (6.4%) | 28 (8.0%) |
| 20 to 24 Years | 16 (7.3%) | 24 (6.8%) |
| 25 to 29 Years | 2 (0.9%) | 4 (1.1%) |
| 30 to 34 Years | 11 (5.1%) | 14 (4.0%) |
| 35 to 39 Years | 3 (1.4%) | 25 (7.1%) |
| 40 to 44 Years | 27 (12.4%) | 18 (5.1%) |
| 45 to 49 Years | 2 (0.9%) | 2 (0.6%) |
| 50 to 54 Years | 24 (11.0%) | 32 (9.1%) |
| 55 to 59 Years | 32 (14.7%) | 19 (5.4%) |
| 60 to 64 Years | 4 (1.8%) | 33 (9.4%) |
| 65 to 69 Years | 28 (12.8%) | 37 (10.5%) |
| 70 to 74 Years | 13 (6.0%) | 21 (6.0%) |
| 75 to 79 Years | 1 (0.5%) | 16 (4.5%) |
| 80 to 84 Years | 6 (2.8%) | 21 (6.0%) |
| 85 Years and over | 4 (1.8%) | 11 (3.1%) |
| Total | 218 (100.0%) | 352 (100.0%) |
Families and Households in Floyd
Median Family Size in Floyd
The median family size in Floyd is 3.01 persons per family, with married-couple families (106 | 73.1%) accounting for the largest median family size of 3.21 persons per family. On the other hand, single male/father families (3 | 2.1%) represent the smallest median family size with 1.67 persons per family.
| Family Type | # Families | Family Size |
| Married-Couple | 106 (73.1%) | 3.21 |
| Single Male/Father | 3 (2.1%) | 1.67 |
| Single Female/Mother | 36 (24.8%) | 2.56 |
| Total Families | 145 (100.0%) | 3.01 |
Median Household Size in Floyd
The median household size in Floyd is 2.25 persons per household, with married-couple households (106 | 41.9%) accounting for the largest median household size of 3.25 persons per household. non-family households (108 | 42.7%) represent the smallest median household size with 1.16 persons per household.
| Household Type | # Households | Household Size |
| Married-Couple | 106 (41.9%) | 3.25 |
| Single Male/Father | 3 (1.2%) | 3.00 |
| Single Female/Mother | 36 (14.2%) | 2.56 |
| Non-family | 108 (42.7%) | 1.16 |
| Total Households | 253 (100.0%) | 2.25 |
Household Size by Marriage Status in Floyd
Out of a total of 253 households in Floyd, 145 (57.3%) are family households, while 108 (42.7%) are nonfamily households. The most numerous type of family households are 2-person households, comprising 72, and the most common type of nonfamily households are 1-person households, comprising 96.
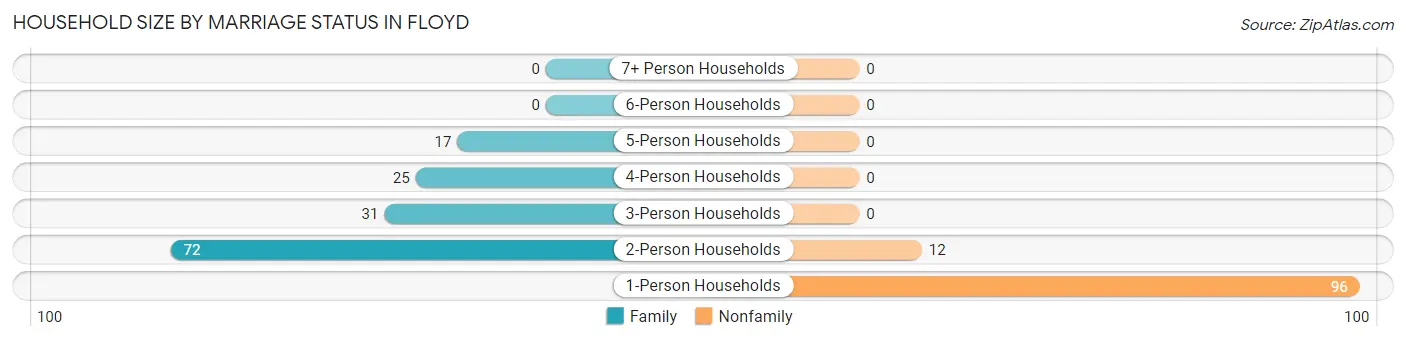
| Household Size | Family Households | Nonfamily Households |
| 1-Person Households | - | 96 (37.9%) |
| 2-Person Households | 72 (28.5%) | 12 (4.7%) |
| 3-Person Households | 31 (12.2%) | 0 (0.0%) |
| 4-Person Households | 25 (9.9%) | 0 (0.0%) |
| 5-Person Households | 17 (6.7%) | 0 (0.0%) |
| 6-Person Households | 0 (0.0%) | 0 (0.0%) |
| 7+ Person Households | 0 (0.0%) | 0 (0.0%) |
| Total | 145 (57.3%) | 108 (42.7%) |
Female Fertility in Floyd
Fertility by Age in Floyd
Average fertility rate in Floyd is 43.0 births per 1,000 women. Women in the age bracket of 20 to 34 years have the highest fertility rate with 119.0 births per 1,000 women. Women in the age bracket of 20 to 34 years acount for 100.0% of all women with births.
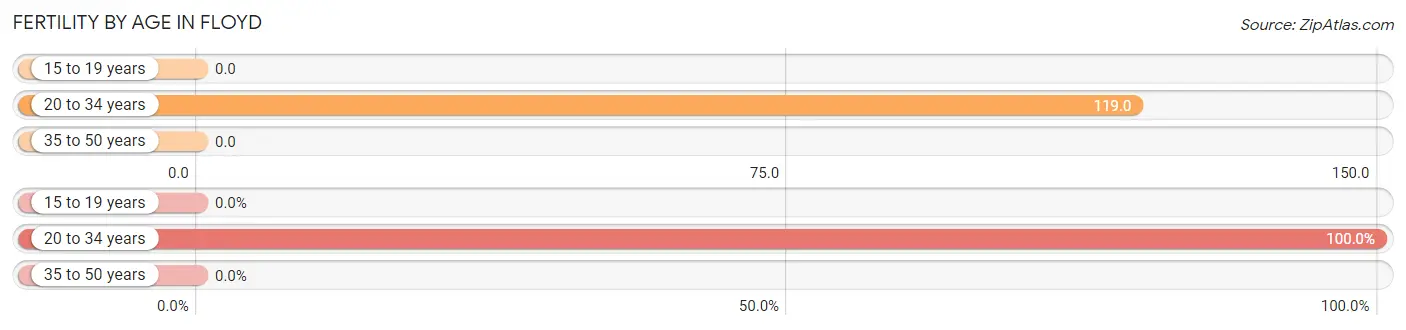
| Age Bracket | Women with Births | Births / 1,000 Women |
| 15 to 19 years | 0 (0.0%) | 0.0 |
| 20 to 34 years | 5 (100.0%) | 119.0 |
| 35 to 50 years | 0 (0.0%) | 0.0 |
| Total | 5 (100.0%) | 43.0 |
Fertility by Age by Marriage Status in Floyd
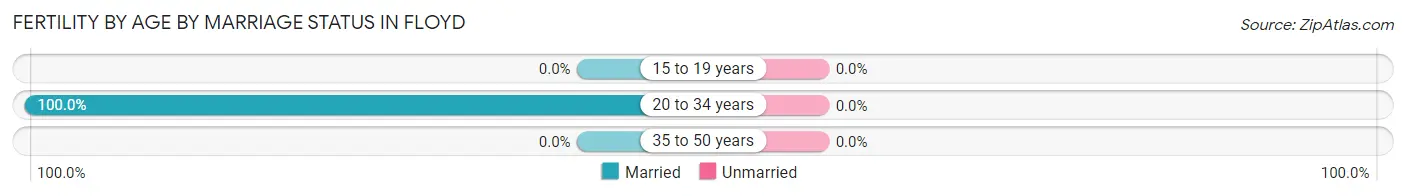
| Age Bracket | Married | Unmarried |
| 15 to 19 years | 0 (0.0%) | 0 (0.0%) |
| 20 to 34 years | 5 (100.0%) | 0 (0.0%) |
| 35 to 50 years | 0 (0.0%) | 0 (0.0%) |
| Total | 5 (100.0%) | 0 (0.0%) |
Fertility by Education in Floyd
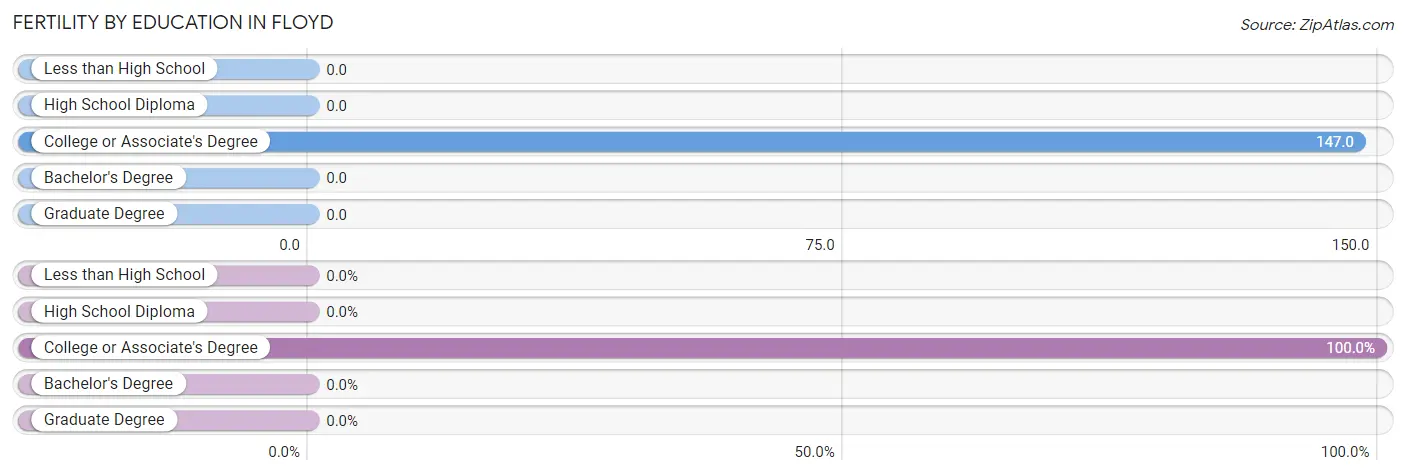
| Educational Attainment | Women with Births | Births / 1,000 Women |
| Less than High School | 0 (0.0%) | 0.0 |
| High School Diploma | 0 (0.0%) | 0.0 |
| College or Associate's Degree | 5 (100.0%) | 147.0 |
| Bachelor's Degree | 0 (0.0%) | 0.0 |
| Graduate Degree | 0 (0.0%) | 0.0 |
| Total | 5 (100.0%) | 43.0 |
Fertility by Education by Marriage Status in Floyd
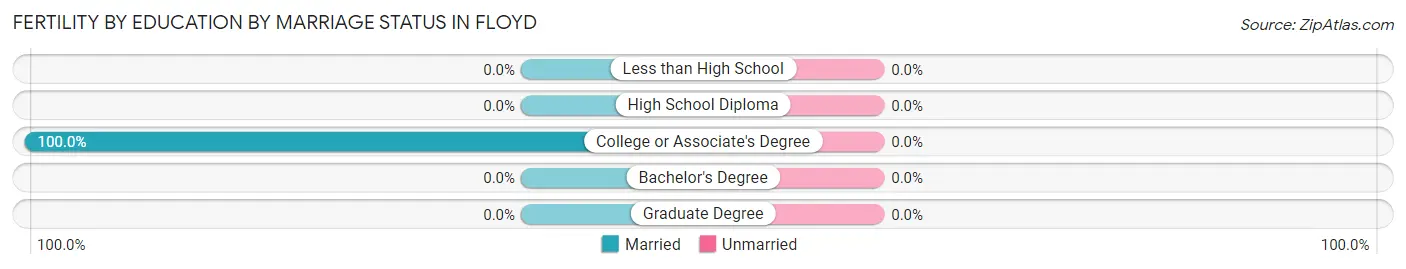
| Educational Attainment | Married | Unmarried |
| Less than High School | 0 (0.0%) | 0 (0.0%) |
| High School Diploma | 0 (0.0%) | 0 (0.0%) |
| College or Associate's Degree | 5 (100.0%) | 0 (0.0%) |
| Bachelor's Degree | 0 (0.0%) | 0 (0.0%) |
| Graduate Degree | 0 (0.0%) | 0 (0.0%) |
| Total | 5 (100.0%) | 0 (0.0%) |
Employment Characteristics in Floyd
Employment by Class of Employer in Floyd
Among the 269 employed individuals in Floyd, private company employees (112 | 41.6%), local government employees (50 | 18.6%), and not-for-profit organizations (49 | 18.2%) make up the most common classes of employment.
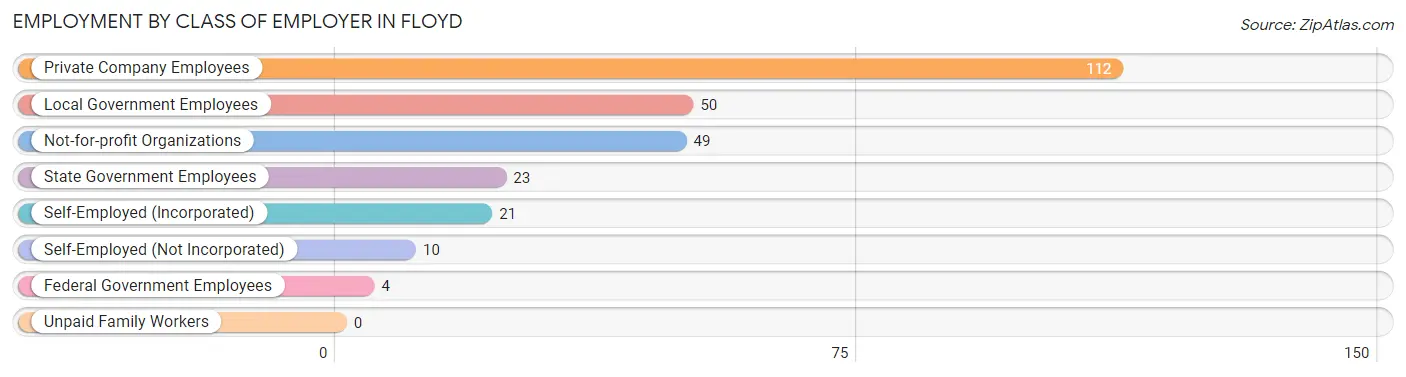
| Employer Class | # Employees | % Employees |
| Private Company Employees | 112 | 41.6% |
| Self-Employed (Incorporated) | 21 | 7.8% |
| Self-Employed (Not Incorporated) | 10 | 3.7% |
| Not-for-profit Organizations | 49 | 18.2% |
| Local Government Employees | 50 | 18.6% |
| State Government Employees | 23 | 8.6% |
| Federal Government Employees | 4 | 1.5% |
| Unpaid Family Workers | 0 | 0.0% |
| Total | 269 | 100.0% |
Employment Status by Age in Floyd
According to the labor force statistics for Floyd, out of the total population over 16 years of age (482), 58.7% or 283 individuals are in the labor force, with 3.2% or 9 of them unemployed. The age group with the highest labor force participation rate is 55 to 59 years, with 94.1% or 48 individuals in the labor force. Within the labor force, the 16 to 19 years age range has the highest percentage of unemployed individuals, with 43.8% or 7 of them being unemployed.
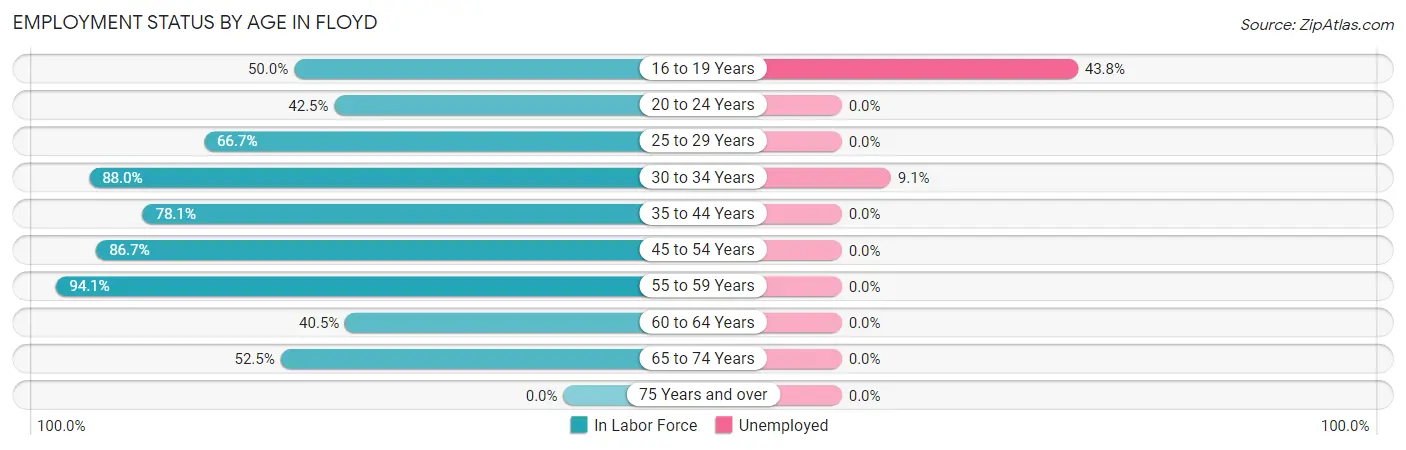
| Age Bracket | In Labor Force | Unemployed |
| 16 to 19 Years | 16 (50.0%) | 7 (43.8%) |
| 20 to 24 Years | 17 (42.5%) | 0 (0.0%) |
| 25 to 29 Years | 4 (66.7%) | 0 (0.0%) |
| 30 to 34 Years | 22 (88.0%) | 2 (9.1%) |
| 35 to 44 Years | 57 (78.1%) | 0 (0.0%) |
| 45 to 54 Years | 52 (86.7%) | 0 (0.0%) |
| 55 to 59 Years | 48 (94.1%) | 0 (0.0%) |
| 60 to 64 Years | 15 (40.5%) | 0 (0.0%) |
| 65 to 74 Years | 52 (52.5%) | 0 (0.0%) |
| 75 Years and over | 0 (0.0%) | 0 (0.0%) |
| Total | 283 (58.7%) | 9 (3.2%) |
Employment Status by Educational Attainment in Floyd
According to labor force statistics for Floyd, 78.6% of individuals (198) out of the total population between 25 and 64 years of age (252) are in the labor force, with 1.0% or 2 of them being unemployed. The group with the highest labor force participation rate are those with the educational attainment of college / associate degree, with 96.7% or 59 individuals in the labor force. Within the labor force, individuals with college / associate degree education have the highest percentage of unemployment, with 3.4% or 2 of them being unemployed.
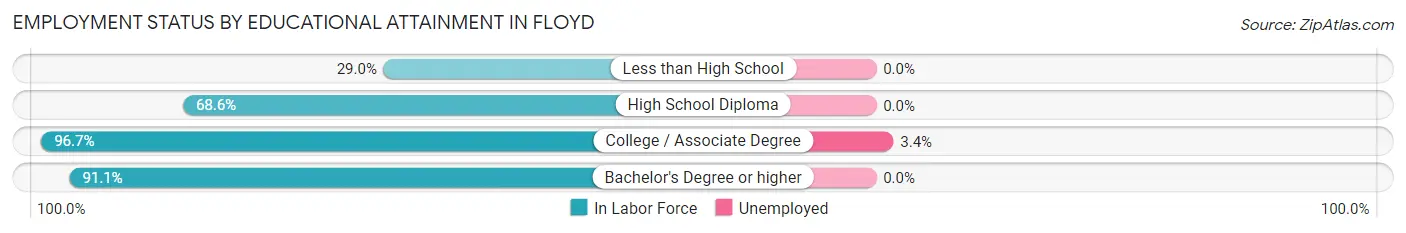
| Educational Attainment | In Labor Force | Unemployed |
| Less than High School | 9 (29.0%) | 0 (0.0%) |
| High School Diploma | 48 (68.6%) | 0 (0.0%) |
| College / Associate Degree | 59 (96.7%) | 2 (3.4%) |
| Bachelor's Degree or higher | 82 (91.1%) | 0 (0.0%) |
| Total | 198 (78.6%) | 3 (1.0%) |
Employment Occupations by Sex in Floyd
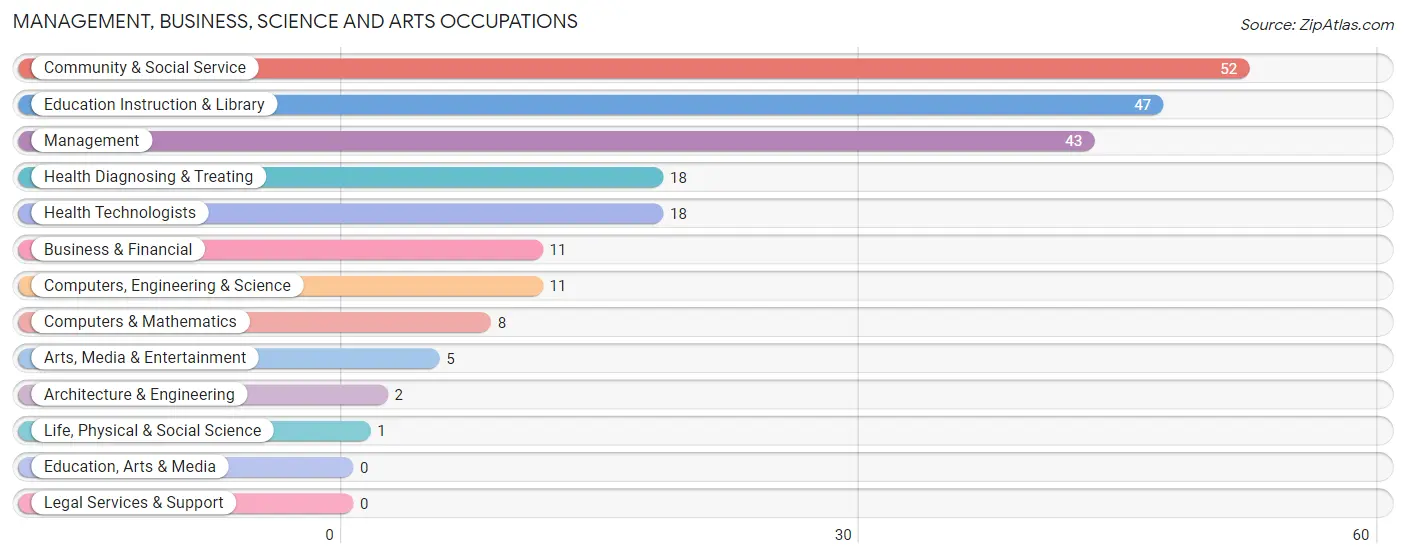
Management, Business, Science and Arts Occupations
The most common Management, Business, Science and Arts occupations in Floyd are Community & Social Service (52 | 19.0%), Education Instruction & Library (47 | 17.2%), Management (43 | 15.7%), Health Diagnosing & Treating (18 | 6.6%), and Health Technologists (18 | 6.6%).
Management, Business, Science and Arts Occupations by Sex
Within the Management, Business, Science and Arts occupations in Floyd, the most male-oriented occupations are Computers, Engineering & Science (100.0%), Computers & Mathematics (100.0%), and Architecture & Engineering (100.0%), while the most female-oriented occupations are Community & Social Service (100.0%), Education Instruction & Library (100.0%), and Arts, Media & Entertainment (100.0%).
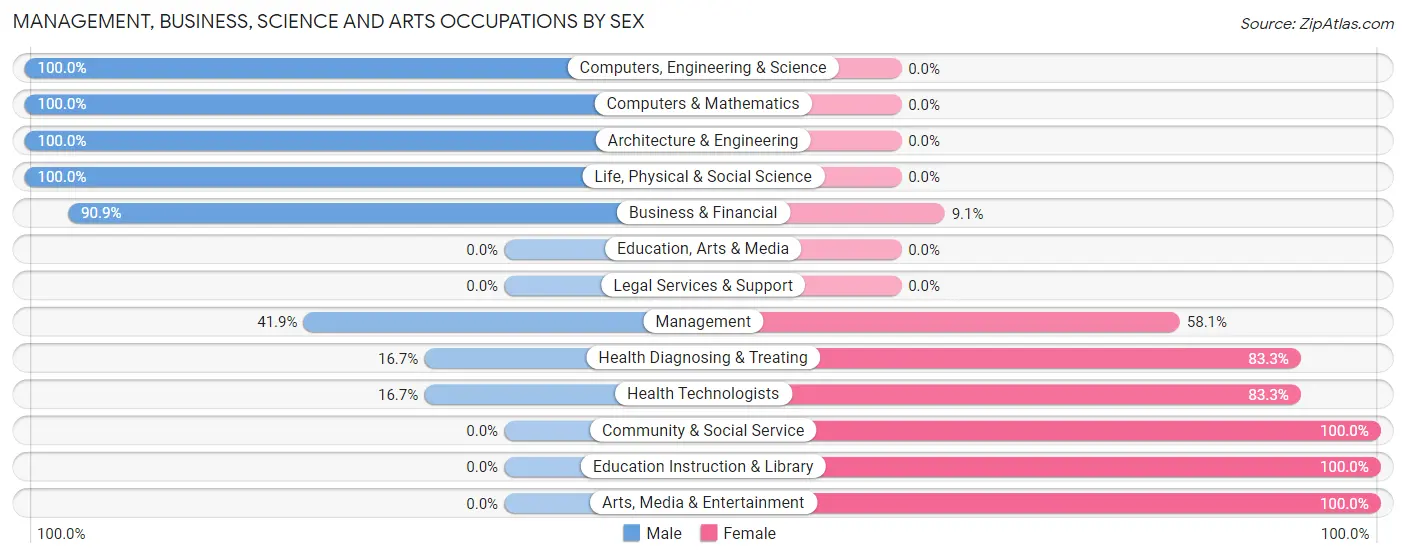
| Occupation | Male | Female |
| Management | 18 (41.9%) | 25 (58.1%) |
| Business & Financial | 10 (90.9%) | 1 (9.1%) |
| Computers, Engineering & Science | 11 (100.0%) | 0 (0.0%) |
| Computers & Mathematics | 8 (100.0%) | 0 (0.0%) |
| Architecture & Engineering | 2 (100.0%) | 0 (0.0%) |
| Life, Physical & Social Science | 1 (100.0%) | 0 (0.0%) |
| Community & Social Service | 0 (0.0%) | 52 (100.0%) |
| Education, Arts & Media | 0 (0.0%) | 0 (0.0%) |
| Legal Services & Support | 0 (0.0%) | 0 (0.0%) |
| Education Instruction & Library | 0 (0.0%) | 47 (100.0%) |
| Arts, Media & Entertainment | 0 (0.0%) | 5 (100.0%) |
| Health Diagnosing & Treating | 3 (16.7%) | 15 (83.3%) |
| Health Technologists | 3 (16.7%) | 15 (83.3%) |
| Total (Category) | 42 (31.1%) | 93 (68.9%) |
| Total (Overall) | 128 (46.7%) | 146 (53.3%) |
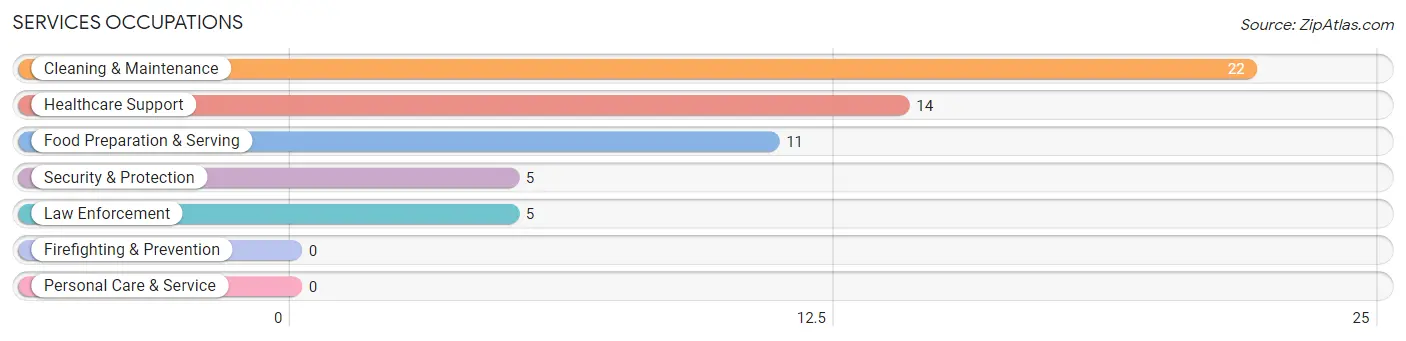
Services Occupations
The most common Services occupations in Floyd are Cleaning & Maintenance (22 | 8.0%), Healthcare Support (14 | 5.1%), Food Preparation & Serving (11 | 4.0%), Security & Protection (5 | 1.8%), and Law Enforcement (5 | 1.8%).
Services Occupations by Sex
Within the Services occupations in Floyd, the most male-oriented occupations are Security & Protection (100.0%), Law Enforcement (100.0%), and Cleaning & Maintenance (63.6%), while the most female-oriented occupations are Healthcare Support (100.0%), Food Preparation & Serving (45.5%), and Cleaning & Maintenance (36.4%).
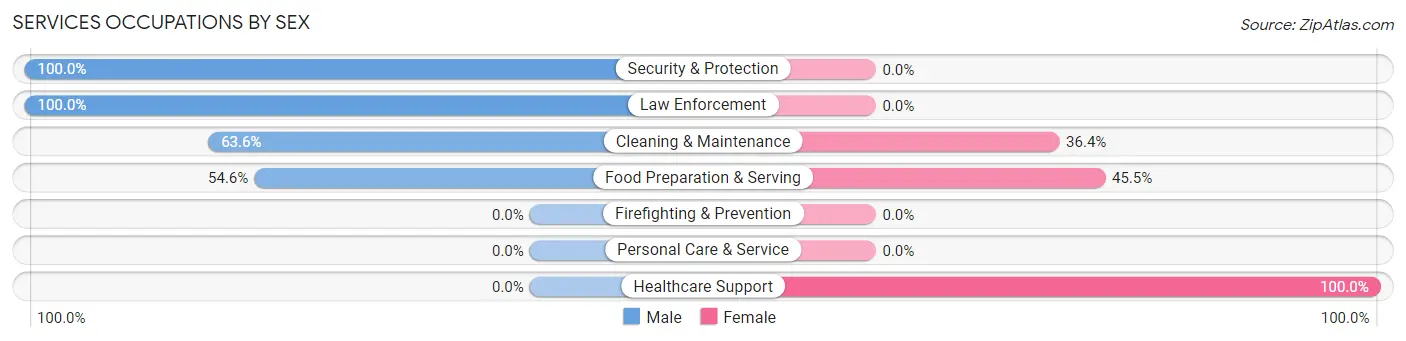
| Occupation | Male | Female |
| Healthcare Support | 0 (0.0%) | 14 (100.0%) |
| Security & Protection | 5 (100.0%) | 0 (0.0%) |
| Firefighting & Prevention | 0 (0.0%) | 0 (0.0%) |
| Law Enforcement | 5 (100.0%) | 0 (0.0%) |
| Food Preparation & Serving | 6 (54.5%) | 5 (45.5%) |
| Cleaning & Maintenance | 14 (63.6%) | 8 (36.4%) |
| Personal Care & Service | 0 (0.0%) | 0 (0.0%) |
| Total (Category) | 25 (48.1%) | 27 (51.9%) |
| Total (Overall) | 128 (46.7%) | 146 (53.3%) |
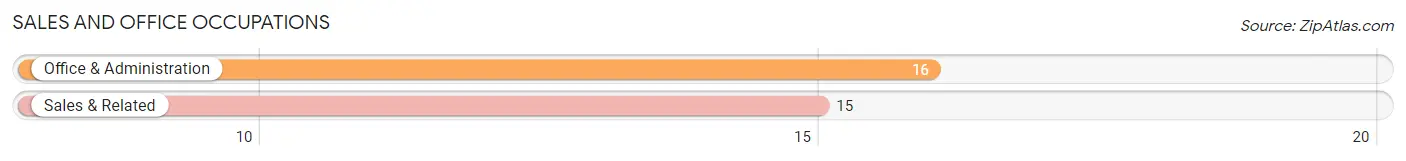
Sales and Office Occupations
The most common Sales and Office occupations in Floyd are Office & Administration (16 | 5.8%), and Sales & Related (15 | 5.5%).
Sales and Office Occupations by Sex
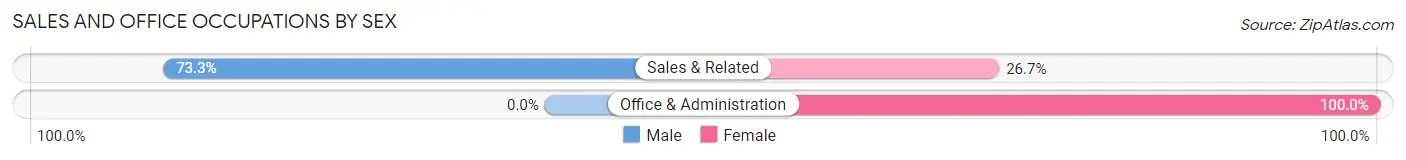
| Occupation | Male | Female |
| Sales & Related | 11 (73.3%) | 4 (26.7%) |
| Office & Administration | 0 (0.0%) | 16 (100.0%) |
| Total (Category) | 11 (35.5%) | 20 (64.5%) |
| Total (Overall) | 128 (46.7%) | 146 (53.3%) |
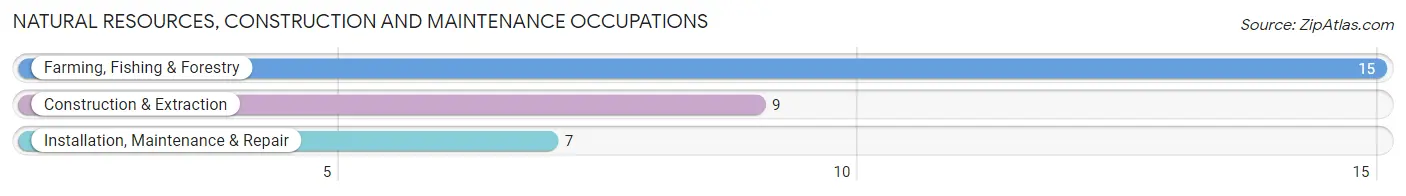
Natural Resources, Construction and Maintenance Occupations
The most common Natural Resources, Construction and Maintenance occupations in Floyd are Farming, Fishing & Forestry (15 | 5.5%), Construction & Extraction (9 | 3.3%), and Installation, Maintenance & Repair (7 | 2.5%).
Natural Resources, Construction and Maintenance Occupations by Sex
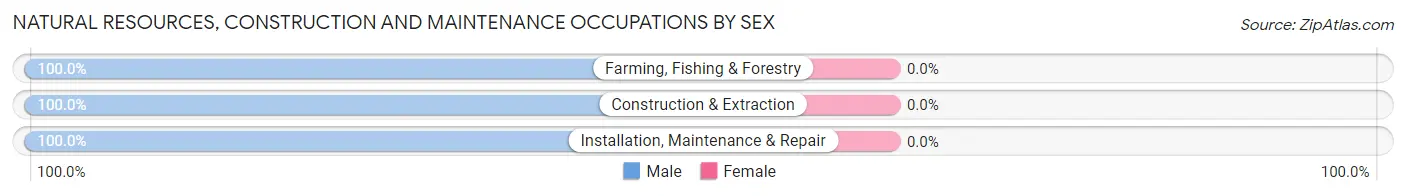
| Occupation | Male | Female |
| Farming, Fishing & Forestry | 15 (100.0%) | 0 (0.0%) |
| Construction & Extraction | 9 (100.0%) | 0 (0.0%) |
| Installation, Maintenance & Repair | 7 (100.0%) | 0 (0.0%) |
| Total (Category) | 31 (100.0%) | 0 (0.0%) |
| Total (Overall) | 128 (46.7%) | 146 (53.3%) |
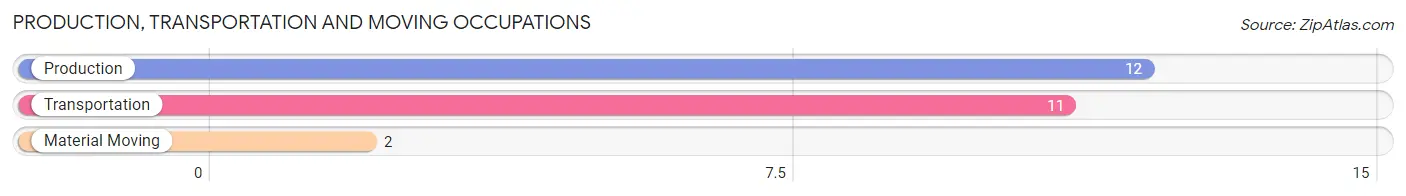
Production, Transportation and Moving Occupations
The most common Production, Transportation and Moving occupations in Floyd are Production (12 | 4.4%), Transportation (11 | 4.0%), and Material Moving (2 | 0.7%).
Production, Transportation and Moving Occupations by Sex
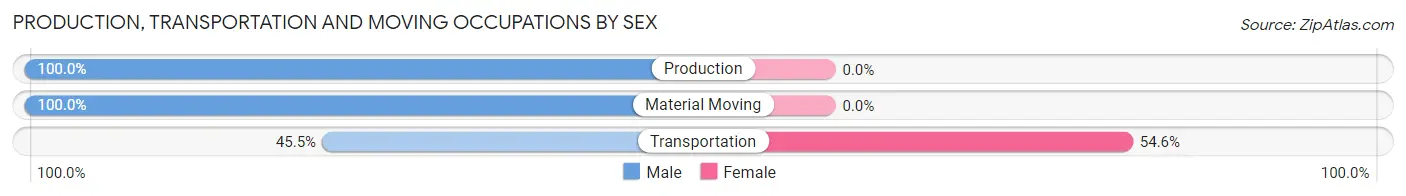
| Occupation | Male | Female |
| Production | 12 (100.0%) | 0 (0.0%) |
| Transportation | 5 (45.5%) | 6 (54.5%) |
| Material Moving | 2 (100.0%) | 0 (0.0%) |
| Total (Category) | 19 (76.0%) | 6 (24.0%) |
| Total (Overall) | 128 (46.7%) | 146 (53.3%) |
Employment Industries by Sex in Floyd
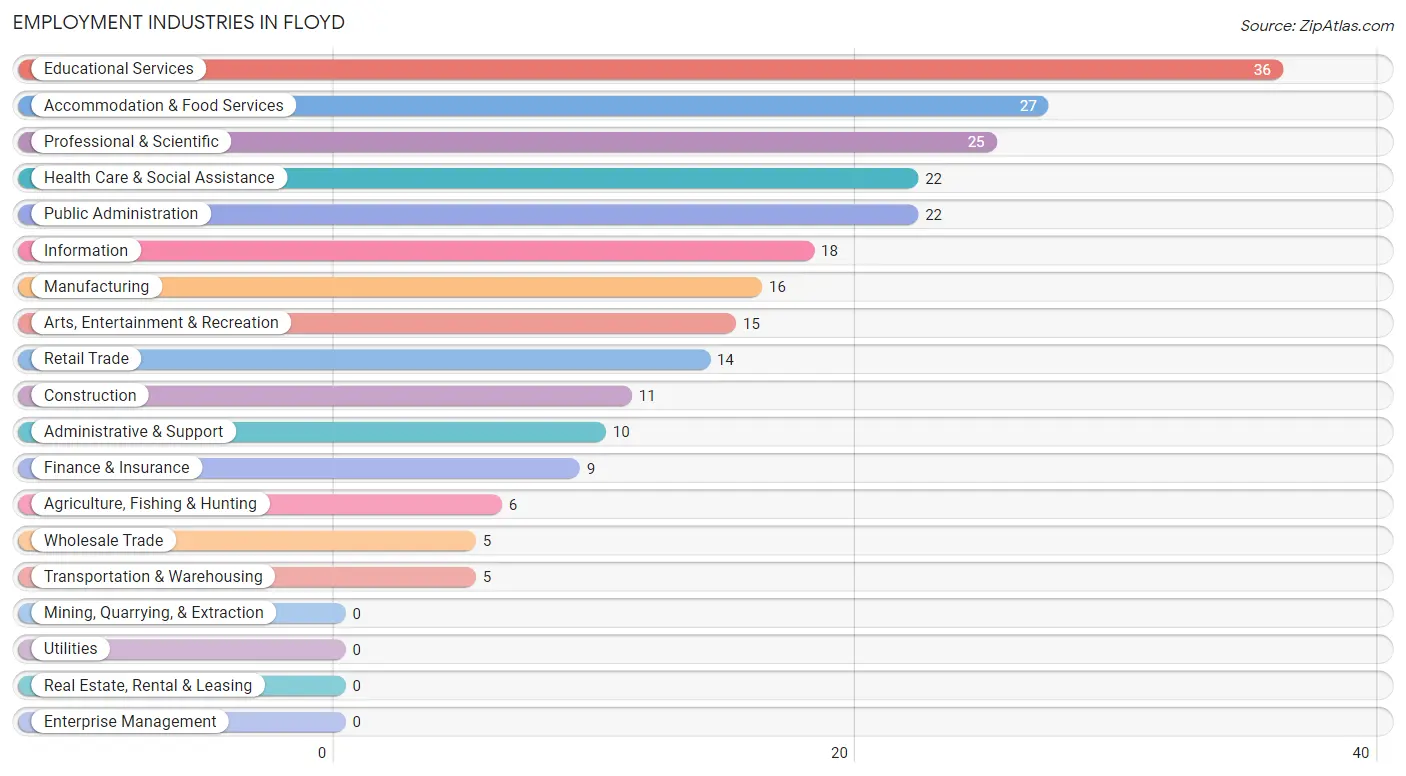
Employment Industries in Floyd
The major employment industries in Floyd include Educational Services (36 | 13.1%), Accommodation & Food Services (27 | 9.9%), Professional & Scientific (25 | 9.1%), Health Care & Social Assistance (22 | 8.0%), and Public Administration (22 | 8.0%).
Employment Industries by Sex in Floyd
The Floyd industries that see more men than women are Construction (100.0%), Wholesale Trade (100.0%), and Transportation & Warehousing (100.0%), whereas the industries that tend to have a higher number of women are Educational Services (100.0%), Information (94.4%), and Finance & Insurance (88.9%).
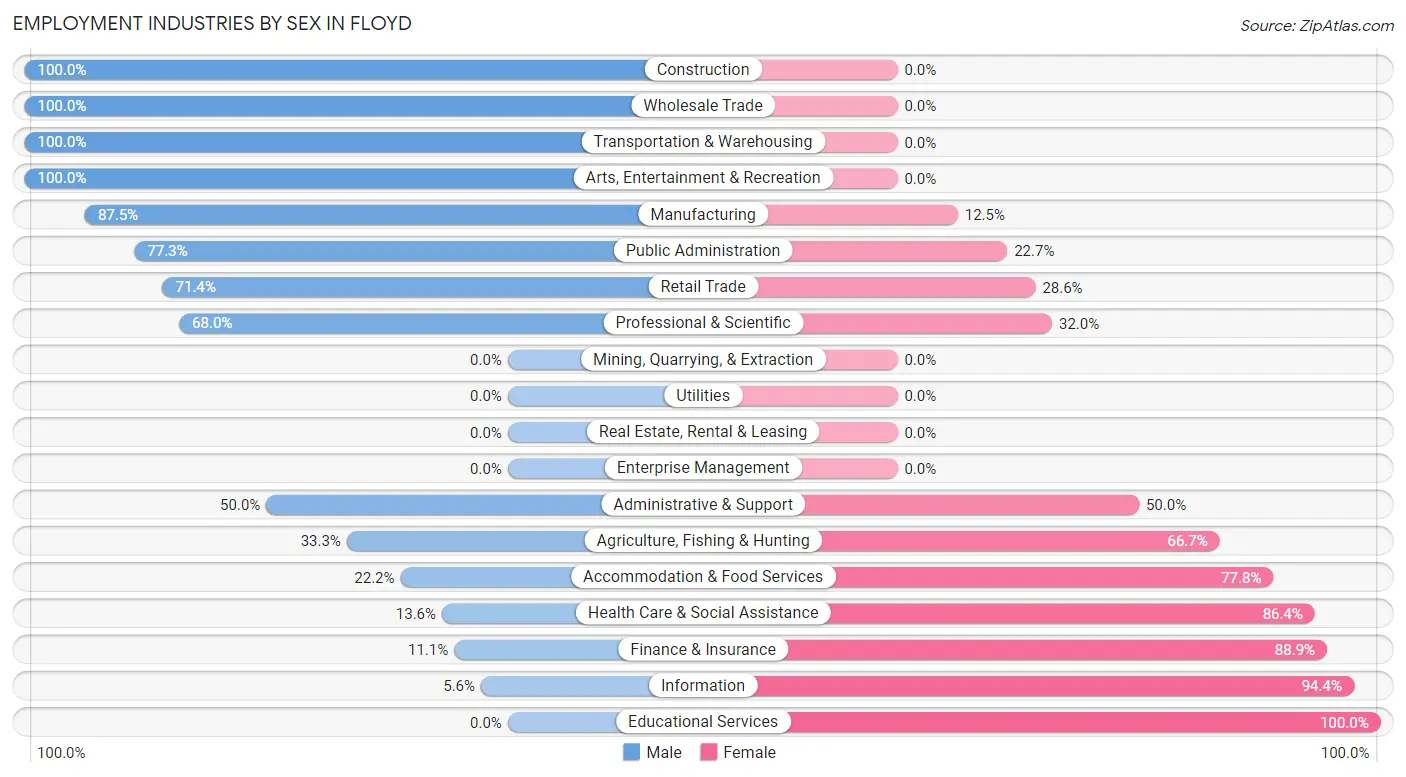
| Industry | Male | Female |
| Agriculture, Fishing & Hunting | 2 (33.3%) | 4 (66.7%) |
| Mining, Quarrying, & Extraction | 0 (0.0%) | 0 (0.0%) |
| Construction | 11 (100.0%) | 0 (0.0%) |
| Manufacturing | 14 (87.5%) | 2 (12.5%) |
| Wholesale Trade | 5 (100.0%) | 0 (0.0%) |
| Retail Trade | 10 (71.4%) | 4 (28.6%) |
| Transportation & Warehousing | 5 (100.0%) | 0 (0.0%) |
| Utilities | 0 (0.0%) | 0 (0.0%) |
| Information | 1 (5.6%) | 17 (94.4%) |
| Finance & Insurance | 1 (11.1%) | 8 (88.9%) |
| Real Estate, Rental & Leasing | 0 (0.0%) | 0 (0.0%) |
| Professional & Scientific | 17 (68.0%) | 8 (32.0%) |
| Enterprise Management | 0 (0.0%) | 0 (0.0%) |
| Administrative & Support | 5 (50.0%) | 5 (50.0%) |
| Educational Services | 0 (0.0%) | 36 (100.0%) |
| Health Care & Social Assistance | 3 (13.6%) | 19 (86.4%) |
| Arts, Entertainment & Recreation | 15 (100.0%) | 0 (0.0%) |
| Accommodation & Food Services | 6 (22.2%) | 21 (77.8%) |
| Public Administration | 17 (77.3%) | 5 (22.7%) |
| Total | 128 (46.7%) | 146 (53.3%) |
Education in Floyd
School Enrollment in Floyd
The most common levels of schooling among the 116 students in Floyd are middle school (39 | 33.6%), high school (38 | 32.8%), and college / undergraduate (16 | 13.8%).
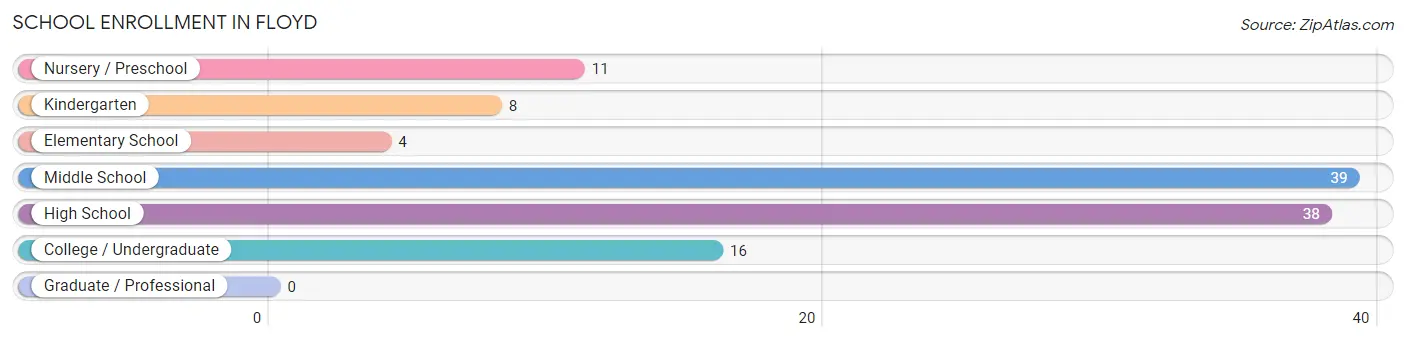
| School Level | # Students | % Students |
| Nursery / Preschool | 11 | 9.5% |
| Kindergarten | 8 | 6.9% |
| Elementary School | 4 | 3.5% |
| Middle School | 39 | 33.6% |
| High School | 38 | 32.8% |
| College / Undergraduate | 16 | 13.8% |
| Graduate / Professional | 0 | 0.0% |
| Total | 116 | 100.0% |
School Enrollment by Age by Funding Source in Floyd
Out of a total of 116 students who are enrolled in schools in Floyd, 4 (3.4%) attend a private institution, while the remaining 112 (96.6%) are enrolled in public schools. The age group of 5 to 9 year old has the highest likelihood of being enrolled in private schools, with 4 (33.3% in the age bracket) enrolled. Conversely, the age group of 3 to 4 year olds has the lowest likelihood of being enrolled in a private school, with 7 (100.0% in the age bracket) attending a public institution.
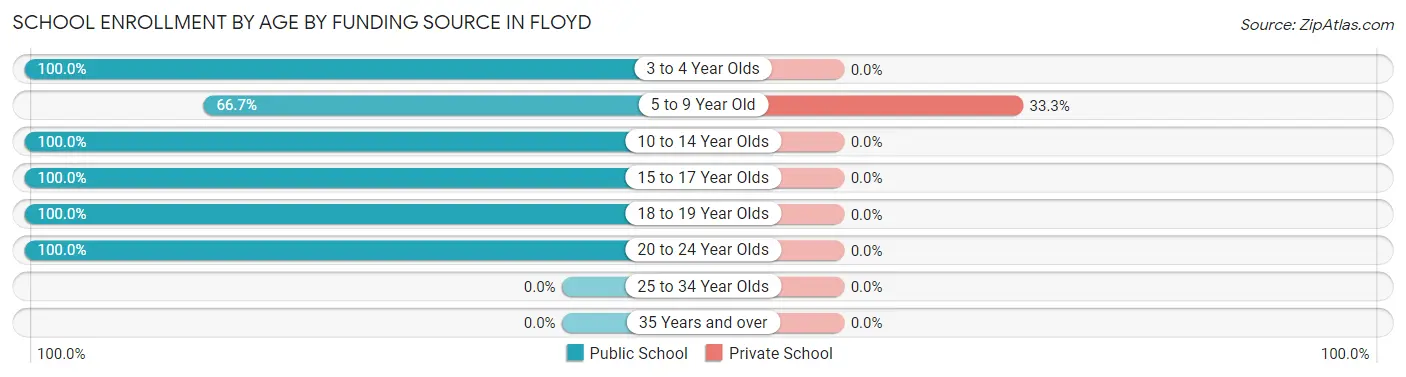
| Age Bracket | Public School | Private School |
| 3 to 4 Year Olds | 7 (100.0%) | 0 (0.0%) |
| 5 to 9 Year Old | 8 (66.7%) | 4 (33.3%) |
| 10 to 14 Year Olds | 46 (100.0%) | 0 (0.0%) |
| 15 to 17 Year Olds | 35 (100.0%) | 0 (0.0%) |
| 18 to 19 Year Olds | 5 (100.0%) | 0 (0.0%) |
| 20 to 24 Year Olds | 11 (100.0%) | 0 (0.0%) |
| 25 to 34 Year Olds | 0 (0.0%) | 0 (0.0%) |
| 35 Years and over | 0 (0.0%) | 0 (0.0%) |
| Total | 112 (96.6%) | 4 (3.4%) |
Educational Attainment by Field of Study in Floyd
Education (31 | 18.8%), literature & languages (27 | 16.4%), business (18 | 10.9%), science & technology (15 | 9.1%), and liberal arts & history (15 | 9.1%) are the most common fields of study among 165 individuals in Floyd who have obtained a bachelor's degree or higher.
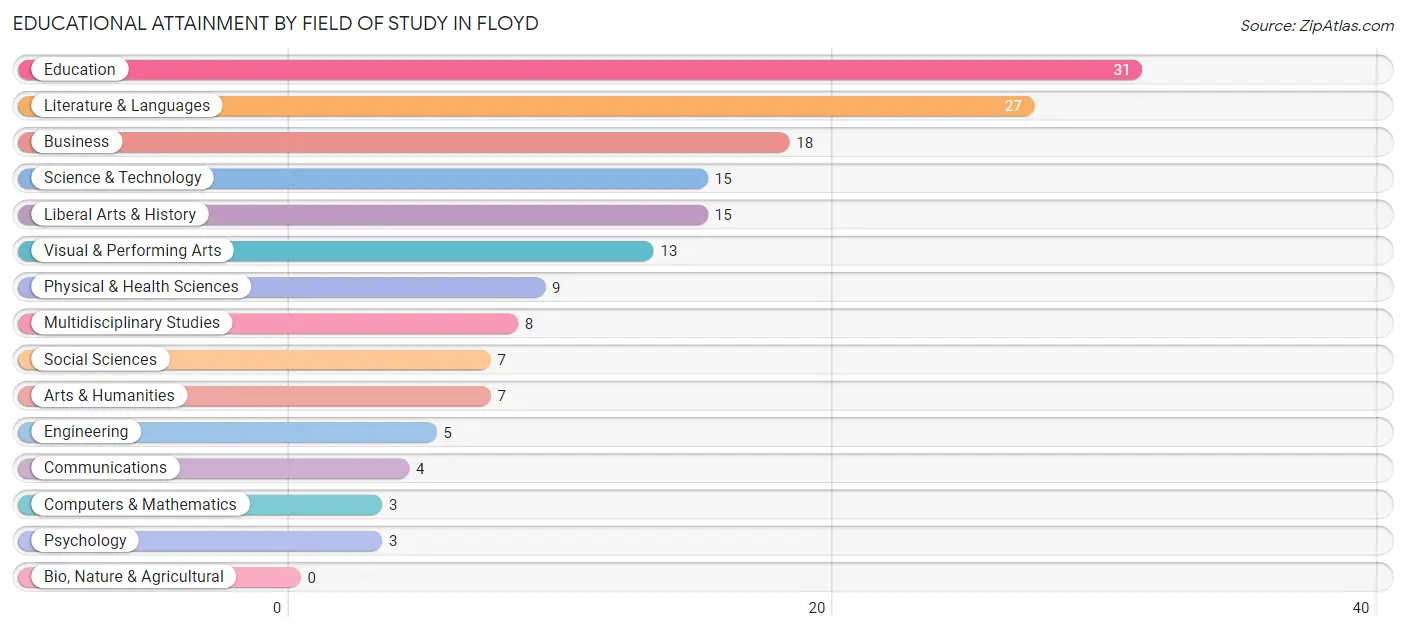
| Field of Study | # Graduates | % Graduates |
| Computers & Mathematics | 3 | 1.8% |
| Bio, Nature & Agricultural | 0 | 0.0% |
| Physical & Health Sciences | 9 | 5.4% |
| Psychology | 3 | 1.8% |
| Social Sciences | 7 | 4.2% |
| Engineering | 5 | 3.0% |
| Multidisciplinary Studies | 8 | 4.9% |
| Science & Technology | 15 | 9.1% |
| Business | 18 | 10.9% |
| Education | 31 | 18.8% |
| Literature & Languages | 27 | 16.4% |
| Liberal Arts & History | 15 | 9.1% |
| Visual & Performing Arts | 13 | 7.9% |
| Communications | 4 | 2.4% |
| Arts & Humanities | 7 | 4.2% |
| Total | 165 | 100.0% |
Transportation & Commute in Floyd
Vehicle Availability by Sex in Floyd
The most prevalent vehicle ownership categories in Floyd are males with 2 vehicles (63, accounting for 50.0%) and females with 2 vehicles (86, making up 44.1%).
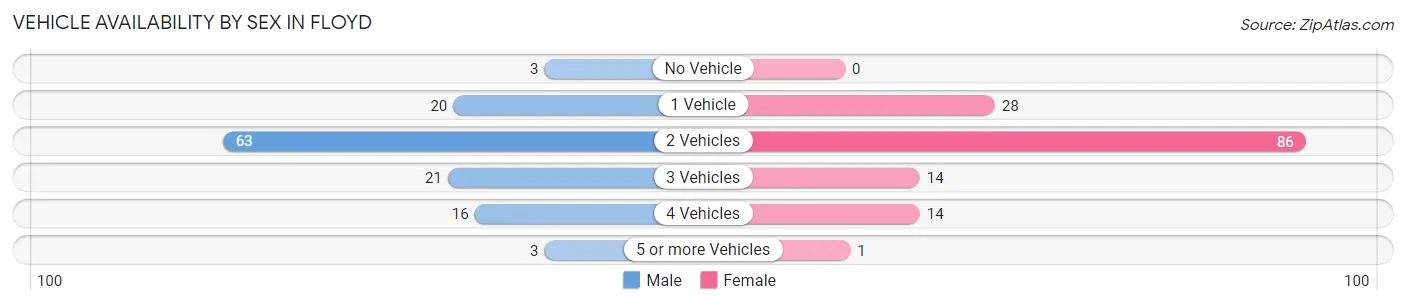
| Vehicles Available | Male | Female |
| No Vehicle | 3 (2.4%) | 0 (0.0%) |
| 1 Vehicle | 20 (15.9%) | 28 (19.6%) |
| 2 Vehicles | 63 (50.0%) | 86 (60.1%) |
| 3 Vehicles | 21 (16.7%) | 14 (9.8%) |
| 4 Vehicles | 16 (12.7%) | 14 (9.8%) |
| 5 or more Vehicles | 3 (2.4%) | 1 (0.7%) |
| Total | 126 (100.0%) | 143 (100.0%) |
Commute Time in Floyd
The most frequently occuring commute durations in Floyd are 5 to 9 minutes (99 commuters, 39.8%), less than 5 minutes (61 commuters, 24.5%), and 10 to 14 minutes (26 commuters, 10.4%).
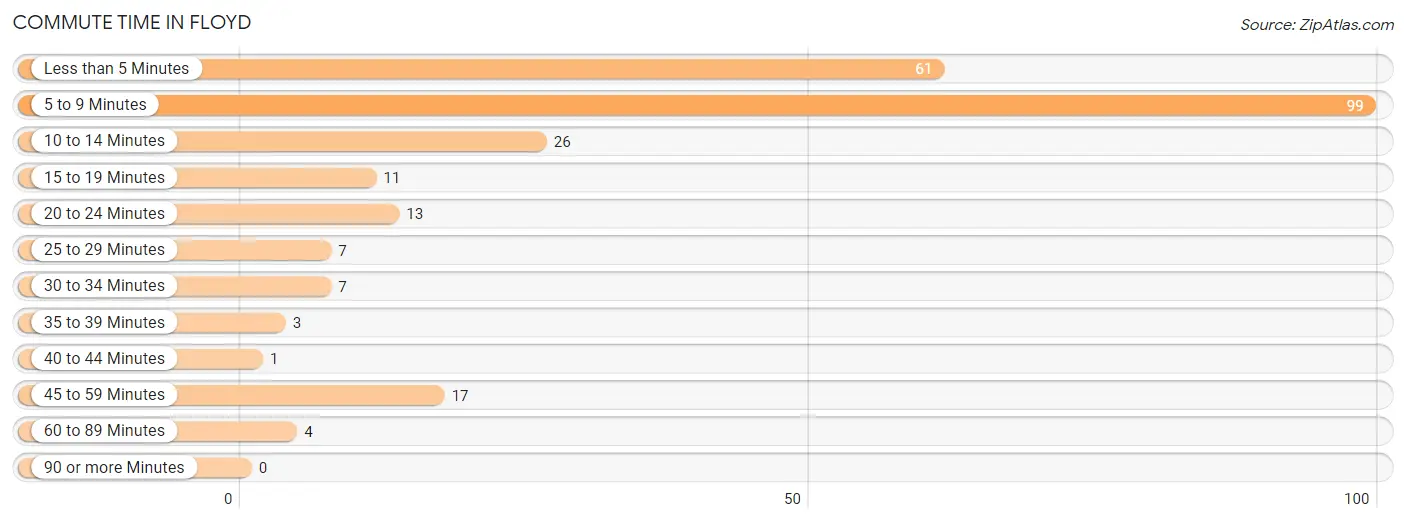
| Commute Time | # Commuters | % Commuters |
| Less than 5 Minutes | 61 | 24.5% |
| 5 to 9 Minutes | 99 | 39.8% |
| 10 to 14 Minutes | 26 | 10.4% |
| 15 to 19 Minutes | 11 | 4.4% |
| 20 to 24 Minutes | 13 | 5.2% |
| 25 to 29 Minutes | 7 | 2.8% |
| 30 to 34 Minutes | 7 | 2.8% |
| 35 to 39 Minutes | 3 | 1.2% |
| 40 to 44 Minutes | 1 | 0.4% |
| 45 to 59 Minutes | 17 | 6.8% |
| 60 to 89 Minutes | 4 | 1.6% |
| 90 or more Minutes | 0 | 0.0% |
Commute Time by Sex in Floyd
The most common commute times in Floyd are 5 to 9 minutes (44 commuters, 38.3%) for males and 5 to 9 minutes (55 commuters, 41.0%) for females.
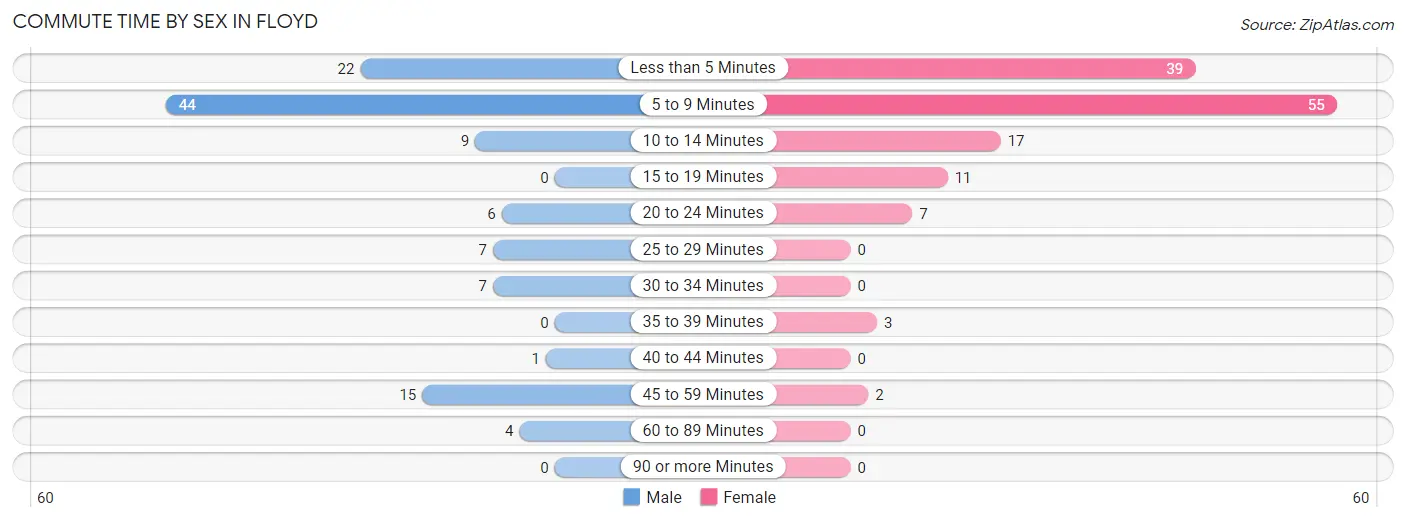
| Commute Time | Male | Female |
| Less than 5 Minutes | 22 (19.1%) | 39 (29.1%) |
| 5 to 9 Minutes | 44 (38.3%) | 55 (41.0%) |
| 10 to 14 Minutes | 9 (7.8%) | 17 (12.7%) |
| 15 to 19 Minutes | 0 (0.0%) | 11 (8.2%) |
| 20 to 24 Minutes | 6 (5.2%) | 7 (5.2%) |
| 25 to 29 Minutes | 7 (6.1%) | 0 (0.0%) |
| 30 to 34 Minutes | 7 (6.1%) | 0 (0.0%) |
| 35 to 39 Minutes | 0 (0.0%) | 3 (2.2%) |
| 40 to 44 Minutes | 1 (0.9%) | 0 (0.0%) |
| 45 to 59 Minutes | 15 (13.0%) | 2 (1.5%) |
| 60 to 89 Minutes | 4 (3.5%) | 0 (0.0%) |
| 90 or more Minutes | 0 (0.0%) | 0 (0.0%) |
Time of Departure to Work by Sex in Floyd
The most frequent times of departure to work in Floyd are 8:00 AM to 8:29 AM (45, 39.1%) for males and 8:00 AM to 8:29 AM (38, 28.4%) for females.
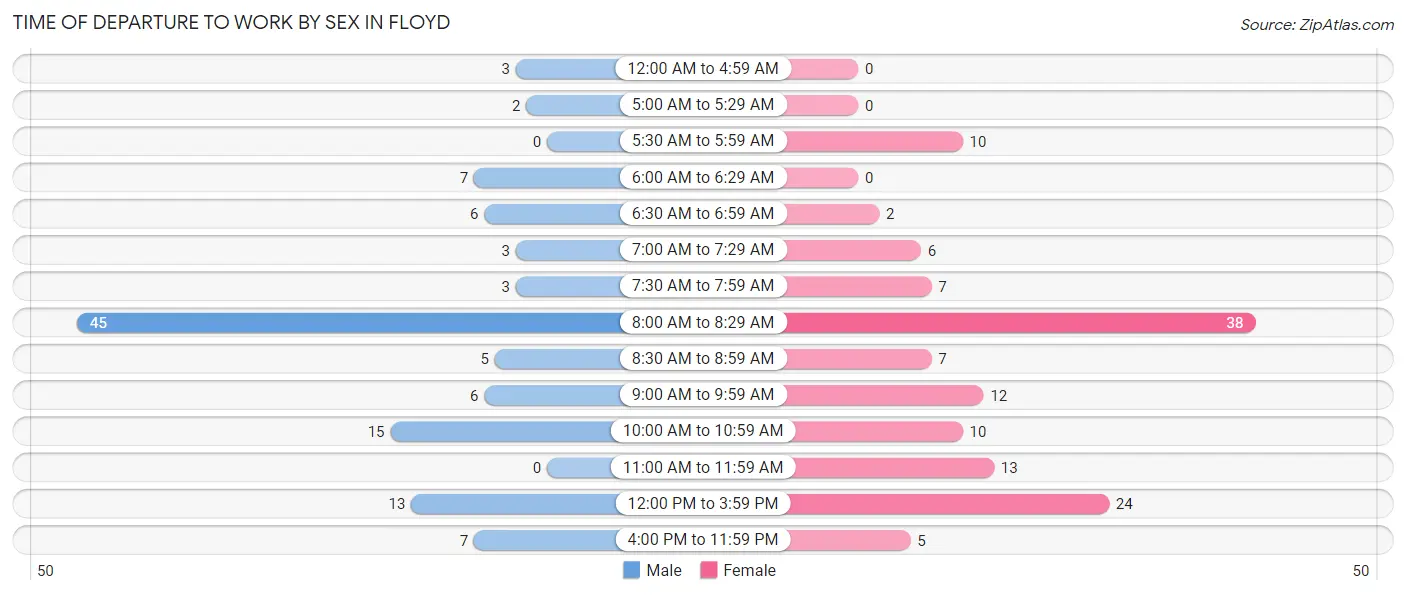
| Time of Departure | Male | Female |
| 12:00 AM to 4:59 AM | 3 (2.6%) | 0 (0.0%) |
| 5:00 AM to 5:29 AM | 2 (1.7%) | 0 (0.0%) |
| 5:30 AM to 5:59 AM | 0 (0.0%) | 10 (7.5%) |
| 6:00 AM to 6:29 AM | 7 (6.1%) | 0 (0.0%) |
| 6:30 AM to 6:59 AM | 6 (5.2%) | 2 (1.5%) |
| 7:00 AM to 7:29 AM | 3 (2.6%) | 6 (4.5%) |
| 7:30 AM to 7:59 AM | 3 (2.6%) | 7 (5.2%) |
| 8:00 AM to 8:29 AM | 45 (39.1%) | 38 (28.4%) |
| 8:30 AM to 8:59 AM | 5 (4.3%) | 7 (5.2%) |
| 9:00 AM to 9:59 AM | 6 (5.2%) | 12 (9.0%) |
| 10:00 AM to 10:59 AM | 15 (13.0%) | 10 (7.5%) |
| 11:00 AM to 11:59 AM | 0 (0.0%) | 13 (9.7%) |
| 12:00 PM to 3:59 PM | 13 (11.3%) | 24 (17.9%) |
| 4:00 PM to 11:59 PM | 7 (6.1%) | 5 (3.7%) |
| Total | 115 (100.0%) | 134 (100.0%) |
Housing Occupancy in Floyd
Occupancy by Ownership in Floyd
Of the total 253 dwellings in Floyd, owner-occupied units account for 158 (62.5%), while renter-occupied units make up 95 (37.6%).
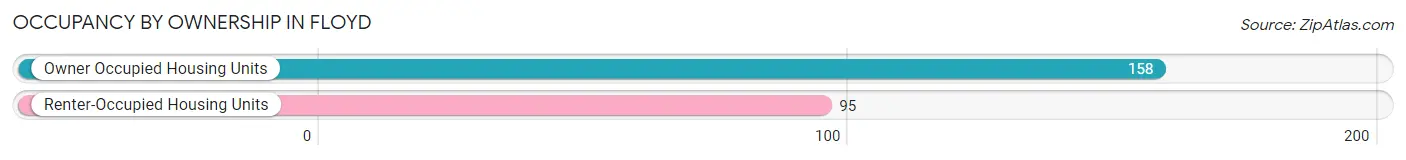
| Occupancy | # Housing Units | % Housing Units |
| Owner Occupied Housing Units | 158 | 62.5% |
| Renter-Occupied Housing Units | 95 | 37.6% |
| Total Occupied Housing Units | 253 | 100.0% |
Occupancy by Household Size in Floyd
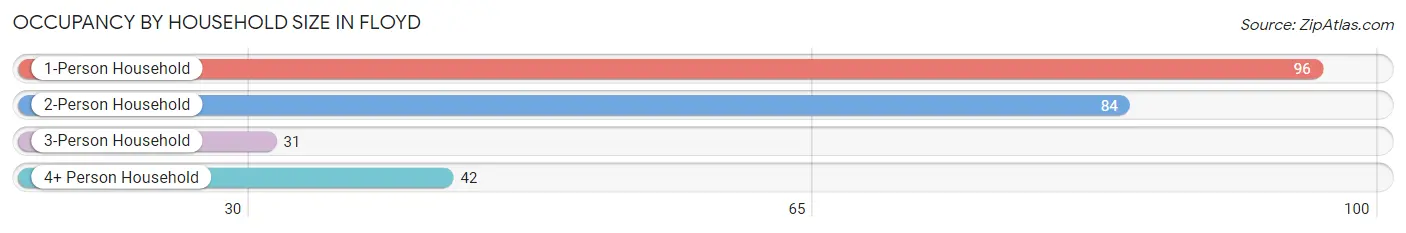
| Household Size | # Housing Units | % Housing Units |
| 1-Person Household | 96 | 37.9% |
| 2-Person Household | 84 | 33.2% |
| 3-Person Household | 31 | 12.2% |
| 4+ Person Household | 42 | 16.6% |
| Total Housing Units | 253 | 100.0% |
Occupancy by Ownership by Household Size in Floyd
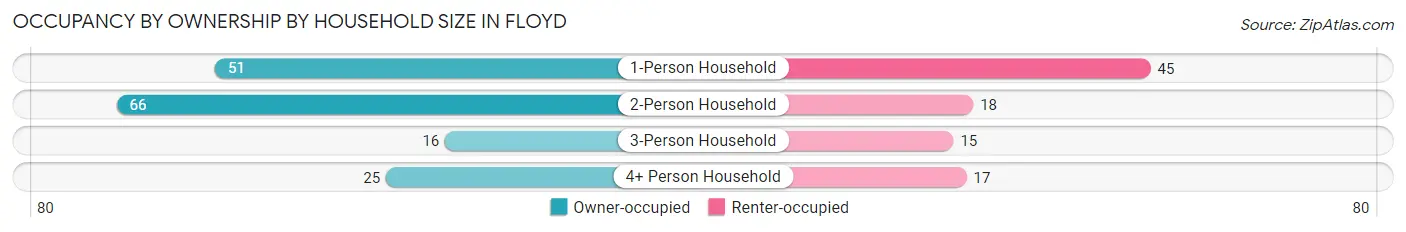
| Household Size | Owner-occupied | Renter-occupied |
| 1-Person Household | 51 (53.1%) | 45 (46.9%) |
| 2-Person Household | 66 (78.6%) | 18 (21.4%) |
| 3-Person Household | 16 (51.6%) | 15 (48.4%) |
| 4+ Person Household | 25 (59.5%) | 17 (40.5%) |
| Total Housing Units | 158 (62.5%) | 95 (37.6%) |
Occupancy by Educational Attainment in Floyd
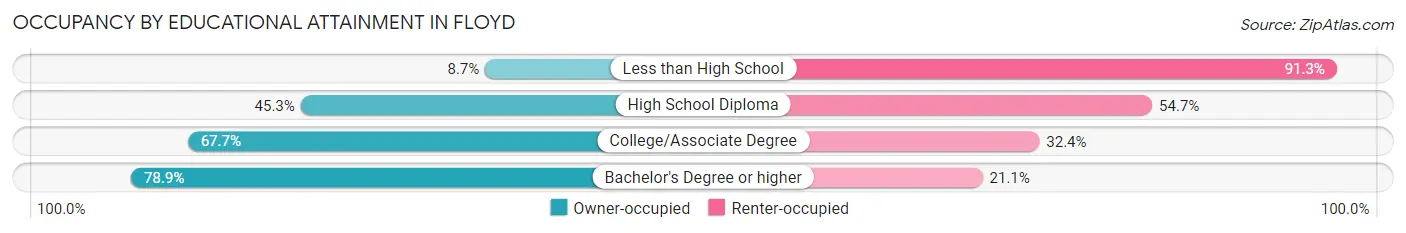
| Household Size | Owner-occupied | Renter-occupied |
| Less than High School | 2 (8.7%) | 21 (91.3%) |
| High School Diploma | 24 (45.3%) | 29 (54.7%) |
| College/Associate Degree | 46 (67.6%) | 22 (32.4%) |
| Bachelor's Degree or higher | 86 (78.9%) | 23 (21.1%) |
Occupancy by Age of Householder in Floyd
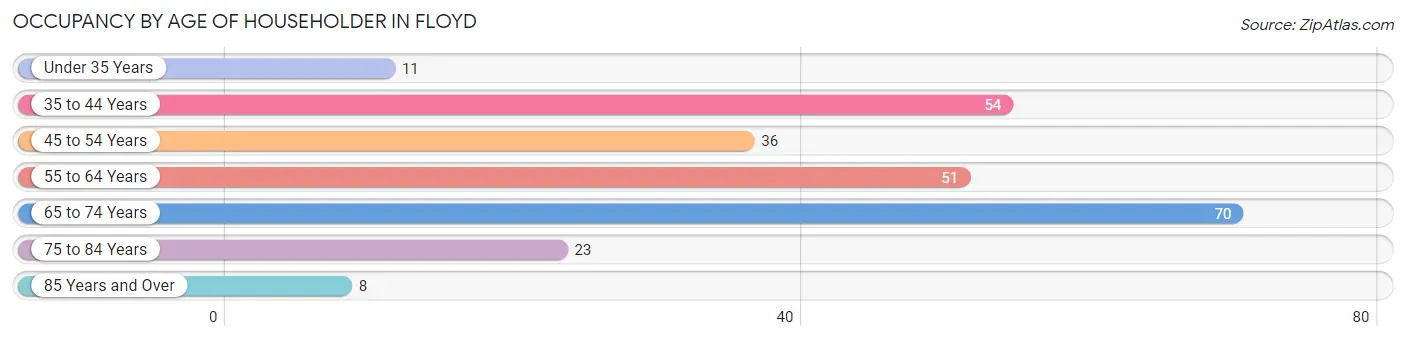
| Age Bracket | # Households | % Households |
| Under 35 Years | 11 | 4.3% |
| 35 to 44 Years | 54 | 21.3% |
| 45 to 54 Years | 36 | 14.2% |
| 55 to 64 Years | 51 | 20.2% |
| 65 to 74 Years | 70 | 27.7% |
| 75 to 84 Years | 23 | 9.1% |
| 85 Years and Over | 8 | 3.2% |
| Total | 253 | 100.0% |
Housing Finances in Floyd
Median Income by Occupancy in Floyd
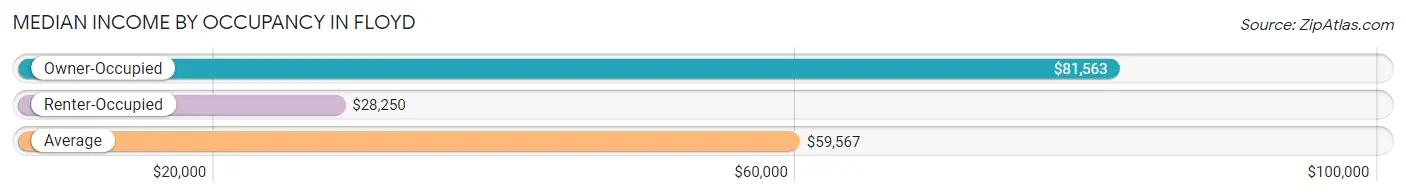
| Occupancy Type | # Households | Median Income |
| Owner-Occupied | 158 (62.5%) | $81,563 |
| Renter-Occupied | 95 (37.6%) | $28,250 |
| Average | 253 (100.0%) | $59,567 |
Occupancy by Householder Income Bracket in Floyd
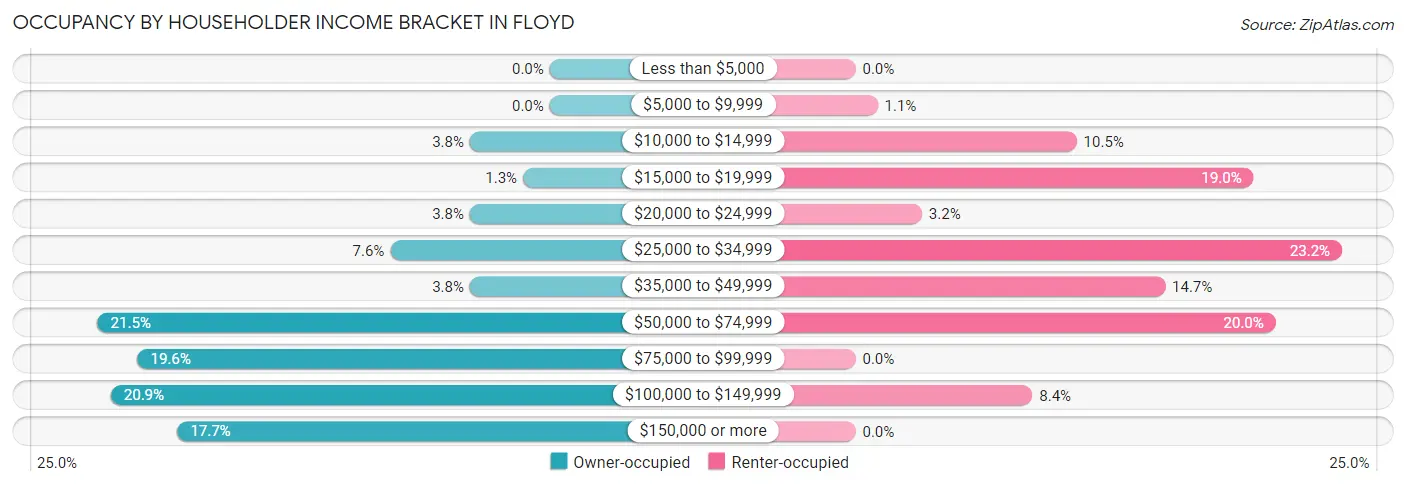
| Income Bracket | Owner-occupied | Renter-occupied |
| Less than $5,000 | 0 (0.0%) | 0 (0.0%) |
| $5,000 to $9,999 | 0 (0.0%) | 1 (1.1%) |
| $10,000 to $14,999 | 6 (3.8%) | 10 (10.5%) |
| $15,000 to $19,999 | 2 (1.3%) | 18 (19.0%) |
| $20,000 to $24,999 | 6 (3.8%) | 3 (3.2%) |
| $25,000 to $34,999 | 12 (7.6%) | 22 (23.2%) |
| $35,000 to $49,999 | 6 (3.8%) | 14 (14.7%) |
| $50,000 to $74,999 | 34 (21.5%) | 19 (20.0%) |
| $75,000 to $99,999 | 31 (19.6%) | 0 (0.0%) |
| $100,000 to $149,999 | 33 (20.9%) | 8 (8.4%) |
| $150,000 or more | 28 (17.7%) | 0 (0.0%) |
| Total | 158 (100.0%) | 95 (100.0%) |
Monthly Housing Cost Tiers in Floyd
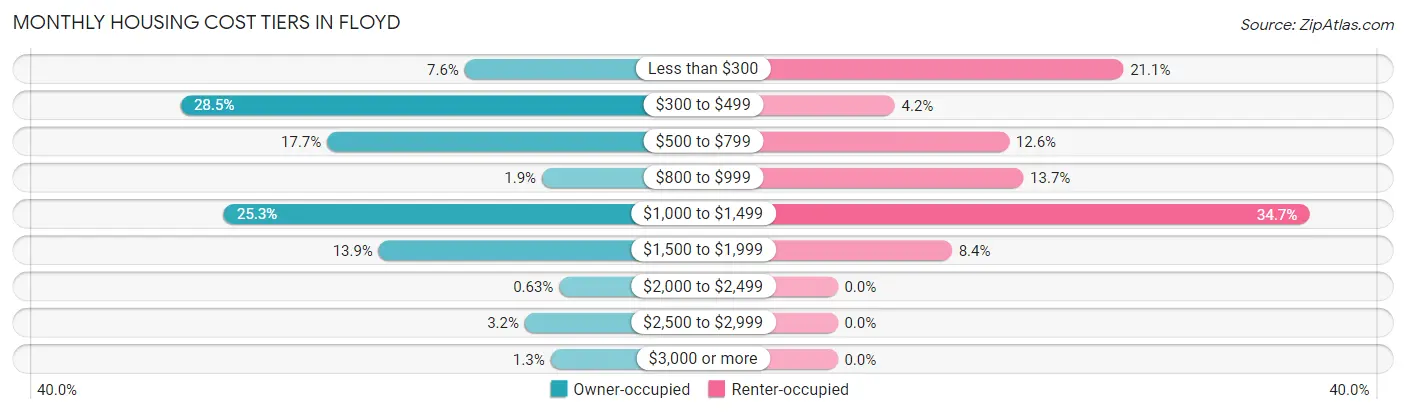
| Monthly Cost | Owner-occupied | Renter-occupied |
| Less than $300 | 12 (7.6%) | 20 (21.0%) |
| $300 to $499 | 45 (28.5%) | 4 (4.2%) |
| $500 to $799 | 28 (17.7%) | 12 (12.6%) |
| $800 to $999 | 3 (1.9%) | 13 (13.7%) |
| $1,000 to $1,499 | 40 (25.3%) | 33 (34.7%) |
| $1,500 to $1,999 | 22 (13.9%) | 8 (8.4%) |
| $2,000 to $2,499 | 1 (0.6%) | 0 (0.0%) |
| $2,500 to $2,999 | 5 (3.2%) | 0 (0.0%) |
| $3,000 or more | 2 (1.3%) | 0 (0.0%) |
| Total | 158 (100.0%) | 95 (100.0%) |
Physical Housing Characteristics in Floyd
Housing Structures in Floyd
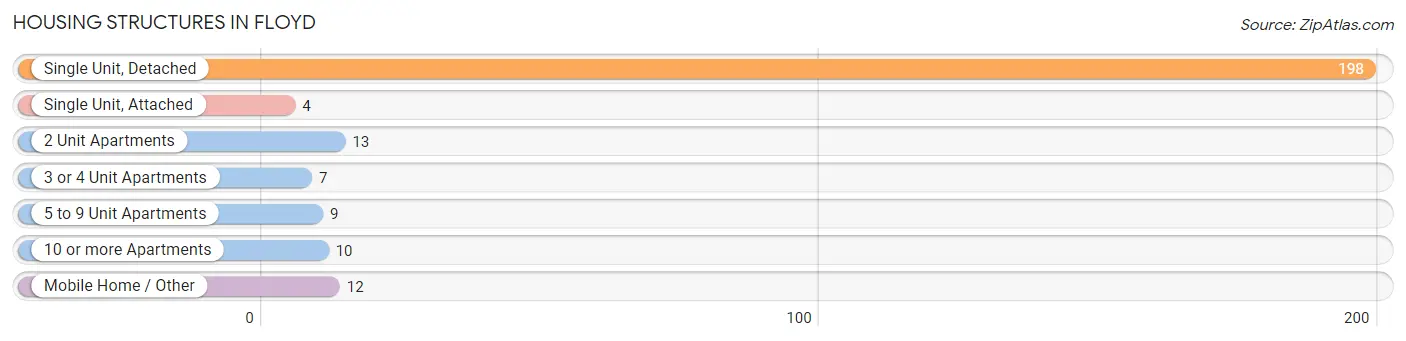
| Structure Type | # Housing Units | % Housing Units |
| Single Unit, Detached | 198 | 78.3% |
| Single Unit, Attached | 4 | 1.6% |
| 2 Unit Apartments | 13 | 5.1% |
| 3 or 4 Unit Apartments | 7 | 2.8% |
| 5 to 9 Unit Apartments | 9 | 3.6% |
| 10 or more Apartments | 10 | 4.0% |
| Mobile Home / Other | 12 | 4.7% |
| Total | 253 | 100.0% |
Housing Structures by Occupancy in Floyd
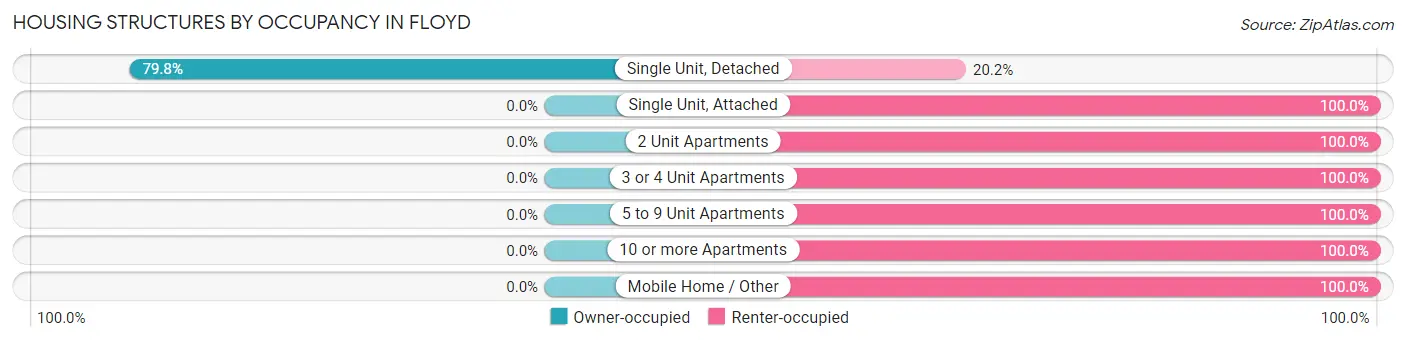
| Structure Type | Owner-occupied | Renter-occupied |
| Single Unit, Detached | 158 (79.8%) | 40 (20.2%) |
| Single Unit, Attached | 0 (0.0%) | 4 (100.0%) |
| 2 Unit Apartments | 0 (0.0%) | 13 (100.0%) |
| 3 or 4 Unit Apartments | 0 (0.0%) | 7 (100.0%) |
| 5 to 9 Unit Apartments | 0 (0.0%) | 9 (100.0%) |
| 10 or more Apartments | 0 (0.0%) | 10 (100.0%) |
| Mobile Home / Other | 0 (0.0%) | 12 (100.0%) |
| Total | 158 (62.5%) | 95 (37.6%) |
Housing Structures by Number of Rooms in Floyd
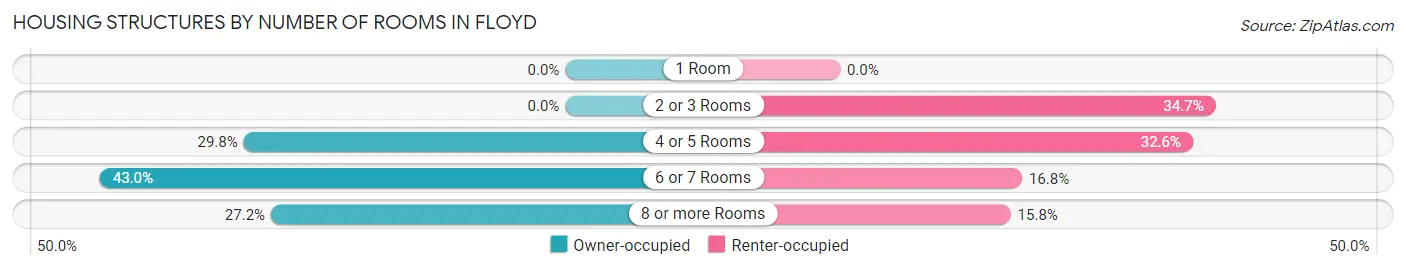
| Number of Rooms | Owner-occupied | Renter-occupied |
| 1 Room | 0 (0.0%) | 0 (0.0%) |
| 2 or 3 Rooms | 0 (0.0%) | 33 (34.7%) |
| 4 or 5 Rooms | 47 (29.7%) | 31 (32.6%) |
| 6 or 7 Rooms | 68 (43.0%) | 16 (16.8%) |
| 8 or more Rooms | 43 (27.2%) | 15 (15.8%) |
| Total | 158 (100.0%) | 95 (100.0%) |
Housing Structure by Heating Type in Floyd
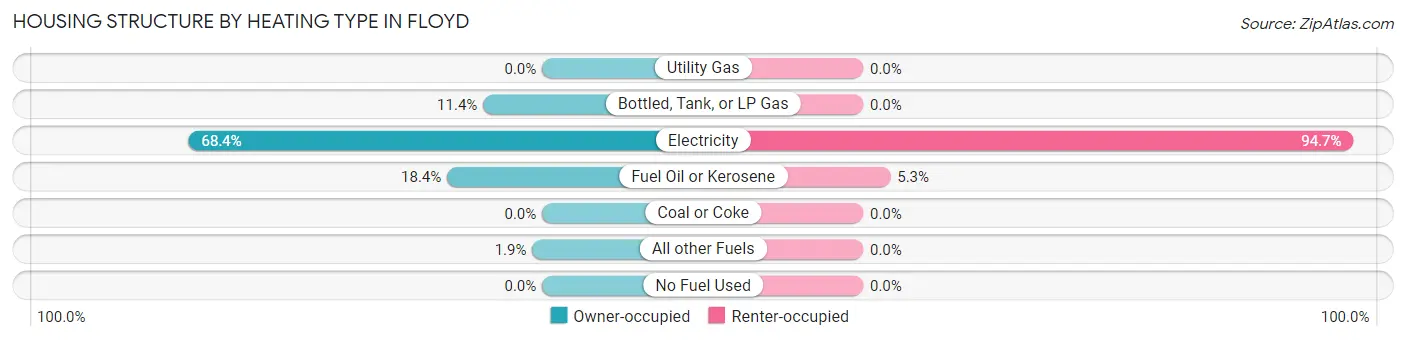
| Heating Type | Owner-occupied | Renter-occupied |
| Utility Gas | 0 (0.0%) | 0 (0.0%) |
| Bottled, Tank, or LP Gas | 18 (11.4%) | 0 (0.0%) |
| Electricity | 108 (68.3%) | 90 (94.7%) |
| Fuel Oil or Kerosene | 29 (18.3%) | 5 (5.3%) |
| Coal or Coke | 0 (0.0%) | 0 (0.0%) |
| All other Fuels | 3 (1.9%) | 0 (0.0%) |
| No Fuel Used | 0 (0.0%) | 0 (0.0%) |
| Total | 158 (100.0%) | 95 (100.0%) |
Household Vehicle Usage in Floyd
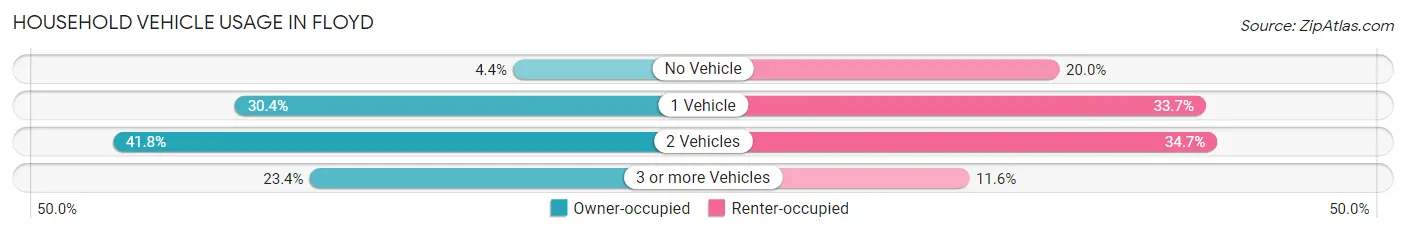
| Vehicles per Household | Owner-occupied | Renter-occupied |
| No Vehicle | 7 (4.4%) | 19 (20.0%) |
| 1 Vehicle | 48 (30.4%) | 32 (33.7%) |
| 2 Vehicles | 66 (41.8%) | 33 (34.7%) |
| 3 or more Vehicles | 37 (23.4%) | 11 (11.6%) |
| Total | 158 (100.0%) | 95 (100.0%) |
Real Estate & Mortgages in Floyd
Real Estate and Mortgage Overview in Floyd
| Characteristic | Without Mortgage | With Mortgage |
| Housing Units | 78 | 80 |
| Median Property Value | $210,600 | $250,000 |
| Median Household Income | $85,000 | $14 |
| Monthly Housing Costs | $350 | $2 |
| Real Estate Taxes | $1,474 | $0 |
Property Value by Mortgage Status in Floyd
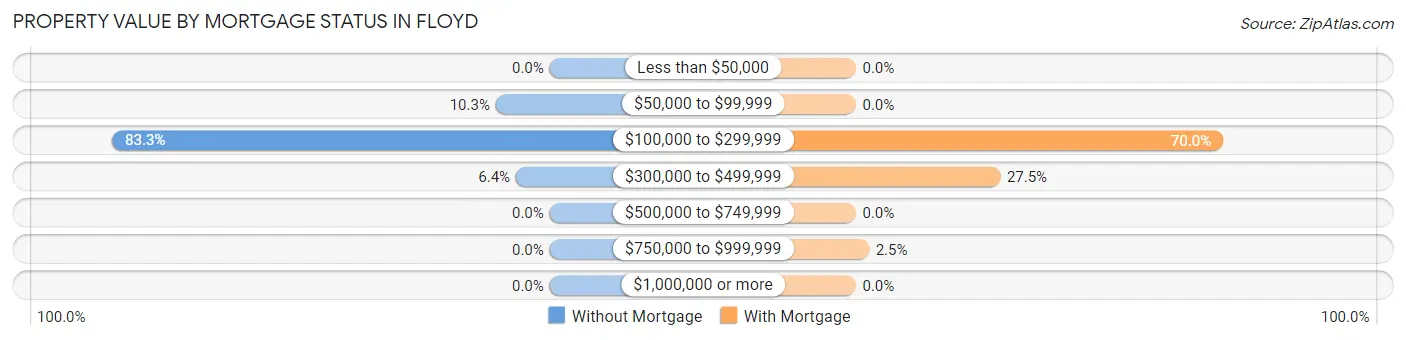
| Property Value | Without Mortgage | With Mortgage |
| Less than $50,000 | 0 (0.0%) | 0 (0.0%) |
| $50,000 to $99,999 | 8 (10.3%) | 0 (0.0%) |
| $100,000 to $299,999 | 65 (83.3%) | 56 (70.0%) |
| $300,000 to $499,999 | 5 (6.4%) | 22 (27.5%) |
| $500,000 to $749,999 | 0 (0.0%) | 0 (0.0%) |
| $750,000 to $999,999 | 0 (0.0%) | 2 (2.5%) |
| $1,000,000 or more | 0 (0.0%) | 0 (0.0%) |
| Total | 78 (100.0%) | 80 (100.0%) |
Household Income by Mortgage Status in Floyd
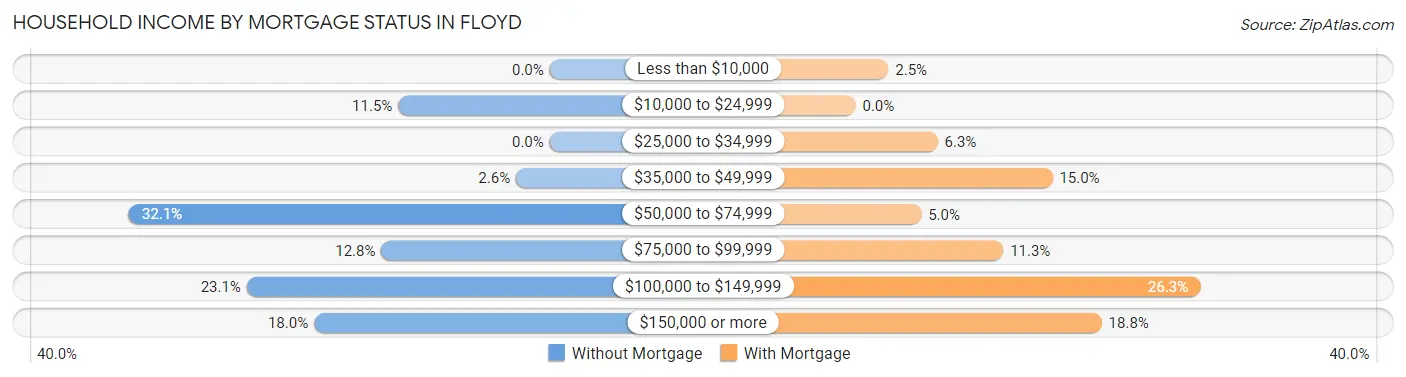
| Household Income | Without Mortgage | With Mortgage |
| Less than $10,000 | 0 (0.0%) | 2 (2.5%) |
| $10,000 to $24,999 | 9 (11.5%) | 0 (0.0%) |
| $25,000 to $34,999 | 0 (0.0%) | 5 (6.2%) |
| $35,000 to $49,999 | 2 (2.6%) | 12 (15.0%) |
| $50,000 to $74,999 | 25 (32.1%) | 4 (5.0%) |
| $75,000 to $99,999 | 10 (12.8%) | 9 (11.3%) |
| $100,000 to $149,999 | 18 (23.1%) | 21 (26.3%) |
| $150,000 or more | 14 (17.9%) | 15 (18.8%) |
| Total | 78 (100.0%) | 80 (100.0%) |
Property Value to Household Income Ratio in Floyd
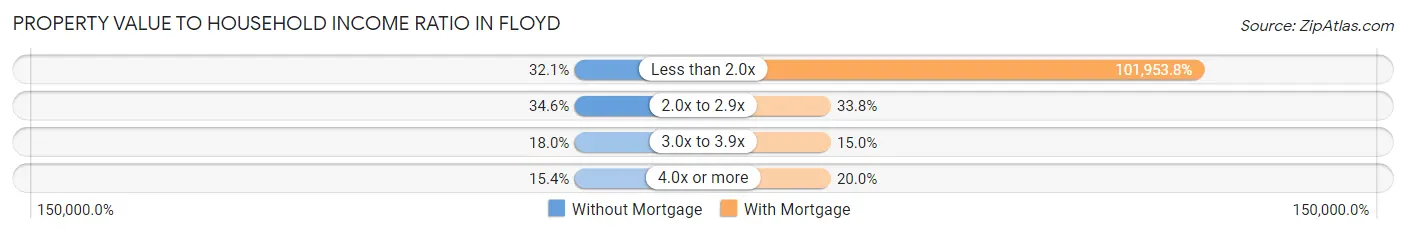
| Value-to-Income Ratio | Without Mortgage | With Mortgage |
| Less than 2.0x | 25 (32.1%) | 81,563 (101,953.8%) |
| 2.0x to 2.9x | 27 (34.6%) | 27 (33.8%) |
| 3.0x to 3.9x | 14 (17.9%) | 12 (15.0%) |
| 4.0x or more | 12 (15.4%) | 16 (20.0%) |
| Total | 78 (100.0%) | 80 (100.0%) |
Real Estate Taxes by Mortgage Status in Floyd
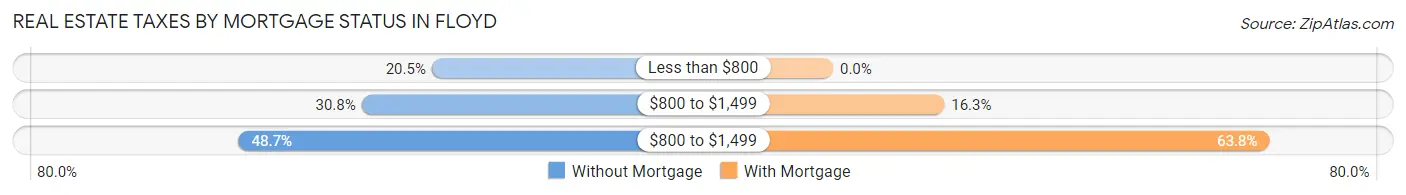
| Property Taxes | Without Mortgage | With Mortgage |
| Less than $800 | 16 (20.5%) | 0 (0.0%) |
| $800 to $1,499 | 24 (30.8%) | 13 (16.3%) |
| $800 to $1,499 | 38 (48.7%) | 51 (63.7%) |
| Total | 78 (100.0%) | 80 (100.0%) |
Health & Disability in Floyd
Health Insurance Coverage by Age in Floyd
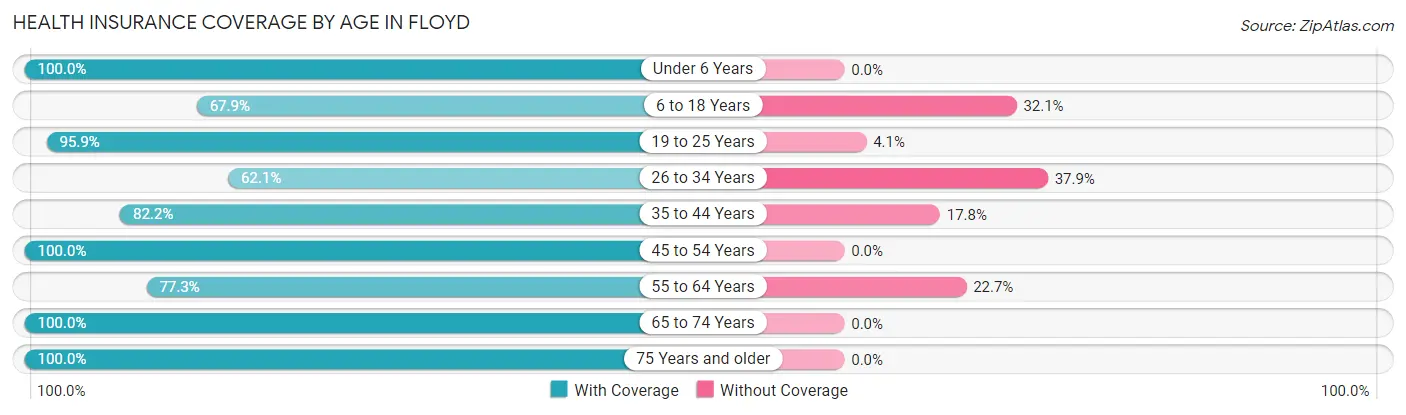
| Age Bracket | With Coverage | Without Coverage |
| Under 6 Years | 32 (100.0%) | 0 (0.0%) |
| 6 to 18 Years | 55 (67.9%) | 26 (32.1%) |
| 19 to 25 Years | 47 (95.9%) | 2 (4.1%) |
| 26 to 34 Years | 18 (62.1%) | 11 (37.9%) |
| 35 to 44 Years | 60 (82.2%) | 13 (17.8%) |
| 45 to 54 Years | 60 (100.0%) | 0 (0.0%) |
| 55 to 64 Years | 68 (77.3%) | 20 (22.7%) |
| 65 to 74 Years | 99 (100.0%) | 0 (0.0%) |
| 75 Years and older | 59 (100.0%) | 0 (0.0%) |
| Total | 498 (87.4%) | 72 (12.6%) |
Health Insurance Coverage by Citizenship Status in Floyd
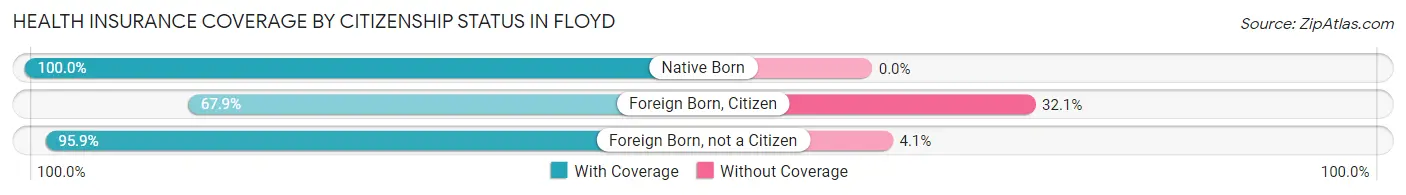
| Citizenship Status | With Coverage | Without Coverage |
| Native Born | 32 (100.0%) | 0 (0.0%) |
| Foreign Born, Citizen | 55 (67.9%) | 26 (32.1%) |
| Foreign Born, not a Citizen | 47 (95.9%) | 2 (4.1%) |
Health Insurance Coverage by Household Income in Floyd
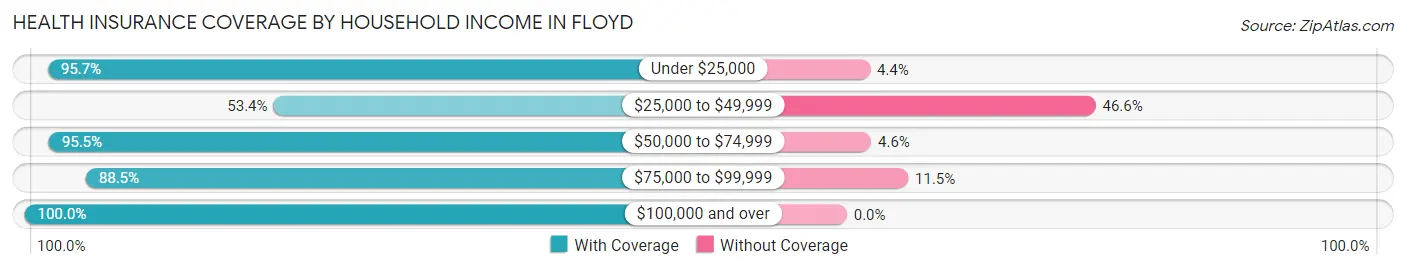
| Household Income | With Coverage | Without Coverage |
| Under $25,000 | 66 (95.7%) | 3 (4.3%) |
| $25,000 to $49,999 | 63 (53.4%) | 55 (46.6%) |
| $50,000 to $74,999 | 84 (95.5%) | 4 (4.5%) |
| $75,000 to $99,999 | 77 (88.5%) | 10 (11.5%) |
| $100,000 and over | 208 (100.0%) | 0 (0.0%) |
Public vs Private Health Insurance Coverage by Age in Floyd
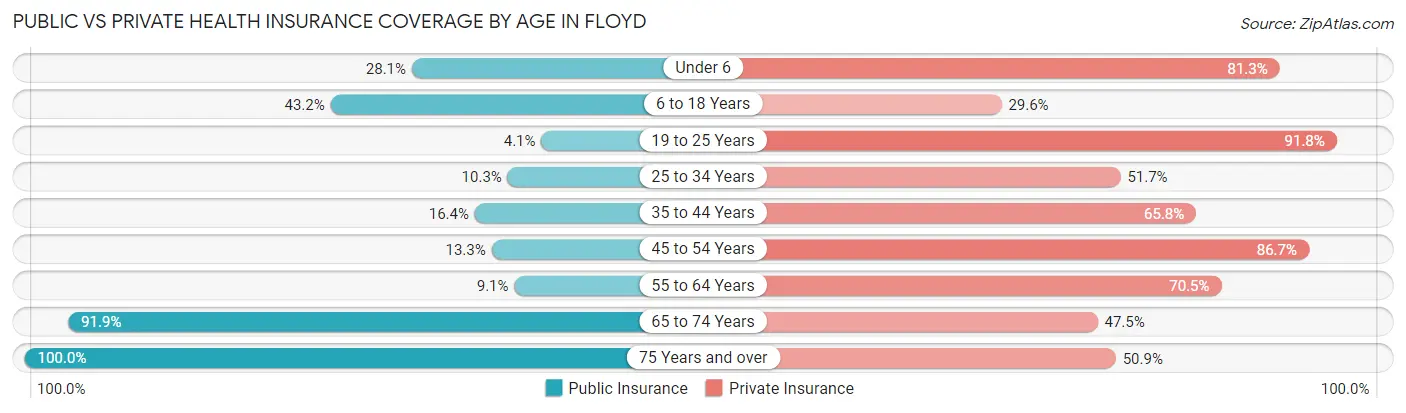
| Age Bracket | Public Insurance | Private Insurance |
| Under 6 | 9 (28.1%) | 26 (81.2%) |
| 6 to 18 Years | 35 (43.2%) | 24 (29.6%) |
| 19 to 25 Years | 2 (4.1%) | 45 (91.8%) |
| 25 to 34 Years | 3 (10.3%) | 15 (51.7%) |
| 35 to 44 Years | 12 (16.4%) | 48 (65.7%) |
| 45 to 54 Years | 8 (13.3%) | 52 (86.7%) |
| 55 to 64 Years | 8 (9.1%) | 62 (70.5%) |
| 65 to 74 Years | 91 (91.9%) | 47 (47.5%) |
| 75 Years and over | 59 (100.0%) | 30 (50.8%) |
| Total | 227 (39.8%) | 349 (61.2%) |
Disability Status by Sex by Age in Floyd
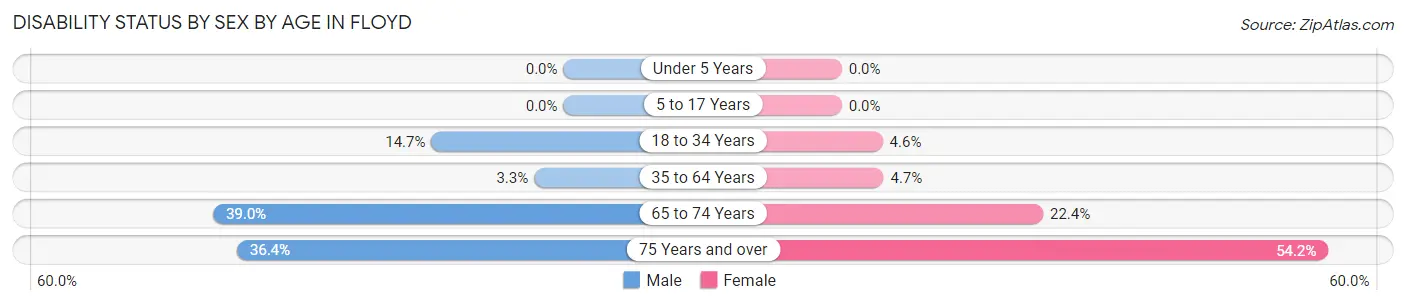
| Age Bracket | Male | Female |
| Under 5 Years | 0 (0.0%) | 0 (0.0%) |
| 5 to 17 Years | 0 (0.0%) | 0 (0.0%) |
| 18 to 34 Years | 5 (14.7%) | 2 (4.5%) |
| 35 to 64 Years | 3 (3.3%) | 6 (4.6%) |
| 65 to 74 Years | 16 (39.0%) | 13 (22.4%) |
| 75 Years and over | 4 (36.4%) | 26 (54.2%) |
Disability Class by Sex by Age in Floyd
Disability Class: Hearing Difficulty
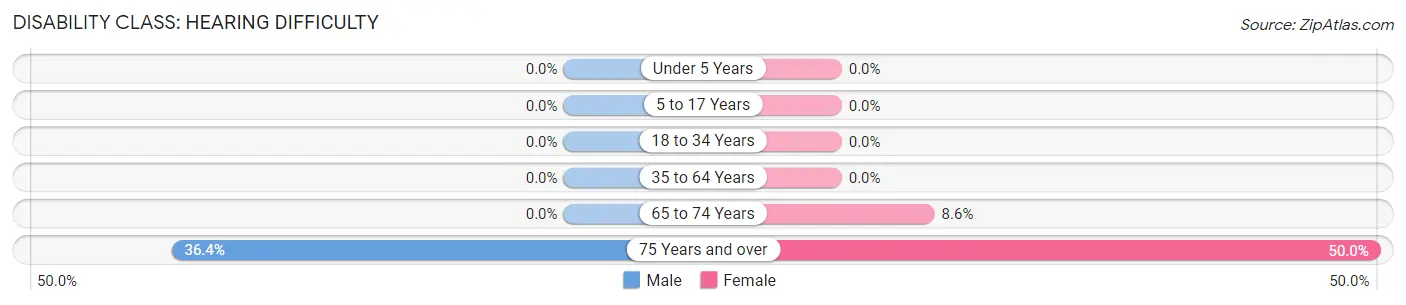
| Age Bracket | Male | Female |
| Under 5 Years | 0 (0.0%) | 0 (0.0%) |
| 5 to 17 Years | 0 (0.0%) | 0 (0.0%) |
| 18 to 34 Years | 0 (0.0%) | 0 (0.0%) |
| 35 to 64 Years | 0 (0.0%) | 0 (0.0%) |
| 65 to 74 Years | 0 (0.0%) | 5 (8.6%) |
| 75 Years and over | 4 (36.4%) | 24 (50.0%) |
Disability Class: Vision Difficulty
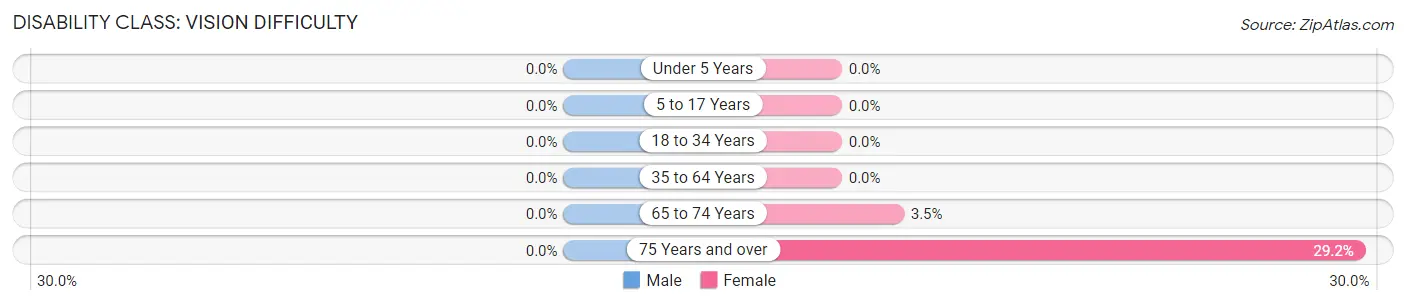
| Age Bracket | Male | Female |
| Under 5 Years | 0 (0.0%) | 0 (0.0%) |
| 5 to 17 Years | 0 (0.0%) | 0 (0.0%) |
| 18 to 34 Years | 0 (0.0%) | 0 (0.0%) |
| 35 to 64 Years | 0 (0.0%) | 0 (0.0%) |
| 65 to 74 Years | 0 (0.0%) | 2 (3.5%) |
| 75 Years and over | 0 (0.0%) | 14 (29.2%) |
Disability Class: Cognitive Difficulty
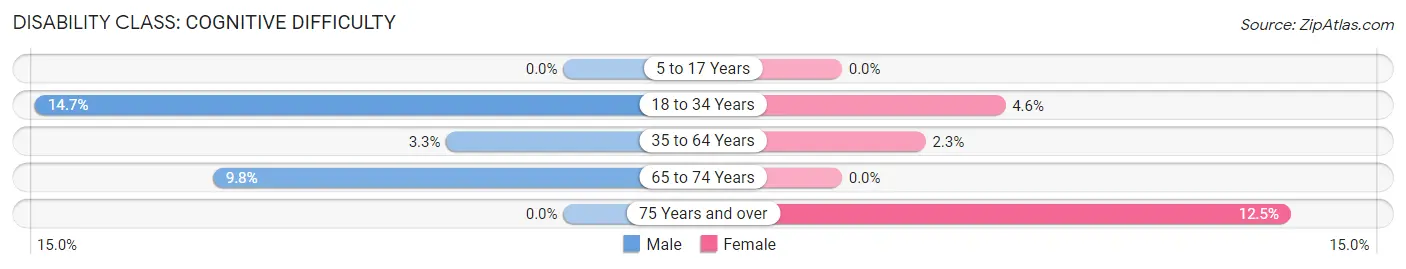
| Age Bracket | Male | Female |
| 5 to 17 Years | 0 (0.0%) | 0 (0.0%) |
| 18 to 34 Years | 5 (14.7%) | 2 (4.5%) |
| 35 to 64 Years | 3 (3.3%) | 3 (2.3%) |
| 65 to 74 Years | 4 (9.8%) | 0 (0.0%) |
| 75 Years and over | 0 (0.0%) | 6 (12.5%) |
Disability Class: Ambulatory Difficulty
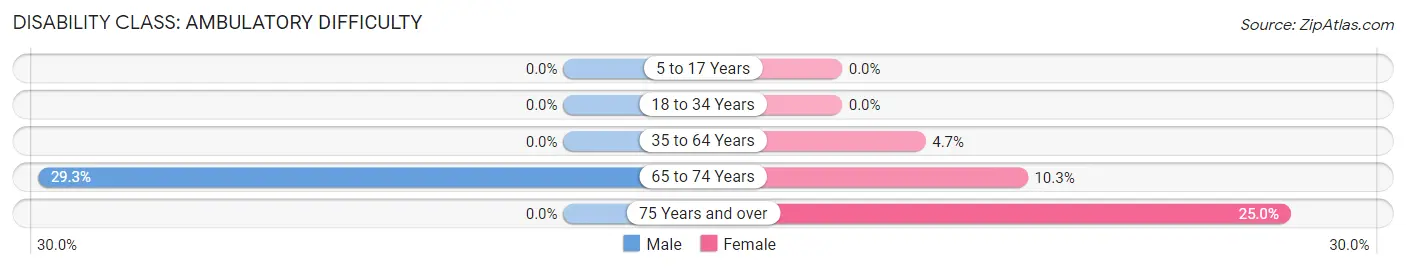
| Age Bracket | Male | Female |
| 5 to 17 Years | 0 (0.0%) | 0 (0.0%) |
| 18 to 34 Years | 0 (0.0%) | 0 (0.0%) |
| 35 to 64 Years | 0 (0.0%) | 6 (4.6%) |
| 65 to 74 Years | 12 (29.3%) | 6 (10.3%) |
| 75 Years and over | 0 (0.0%) | 12 (25.0%) |
Disability Class: Self-Care Difficulty
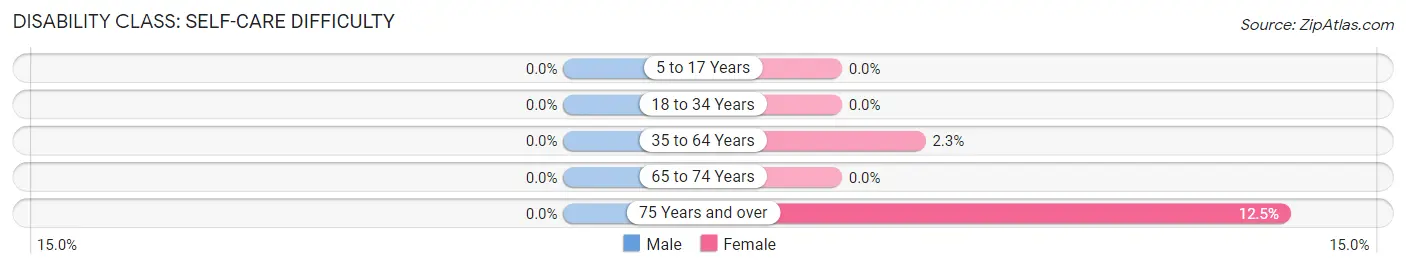
| Age Bracket | Male | Female |
| 5 to 17 Years | 0 (0.0%) | 0 (0.0%) |
| 18 to 34 Years | 0 (0.0%) | 0 (0.0%) |
| 35 to 64 Years | 0 (0.0%) | 3 (2.3%) |
| 65 to 74 Years | 0 (0.0%) | 0 (0.0%) |
| 75 Years and over | 0 (0.0%) | 6 (12.5%) |
Technology Access in Floyd
Computing Device Access in Floyd
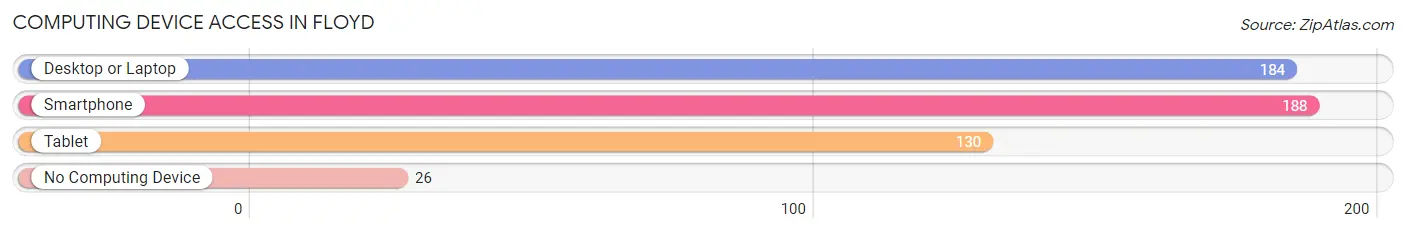
| Device Type | # Households | % Households |
| Desktop or Laptop | 184 | 72.7% |
| Smartphone | 188 | 74.3% |
| Tablet | 130 | 51.4% |
| No Computing Device | 26 | 10.3% |
| Total | 253 | 100.0% |
Internet Access in Floyd
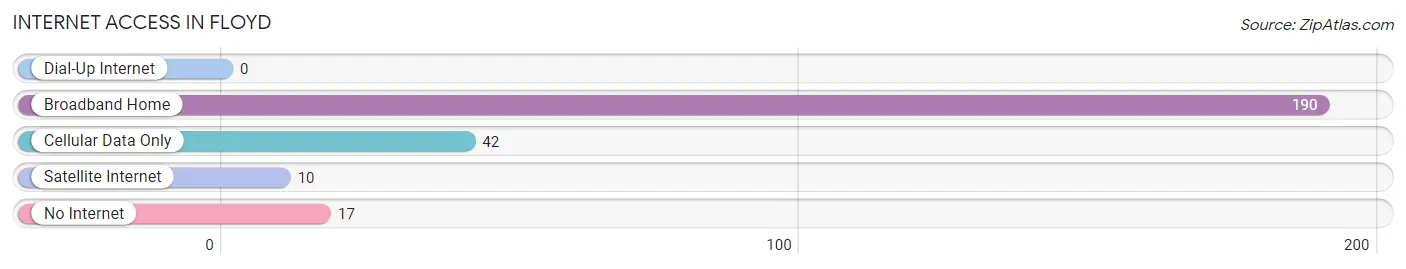
| Internet Type | # Households | % Households |
| Dial-Up Internet | 0 | 0.0% |
| Broadband Home | 190 | 75.1% |
| Cellular Data Only | 42 | 16.6% |
| Satellite Internet | 10 | 4.0% |
| No Internet | 17 | 6.7% |
| Total | 253 | 100.0% |
Floyd Summary
Floyd, Virginia is a small town located in the Blue Ridge Mountains of southwestern Virginia. It is the county seat of Floyd County and is part of the Blacksburg-Christiansburg-Radford Metropolitan Statistical Area. The town has a population of 462 people, according to the 2010 census.
History
Floyd was founded in 1837 and named after John Floyd, the Governor of Virginia from 1834 to 1836. The town was originally known as Jacksonville, but the name was changed to Floyd in 1845. The town was an important stop on the Great Road, which connected the Shenandoah Valley to the Piedmont region of Virginia.
Floyd was an important center of commerce in the 19th century, with several stores, a hotel, and a post office. The town was also home to several churches, including the Floyd Presbyterian Church, which was founded in 1845.
In the late 19th century, Floyd became a popular destination for tourists, who came to enjoy the scenic beauty of the Blue Ridge Mountains. The town was also home to several resorts, including the Floyd Hotel, which was built in 1891.
Geography
Floyd is located in the Blue Ridge Mountains of southwestern Virginia. The town is situated at the intersection of US Route 221 and State Route 8. The town is surrounded by the Jefferson National Forest and is located near the Blue Ridge Parkway.
The town is located in a valley, with the surrounding mountains providing a picturesque backdrop. The town is located at an elevation of 1,890 feet above sea level.
Economy
Floyd is a small, rural town with a limited economy. The town is home to several small businesses, including restaurants, antique stores, and art galleries. The town is also home to several farms, which produce a variety of crops, including apples, peaches, and hay.
The town is also home to several wineries, which produce a variety of wines. The town is also home to several craft breweries, which produce a variety of beers.
Demographics
According to the 2010 census, Floyd has a population of 462 people. The town has a median household income of $35,000 and a median age of 44. The town is predominantly white, with 92.3% of the population identifying as white. The town is also home to a small Hispanic population, with 4.3% of the population identifying as Hispanic or Latino.
Conclusion
Floyd, Virginia is a small town located in the Blue Ridge Mountains of southwestern Virginia. The town has a population of 462 people, according to the 2010 census. The town is an important center of commerce in the 19th century, with several stores, a hotel, and a post office. The town is also home to several wineries, craft breweries, and farms. The town is predominantly white, with 92.3% of the population identifying as white. The town has a median household income of $35,000 and a median age of 44.
Common Questions
What is Per Capita Income in Floyd?
Per Capita income in Floyd is $33,372.
What is the Median Family Income in Floyd?
Median Family Income in Floyd is $81,484.
What is the Median Household income in Floyd?
Median Household Income in Floyd is $59,567.
What is Income or Wage Gap in Floyd?
Income or Wage Gap in Floyd is 39.3%.
Women in Floyd earn 60.7 cents for every dollar earned by a man.
What is Family Income Deficit in Floyd?
Family Income Deficit in Floyd is $5,923.
Families that are below poverty line in Floyd earn $5,923 less on average than the poverty threshold level.
What is Inequality or Gini Index in Floyd?
Inequality or Gini Index in Floyd is 0.40.
What is the Total Population of Floyd?
Total Population of Floyd is 570.
What is the Total Male Population of Floyd?
Total Male Population of Floyd is 218.
What is the Total Female Population of Floyd?
Total Female Population of Floyd is 352.
What is the Ratio of Males per 100 Females in Floyd?
There are 61.93 Males per 100 Females in Floyd.
What is the Ratio of Females per 100 Males in Floyd?
There are 161.47 Females per 100 Males in Floyd.
What is the Median Population Age in Floyd?
Median Population Age in Floyd is 51.1 Years.
What is the Average Family Size in Floyd
Average Family Size in Floyd is 3.0 People.
What is the Average Household Size in Floyd
Average Household Size in Floyd is 2.2 People.
How Large is the Labor Force in Floyd?
There are 283 People in the Labor Forcein in Floyd.
What is the Percentage of People in the Labor Force in Floyd?
58.7% of People are in the Labor Force in Floyd.
What is the Unemployment Rate in Floyd?
Unemployment Rate in Floyd is 3.2%.