Laurel, VA Map & Demographics
Laurel Map
Laurel Overview
$35,155
PER CAPITA INCOME
$91,148
AVG FAMILY INCOME
$67,988
AVG HOUSEHOLD INCOME
18.1%
WAGE / INCOME GAP [ % ]
81.9¢/ $1
WAGE / INCOME GAP [ $ ]
0.39
INEQUALITY / GINI INDEX
18,480
TOTAL POPULATION
9,110
MALE POPULATION
9,370
FEMALE POPULATION
97.23
MALES / 100 FEMALES
102.85
FEMALES / 100 MALES
35.1
MEDIAN AGE
3.2
AVG FAMILY SIZE
2.5
AVG HOUSEHOLD SIZE
11,161
LABOR FORCE [ PEOPLE ]
72.7%
PERCENT IN LABOR FORCE
4.1%
UNEMPLOYMENT RATE
Income in Laurel
Income Overview in Laurel
Per Capita Income in Laurel is $35,155, while median incomes of families and households are $91,148 and $67,988 respectively.
| Characteristic | Number | Measure |
| Per Capita Income | 18,480 | $35,155 |
| Median Family Income | 3,973 | $91,148 |
| Mean Family Income | 3,973 | $103,255 |
| Median Household Income | 7,158 | $67,988 |
| Mean Household Income | 7,158 | $85,192 |
| Income Deficit | 3,973 | $0 |
| Wage / Income Gap (%) | 18,480 | 18.15% |
| Wage / Income Gap ($) | 18,480 | 81.85¢ per $1 |
| Gini / Inequality Index | 18,480 | 0.39 |
Earnings by Sex in Laurel
Average Earnings in Laurel are $41,621, $45,421 for men and $37,179 for women, a difference of 18.1%.
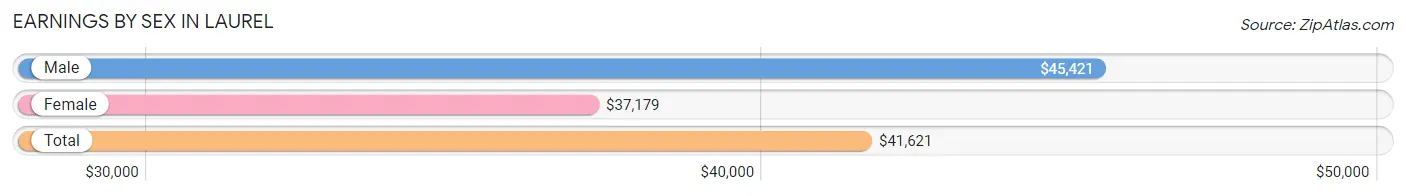
| Sex | Number | Average Earnings |
| Male | 5,878 (51.2%) | $45,421 |
| Female | 5,592 (48.7%) | $37,179 |
| Total | 11,470 (100.0%) | $41,621 |
Earnings by Sex by Income Bracket in Laurel
The most common earnings brackets in Laurel are $55,000 to $64,999 for men (664 | 11.3%) and $50,000 to $54,999 for women (538 | 9.6%).
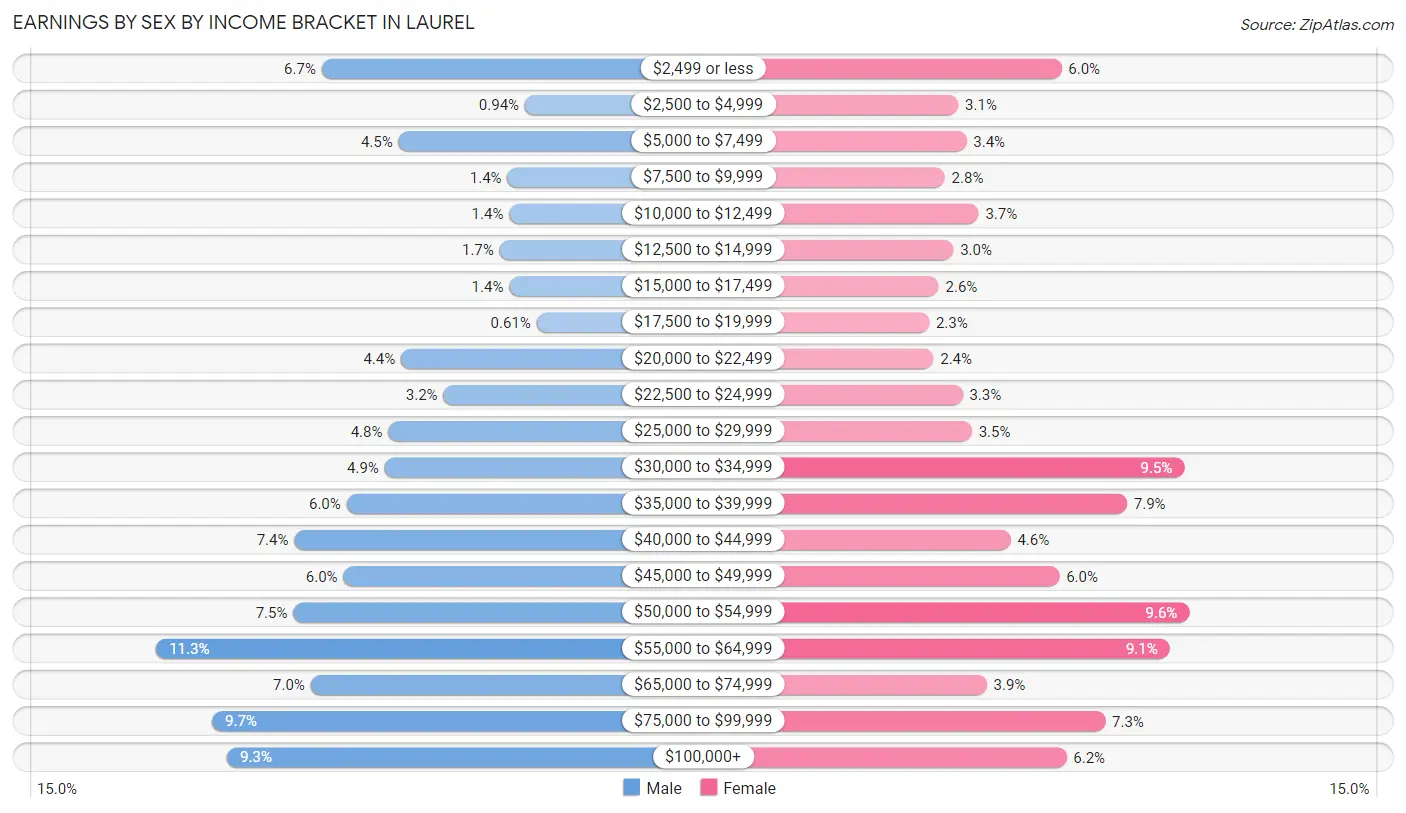
| Income | Male | Female |
| $2,499 or less | 391 (6.7%) | 337 (6.0%) |
| $2,500 to $4,999 | 55 (0.9%) | 175 (3.1%) |
| $5,000 to $7,499 | 264 (4.5%) | 188 (3.4%) |
| $7,500 to $9,999 | 84 (1.4%) | 154 (2.8%) |
| $10,000 to $12,499 | 81 (1.4%) | 207 (3.7%) |
| $12,500 to $14,999 | 97 (1.7%) | 167 (3.0%) |
| $15,000 to $17,499 | 81 (1.4%) | 144 (2.6%) |
| $17,500 to $19,999 | 36 (0.6%) | 129 (2.3%) |
| $20,000 to $22,499 | 260 (4.4%) | 136 (2.4%) |
| $22,500 to $24,999 | 190 (3.2%) | 182 (3.3%) |
| $25,000 to $29,999 | 281 (4.8%) | 196 (3.5%) |
| $30,000 to $34,999 | 287 (4.9%) | 530 (9.5%) |
| $35,000 to $39,999 | 350 (5.9%) | 440 (7.9%) |
| $40,000 to $44,999 | 436 (7.4%) | 257 (4.6%) |
| $45,000 to $49,999 | 355 (6.0%) | 334 (6.0%) |
| $50,000 to $54,999 | 438 (7.4%) | 538 (9.6%) |
| $55,000 to $64,999 | 664 (11.3%) | 507 (9.1%) |
| $65,000 to $74,999 | 409 (7.0%) | 220 (3.9%) |
| $75,000 to $99,999 | 572 (9.7%) | 406 (7.3%) |
| $100,000+ | 547 (9.3%) | 345 (6.2%) |
| Total | 5,878 (100.0%) | 5,592 (100.0%) |
Earnings by Sex by Educational Attainment in Laurel
Average earnings in Laurel are $49,418 for men and $41,788 for women, a difference of 15.4%. Men with an educational attainment of graduate degree enjoy the highest average annual earnings of $80,647, while those with less than high school education earn the least with $31,930. Women with an educational attainment of graduate degree earn the most with the average annual earnings of $64,412, while those with less than high school education have the smallest earnings of $22,167.
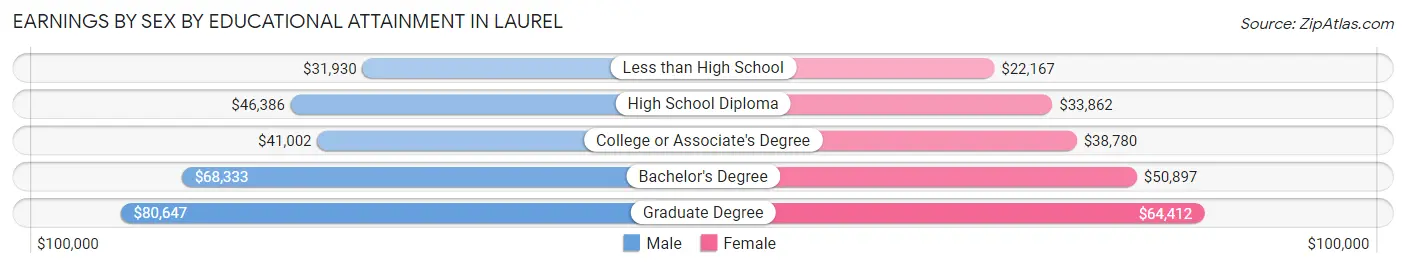
| Educational Attainment | Male Income | Female Income |
| Less than High School | $31,930 | $22,167 |
| High School Diploma | $46,386 | $33,862 |
| College or Associate's Degree | $41,002 | $38,780 |
| Bachelor's Degree | $68,333 | $50,897 |
| Graduate Degree | $80,647 | $64,412 |
| Total | $49,418 | $41,788 |
Family Income in Laurel
Family Income Brackets in Laurel
According to the Laurel family income data, there are 1,204 families falling into the $100,000 to $149,999 income range, which is the most common income bracket and makes up 30.3% of all families. Conversely, the $10,000 to $14,999 income bracket is the least frequent group with only 48 families (1.2%) belonging to this category.
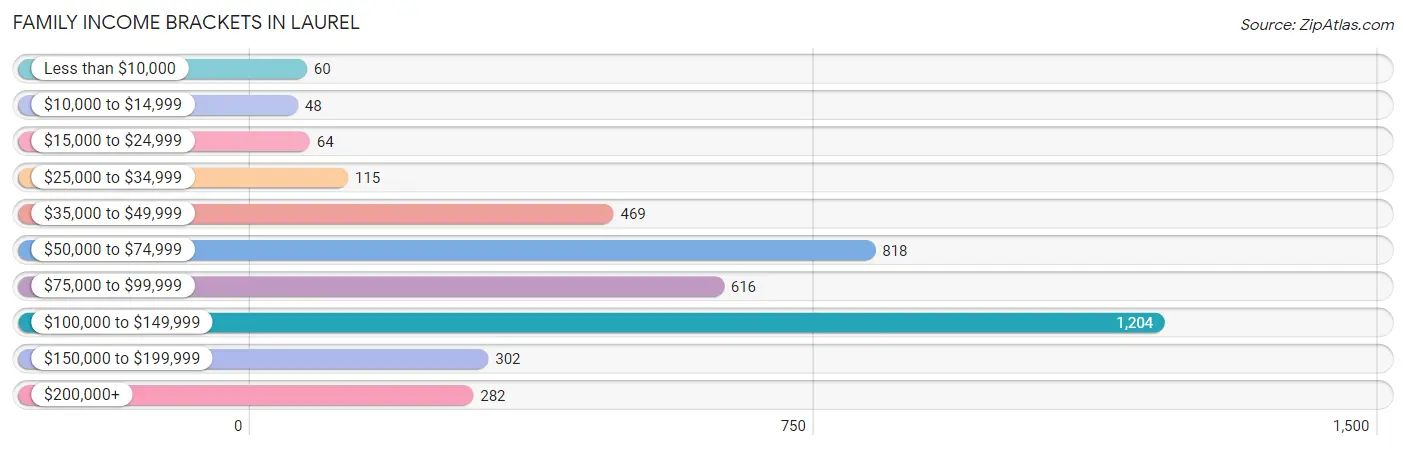
| Income Bracket | # Families | % Families |
| Less than $10,000 | 60 | 1.5% |
| $10,000 to $14,999 | 48 | 1.2% |
| $15,000 to $24,999 | 64 | 1.6% |
| $25,000 to $34,999 | 115 | 2.9% |
| $35,000 to $49,999 | 469 | 11.8% |
| $50,000 to $74,999 | 818 | 20.6% |
| $75,000 to $99,999 | 616 | 15.5% |
| $100,000 to $149,999 | 1,204 | 30.3% |
| $150,000 to $199,999 | 302 | 7.6% |
| $200,000+ | 282 | 7.1% |
Family Income by Famaliy Size in Laurel
7+ person families (55 | 1.4%) account for the highest median family income in Laurel with $196,250 per family, while 2-person families (1,892 | 47.6%) have the highest median income of $38,642 per family member.
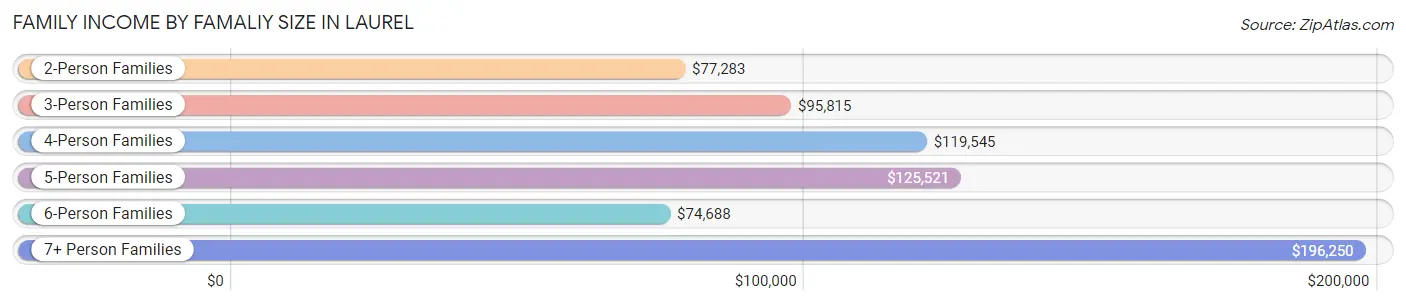
| Income Bracket | # Families | Median Income |
| 2-Person Families | 1,892 (47.6%) | $77,283 |
| 3-Person Families | 967 (24.3%) | $95,815 |
| 4-Person Families | 682 (17.2%) | $119,545 |
| 5-Person Families | 249 (6.3%) | $125,521 |
| 6-Person Families | 128 (3.2%) | $74,688 |
| 7+ Person Families | 55 (1.4%) | $196,250 |
| Total | 3,973 (100.0%) | $91,148 |
Family Income by Number of Earners in Laurel
The median family income in Laurel is $91,148, with families comprising 3+ earners (596) having the highest median family income of $127,941, while families with 1 earner (860) have the lowest median family income of $56,350, accounting for 15.0% and 21.6% of families, respectively.
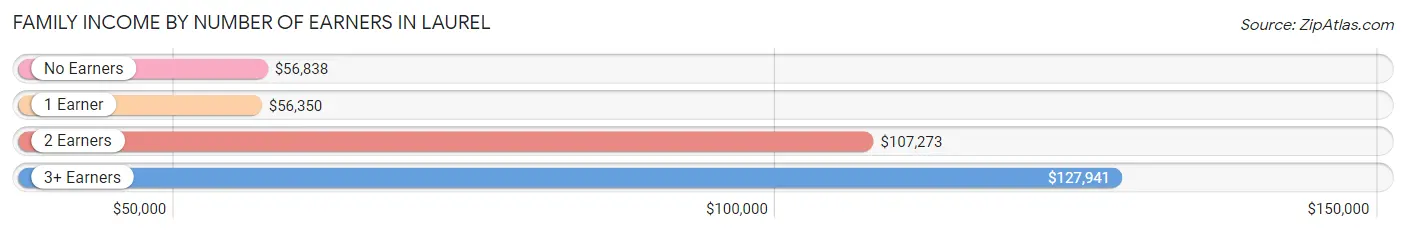
| Number of Earners | # Families | Median Income |
| No Earners | 321 (8.1%) | $56,838 |
| 1 Earner | 860 (21.6%) | $56,350 |
| 2 Earners | 2,196 (55.3%) | $107,273 |
| 3+ Earners | 596 (15.0%) | $127,941 |
| Total | 3,973 (100.0%) | $91,148 |
Household Income in Laurel
Household Income Brackets in Laurel
With 1,568 households falling in the category, the $100,000 to $149,999 income range is the most frequent in Laurel, accounting for 21.9% of all households. In contrast, only 143 households (2.0%) fall into the $10,000 to $14,999 income bracket, making it the least populous group.
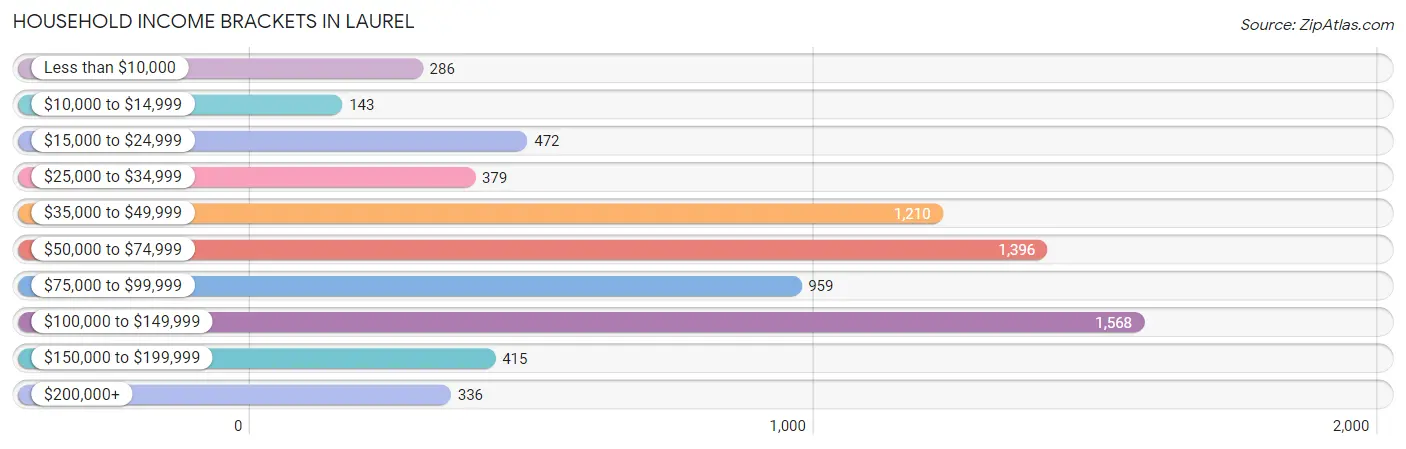
| Income Bracket | # Households | % Households |
| Less than $10,000 | 286 | 4.0% |
| $10,000 to $14,999 | 143 | 2.0% |
| $15,000 to $24,999 | 472 | 6.6% |
| $25,000 to $34,999 | 379 | 5.3% |
| $35,000 to $49,999 | 1,210 | 16.9% |
| $50,000 to $74,999 | 1,396 | 19.5% |
| $75,000 to $99,999 | 959 | 13.4% |
| $100,000 to $149,999 | 1,568 | 21.9% |
| $150,000 to $199,999 | 415 | 5.8% |
| $200,000+ | 336 | 4.7% |
Household Income by Householder Age in Laurel
The median household income in Laurel is $67,988, with the highest median household income of $82,500 found in the 45 to 64 years age bracket for the primary householder. A total of 2,556 households (35.7%) fall into this category. Meanwhile, the 15 to 24 years age bracket for the primary householder has the lowest median household income of $54,563, with 397 households (5.6%) in this group.
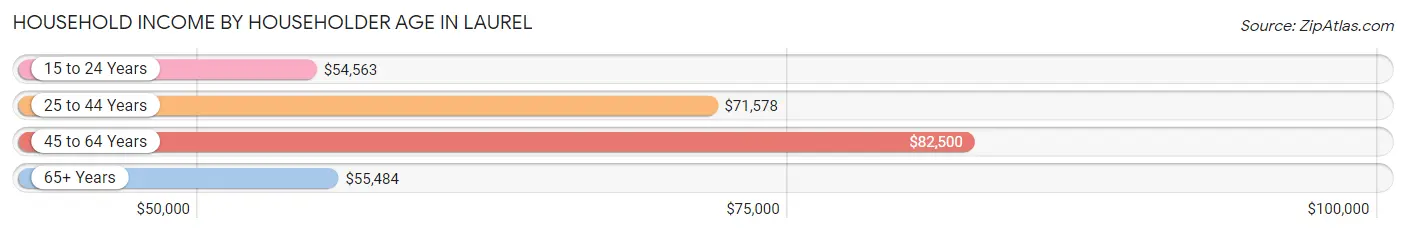
| Income Bracket | # Households | Median Income |
| 15 to 24 Years | 397 (5.6%) | $54,563 |
| 25 to 44 Years | 2,761 (38.6%) | $71,578 |
| 45 to 64 Years | 2,556 (35.7%) | $82,500 |
| 65+ Years | 1,444 (20.2%) | $55,484 |
| Total | 7,158 (100.0%) | $67,988 |
Poverty in Laurel
Income Below Poverty by Sex and Age in Laurel
With 10.9% poverty level for males and 6.2% for females among the residents of Laurel, 12 to 14 year old males and 6 to 11 year old females are the most vulnerable to poverty, with 69 males (22.2%) and 50 females (12.7%) in their respective age groups living below the poverty level.
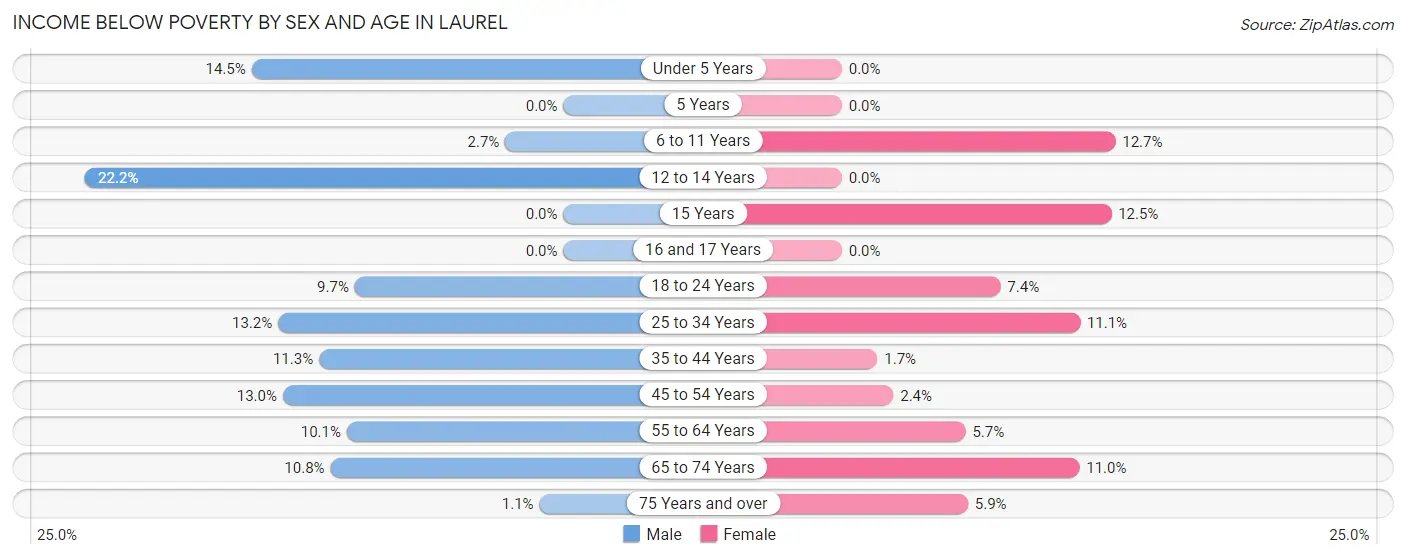
| Age Bracket | Male | Female |
| Under 5 Years | 79 (14.5%) | 0 (0.0%) |
| 5 Years | 0 (0.0%) | 0 (0.0%) |
| 6 to 11 Years | 12 (2.7%) | 50 (12.7%) |
| 12 to 14 Years | 69 (22.2%) | 0 (0.0%) |
| 15 Years | 0 (0.0%) | 23 (12.5%) |
| 16 and 17 Years | 0 (0.0%) | 0 (0.0%) |
| 18 to 24 Years | 84 (9.7%) | 57 (7.4%) |
| 25 to 34 Years | 252 (13.2%) | 192 (11.1%) |
| 35 to 44 Years | 125 (11.3%) | 18 (1.7%) |
| 45 to 54 Years | 137 (13.0%) | 25 (2.4%) |
| 55 to 64 Years | 112 (10.1%) | 68 (5.7%) |
| 65 to 74 Years | 51 (10.8%) | 85 (11.0%) |
| 75 Years and over | 3 (1.1%) | 39 (5.9%) |
| Total | 924 (10.9%) | 557 (6.2%) |
Income Above Poverty by Sex and Age in Laurel
According to the poverty statistics in Laurel, males aged 5 years and females aged under 5 years are the age groups that are most secure financially, with 100.0% of males and 100.0% of females in these age groups living above the poverty line.
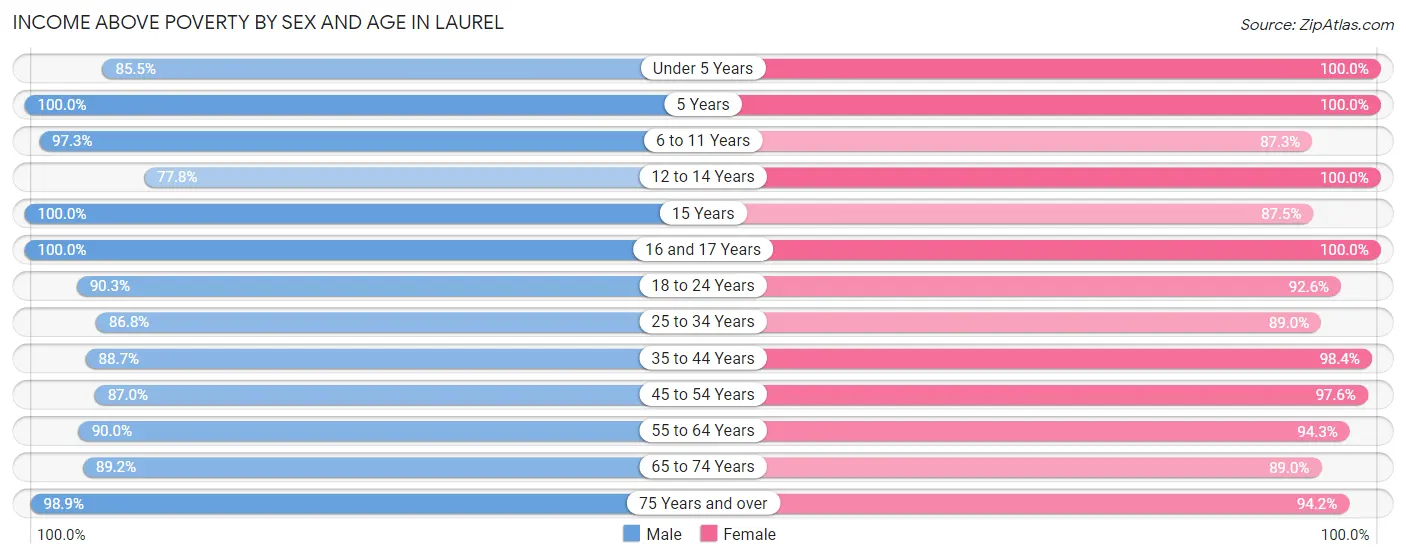
| Age Bracket | Male | Female |
| Under 5 Years | 467 (85.5%) | 612 (100.0%) |
| 5 Years | 94 (100.0%) | 50 (100.0%) |
| 6 to 11 Years | 433 (97.3%) | 344 (87.3%) |
| 12 to 14 Years | 242 (77.8%) | 335 (100.0%) |
| 15 Years | 68 (100.0%) | 161 (87.5%) |
| 16 and 17 Years | 249 (100.0%) | 182 (100.0%) |
| 18 to 24 Years | 784 (90.3%) | 717 (92.6%) |
| 25 to 34 Years | 1,652 (86.8%) | 1,545 (88.9%) |
| 35 to 44 Years | 977 (88.7%) | 1,075 (98.4%) |
| 45 to 54 Years | 915 (87.0%) | 1,019 (97.6%) |
| 55 to 64 Years | 1,002 (89.9%) | 1,117 (94.3%) |
| 65 to 74 Years | 421 (89.2%) | 686 (89.0%) |
| 75 Years and over | 268 (98.9%) | 628 (94.2%) |
| Total | 7,572 (89.1%) | 8,471 (93.8%) |
Income Below Poverty Among Married-Couple Families in Laurel
The poverty statistics for married-couple families in Laurel show that 0.2% or 4 of the total 2,496 families live below the poverty line. Families with no children have the highest poverty rate of 0.3%, comprising of 4 families. On the other hand, families with 1 or 2 children have the lowest poverty rate of 0.0%, which includes 0 families.
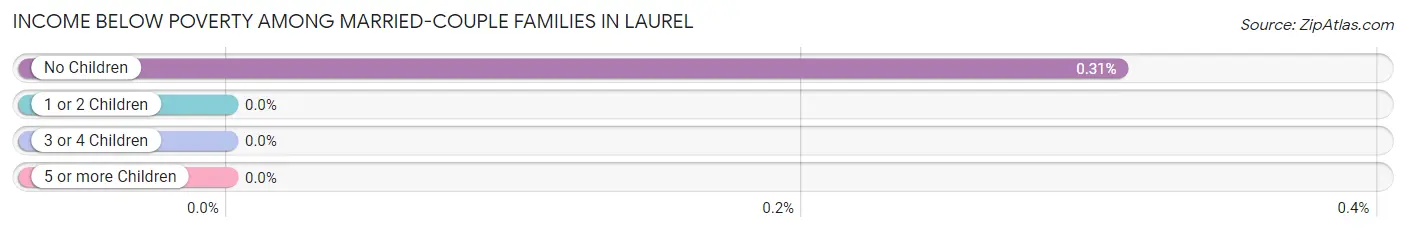
| Children | Above Poverty | Below Poverty |
| No Children | 1,290 (99.7%) | 4 (0.3%) |
| 1 or 2 Children | 1,075 (100.0%) | 0 (0.0%) |
| 3 or 4 Children | 112 (100.0%) | 0 (0.0%) |
| 5 or more Children | 15 (100.0%) | 0 (0.0%) |
| Total | 2,492 (99.8%) | 4 (0.2%) |
Income Below Poverty Among Single-Parent Households in Laurel
According to the poverty data in Laurel, 13.9% or 40 single-father households and 8.5% or 101 single-mother households are living below the poverty line. Among single-father households, those with 3 or 4 children have the highest poverty rate, with 12 households (60.0%) experiencing poverty. Likewise, among single-mother households, those with 3 or 4 children have the highest poverty rate, with 35 households (50.7%) falling below the poverty line.
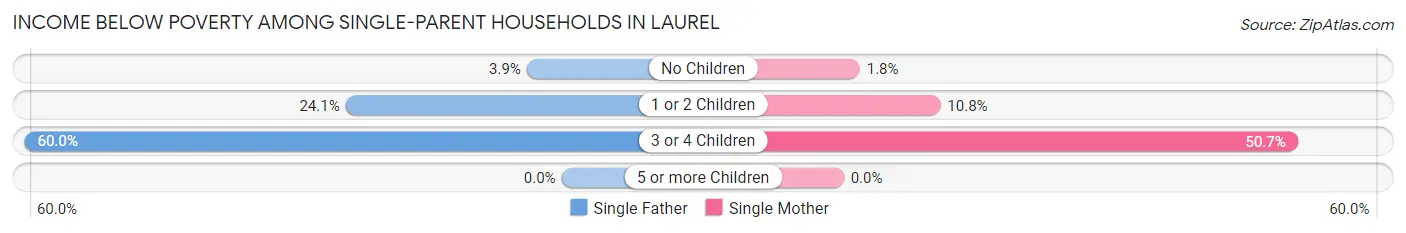
| Children | Single Father | Single Mother |
| No Children | 7 (3.9%) | 11 (1.8%) |
| 1 or 2 Children | 21 (24.1%) | 55 (10.8%) |
| 3 or 4 Children | 12 (60.0%) | 35 (50.7%) |
| 5 or more Children | 0 (0.0%) | 0 (0.0%) |
| Total | 40 (13.9%) | 101 (8.5%) |
Income Below Poverty Among Married-Couple vs Single-Parent Households in Laurel
The poverty data for Laurel shows that 4 of the married-couple family households (0.2%) and 141 of the single-parent households (9.6%) are living below the poverty level. Within the married-couple family households, those with no children have the highest poverty rate, with 4 households (0.3%) falling below the poverty line. Among the single-parent households, those with 3 or 4 children have the highest poverty rate, with 47 household (52.8%) living below poverty.
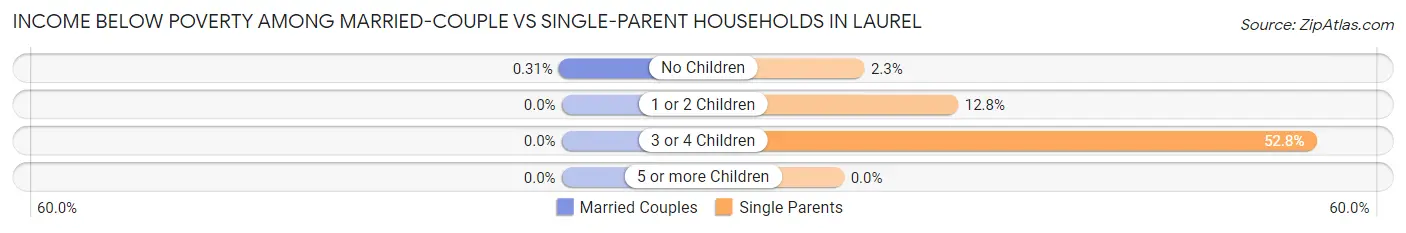
| Children | Married-Couple Families | Single-Parent Households |
| No Children | 4 (0.3%) | 18 (2.3%) |
| 1 or 2 Children | 0 (0.0%) | 76 (12.8%) |
| 3 or 4 Children | 0 (0.0%) | 47 (52.8%) |
| 5 or more Children | 0 (0.0%) | 0 (0.0%) |
| Total | 4 (0.2%) | 141 (9.6%) |
Race in Laurel
The most populous races in Laurel are White / Caucasian (8,588 | 46.5%), Black / African American (5,747 | 31.1%), and Hispanic or Latino (2,126 | 11.5%).
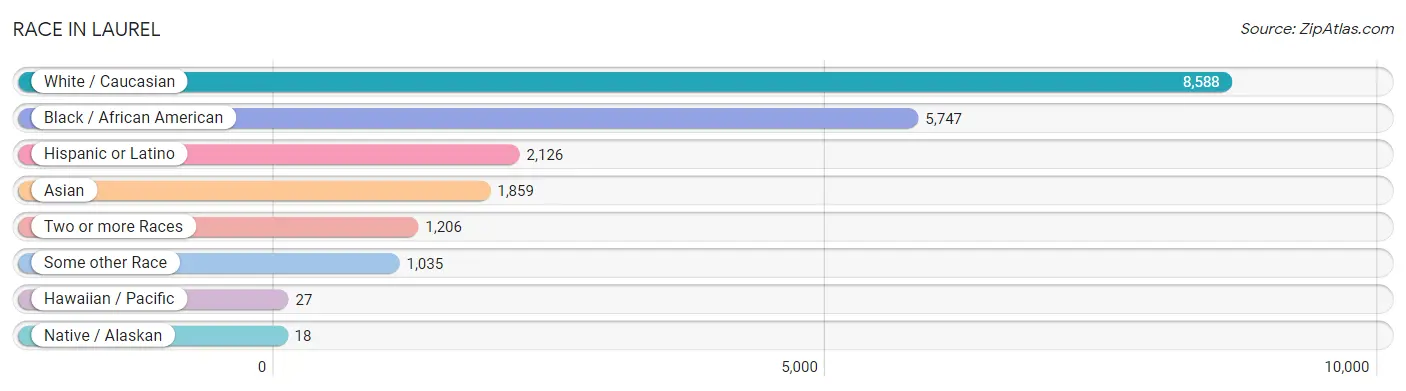
| Race | # Population | % Population |
| Asian | 1,859 | 10.1% |
| Black / African American | 5,747 | 31.1% |
| Hawaiian / Pacific | 27 | 0.2% |
| Hispanic or Latino | 2,126 | 11.5% |
| Native / Alaskan | 18 | 0.1% |
| White / Caucasian | 8,588 | 46.5% |
| Two or more Races | 1,206 | 6.5% |
| Some other Race | 1,035 | 5.6% |
| Total | 18,480 | 100.0% |
Ancestry in Laurel
The most populous ancestries reported in Laurel are English (1,441 | 7.8%), German (1,162 | 6.3%), Irish (883 | 4.8%), American (841 | 4.5%), and Mexican (614 | 3.3%), together accounting for 26.7% of all Laurel residents.
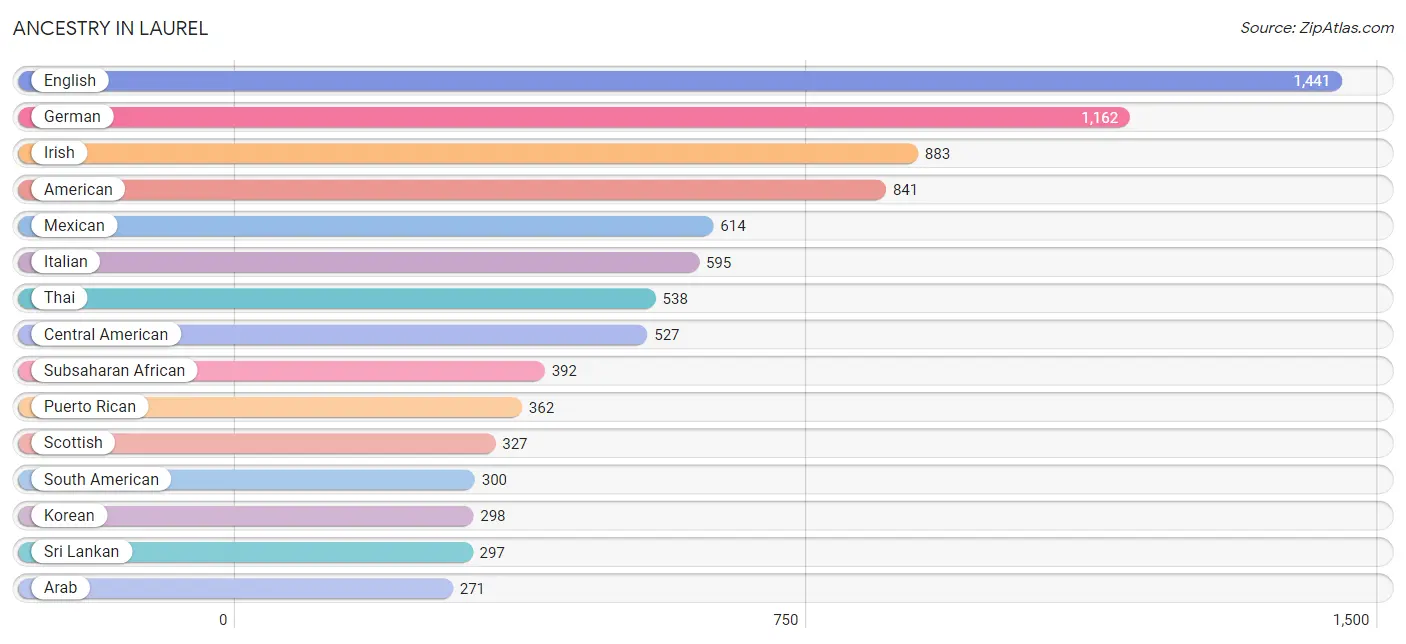
| Ancestry | # Population | % Population |
| Afghan | 101 | 0.5% |
| African | 236 | 1.3% |
| American | 841 | 4.5% |
| Arab | 271 | 1.5% |
| Bahamian | 48 | 0.3% |
| Bhutanese | 16 | 0.1% |
| Brazilian | 8 | 0.0% |
| British | 147 | 0.8% |
| Bulgarian | 19 | 0.1% |
| Burmese | 18 | 0.1% |
| Canadian | 26 | 0.1% |
| Central American | 527 | 2.9% |
| Central American Indian | 5 | 0.0% |
| Cherokee | 28 | 0.2% |
| Cheyenne | 6 | 0.0% |
| Colombian | 51 | 0.3% |
| Cuban | 189 | 1.0% |
| Czech | 25 | 0.1% |
| Danish | 29 | 0.2% |
| Dominican | 114 | 0.6% |
| Dutch | 67 | 0.4% |
| Eastern European | 56 | 0.3% |
| Ecuadorian | 5 | 0.0% |
| Egyptian | 45 | 0.2% |
| English | 1,441 | 7.8% |
| Ethiopian | 22 | 0.1% |
| European | 213 | 1.1% |
| Filipino | 11 | 0.1% |
| French | 258 | 1.4% |
| French Canadian | 38 | 0.2% |
| German | 1,162 | 6.3% |
| Greek | 135 | 0.7% |
| Guatemalan | 225 | 1.2% |
| Guyanese | 8 | 0.0% |
| Haitian | 65 | 0.4% |
| Honduran | 103 | 0.6% |
| Hungarian | 12 | 0.1% |
| Indian (Asian) | 33 | 0.2% |
| Iraqi | 10 | 0.1% |
| Irish | 883 | 4.8% |
| Italian | 595 | 3.2% |
| Jamaican | 44 | 0.2% |
| Japanese | 84 | 0.4% |
| Jordanian | 8 | 0.0% |
| Kenyan | 18 | 0.1% |
| Korean | 298 | 1.6% |
| Lebanese | 70 | 0.4% |
| Mexican | 614 | 3.3% |
| Mexican American Indian | 35 | 0.2% |
| Native Hawaiian | 27 | 0.2% |
| Nigerian | 14 | 0.1% |
| Northern European | 3 | 0.0% |
| Pakistani | 5 | 0.0% |
| Palestinian | 5 | 0.0% |
| Polish | 175 | 0.9% |
| Portuguese | 14 | 0.1% |
| Puerto Rican | 362 | 2.0% |
| Russian | 32 | 0.2% |
| Salvadoran | 199 | 1.1% |
| Scotch-Irish | 192 | 1.0% |
| Scottish | 327 | 1.8% |
| Sierra Leonean | 21 | 0.1% |
| South American | 300 | 1.6% |
| Spaniard | 10 | 0.1% |
| Spanish | 9 | 0.1% |
| Sri Lankan | 297 | 1.6% |
| Subsaharan African | 392 | 2.1% |
| Swedish | 57 | 0.3% |
| Swiss | 3 | 0.0% |
| Thai | 538 | 2.9% |
| Ukrainian | 6 | 0.0% |
| Venezuelan | 244 | 1.3% |
| Vietnamese | 36 | 0.2% |
| Welsh | 110 | 0.6% |
| Yugoslavian | 47 | 0.3% | View All 75 Rows |
Immigrants in Laurel
The most numerous immigrant groups reported in Laurel came from Asia (1,589 | 8.6%), Latin America (1,230 | 6.7%), South Central Asia (977 | 5.3%), Central America (614 | 3.3%), and South Eastern Asia (422 | 2.3%), together accounting for 26.2% of all Laurel residents.
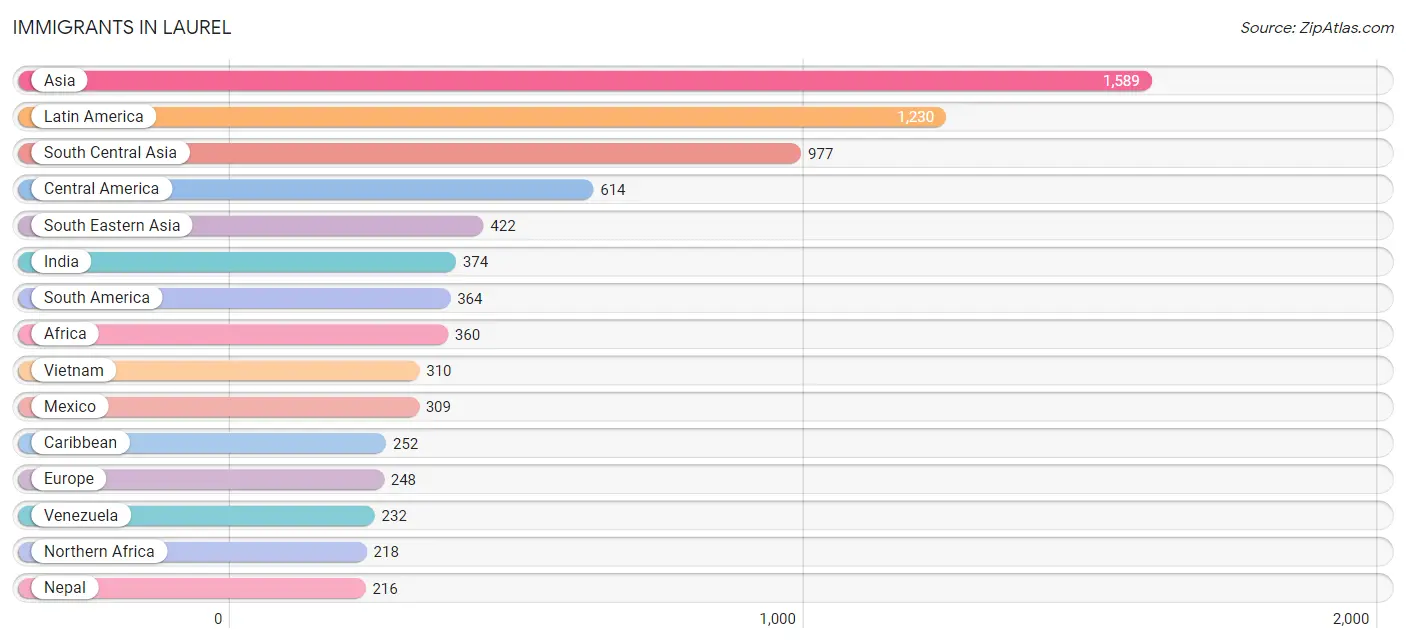
| Immigration Origin | # Population | % Population |
| Afghanistan | 136 | 0.7% |
| Africa | 360 | 1.9% |
| Asia | 1,589 | 8.6% |
| Bangladesh | 49 | 0.3% |
| Bosnia and Herzegovina | 47 | 0.3% |
| Brazil | 48 | 0.3% |
| Bulgaria | 19 | 0.1% |
| Cambodia | 56 | 0.3% |
| Cameroon | 16 | 0.1% |
| Canada | 21 | 0.1% |
| Caribbean | 252 | 1.4% |
| Central America | 614 | 3.3% |
| China | 22 | 0.1% |
| Colombia | 44 | 0.2% |
| Cuba | 137 | 0.7% |
| Dominican Republic | 79 | 0.4% |
| Eastern Africa | 40 | 0.2% |
| Eastern Asia | 37 | 0.2% |
| Eastern Europe | 82 | 0.4% |
| Ecuador | 5 | 0.0% |
| Egypt | 82 | 0.4% |
| El Salvador | 119 | 0.6% |
| England | 142 | 0.8% |
| Ethiopia | 22 | 0.1% |
| Europe | 248 | 1.3% |
| Germany | 24 | 0.1% |
| Ghana | 55 | 0.3% |
| Guatemala | 185 | 1.0% |
| Guyana | 35 | 0.2% |
| Haiti | 25 | 0.1% |
| Honduras | 1 | 0.0% |
| India | 374 | 2.0% |
| Iraq | 113 | 0.6% |
| Jamaica | 11 | 0.1% |
| Jordan | 17 | 0.1% |
| Kenya | 18 | 0.1% |
| Korea | 15 | 0.1% |
| Kuwait | 10 | 0.1% |
| Latin America | 1,230 | 6.7% |
| Lebanon | 8 | 0.0% |
| Mexico | 309 | 1.7% |
| Middle Africa | 16 | 0.1% |
| Morocco | 10 | 0.1% |
| Nepal | 216 | 1.2% |
| Northern Africa | 218 | 1.2% |
| Northern Europe | 142 | 0.8% |
| Pakistan | 4 | 0.0% |
| Philippines | 23 | 0.1% |
| Russia | 8 | 0.0% |
| Sierra Leone | 21 | 0.1% |
| South America | 364 | 2.0% |
| South Central Asia | 977 | 5.3% |
| South Eastern Asia | 422 | 2.3% |
| Sudan | 126 | 0.7% |
| Thailand | 5 | 0.0% |
| Ukraine | 8 | 0.0% |
| Venezuela | 232 | 1.3% |
| Vietnam | 310 | 1.7% |
| Western Africa | 86 | 0.5% |
| Western Asia | 148 | 0.8% |
| Western Europe | 24 | 0.1% | View All 61 Rows |
Sex and Age in Laurel
Sex and Age in Laurel
The most populous age groups in Laurel are 25 to 29 Years (1,060 | 11.6%) for men and 25 to 29 Years (928 | 9.9%) for women.
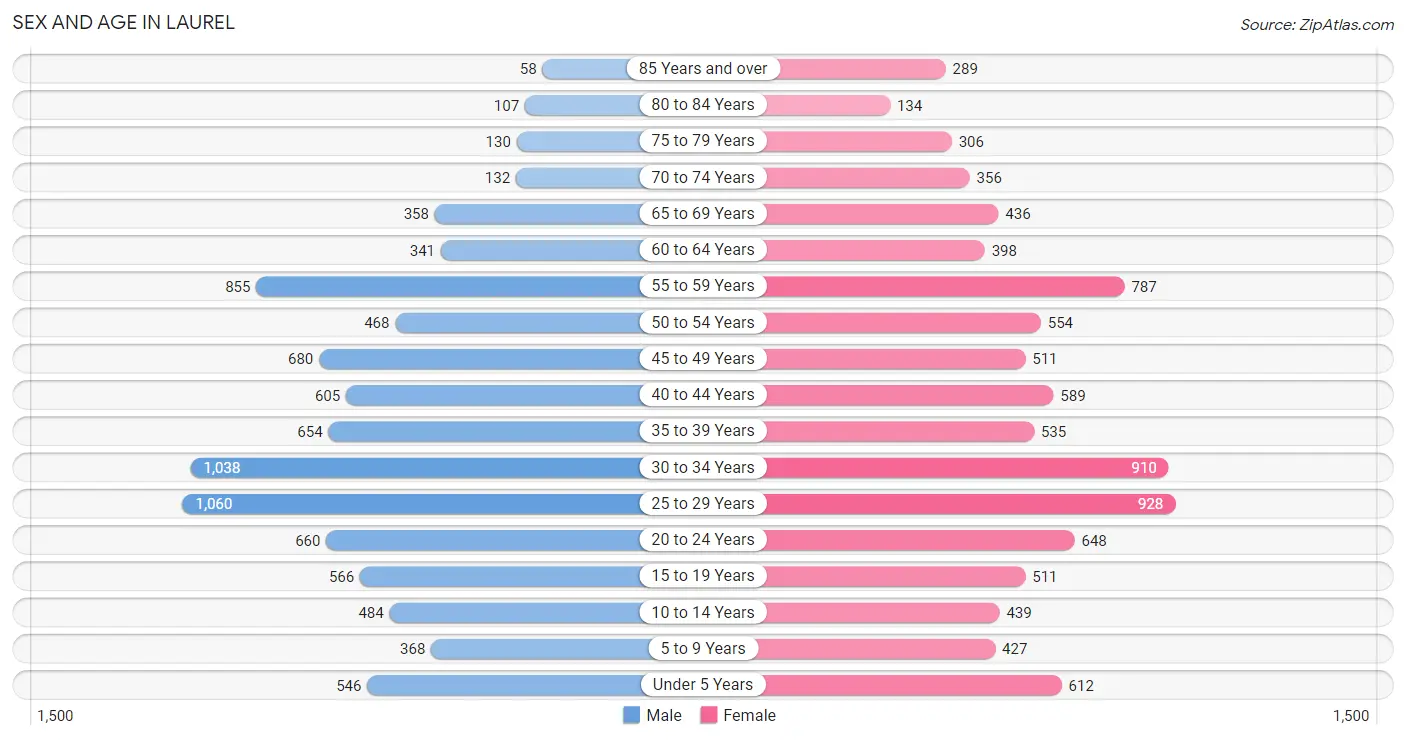
| Age Bracket | Male | Female |
| Under 5 Years | 546 (6.0%) | 612 (6.5%) |
| 5 to 9 Years | 368 (4.0%) | 427 (4.6%) |
| 10 to 14 Years | 484 (5.3%) | 439 (4.7%) |
| 15 to 19 Years | 566 (6.2%) | 511 (5.4%) |
| 20 to 24 Years | 660 (7.2%) | 648 (6.9%) |
| 25 to 29 Years | 1,060 (11.6%) | 928 (9.9%) |
| 30 to 34 Years | 1,038 (11.4%) | 910 (9.7%) |
| 35 to 39 Years | 654 (7.2%) | 535 (5.7%) |
| 40 to 44 Years | 605 (6.6%) | 589 (6.3%) |
| 45 to 49 Years | 680 (7.5%) | 511 (5.4%) |
| 50 to 54 Years | 468 (5.1%) | 554 (5.9%) |
| 55 to 59 Years | 855 (9.4%) | 787 (8.4%) |
| 60 to 64 Years | 341 (3.7%) | 398 (4.3%) |
| 65 to 69 Years | 358 (3.9%) | 436 (4.6%) |
| 70 to 74 Years | 132 (1.5%) | 356 (3.8%) |
| 75 to 79 Years | 130 (1.4%) | 306 (3.3%) |
| 80 to 84 Years | 107 (1.2%) | 134 (1.4%) |
| 85 Years and over | 58 (0.6%) | 289 (3.1%) |
| Total | 9,110 (100.0%) | 9,370 (100.0%) |
Families and Households in Laurel
Median Family Size in Laurel
The median family size in Laurel is 3.25 persons per family, with single female/mother families (1,190 | 29.9%) accounting for the largest median family size of 3.37 persons per family. On the other hand, single male/father families (287 | 7.2%) represent the smallest median family size with 2.41 persons per family.
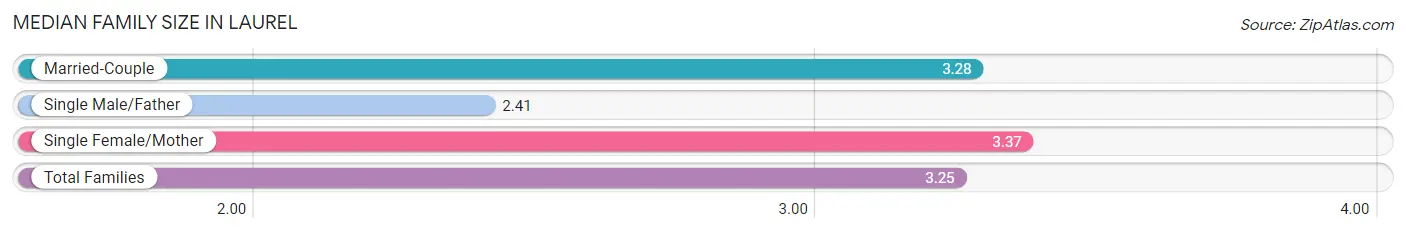
| Family Type | # Families | Family Size |
| Married-Couple | 2,496 (62.8%) | 3.28 |
| Single Male/Father | 287 (7.2%) | 2.41 |
| Single Female/Mother | 1,190 (29.9%) | 3.37 |
| Total Families | 3,973 (100.0%) | 3.25 |
Median Household Size in Laurel
The median household size in Laurel is 2.45 persons per household, with single female/mother households (1,190 | 16.6%) accounting for the largest median household size of 3.59 persons per household. non-family households (3,185 | 44.5%) represent the smallest median household size with 1.30 persons per household.
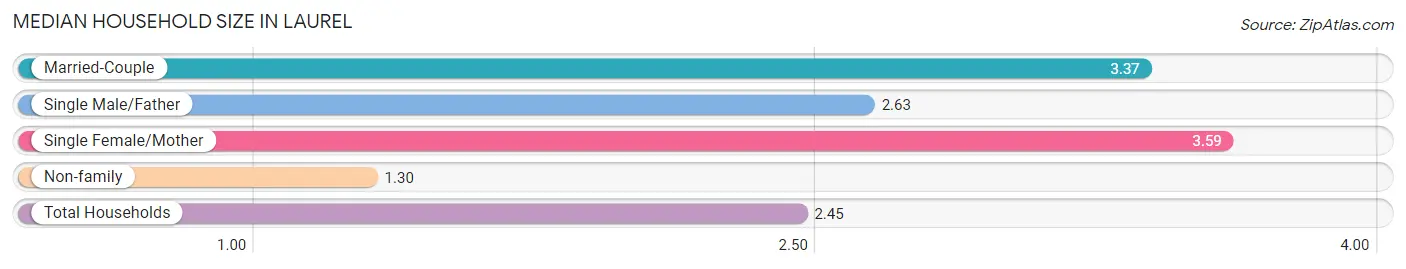
| Household Type | # Households | Household Size |
| Married-Couple | 2,496 (34.9%) | 3.37 |
| Single Male/Father | 287 (4.0%) | 2.63 |
| Single Female/Mother | 1,190 (16.6%) | 3.59 |
| Non-family | 3,185 (44.5%) | 1.30 |
| Total Households | 7,158 (100.0%) | 2.45 |
Household Size by Marriage Status in Laurel
Out of a total of 7,158 households in Laurel, 3,973 (55.5%) are family households, while 3,185 (44.5%) are nonfamily households. The most numerous type of family households are 2-person households, comprising 1,812, and the most common type of nonfamily households are 1-person households, comprising 2,502.
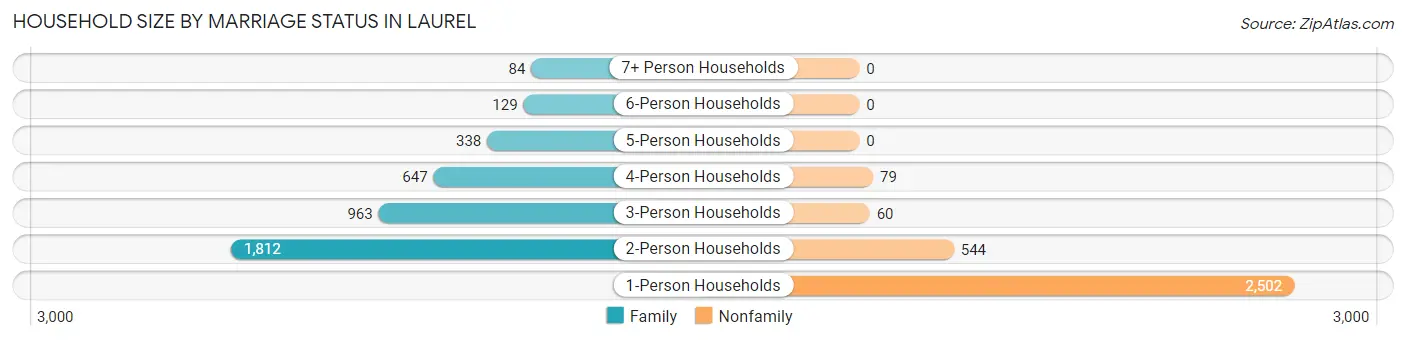
| Household Size | Family Households | Nonfamily Households |
| 1-Person Households | - | 2,502 (34.9%) |
| 2-Person Households | 1,812 (25.3%) | 544 (7.6%) |
| 3-Person Households | 963 (13.5%) | 60 (0.8%) |
| 4-Person Households | 647 (9.0%) | 79 (1.1%) |
| 5-Person Households | 338 (4.7%) | 0 (0.0%) |
| 6-Person Households | 129 (1.8%) | 0 (0.0%) |
| 7+ Person Households | 84 (1.2%) | 0 (0.0%) |
| Total | 3,973 (55.5%) | 3,185 (44.5%) |
Female Fertility in Laurel
Fertility by Age in Laurel
Average fertility rate in Laurel is 50.0 births per 1,000 women. Women in the age bracket of 20 to 34 years have the highest fertility rate with 87.0 births per 1,000 women. Women in the age bracket of 20 to 34 years acount for 89.7% of all women with births.
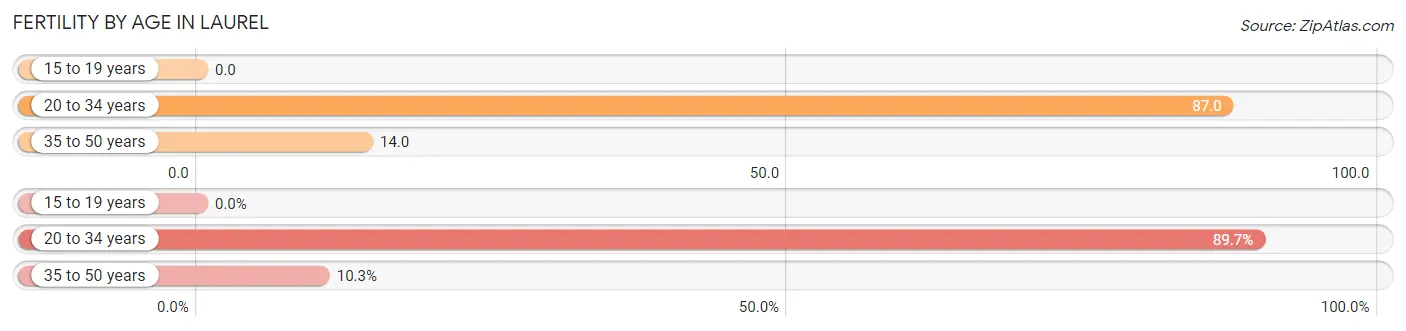
| Age Bracket | Women with Births | Births / 1,000 Women |
| 15 to 19 years | 0 (0.0%) | 0.0 |
| 20 to 34 years | 217 (89.7%) | 87.0 |
| 35 to 50 years | 25 (10.3%) | 14.0 |
| Total | 242 (100.0%) | 50.0 |
Fertility by Age by Marriage Status in Laurel
53.7% of women with births (242) in Laurel are married. The highest percentage of unmarried women with births falls into 35 to 50 years age bracket with 100.0% of them unmarried at the time of birth, while the lowest percentage of unmarried women with births belong to 20 to 34 years age bracket with 40.1% of them unmarried.
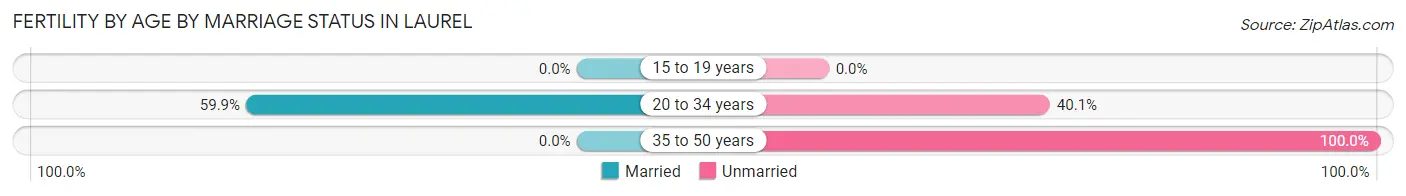
| Age Bracket | Married | Unmarried |
| 15 to 19 years | 0 (0.0%) | 0 (0.0%) |
| 20 to 34 years | 130 (59.9%) | 87 (40.1%) |
| 35 to 50 years | 0 (0.0%) | 25 (100.0%) |
| Total | 130 (53.7%) | 112 (46.3%) |
Fertility by Education in Laurel
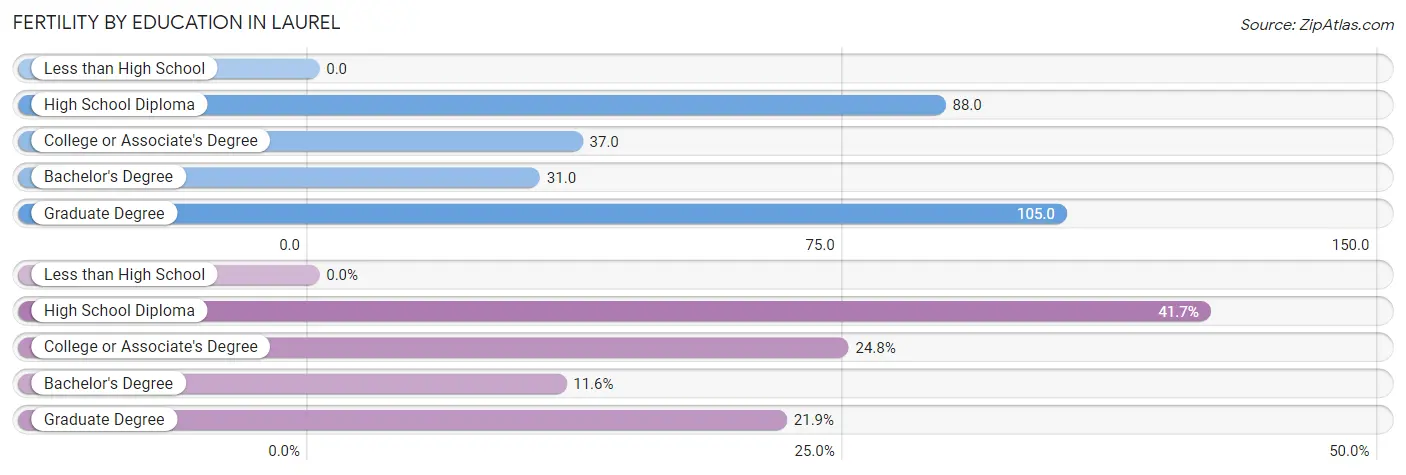
| Educational Attainment | Women with Births | Births / 1,000 Women |
| Less than High School | 0 (0.0%) | 0.0 |
| High School Diploma | 101 (41.7%) | 88.0 |
| College or Associate's Degree | 60 (24.8%) | 37.0 |
| Bachelor's Degree | 28 (11.6%) | 31.0 |
| Graduate Degree | 53 (21.9%) | 105.0 |
| Total | 242 (100.0%) | 50.0 |
Fertility by Education by Marriage Status in Laurel
46.3% of women with births in Laurel are unmarried. Women with the educational attainment of bachelor's degree are most likely to be married with 100.0% of them married at childbirth, while women with the educational attainment of high school diploma are least likely to be married with 86.1% of them unmarried at childbirth.
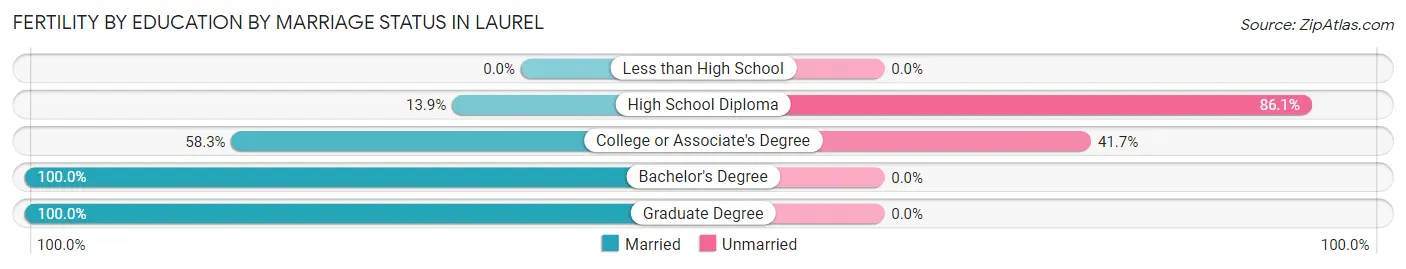
| Educational Attainment | Married | Unmarried |
| Less than High School | 0 (0.0%) | 0 (0.0%) |
| High School Diploma | 14 (13.9%) | 87 (86.1%) |
| College or Associate's Degree | 35 (58.3%) | 25 (41.7%) |
| Bachelor's Degree | 28 (100.0%) | 0 (0.0%) |
| Graduate Degree | 53 (100.0%) | 0 (0.0%) |
| Total | 130 (53.7%) | 112 (46.3%) |
Employment Characteristics in Laurel
Employment by Class of Employer in Laurel
Among the 10,513 employed individuals in Laurel, private company employees (7,637 | 72.6%), local government employees (734 | 7.0%), and not-for-profit organizations (605 | 5.8%) make up the most common classes of employment.
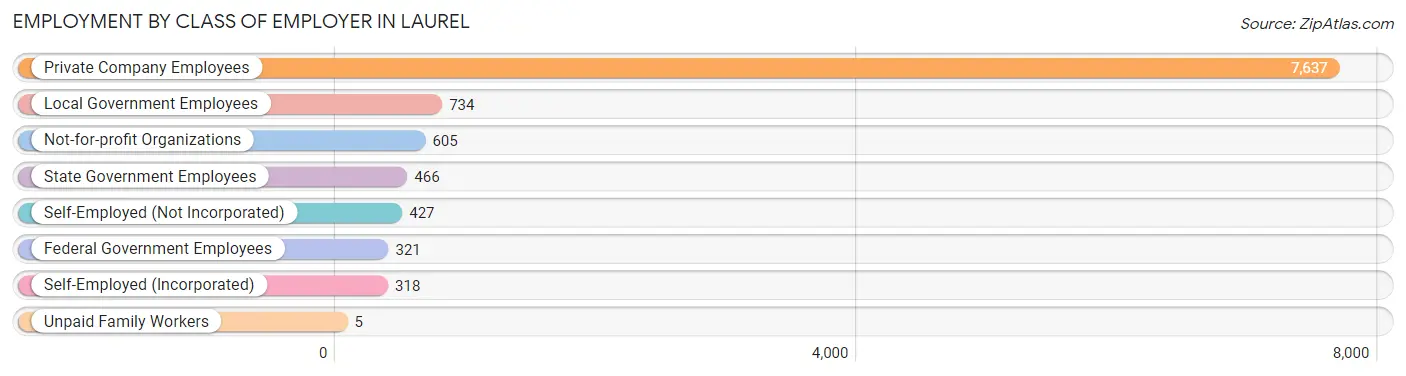
| Employer Class | # Employees | % Employees |
| Private Company Employees | 7,637 | 72.6% |
| Self-Employed (Incorporated) | 318 | 3.0% |
| Self-Employed (Not Incorporated) | 427 | 4.1% |
| Not-for-profit Organizations | 605 | 5.8% |
| Local Government Employees | 734 | 7.0% |
| State Government Employees | 466 | 4.4% |
| Federal Government Employees | 321 | 3.0% |
| Unpaid Family Workers | 5 | 0.1% |
| Total | 10,513 | 100.0% |
Employment Status by Age in Laurel
According to the labor force statistics for Laurel, out of the total population over 16 years of age (15,352), 72.7% or 11,161 individuals are in the labor force, with 4.1% or 458 of them unemployed. The age group with the highest labor force participation rate is 55 to 59 years, with 89.9% or 1,476 individuals in the labor force. Within the labor force, the 16 to 19 years age range has the highest percentage of unemployed individuals, with 12.6% or 43 of them being unemployed.
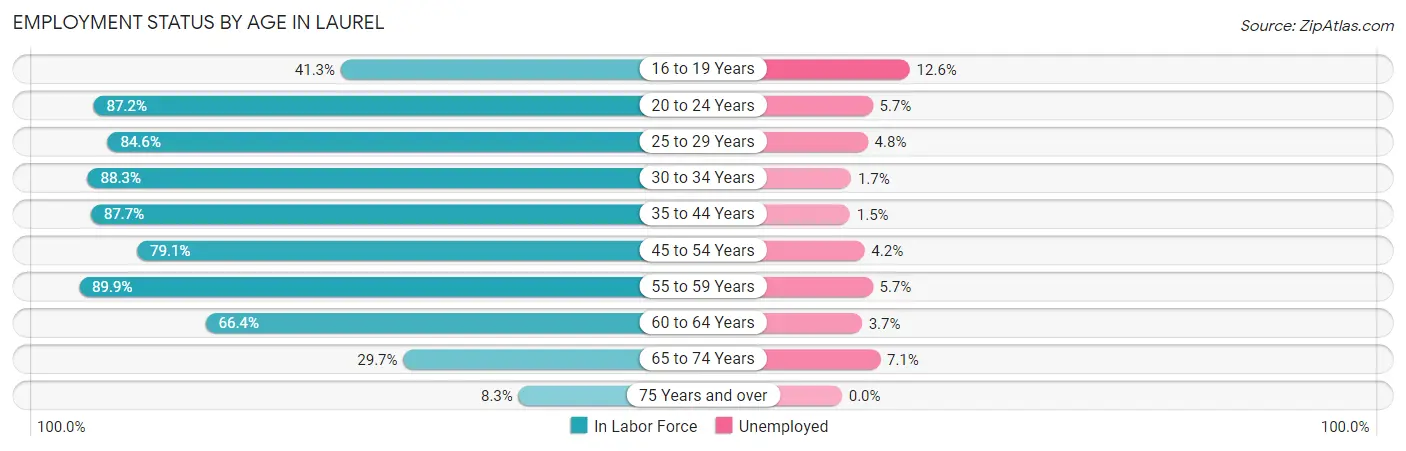
| Age Bracket | In Labor Force | Unemployed |
| 16 to 19 Years | 341 (41.3%) | 43 (12.6%) |
| 20 to 24 Years | 1,141 (87.2%) | 65 (5.7%) |
| 25 to 29 Years | 1,682 (84.6%) | 81 (4.8%) |
| 30 to 34 Years | 1,720 (88.3%) | 29 (1.7%) |
| 35 to 44 Years | 2,090 (87.7%) | 31 (1.5%) |
| 45 to 54 Years | 1,750 (79.1%) | 74 (4.2%) |
| 55 to 59 Years | 1,476 (89.9%) | 84 (5.7%) |
| 60 to 64 Years | 491 (66.4%) | 18 (3.7%) |
| 65 to 74 Years | 381 (29.7%) | 27 (7.1%) |
| 75 Years and over | 85 (8.3%) | 0 (0.0%) |
| Total | 11,161 (72.7%) | 458 (4.1%) |
Employment Status by Educational Attainment in Laurel
According to labor force statistics for Laurel, 84.4% of individuals (9,211) out of the total population between 25 and 64 years of age (10,913) are in the labor force, with 3.4% or 313 of them being unemployed. The group with the highest labor force participation rate are those with the educational attainment of bachelor's degree or higher, with 96.2% or 3,163 individuals in the labor force. Within the labor force, individuals with high school diploma education have the highest percentage of unemployment, with 6.1% or 135 of them being unemployed.
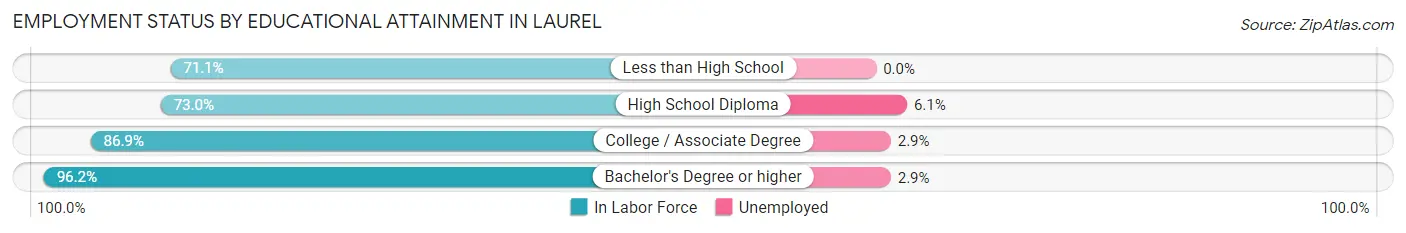
| Educational Attainment | In Labor Force | Unemployed |
| Less than High School | 715 (71.1%) | 0 (0.0%) |
| High School Diploma | 2,215 (73.0%) | 185 (6.1%) |
| College / Associate Degree | 3,116 (86.9%) | 104 (2.9%) |
| Bachelor's Degree or higher | 3,163 (96.2%) | 95 (2.9%) |
| Total | 9,211 (84.4%) | 371 (3.4%) |
Employment Occupations by Sex in Laurel
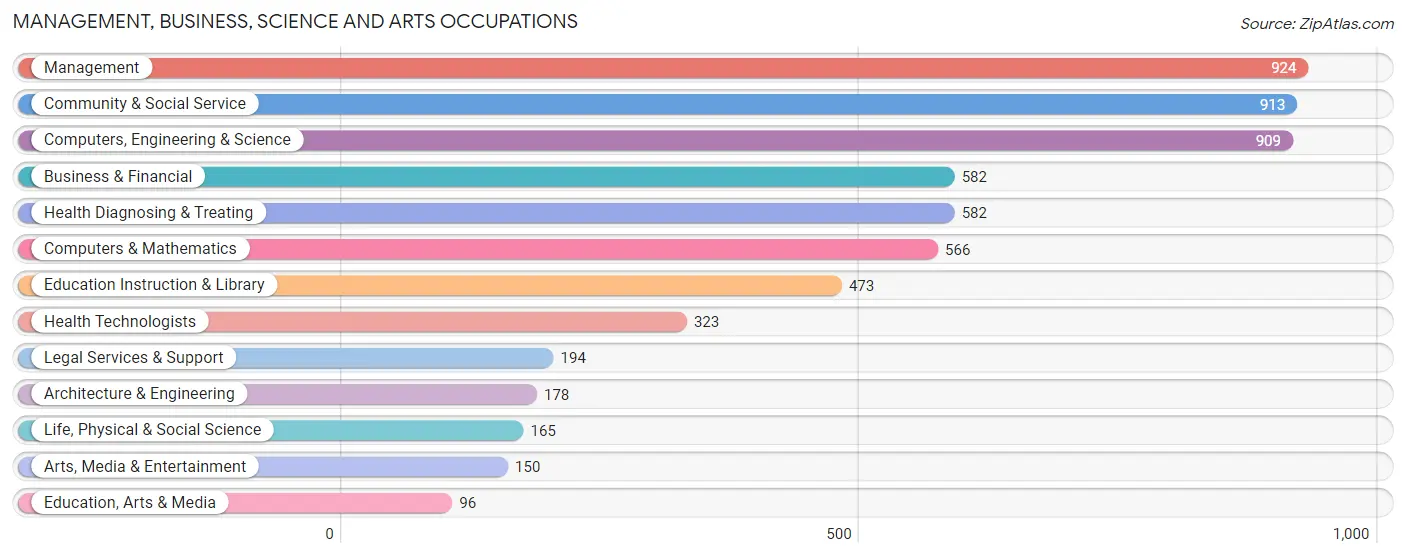
Management, Business, Science and Arts Occupations
The most common Management, Business, Science and Arts occupations in Laurel are Management (924 | 8.6%), Community & Social Service (913 | 8.5%), Computers, Engineering & Science (909 | 8.5%), Business & Financial (582 | 5.4%), and Health Diagnosing & Treating (582 | 5.4%).
Management, Business, Science and Arts Occupations by Sex
Within the Management, Business, Science and Arts occupations in Laurel, the most male-oriented occupations are Computers & Mathematics (87.8%), Computers, Engineering & Science (87.2%), and Life, Physical & Social Science (86.7%), while the most female-oriented occupations are Education, Arts & Media (78.1%), Health Technologists (75.8%), and Health Diagnosing & Treating (74.4%).
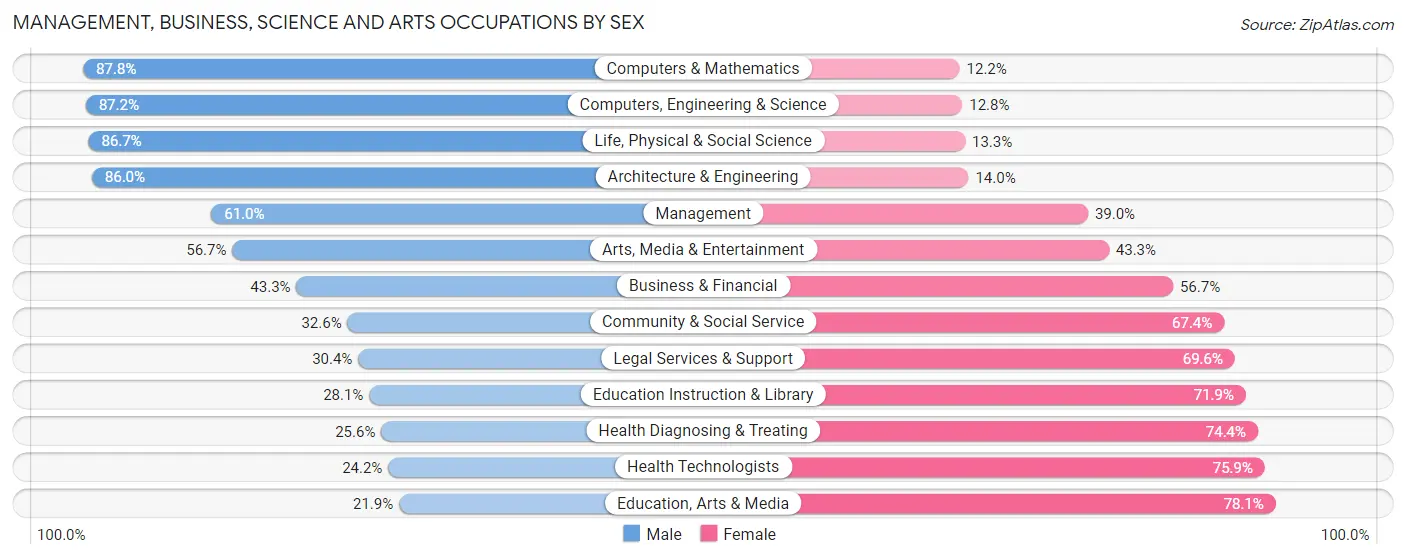
| Occupation | Male | Female |
| Management | 564 (61.0%) | 360 (39.0%) |
| Business & Financial | 252 (43.3%) | 330 (56.7%) |
| Computers, Engineering & Science | 793 (87.2%) | 116 (12.8%) |
| Computers & Mathematics | 497 (87.8%) | 69 (12.2%) |
| Architecture & Engineering | 153 (86.0%) | 25 (14.0%) |
| Life, Physical & Social Science | 143 (86.7%) | 22 (13.3%) |
| Community & Social Service | 298 (32.6%) | 615 (67.4%) |
| Education, Arts & Media | 21 (21.9%) | 75 (78.1%) |
| Legal Services & Support | 59 (30.4%) | 135 (69.6%) |
| Education Instruction & Library | 133 (28.1%) | 340 (71.9%) |
| Arts, Media & Entertainment | 85 (56.7%) | 65 (43.3%) |
| Health Diagnosing & Treating | 149 (25.6%) | 433 (74.4%) |
| Health Technologists | 78 (24.1%) | 245 (75.8%) |
| Total (Category) | 2,056 (52.6%) | 1,854 (47.4%) |
| Total (Overall) | 5,391 (50.4%) | 5,311 (49.6%) |
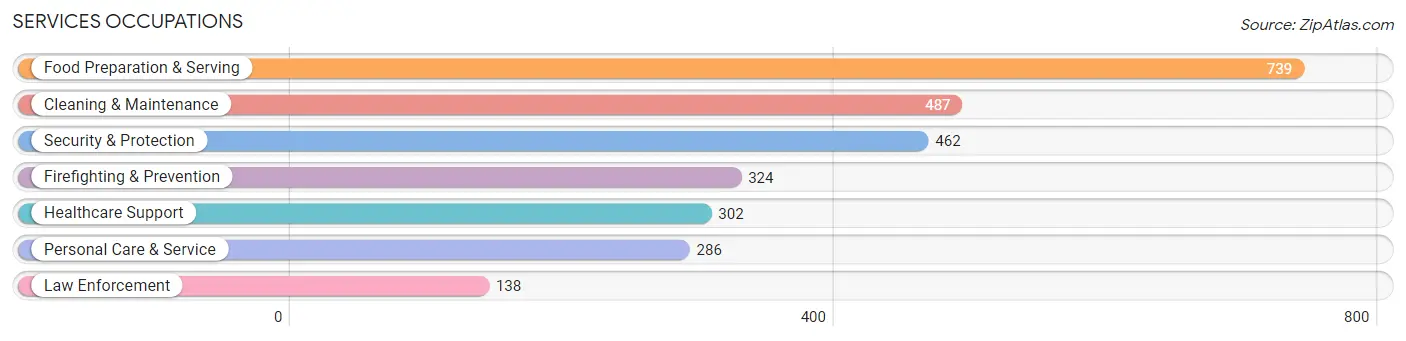
Services Occupations
The most common Services occupations in Laurel are Food Preparation & Serving (739 | 6.9%), Cleaning & Maintenance (487 | 4.5%), Security & Protection (462 | 4.3%), Firefighting & Prevention (324 | 3.0%), and Healthcare Support (302 | 2.8%).
Services Occupations by Sex
Within the Services occupations in Laurel, the most male-oriented occupations are Food Preparation & Serving (66.7%), Law Enforcement (37.7%), and Security & Protection (30.1%), while the most female-oriented occupations are Personal Care & Service (90.6%), Healthcare Support (90.1%), and Cleaning & Maintenance (80.7%).
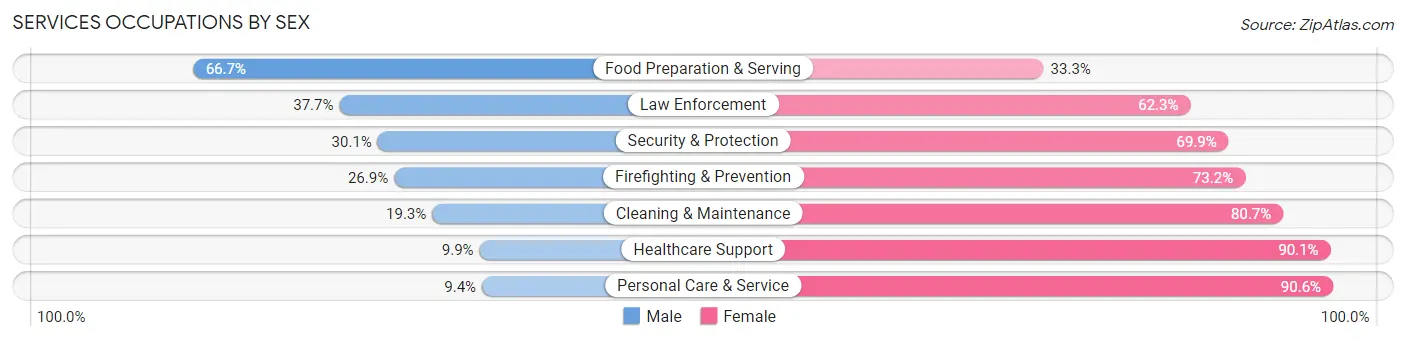
| Occupation | Male | Female |
| Healthcare Support | 30 (9.9%) | 272 (90.1%) |
| Security & Protection | 139 (30.1%) | 323 (69.9%) |
| Firefighting & Prevention | 87 (26.9%) | 237 (73.2%) |
| Law Enforcement | 52 (37.7%) | 86 (62.3%) |
| Food Preparation & Serving | 493 (66.7%) | 246 (33.3%) |
| Cleaning & Maintenance | 94 (19.3%) | 393 (80.7%) |
| Personal Care & Service | 27 (9.4%) | 259 (90.6%) |
| Total (Category) | 783 (34.4%) | 1,493 (65.6%) |
| Total (Overall) | 5,391 (50.4%) | 5,311 (49.6%) |
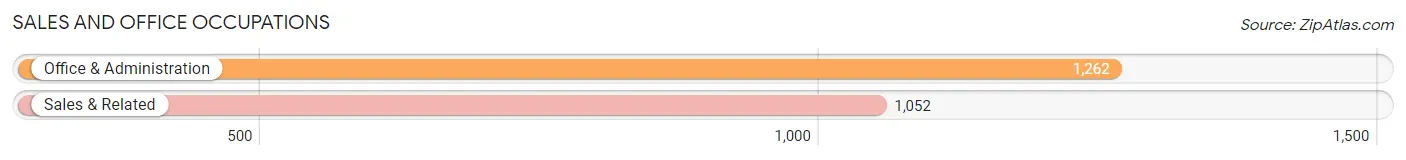
Sales and Office Occupations
The most common Sales and Office occupations in Laurel are Office & Administration (1,262 | 11.8%), and Sales & Related (1,052 | 9.8%).
Sales and Office Occupations by Sex
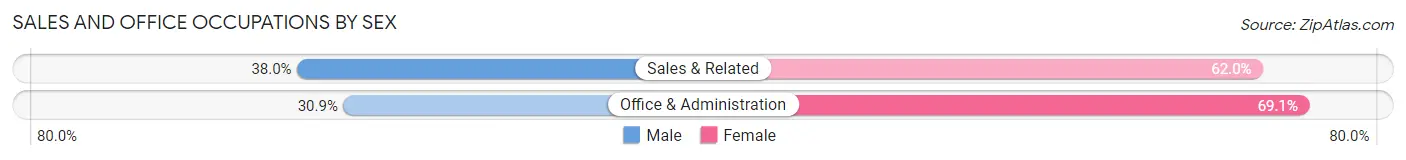
| Occupation | Male | Female |
| Sales & Related | 400 (38.0%) | 652 (62.0%) |
| Office & Administration | 390 (30.9%) | 872 (69.1%) |
| Total (Category) | 790 (34.1%) | 1,524 (65.9%) |
| Total (Overall) | 5,391 (50.4%) | 5,311 (49.6%) |
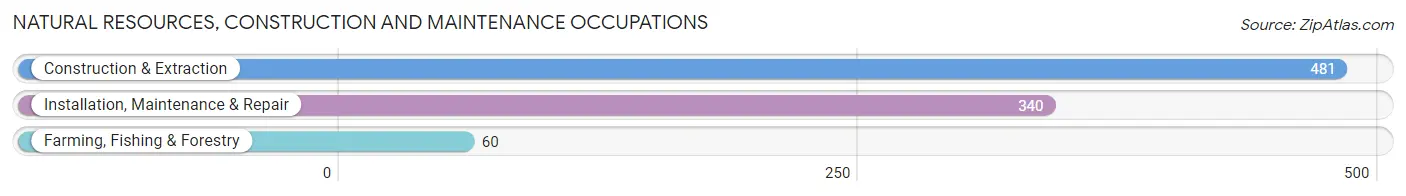
Natural Resources, Construction and Maintenance Occupations
The most common Natural Resources, Construction and Maintenance occupations in Laurel are Construction & Extraction (481 | 4.5%), Installation, Maintenance & Repair (340 | 3.2%), and Farming, Fishing & Forestry (60 | 0.6%).
Natural Resources, Construction and Maintenance Occupations by Sex
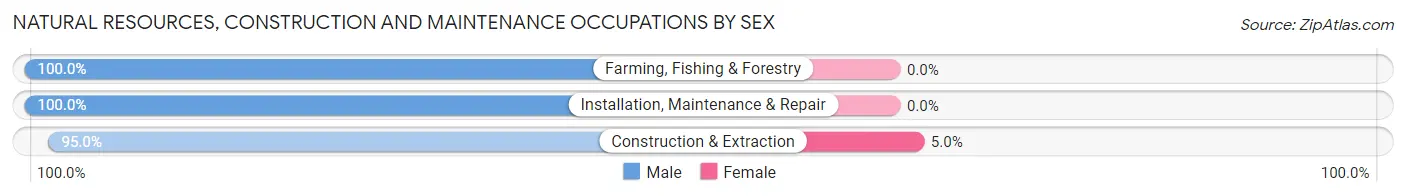
| Occupation | Male | Female |
| Farming, Fishing & Forestry | 60 (100.0%) | 0 (0.0%) |
| Construction & Extraction | 457 (95.0%) | 24 (5.0%) |
| Installation, Maintenance & Repair | 340 (100.0%) | 0 (0.0%) |
| Total (Category) | 857 (97.3%) | 24 (2.7%) |
| Total (Overall) | 5,391 (50.4%) | 5,311 (49.6%) |
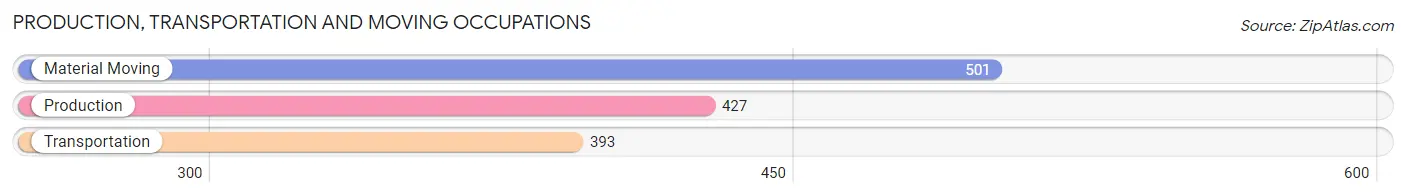
Production, Transportation and Moving Occupations
The most common Production, Transportation and Moving occupations in Laurel are Material Moving (501 | 4.7%), Production (427 | 4.0%), and Transportation (393 | 3.7%).
Production, Transportation and Moving Occupations by Sex
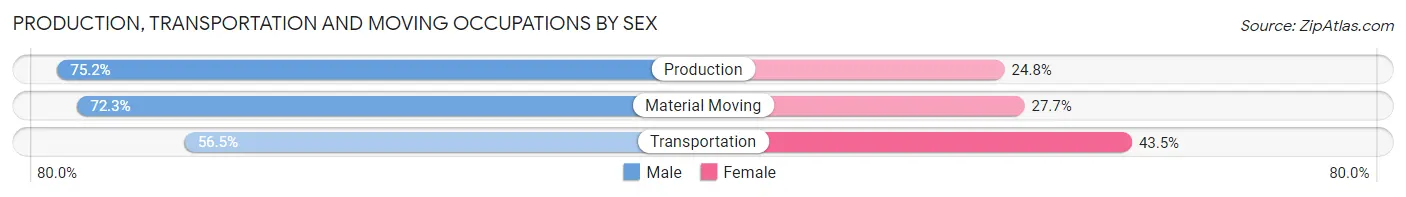
| Occupation | Male | Female |
| Production | 321 (75.2%) | 106 (24.8%) |
| Transportation | 222 (56.5%) | 171 (43.5%) |
| Material Moving | 362 (72.3%) | 139 (27.7%) |
| Total (Category) | 905 (68.5%) | 416 (31.5%) |
| Total (Overall) | 5,391 (50.4%) | 5,311 (49.6%) |
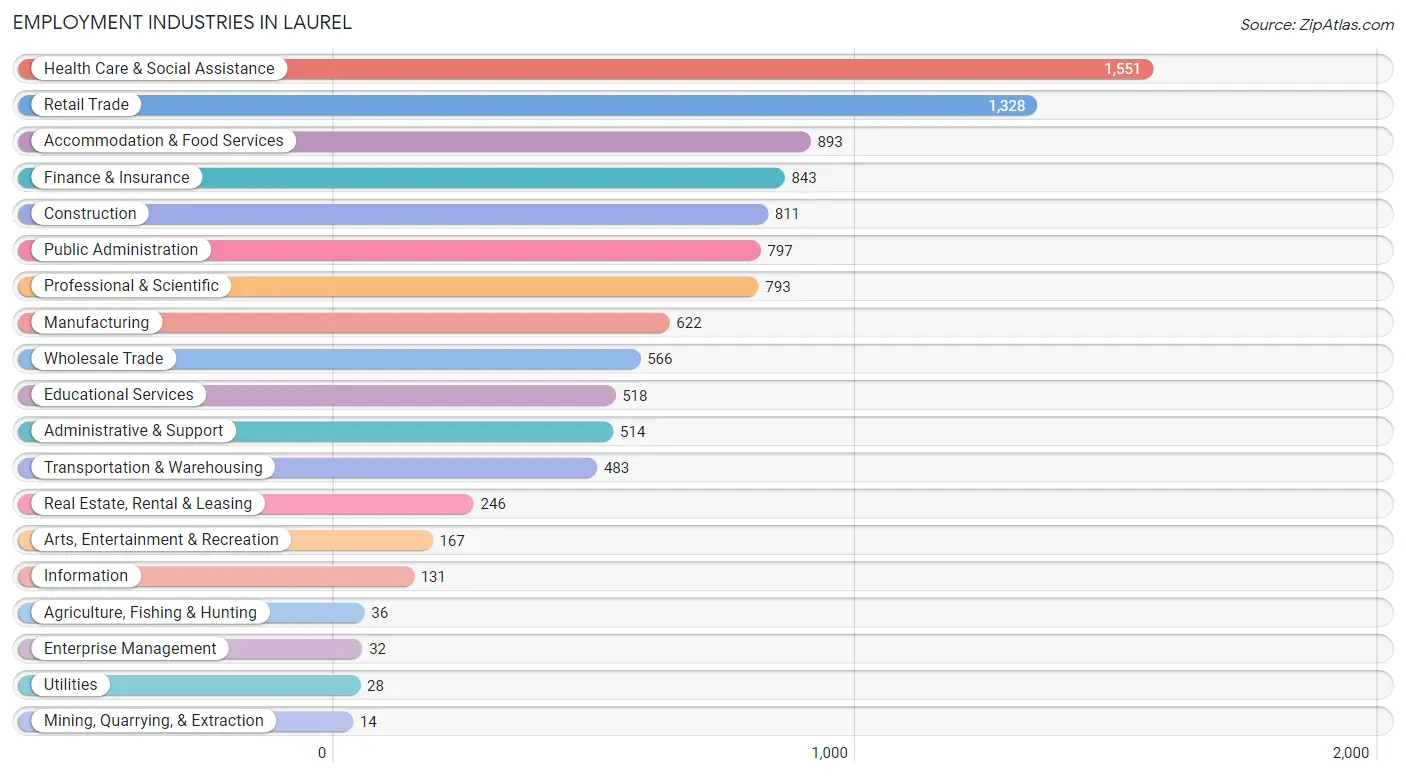
Employment Industries by Sex in Laurel
Employment Industries in Laurel
The major employment industries in Laurel include Health Care & Social Assistance (1,551 | 14.5%), Retail Trade (1,328 | 12.4%), Accommodation & Food Services (893 | 8.3%), Finance & Insurance (843 | 7.9%), and Construction (811 | 7.6%).
Employment Industries by Sex in Laurel
The Laurel industries that see more men than women are Agriculture, Fishing & Hunting (100.0%), Mining, Quarrying, & Extraction (100.0%), and Construction (94.1%), whereas the industries that tend to have a higher number of women are Enterprise Management (100.0%), Utilities (85.7%), and Health Care & Social Assistance (74.0%).
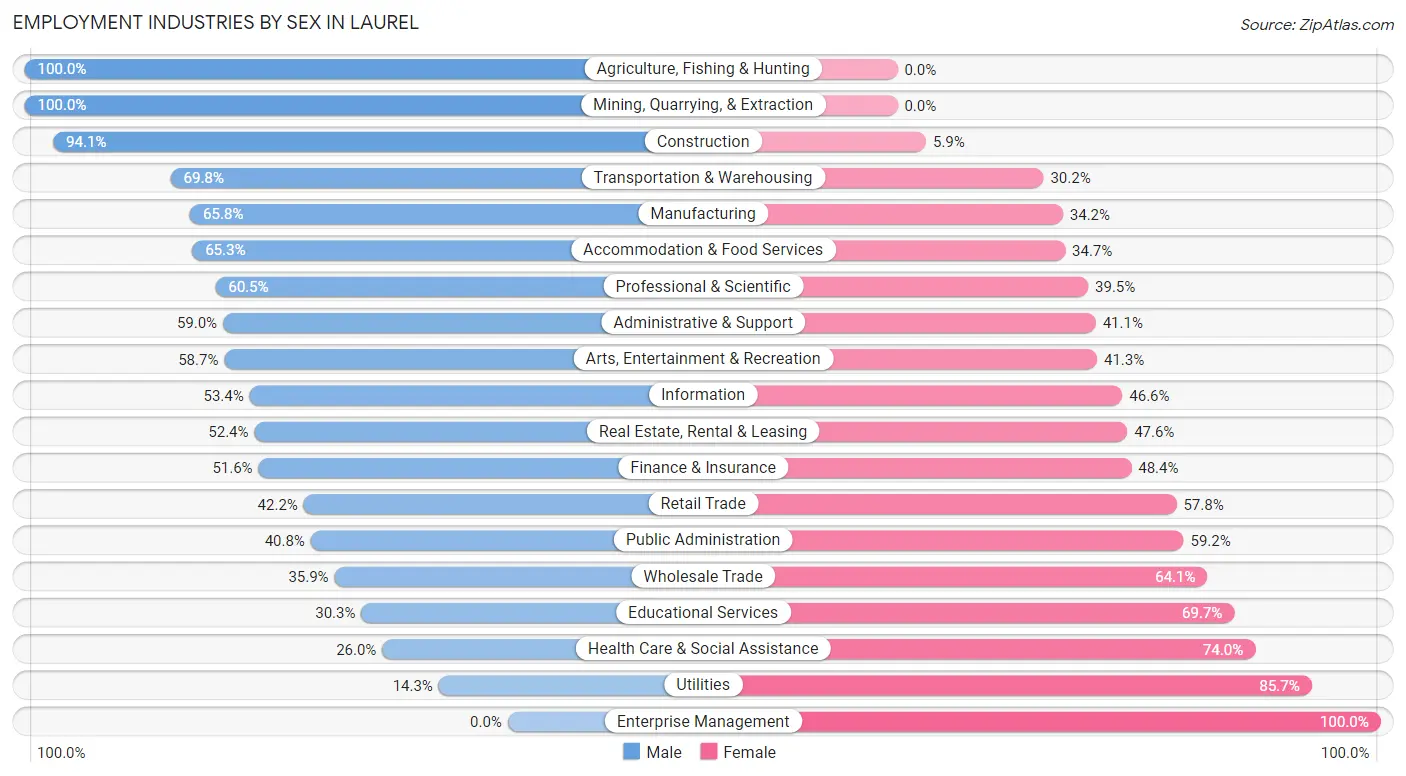
| Industry | Male | Female |
| Agriculture, Fishing & Hunting | 36 (100.0%) | 0 (0.0%) |
| Mining, Quarrying, & Extraction | 14 (100.0%) | 0 (0.0%) |
| Construction | 763 (94.1%) | 48 (5.9%) |
| Manufacturing | 409 (65.8%) | 213 (34.2%) |
| Wholesale Trade | 203 (35.9%) | 363 (64.1%) |
| Retail Trade | 561 (42.2%) | 767 (57.8%) |
| Transportation & Warehousing | 337 (69.8%) | 146 (30.2%) |
| Utilities | 4 (14.3%) | 24 (85.7%) |
| Information | 70 (53.4%) | 61 (46.6%) |
| Finance & Insurance | 435 (51.6%) | 408 (48.4%) |
| Real Estate, Rental & Leasing | 129 (52.4%) | 117 (47.6%) |
| Professional & Scientific | 480 (60.5%) | 313 (39.5%) |
| Enterprise Management | 0 (0.0%) | 32 (100.0%) |
| Administrative & Support | 303 (59.0%) | 211 (41.0%) |
| Educational Services | 157 (30.3%) | 361 (69.7%) |
| Health Care & Social Assistance | 403 (26.0%) | 1,148 (74.0%) |
| Arts, Entertainment & Recreation | 98 (58.7%) | 69 (41.3%) |
| Accommodation & Food Services | 583 (65.3%) | 310 (34.7%) |
| Public Administration | 325 (40.8%) | 472 (59.2%) |
| Total | 5,391 (50.4%) | 5,311 (49.6%) |
Education in Laurel
School Enrollment in Laurel
The most common levels of schooling among the 4,206 students in Laurel are college / undergraduate (1,261 | 30.0%), high school (964 | 22.9%), and middle school (863 | 20.5%).
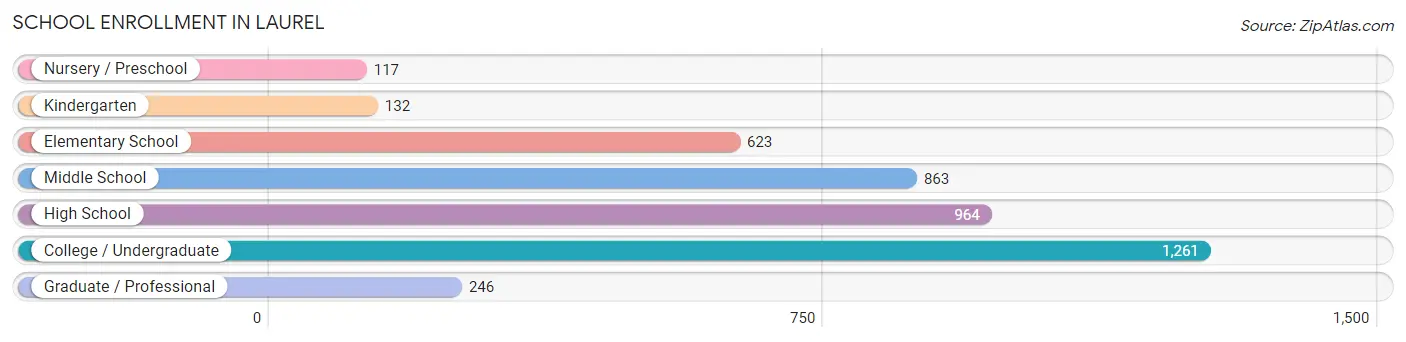
| School Level | # Students | % Students |
| Nursery / Preschool | 117 | 2.8% |
| Kindergarten | 132 | 3.1% |
| Elementary School | 623 | 14.8% |
| Middle School | 863 | 20.5% |
| High School | 964 | 22.9% |
| College / Undergraduate | 1,261 | 30.0% |
| Graduate / Professional | 246 | 5.9% |
| Total | 4,206 | 100.0% |
School Enrollment by Age by Funding Source in Laurel
Out of a total of 4,206 students who are enrolled in schools in Laurel, 580 (13.8%) attend a private institution, while the remaining 3,626 (86.2%) are enrolled in public schools. The age group of 3 to 4 year olds has the highest likelihood of being enrolled in private schools, with 46 (50.5% in the age bracket) enrolled. Conversely, the age group of 15 to 17 year olds has the lowest likelihood of being enrolled in a private school, with 659 (97.3% in the age bracket) attending a public institution.
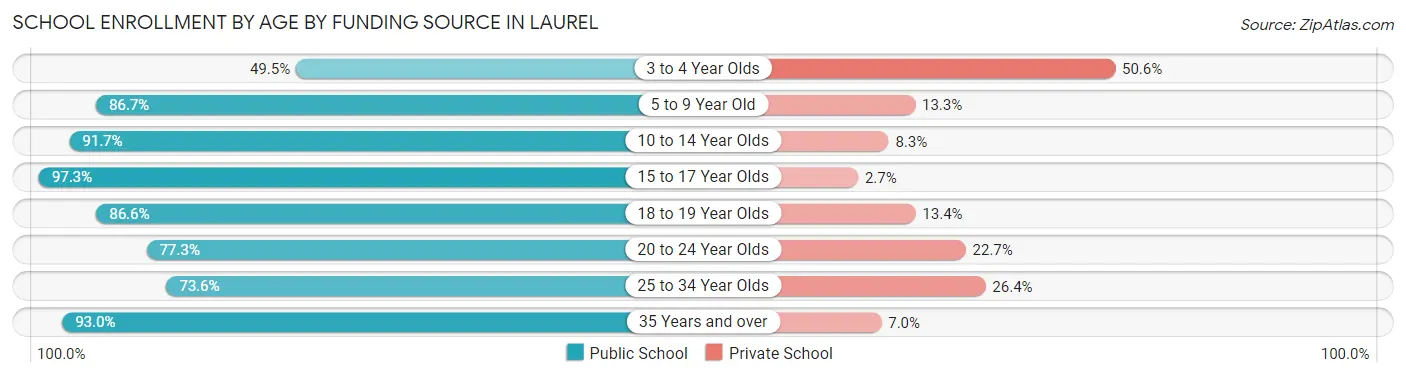
| Age Bracket | Public School | Private School |
| 3 to 4 Year Olds | 45 (49.4%) | 46 (50.5%) |
| 5 to 9 Year Old | 626 (86.7%) | 96 (13.3%) |
| 10 to 14 Year Olds | 846 (91.7%) | 77 (8.3%) |
| 15 to 17 Year Olds | 659 (97.3%) | 18 (2.7%) |
| 18 to 19 Year Olds | 253 (86.6%) | 39 (13.4%) |
| 20 to 24 Year Olds | 405 (77.3%) | 119 (22.7%) |
| 25 to 34 Year Olds | 446 (73.6%) | 160 (26.4%) |
| 35 Years and over | 345 (93.0%) | 26 (7.0%) |
| Total | 3,626 (86.2%) | 580 (13.8%) |
Educational Attainment by Field of Study in Laurel
Business (659 | 15.6%), science & technology (528 | 12.5%), computers & mathematics (371 | 8.8%), education (353 | 8.4%), and social sciences (340 | 8.0%) are the most common fields of study among 4,227 individuals in Laurel who have obtained a bachelor's degree or higher.
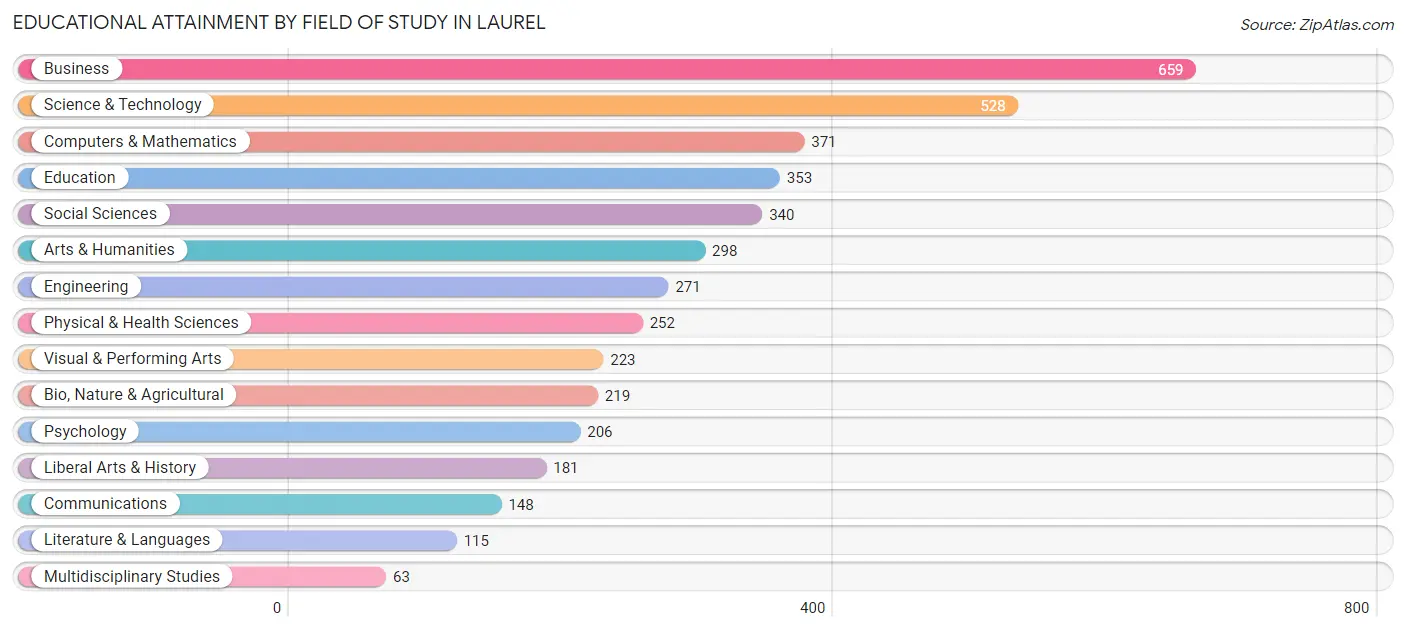
| Field of Study | # Graduates | % Graduates |
| Computers & Mathematics | 371 | 8.8% |
| Bio, Nature & Agricultural | 219 | 5.2% |
| Physical & Health Sciences | 252 | 6.0% |
| Psychology | 206 | 4.9% |
| Social Sciences | 340 | 8.0% |
| Engineering | 271 | 6.4% |
| Multidisciplinary Studies | 63 | 1.5% |
| Science & Technology | 528 | 12.5% |
| Business | 659 | 15.6% |
| Education | 353 | 8.4% |
| Literature & Languages | 115 | 2.7% |
| Liberal Arts & History | 181 | 4.3% |
| Visual & Performing Arts | 223 | 5.3% |
| Communications | 148 | 3.5% |
| Arts & Humanities | 298 | 7.0% |
| Total | 4,227 | 100.0% |
Transportation & Commute in Laurel
Vehicle Availability by Sex in Laurel
The most prevalent vehicle ownership categories in Laurel are males with 2 vehicles (2,071, accounting for 38.8%) and females with 2 vehicles (1,916, making up 40.3%).
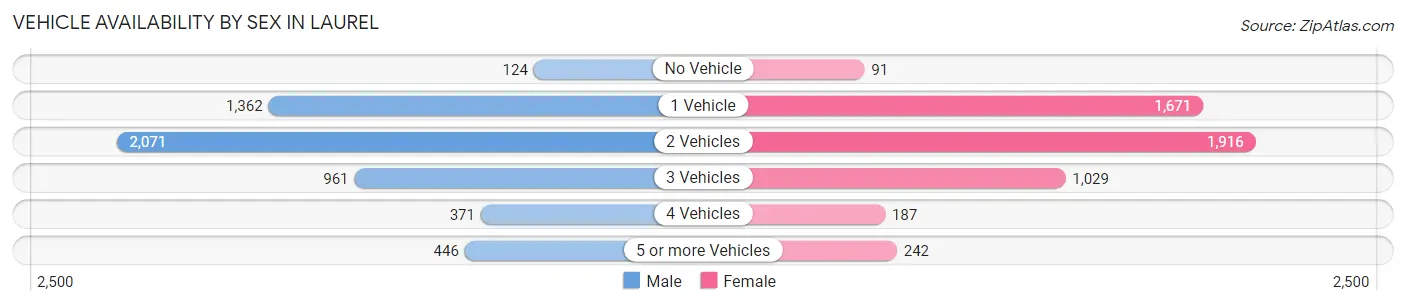
| Vehicles Available | Male | Female |
| No Vehicle | 124 (2.3%) | 91 (1.8%) |
| 1 Vehicle | 1,362 (25.5%) | 1,671 (32.5%) |
| 2 Vehicles | 2,071 (38.8%) | 1,916 (37.3%) |
| 3 Vehicles | 961 (18.0%) | 1,029 (20.0%) |
| 4 Vehicles | 371 (7.0%) | 187 (3.6%) |
| 5 or more Vehicles | 446 (8.4%) | 242 (4.7%) |
| Total | 5,335 (100.0%) | 5,136 (100.0%) |
Commute Time in Laurel
The most frequently occuring commute durations in Laurel are 20 to 24 minutes (2,303 commuters, 24.3%), 15 to 19 minutes (2,293 commuters, 24.2%), and 10 to 14 minutes (1,326 commuters, 14.0%).
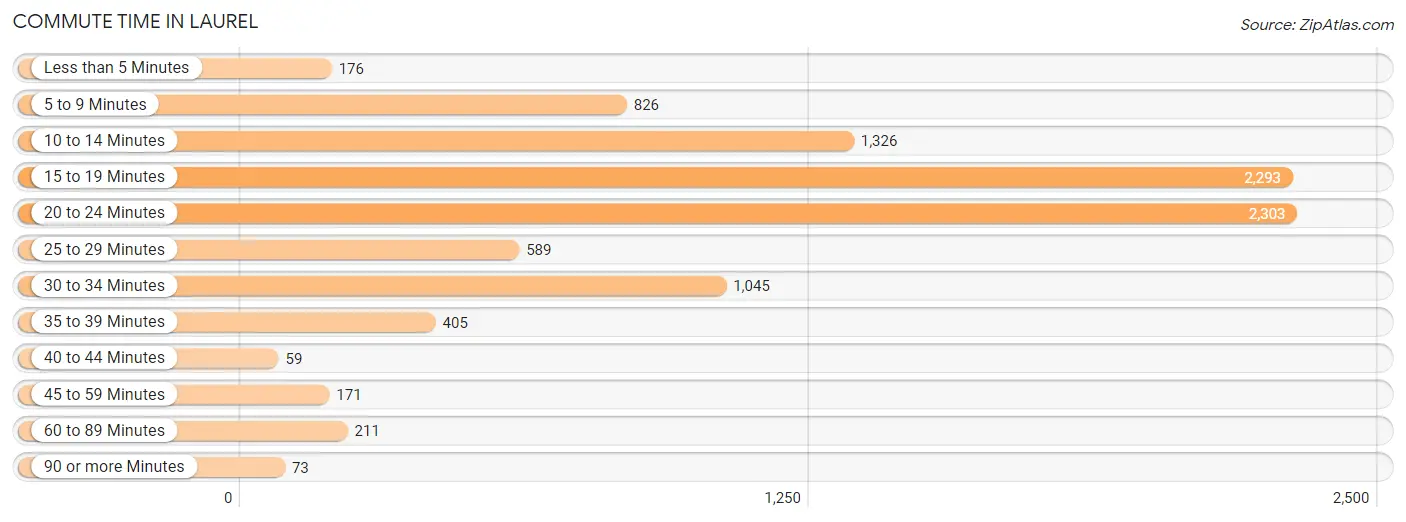
| Commute Time | # Commuters | % Commuters |
| Less than 5 Minutes | 176 | 1.9% |
| 5 to 9 Minutes | 826 | 8.7% |
| 10 to 14 Minutes | 1,326 | 14.0% |
| 15 to 19 Minutes | 2,293 | 24.2% |
| 20 to 24 Minutes | 2,303 | 24.3% |
| 25 to 29 Minutes | 589 | 6.2% |
| 30 to 34 Minutes | 1,045 | 11.0% |
| 35 to 39 Minutes | 405 | 4.3% |
| 40 to 44 Minutes | 59 | 0.6% |
| 45 to 59 Minutes | 171 | 1.8% |
| 60 to 89 Minutes | 211 | 2.2% |
| 90 or more Minutes | 73 | 0.8% |
Commute Time by Sex in Laurel
The most common commute times in Laurel are 15 to 19 minutes (1,321 commuters, 26.8%) for males and 20 to 24 minutes (1,380 commuters, 30.3%) for females.
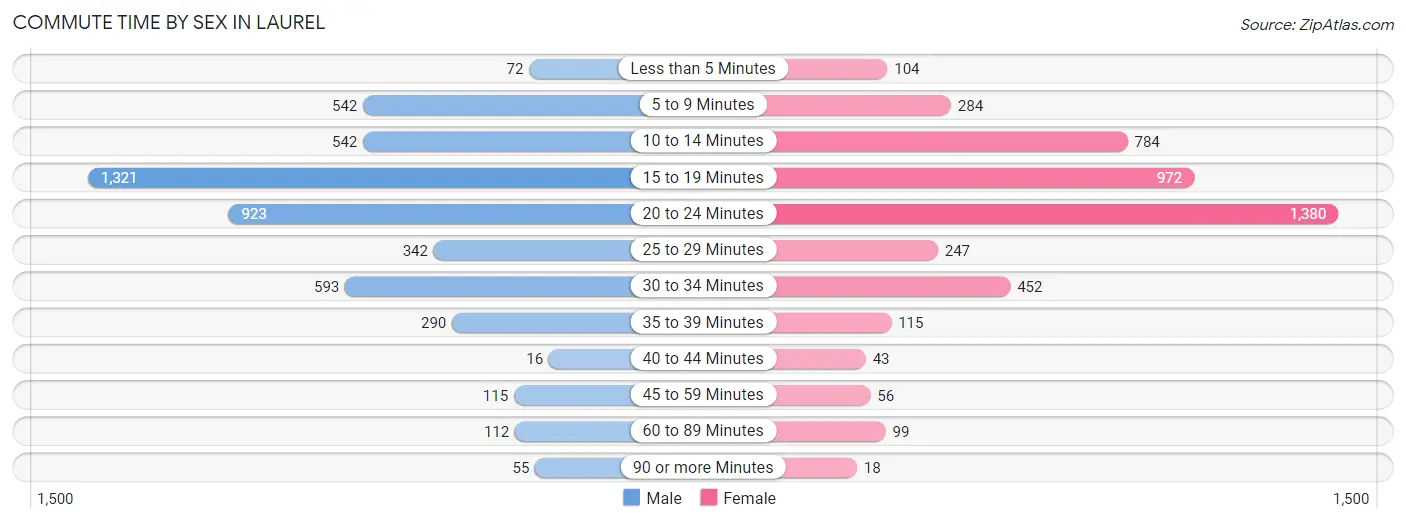
| Commute Time | Male | Female |
| Less than 5 Minutes | 72 (1.5%) | 104 (2.3%) |
| 5 to 9 Minutes | 542 (11.0%) | 284 (6.2%) |
| 10 to 14 Minutes | 542 (11.0%) | 784 (17.2%) |
| 15 to 19 Minutes | 1,321 (26.8%) | 972 (21.3%) |
| 20 to 24 Minutes | 923 (18.8%) | 1,380 (30.3%) |
| 25 to 29 Minutes | 342 (7.0%) | 247 (5.4%) |
| 30 to 34 Minutes | 593 (12.0%) | 452 (9.9%) |
| 35 to 39 Minutes | 290 (5.9%) | 115 (2.5%) |
| 40 to 44 Minutes | 16 (0.3%) | 43 (0.9%) |
| 45 to 59 Minutes | 115 (2.3%) | 56 (1.2%) |
| 60 to 89 Minutes | 112 (2.3%) | 99 (2.2%) |
| 90 or more Minutes | 55 (1.1%) | 18 (0.4%) |
Time of Departure to Work by Sex in Laurel
The most frequent times of departure to work in Laurel are 7:00 AM to 7:29 AM (819, 16.6%) for males and 8:00 AM to 8:29 AM (735, 16.1%) for females.
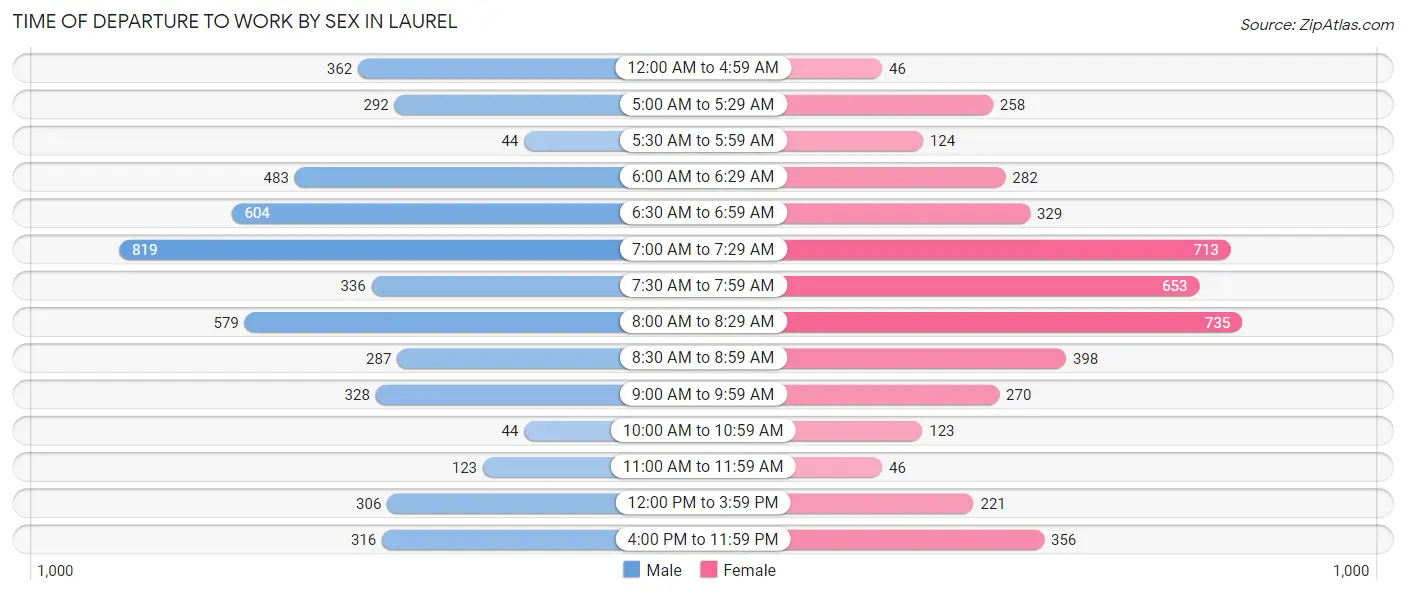
| Time of Departure | Male | Female |
| 12:00 AM to 4:59 AM | 362 (7.3%) | 46 (1.0%) |
| 5:00 AM to 5:29 AM | 292 (5.9%) | 258 (5.7%) |
| 5:30 AM to 5:59 AM | 44 (0.9%) | 124 (2.7%) |
| 6:00 AM to 6:29 AM | 483 (9.8%) | 282 (6.2%) |
| 6:30 AM to 6:59 AM | 604 (12.3%) | 329 (7.2%) |
| 7:00 AM to 7:29 AM | 819 (16.6%) | 713 (15.7%) |
| 7:30 AM to 7:59 AM | 336 (6.8%) | 653 (14.3%) |
| 8:00 AM to 8:29 AM | 579 (11.8%) | 735 (16.1%) |
| 8:30 AM to 8:59 AM | 287 (5.8%) | 398 (8.7%) |
| 9:00 AM to 9:59 AM | 328 (6.7%) | 270 (5.9%) |
| 10:00 AM to 10:59 AM | 44 (0.9%) | 123 (2.7%) |
| 11:00 AM to 11:59 AM | 123 (2.5%) | 46 (1.0%) |
| 12:00 PM to 3:59 PM | 306 (6.2%) | 221 (4.9%) |
| 4:00 PM to 11:59 PM | 316 (6.4%) | 356 (7.8%) |
| Total | 4,923 (100.0%) | 4,554 (100.0%) |
Housing Occupancy in Laurel
Occupancy by Ownership in Laurel
Of the total 7,158 dwellings in Laurel, owner-occupied units account for 3,681 (51.4%), while renter-occupied units make up 3,477 (48.6%).
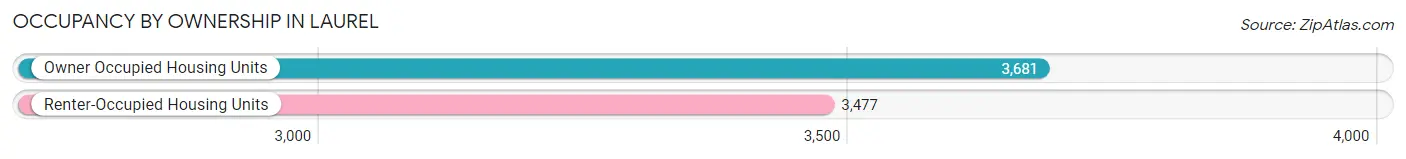
| Occupancy | # Housing Units | % Housing Units |
| Owner Occupied Housing Units | 3,681 | 51.4% |
| Renter-Occupied Housing Units | 3,477 | 48.6% |
| Total Occupied Housing Units | 7,158 | 100.0% |
Occupancy by Household Size in Laurel
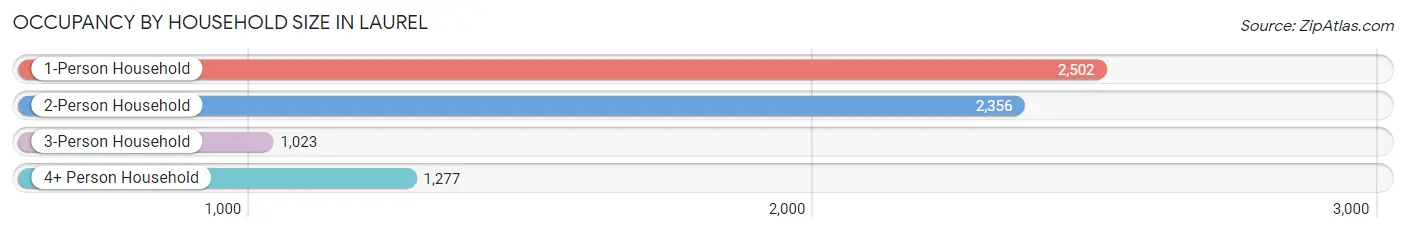
| Household Size | # Housing Units | % Housing Units |
| 1-Person Household | 2,502 | 34.9% |
| 2-Person Household | 2,356 | 32.9% |
| 3-Person Household | 1,023 | 14.3% |
| 4+ Person Household | 1,277 | 17.8% |
| Total Housing Units | 7,158 | 100.0% |
Occupancy by Ownership by Household Size in Laurel
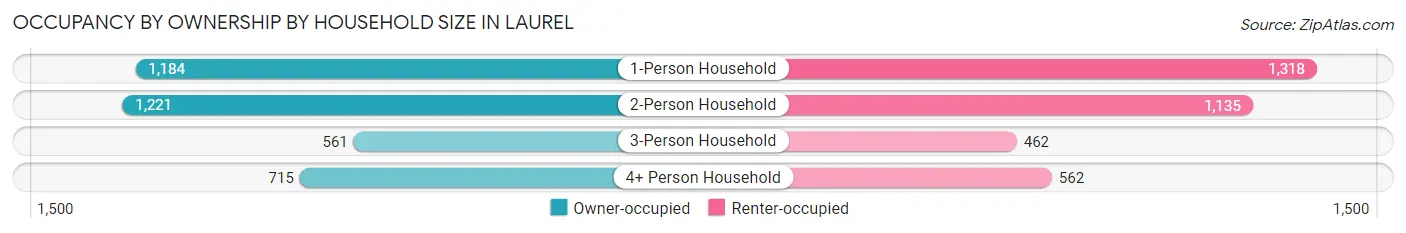
| Household Size | Owner-occupied | Renter-occupied |
| 1-Person Household | 1,184 (47.3%) | 1,318 (52.7%) |
| 2-Person Household | 1,221 (51.8%) | 1,135 (48.2%) |
| 3-Person Household | 561 (54.8%) | 462 (45.2%) |
| 4+ Person Household | 715 (56.0%) | 562 (44.0%) |
| Total Housing Units | 3,681 (51.4%) | 3,477 (48.6%) |
Occupancy by Educational Attainment in Laurel
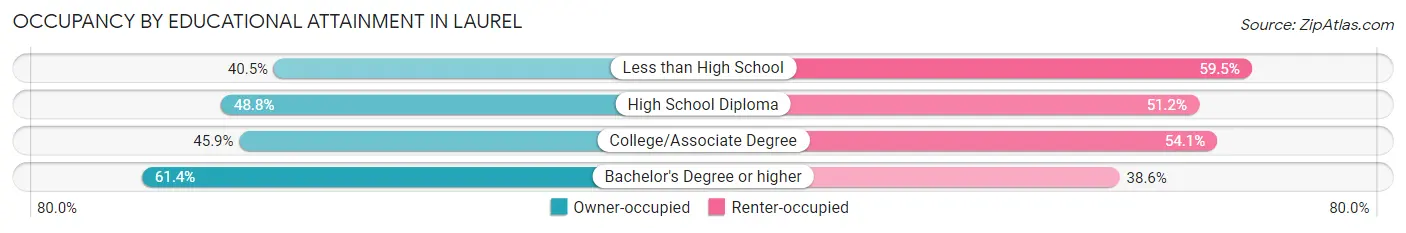
| Household Size | Owner-occupied | Renter-occupied |
| Less than High School | 212 (40.5%) | 312 (59.5%) |
| High School Diploma | 972 (48.8%) | 1,018 (51.2%) |
| College/Associate Degree | 1,053 (45.9%) | 1,239 (54.1%) |
| Bachelor's Degree or higher | 1,444 (61.4%) | 908 (38.6%) |
Occupancy by Age of Householder in Laurel
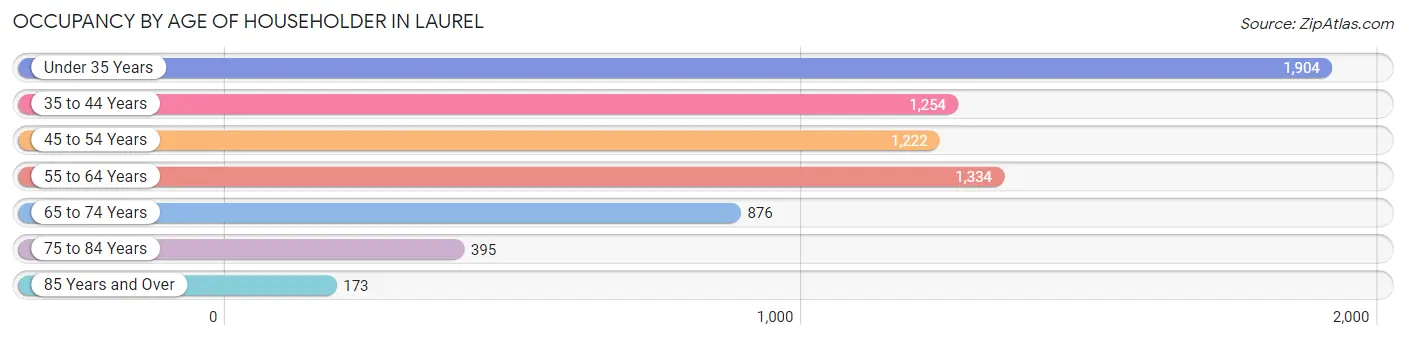
| Age Bracket | # Households | % Households |
| Under 35 Years | 1,904 | 26.6% |
| 35 to 44 Years | 1,254 | 17.5% |
| 45 to 54 Years | 1,222 | 17.1% |
| 55 to 64 Years | 1,334 | 18.6% |
| 65 to 74 Years | 876 | 12.2% |
| 75 to 84 Years | 395 | 5.5% |
| 85 Years and Over | 173 | 2.4% |
| Total | 7,158 | 100.0% |
Housing Finances in Laurel
Median Income by Occupancy in Laurel
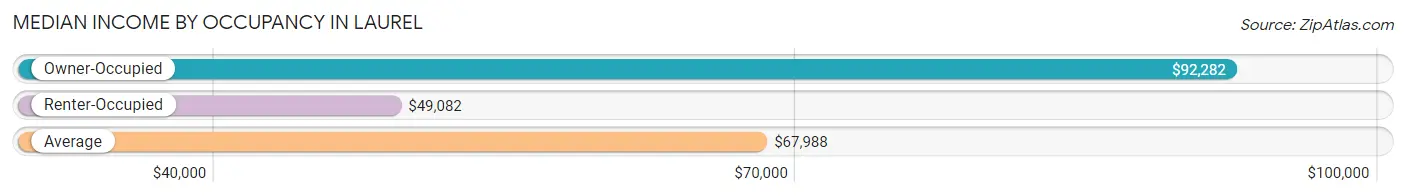
| Occupancy Type | # Households | Median Income |
| Owner-Occupied | 3,681 (51.4%) | $92,282 |
| Renter-Occupied | 3,477 (48.6%) | $49,082 |
| Average | 7,158 (100.0%) | $67,988 |
Occupancy by Householder Income Bracket in Laurel
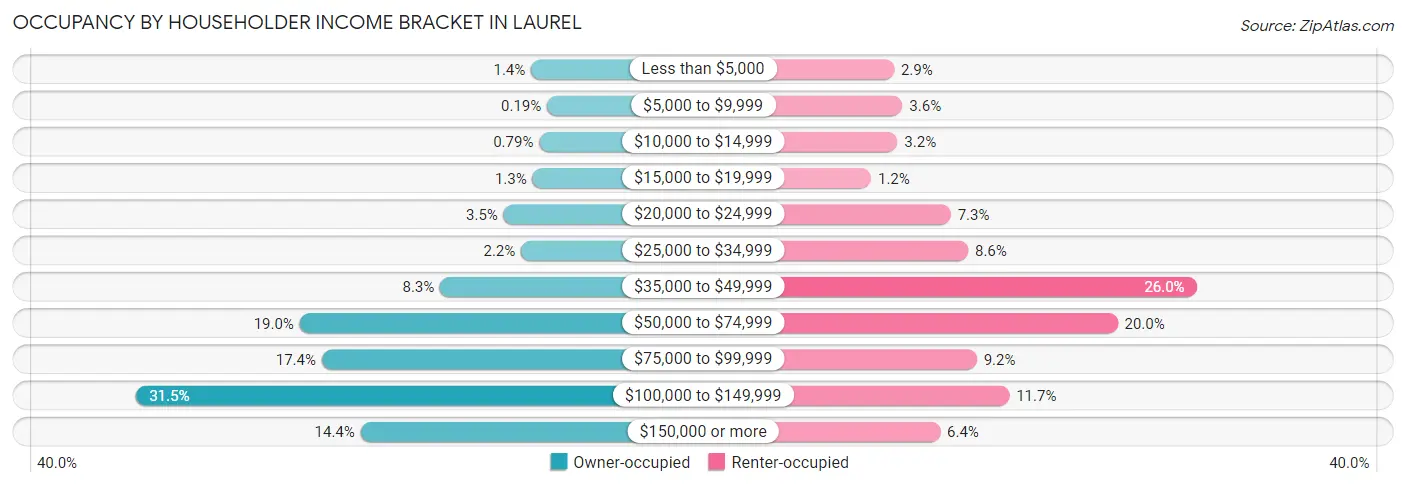
| Income Bracket | Owner-occupied | Renter-occupied |
| Less than $5,000 | 52 (1.4%) | 102 (2.9%) |
| $5,000 to $9,999 | 7 (0.2%) | 124 (3.6%) |
| $10,000 to $14,999 | 29 (0.8%) | 111 (3.2%) |
| $15,000 to $19,999 | 48 (1.3%) | 41 (1.2%) |
| $20,000 to $24,999 | 129 (3.5%) | 252 (7.2%) |
| $25,000 to $34,999 | 80 (2.2%) | 298 (8.6%) |
| $35,000 to $49,999 | 307 (8.3%) | 903 (26.0%) |
| $50,000 to $74,999 | 701 (19.0%) | 694 (20.0%) |
| $75,000 to $99,999 | 639 (17.4%) | 321 (9.2%) |
| $100,000 to $149,999 | 1,159 (31.5%) | 407 (11.7%) |
| $150,000 or more | 530 (14.4%) | 224 (6.4%) |
| Total | 3,681 (100.0%) | 3,477 (100.0%) |
Monthly Housing Cost Tiers in Laurel
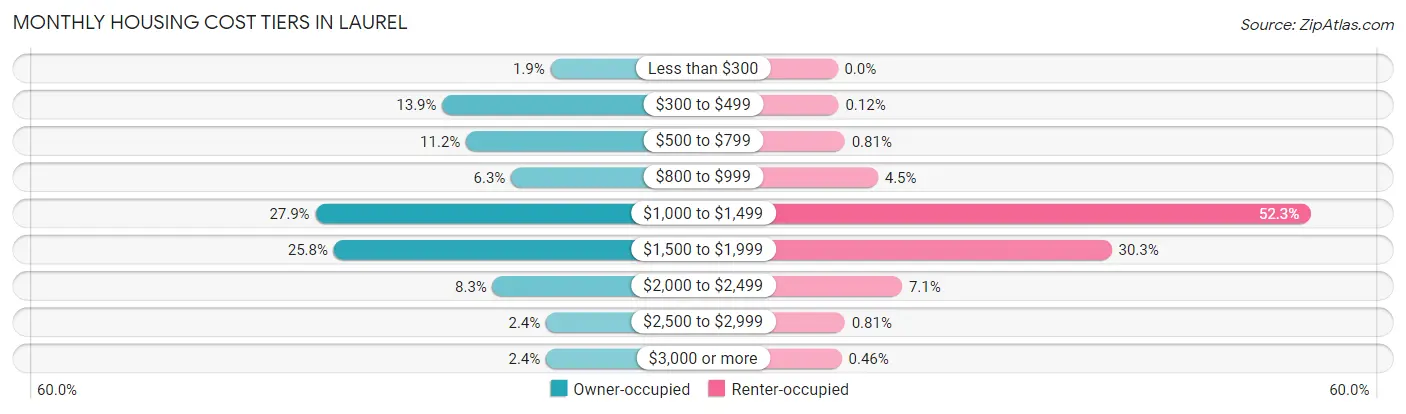
| Monthly Cost | Owner-occupied | Renter-occupied |
| Less than $300 | 70 (1.9%) | 0 (0.0%) |
| $300 to $499 | 510 (13.9%) | 4 (0.1%) |
| $500 to $799 | 413 (11.2%) | 28 (0.8%) |
| $800 to $999 | 230 (6.2%) | 155 (4.5%) |
| $1,000 to $1,499 | 1,026 (27.9%) | 1,819 (52.3%) |
| $1,500 to $1,999 | 951 (25.8%) | 1,053 (30.3%) |
| $2,000 to $2,499 | 305 (8.3%) | 248 (7.1%) |
| $2,500 to $2,999 | 88 (2.4%) | 28 (0.8%) |
| $3,000 or more | 88 (2.4%) | 16 (0.5%) |
| Total | 3,681 (100.0%) | 3,477 (100.0%) |
Physical Housing Characteristics in Laurel
Housing Structures in Laurel
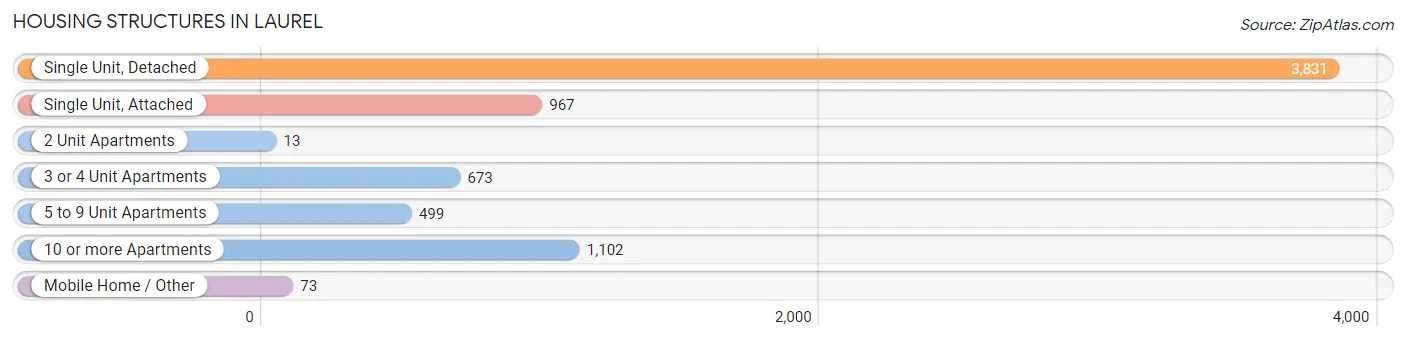
| Structure Type | # Housing Units | % Housing Units |
| Single Unit, Detached | 3,831 | 53.5% |
| Single Unit, Attached | 967 | 13.5% |
| 2 Unit Apartments | 13 | 0.2% |
| 3 or 4 Unit Apartments | 673 | 9.4% |
| 5 to 9 Unit Apartments | 499 | 7.0% |
| 10 or more Apartments | 1,102 | 15.4% |
| Mobile Home / Other | 73 | 1.0% |
| Total | 7,158 | 100.0% |
Housing Structures by Occupancy in Laurel
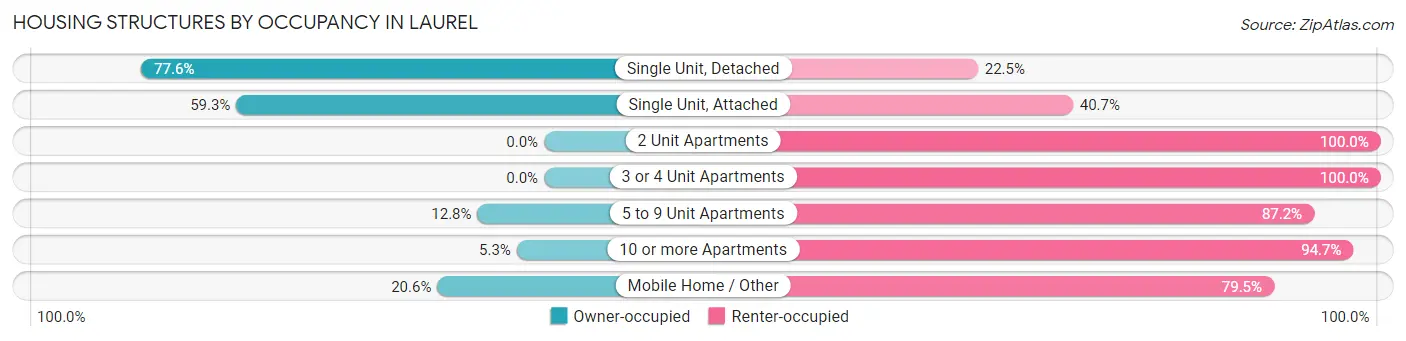
| Structure Type | Owner-occupied | Renter-occupied |
| Single Unit, Detached | 2,971 (77.5%) | 860 (22.5%) |
| Single Unit, Attached | 573 (59.3%) | 394 (40.7%) |
| 2 Unit Apartments | 0 (0.0%) | 13 (100.0%) |
| 3 or 4 Unit Apartments | 0 (0.0%) | 673 (100.0%) |
| 5 to 9 Unit Apartments | 64 (12.8%) | 435 (87.2%) |
| 10 or more Apartments | 58 (5.3%) | 1,044 (94.7%) |
| Mobile Home / Other | 15 (20.5%) | 58 (79.4%) |
| Total | 3,681 (51.4%) | 3,477 (48.6%) |
Housing Structures by Number of Rooms in Laurel
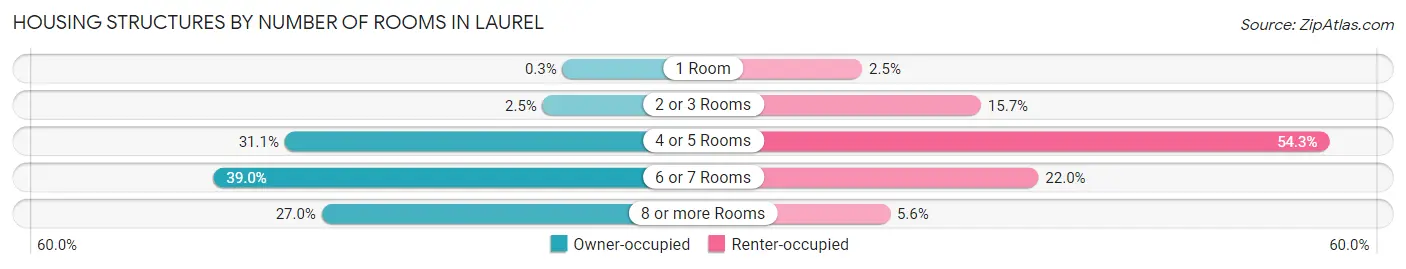
| Number of Rooms | Owner-occupied | Renter-occupied |
| 1 Room | 11 (0.3%) | 86 (2.5%) |
| 2 or 3 Rooms | 92 (2.5%) | 544 (15.7%) |
| 4 or 5 Rooms | 1,146 (31.1%) | 1,888 (54.3%) |
| 6 or 7 Rooms | 1,437 (39.0%) | 766 (22.0%) |
| 8 or more Rooms | 995 (27.0%) | 193 (5.6%) |
| Total | 3,681 (100.0%) | 3,477 (100.0%) |
Housing Structure by Heating Type in Laurel
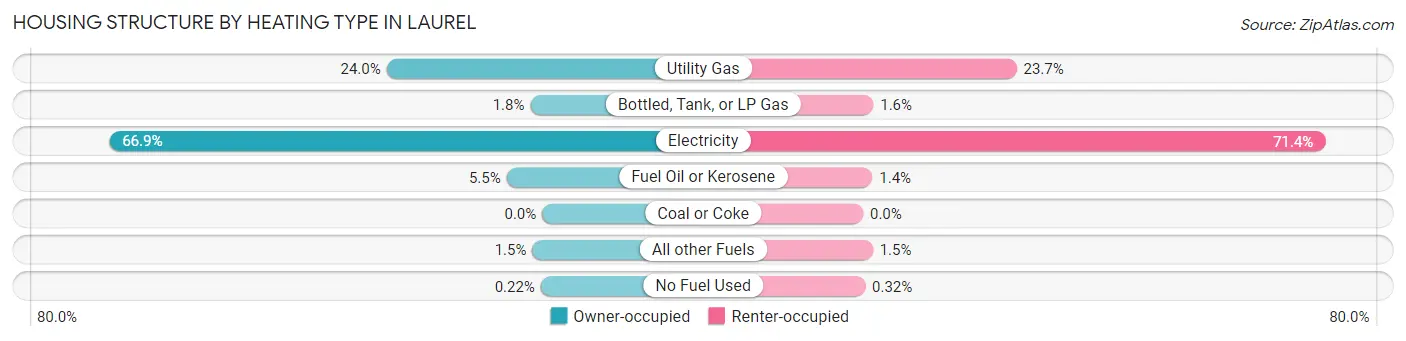
| Heating Type | Owner-occupied | Renter-occupied |
| Utility Gas | 885 (24.0%) | 825 (23.7%) |
| Bottled, Tank, or LP Gas | 67 (1.8%) | 55 (1.6%) |
| Electricity | 2,463 (66.9%) | 2,484 (71.4%) |
| Fuel Oil or Kerosene | 202 (5.5%) | 50 (1.4%) |
| Coal or Coke | 0 (0.0%) | 0 (0.0%) |
| All other Fuels | 56 (1.5%) | 52 (1.5%) |
| No Fuel Used | 8 (0.2%) | 11 (0.3%) |
| Total | 3,681 (100.0%) | 3,477 (100.0%) |
Household Vehicle Usage in Laurel
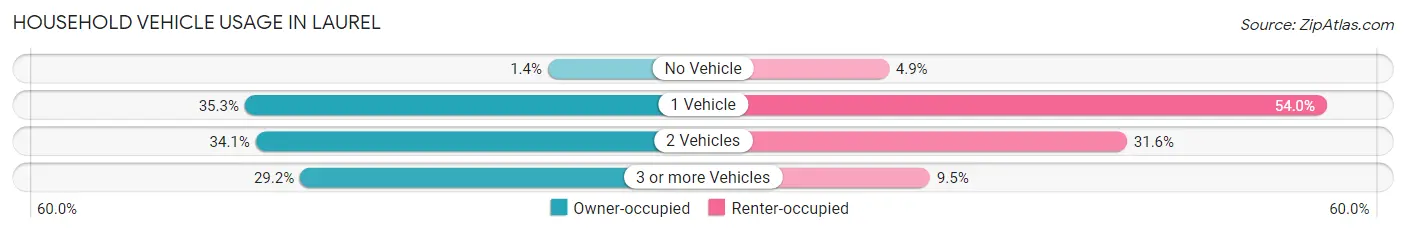
| Vehicles per Household | Owner-occupied | Renter-occupied |
| No Vehicle | 51 (1.4%) | 171 (4.9%) |
| 1 Vehicle | 1,301 (35.3%) | 1,877 (54.0%) |
| 2 Vehicles | 1,256 (34.1%) | 1,098 (31.6%) |
| 3 or more Vehicles | 1,073 (29.1%) | 331 (9.5%) |
| Total | 3,681 (100.0%) | 3,477 (100.0%) |
Real Estate & Mortgages in Laurel
Real Estate and Mortgage Overview in Laurel
| Characteristic | Without Mortgage | With Mortgage |
| Housing Units | 801 | 2,880 |
| Median Property Value | $259,200 | $256,600 |
| Median Household Income | $75,156 | $434 |
| Monthly Housing Costs | $479 | $88 |
| Real Estate Taxes | $1,867 | $193 |
Property Value by Mortgage Status in Laurel
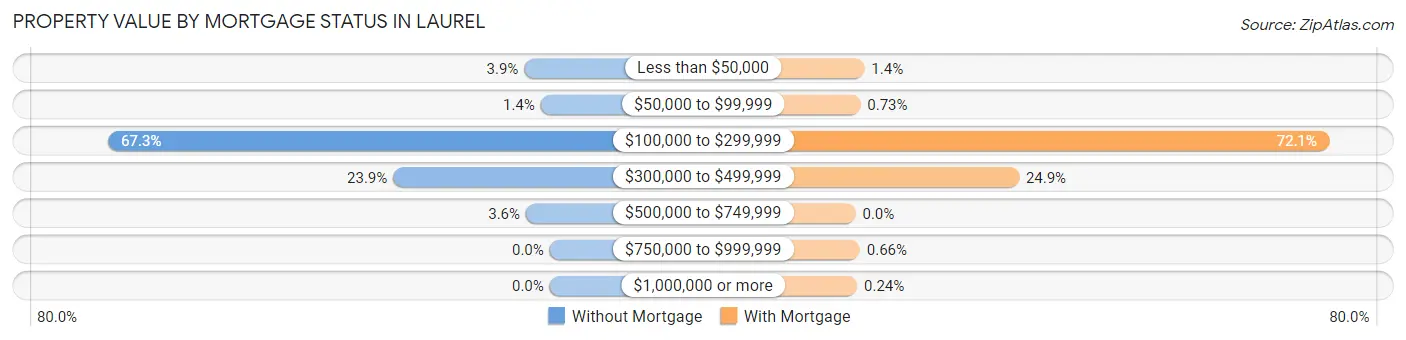
| Property Value | Without Mortgage | With Mortgage |
| Less than $50,000 | 31 (3.9%) | 39 (1.3%) |
| $50,000 to $99,999 | 11 (1.4%) | 21 (0.7%) |
| $100,000 to $299,999 | 539 (67.3%) | 2,077 (72.1%) |
| $300,000 to $499,999 | 191 (23.8%) | 717 (24.9%) |
| $500,000 to $749,999 | 29 (3.6%) | 0 (0.0%) |
| $750,000 to $999,999 | 0 (0.0%) | 19 (0.7%) |
| $1,000,000 or more | 0 (0.0%) | 7 (0.2%) |
| Total | 801 (100.0%) | 2,880 (100.0%) |
Household Income by Mortgage Status in Laurel
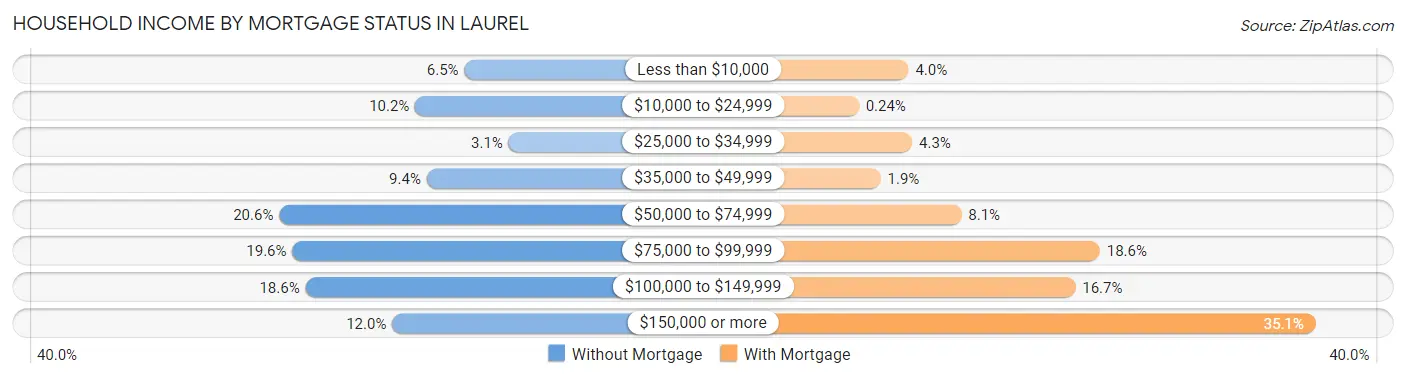
| Household Income | Without Mortgage | With Mortgage |
| Less than $10,000 | 52 (6.5%) | 116 (4.0%) |
| $10,000 to $24,999 | 82 (10.2%) | 7 (0.2%) |
| $25,000 to $34,999 | 25 (3.1%) | 124 (4.3%) |
| $35,000 to $49,999 | 75 (9.4%) | 55 (1.9%) |
| $50,000 to $74,999 | 165 (20.6%) | 232 (8.1%) |
| $75,000 to $99,999 | 157 (19.6%) | 536 (18.6%) |
| $100,000 to $149,999 | 149 (18.6%) | 482 (16.7%) |
| $150,000 or more | 96 (12.0%) | 1,010 (35.1%) |
| Total | 801 (100.0%) | 2,880 (100.0%) |
Property Value to Household Income Ratio in Laurel
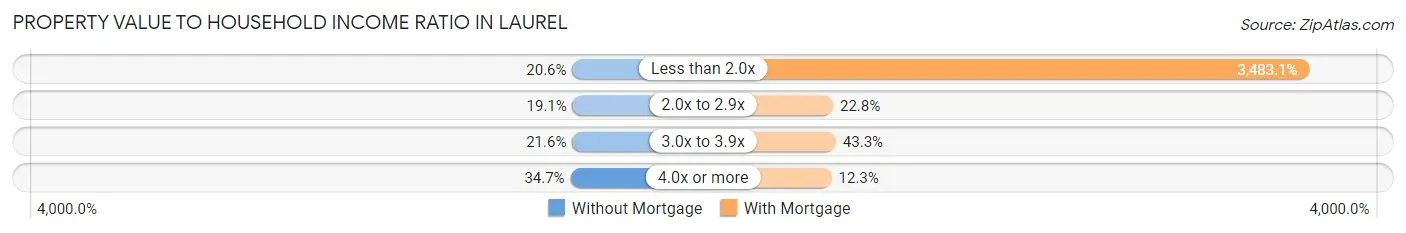
| Value-to-Income Ratio | Without Mortgage | With Mortgage |
| Less than 2.0x | 165 (20.6%) | 100,313 (3,483.1%) |
| 2.0x to 2.9x | 153 (19.1%) | 656 (22.8%) |
| 3.0x to 3.9x | 173 (21.6%) | 1,248 (43.3%) |
| 4.0x or more | 278 (34.7%) | 355 (12.3%) |
| Total | 801 (100.0%) | 2,880 (100.0%) |
Real Estate Taxes by Mortgage Status in Laurel
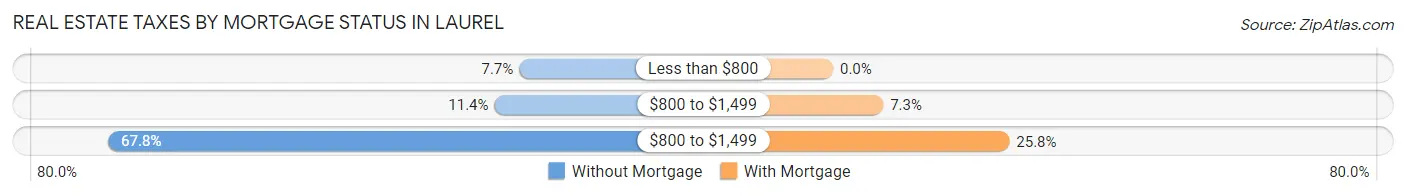
| Property Taxes | Without Mortgage | With Mortgage |
| Less than $800 | 62 (7.7%) | 0 (0.0%) |
| $800 to $1,499 | 91 (11.4%) | 211 (7.3%) |
| $800 to $1,499 | 543 (67.8%) | 742 (25.8%) |
| Total | 801 (100.0%) | 2,880 (100.0%) |
Health & Disability in Laurel
Health Insurance Coverage by Age in Laurel
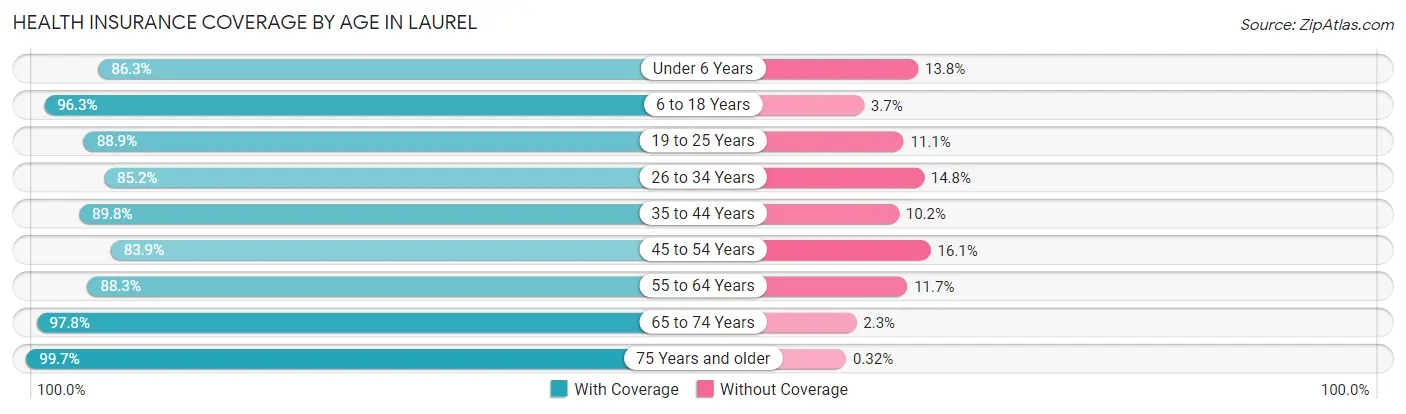
| Age Bracket | With Coverage | Without Coverage |
| Under 6 Years | 1,123 (86.3%) | 179 (13.8%) |
| 6 to 18 Years | 2,371 (96.3%) | 90 (3.7%) |
| 19 to 25 Years | 1,713 (88.9%) | 213 (11.1%) |
| 26 to 34 Years | 2,683 (85.2%) | 467 (14.8%) |
| 35 to 44 Years | 1,972 (89.8%) | 223 (10.2%) |
| 45 to 54 Years | 1,759 (83.9%) | 337 (16.1%) |
| 55 to 64 Years | 2,029 (88.3%) | 270 (11.7%) |
| 65 to 74 Years | 1,215 (97.8%) | 28 (2.2%) |
| 75 Years and older | 935 (99.7%) | 3 (0.3%) |
| Total | 15,800 (89.7%) | 1,810 (10.3%) |
Health Insurance Coverage by Citizenship Status in Laurel
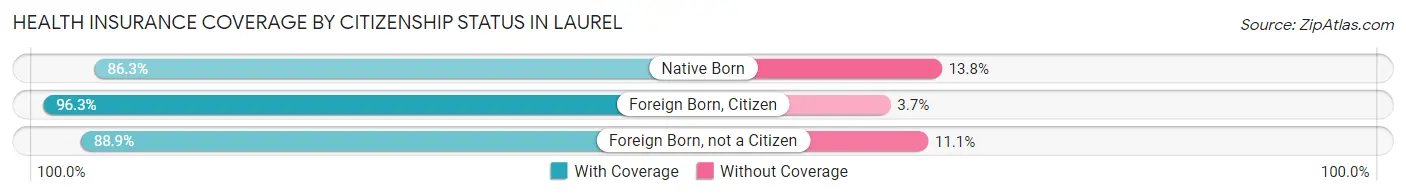
| Citizenship Status | With Coverage | Without Coverage |
| Native Born | 1,123 (86.3%) | 179 (13.8%) |
| Foreign Born, Citizen | 2,371 (96.3%) | 90 (3.7%) |
| Foreign Born, not a Citizen | 1,713 (88.9%) | 213 (11.1%) |
Health Insurance Coverage by Household Income in Laurel
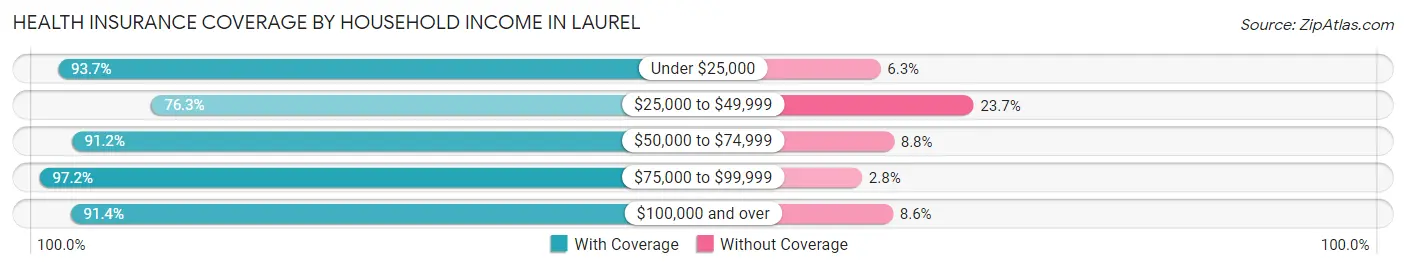
| Household Income | With Coverage | Without Coverage |
| Under $25,000 | 1,281 (93.7%) | 86 (6.3%) |
| $25,000 to $49,999 | 2,200 (76.3%) | 685 (23.7%) |
| $50,000 to $74,999 | 2,737 (91.2%) | 264 (8.8%) |
| $75,000 to $99,999 | 2,302 (97.2%) | 67 (2.8%) |
| $100,000 and over | 7,250 (91.4%) | 685 (8.6%) |
Public vs Private Health Insurance Coverage by Age in Laurel
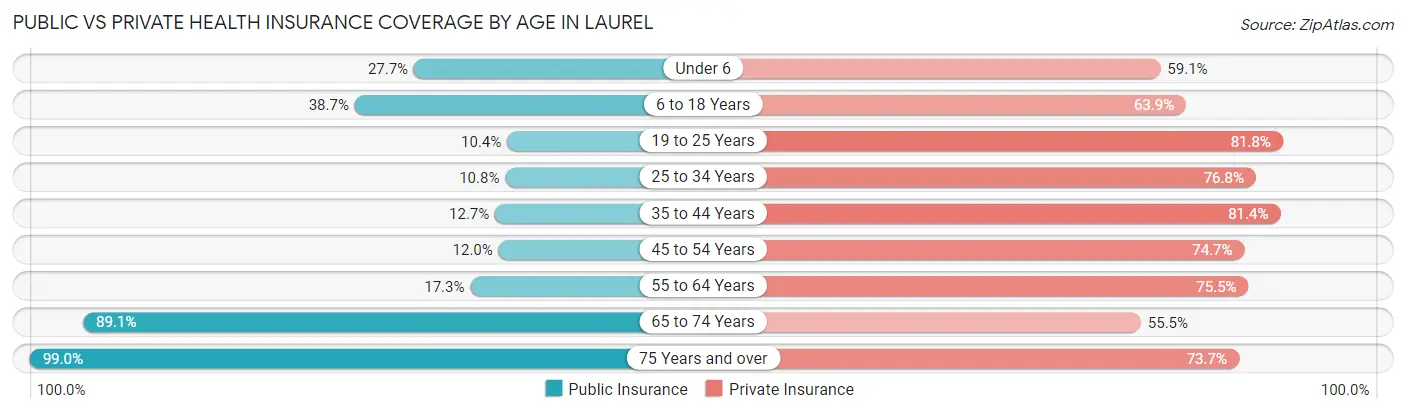
| Age Bracket | Public Insurance | Private Insurance |
| Under 6 | 361 (27.7%) | 770 (59.1%) |
| 6 to 18 Years | 953 (38.7%) | 1,572 (63.9%) |
| 19 to 25 Years | 201 (10.4%) | 1,576 (81.8%) |
| 25 to 34 Years | 340 (10.8%) | 2,420 (76.8%) |
| 35 to 44 Years | 278 (12.7%) | 1,786 (81.4%) |
| 45 to 54 Years | 252 (12.0%) | 1,566 (74.7%) |
| 55 to 64 Years | 397 (17.3%) | 1,735 (75.5%) |
| 65 to 74 Years | 1,108 (89.1%) | 690 (55.5%) |
| 75 Years and over | 929 (99.0%) | 691 (73.7%) |
| Total | 4,819 (27.4%) | 12,806 (72.7%) |
Disability Status by Sex by Age in Laurel
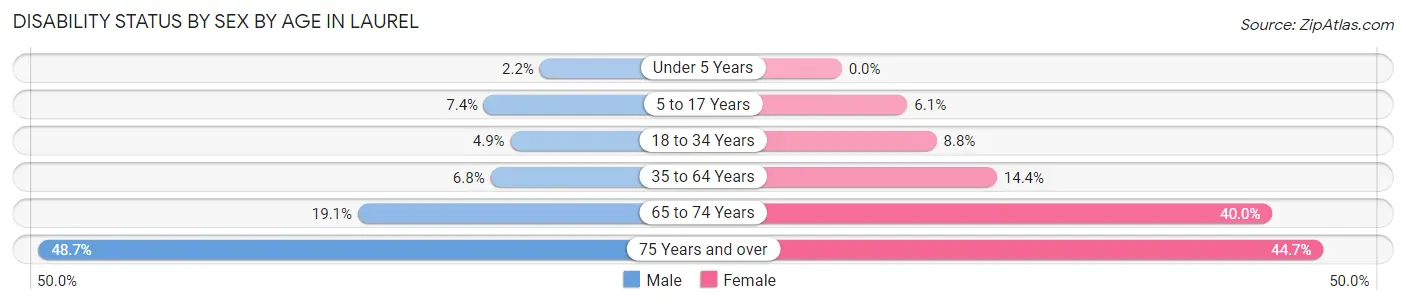
| Age Bracket | Male | Female |
| Under 5 Years | 12 (2.2%) | 0 (0.0%) |
| 5 to 17 Years | 86 (7.4%) | 75 (6.1%) |
| 18 to 34 Years | 136 (4.9%) | 221 (8.8%) |
| 35 to 64 Years | 221 (6.8%) | 478 (14.4%) |
| 65 to 74 Years | 90 (19.1%) | 308 (40.0%) |
| 75 Years and over | 132 (48.7%) | 298 (44.7%) |
Disability Class by Sex by Age in Laurel
Disability Class: Hearing Difficulty
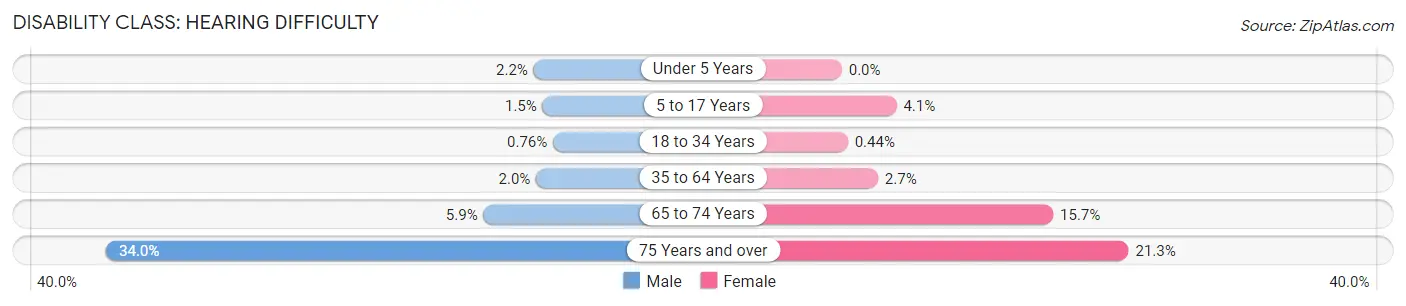
| Age Bracket | Male | Female |
| Under 5 Years | 12 (2.2%) | 0 (0.0%) |
| 5 to 17 Years | 18 (1.5%) | 50 (4.1%) |
| 18 to 34 Years | 21 (0.8%) | 11 (0.4%) |
| 35 to 64 Years | 66 (2.0%) | 89 (2.7%) |
| 65 to 74 Years | 28 (5.9%) | 121 (15.7%) |
| 75 Years and over | 92 (34.0%) | 142 (21.3%) |
Disability Class: Vision Difficulty
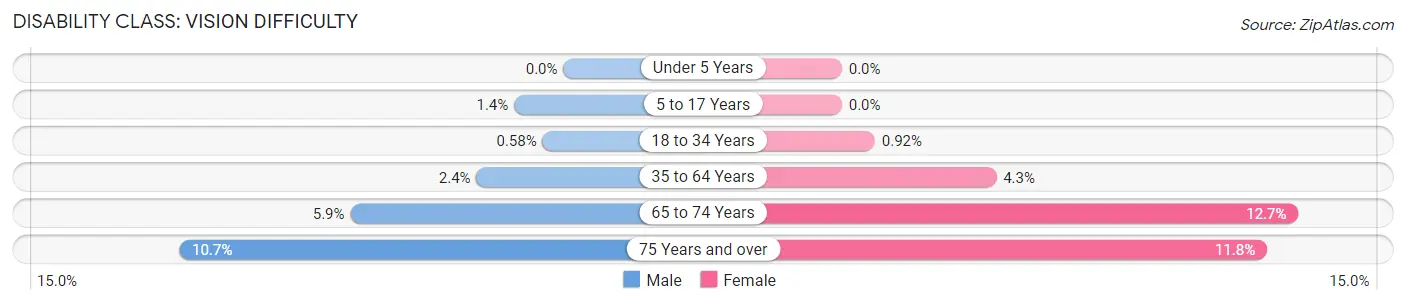
| Age Bracket | Male | Female |
| Under 5 Years | 0 (0.0%) | 0 (0.0%) |
| 5 to 17 Years | 16 (1.4%) | 0 (0.0%) |
| 18 to 34 Years | 16 (0.6%) | 23 (0.9%) |
| 35 to 64 Years | 79 (2.4%) | 143 (4.3%) |
| 65 to 74 Years | 28 (5.9%) | 98 (12.7%) |
| 75 Years and over | 29 (10.7%) | 79 (11.8%) |
Disability Class: Cognitive Difficulty
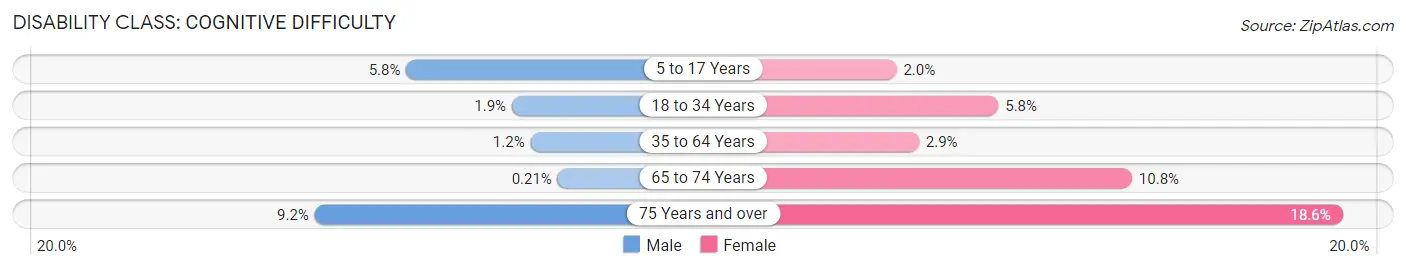
| Age Bracket | Male | Female |
| 5 to 17 Years | 68 (5.8%) | 25 (2.0%) |
| 18 to 34 Years | 53 (1.9%) | 146 (5.8%) |
| 35 to 64 Years | 40 (1.2%) | 95 (2.9%) |
| 65 to 74 Years | 1 (0.2%) | 83 (10.8%) |
| 75 Years and over | 25 (9.2%) | 124 (18.6%) |
Disability Class: Ambulatory Difficulty
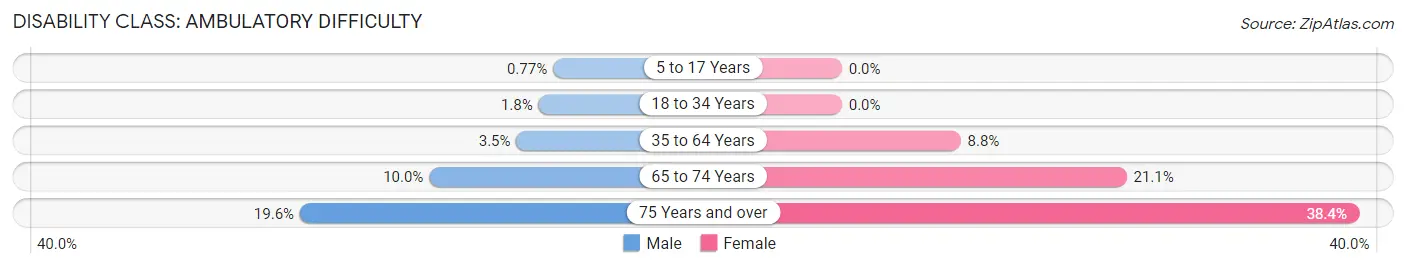
| Age Bracket | Male | Female |
| 5 to 17 Years | 9 (0.8%) | 0 (0.0%) |
| 18 to 34 Years | 51 (1.8%) | 0 (0.0%) |
| 35 to 64 Years | 114 (3.5%) | 293 (8.8%) |
| 65 to 74 Years | 47 (10.0%) | 163 (21.1%) |
| 75 Years and over | 53 (19.6%) | 256 (38.4%) |
Disability Class: Self-Care Difficulty
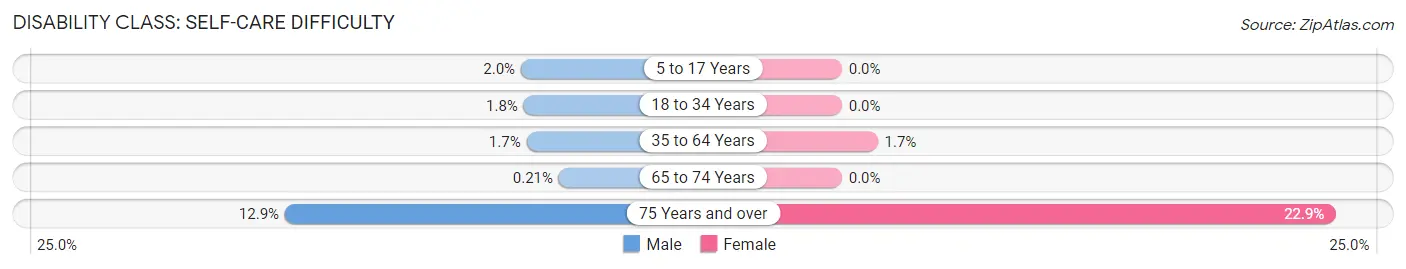
| Age Bracket | Male | Female |
| 5 to 17 Years | 23 (2.0%) | 0 (0.0%) |
| 18 to 34 Years | 51 (1.8%) | 0 (0.0%) |
| 35 to 64 Years | 56 (1.7%) | 55 (1.7%) |
| 65 to 74 Years | 1 (0.2%) | 0 (0.0%) |
| 75 Years and over | 35 (12.9%) | 153 (22.9%) |
Technology Access in Laurel
Computing Device Access in Laurel
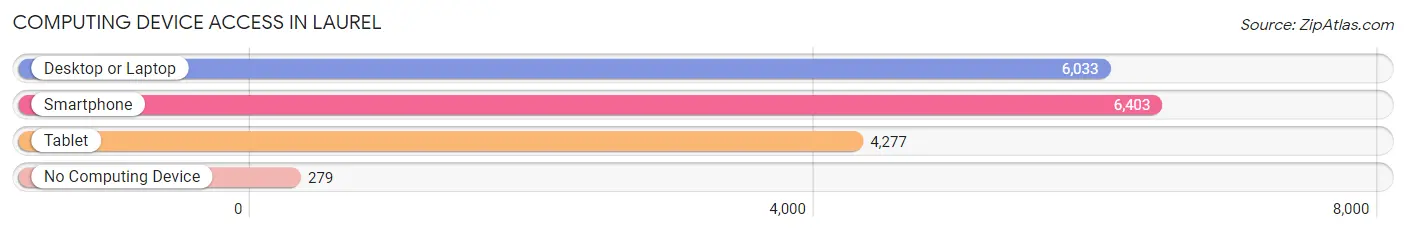
| Device Type | # Households | % Households |
| Desktop or Laptop | 6,033 | 84.3% |
| Smartphone | 6,403 | 89.4% |
| Tablet | 4,277 | 59.8% |
| No Computing Device | 279 | 3.9% |
| Total | 7,158 | 100.0% |
Internet Access in Laurel
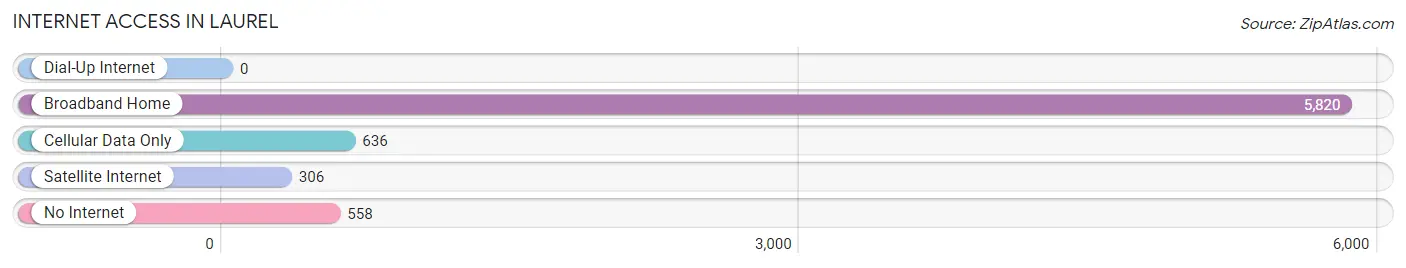
| Internet Type | # Households | % Households |
| Dial-Up Internet | 0 | 0.0% |
| Broadband Home | 5,820 | 81.3% |
| Cellular Data Only | 636 | 8.9% |
| Satellite Internet | 306 | 4.3% |
| No Internet | 558 | 7.8% |
| Total | 7,158 | 100.0% |
Laurel Summary
Laurel, Virginia is a small town located in the northern part of the state, about 30 miles from Washington, D.C. It is part of the Washington metropolitan area and is situated in the foothills of the Blue Ridge Mountains. The town has a population of about 5,000 people and is known for its rural charm and small-town atmosphere.
History
Laurel was first settled in the late 1700s by a group of Quakers from Pennsylvania. The town was originally known as “Laurel Hill” and was incorporated in 1810. The town was named after the laurel trees that grew in abundance in the area.
In the early 1800s, the town was a major stop on the stagecoach route between Washington, D.C. and Winchester, Virginia. The town was also a major stop on the Manassas Gap Railroad, which connected the Shenandoah Valley to the Potomac River.
During the Civil War, Laurel was the site of several battles, including the Battle of Cedar Creek in October 1864. After the war, the town experienced a period of growth and prosperity. In the late 1800s, the town was home to several factories, including a woolen mill, a flour mill, and a canning factory.
Geography
Laurel is located in the northern part of Virginia, about 30 miles from Washington, D.C. The town is situated in the foothills of the Blue Ridge Mountains and is surrounded by rolling hills and lush forests. The town is located on the banks of the Shenandoah River and is close to several state parks, including Shenandoah National Park and George Washington National Forest.
The climate in Laurel is temperate, with hot summers and cold winters. The average temperature in the summer is around 80 degrees Fahrenheit, while the average temperature in the winter is around 40 degrees Fahrenheit.
Economy
The economy of Laurel is largely based on agriculture and tourism. The town is home to several farms, including dairy farms, beef farms, and vegetable farms. The town is also home to several wineries and breweries, as well as several restaurants and shops.
The town is also home to several small businesses, including a furniture store, a hardware store, and a grocery store. The town is also home to several professional services, including a law firm, an accounting firm, and a real estate agency.
Demographics
As of the 2010 census, the population of Laurel was 5,073. The racial makeup of the town was 87.3% White, 8.2% African American, 0.7% Native American, 0.7% Asian, 0.1% Pacific Islander, and 2.9% from other races. The median household income in the town was $50,945, and the median family income was $60,945.
The town is home to several churches, including the Laurel United Methodist Church, the Laurel Baptist Church, and the Laurel Presbyterian Church. The town is also home to several schools, including Laurel Elementary School, Laurel Middle School, and Laurel High School.
Common Questions
What is Per Capita Income in Laurel?
Per Capita income in Laurel is $35,155.
What is the Median Family Income in Laurel?
Median Family Income in Laurel is $91,148.
What is the Median Household income in Laurel?
Median Household Income in Laurel is $67,988.
What is Income or Wage Gap in Laurel?
Income or Wage Gap in Laurel is 18.1%.
Women in Laurel earn 81.9 cents for every dollar earned by a man.
What is Inequality or Gini Index in Laurel?
Inequality or Gini Index in Laurel is 0.39.
What is the Total Population of Laurel?
Total Population of Laurel is 18,480.
What is the Total Male Population of Laurel?
Total Male Population of Laurel is 9,110.
What is the Total Female Population of Laurel?
Total Female Population of Laurel is 9,370.
What is the Ratio of Males per 100 Females in Laurel?
There are 97.23 Males per 100 Females in Laurel.
What is the Ratio of Females per 100 Males in Laurel?
There are 102.85 Females per 100 Males in Laurel.
What is the Median Population Age in Laurel?
Median Population Age in Laurel is 35.1 Years.
What is the Average Family Size in Laurel
Average Family Size in Laurel is 3.2 People.
What is the Average Household Size in Laurel
Average Household Size in Laurel is 2.5 People.
How Large is the Labor Force in Laurel?
There are 11,161 People in the Labor Forcein in Laurel.
What is the Percentage of People in the Labor Force in Laurel?
72.7% of People are in the Labor Force in Laurel.
What is the Unemployment Rate in Laurel?
Unemployment Rate in Laurel is 4.1%.