Kings Park, VA Map & Demographics
Kings Park Map
Kings Park Overview
$57,703
PER CAPITA INCOME
$157,426
AVG FAMILY INCOME
$146,583
AVG HOUSEHOLD INCOME
1.1%
WAGE / INCOME GAP [ % ]
98.9¢/ $1
WAGE / INCOME GAP [ $ ]
0.31
INEQUALITY / GINI INDEX
4,003
TOTAL POPULATION
1,937
MALE POPULATION
2,066
FEMALE POPULATION
93.76
MALES / 100 FEMALES
106.66
FEMALES / 100 MALES
45.5
MEDIAN AGE
3.1
AVG FAMILY SIZE
2.9
AVG HOUSEHOLD SIZE
2,306
LABOR FORCE [ PEOPLE ]
68.4%
PERCENT IN LABOR FORCE
4.8%
UNEMPLOYMENT RATE
Income in Kings Park
Income Overview in Kings Park
Per Capita Income in Kings Park is $57,703, while median incomes of families and households are $157,426 and $146,583 respectively.
| Characteristic | Number | Measure |
| Per Capita Income | 4,003 | $57,703 |
| Median Family Income | 1,153 | $157,426 |
| Mean Family Income | 1,153 | $175,964 |
| Median Household Income | 1,396 | $146,583 |
| Mean Household Income | 1,396 | $166,431 |
| Income Deficit | 1,153 | $0 |
| Wage / Income Gap (%) | 4,003 | 1.15% |
| Wage / Income Gap ($) | 4,003 | 98.85¢ per $1 |
| Gini / Inequality Index | 4,003 | 0.31 |
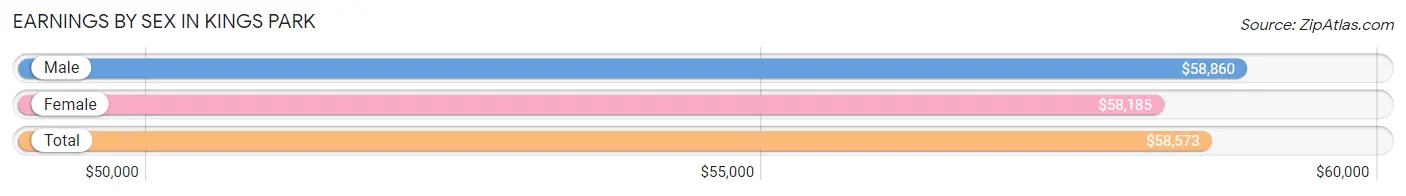
Earnings by Sex in Kings Park
Average Earnings in Kings Park are $58,573, $58,860 for men and $58,185 for women, a difference of 1.1%.
| Sex | Number | Average Earnings |
| Male | 1,098 (47.1%) | $58,860 |
| Female | 1,231 (52.9%) | $58,185 |
| Total | 2,329 (100.0%) | $58,573 |
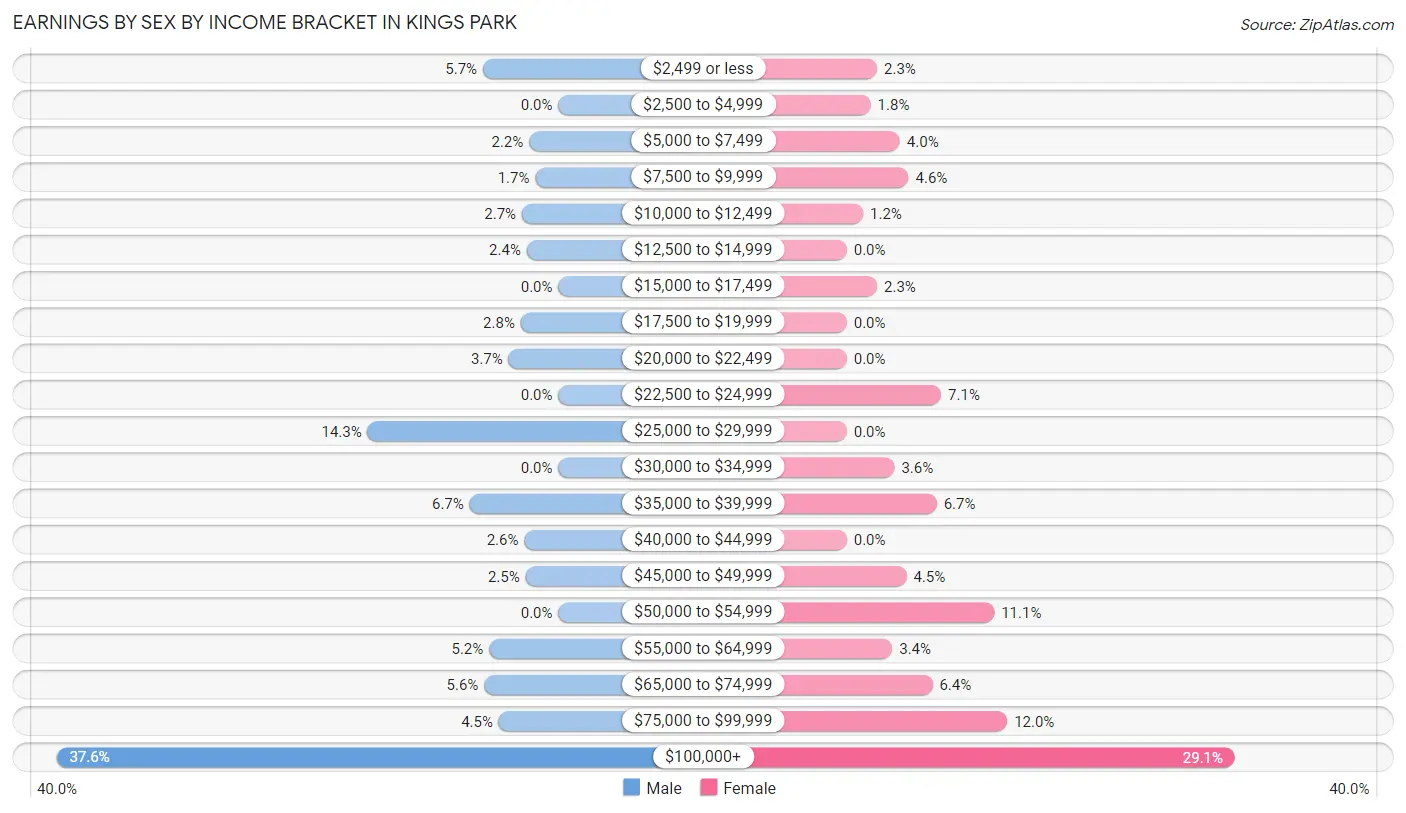
Earnings by Sex by Income Bracket in Kings Park
The most common earnings brackets in Kings Park are $100,000+ for men (413 | 37.6%) and $100,000+ for women (358 | 29.1%).
| Income | Male | Female |
| $2,499 or less | 62 (5.7%) | 28 (2.3%) |
| $2,500 to $4,999 | 0 (0.0%) | 22 (1.8%) |
| $5,000 to $7,499 | 24 (2.2%) | 49 (4.0%) |
| $7,500 to $9,999 | 19 (1.7%) | 57 (4.6%) |
| $10,000 to $12,499 | 30 (2.7%) | 15 (1.2%) |
| $12,500 to $14,999 | 26 (2.4%) | 0 (0.0%) |
| $15,000 to $17,499 | 0 (0.0%) | 28 (2.3%) |
| $17,500 to $19,999 | 31 (2.8%) | 0 (0.0%) |
| $20,000 to $22,499 | 41 (3.7%) | 0 (0.0%) |
| $22,500 to $24,999 | 0 (0.0%) | 87 (7.1%) |
| $25,000 to $29,999 | 157 (14.3%) | 0 (0.0%) |
| $30,000 to $34,999 | 0 (0.0%) | 44 (3.6%) |
| $35,000 to $39,999 | 73 (6.7%) | 83 (6.7%) |
| $40,000 to $44,999 | 28 (2.5%) | 0 (0.0%) |
| $45,000 to $49,999 | 27 (2.5%) | 55 (4.5%) |
| $50,000 to $54,999 | 0 (0.0%) | 136 (11.1%) |
| $55,000 to $64,999 | 57 (5.2%) | 42 (3.4%) |
| $65,000 to $74,999 | 61 (5.6%) | 79 (6.4%) |
| $75,000 to $99,999 | 49 (4.5%) | 148 (12.0%) |
| $100,000+ | 413 (37.6%) | 358 (29.1%) |
| Total | 1,098 (100.0%) | 1,231 (100.0%) |
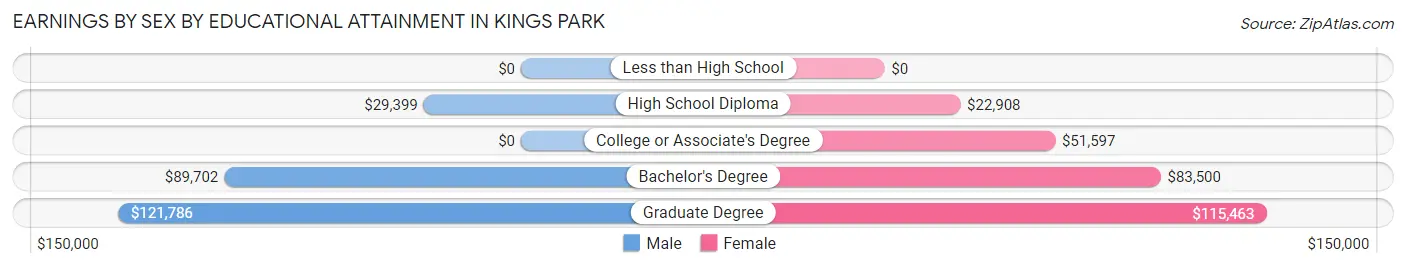
Earnings by Sex by Educational Attainment in Kings Park
Average earnings in Kings Park are $66,118 for men and $67,981 for women, a difference of 2.7%. Men with an educational attainment of graduate degree enjoy the highest average annual earnings of $121,786, while those with high school diploma education earn the least with $29,399. Women with an educational attainment of graduate degree earn the most with the average annual earnings of $115,463, while those with high school diploma education have the smallest earnings of $22,908.
| Educational Attainment | Male Income | Female Income |
| Less than High School | - | - |
| High School Diploma | $29,399 | $22,908 |
| College or Associate's Degree | - | - |
| Bachelor's Degree | $89,702 | $83,500 |
| Graduate Degree | $121,786 | $115,463 |
| Total | $66,118 | $67,981 |
Family Income in Kings Park
Family Income Brackets in Kings Park
According to the Kings Park family income data, there are 455 families falling into the $200,000+ income range, which is the most common income bracket and makes up 39.5% of all families.
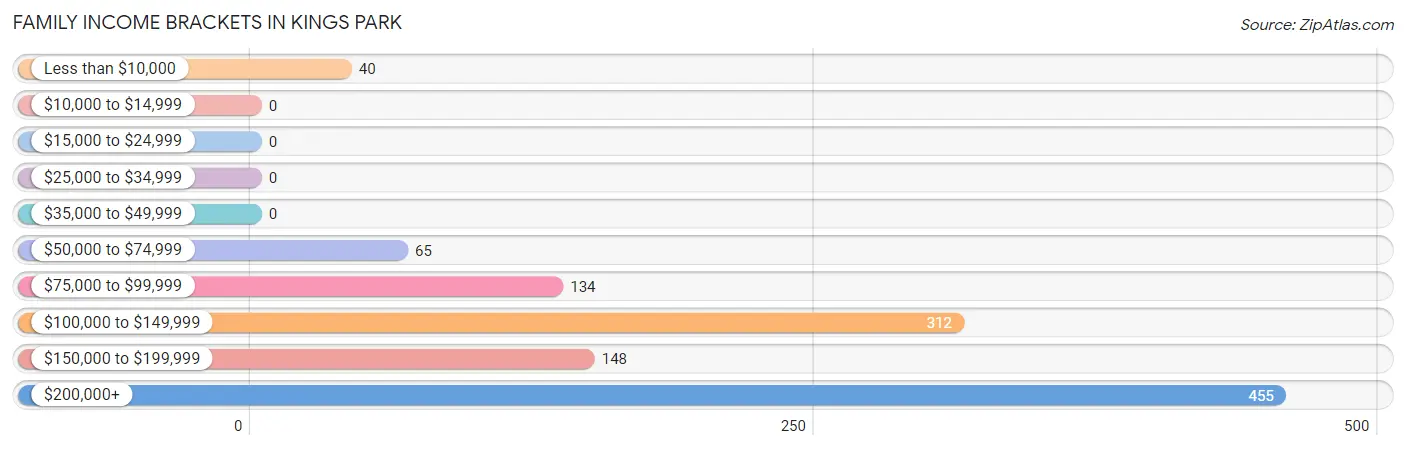
| Income Bracket | # Families | % Families |
| Less than $10,000 | 40 | 3.5% |
| $10,000 to $14,999 | 0 | 0.0% |
| $15,000 to $24,999 | 0 | 0.0% |
| $25,000 to $34,999 | 0 | 0.0% |
| $35,000 to $49,999 | 0 | 0.0% |
| $50,000 to $74,999 | 65 | 5.6% |
| $75,000 to $99,999 | 134 | 11.6% |
| $100,000 to $149,999 | 312 | 27.1% |
| $150,000 to $199,999 | 148 | 12.8% |
| $200,000+ | 455 | 39.5% |
Family Income by Famaliy Size in Kings Park
4-person families (242 | 21.0%) account for the highest median family income in Kings Park with $242,679 per family, while 2-person families (529 | 45.9%) have the highest median income of $68,392 per family member.
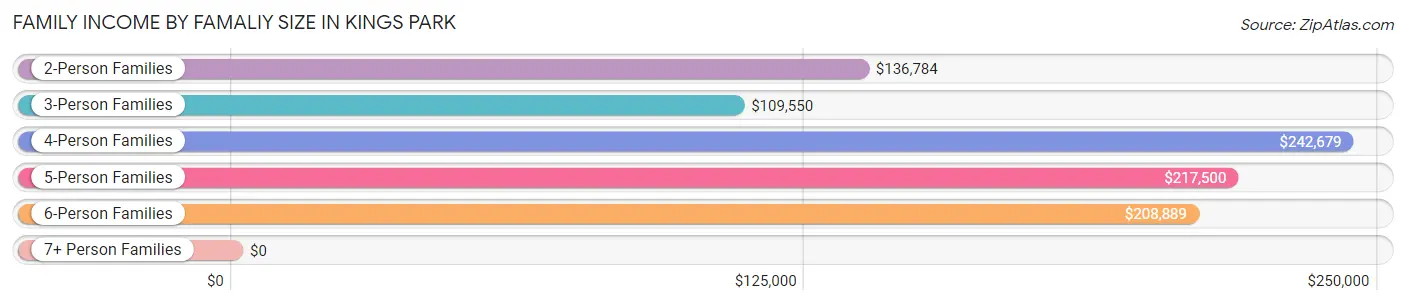
| Income Bracket | # Families | Median Income |
| 2-Person Families | 529 (45.9%) | $136,784 |
| 3-Person Families | 271 (23.5%) | $109,550 |
| 4-Person Families | 242 (21.0%) | $242,679 |
| 5-Person Families | 44 (3.8%) | $217,500 |
| 6-Person Families | 58 (5.0%) | $208,889 |
| 7+ Person Families | 9 (0.8%) | $0 |
| Total | 1,153 (100.0%) | $157,426 |
Family Income by Number of Earners in Kings Park
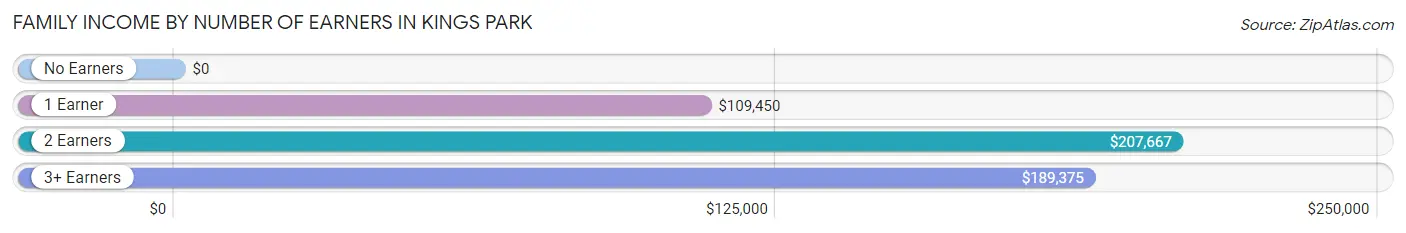
| Number of Earners | # Families | Median Income |
| No Earners | 85 (7.4%) | $0 |
| 1 Earner | 347 (30.1%) | $109,450 |
| 2 Earners | 572 (49.6%) | $207,667 |
| 3+ Earners | 149 (12.9%) | $189,375 |
| Total | 1,153 (100.0%) | $157,426 |
Household Income in Kings Park
Household Income Brackets in Kings Park
With 480 households falling in the category, the $200,000+ income range is the most frequent in Kings Park, accounting for 34.4% of all households.
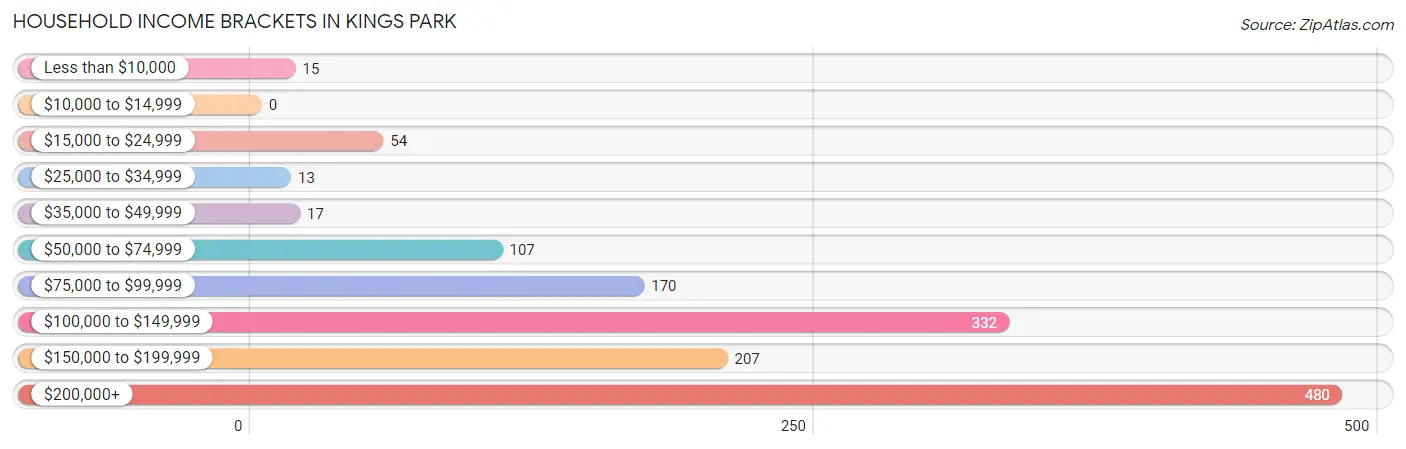
| Income Bracket | # Households | % Households |
| Less than $10,000 | 15 | 1.1% |
| $10,000 to $14,999 | 0 | 0.0% |
| $15,000 to $24,999 | 54 | 3.9% |
| $25,000 to $34,999 | 13 | 0.9% |
| $35,000 to $49,999 | 17 | 1.2% |
| $50,000 to $74,999 | 107 | 7.7% |
| $75,000 to $99,999 | 170 | 12.2% |
| $100,000 to $149,999 | 332 | 23.8% |
| $150,000 to $199,999 | 207 | 14.8% |
| $200,000+ | 480 | 34.4% |
Household Income by Householder Age in Kings Park
The median household income in Kings Park is $146,583, with the highest median household income of $184,643 found in the 45 to 64 years age bracket for the primary householder. A total of 382 households (27.4%) fall into this category. Meanwhile, the 15 to 24 years age bracket for the primary householder has the lowest median household income of $0, with 36 households (2.6%) in this group.
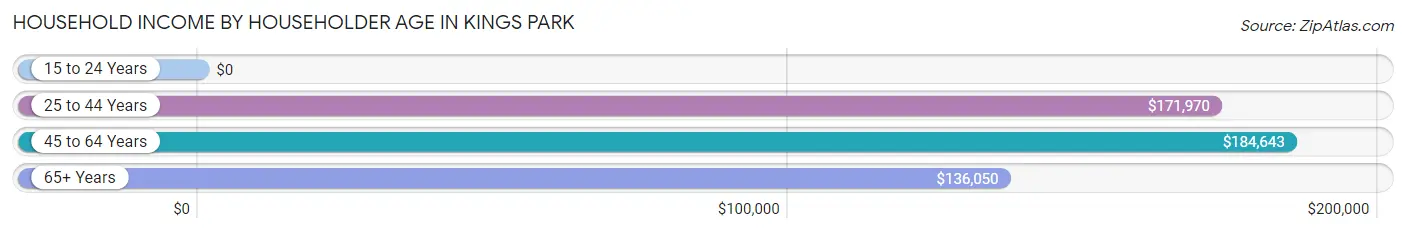
| Income Bracket | # Households | Median Income |
| 15 to 24 Years | 36 (2.6%) | $0 |
| 25 to 44 Years | 362 (25.9%) | $171,970 |
| 45 to 64 Years | 382 (27.4%) | $184,643 |
| 65+ Years | 616 (44.1%) | $136,050 |
| Total | 1,396 (100.0%) | $146,583 |
Poverty in Kings Park
Income Below Poverty by Sex and Age in Kings Park
With 3.7% poverty level for males and 6.4% for females among the residents of Kings Park, 45 to 54 year old males and 18 to 24 year old females are the most vulnerable to poverty, with 40 males (15.8%) and 55 females (41.7%) in their respective age groups living below the poverty level.
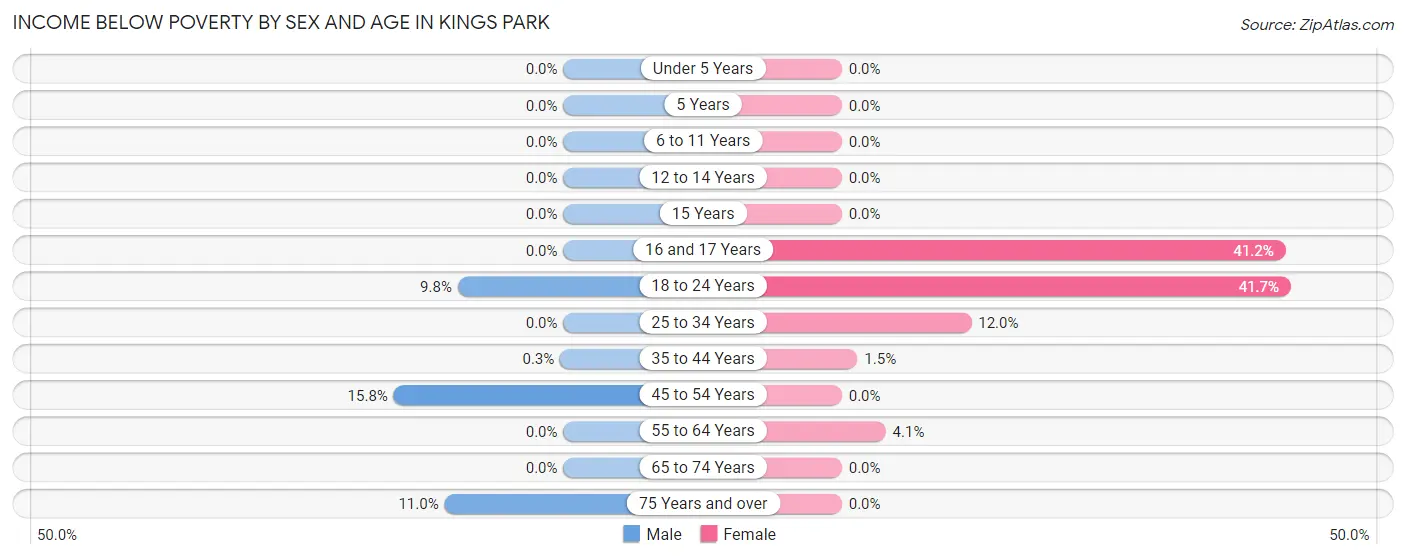
| Age Bracket | Male | Female |
| Under 5 Years | 0 (0.0%) | 0 (0.0%) |
| 5 Years | 0 (0.0%) | 0 (0.0%) |
| 6 to 11 Years | 0 (0.0%) | 0 (0.0%) |
| 12 to 14 Years | 0 (0.0%) | 0 (0.0%) |
| 15 Years | 0 (0.0%) | 0 (0.0%) |
| 16 and 17 Years | 0 (0.0%) | 42 (41.2%) |
| 18 to 24 Years | 15 (9.8%) | 55 (41.7%) |
| 25 to 34 Years | 0 (0.0%) | 22 (12.0%) |
| 35 to 44 Years | 1 (0.3%) | 4 (1.5%) |
| 45 to 54 Years | 40 (15.8%) | 0 (0.0%) |
| 55 to 64 Years | 0 (0.0%) | 9 (4.1%) |
| 65 to 74 Years | 0 (0.0%) | 0 (0.0%) |
| 75 Years and over | 16 (11.0%) | 0 (0.0%) |
| Total | 72 (3.7%) | 132 (6.4%) |
Income Above Poverty by Sex and Age in Kings Park
According to the poverty statistics in Kings Park, males aged under 5 years and females aged under 5 years are the age groups that are most secure financially, with 100.0% of males and 100.0% of females in these age groups living above the poverty line.
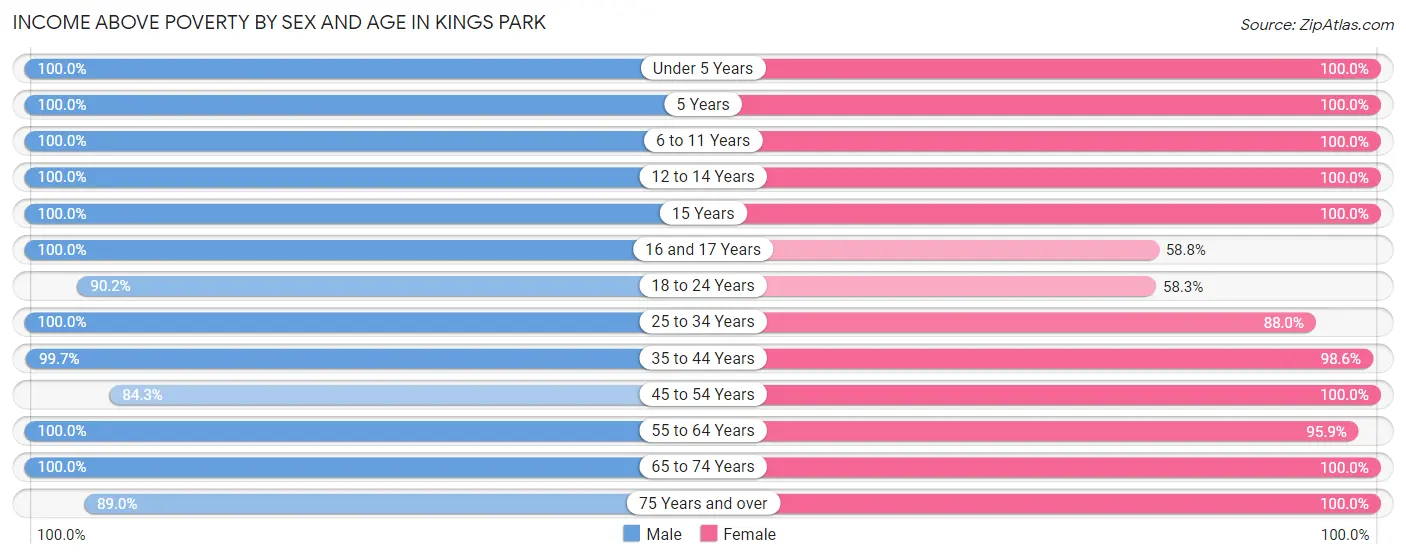
| Age Bracket | Male | Female |
| Under 5 Years | 45 (100.0%) | 130 (100.0%) |
| 5 Years | 25 (100.0%) | 17 (100.0%) |
| 6 to 11 Years | 130 (100.0%) | 109 (100.0%) |
| 12 to 14 Years | 83 (100.0%) | 59 (100.0%) |
| 15 Years | 5 (100.0%) | 29 (100.0%) |
| 16 and 17 Years | 63 (100.0%) | 60 (58.8%) |
| 18 to 24 Years | 138 (90.2%) | 77 (58.3%) |
| 25 to 34 Years | 113 (100.0%) | 161 (88.0%) |
| 35 to 44 Years | 327 (99.7%) | 272 (98.6%) |
| 45 to 54 Years | 214 (84.3%) | 278 (100.0%) |
| 55 to 64 Years | 228 (100.0%) | 212 (95.9%) |
| 65 to 74 Years | 365 (100.0%) | 377 (100.0%) |
| 75 Years and over | 129 (89.0%) | 153 (100.0%) |
| Total | 1,865 (96.3%) | 1,934 (93.6%) |
Income Below Poverty Among Married-Couple Families in Kings Park
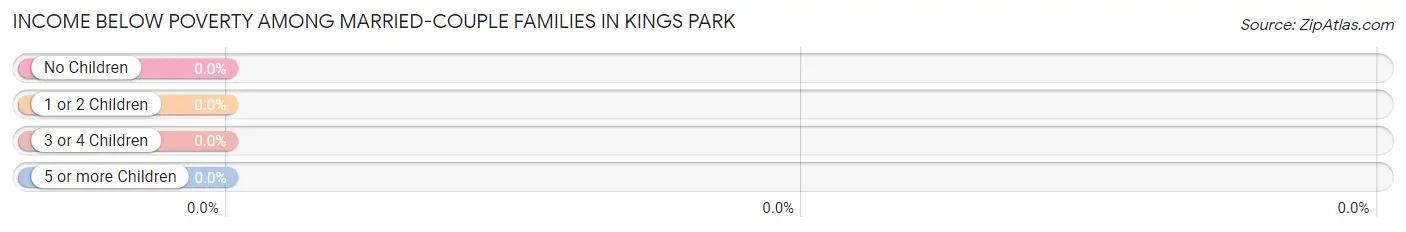
| Children | Above Poverty | Below Poverty |
| No Children | 577 (100.0%) | 0 (0.0%) |
| 1 or 2 Children | 281 (100.0%) | 0 (0.0%) |
| 3 or 4 Children | 59 (100.0%) | 0 (0.0%) |
| 5 or more Children | 0 (0.0%) | 0 (0.0%) |
| Total | 917 (100.0%) | 0 (0.0%) |
Income Below Poverty Among Single-Parent Households in Kings Park
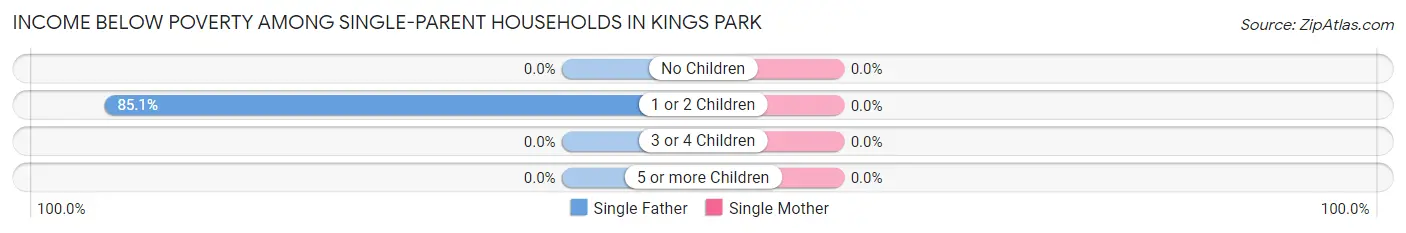
| Children | Single Father | Single Mother |
| No Children | 0 (0.0%) | 0 (0.0%) |
| 1 or 2 Children | 40 (85.1%) | 0 (0.0%) |
| 3 or 4 Children | 0 (0.0%) | 0 (0.0%) |
| 5 or more Children | 0 (0.0%) | 0 (0.0%) |
| Total | 40 (35.7%) | 0 (0.0%) |
Income Below Poverty Among Married-Couple vs Single-Parent Households in Kings Park
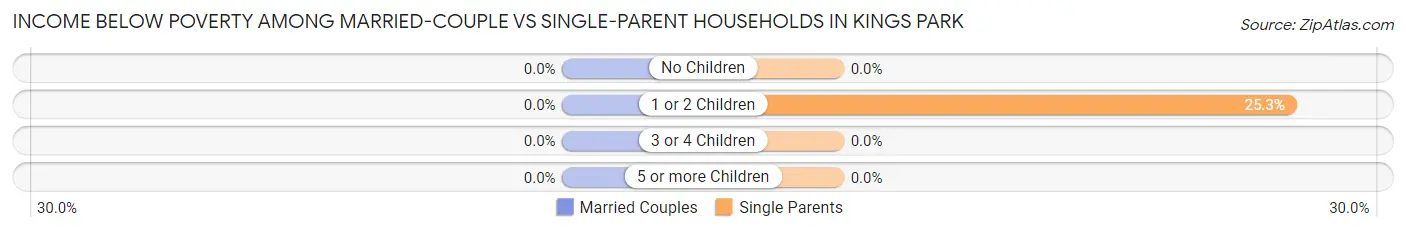
| Children | Married-Couple Families | Single-Parent Households |
| No Children | 0 (0.0%) | 0 (0.0%) |
| 1 or 2 Children | 0 (0.0%) | 40 (25.3%) |
| 3 or 4 Children | 0 (0.0%) | 0 (0.0%) |
| 5 or more Children | 0 (0.0%) | 0 (0.0%) |
| Total | 0 (0.0%) | 40 (17.0%) |
Race in Kings Park
The most populous races in Kings Park are White / Caucasian (2,713 | 67.8%), Asian (810 | 20.2%), and Hispanic or Latino (677 | 16.9%).
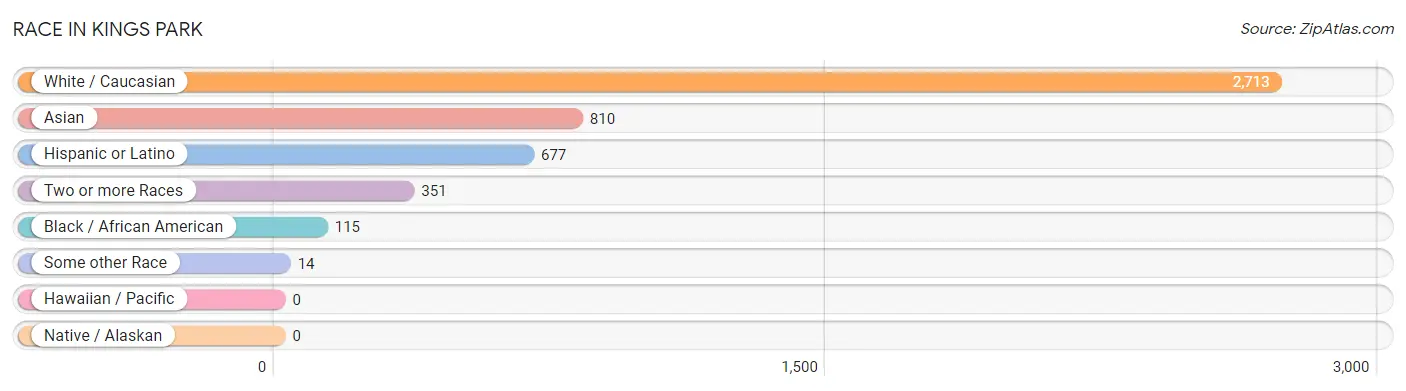
| Race | # Population | % Population |
| Asian | 810 | 20.2% |
| Black / African American | 115 | 2.9% |
| Hawaiian / Pacific | 0 | 0.0% |
| Hispanic or Latino | 677 | 16.9% |
| Native / Alaskan | 0 | 0.0% |
| White / Caucasian | 2,713 | 67.8% |
| Two or more Races | 351 | 8.8% |
| Some other Race | 14 | 0.4% |
| Total | 4,003 | 100.0% |
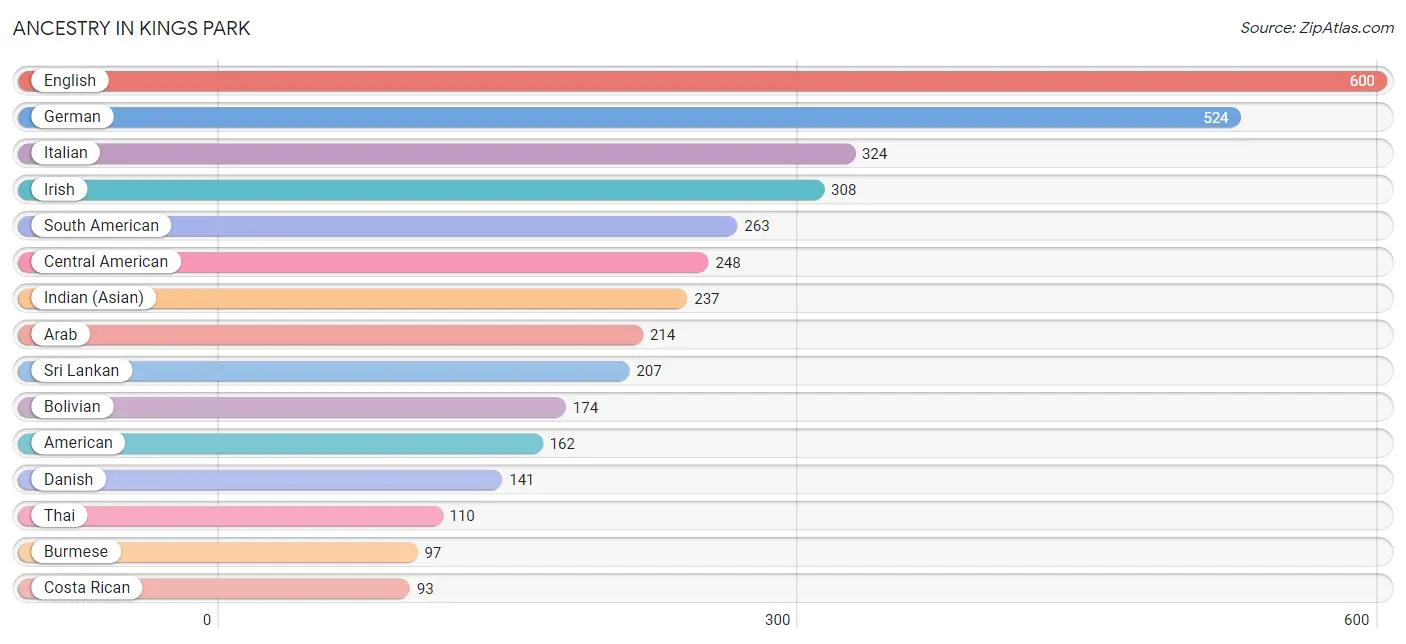
Ancestry in Kings Park
The most populous ancestries reported in Kings Park are English (600 | 15.0%), German (524 | 13.1%), Italian (324 | 8.1%), Irish (308 | 7.7%), and South American (263 | 6.6%), together accounting for 50.4% of all Kings Park residents.
| Ancestry | # Population | % Population |
| Afghan | 49 | 1.2% |
| American | 162 | 4.1% |
| Arab | 214 | 5.3% |
| Austrian | 17 | 0.4% |
| Belgian | 40 | 1.0% |
| Bhutanese | 41 | 1.0% |
| Bolivian | 174 | 4.3% |
| Burmese | 97 | 2.4% |
| Canadian | 10 | 0.3% |
| Central American | 248 | 6.2% |
| Costa Rican | 93 | 2.3% |
| Czech | 14 | 0.4% |
| Czechoslovakian | 19 | 0.5% |
| Danish | 141 | 3.5% |
| Dutch | 71 | 1.8% |
| Eastern European | 43 | 1.1% |
| Ecuadorian | 40 | 1.0% |
| English | 600 | 15.0% |
| European | 76 | 1.9% |
| French | 45 | 1.1% |
| French Canadian | 52 | 1.3% |
| German | 524 | 13.1% |
| Greek | 34 | 0.9% |
| Guatemalan | 50 | 1.3% |
| Honduran | 72 | 1.8% |
| Indian (Asian) | 237 | 5.9% |
| Iranian | 67 | 1.7% |
| Iraqi | 87 | 2.2% |
| Irish | 308 | 7.7% |
| Italian | 324 | 8.1% |
| Jamaican | 24 | 0.6% |
| Japanese | 21 | 0.5% |
| Korean | 21 | 0.5% |
| Lebanese | 30 | 0.7% |
| Malaysian | 9 | 0.2% |
| Mexican | 70 | 1.8% |
| Northern European | 35 | 0.9% |
| Norwegian | 13 | 0.3% |
| Pakistani | 54 | 1.3% |
| Peruvian | 49 | 1.2% |
| Polish | 80 | 2.0% |
| Portuguese | 62 | 1.5% |
| Puerto Rican | 64 | 1.6% |
| Salvadoran | 33 | 0.8% |
| Scandinavian | 15 | 0.4% |
| Scotch-Irish | 20 | 0.5% |
| Scottish | 44 | 1.1% |
| Sioux | 24 | 0.6% |
| Slovak | 29 | 0.7% |
| South American | 263 | 6.6% |
| Spaniard | 32 | 0.8% |
| Sri Lankan | 207 | 5.2% |
| Swedish | 16 | 0.4% |
| Swiss | 60 | 1.5% |
| Thai | 110 | 2.8% |
| Welsh | 40 | 1.0% | View All 56 Rows |
Immigrants in Kings Park
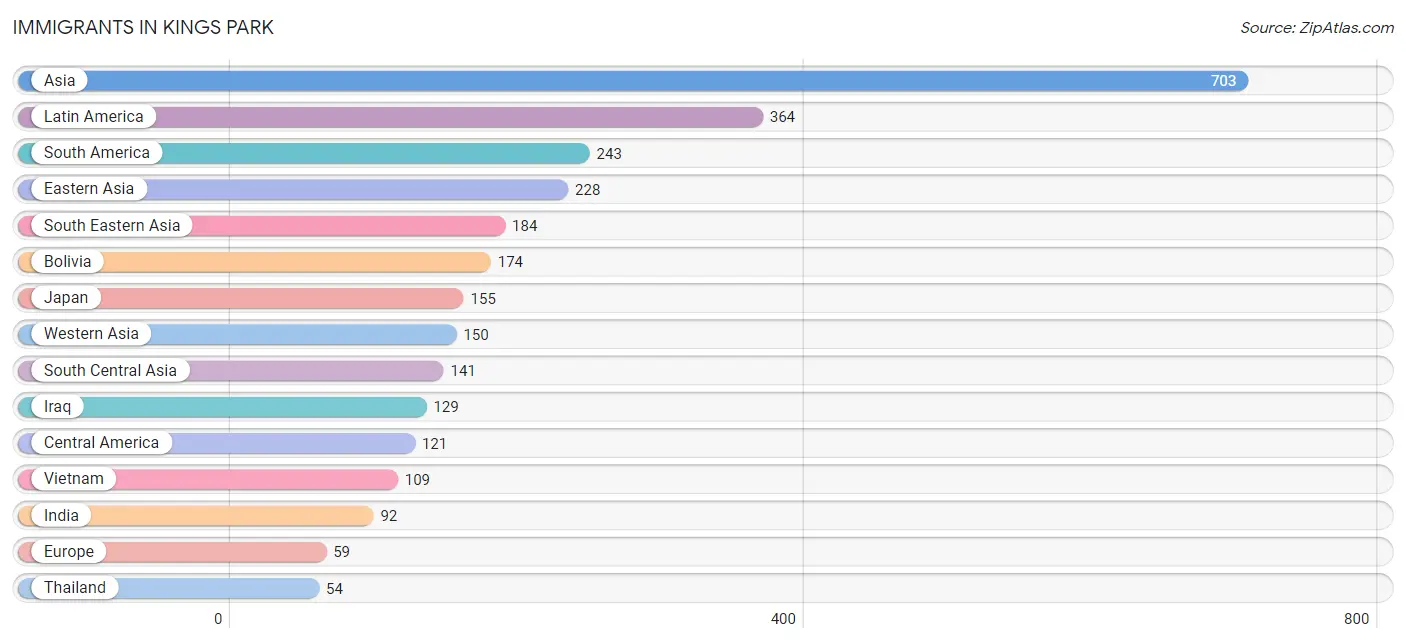
The most numerous immigrant groups reported in Kings Park came from Asia (703 | 17.6%), Latin America (364 | 9.1%), South America (243 | 6.1%), Eastern Asia (228 | 5.7%), and South Eastern Asia (184 | 4.6%), together accounting for 43.0% of all Kings Park residents.
| Immigration Origin | # Population | % Population |
| Afghanistan | 23 | 0.6% |
| Asia | 703 | 17.6% |
| Bolivia | 174 | 4.3% |
| Bosnia and Herzegovina | 15 | 0.4% |
| Brazil | 20 | 0.5% |
| Cambodia | 21 | 0.5% |
| Central America | 121 | 3.0% |
| China | 43 | 1.1% |
| Eastern Asia | 228 | 5.7% |
| Eastern Europe | 15 | 0.4% |
| El Salvador | 33 | 0.8% |
| Europe | 59 | 1.5% |
| Greece | 25 | 0.6% |
| Guatemala | 50 | 1.3% |
| Honduras | 38 | 0.9% |
| India | 92 | 2.3% |
| Iran | 26 | 0.6% |
| Iraq | 129 | 3.2% |
| Italy | 19 | 0.5% |
| Japan | 155 | 3.9% |
| Jordan | 21 | 0.5% |
| Korea | 30 | 0.7% |
| Latin America | 364 | 9.1% |
| Peru | 49 | 1.2% |
| South America | 243 | 6.1% |
| South Central Asia | 141 | 3.5% |
| South Eastern Asia | 184 | 4.6% |
| Southern Europe | 44 | 1.1% |
| Thailand | 54 | 1.3% |
| Vietnam | 109 | 2.7% |
| Western Asia | 150 | 3.7% | View All 31 Rows |
Sex and Age in Kings Park
Sex and Age in Kings Park
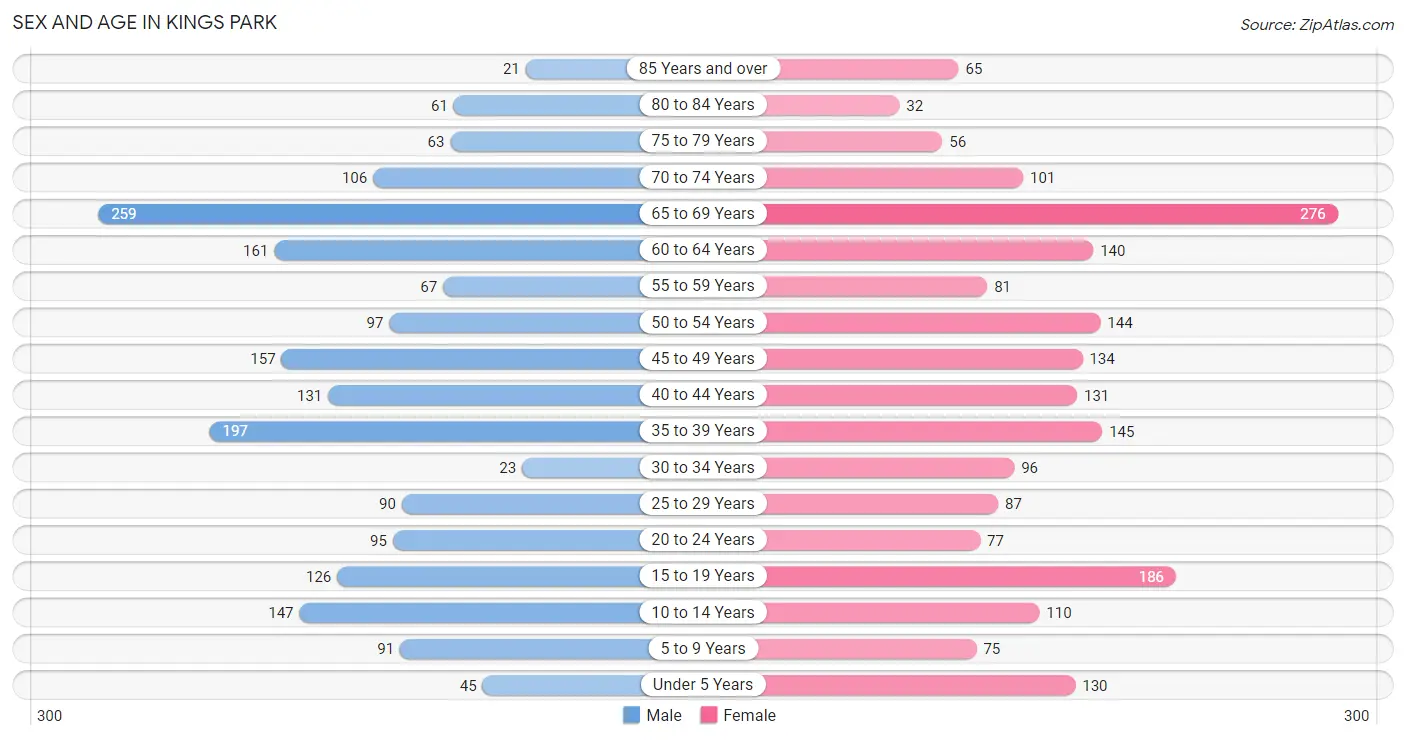
The most populous age groups in Kings Park are 65 to 69 Years (259 | 13.4%) for men and 65 to 69 Years (276 | 13.4%) for women.
| Age Bracket | Male | Female |
| Under 5 Years | 45 (2.3%) | 130 (6.3%) |
| 5 to 9 Years | 91 (4.7%) | 75 (3.6%) |
| 10 to 14 Years | 147 (7.6%) | 110 (5.3%) |
| 15 to 19 Years | 126 (6.5%) | 186 (9.0%) |
| 20 to 24 Years | 95 (4.9%) | 77 (3.7%) |
| 25 to 29 Years | 90 (4.6%) | 87 (4.2%) |
| 30 to 34 Years | 23 (1.2%) | 96 (4.6%) |
| 35 to 39 Years | 197 (10.2%) | 145 (7.0%) |
| 40 to 44 Years | 131 (6.8%) | 131 (6.3%) |
| 45 to 49 Years | 157 (8.1%) | 134 (6.5%) |
| 50 to 54 Years | 97 (5.0%) | 144 (7.0%) |
| 55 to 59 Years | 67 (3.5%) | 81 (3.9%) |
| 60 to 64 Years | 161 (8.3%) | 140 (6.8%) |
| 65 to 69 Years | 259 (13.4%) | 276 (13.4%) |
| 70 to 74 Years | 106 (5.5%) | 101 (4.9%) |
| 75 to 79 Years | 63 (3.3%) | 56 (2.7%) |
| 80 to 84 Years | 61 (3.2%) | 32 (1.5%) |
| 85 Years and over | 21 (1.1%) | 65 (3.2%) |
| Total | 1,937 (100.0%) | 2,066 (100.0%) |
Families and Households in Kings Park
Median Family Size in Kings Park
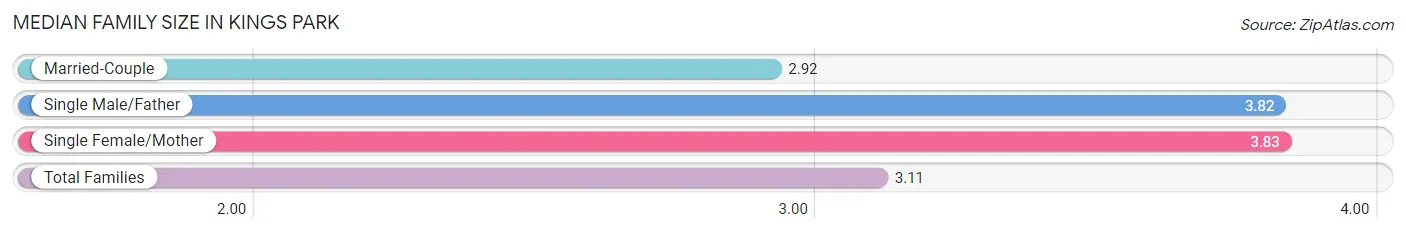
The median family size in Kings Park is 3.11 persons per family, with single female/mother families (124 | 10.7%) accounting for the largest median family size of 3.83 persons per family. On the other hand, married-couple families (917 | 79.5%) represent the smallest median family size with 2.92 persons per family.
| Family Type | # Families | Family Size |
| Married-Couple | 917 (79.5%) | 2.92 |
| Single Male/Father | 112 (9.7%) | 3.82 |
| Single Female/Mother | 124 (10.7%) | 3.83 |
| Total Families | 1,153 (100.0%) | 3.11 |
Median Household Size in Kings Park
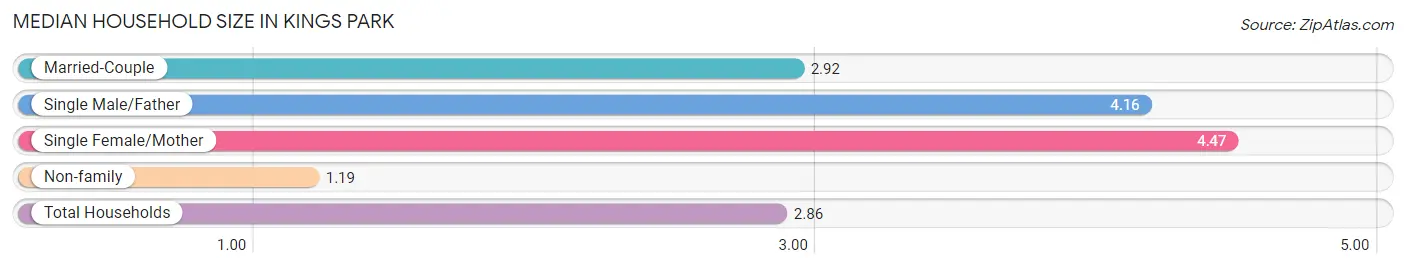
The median household size in Kings Park is 2.86 persons per household, with single female/mother households (124 | 8.9%) accounting for the largest median household size of 4.47 persons per household. non-family households (243 | 17.4%) represent the smallest median household size with 1.19 persons per household.
| Household Type | # Households | Household Size |
| Married-Couple | 917 (65.7%) | 2.92 |
| Single Male/Father | 112 (8.0%) | 4.16 |
| Single Female/Mother | 124 (8.9%) | 4.47 |
| Non-family | 243 (17.4%) | 1.19 |
| Total Households | 1,396 (100.0%) | 2.86 |
Household Size by Marriage Status in Kings Park
Out of a total of 1,396 households in Kings Park, 1,153 (82.6%) are family households, while 243 (17.4%) are nonfamily households. The most numerous type of family households are 2-person households, comprising 529, and the most common type of nonfamily households are 1-person households, comprising 200.
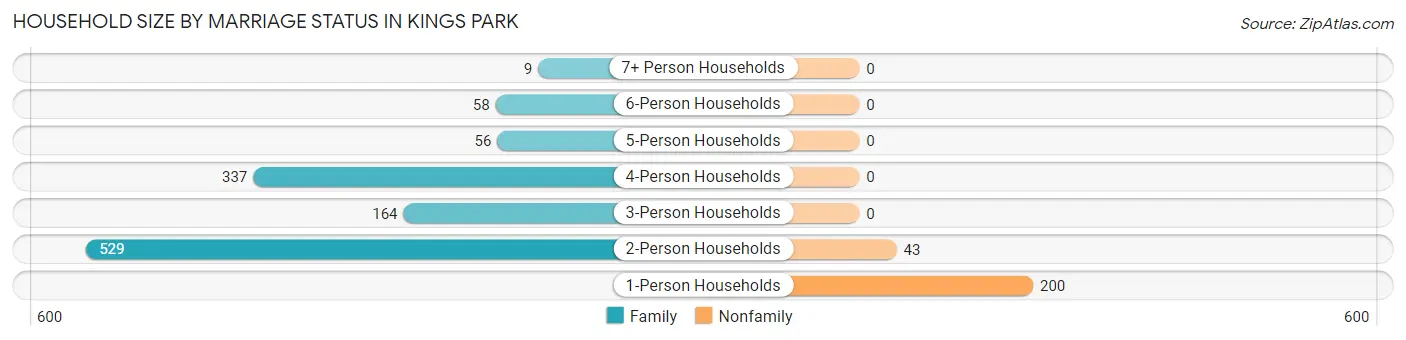
| Household Size | Family Households | Nonfamily Households |
| 1-Person Households | - | 200 (14.3%) |
| 2-Person Households | 529 (37.9%) | 43 (3.1%) |
| 3-Person Households | 164 (11.7%) | 0 (0.0%) |
| 4-Person Households | 337 (24.1%) | 0 (0.0%) |
| 5-Person Households | 56 (4.0%) | 0 (0.0%) |
| 6-Person Households | 58 (4.2%) | 0 (0.0%) |
| 7+ Person Households | 9 (0.6%) | 0 (0.0%) |
| Total | 1,153 (82.6%) | 243 (17.4%) |
Female Fertility in Kings Park
Fertility by Age in Kings Park
Average fertility rate in Kings Park is 31.0 births per 1,000 women. Women in the age bracket of 35 to 50 years have the highest fertility rate with 63.0 births per 1,000 women. Women in the age bracket of 35 to 50 years acount for 100.0% of all women with births.
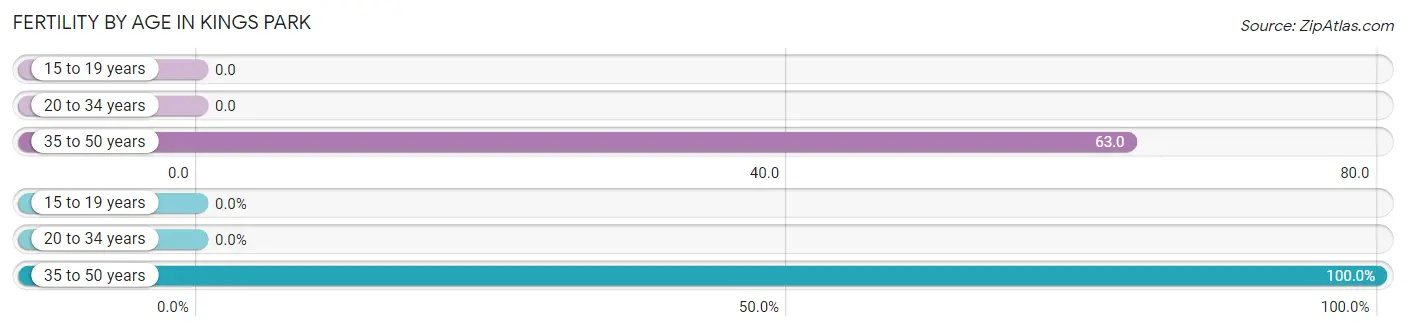
| Age Bracket | Women with Births | Births / 1,000 Women |
| 15 to 19 years | 0 (0.0%) | 0.0 |
| 20 to 34 years | 0 (0.0%) | 0.0 |
| 35 to 50 years | 27 (100.0%) | 63.0 |
| Total | 27 (100.0%) | 31.0 |
Fertility by Age by Marriage Status in Kings Park
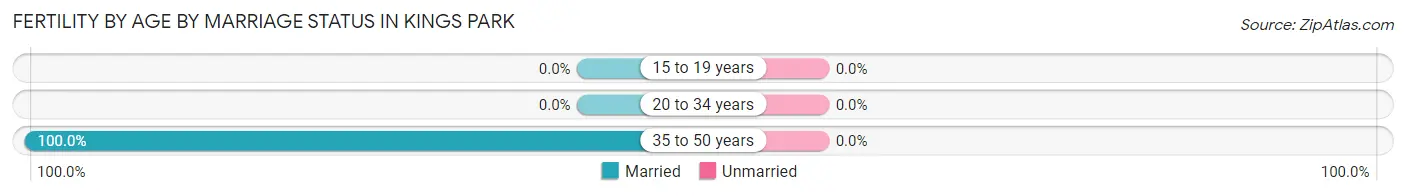
| Age Bracket | Married | Unmarried |
| 15 to 19 years | 0 (0.0%) | 0 (0.0%) |
| 20 to 34 years | 0 (0.0%) | 0 (0.0%) |
| 35 to 50 years | 27 (100.0%) | 0 (0.0%) |
| Total | 27 (100.0%) | 0 (0.0%) |
Fertility by Education in Kings Park
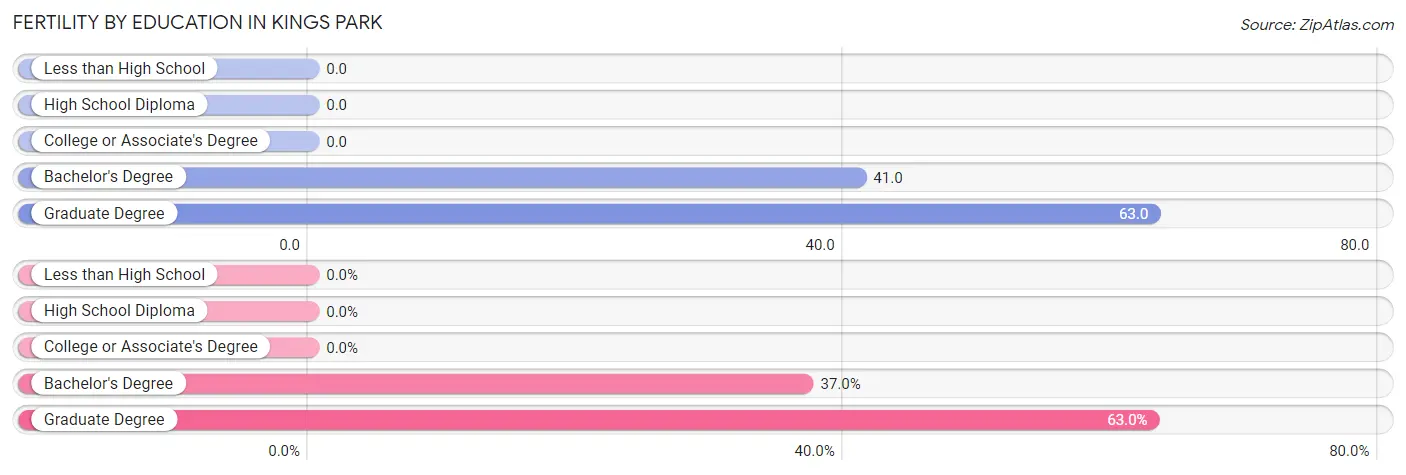
| Educational Attainment | Women with Births | Births / 1,000 Women |
| Less than High School | 0 (0.0%) | 0.0 |
| High School Diploma | 0 (0.0%) | 0.0 |
| College or Associate's Degree | 0 (0.0%) | 0.0 |
| Bachelor's Degree | 10 (37.0%) | 41.0 |
| Graduate Degree | 17 (63.0%) | 63.0 |
| Total | 27 (100.0%) | 31.0 |
Fertility by Education by Marriage Status in Kings Park
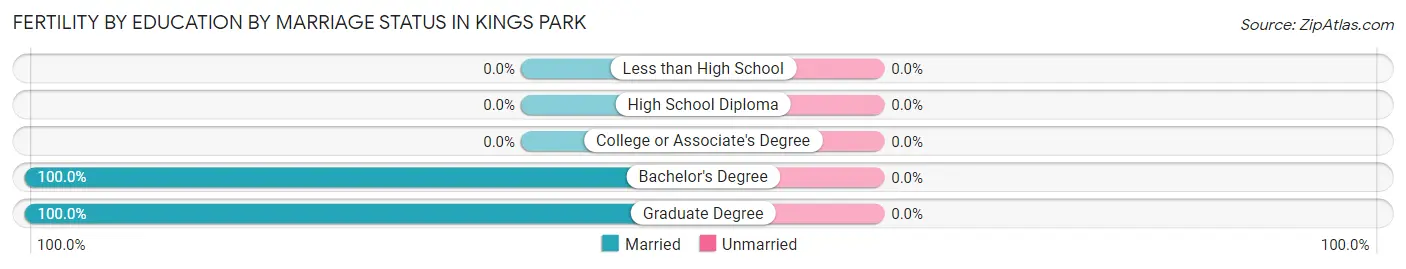
| Educational Attainment | Married | Unmarried |
| Less than High School | 0 (0.0%) | 0 (0.0%) |
| High School Diploma | 0 (0.0%) | 0 (0.0%) |
| College or Associate's Degree | 0 (0.0%) | 0 (0.0%) |
| Bachelor's Degree | 10 (100.0%) | 0 (0.0%) |
| Graduate Degree | 17 (100.0%) | 0 (0.0%) |
| Total | 27 (100.0%) | 0 (0.0%) |
Employment Characteristics in Kings Park
Employment by Class of Employer in Kings Park
Among the 2,168 employed individuals in Kings Park, private company employees (1,047 | 48.3%), not-for-profit organizations (251 | 11.6%), and local government employees (240 | 11.1%) make up the most common classes of employment.
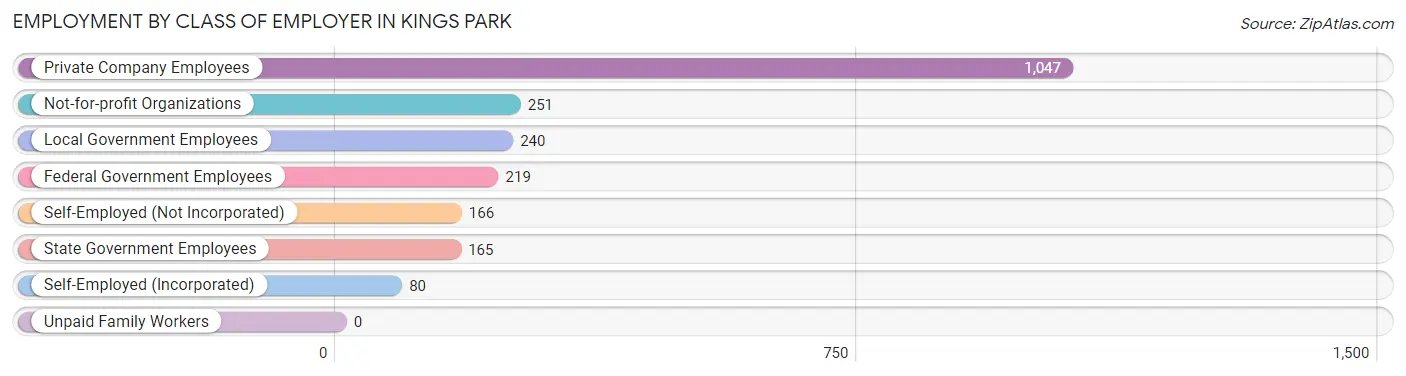
| Employer Class | # Employees | % Employees |
| Private Company Employees | 1,047 | 48.3% |
| Self-Employed (Incorporated) | 80 | 3.7% |
| Self-Employed (Not Incorporated) | 166 | 7.7% |
| Not-for-profit Organizations | 251 | 11.6% |
| Local Government Employees | 240 | 11.1% |
| State Government Employees | 165 | 7.6% |
| Federal Government Employees | 219 | 10.1% |
| Unpaid Family Workers | 0 | 0.0% |
| Total | 2,168 | 100.0% |
Employment Status by Age in Kings Park
According to the labor force statistics for Kings Park, out of the total population over 16 years of age (3,371), 68.4% or 2,306 individuals are in the labor force, with 4.8% or 111 of them unemployed. The age group with the highest labor force participation rate is 25 to 29 years, with 100.0% or 177 individuals in the labor force. Within the labor force, the 75 years and over age range has the highest percentage of unemployed individuals, with 100.0% or 63 of them being unemployed.
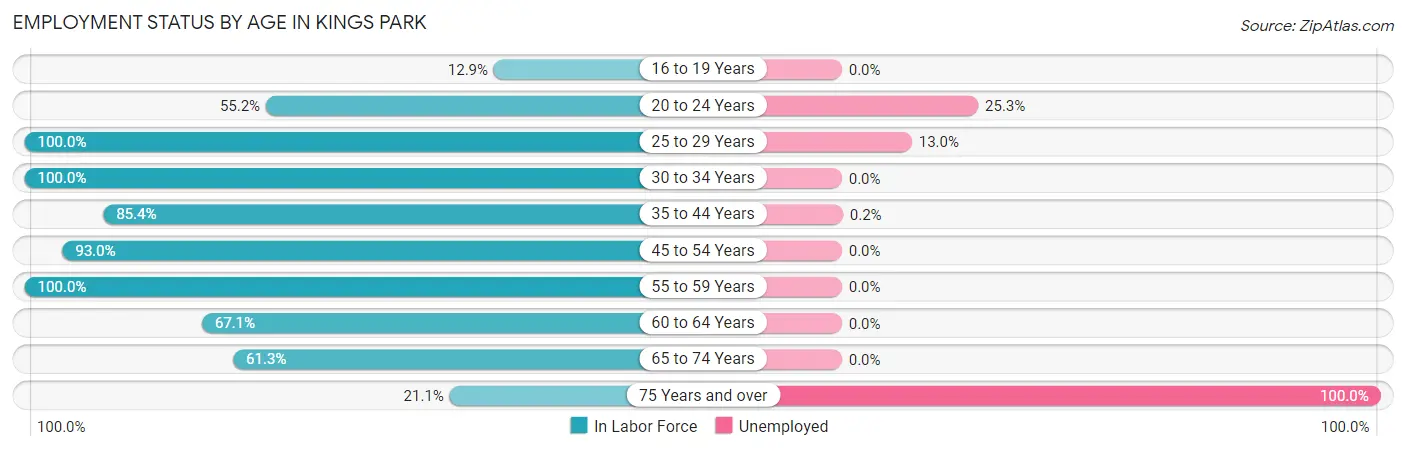
| Age Bracket | In Labor Force | Unemployed |
| 16 to 19 Years | 36 (12.9%) | 0 (0.0%) |
| 20 to 24 Years | 95 (55.2%) | 24 (25.3%) |
| 25 to 29 Years | 177 (100.0%) | 23 (13.0%) |
| 30 to 34 Years | 119 (100.0%) | 0 (0.0%) |
| 35 to 44 Years | 516 (85.4%) | 1 (0.2%) |
| 45 to 54 Years | 495 (93.0%) | 0 (0.0%) |
| 55 to 59 Years | 148 (100.0%) | 0 (0.0%) |
| 60 to 64 Years | 202 (67.1%) | 0 (0.0%) |
| 65 to 74 Years | 455 (61.3%) | 0 (0.0%) |
| 75 Years and over | 63 (21.1%) | 63 (100.0%) |
| Total | 2,306 (68.4%) | 111 (4.8%) |
Employment Status by Educational Attainment in Kings Park
According to labor force statistics for Kings Park, 88.1% of individuals (1,657) out of the total population between 25 and 64 years of age (1,881) are in the labor force, with 1.5% or 25 of them being unemployed. The group with the highest labor force participation rate are those with the educational attainment of college / associate degree, with 93.6% or 250 individuals in the labor force. Within the labor force, individuals with bachelor's degree or higher education have the highest percentage of unemployment, with 2.1% or 23 of them being unemployed.
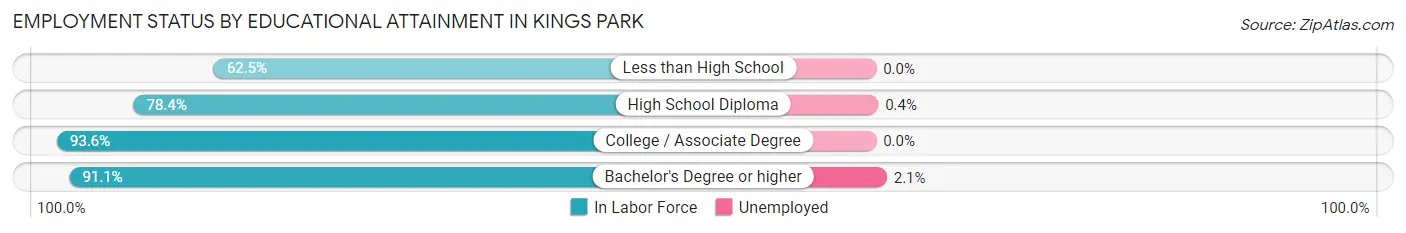
| Educational Attainment | In Labor Force | Unemployed |
| Less than High School | 45 (62.5%) | 0 (0.0%) |
| High School Diploma | 261 (78.4%) | 1 (0.4%) |
| College / Associate Degree | 250 (93.6%) | 0 (0.0%) |
| Bachelor's Degree or higher | 1,101 (91.1%) | 25 (2.1%) |
| Total | 1,657 (88.1%) | 28 (1.5%) |
Employment Occupations by Sex in Kings Park
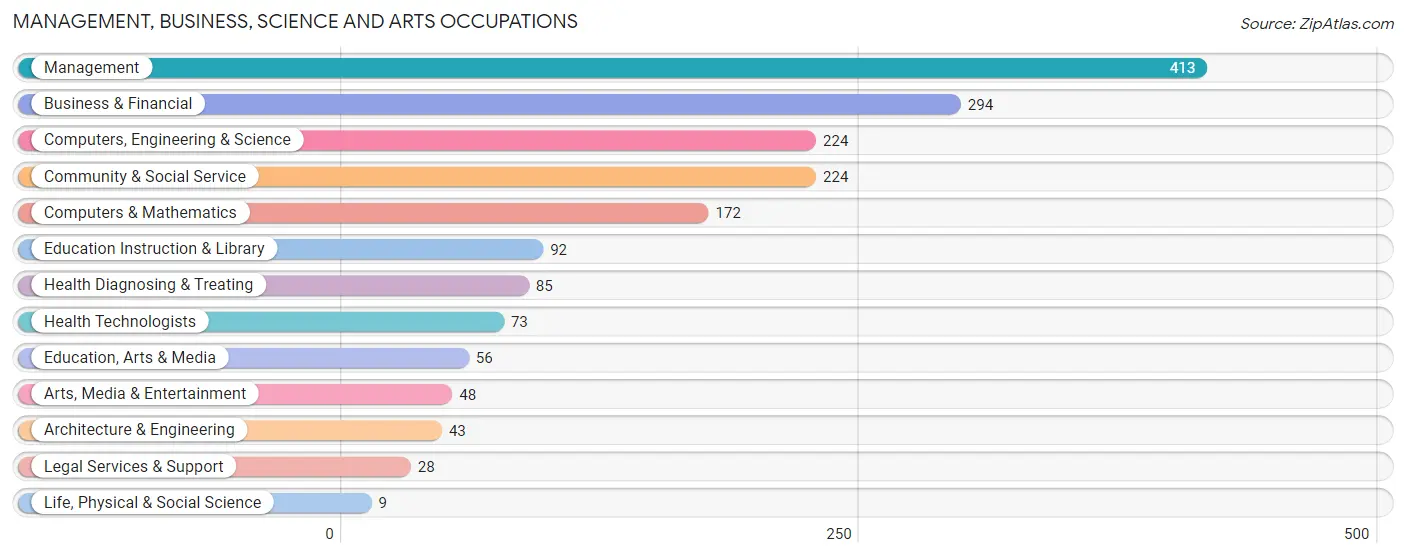
Management, Business, Science and Arts Occupations
The most common Management, Business, Science and Arts occupations in Kings Park are Management (413 | 19.0%), Business & Financial (294 | 13.5%), Computers, Engineering & Science (224 | 10.3%), Community & Social Service (224 | 10.3%), and Computers & Mathematics (172 | 7.9%).
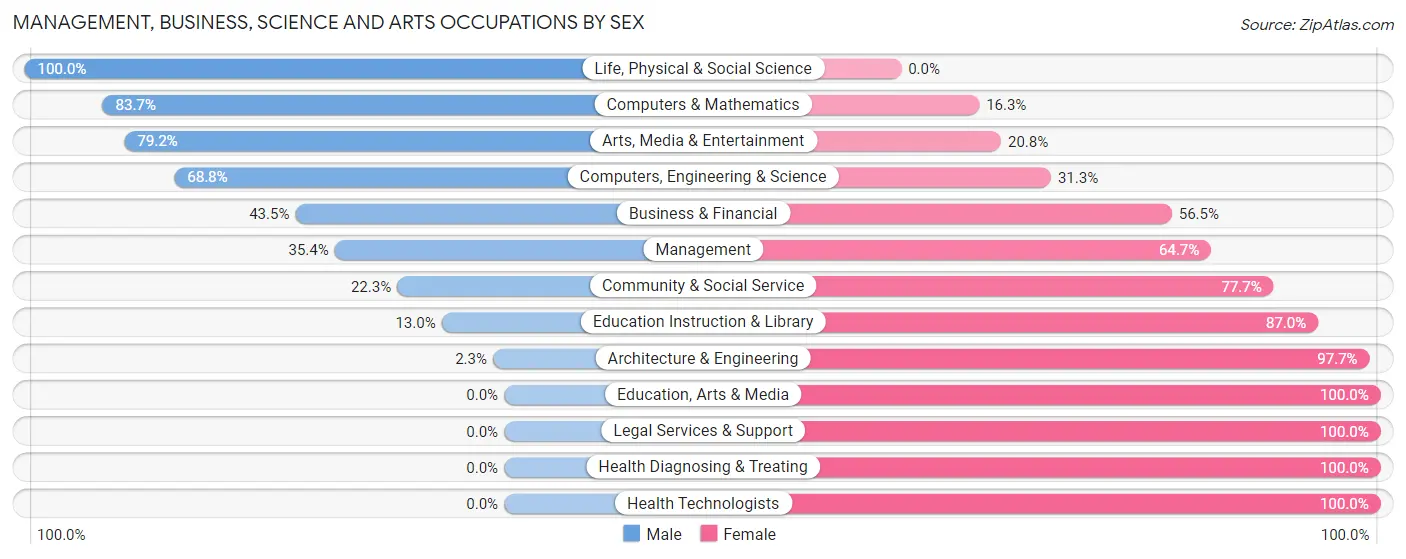
Management, Business, Science and Arts Occupations by Sex
Within the Management, Business, Science and Arts occupations in Kings Park, the most male-oriented occupations are Life, Physical & Social Science (100.0%), Computers & Mathematics (83.7%), and Arts, Media & Entertainment (79.2%), while the most female-oriented occupations are Education, Arts & Media (100.0%), Legal Services & Support (100.0%), and Health Diagnosing & Treating (100.0%).
| Occupation | Male | Female |
| Management | 146 (35.3%) | 267 (64.6%) |
| Business & Financial | 128 (43.5%) | 166 (56.5%) |
| Computers, Engineering & Science | 154 (68.8%) | 70 (31.2%) |
| Computers & Mathematics | 144 (83.7%) | 28 (16.3%) |
| Architecture & Engineering | 1 (2.3%) | 42 (97.7%) |
| Life, Physical & Social Science | 9 (100.0%) | 0 (0.0%) |
| Community & Social Service | 50 (22.3%) | 174 (77.7%) |
| Education, Arts & Media | 0 (0.0%) | 56 (100.0%) |
| Legal Services & Support | 0 (0.0%) | 28 (100.0%) |
| Education Instruction & Library | 12 (13.0%) | 80 (87.0%) |
| Arts, Media & Entertainment | 38 (79.2%) | 10 (20.8%) |
| Health Diagnosing & Treating | 0 (0.0%) | 85 (100.0%) |
| Health Technologists | 0 (0.0%) | 73 (100.0%) |
| Total (Category) | 478 (38.6%) | 762 (61.5%) |
| Total (Overall) | 999 (45.9%) | 1,179 (54.1%) |
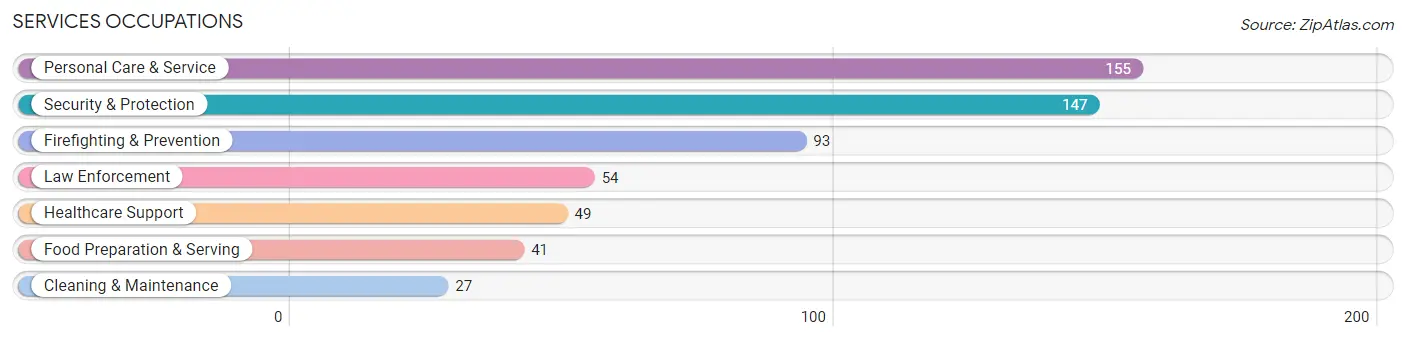
Services Occupations
The most common Services occupations in Kings Park are Personal Care & Service (155 | 7.1%), Security & Protection (147 | 6.8%), Firefighting & Prevention (93 | 4.3%), Law Enforcement (54 | 2.5%), and Healthcare Support (49 | 2.2%).
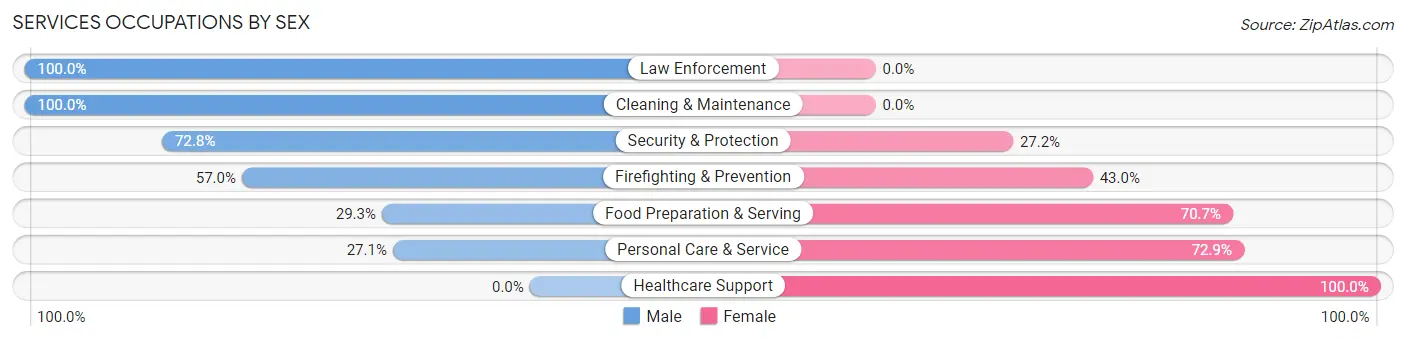
Services Occupations by Sex
Within the Services occupations in Kings Park, the most male-oriented occupations are Law Enforcement (100.0%), Cleaning & Maintenance (100.0%), and Security & Protection (72.8%), while the most female-oriented occupations are Healthcare Support (100.0%), Personal Care & Service (72.9%), and Food Preparation & Serving (70.7%).
| Occupation | Male | Female |
| Healthcare Support | 0 (0.0%) | 49 (100.0%) |
| Security & Protection | 107 (72.8%) | 40 (27.2%) |
| Firefighting & Prevention | 53 (57.0%) | 40 (43.0%) |
| Law Enforcement | 54 (100.0%) | 0 (0.0%) |
| Food Preparation & Serving | 12 (29.3%) | 29 (70.7%) |
| Cleaning & Maintenance | 27 (100.0%) | 0 (0.0%) |
| Personal Care & Service | 42 (27.1%) | 113 (72.9%) |
| Total (Category) | 188 (44.9%) | 231 (55.1%) |
| Total (Overall) | 999 (45.9%) | 1,179 (54.1%) |
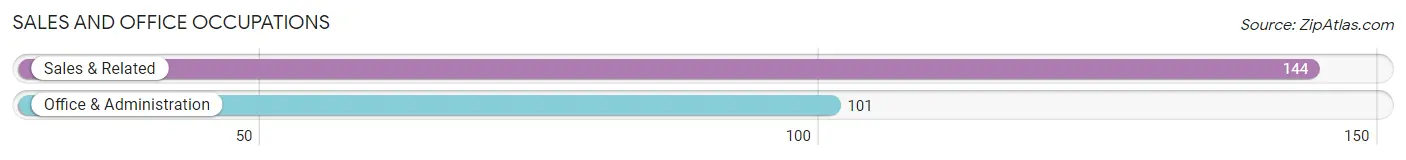
Sales and Office Occupations
The most common Sales and Office occupations in Kings Park are Sales & Related (144 | 6.6%), and Office & Administration (101 | 4.6%).
Sales and Office Occupations by Sex
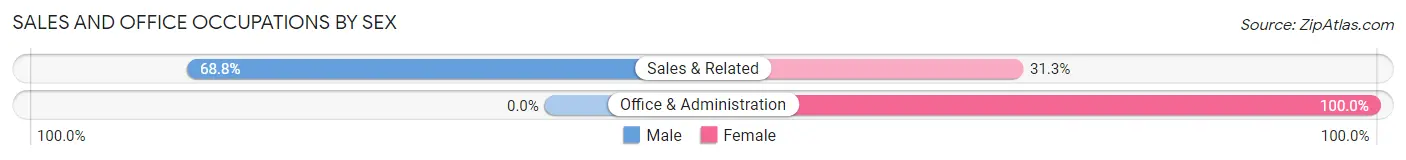
| Occupation | Male | Female |
| Sales & Related | 99 (68.8%) | 45 (31.2%) |
| Office & Administration | 0 (0.0%) | 101 (100.0%) |
| Total (Category) | 99 (40.4%) | 146 (59.6%) |
| Total (Overall) | 999 (45.9%) | 1,179 (54.1%) |
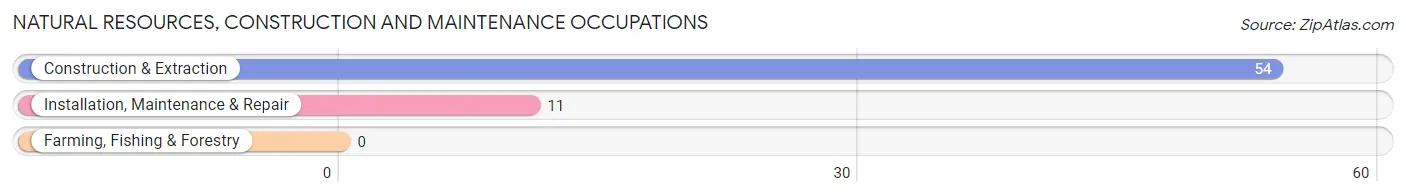
Natural Resources, Construction and Maintenance Occupations
The most common Natural Resources, Construction and Maintenance occupations in Kings Park are Construction & Extraction (54 | 2.5%), and Installation, Maintenance & Repair (11 | 0.5%).
Natural Resources, Construction and Maintenance Occupations by Sex
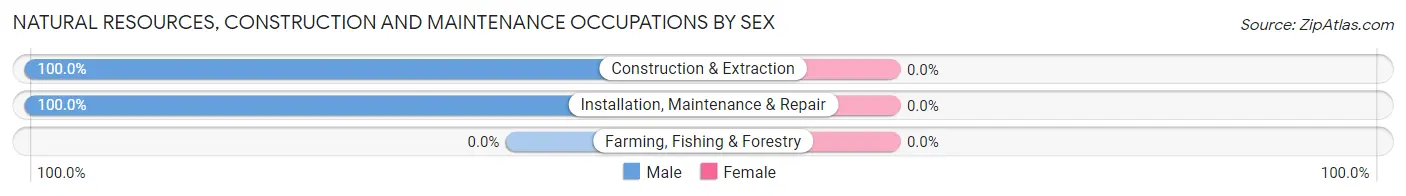
| Occupation | Male | Female |
| Farming, Fishing & Forestry | 0 (0.0%) | 0 (0.0%) |
| Construction & Extraction | 54 (100.0%) | 0 (0.0%) |
| Installation, Maintenance & Repair | 11 (100.0%) | 0 (0.0%) |
| Total (Category) | 65 (100.0%) | 0 (0.0%) |
| Total (Overall) | 999 (45.9%) | 1,179 (54.1%) |
Production, Transportation and Moving Occupations
The most common Production, Transportation and Moving occupations in Kings Park are Material Moving (154 | 7.1%), Transportation (31 | 1.4%), and Production (24 | 1.1%).
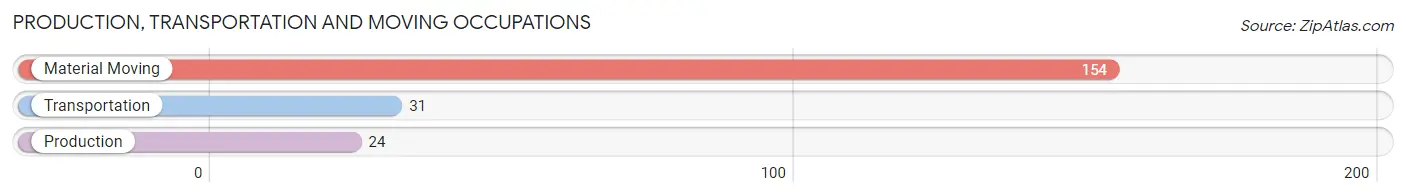
Production, Transportation and Moving Occupations by Sex
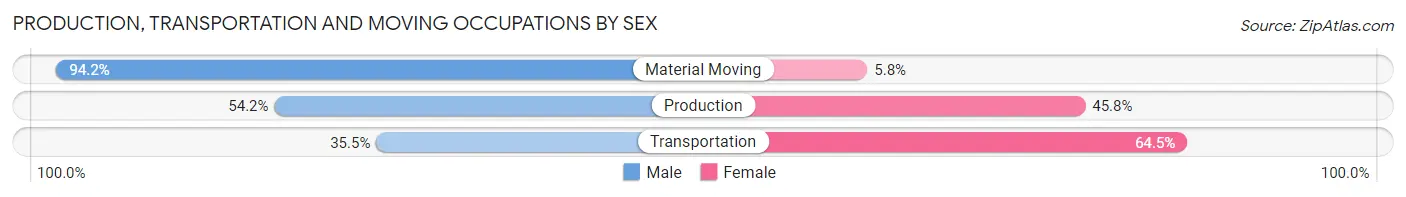
| Occupation | Male | Female |
| Production | 13 (54.2%) | 11 (45.8%) |
| Transportation | 11 (35.5%) | 20 (64.5%) |
| Material Moving | 145 (94.2%) | 9 (5.8%) |
| Total (Category) | 169 (80.9%) | 40 (19.1%) |
| Total (Overall) | 999 (45.9%) | 1,179 (54.1%) |
Employment Industries by Sex in Kings Park
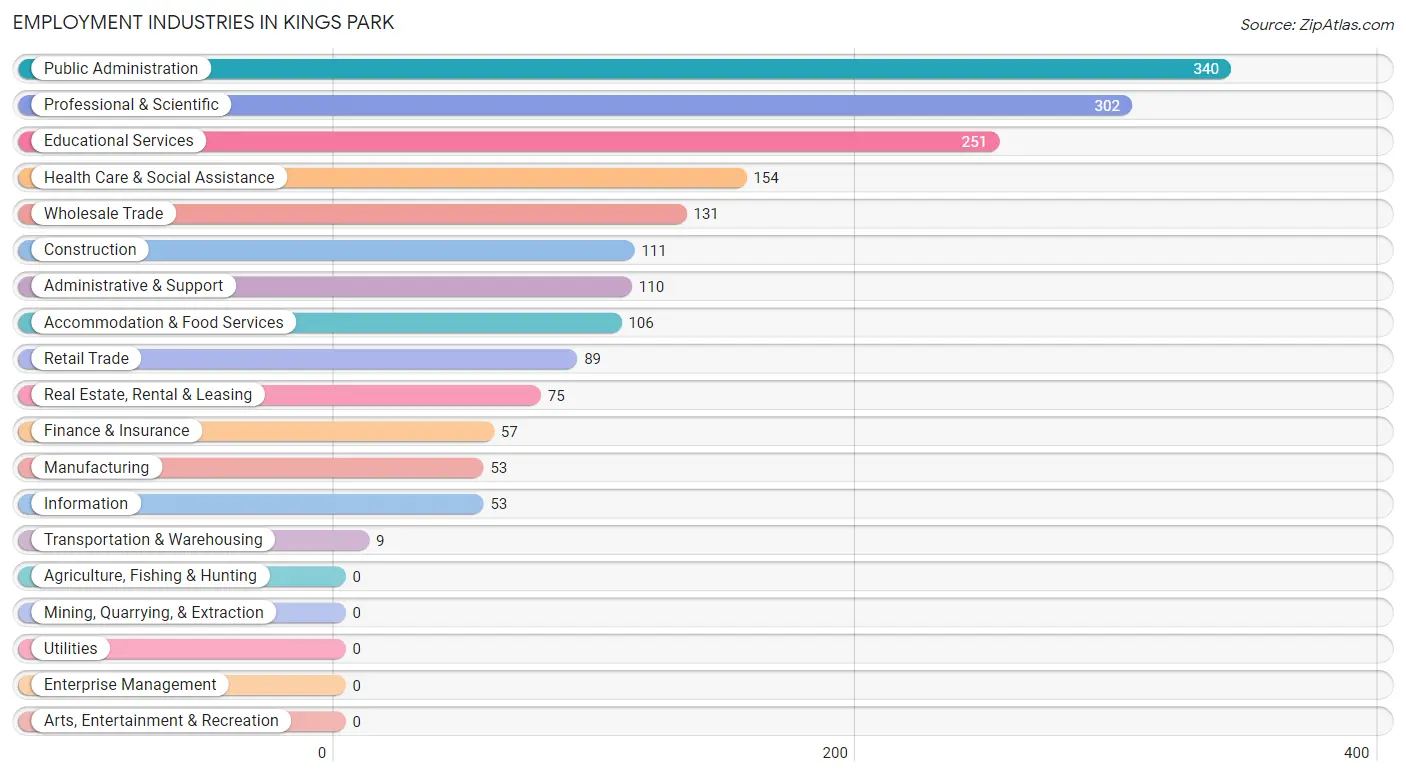
Employment Industries in Kings Park
The major employment industries in Kings Park include Public Administration (340 | 15.6%), Professional & Scientific (302 | 13.9%), Educational Services (251 | 11.5%), Health Care & Social Assistance (154 | 7.1%), and Wholesale Trade (131 | 6.0%).
Employment Industries by Sex in Kings Park
The Kings Park industries that see more men than women are Manufacturing (100.0%), Wholesale Trade (100.0%), and Transportation & Warehousing (100.0%), whereas the industries that tend to have a higher number of women are Health Care & Social Assistance (89.0%), Educational Services (87.6%), and Finance & Insurance (68.4%).
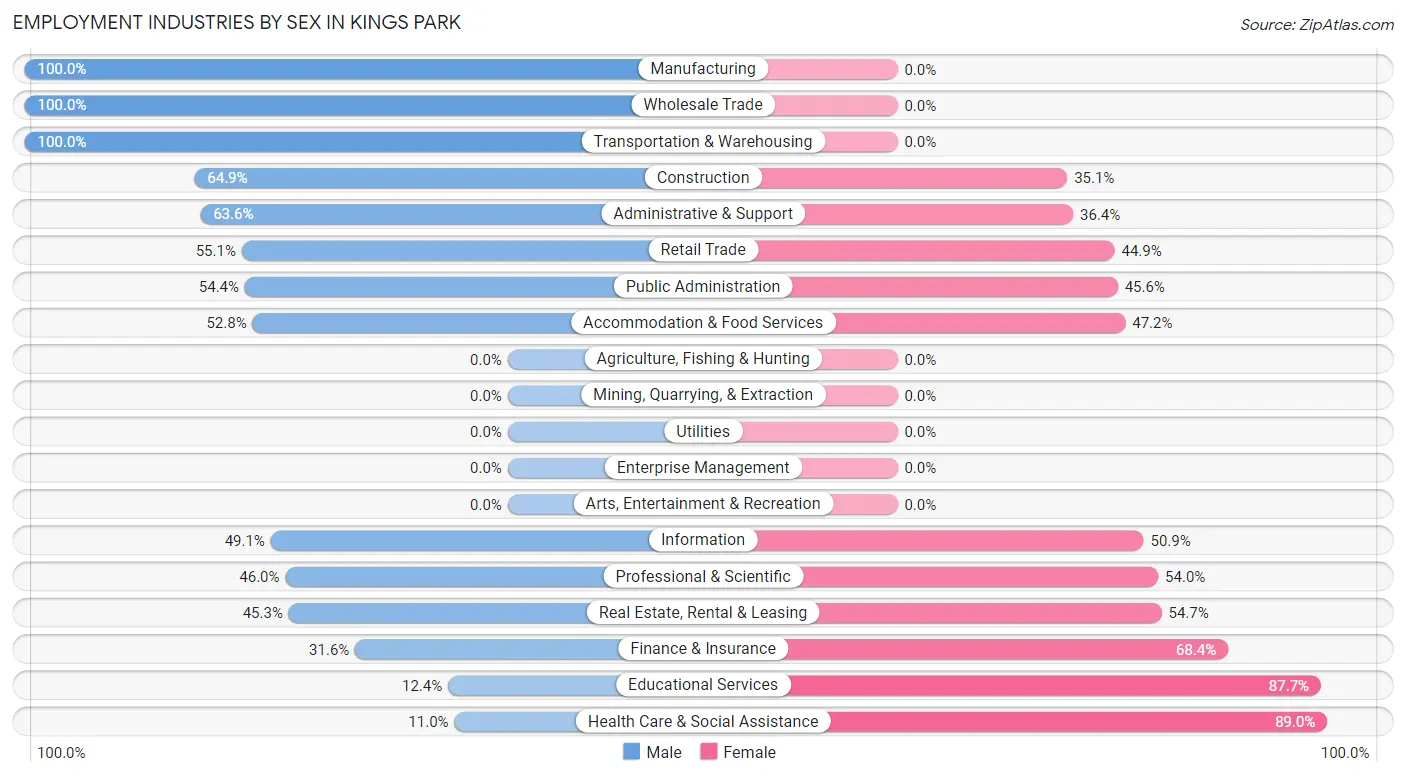
| Industry | Male | Female |
| Agriculture, Fishing & Hunting | 0 (0.0%) | 0 (0.0%) |
| Mining, Quarrying, & Extraction | 0 (0.0%) | 0 (0.0%) |
| Construction | 72 (64.9%) | 39 (35.1%) |
| Manufacturing | 53 (100.0%) | 0 (0.0%) |
| Wholesale Trade | 131 (100.0%) | 0 (0.0%) |
| Retail Trade | 49 (55.1%) | 40 (44.9%) |
| Transportation & Warehousing | 9 (100.0%) | 0 (0.0%) |
| Utilities | 0 (0.0%) | 0 (0.0%) |
| Information | 26 (49.1%) | 27 (50.9%) |
| Finance & Insurance | 18 (31.6%) | 39 (68.4%) |
| Real Estate, Rental & Leasing | 34 (45.3%) | 41 (54.7%) |
| Professional & Scientific | 139 (46.0%) | 163 (54.0%) |
| Enterprise Management | 0 (0.0%) | 0 (0.0%) |
| Administrative & Support | 70 (63.6%) | 40 (36.4%) |
| Educational Services | 31 (12.3%) | 220 (87.6%) |
| Health Care & Social Assistance | 17 (11.0%) | 137 (89.0%) |
| Arts, Entertainment & Recreation | 0 (0.0%) | 0 (0.0%) |
| Accommodation & Food Services | 56 (52.8%) | 50 (47.2%) |
| Public Administration | 185 (54.4%) | 155 (45.6%) |
| Total | 999 (45.9%) | 1,179 (54.1%) |
Education in Kings Park
School Enrollment in Kings Park
The most common levels of schooling among the 926 students in Kings Park are high school (237 | 25.6%), middle school (204 | 22.0%), and college / undergraduate (162 | 17.5%).
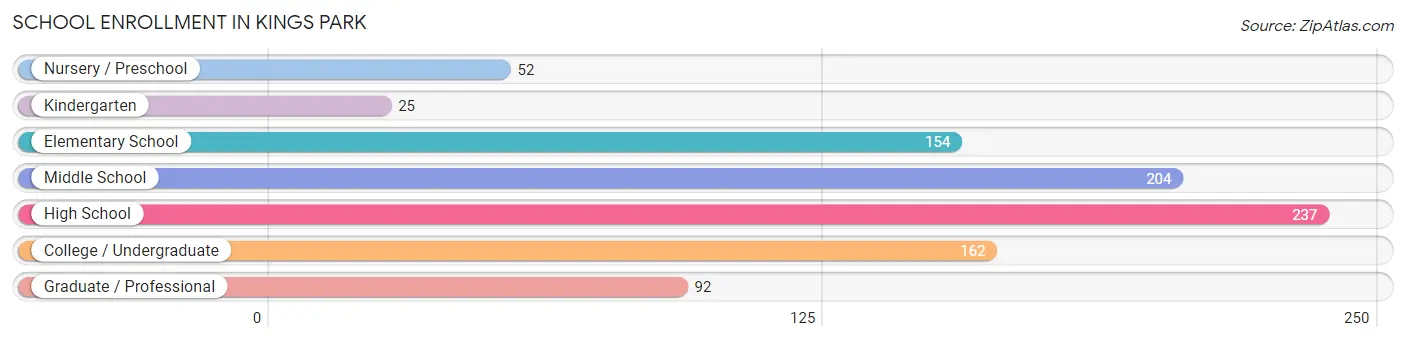
| School Level | # Students | % Students |
| Nursery / Preschool | 52 | 5.6% |
| Kindergarten | 25 | 2.7% |
| Elementary School | 154 | 16.6% |
| Middle School | 204 | 22.0% |
| High School | 237 | 25.6% |
| College / Undergraduate | 162 | 17.5% |
| Graduate / Professional | 92 | 9.9% |
| Total | 926 | 100.0% |
School Enrollment by Age by Funding Source in Kings Park
Out of a total of 926 students who are enrolled in schools in Kings Park, 167 (18.0%) attend a private institution, while the remaining 759 (82.0%) are enrolled in public schools. The age group of 3 to 4 year olds has the highest likelihood of being enrolled in private schools, with 10 (28.6% in the age bracket) enrolled. Conversely, the age group of 18 to 19 year olds has the lowest likelihood of being enrolled in a private school, with 82 (100.0% in the age bracket) attending a public institution.
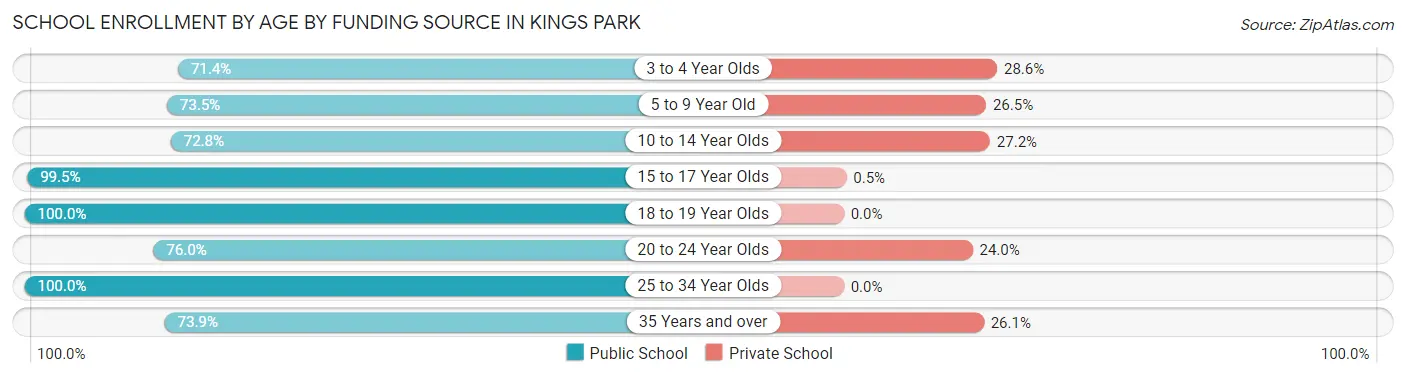
| Age Bracket | Public School | Private School |
| 3 to 4 Year Olds | 25 (71.4%) | 10 (28.6%) |
| 5 to 9 Year Old | 122 (73.5%) | 44 (26.5%) |
| 10 to 14 Year Olds | 187 (72.8%) | 70 (27.2%) |
| 15 to 17 Year Olds | 198 (99.5%) | 1 (0.5%) |
| 18 to 19 Year Olds | 82 (100.0%) | 0 (0.0%) |
| 20 to 24 Year Olds | 38 (76.0%) | 12 (24.0%) |
| 25 to 34 Year Olds | 22 (100.0%) | 0 (0.0%) |
| 35 Years and over | 85 (73.9%) | 30 (26.1%) |
| Total | 759 (82.0%) | 167 (18.0%) |
Educational Attainment by Field of Study in Kings Park
Business (350 | 19.6%), social sciences (311 | 17.4%), visual & performing arts (150 | 8.4%), liberal arts & history (145 | 8.1%), and bio, nature & agricultural (143 | 8.0%) are the most common fields of study among 1,786 individuals in Kings Park who have obtained a bachelor's degree or higher.
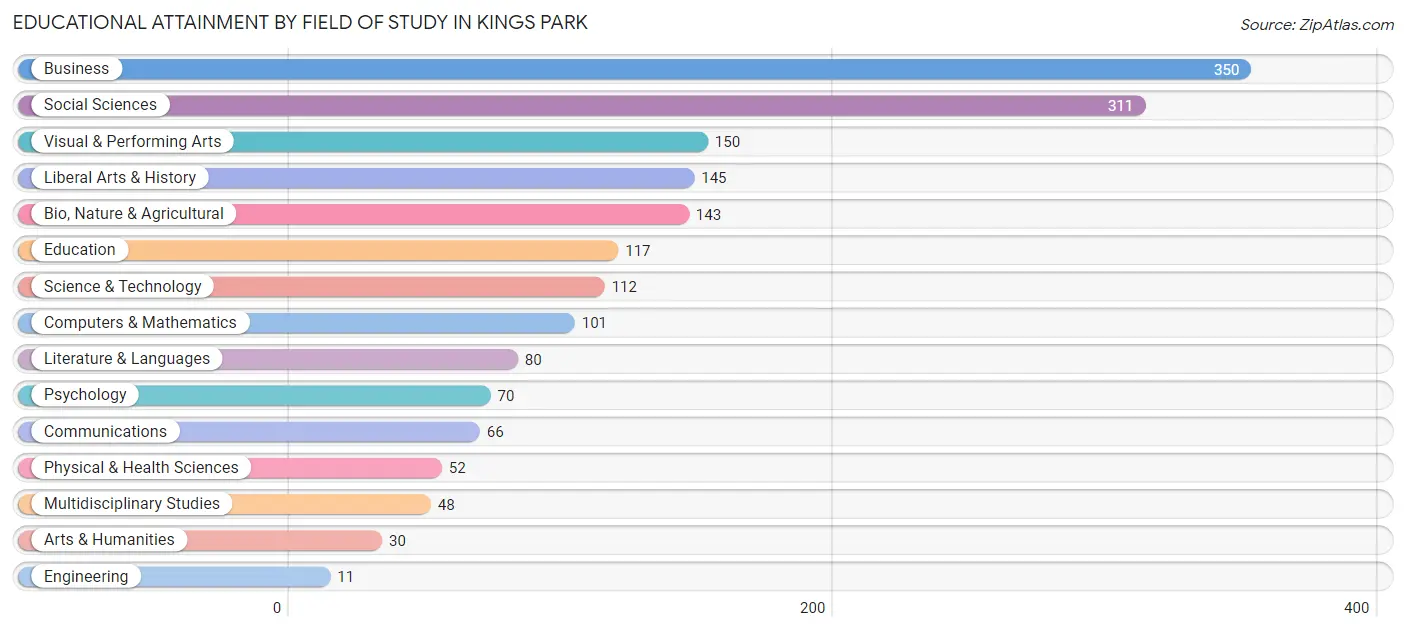
| Field of Study | # Graduates | % Graduates |
| Computers & Mathematics | 101 | 5.7% |
| Bio, Nature & Agricultural | 143 | 8.0% |
| Physical & Health Sciences | 52 | 2.9% |
| Psychology | 70 | 3.9% |
| Social Sciences | 311 | 17.4% |
| Engineering | 11 | 0.6% |
| Multidisciplinary Studies | 48 | 2.7% |
| Science & Technology | 112 | 6.3% |
| Business | 350 | 19.6% |
| Education | 117 | 6.6% |
| Literature & Languages | 80 | 4.5% |
| Liberal Arts & History | 145 | 8.1% |
| Visual & Performing Arts | 150 | 8.4% |
| Communications | 66 | 3.7% |
| Arts & Humanities | 30 | 1.7% |
| Total | 1,786 | 100.0% |
Transportation & Commute in Kings Park
Vehicle Availability by Sex in Kings Park
The most prevalent vehicle ownership categories in Kings Park are males with 2 vehicles (486, accounting for 48.6%) and females with 2 vehicles (450, making up 41.9%).
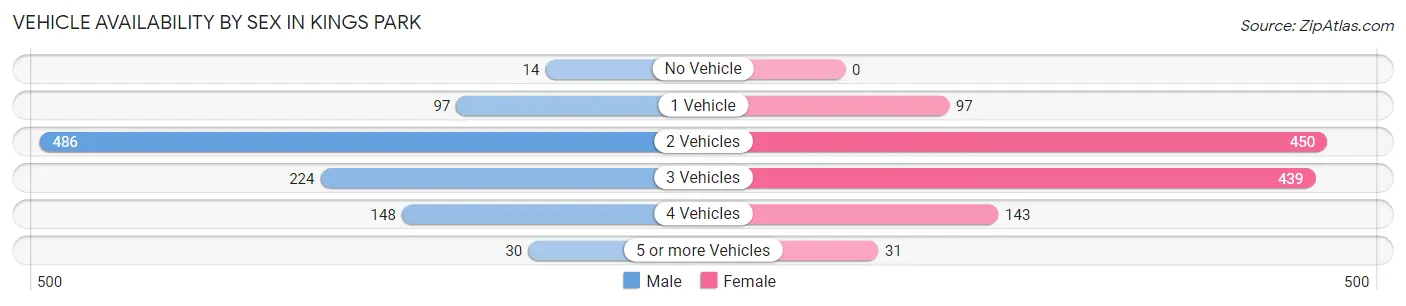
| Vehicles Available | Male | Female |
| No Vehicle | 14 (1.4%) | 0 (0.0%) |
| 1 Vehicle | 97 (9.7%) | 97 (8.4%) |
| 2 Vehicles | 486 (48.6%) | 450 (38.8%) |
| 3 Vehicles | 224 (22.4%) | 439 (37.8%) |
| 4 Vehicles | 148 (14.8%) | 143 (12.3%) |
| 5 or more Vehicles | 30 (3.0%) | 31 (2.7%) |
| Total | 999 (100.0%) | 1,160 (100.0%) |
Commute Time in Kings Park
The most frequently occuring commute durations in Kings Park are 30 to 34 minutes (341 commuters, 18.9%), 20 to 24 minutes (283 commuters, 15.7%), and 25 to 29 minutes (268 commuters, 14.9%).
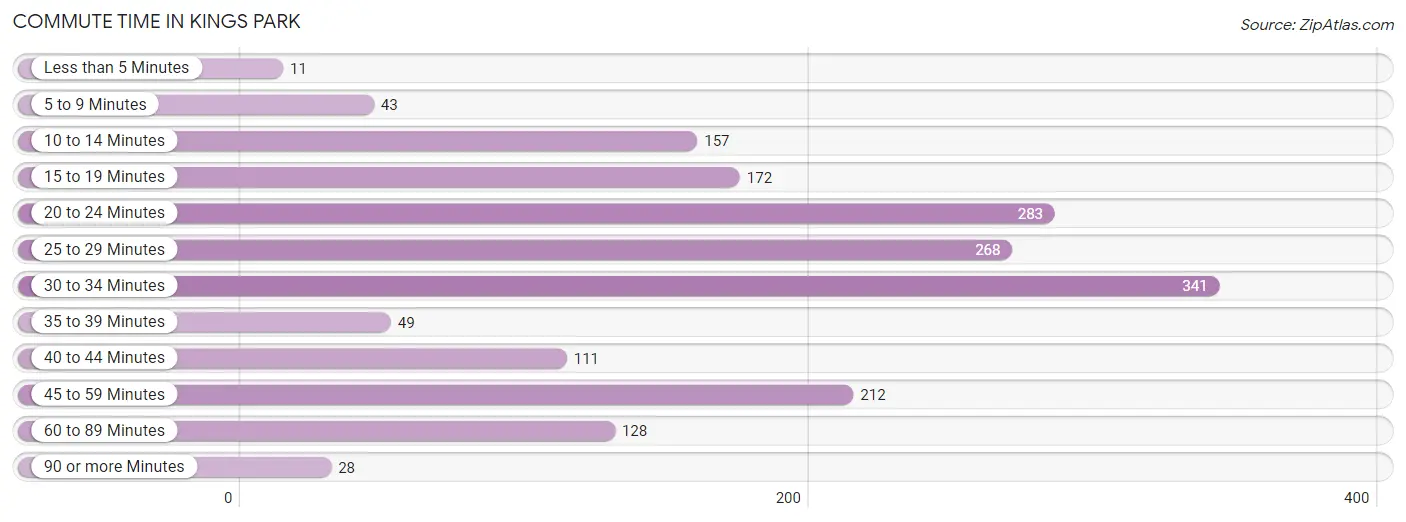
| Commute Time | # Commuters | % Commuters |
| Less than 5 Minutes | 11 | 0.6% |
| 5 to 9 Minutes | 43 | 2.4% |
| 10 to 14 Minutes | 157 | 8.7% |
| 15 to 19 Minutes | 172 | 9.5% |
| 20 to 24 Minutes | 283 | 15.7% |
| 25 to 29 Minutes | 268 | 14.9% |
| 30 to 34 Minutes | 341 | 18.9% |
| 35 to 39 Minutes | 49 | 2.7% |
| 40 to 44 Minutes | 111 | 6.2% |
| 45 to 59 Minutes | 212 | 11.8% |
| 60 to 89 Minutes | 128 | 7.1% |
| 90 or more Minutes | 28 | 1.5% |
Commute Time by Sex in Kings Park
The most common commute times in Kings Park are 30 to 34 minutes (184 commuters, 21.5%) for males and 20 to 24 minutes (211 commuters, 22.3%) for females.
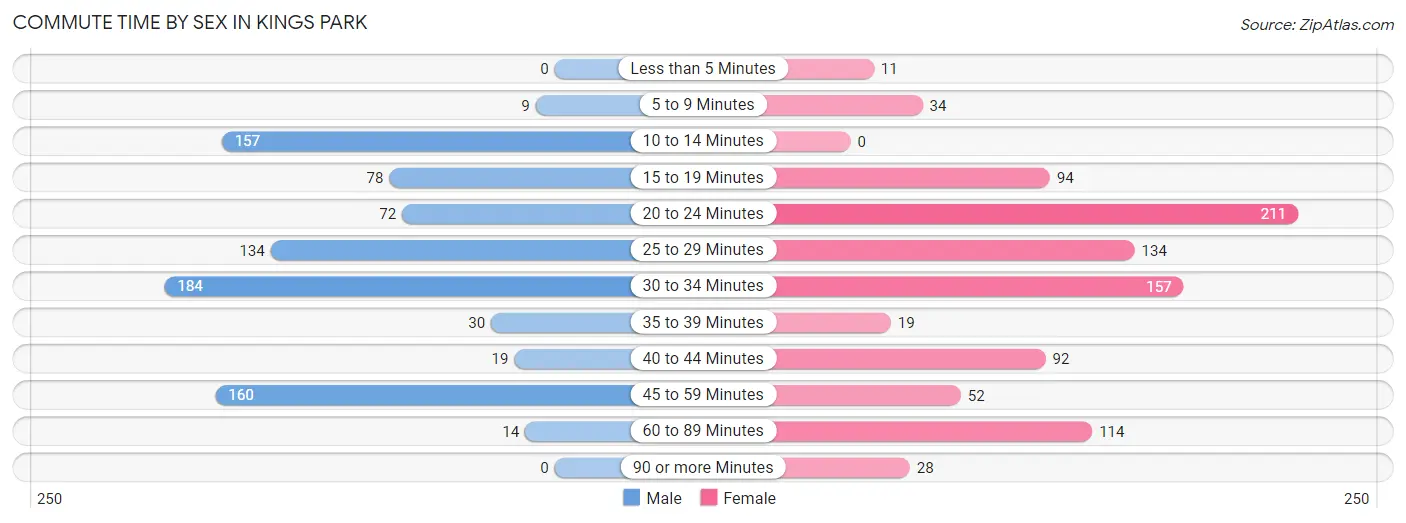
| Commute Time | Male | Female |
| Less than 5 Minutes | 0 (0.0%) | 11 (1.2%) |
| 5 to 9 Minutes | 9 (1.1%) | 34 (3.6%) |
| 10 to 14 Minutes | 157 (18.3%) | 0 (0.0%) |
| 15 to 19 Minutes | 78 (9.1%) | 94 (9.9%) |
| 20 to 24 Minutes | 72 (8.4%) | 211 (22.3%) |
| 25 to 29 Minutes | 134 (15.6%) | 134 (14.2%) |
| 30 to 34 Minutes | 184 (21.5%) | 157 (16.6%) |
| 35 to 39 Minutes | 30 (3.5%) | 19 (2.0%) |
| 40 to 44 Minutes | 19 (2.2%) | 92 (9.7%) |
| 45 to 59 Minutes | 160 (18.7%) | 52 (5.5%) |
| 60 to 89 Minutes | 14 (1.6%) | 114 (12.0%) |
| 90 or more Minutes | 0 (0.0%) | 28 (3.0%) |
Time of Departure to Work by Sex in Kings Park
The most frequent times of departure to work in Kings Park are 7:30 AM to 7:59 AM (136, 15.9%) for males and 8:00 AM to 8:29 AM (266, 28.1%) for females.
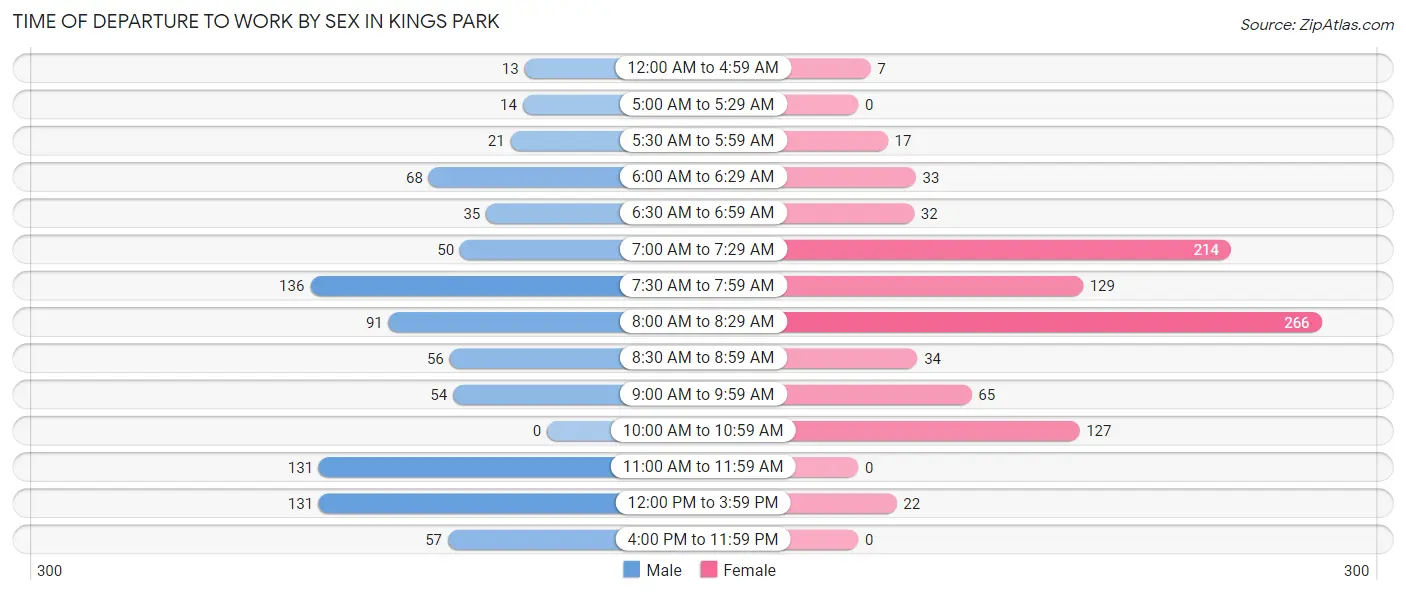
| Time of Departure | Male | Female |
| 12:00 AM to 4:59 AM | 13 (1.5%) | 7 (0.7%) |
| 5:00 AM to 5:29 AM | 14 (1.6%) | 0 (0.0%) |
| 5:30 AM to 5:59 AM | 21 (2.5%) | 17 (1.8%) |
| 6:00 AM to 6:29 AM | 68 (7.9%) | 33 (3.5%) |
| 6:30 AM to 6:59 AM | 35 (4.1%) | 32 (3.4%) |
| 7:00 AM to 7:29 AM | 50 (5.8%) | 214 (22.6%) |
| 7:30 AM to 7:59 AM | 136 (15.9%) | 129 (13.6%) |
| 8:00 AM to 8:29 AM | 91 (10.6%) | 266 (28.1%) |
| 8:30 AM to 8:59 AM | 56 (6.5%) | 34 (3.6%) |
| 9:00 AM to 9:59 AM | 54 (6.3%) | 65 (6.9%) |
| 10:00 AM to 10:59 AM | 0 (0.0%) | 127 (13.4%) |
| 11:00 AM to 11:59 AM | 131 (15.3%) | 0 (0.0%) |
| 12:00 PM to 3:59 PM | 131 (15.3%) | 22 (2.3%) |
| 4:00 PM to 11:59 PM | 57 (6.7%) | 0 (0.0%) |
| Total | 857 (100.0%) | 946 (100.0%) |
Housing Occupancy in Kings Park
Occupancy by Ownership in Kings Park
Of the total 1,396 dwellings in Kings Park, owner-occupied units account for 1,321 (94.6%), while renter-occupied units make up 75 (5.4%).
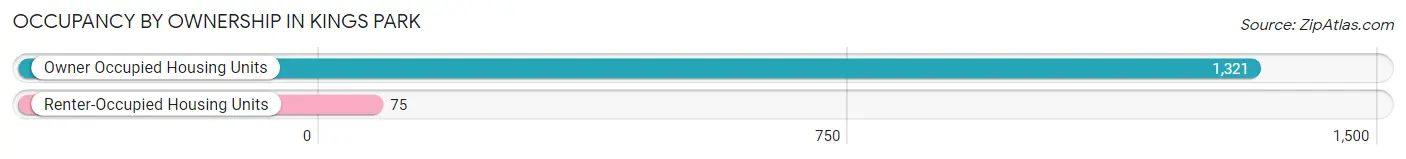
| Occupancy | # Housing Units | % Housing Units |
| Owner Occupied Housing Units | 1,321 | 94.6% |
| Renter-Occupied Housing Units | 75 | 5.4% |
| Total Occupied Housing Units | 1,396 | 100.0% |
Occupancy by Household Size in Kings Park
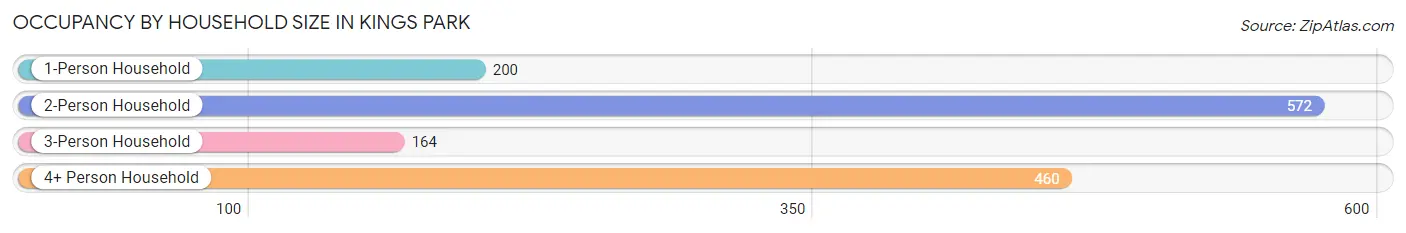
| Household Size | # Housing Units | % Housing Units |
| 1-Person Household | 200 | 14.3% |
| 2-Person Household | 572 | 41.0% |
| 3-Person Household | 164 | 11.7% |
| 4+ Person Household | 460 | 33.0% |
| Total Housing Units | 1,396 | 100.0% |
Occupancy by Ownership by Household Size in Kings Park
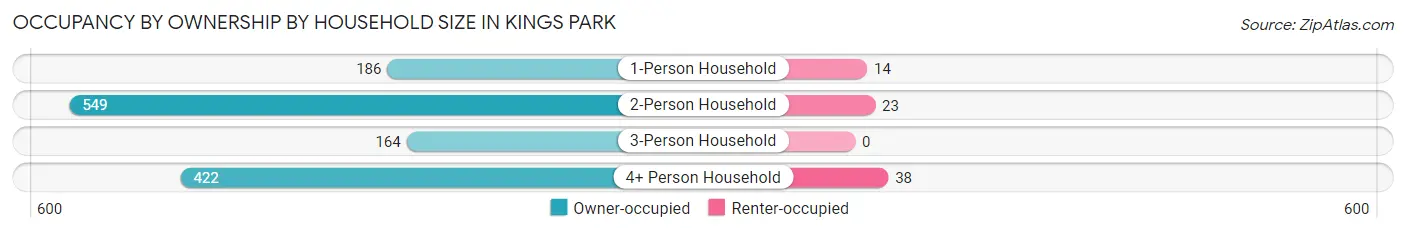
| Household Size | Owner-occupied | Renter-occupied |
| 1-Person Household | 186 (93.0%) | 14 (7.0%) |
| 2-Person Household | 549 (96.0%) | 23 (4.0%) |
| 3-Person Household | 164 (100.0%) | 0 (0.0%) |
| 4+ Person Household | 422 (91.7%) | 38 (8.3%) |
| Total Housing Units | 1,321 (94.6%) | 75 (5.4%) |
Occupancy by Educational Attainment in Kings Park
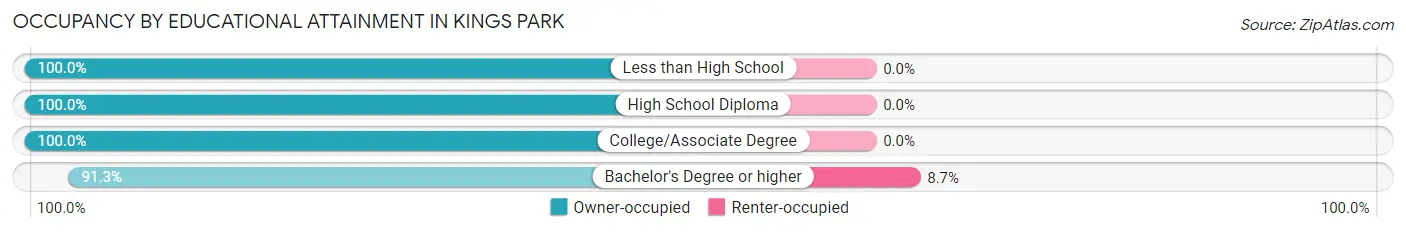
| Household Size | Owner-occupied | Renter-occupied |
| Less than High School | 63 (100.0%) | 0 (0.0%) |
| High School Diploma | 279 (100.0%) | 0 (0.0%) |
| College/Associate Degree | 196 (100.0%) | 0 (0.0%) |
| Bachelor's Degree or higher | 783 (91.3%) | 75 (8.7%) |
Occupancy by Age of Householder in Kings Park
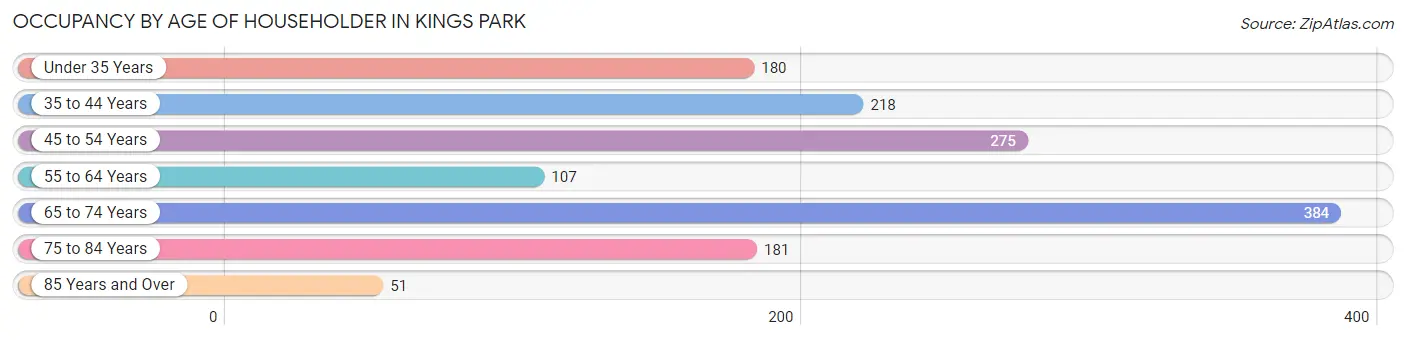
| Age Bracket | # Households | % Households |
| Under 35 Years | 180 | 12.9% |
| 35 to 44 Years | 218 | 15.6% |
| 45 to 54 Years | 275 | 19.7% |
| 55 to 64 Years | 107 | 7.7% |
| 65 to 74 Years | 384 | 27.5% |
| 75 to 84 Years | 181 | 13.0% |
| 85 Years and Over | 51 | 3.6% |
| Total | 1,396 | 100.0% |
Housing Finances in Kings Park
Median Income by Occupancy in Kings Park
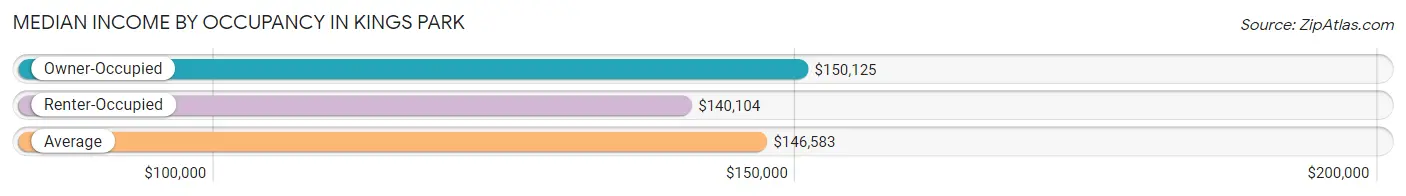
| Occupancy Type | # Households | Median Income |
| Owner-Occupied | 1,321 (94.6%) | $150,125 |
| Renter-Occupied | 75 (5.4%) | $140,104 |
| Average | 1,396 (100.0%) | $146,583 |
Occupancy by Householder Income Bracket in Kings Park
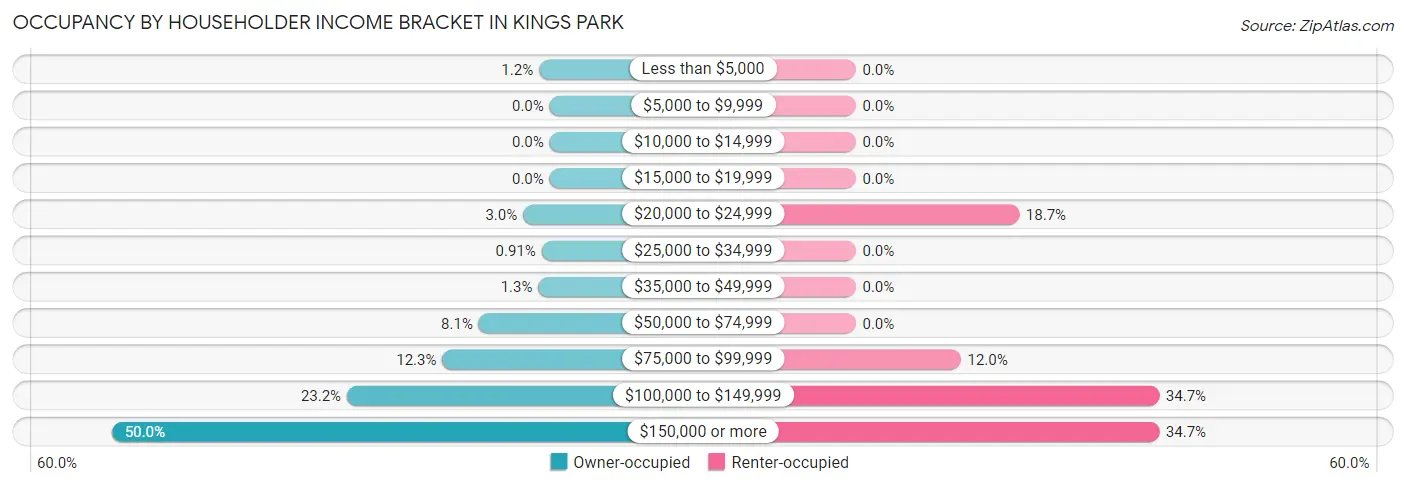
| Income Bracket | Owner-occupied | Renter-occupied |
| Less than $5,000 | 16 (1.2%) | 0 (0.0%) |
| $5,000 to $9,999 | 0 (0.0%) | 0 (0.0%) |
| $10,000 to $14,999 | 0 (0.0%) | 0 (0.0%) |
| $15,000 to $19,999 | 0 (0.0%) | 0 (0.0%) |
| $20,000 to $24,999 | 40 (3.0%) | 14 (18.7%) |
| $25,000 to $34,999 | 12 (0.9%) | 0 (0.0%) |
| $35,000 to $49,999 | 17 (1.3%) | 0 (0.0%) |
| $50,000 to $74,999 | 107 (8.1%) | 0 (0.0%) |
| $75,000 to $99,999 | 162 (12.3%) | 9 (12.0%) |
| $100,000 to $149,999 | 306 (23.2%) | 26 (34.7%) |
| $150,000 or more | 661 (50.0%) | 26 (34.7%) |
| Total | 1,321 (100.0%) | 75 (100.0%) |
Monthly Housing Cost Tiers in Kings Park
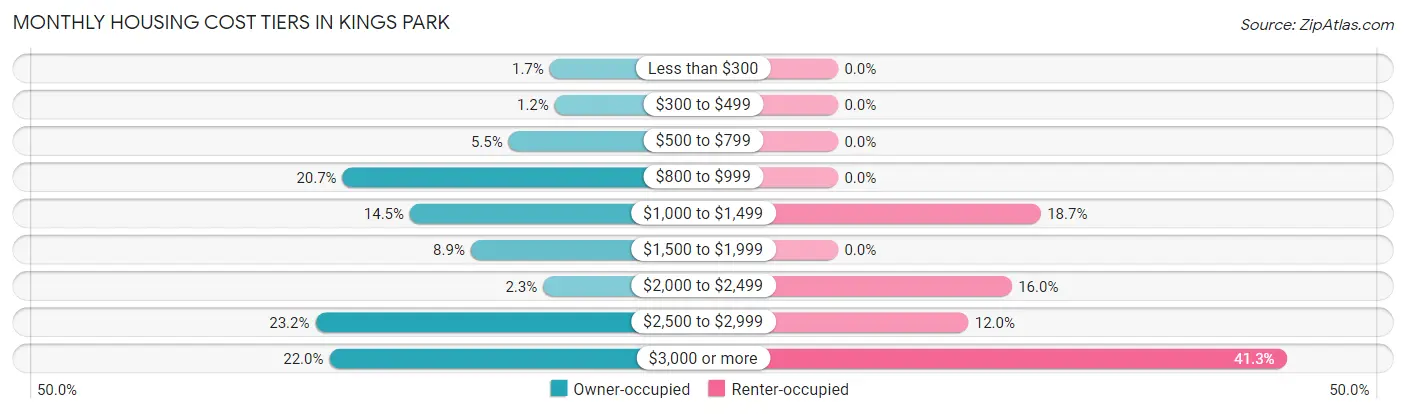
| Monthly Cost | Owner-occupied | Renter-occupied |
| Less than $300 | 22 (1.7%) | 0 (0.0%) |
| $300 to $499 | 16 (1.2%) | 0 (0.0%) |
| $500 to $799 | 72 (5.4%) | 0 (0.0%) |
| $800 to $999 | 274 (20.7%) | 0 (0.0%) |
| $1,000 to $1,499 | 192 (14.5%) | 14 (18.7%) |
| $1,500 to $1,999 | 118 (8.9%) | 0 (0.0%) |
| $2,000 to $2,499 | 30 (2.3%) | 12 (16.0%) |
| $2,500 to $2,999 | 307 (23.2%) | 9 (12.0%) |
| $3,000 or more | 290 (22.0%) | 31 (41.3%) |
| Total | 1,321 (100.0%) | 75 (100.0%) |
Physical Housing Characteristics in Kings Park
Housing Structures in Kings Park
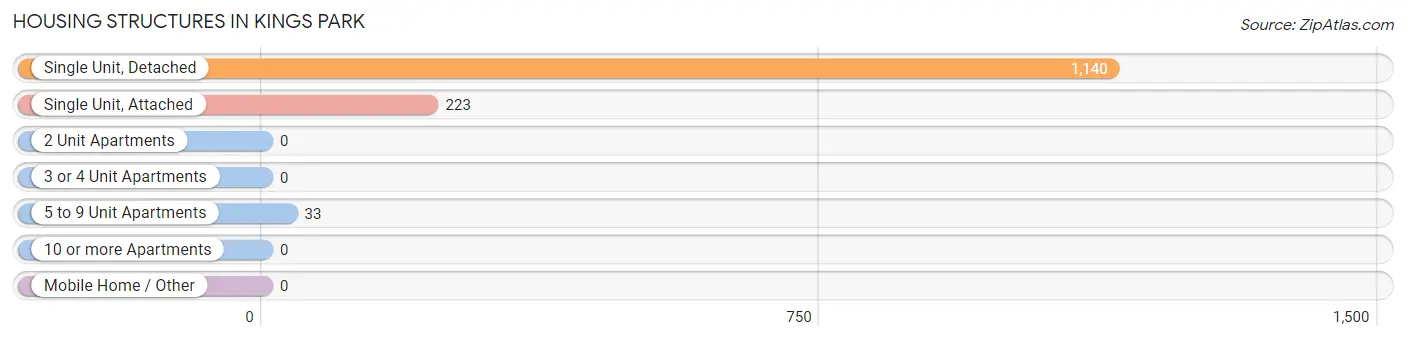
| Structure Type | # Housing Units | % Housing Units |
| Single Unit, Detached | 1,140 | 81.7% |
| Single Unit, Attached | 223 | 16.0% |
| 2 Unit Apartments | 0 | 0.0% |
| 3 or 4 Unit Apartments | 0 | 0.0% |
| 5 to 9 Unit Apartments | 33 | 2.4% |
| 10 or more Apartments | 0 | 0.0% |
| Mobile Home / Other | 0 | 0.0% |
| Total | 1,396 | 100.0% |
Housing Structures by Occupancy in Kings Park
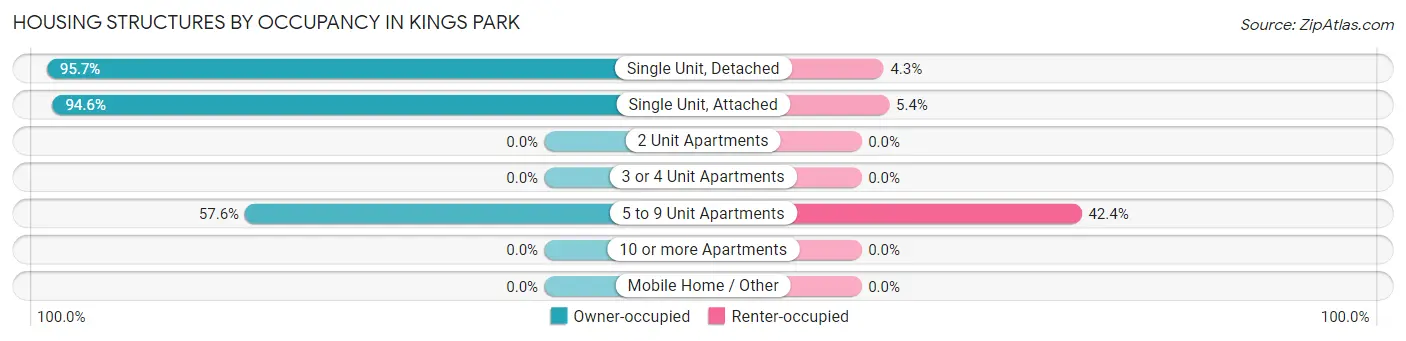
| Structure Type | Owner-occupied | Renter-occupied |
| Single Unit, Detached | 1,091 (95.7%) | 49 (4.3%) |
| Single Unit, Attached | 211 (94.6%) | 12 (5.4%) |
| 2 Unit Apartments | 0 (0.0%) | 0 (0.0%) |
| 3 or 4 Unit Apartments | 0 (0.0%) | 0 (0.0%) |
| 5 to 9 Unit Apartments | 19 (57.6%) | 14 (42.4%) |
| 10 or more Apartments | 0 (0.0%) | 0 (0.0%) |
| Mobile Home / Other | 0 (0.0%) | 0 (0.0%) |
| Total | 1,321 (94.6%) | 75 (5.4%) |
Housing Structures by Number of Rooms in Kings Park
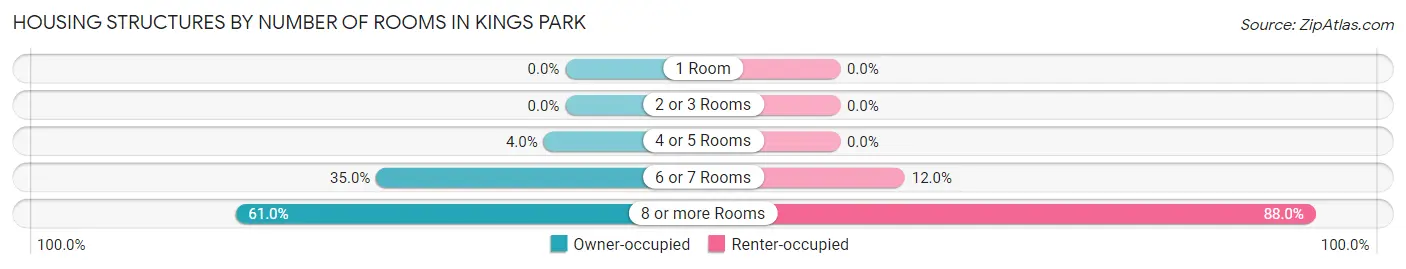
| Number of Rooms | Owner-occupied | Renter-occupied |
| 1 Room | 0 (0.0%) | 0 (0.0%) |
| 2 or 3 Rooms | 0 (0.0%) | 0 (0.0%) |
| 4 or 5 Rooms | 53 (4.0%) | 0 (0.0%) |
| 6 or 7 Rooms | 462 (35.0%) | 9 (12.0%) |
| 8 or more Rooms | 806 (61.0%) | 66 (88.0%) |
| Total | 1,321 (100.0%) | 75 (100.0%) |
Housing Structure by Heating Type in Kings Park
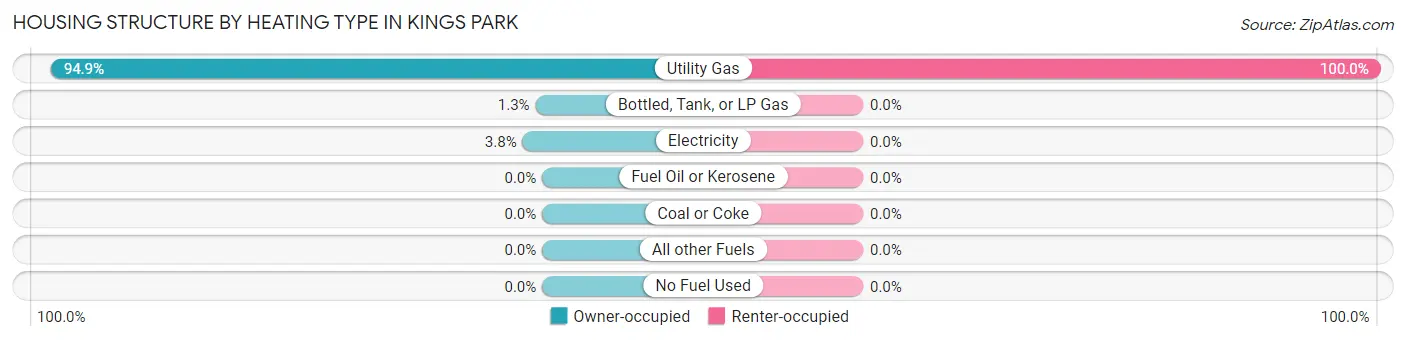
| Heating Type | Owner-occupied | Renter-occupied |
| Utility Gas | 1,254 (94.9%) | 75 (100.0%) |
| Bottled, Tank, or LP Gas | 17 (1.3%) | 0 (0.0%) |
| Electricity | 50 (3.8%) | 0 (0.0%) |
| Fuel Oil or Kerosene | 0 (0.0%) | 0 (0.0%) |
| Coal or Coke | 0 (0.0%) | 0 (0.0%) |
| All other Fuels | 0 (0.0%) | 0 (0.0%) |
| No Fuel Used | 0 (0.0%) | 0 (0.0%) |
| Total | 1,321 (100.0%) | 75 (100.0%) |
Household Vehicle Usage in Kings Park
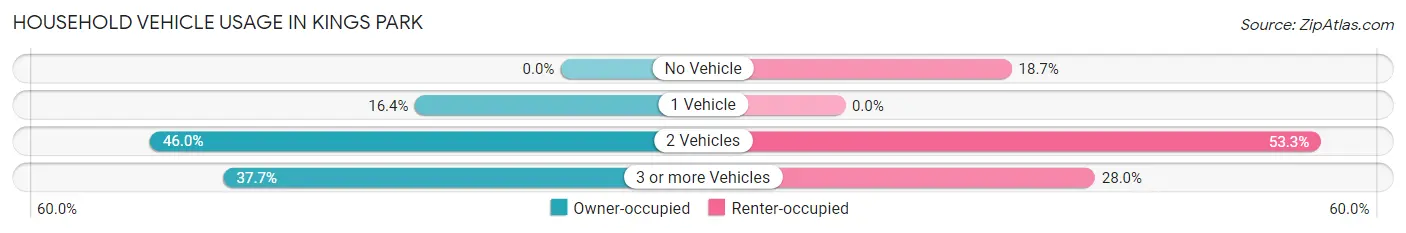
| Vehicles per Household | Owner-occupied | Renter-occupied |
| No Vehicle | 0 (0.0%) | 14 (18.7%) |
| 1 Vehicle | 216 (16.4%) | 0 (0.0%) |
| 2 Vehicles | 607 (46.0%) | 40 (53.3%) |
| 3 or more Vehicles | 498 (37.7%) | 21 (28.0%) |
| Total | 1,321 (100.0%) | 75 (100.0%) |
Real Estate & Mortgages in Kings Park
Real Estate and Mortgage Overview in Kings Park
| Characteristic | Without Mortgage | With Mortgage |
| Housing Units | 508 | 813 |
| Median Property Value | $597,000 | $606,100 |
| Median Household Income | $135,821 | $514 |
| Monthly Housing Costs | $939 | $290 |
| Real Estate Taxes | $6,198 | $0 |
Property Value by Mortgage Status in Kings Park
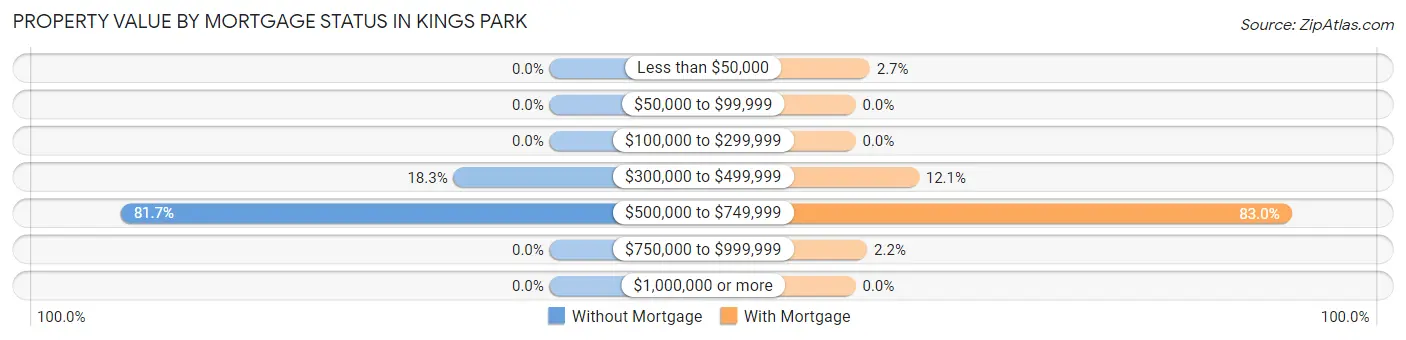
| Property Value | Without Mortgage | With Mortgage |
| Less than $50,000 | 0 (0.0%) | 22 (2.7%) |
| $50,000 to $99,999 | 0 (0.0%) | 0 (0.0%) |
| $100,000 to $299,999 | 0 (0.0%) | 0 (0.0%) |
| $300,000 to $499,999 | 93 (18.3%) | 98 (12.0%) |
| $500,000 to $749,999 | 415 (81.7%) | 675 (83.0%) |
| $750,000 to $999,999 | 0 (0.0%) | 18 (2.2%) |
| $1,000,000 or more | 0 (0.0%) | 0 (0.0%) |
| Total | 508 (100.0%) | 813 (100.0%) |
Household Income by Mortgage Status in Kings Park
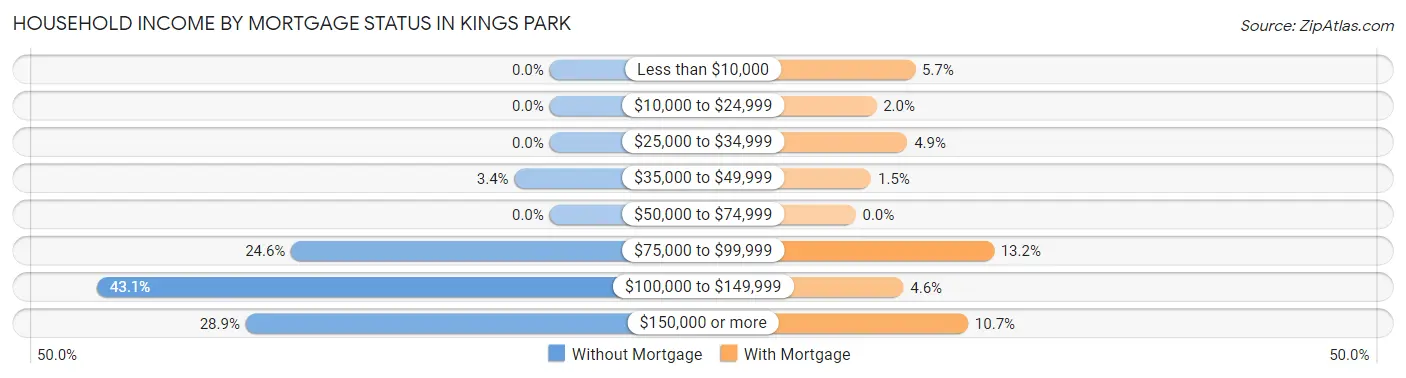
| Household Income | Without Mortgage | With Mortgage |
| Less than $10,000 | 0 (0.0%) | 46 (5.7%) |
| $10,000 to $24,999 | 0 (0.0%) | 16 (2.0%) |
| $25,000 to $34,999 | 0 (0.0%) | 40 (4.9%) |
| $35,000 to $49,999 | 17 (3.4%) | 12 (1.5%) |
| $50,000 to $74,999 | 0 (0.0%) | 0 (0.0%) |
| $75,000 to $99,999 | 125 (24.6%) | 107 (13.2%) |
| $100,000 to $149,999 | 219 (43.1%) | 37 (4.5%) |
| $150,000 or more | 147 (28.9%) | 87 (10.7%) |
| Total | 508 (100.0%) | 813 (100.0%) |
Property Value to Household Income Ratio in Kings Park
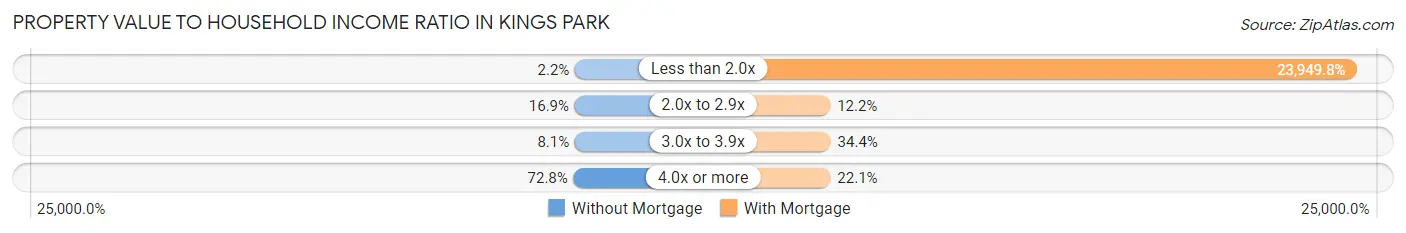
| Value-to-Income Ratio | Without Mortgage | With Mortgage |
| Less than 2.0x | 11 (2.2%) | 194,712 (23,949.8%) |
| 2.0x to 2.9x | 86 (16.9%) | 99 (12.2%) |
| 3.0x to 3.9x | 41 (8.1%) | 280 (34.4%) |
| 4.0x or more | 370 (72.8%) | 180 (22.1%) |
| Total | 508 (100.0%) | 813 (100.0%) |
Real Estate Taxes by Mortgage Status in Kings Park
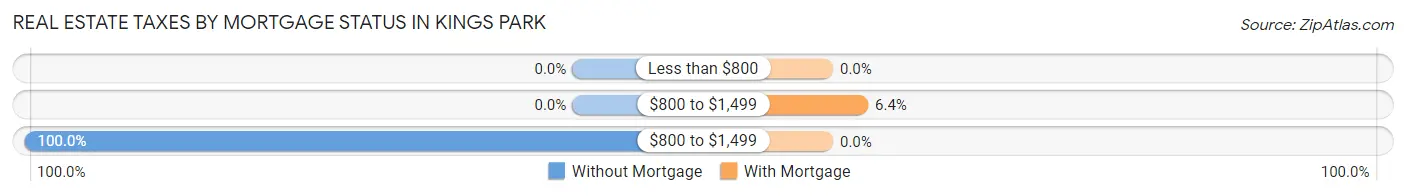
| Property Taxes | Without Mortgage | With Mortgage |
| Less than $800 | 0 (0.0%) | 0 (0.0%) |
| $800 to $1,499 | 0 (0.0%) | 52 (6.4%) |
| $800 to $1,499 | 508 (100.0%) | 0 (0.0%) |
| Total | 508 (100.0%) | 813 (100.0%) |
Health & Disability in Kings Park
Health Insurance Coverage by Age in Kings Park
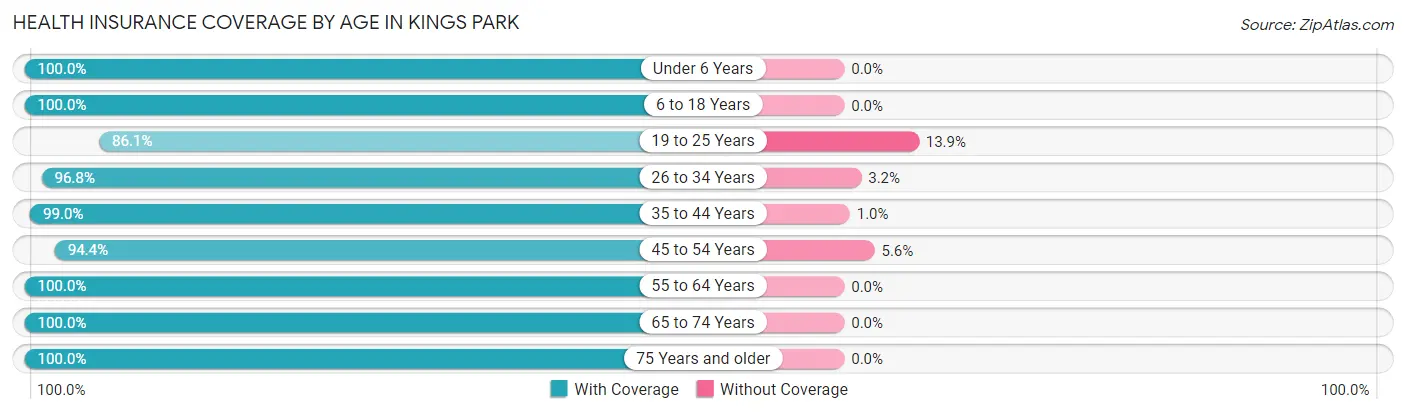
| Age Bracket | With Coverage | Without Coverage |
| Under 6 Years | 217 (100.0%) | 0 (0.0%) |
| 6 to 18 Years | 580 (100.0%) | 0 (0.0%) |
| 19 to 25 Years | 310 (86.1%) | 50 (13.9%) |
| 26 to 34 Years | 214 (96.8%) | 7 (3.2%) |
| 35 to 44 Years | 581 (99.0%) | 6 (1.0%) |
| 45 to 54 Years | 502 (94.4%) | 30 (5.6%) |
| 55 to 64 Years | 449 (100.0%) | 0 (0.0%) |
| 65 to 74 Years | 742 (100.0%) | 0 (0.0%) |
| 75 Years and older | 298 (100.0%) | 0 (0.0%) |
| Total | 3,893 (97.7%) | 93 (2.3%) |
Health Insurance Coverage by Citizenship Status in Kings Park
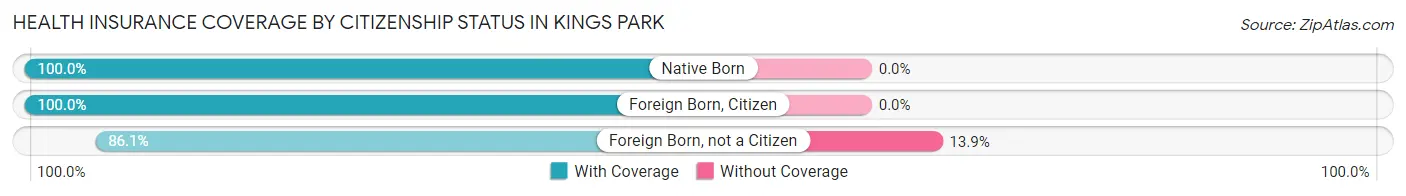
| Citizenship Status | With Coverage | Without Coverage |
| Native Born | 217 (100.0%) | 0 (0.0%) |
| Foreign Born, Citizen | 580 (100.0%) | 0 (0.0%) |
| Foreign Born, not a Citizen | 310 (86.1%) | 50 (13.9%) |
Health Insurance Coverage by Household Income in Kings Park
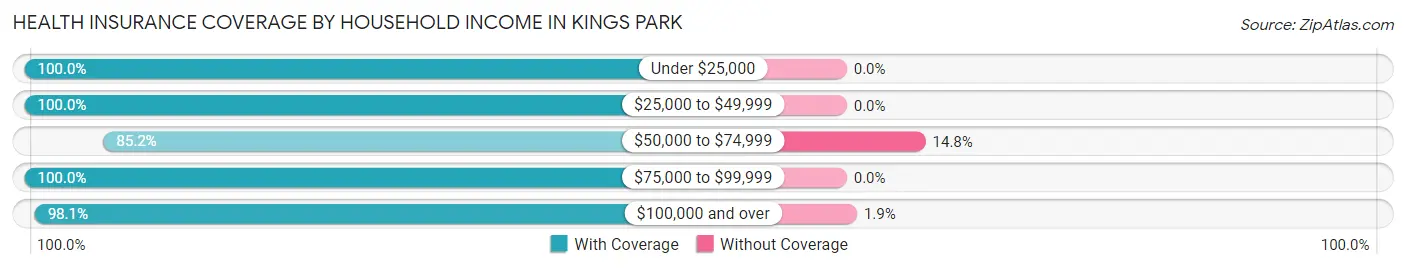
| Household Income | With Coverage | Without Coverage |
| Under $25,000 | 205 (100.0%) | 0 (0.0%) |
| $25,000 to $49,999 | 29 (100.0%) | 0 (0.0%) |
| $50,000 to $74,999 | 202 (85.2%) | 35 (14.8%) |
| $75,000 to $99,999 | 468 (100.0%) | 0 (0.0%) |
| $100,000 and over | 2,975 (98.1%) | 58 (1.9%) |
Public vs Private Health Insurance Coverage by Age in Kings Park
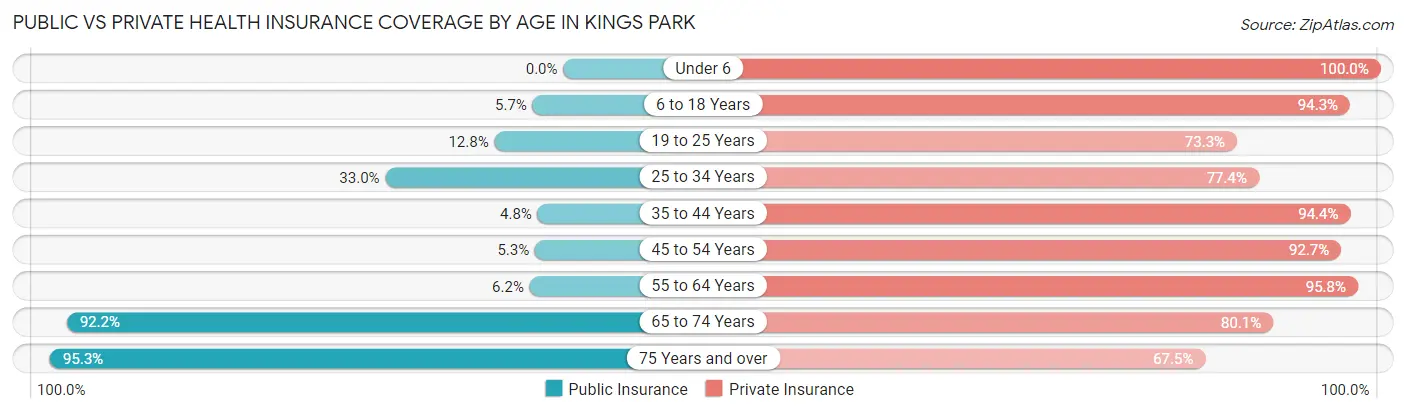
| Age Bracket | Public Insurance | Private Insurance |
| Under 6 | 0 (0.0%) | 217 (100.0%) |
| 6 to 18 Years | 33 (5.7%) | 547 (94.3%) |
| 19 to 25 Years | 46 (12.8%) | 264 (73.3%) |
| 25 to 34 Years | 73 (33.0%) | 171 (77.4%) |
| 35 to 44 Years | 28 (4.8%) | 554 (94.4%) |
| 45 to 54 Years | 28 (5.3%) | 493 (92.7%) |
| 55 to 64 Years | 28 (6.2%) | 430 (95.8%) |
| 65 to 74 Years | 684 (92.2%) | 594 (80.0%) |
| 75 Years and over | 284 (95.3%) | 201 (67.4%) |
| Total | 1,204 (30.2%) | 3,471 (87.1%) |
Disability Status by Sex by Age in Kings Park
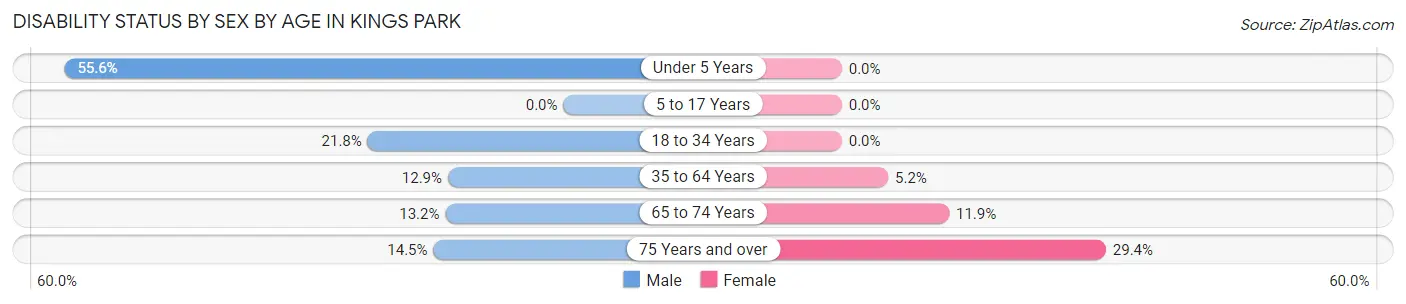
| Age Bracket | Male | Female |
| Under 5 Years | 25 (55.6%) | 0 (0.0%) |
| 5 to 17 Years | 0 (0.0%) | 0 (0.0%) |
| 18 to 34 Years | 58 (21.8%) | 0 (0.0%) |
| 35 to 64 Years | 102 (12.9%) | 40 (5.2%) |
| 65 to 74 Years | 48 (13.2%) | 45 (11.9%) |
| 75 Years and over | 21 (14.5%) | 45 (29.4%) |
Disability Class by Sex by Age in Kings Park
Disability Class: Hearing Difficulty
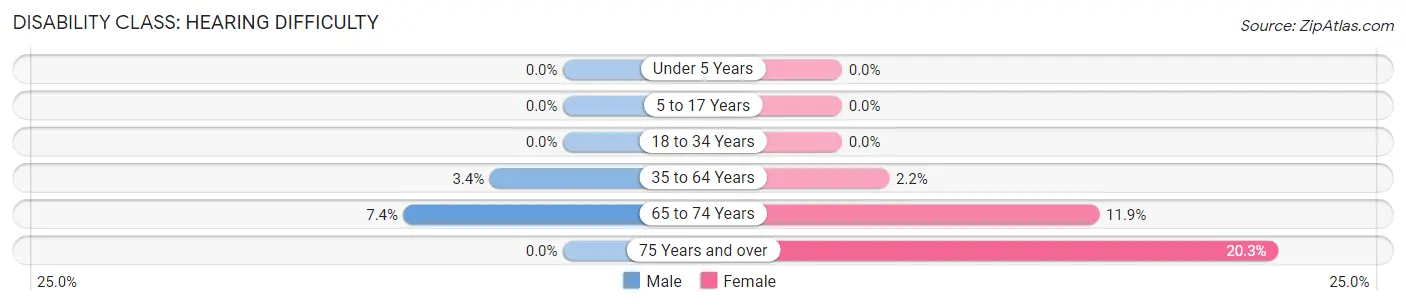
| Age Bracket | Male | Female |
| Under 5 Years | 0 (0.0%) | 0 (0.0%) |
| 5 to 17 Years | 0 (0.0%) | 0 (0.0%) |
| 18 to 34 Years | 0 (0.0%) | 0 (0.0%) |
| 35 to 64 Years | 27 (3.4%) | 17 (2.2%) |
| 65 to 74 Years | 27 (7.4%) | 45 (11.9%) |
| 75 Years and over | 0 (0.0%) | 31 (20.3%) |
Disability Class: Vision Difficulty
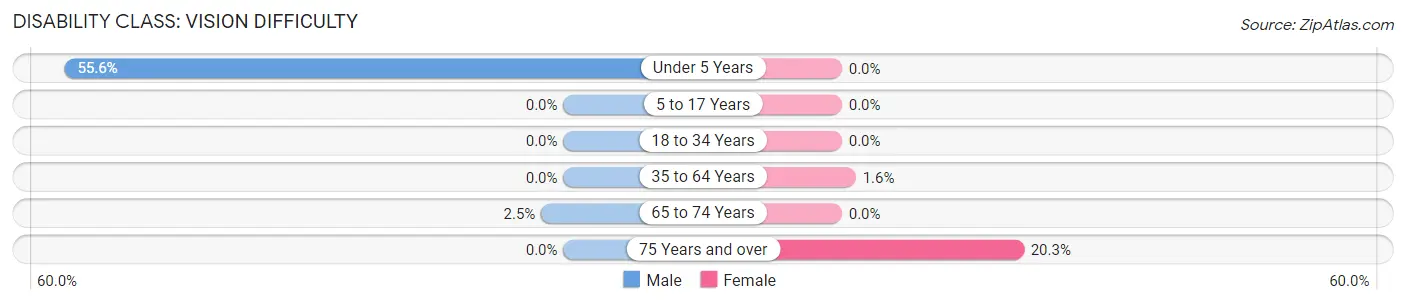
| Age Bracket | Male | Female |
| Under 5 Years | 25 (55.6%) | 0 (0.0%) |
| 5 to 17 Years | 0 (0.0%) | 0 (0.0%) |
| 18 to 34 Years | 0 (0.0%) | 0 (0.0%) |
| 35 to 64 Years | 0 (0.0%) | 12 (1.5%) |
| 65 to 74 Years | 9 (2.5%) | 0 (0.0%) |
| 75 Years and over | 0 (0.0%) | 31 (20.3%) |
Disability Class: Cognitive Difficulty
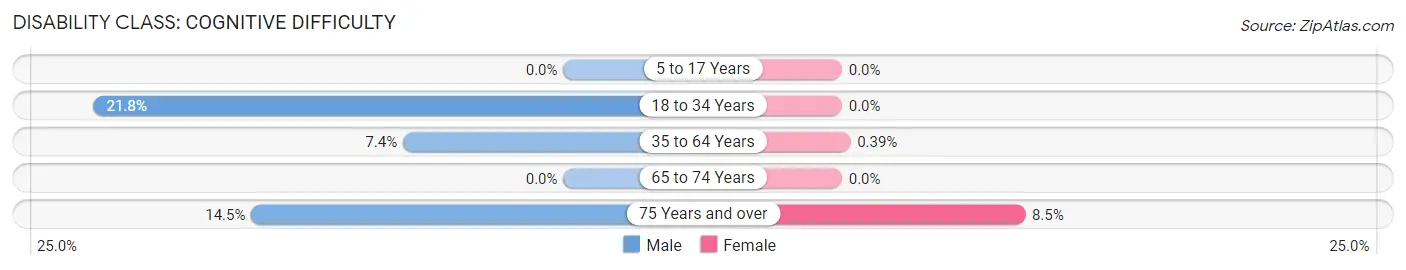
| Age Bracket | Male | Female |
| 5 to 17 Years | 0 (0.0%) | 0 (0.0%) |
| 18 to 34 Years | 58 (21.8%) | 0 (0.0%) |
| 35 to 64 Years | 59 (7.4%) | 3 (0.4%) |
| 65 to 74 Years | 0 (0.0%) | 0 (0.0%) |
| 75 Years and over | 21 (14.5%) | 13 (8.5%) |
Disability Class: Ambulatory Difficulty
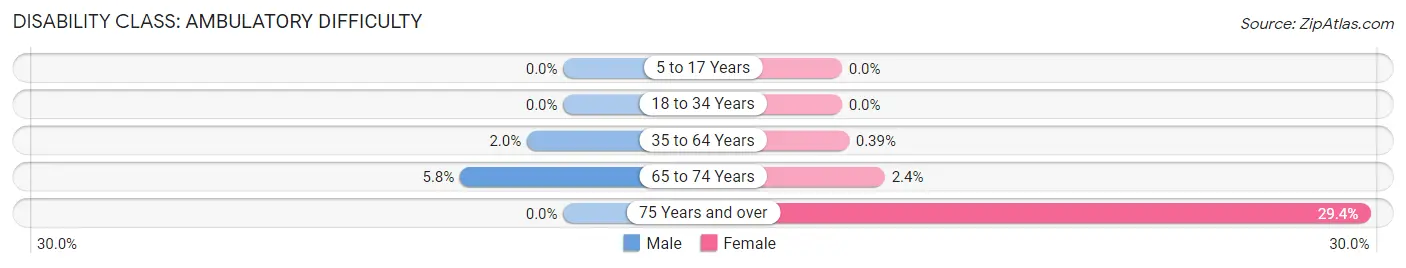
| Age Bracket | Male | Female |
| 5 to 17 Years | 0 (0.0%) | 0 (0.0%) |
| 18 to 34 Years | 0 (0.0%) | 0 (0.0%) |
| 35 to 64 Years | 16 (2.0%) | 3 (0.4%) |
| 65 to 74 Years | 21 (5.8%) | 9 (2.4%) |
| 75 Years and over | 0 (0.0%) | 45 (29.4%) |
Disability Class: Self-Care Difficulty
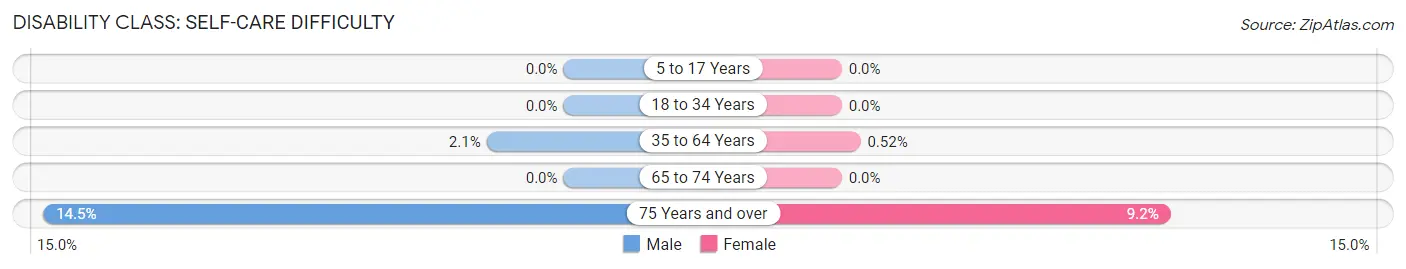
| Age Bracket | Male | Female |
| 5 to 17 Years | 0 (0.0%) | 0 (0.0%) |
| 18 to 34 Years | 0 (0.0%) | 0 (0.0%) |
| 35 to 64 Years | 17 (2.1%) | 4 (0.5%) |
| 65 to 74 Years | 0 (0.0%) | 0 (0.0%) |
| 75 Years and over | 21 (14.5%) | 14 (9.1%) |
Technology Access in Kings Park
Computing Device Access in Kings Park
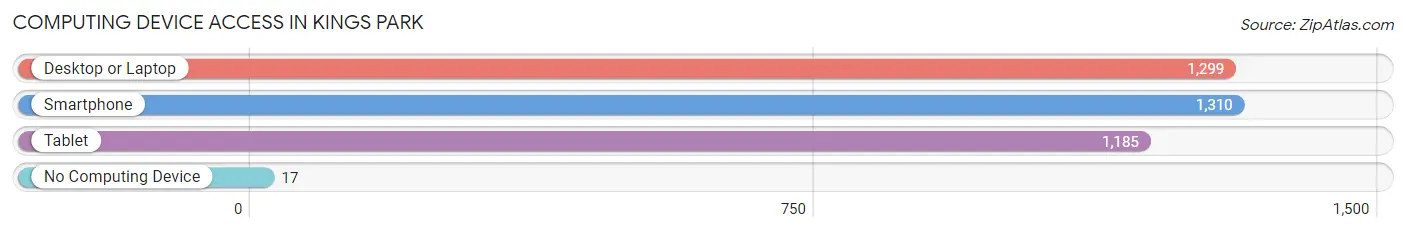
| Device Type | # Households | % Households |
| Desktop or Laptop | 1,299 | 93.0% |
| Smartphone | 1,310 | 93.8% |
| Tablet | 1,185 | 84.9% |
| No Computing Device | 17 | 1.2% |
| Total | 1,396 | 100.0% |
Internet Access in Kings Park
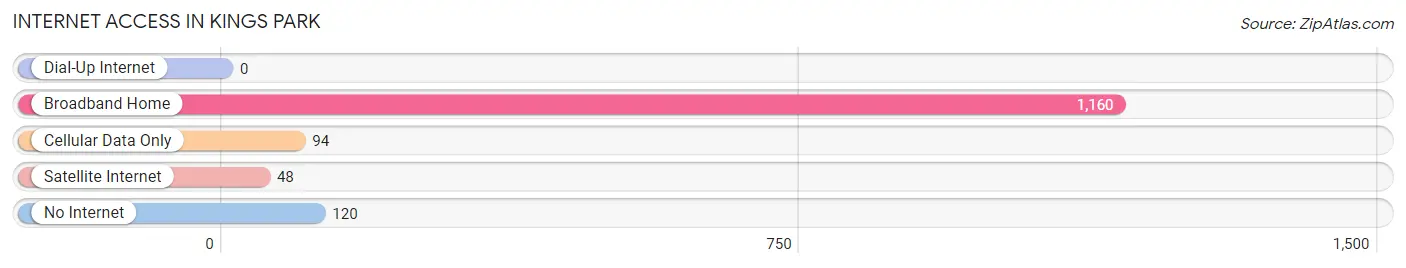
| Internet Type | # Households | % Households |
| Dial-Up Internet | 0 | 0.0% |
| Broadband Home | 1,160 | 83.1% |
| Cellular Data Only | 94 | 6.7% |
| Satellite Internet | 48 | 3.4% |
| No Internet | 120 | 8.6% |
| Total | 1,396 | 100.0% |
Kings Park Summary
History
Kings Park is a census-designated place (CDP) located in Fairfax County, Virginia. It is situated in the southeastern corner of the county, just north of the city of Alexandria. The area was first settled in the late 1700s by a group of Quakers who established a small farming community. The area was known as Kings Park until the early 1900s when it was renamed to its current name.
The area was largely rural until the 1950s when the population began to grow rapidly due to the expansion of the Washington, D.C. metropolitan area. The population of Kings Park increased from 1,000 in 1950 to over 10,000 by the year 2000.
Geography
Kings Park is located in the southeastern corner of Fairfax County, Virginia. It is bordered by the city of Alexandria to the south, the Potomac River to the east, and the towns of Lorton and Occoquan to the north and west, respectively. The area is mostly flat, with some rolling hills in the northern part of the CDP.
The climate in Kings Park is temperate, with hot summers and mild winters. The average annual temperature is around 60 degrees Fahrenheit (15.5 degrees Celsius). The average annual precipitation is around 40 inches (101.6 cm).
Economy
The economy of Kings Park is largely based on the service industry. The area is home to a number of government contractors, as well as several large retail stores. The area also has a number of small businesses, including restaurants, shops, and professional services.
The unemployment rate in Kings Park is lower than the national average, and the median household income is higher than the national average. The median home value in Kings Park is also higher than the national average.
Demographics
As of the 2010 census, the population of Kings Park was 11,845. The racial makeup of the CDP was 79.3% White, 11.2% African American, 4.2% Asian, and 5.3% other. The median age was 38.7 years.
The median household income in Kings Park was $90,845, and the median home value was $521,000. The homeownership rate was 75.3%.
Conclusion
Kings Park is a census-designated place located in Fairfax County, Virginia. It is situated in the southeastern corner of the county, just north of the city of Alexandria. The area was first settled in the late 1700s by a group of Quakers who established a small farming community. The area was largely rural until the 1950s when the population began to grow rapidly due to the expansion of the Washington, D.C. metropolitan area. The economy of Kings Park is largely based on the service industry, and the median household income is higher than the national average. As of the 2010 census, the population of Kings Park was 11,845. The racial makeup of the CDP was 79.3% White, 11.2% African American, 4.2% Asian, and 5.3% other.
Common Questions
What is Per Capita Income in Kings Park?
Per Capita income in Kings Park is $57,703.
What is the Median Family Income in Kings Park?
Median Family Income in Kings Park is $157,426.
What is the Median Household income in Kings Park?
Median Household Income in Kings Park is $146,583.
What is Income or Wage Gap in Kings Park?
Income or Wage Gap in Kings Park is 1.1%.
Women in Kings Park earn 98.9 cents for every dollar earned by a man.
What is Inequality or Gini Index in Kings Park?
Inequality or Gini Index in Kings Park is 0.31.
What is the Total Population of Kings Park?
Total Population of Kings Park is 4,003.
What is the Total Male Population of Kings Park?
Total Male Population of Kings Park is 1,937.
What is the Total Female Population of Kings Park?
Total Female Population of Kings Park is 2,066.
What is the Ratio of Males per 100 Females in Kings Park?
There are 93.76 Males per 100 Females in Kings Park.
What is the Ratio of Females per 100 Males in Kings Park?
There are 106.66 Females per 100 Males in Kings Park.
What is the Median Population Age in Kings Park?
Median Population Age in Kings Park is 45.5 Years.
What is the Average Family Size in Kings Park
Average Family Size in Kings Park is 3.1 People.
What is the Average Household Size in Kings Park
Average Household Size in Kings Park is 2.9 People.
How Large is the Labor Force in Kings Park?
There are 2,306 People in the Labor Forcein in Kings Park.
What is the Percentage of People in the Labor Force in Kings Park?
68.4% of People are in the Labor Force in Kings Park.
What is the Unemployment Rate in Kings Park?
Unemployment Rate in Kings Park is 4.8%.