Manchester, VA Map & Demographics
Manchester Map
Manchester Overview
$34,044
PER CAPITA INCOME
$89,274
AVG FAMILY INCOME
$70,841
AVG HOUSEHOLD INCOME
6.4%
WAGE / INCOME GAP [ % ]
93.6¢/ $1
WAGE / INCOME GAP [ $ ]
0.38
INEQUALITY / GINI INDEX
11,929
TOTAL POPULATION
5,658
MALE POPULATION
6,271
FEMALE POPULATION
90.22
MALES / 100 FEMALES
110.83
FEMALES / 100 MALES
34.1
MEDIAN AGE
3.2
AVG FAMILY SIZE
2.4
AVG HOUSEHOLD SIZE
7,107
LABOR FORCE [ PEOPLE ]
75.7%
PERCENT IN LABOR FORCE
7.8%
UNEMPLOYMENT RATE
Income in Manchester
Income Overview in Manchester
Per Capita Income in Manchester is $34,044, while median incomes of families and households are $89,274 and $70,841 respectively.
| Characteristic | Number | Measure |
| Per Capita Income | 11,929 | $34,044 |
| Median Family Income | 2,970 | $89,274 |
| Mean Family Income | 2,970 | $96,475 |
| Median Household Income | 4,924 | $70,841 |
| Mean Household Income | 4,924 | $82,387 |
| Income Deficit | 2,970 | $0 |
| Wage / Income Gap (%) | 11,929 | 6.45% |
| Wage / Income Gap ($) | 11,929 | 93.55¢ per $1 |
| Gini / Inequality Index | 11,929 | 0.38 |
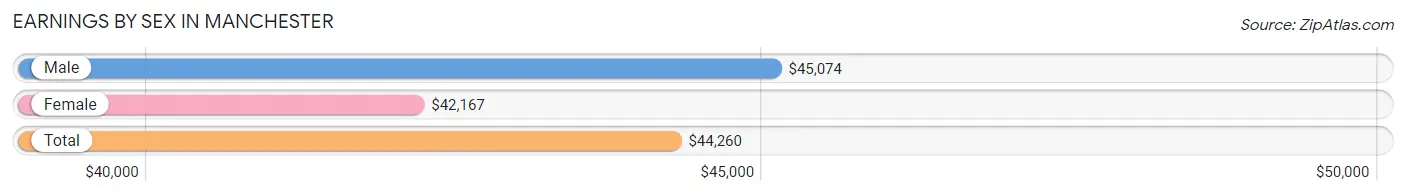
Earnings by Sex in Manchester
Average Earnings in Manchester are $44,260, $45,074 for men and $42,167 for women, a difference of 6.5%.
| Sex | Number | Average Earnings |
| Male | 3,560 (48.5%) | $45,074 |
| Female | 3,787 (51.5%) | $42,167 |
| Total | 7,347 (100.0%) | $44,260 |
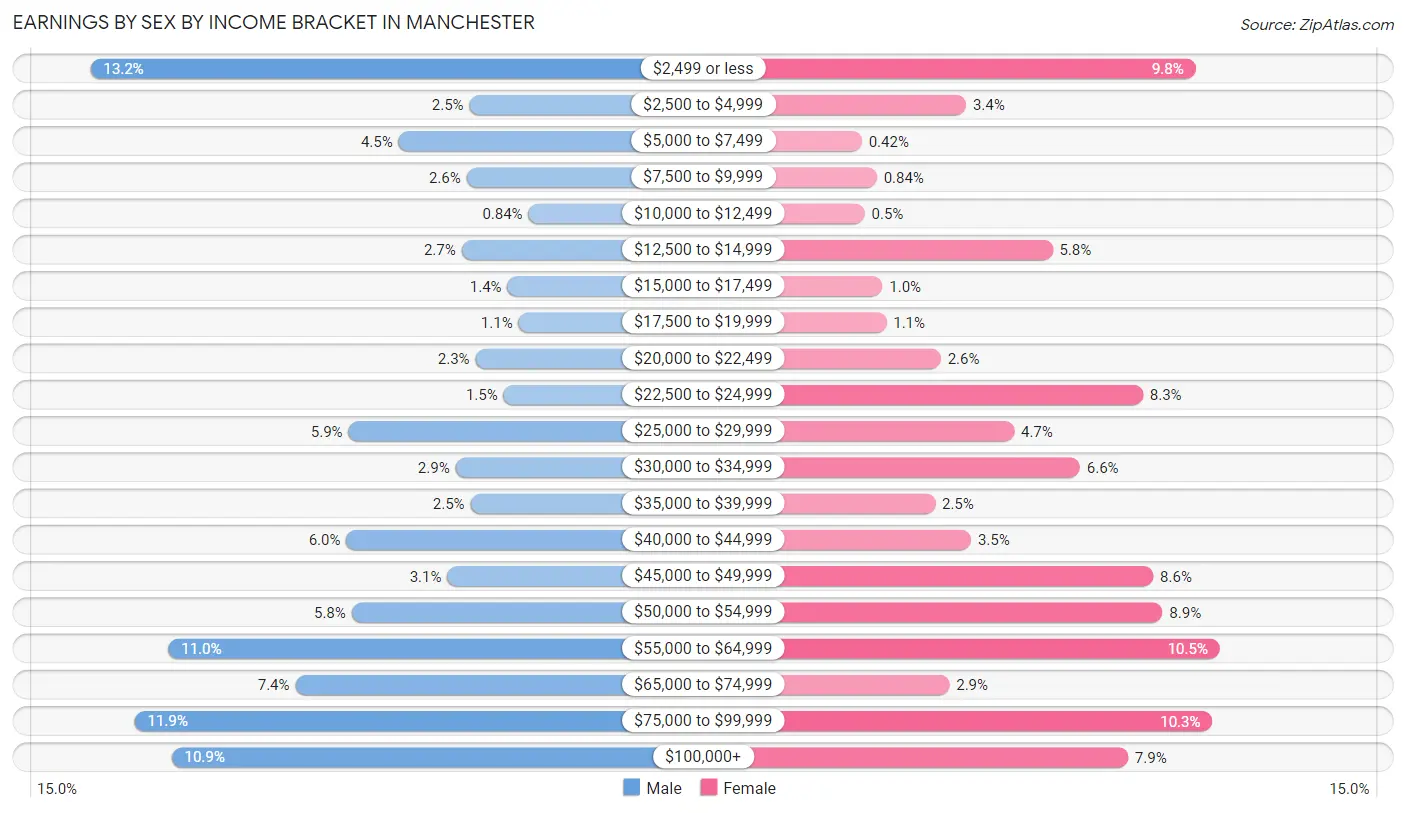
Earnings by Sex by Income Bracket in Manchester
The most common earnings brackets in Manchester are $2,499 or less for men (468 | 13.2%) and $55,000 to $64,999 for women (397 | 10.5%).
| Income | Male | Female |
| $2,499 or less | 468 (13.2%) | 371 (9.8%) |
| $2,500 to $4,999 | 89 (2.5%) | 127 (3.4%) |
| $5,000 to $7,499 | 160 (4.5%) | 16 (0.4%) |
| $7,500 to $9,999 | 92 (2.6%) | 32 (0.8%) |
| $10,000 to $12,499 | 30 (0.8%) | 19 (0.5%) |
| $12,500 to $14,999 | 97 (2.7%) | 219 (5.8%) |
| $15,000 to $17,499 | 51 (1.4%) | 38 (1.0%) |
| $17,500 to $19,999 | 40 (1.1%) | 42 (1.1%) |
| $20,000 to $22,499 | 83 (2.3%) | 100 (2.6%) |
| $22,500 to $24,999 | 55 (1.5%) | 315 (8.3%) |
| $25,000 to $29,999 | 210 (5.9%) | 178 (4.7%) |
| $30,000 to $34,999 | 103 (2.9%) | 248 (6.6%) |
| $35,000 to $39,999 | 88 (2.5%) | 94 (2.5%) |
| $40,000 to $44,999 | 212 (6.0%) | 132 (3.5%) |
| $45,000 to $49,999 | 111 (3.1%) | 326 (8.6%) |
| $50,000 to $54,999 | 207 (5.8%) | 336 (8.9%) |
| $55,000 to $64,999 | 390 (11.0%) | 397 (10.5%) |
| $65,000 to $74,999 | 263 (7.4%) | 109 (2.9%) |
| $75,000 to $99,999 | 424 (11.9%) | 389 (10.3%) |
| $100,000+ | 387 (10.9%) | 299 (7.9%) |
| Total | 3,560 (100.0%) | 3,787 (100.0%) |
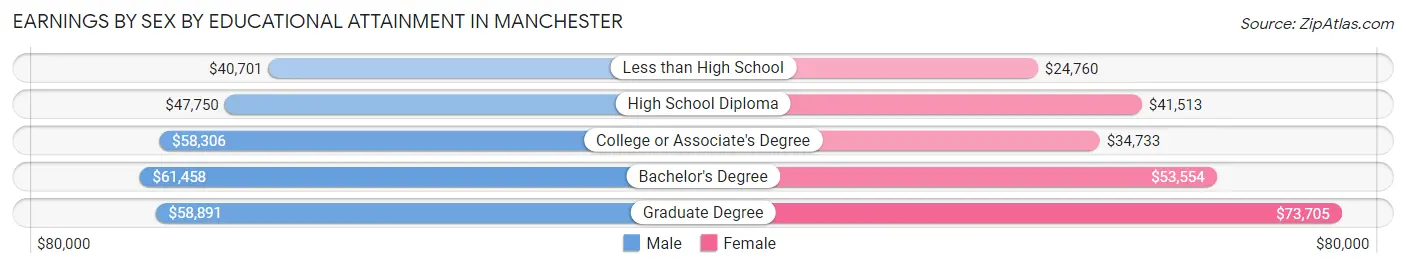
Earnings by Sex by Educational Attainment in Manchester
Average earnings in Manchester are $55,248 for men and $48,444 for women, a difference of 12.3%. Men with an educational attainment of bachelor's degree enjoy the highest average annual earnings of $61,458, while those with less than high school education earn the least with $40,701. Women with an educational attainment of graduate degree earn the most with the average annual earnings of $73,705, while those with less than high school education have the smallest earnings of $24,760.
| Educational Attainment | Male Income | Female Income |
| Less than High School | $40,701 | $24,760 |
| High School Diploma | $47,750 | $41,513 |
| College or Associate's Degree | $58,306 | $34,733 |
| Bachelor's Degree | $61,458 | $53,554 |
| Graduate Degree | $58,891 | $73,705 |
| Total | $55,248 | $48,444 |
Family Income in Manchester
Family Income Brackets in Manchester
According to the Manchester family income data, there are 781 families falling into the $100,000 to $149,999 income range, which is the most common income bracket and makes up 26.3% of all families. Conversely, the $10,000 to $14,999 income bracket is the least frequent group with only 15 families (0.5%) belonging to this category.
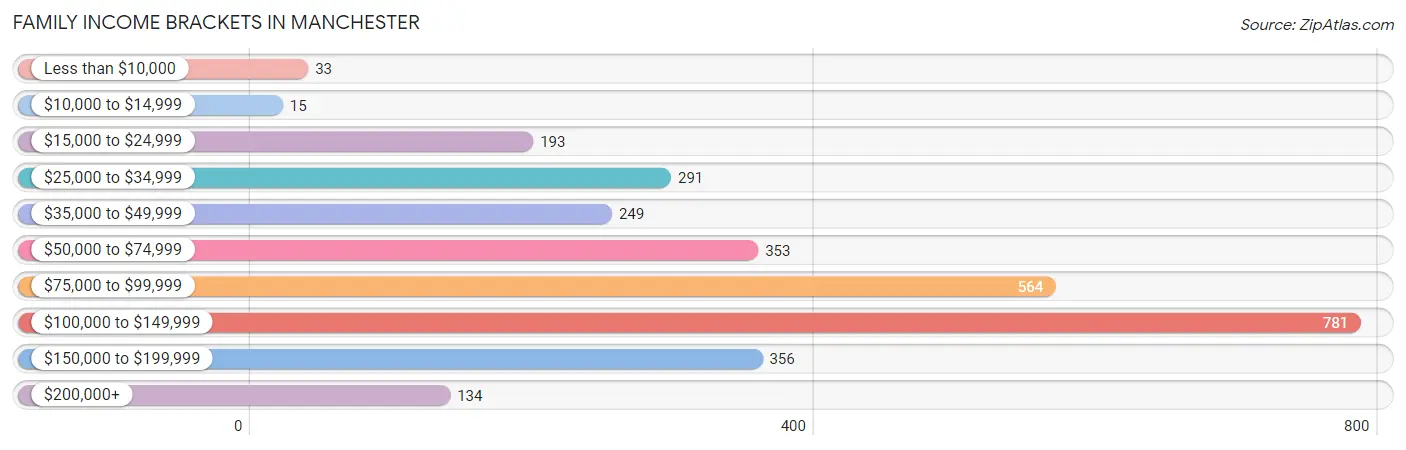
| Income Bracket | # Families | % Families |
| Less than $10,000 | 33 | 1.1% |
| $10,000 to $14,999 | 15 | 0.5% |
| $15,000 to $24,999 | 193 | 6.5% |
| $25,000 to $34,999 | 291 | 9.8% |
| $35,000 to $49,999 | 249 | 8.4% |
| $50,000 to $74,999 | 353 | 11.9% |
| $75,000 to $99,999 | 564 | 19.0% |
| $100,000 to $149,999 | 781 | 26.3% |
| $150,000 to $199,999 | 356 | 12.0% |
| $200,000+ | 134 | 4.5% |
Family Income by Famaliy Size in Manchester
3-person families (633 | 21.3%) account for the highest median family income in Manchester with $118,255 per family, while 3-person families (633 | 21.3%) have the highest median income of $39,418 per family member.
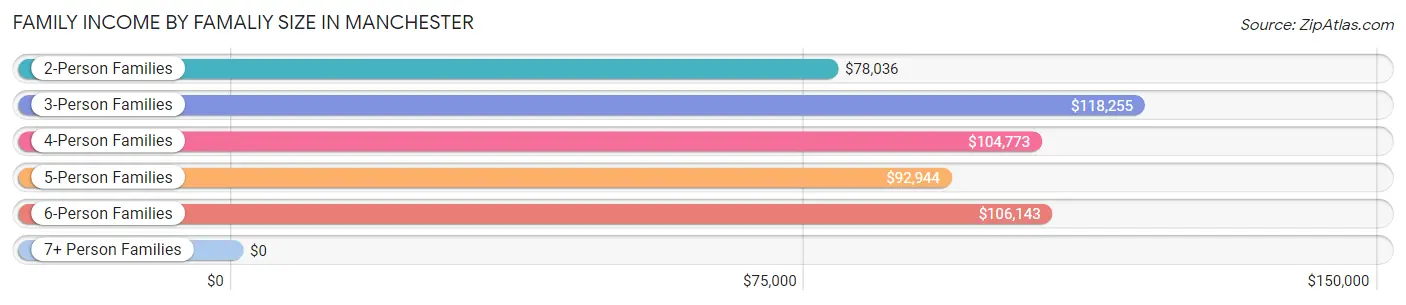
| Income Bracket | # Families | Median Income |
| 2-Person Families | 1,215 (40.9%) | $78,036 |
| 3-Person Families | 633 (21.3%) | $118,255 |
| 4-Person Families | 682 (23.0%) | $104,773 |
| 5-Person Families | 328 (11.0%) | $92,944 |
| 6-Person Families | 62 (2.1%) | $106,143 |
| 7+ Person Families | 50 (1.7%) | $0 |
| Total | 2,970 (100.0%) | $89,274 |
Family Income by Number of Earners in Manchester
The median family income in Manchester is $89,274, with families comprising 3+ earners (659) having the highest median family income of $129,193, while families with 1 earner (883) have the lowest median family income of $56,010, accounting for 22.2% and 29.7% of families, respectively.
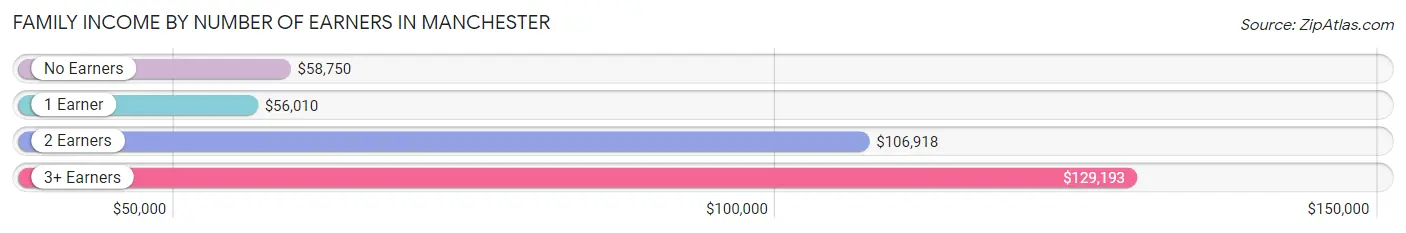
| Number of Earners | # Families | Median Income |
| No Earners | 197 (6.6%) | $58,750 |
| 1 Earner | 883 (29.7%) | $56,010 |
| 2 Earners | 1,231 (41.4%) | $106,918 |
| 3+ Earners | 659 (22.2%) | $129,193 |
| Total | 2,970 (100.0%) | $89,274 |
Household Income in Manchester
Household Income Brackets in Manchester
With 970 households falling in the category, the $100,000 to $149,999 income range is the most frequent in Manchester, accounting for 19.7% of all households. In contrast, only 89 households (1.8%) fall into the $10,000 to $14,999 income bracket, making it the least populous group.
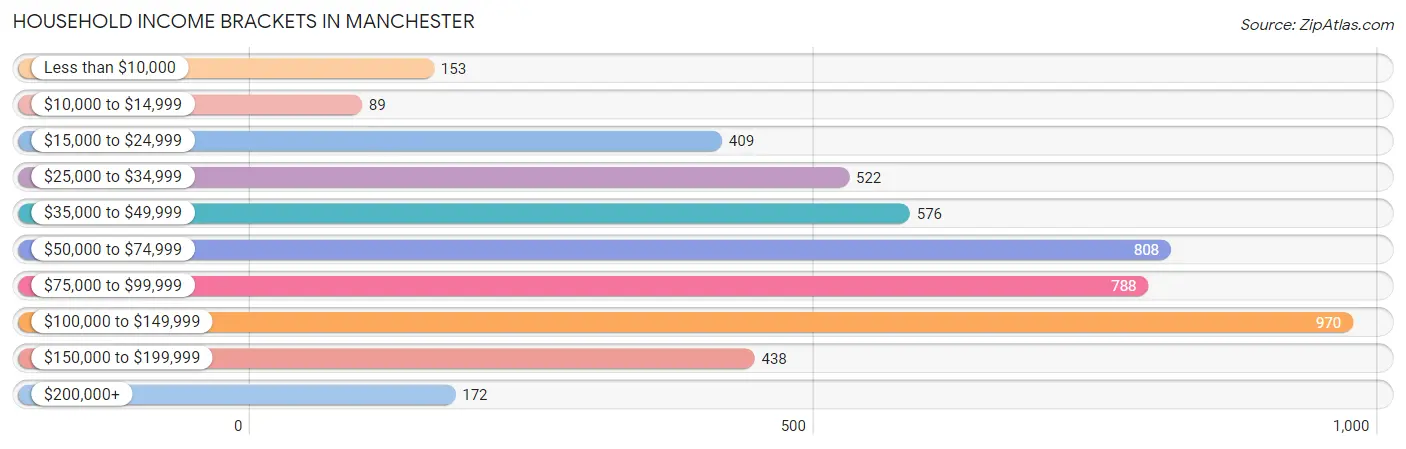
| Income Bracket | # Households | % Households |
| Less than $10,000 | 153 | 3.1% |
| $10,000 to $14,999 | 89 | 1.8% |
| $15,000 to $24,999 | 409 | 8.3% |
| $25,000 to $34,999 | 522 | 10.6% |
| $35,000 to $49,999 | 576 | 11.7% |
| $50,000 to $74,999 | 808 | 16.4% |
| $75,000 to $99,999 | 788 | 16.0% |
| $100,000 to $149,999 | 970 | 19.7% |
| $150,000 to $199,999 | 438 | 8.9% |
| $200,000+ | 172 | 3.5% |
Household Income by Householder Age in Manchester
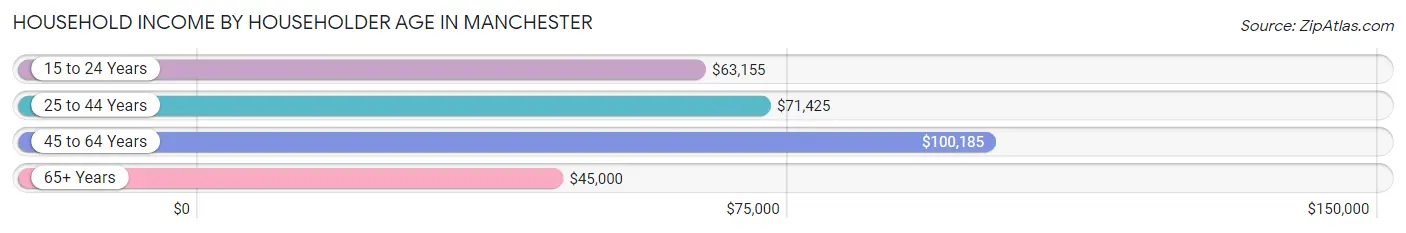
The median household income in Manchester is $70,841, with the highest median household income of $100,185 found in the 45 to 64 years age bracket for the primary householder. A total of 1,718 households (34.9%) fall into this category. Meanwhile, the 65+ years age bracket for the primary householder has the lowest median household income of $45,000, with 1,088 households (22.1%) in this group.
| Income Bracket | # Households | Median Income |
| 15 to 24 Years | 192 (3.9%) | $63,155 |
| 25 to 44 Years | 1,926 (39.1%) | $71,425 |
| 45 to 64 Years | 1,718 (34.9%) | $100,185 |
| 65+ Years | 1,088 (22.1%) | $45,000 |
| Total | 4,924 (100.0%) | $70,841 |
Poverty in Manchester
Income Below Poverty by Sex and Age in Manchester
With 14.4% poverty level for males and 12.2% for females among the residents of Manchester, 15 year old males and 18 to 24 year old females are the most vulnerable to poverty, with 46 males (92.0%) and 200 females (36.0%) in their respective age groups living below the poverty level.
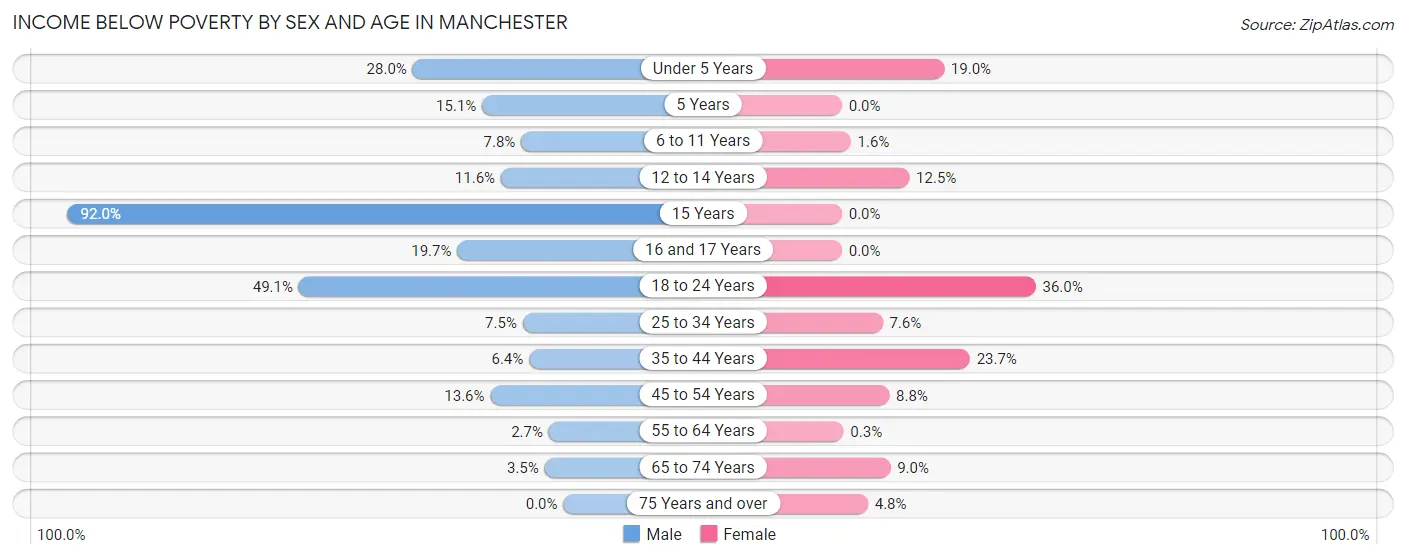
| Age Bracket | Male | Female |
| Under 5 Years | 113 (28.0%) | 58 (19.0%) |
| 5 Years | 22 (15.1%) | 0 (0.0%) |
| 6 to 11 Years | 38 (7.8%) | 5 (1.6%) |
| 12 to 14 Years | 16 (11.6%) | 66 (12.5%) |
| 15 Years | 46 (92.0%) | 0 (0.0%) |
| 16 and 17 Years | 61 (19.7%) | 0 (0.0%) |
| 18 to 24 Years | 248 (49.1%) | 200 (36.0%) |
| 25 to 34 Years | 80 (7.5%) | 89 (7.5%) |
| 35 to 44 Years | 44 (6.4%) | 221 (23.7%) |
| 45 to 54 Years | 111 (13.6%) | 60 (8.8%) |
| 55 to 64 Years | 9 (2.7%) | 2 (0.3%) |
| 65 to 74 Years | 20 (3.5%) | 50 (9.0%) |
| 75 Years and over | 0 (0.0%) | 16 (4.8%) |
| Total | 808 (14.4%) | 767 (12.2%) |
Income Above Poverty by Sex and Age in Manchester
According to the poverty statistics in Manchester, males aged 75 years and over and females aged 5 years are the age groups that are most secure financially, with 100.0% of males and 100.0% of females in these age groups living above the poverty line.
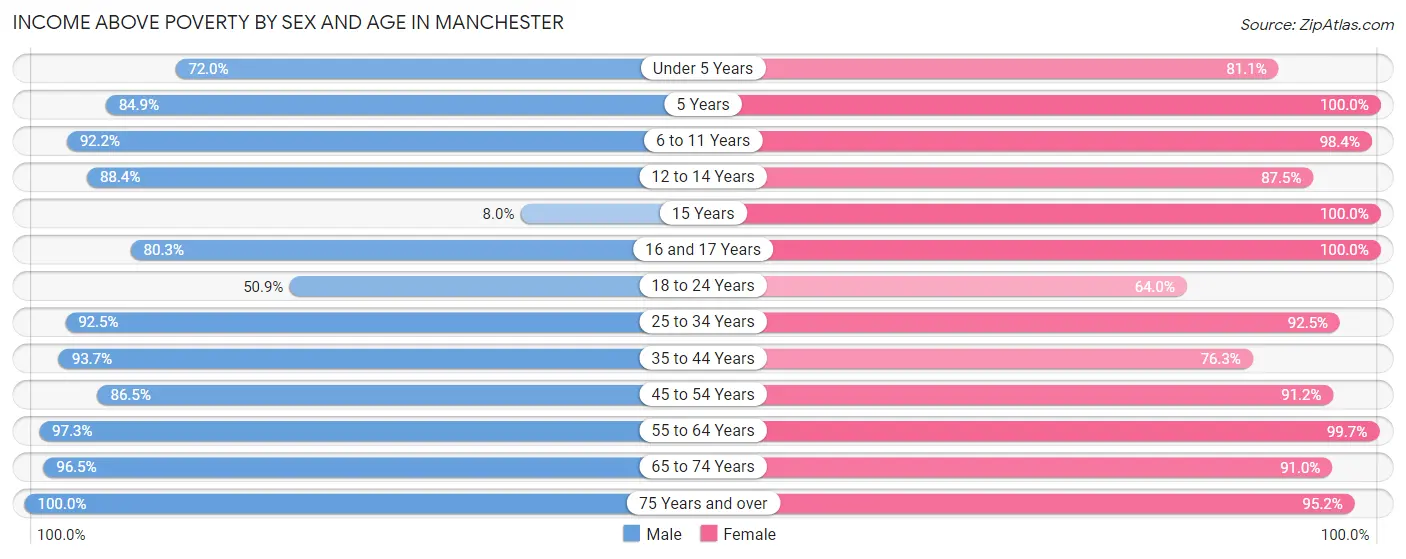
| Age Bracket | Male | Female |
| Under 5 Years | 291 (72.0%) | 248 (81.0%) |
| 5 Years | 124 (84.9%) | 91 (100.0%) |
| 6 to 11 Years | 448 (92.2%) | 300 (98.4%) |
| 12 to 14 Years | 122 (88.4%) | 462 (87.5%) |
| 15 Years | 4 (8.0%) | 64 (100.0%) |
| 16 and 17 Years | 249 (80.3%) | 80 (100.0%) |
| 18 to 24 Years | 257 (50.9%) | 356 (64.0%) |
| 25 to 34 Years | 981 (92.5%) | 1,090 (92.4%) |
| 35 to 44 Years | 649 (93.6%) | 710 (76.3%) |
| 45 to 54 Years | 708 (86.5%) | 623 (91.2%) |
| 55 to 64 Years | 324 (97.3%) | 657 (99.7%) |
| 65 to 74 Years | 555 (96.5%) | 507 (91.0%) |
| 75 Years and over | 105 (100.0%) | 316 (95.2%) |
| Total | 4,817 (85.6%) | 5,504 (87.8%) |
Income Below Poverty Among Married-Couple Families in Manchester
The poverty statistics for married-couple families in Manchester show that 8.3% or 158 of the total 1,910 families live below the poverty line. Families with 5 or more children have the highest poverty rate of 100.0%, comprising of 9 families. On the other hand, families with no children have the lowest poverty rate of 1.5%, which includes 13 families.
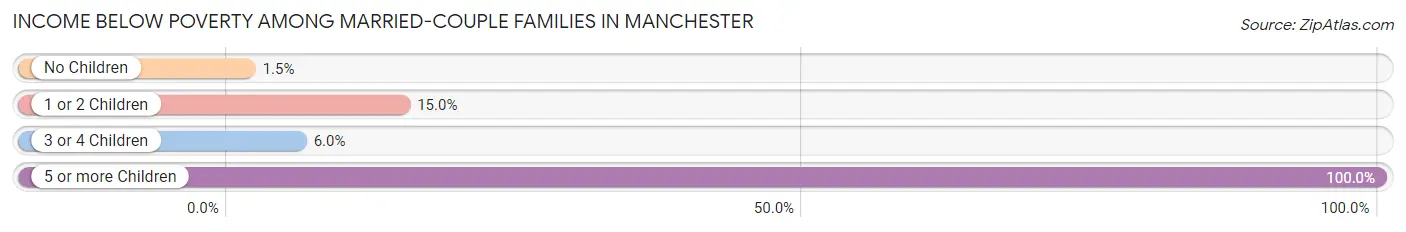
| Children | Above Poverty | Below Poverty |
| No Children | 830 (98.5%) | 13 (1.5%) |
| 1 or 2 Children | 686 (85.0%) | 121 (15.0%) |
| 3 or 4 Children | 236 (94.0%) | 15 (6.0%) |
| 5 or more Children | 0 (0.0%) | 9 (100.0%) |
| Total | 1,752 (91.7%) | 158 (8.3%) |
Income Below Poverty Among Single-Parent Households in Manchester
According to the poverty data in Manchester, 15.7% or 22 single-father households and 17.4% or 160 single-mother households are living below the poverty line. Among single-father households, those with 3 or 4 children have the highest poverty rate, with 4 households (100.0%) experiencing poverty. Likewise, among single-mother households, those with 1 or 2 children have the highest poverty rate, with 160 households (24.8%) falling below the poverty line.
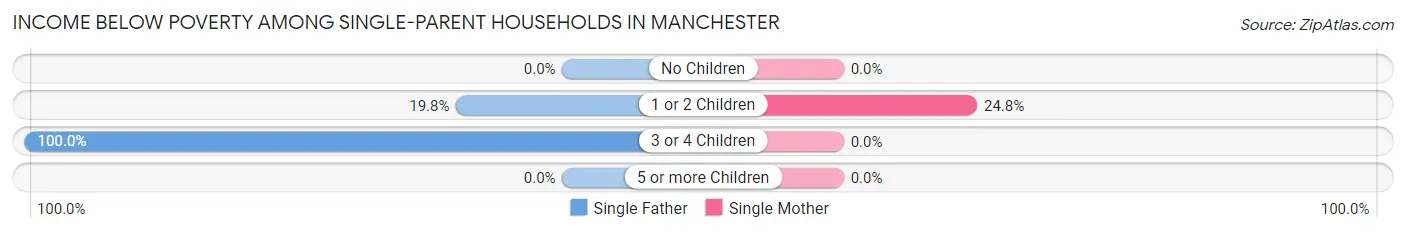
| Children | Single Father | Single Mother |
| No Children | 0 (0.0%) | 0 (0.0%) |
| 1 or 2 Children | 18 (19.8%) | 160 (24.8%) |
| 3 or 4 Children | 4 (100.0%) | 0 (0.0%) |
| 5 or more Children | 0 (0.0%) | 0 (0.0%) |
| Total | 22 (15.7%) | 160 (17.4%) |
Income Below Poverty Among Married-Couple vs Single-Parent Households in Manchester
The poverty data for Manchester shows that 158 of the married-couple family households (8.3%) and 182 of the single-parent households (17.2%) are living below the poverty level. Within the married-couple family households, those with 5 or more children have the highest poverty rate, with 9 households (100.0%) falling below the poverty line. Among the single-parent households, those with 1 or 2 children have the highest poverty rate, with 178 household (24.2%) living below poverty.

| Children | Married-Couple Families | Single-Parent Households |
| No Children | 13 (1.5%) | 0 (0.0%) |
| 1 or 2 Children | 121 (15.0%) | 178 (24.2%) |
| 3 or 4 Children | 15 (6.0%) | 4 (9.5%) |
| 5 or more Children | 9 (100.0%) | 0 (0.0%) |
| Total | 158 (8.3%) | 182 (17.2%) |
Race in Manchester
The most populous races in Manchester are White / Caucasian (6,576 | 55.1%), Black / African American (4,063 | 34.1%), and Hispanic or Latino (1,681 | 14.1%).
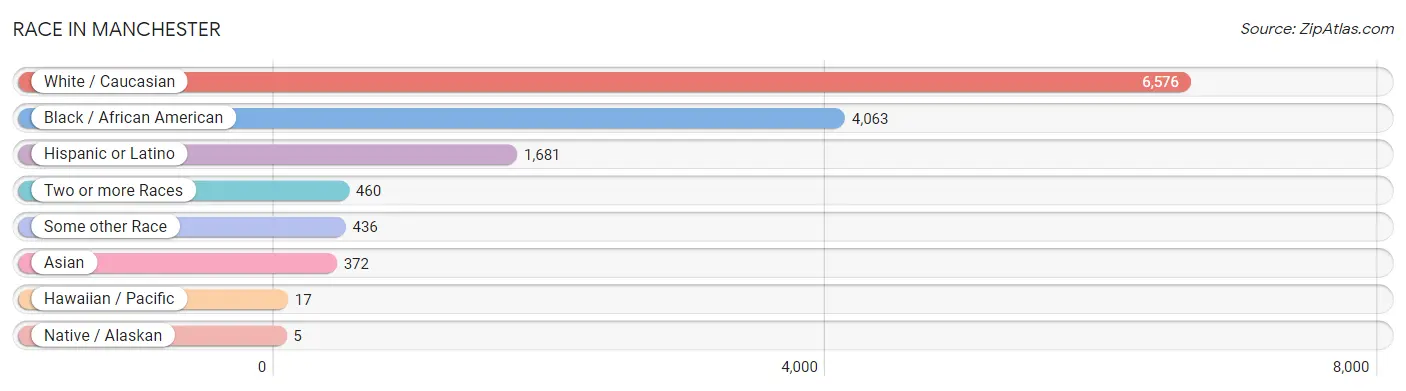
| Race | # Population | % Population |
| Asian | 372 | 3.1% |
| Black / African American | 4,063 | 34.1% |
| Hawaiian / Pacific | 17 | 0.1% |
| Hispanic or Latino | 1,681 | 14.1% |
| Native / Alaskan | 5 | 0.0% |
| White / Caucasian | 6,576 | 55.1% |
| Two or more Races | 460 | 3.9% |
| Some other Race | 436 | 3.6% |
| Total | 11,929 | 100.0% |
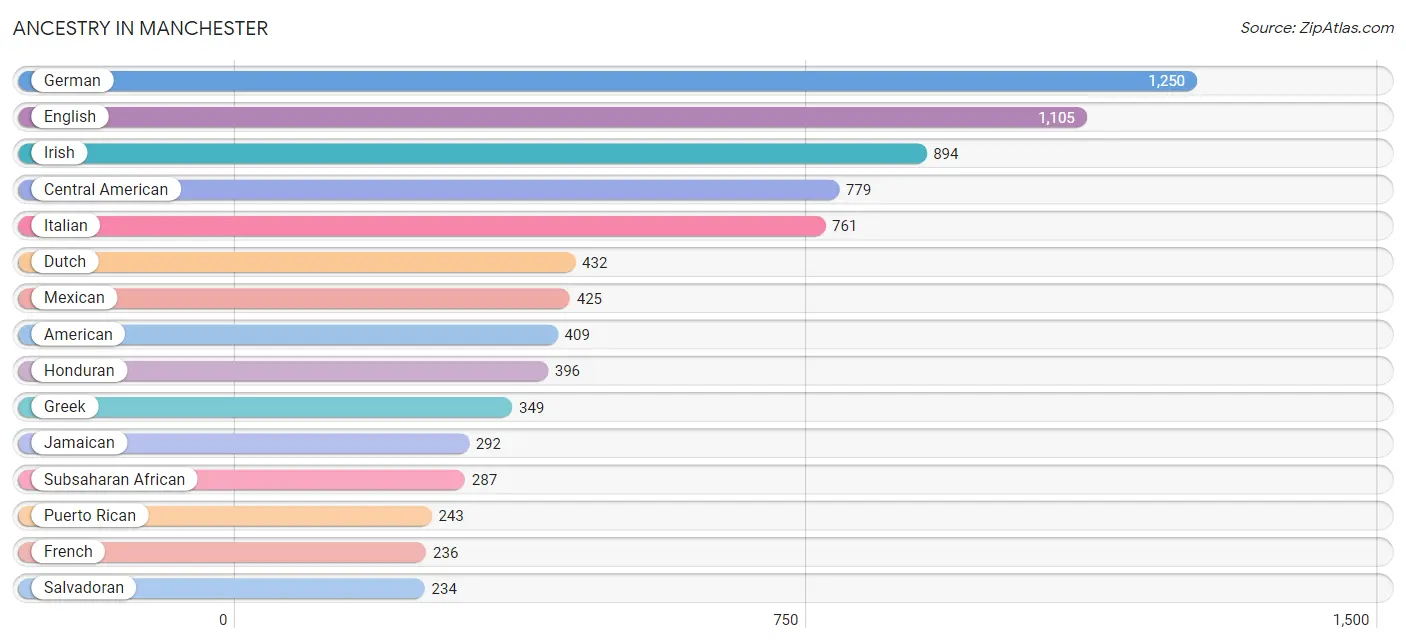
Ancestry in Manchester
The most populous ancestries reported in Manchester are German (1,250 | 10.5%), English (1,105 | 9.3%), Irish (894 | 7.5%), Central American (779 | 6.5%), and Italian (761 | 6.4%), together accounting for 40.1% of all Manchester residents.
| Ancestry | # Population | % Population |
| African | 178 | 1.5% |
| American | 409 | 3.4% |
| Arab | 128 | 1.1% |
| Armenian | 14 | 0.1% |
| Belgian | 17 | 0.1% |
| Bhutanese | 27 | 0.2% |
| British | 59 | 0.5% |
| British West Indian | 17 | 0.1% |
| Burmese | 96 | 0.8% |
| Canadian | 99 | 0.8% |
| Central American | 779 | 6.5% |
| Cherokee | 37 | 0.3% |
| Colombian | 28 | 0.2% |
| Cuban | 130 | 1.1% |
| Czechoslovakian | 48 | 0.4% |
| Dominican | 51 | 0.4% |
| Dutch | 432 | 3.6% |
| Eastern European | 48 | 0.4% |
| Egyptian | 33 | 0.3% |
| English | 1,105 | 9.3% |
| Ethiopian | 2 | 0.0% |
| European | 190 | 1.6% |
| French | 236 | 2.0% |
| French Canadian | 17 | 0.1% |
| German | 1,250 | 10.5% |
| Ghanaian | 17 | 0.1% |
| Greek | 349 | 2.9% |
| Guamanian / Chamorro | 30 | 0.3% |
| Guatemalan | 149 | 1.3% |
| Honduran | 396 | 3.3% |
| Hungarian | 49 | 0.4% |
| Indian (Asian) | 16 | 0.1% |
| Inupiat | 19 | 0.2% |
| Irish | 894 | 7.5% |
| Israeli | 20 | 0.2% |
| Italian | 761 | 6.4% |
| Jamaican | 292 | 2.5% |
| Jordanian | 87 | 0.7% |
| Korean | 145 | 1.2% |
| Lithuanian | 7 | 0.1% |
| Luxembourger | 33 | 0.3% |
| Mexican | 425 | 3.6% |
| Northern European | 25 | 0.2% |
| Norwegian | 81 | 0.7% |
| Polish | 122 | 1.0% |
| Puerto Rican | 243 | 2.0% |
| Russian | 28 | 0.2% |
| Salvadoran | 234 | 2.0% |
| Scotch-Irish | 181 | 1.5% |
| Scottish | 82 | 0.7% |
| Slovak | 20 | 0.2% |
| South African | 59 | 0.5% |
| South American | 28 | 0.2% |
| Sri Lankan | 50 | 0.4% |
| Subsaharan African | 287 | 2.4% |
| Sudanese | 30 | 0.3% |
| Swedish | 123 | 1.0% |
| Thai | 8 | 0.1% |
| Ukrainian | 26 | 0.2% |
| Welsh | 133 | 1.1% |
| West Indian | 25 | 0.2% | View All 61 Rows |
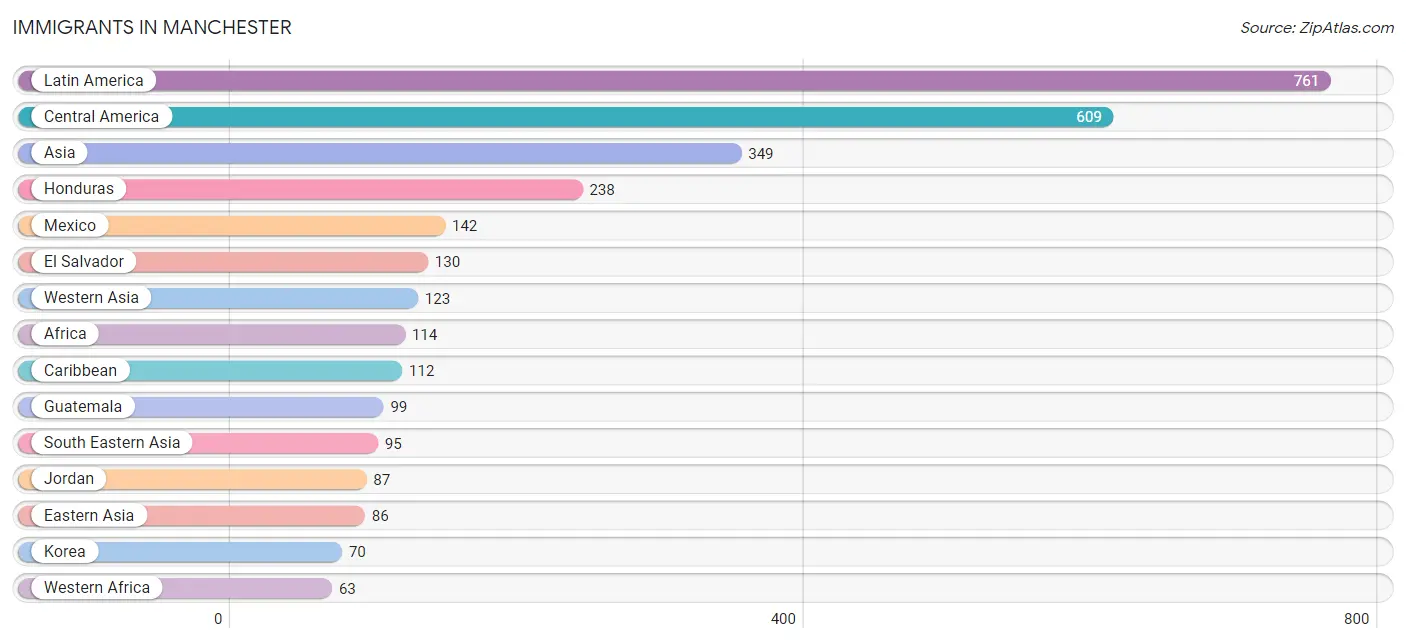
Immigrants in Manchester
The most numerous immigrant groups reported in Manchester came from Latin America (761 | 6.4%), Central America (609 | 5.1%), Asia (349 | 2.9%), Honduras (238 | 2.0%), and Mexico (142 | 1.2%), together accounting for 17.6% of all Manchester residents.
| Immigration Origin | # Population | % Population |
| Africa | 114 | 1.0% |
| Asia | 349 | 2.9% |
| Brazil | 20 | 0.2% |
| Caribbean | 112 | 0.9% |
| Central America | 609 | 5.1% |
| China | 16 | 0.1% |
| Colombia | 20 | 0.2% |
| Congo | 1 | 0.0% |
| Cuba | 53 | 0.4% |
| Dominican Republic | 5 | 0.0% |
| Eastern Asia | 86 | 0.7% |
| Egypt | 35 | 0.3% |
| El Salvador | 130 | 1.1% |
| England | 19 | 0.2% |
| Europe | 42 | 0.4% |
| Germany | 23 | 0.2% |
| Ghana | 53 | 0.4% |
| Guatemala | 99 | 0.8% |
| Honduras | 238 | 2.0% |
| Israel | 20 | 0.2% |
| Jamaica | 21 | 0.2% |
| Jordan | 87 | 0.7% |
| Korea | 70 | 0.6% |
| Kuwait | 16 | 0.1% |
| Latin America | 761 | 6.4% |
| Liberia | 10 | 0.1% |
| Mexico | 142 | 1.2% |
| Middle Africa | 1 | 0.0% |
| Nepal | 12 | 0.1% |
| Northern Africa | 50 | 0.4% |
| Northern Europe | 19 | 0.2% |
| Pakistan | 33 | 0.3% |
| Philippines | 54 | 0.4% |
| South America | 40 | 0.3% |
| South Central Asia | 45 | 0.4% |
| South Eastern Asia | 95 | 0.8% |
| Sudan | 15 | 0.1% |
| Vietnam | 41 | 0.3% |
| Western Africa | 63 | 0.5% |
| Western Asia | 123 | 1.0% |
| Western Europe | 23 | 0.2% | View All 41 Rows |
Sex and Age in Manchester
Sex and Age in Manchester
The most populous age groups in Manchester are 15 to 19 Years (675 | 11.9%) for men and 25 to 29 Years (643 | 10.2%) for women.
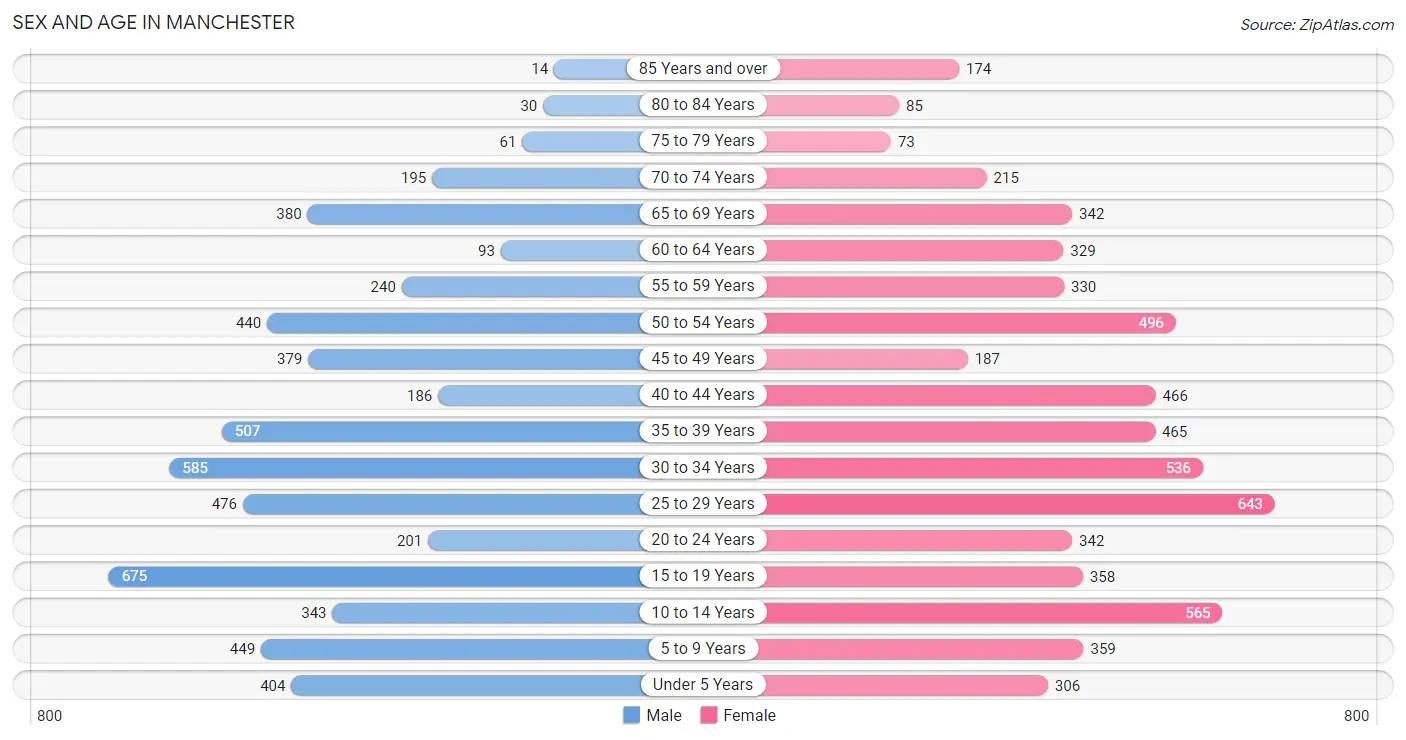
| Age Bracket | Male | Female |
| Under 5 Years | 404 (7.1%) | 306 (4.9%) |
| 5 to 9 Years | 449 (7.9%) | 359 (5.7%) |
| 10 to 14 Years | 343 (6.1%) | 565 (9.0%) |
| 15 to 19 Years | 675 (11.9%) | 358 (5.7%) |
| 20 to 24 Years | 201 (3.5%) | 342 (5.4%) |
| 25 to 29 Years | 476 (8.4%) | 643 (10.2%) |
| 30 to 34 Years | 585 (10.3%) | 536 (8.6%) |
| 35 to 39 Years | 507 (9.0%) | 465 (7.4%) |
| 40 to 44 Years | 186 (3.3%) | 466 (7.4%) |
| 45 to 49 Years | 379 (6.7%) | 187 (3.0%) |
| 50 to 54 Years | 440 (7.8%) | 496 (7.9%) |
| 55 to 59 Years | 240 (4.2%) | 330 (5.3%) |
| 60 to 64 Years | 93 (1.6%) | 329 (5.2%) |
| 65 to 69 Years | 380 (6.7%) | 342 (5.4%) |
| 70 to 74 Years | 195 (3.5%) | 215 (3.4%) |
| 75 to 79 Years | 61 (1.1%) | 73 (1.2%) |
| 80 to 84 Years | 30 (0.5%) | 85 (1.4%) |
| 85 Years and over | 14 (0.3%) | 174 (2.8%) |
| Total | 5,658 (100.0%) | 6,271 (100.0%) |
Families and Households in Manchester
Median Family Size in Manchester
The median family size in Manchester is 3.22 persons per family, with married-couple families (1,910 | 64.3%) accounting for the largest median family size of 3.36 persons per family. On the other hand, single male/father families (140 | 4.7%) represent the smallest median family size with 2.94 persons per family.
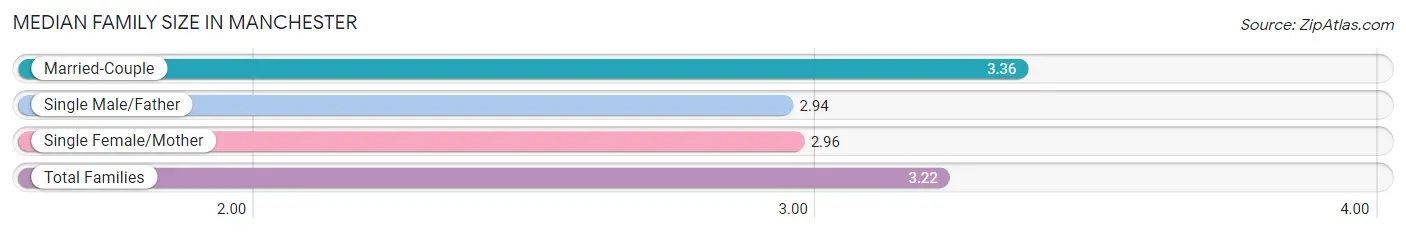
| Family Type | # Families | Family Size |
| Married-Couple | 1,910 (64.3%) | 3.36 |
| Single Male/Father | 140 (4.7%) | 2.94 |
| Single Female/Mother | 920 (31.0%) | 2.96 |
| Total Families | 2,970 (100.0%) | 3.22 |
Median Household Size in Manchester
The median household size in Manchester is 2.42 persons per household, with married-couple households (1,910 | 38.8%) accounting for the largest median household size of 3.36 persons per household. non-family households (1,954 | 39.7%) represent the smallest median household size with 1.15 persons per household.
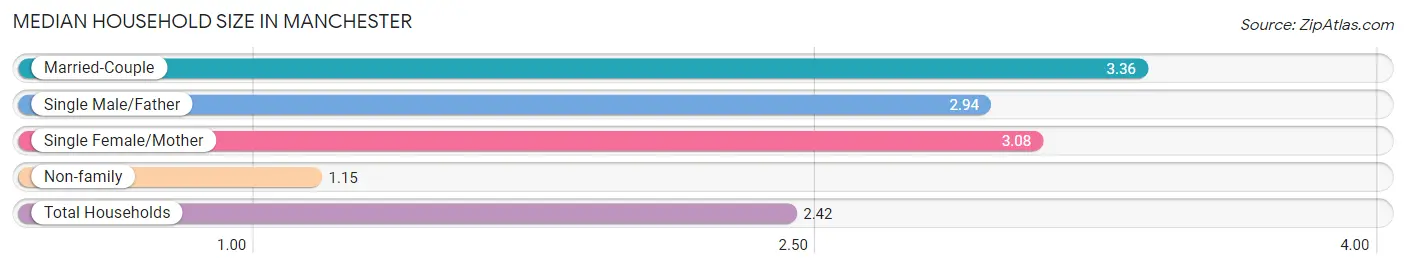
| Household Type | # Households | Household Size |
| Married-Couple | 1,910 (38.8%) | 3.36 |
| Single Male/Father | 140 (2.8%) | 2.94 |
| Single Female/Mother | 920 (18.7%) | 3.08 |
| Non-family | 1,954 (39.7%) | 1.15 |
| Total Households | 4,924 (100.0%) | 2.42 |
Household Size by Marriage Status in Manchester
Out of a total of 4,924 households in Manchester, 2,970 (60.3%) are family households, while 1,954 (39.7%) are nonfamily households. The most numerous type of family households are 2-person households, comprising 1,116, and the most common type of nonfamily households are 1-person households, comprising 1,702.
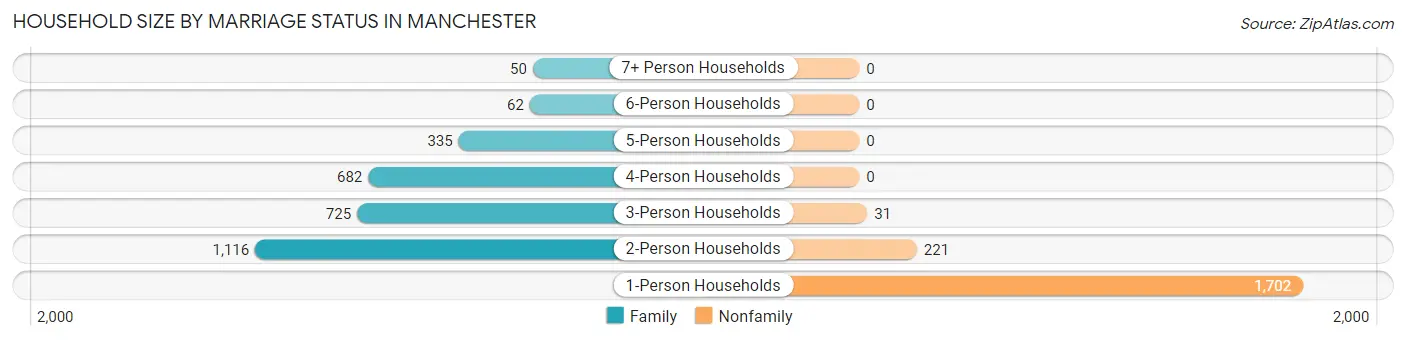
| Household Size | Family Households | Nonfamily Households |
| 1-Person Households | - | 1,702 (34.6%) |
| 2-Person Households | 1,116 (22.7%) | 221 (4.5%) |
| 3-Person Households | 725 (14.7%) | 31 (0.6%) |
| 4-Person Households | 682 (13.9%) | 0 (0.0%) |
| 5-Person Households | 335 (6.8%) | 0 (0.0%) |
| 6-Person Households | 62 (1.3%) | 0 (0.0%) |
| 7+ Person Households | 50 (1.0%) | 0 (0.0%) |
| Total | 2,970 (60.3%) | 1,954 (39.7%) |
Female Fertility in Manchester
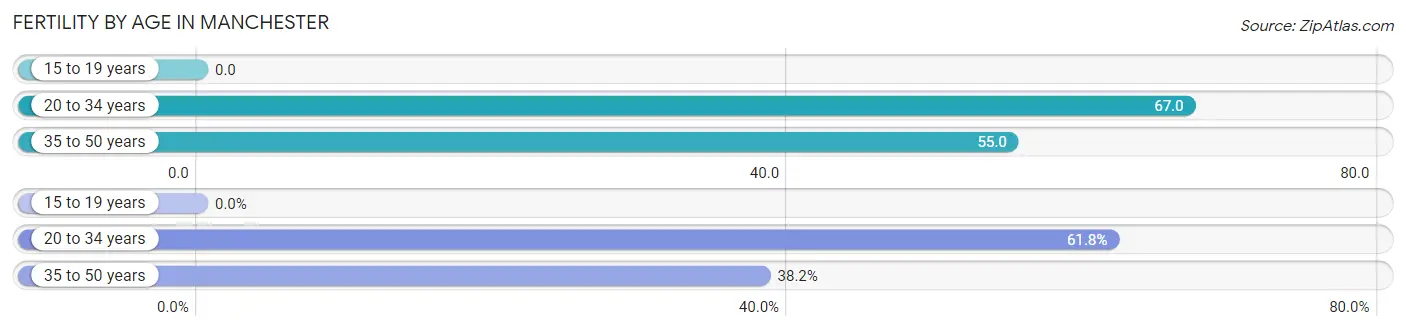
Fertility by Age in Manchester
Average fertility rate in Manchester is 54.0 births per 1,000 women. Women in the age bracket of 20 to 34 years have the highest fertility rate with 67.0 births per 1,000 women. Women in the age bracket of 20 to 34 years acount for 61.8% of all women with births.
| Age Bracket | Women with Births | Births / 1,000 Women |
| 15 to 19 years | 0 (0.0%) | 0.0 |
| 20 to 34 years | 102 (61.8%) | 67.0 |
| 35 to 50 years | 63 (38.2%) | 55.0 |
| Total | 165 (100.0%) | 54.0 |
Fertility by Age by Marriage Status in Manchester
70.9% of women with births (165) in Manchester are married. The highest percentage of unmarried women with births falls into 35 to 50 years age bracket with 52.4% of them unmarried at the time of birth, while the lowest percentage of unmarried women with births belong to 20 to 34 years age bracket with 14.7% of them unmarried.
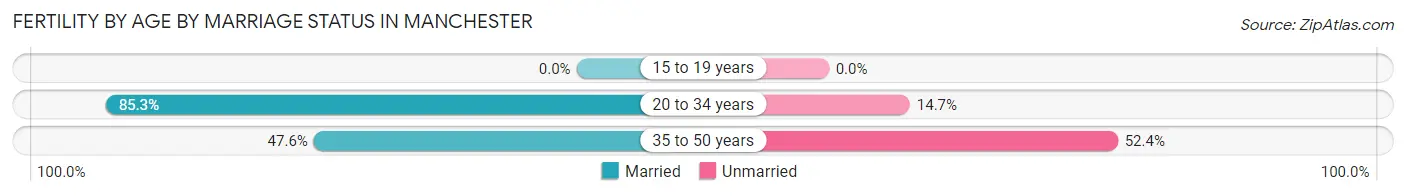
| Age Bracket | Married | Unmarried |
| 15 to 19 years | 0 (0.0%) | 0 (0.0%) |
| 20 to 34 years | 87 (85.3%) | 15 (14.7%) |
| 35 to 50 years | 30 (47.6%) | 33 (52.4%) |
| Total | 117 (70.9%) | 48 (29.1%) |
Fertility by Education in Manchester
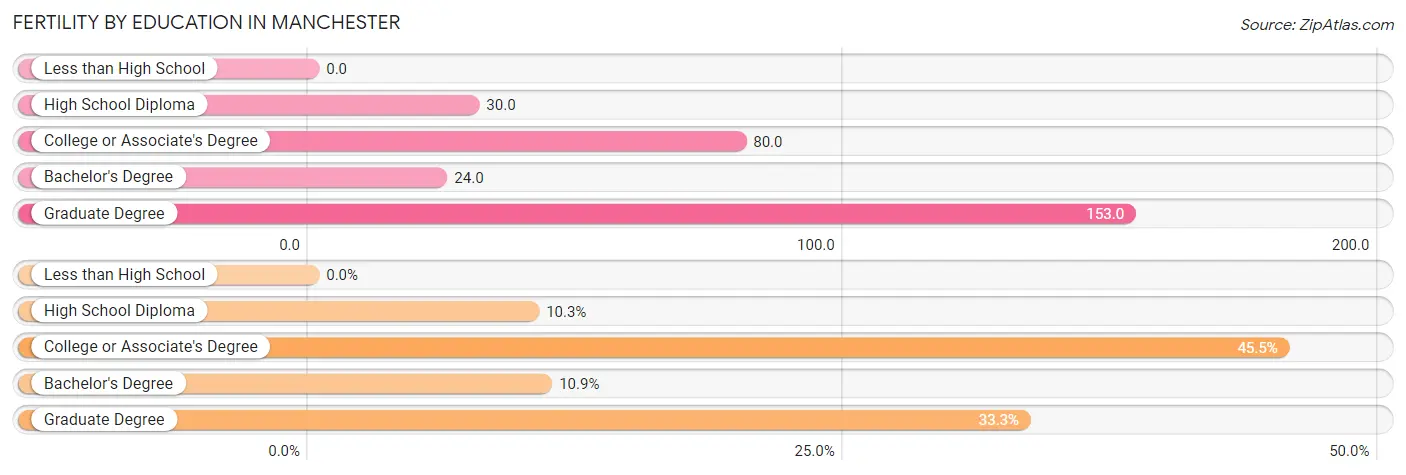
| Educational Attainment | Women with Births | Births / 1,000 Women |
| Less than High School | 0 (0.0%) | 0.0 |
| High School Diploma | 17 (10.3%) | 30.0 |
| College or Associate's Degree | 75 (45.5%) | 80.0 |
| Bachelor's Degree | 18 (10.9%) | 24.0 |
| Graduate Degree | 55 (33.3%) | 153.0 |
| Total | 165 (100.0%) | 54.0 |
Fertility by Education by Marriage Status in Manchester
29.1% of women with births in Manchester are unmarried. Women with the educational attainment of bachelor's degree are most likely to be married with 100.0% of them married at childbirth, while women with the educational attainment of high school diploma are least likely to be married with 100.0% of them unmarried at childbirth.
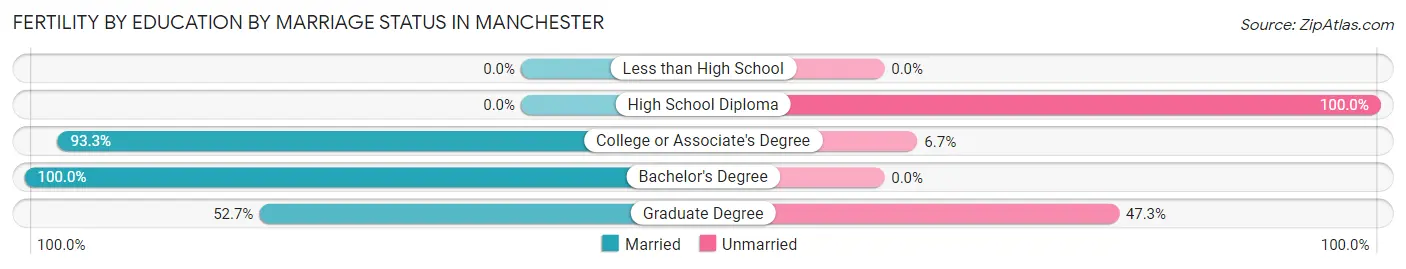
| Educational Attainment | Married | Unmarried |
| Less than High School | 0 (0.0%) | 0 (0.0%) |
| High School Diploma | 0 (0.0%) | 17 (100.0%) |
| College or Associate's Degree | 70 (93.3%) | 5 (6.7%) |
| Bachelor's Degree | 18 (100.0%) | 0 (0.0%) |
| Graduate Degree | 29 (52.7%) | 26 (47.3%) |
| Total | 117 (70.9%) | 48 (29.1%) |
Employment Characteristics in Manchester
Employment by Class of Employer in Manchester
Among the 6,447 employed individuals in Manchester, private company employees (4,367 | 67.7%), local government employees (815 | 12.6%), and not-for-profit organizations (385 | 6.0%) make up the most common classes of employment.
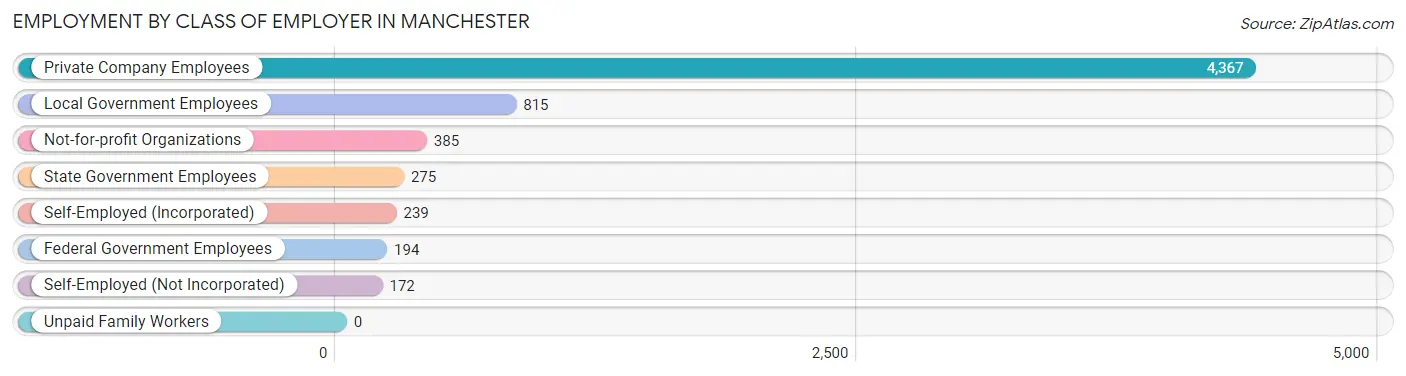
| Employer Class | # Employees | % Employees |
| Private Company Employees | 4,367 | 67.7% |
| Self-Employed (Incorporated) | 239 | 3.7% |
| Self-Employed (Not Incorporated) | 172 | 2.7% |
| Not-for-profit Organizations | 385 | 6.0% |
| Local Government Employees | 815 | 12.6% |
| State Government Employees | 275 | 4.3% |
| Federal Government Employees | 194 | 3.0% |
| Unpaid Family Workers | 0 | 0.0% |
| Total | 6,447 | 100.0% |
Employment Status by Age in Manchester
According to the labor force statistics for Manchester, out of the total population over 16 years of age (9,389), 75.7% or 7,107 individuals are in the labor force, with 7.8% or 554 of them unemployed. The age group with the highest labor force participation rate is 20 to 24 years, with 93.7% or 509 individuals in the labor force. Within the labor force, the 16 to 19 years age range has the highest percentage of unemployed individuals, with 43.5% or 213 of them being unemployed.
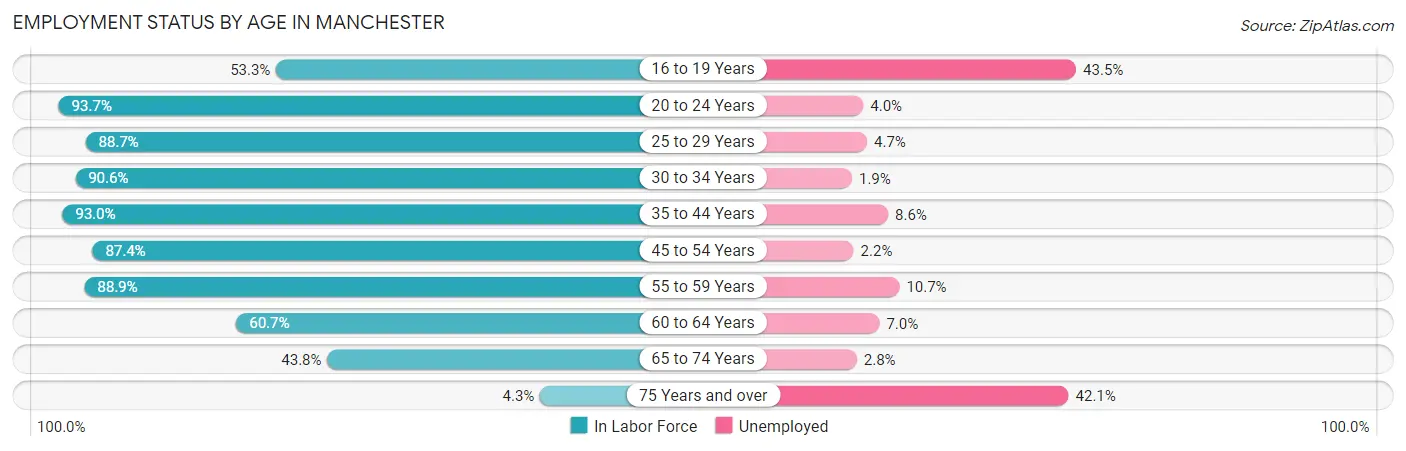
| Age Bracket | In Labor Force | Unemployed |
| 16 to 19 Years | 490 (53.3%) | 213 (43.5%) |
| 20 to 24 Years | 509 (93.7%) | 20 (4.0%) |
| 25 to 29 Years | 993 (88.7%) | 47 (4.7%) |
| 30 to 34 Years | 1,016 (90.6%) | 19 (1.9%) |
| 35 to 44 Years | 1,510 (93.0%) | 130 (8.6%) |
| 45 to 54 Years | 1,313 (87.4%) | 29 (2.2%) |
| 55 to 59 Years | 507 (88.9%) | 54 (10.7%) |
| 60 to 64 Years | 256 (60.7%) | 18 (7.0%) |
| 65 to 74 Years | 496 (43.8%) | 14 (2.8%) |
| 75 Years and over | 19 (4.3%) | 8 (42.1%) |
| Total | 7,107 (75.7%) | 554 (7.8%) |
Employment Status by Educational Attainment in Manchester
According to labor force statistics for Manchester, 88.0% of individuals (5,595) out of the total population between 25 and 64 years of age (6,358) are in the labor force, with 5.3% or 297 of them being unemployed. The group with the highest labor force participation rate are those with the educational attainment of bachelor's degree or higher, with 92.6% or 2,435 individuals in the labor force. Within the labor force, individuals with college / associate degree education have the highest percentage of unemployment, with 8.5% or 132 of them being unemployed.
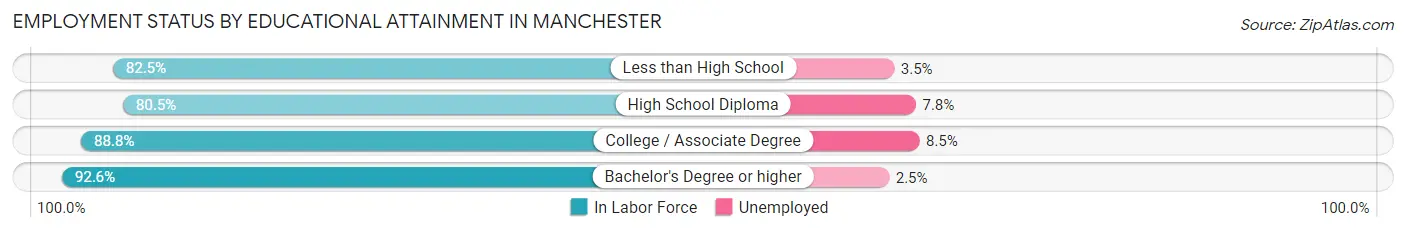
| Educational Attainment | In Labor Force | Unemployed |
| Less than High School | 519 (82.5%) | 22 (3.5%) |
| High School Diploma | 1,092 (80.5%) | 106 (7.8%) |
| College / Associate Degree | 1,548 (88.8%) | 148 (8.5%) |
| Bachelor's Degree or higher | 2,435 (92.6%) | 66 (2.5%) |
| Total | 5,595 (88.0%) | 337 (5.3%) |
Employment Occupations by Sex in Manchester
Management, Business, Science and Arts Occupations
The most common Management, Business, Science and Arts occupations in Manchester are Community & Social Service (1,030 | 15.8%), Management (982 | 15.0%), Education Instruction & Library (583 | 8.9%), Business & Financial (455 | 7.0%), and Health Diagnosing & Treating (394 | 6.0%).
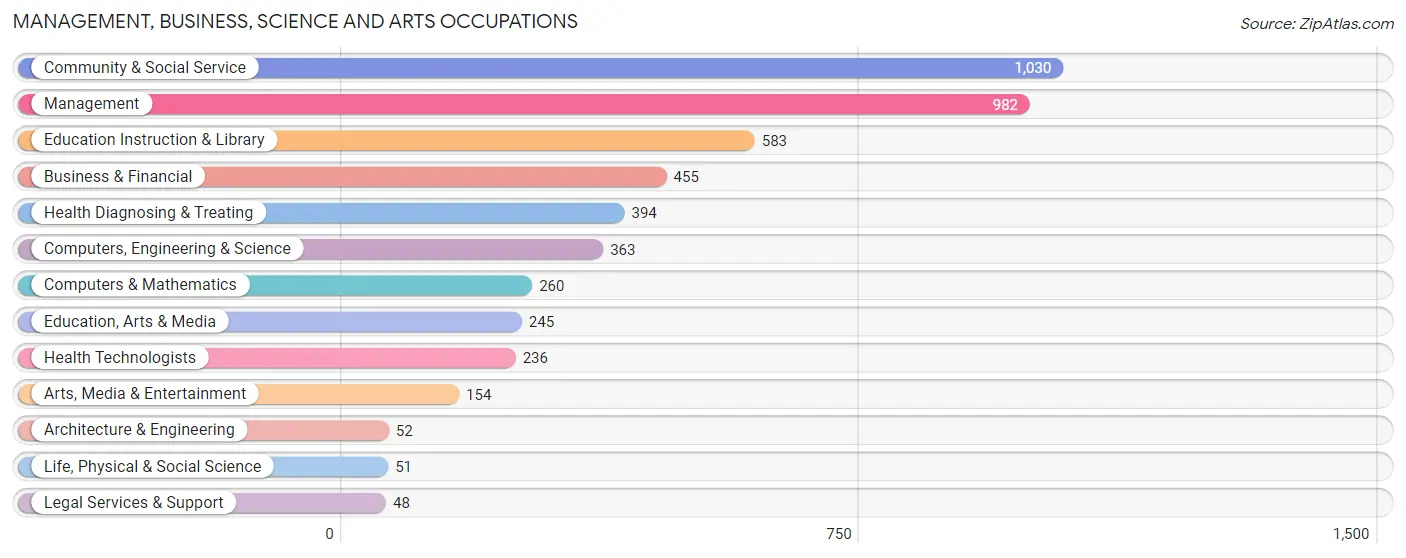
Management, Business, Science and Arts Occupations by Sex
Within the Management, Business, Science and Arts occupations in Manchester, the most male-oriented occupations are Architecture & Engineering (100.0%), Arts, Media & Entertainment (94.2%), and Computers & Mathematics (77.3%), while the most female-oriented occupations are Legal Services & Support (100.0%), Health Technologists (100.0%), and Health Diagnosing & Treating (94.2%).
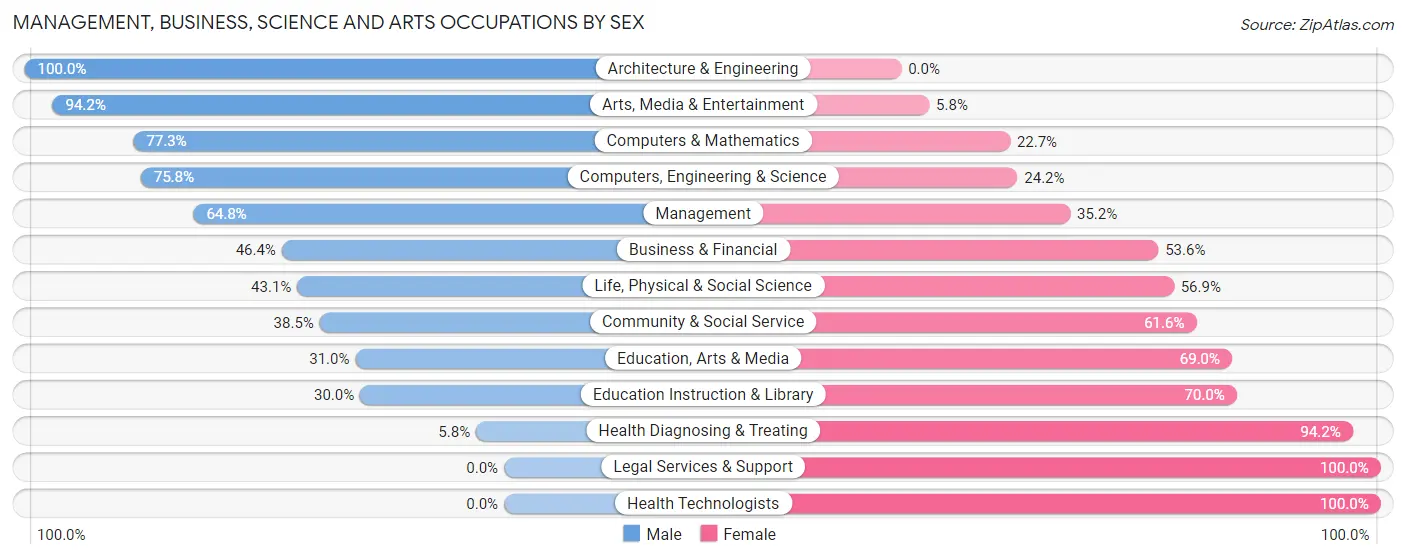
| Occupation | Male | Female |
| Management | 636 (64.8%) | 346 (35.2%) |
| Business & Financial | 211 (46.4%) | 244 (53.6%) |
| Computers, Engineering & Science | 275 (75.8%) | 88 (24.2%) |
| Computers & Mathematics | 201 (77.3%) | 59 (22.7%) |
| Architecture & Engineering | 52 (100.0%) | 0 (0.0%) |
| Life, Physical & Social Science | 22 (43.1%) | 29 (56.9%) |
| Community & Social Service | 396 (38.5%) | 634 (61.6%) |
| Education, Arts & Media | 76 (31.0%) | 169 (69.0%) |
| Legal Services & Support | 0 (0.0%) | 48 (100.0%) |
| Education Instruction & Library | 175 (30.0%) | 408 (70.0%) |
| Arts, Media & Entertainment | 145 (94.2%) | 9 (5.8%) |
| Health Diagnosing & Treating | 23 (5.8%) | 371 (94.2%) |
| Health Technologists | 0 (0.0%) | 236 (100.0%) |
| Total (Category) | 1,541 (47.8%) | 1,683 (52.2%) |
| Total (Overall) | 3,100 (47.4%) | 3,437 (52.6%) |
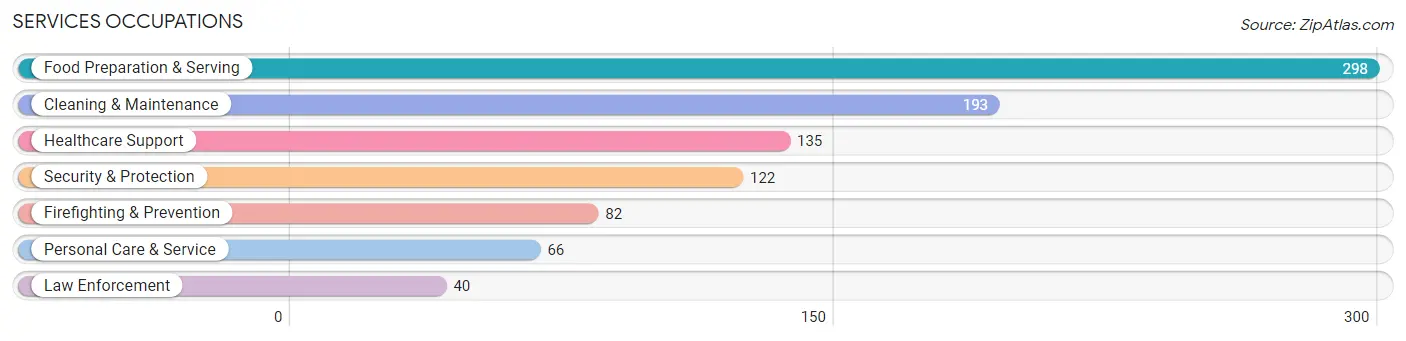
Services Occupations
The most common Services occupations in Manchester are Food Preparation & Serving (298 | 4.6%), Cleaning & Maintenance (193 | 2.9%), Healthcare Support (135 | 2.1%), Security & Protection (122 | 1.9%), and Firefighting & Prevention (82 | 1.3%).
Services Occupations by Sex
Within the Services occupations in Manchester, the most male-oriented occupations are Firefighting & Prevention (86.6%), Security & Protection (84.4%), and Law Enforcement (80.0%), while the most female-oriented occupations are Healthcare Support (100.0%), Personal Care & Service (63.6%), and Food Preparation & Serving (59.4%).
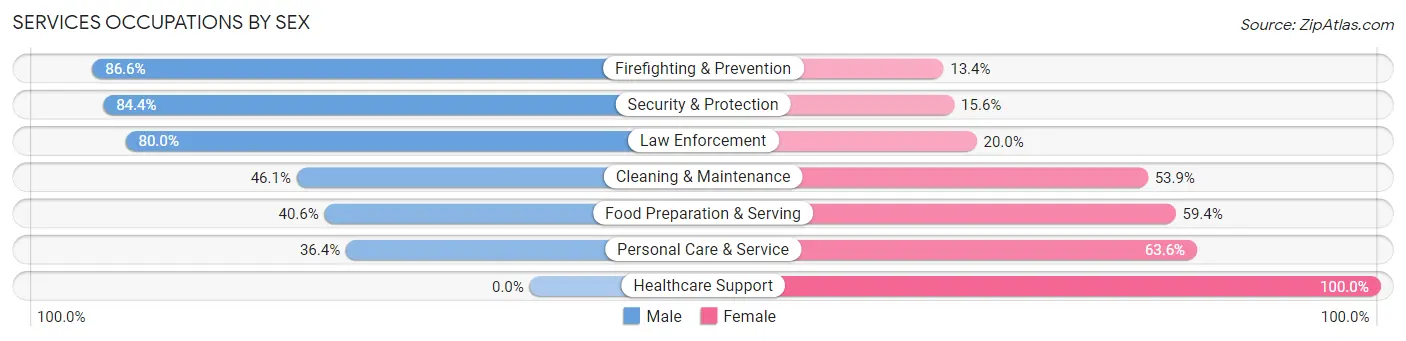
| Occupation | Male | Female |
| Healthcare Support | 0 (0.0%) | 135 (100.0%) |
| Security & Protection | 103 (84.4%) | 19 (15.6%) |
| Firefighting & Prevention | 71 (86.6%) | 11 (13.4%) |
| Law Enforcement | 32 (80.0%) | 8 (20.0%) |
| Food Preparation & Serving | 121 (40.6%) | 177 (59.4%) |
| Cleaning & Maintenance | 89 (46.1%) | 104 (53.9%) |
| Personal Care & Service | 24 (36.4%) | 42 (63.6%) |
| Total (Category) | 337 (41.4%) | 477 (58.6%) |
| Total (Overall) | 3,100 (47.4%) | 3,437 (52.6%) |
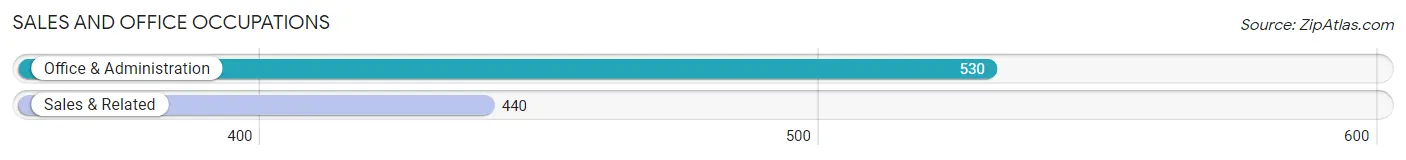
Sales and Office Occupations
The most common Sales and Office occupations in Manchester are Office & Administration (530 | 8.1%), and Sales & Related (440 | 6.7%).
Sales and Office Occupations by Sex
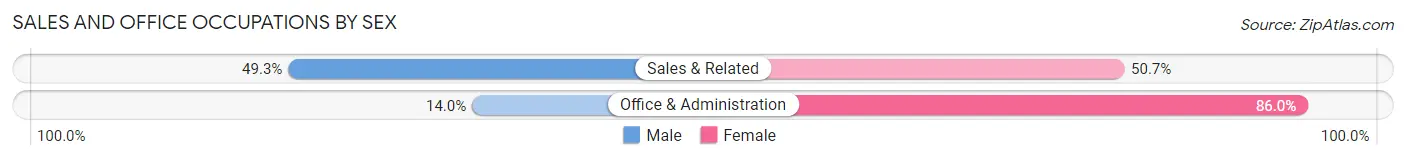
| Occupation | Male | Female |
| Sales & Related | 217 (49.3%) | 223 (50.7%) |
| Office & Administration | 74 (14.0%) | 456 (86.0%) |
| Total (Category) | 291 (30.0%) | 679 (70.0%) |
| Total (Overall) | 3,100 (47.4%) | 3,437 (52.6%) |
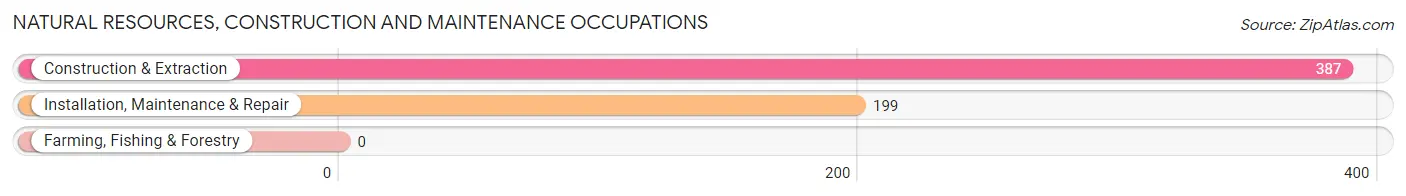
Natural Resources, Construction and Maintenance Occupations
The most common Natural Resources, Construction and Maintenance occupations in Manchester are Construction & Extraction (387 | 5.9%), and Installation, Maintenance & Repair (199 | 3.0%).
Natural Resources, Construction and Maintenance Occupations by Sex
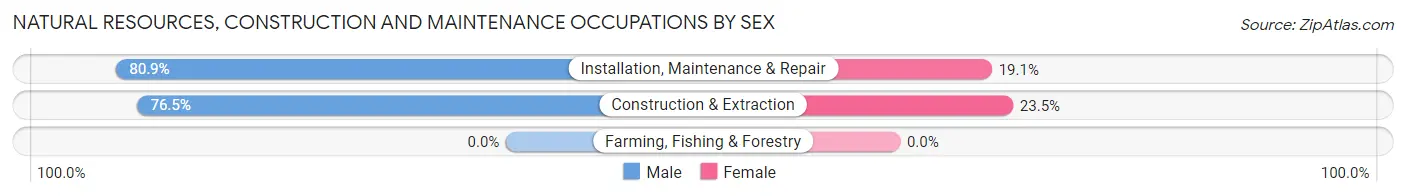
| Occupation | Male | Female |
| Farming, Fishing & Forestry | 0 (0.0%) | 0 (0.0%) |
| Construction & Extraction | 296 (76.5%) | 91 (23.5%) |
| Installation, Maintenance & Repair | 161 (80.9%) | 38 (19.1%) |
| Total (Category) | 457 (78.0%) | 129 (22.0%) |
| Total (Overall) | 3,100 (47.4%) | 3,437 (52.6%) |
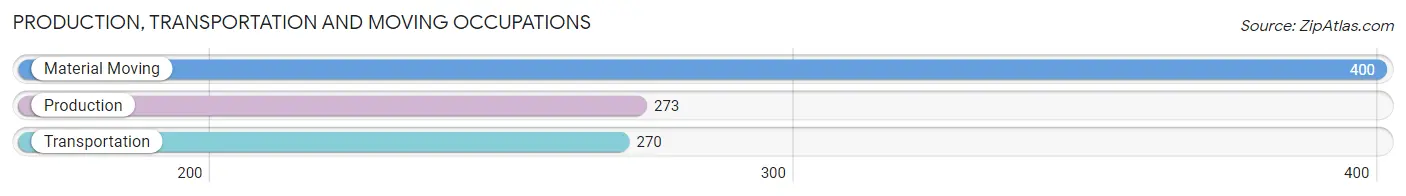
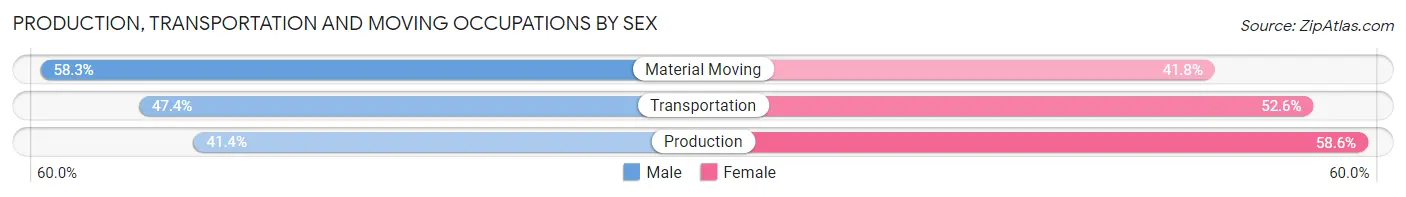
Production, Transportation and Moving Occupations
The most common Production, Transportation and Moving occupations in Manchester are Material Moving (400 | 6.1%), Production (273 | 4.2%), and Transportation (270 | 4.1%).
Production, Transportation and Moving Occupations by Sex
| Occupation | Male | Female |
| Production | 113 (41.4%) | 160 (58.6%) |
| Transportation | 128 (47.4%) | 142 (52.6%) |
| Material Moving | 233 (58.3%) | 167 (41.7%) |
| Total (Category) | 474 (50.3%) | 469 (49.7%) |
| Total (Overall) | 3,100 (47.4%) | 3,437 (52.6%) |
Employment Industries by Sex in Manchester
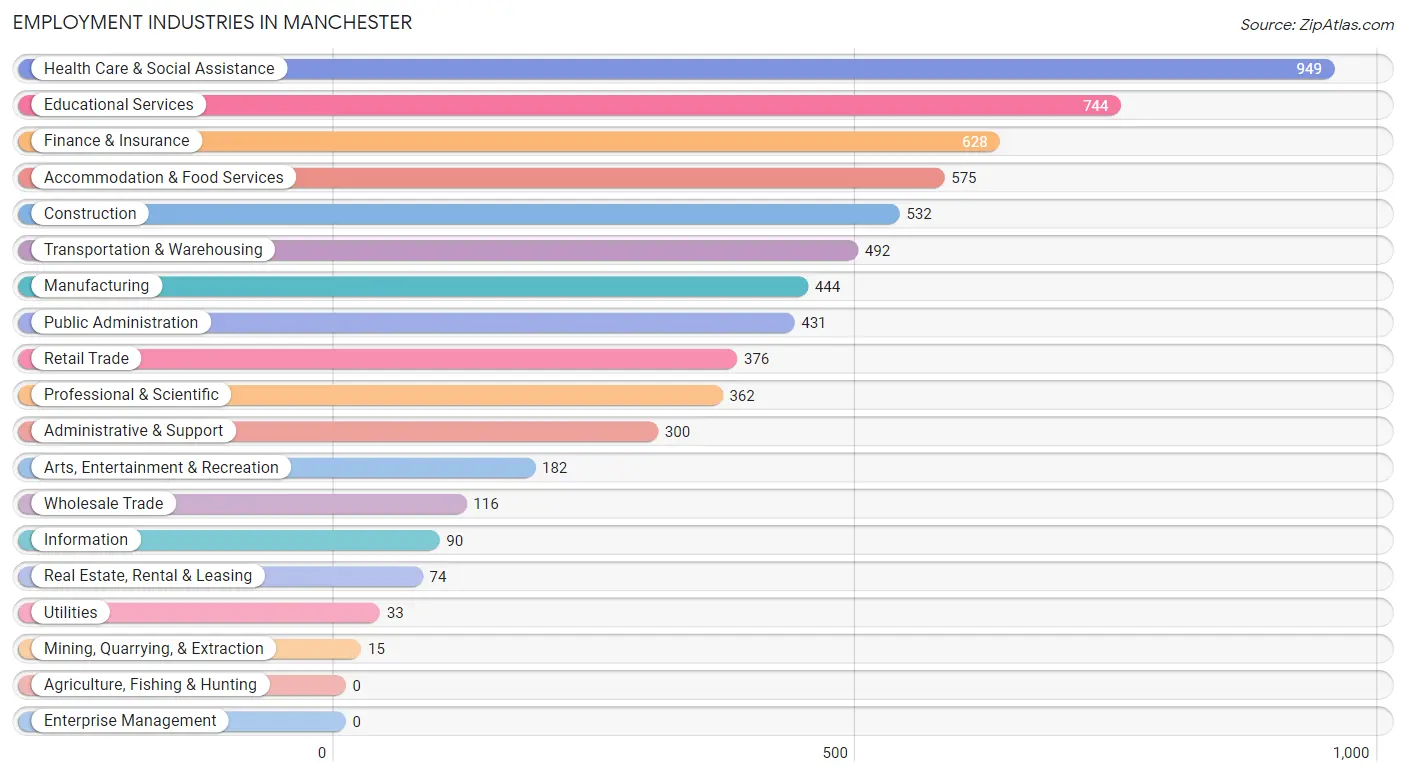
Employment Industries in Manchester
The major employment industries in Manchester include Health Care & Social Assistance (949 | 14.5%), Educational Services (744 | 11.4%), Finance & Insurance (628 | 9.6%), Accommodation & Food Services (575 | 8.8%), and Construction (532 | 8.1%).
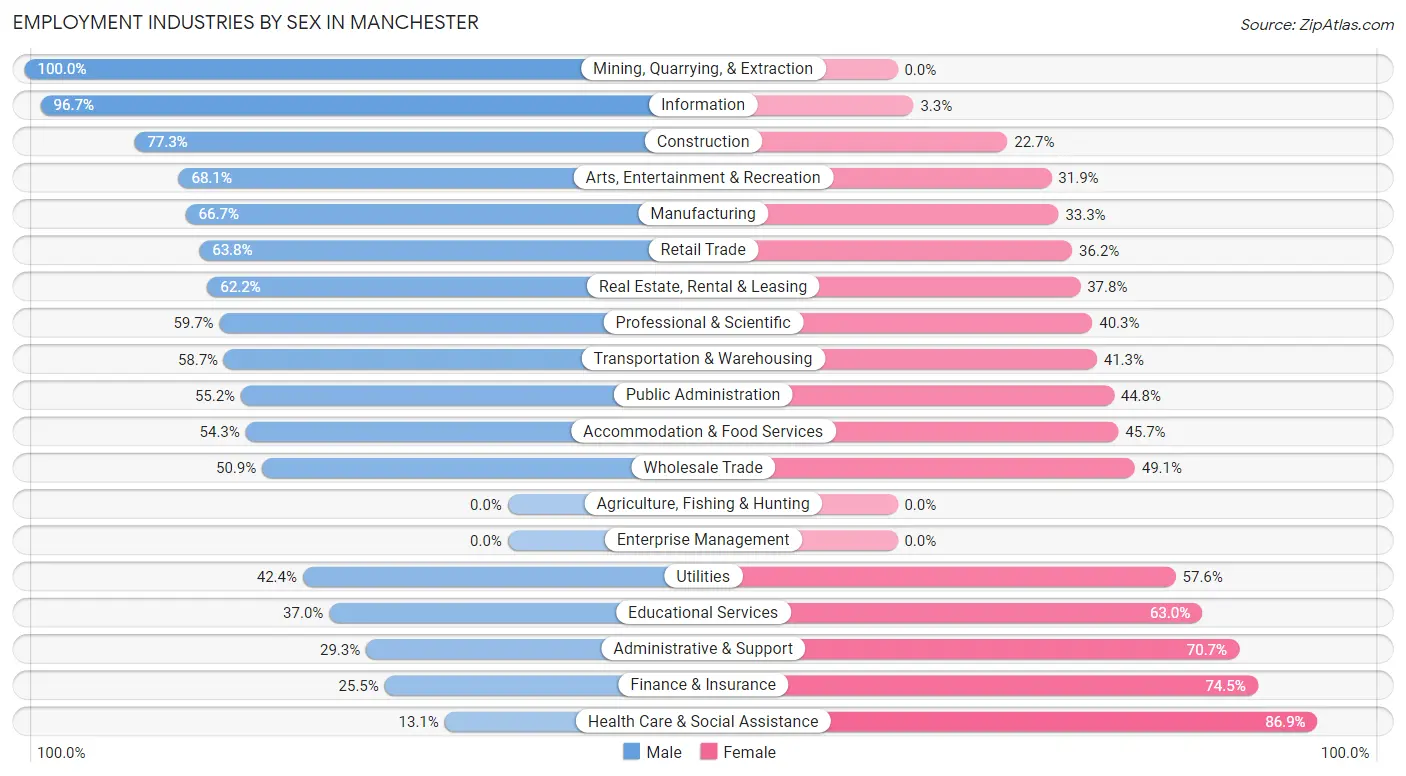
Employment Industries by Sex in Manchester
The Manchester industries that see more men than women are Mining, Quarrying, & Extraction (100.0%), Information (96.7%), and Construction (77.3%), whereas the industries that tend to have a higher number of women are Health Care & Social Assistance (86.9%), Finance & Insurance (74.5%), and Administrative & Support (70.7%).
| Industry | Male | Female |
| Agriculture, Fishing & Hunting | 0 (0.0%) | 0 (0.0%) |
| Mining, Quarrying, & Extraction | 15 (100.0%) | 0 (0.0%) |
| Construction | 411 (77.3%) | 121 (22.7%) |
| Manufacturing | 296 (66.7%) | 148 (33.3%) |
| Wholesale Trade | 59 (50.9%) | 57 (49.1%) |
| Retail Trade | 240 (63.8%) | 136 (36.2%) |
| Transportation & Warehousing | 289 (58.7%) | 203 (41.3%) |
| Utilities | 14 (42.4%) | 19 (57.6%) |
| Information | 87 (96.7%) | 3 (3.3%) |
| Finance & Insurance | 160 (25.5%) | 468 (74.5%) |
| Real Estate, Rental & Leasing | 46 (62.2%) | 28 (37.8%) |
| Professional & Scientific | 216 (59.7%) | 146 (40.3%) |
| Enterprise Management | 0 (0.0%) | 0 (0.0%) |
| Administrative & Support | 88 (29.3%) | 212 (70.7%) |
| Educational Services | 275 (37.0%) | 469 (63.0%) |
| Health Care & Social Assistance | 124 (13.1%) | 825 (86.9%) |
| Arts, Entertainment & Recreation | 124 (68.1%) | 58 (31.9%) |
| Accommodation & Food Services | 312 (54.3%) | 263 (45.7%) |
| Public Administration | 238 (55.2%) | 193 (44.8%) |
| Total | 3,100 (47.4%) | 3,437 (52.6%) |
Education in Manchester
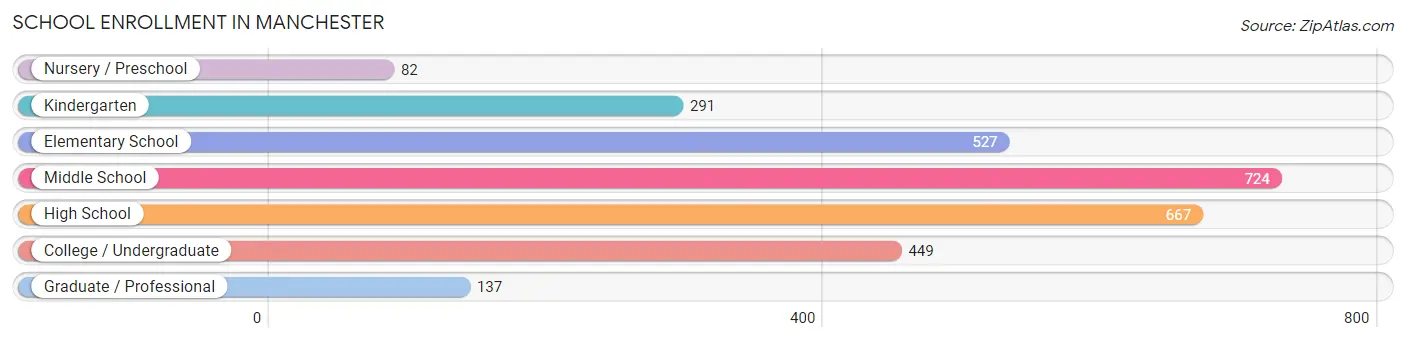
School Enrollment in Manchester
The most common levels of schooling among the 2,877 students in Manchester are middle school (724 | 25.2%), high school (667 | 23.2%), and elementary school (527 | 18.3%).
| School Level | # Students | % Students |
| Nursery / Preschool | 82 | 2.9% |
| Kindergarten | 291 | 10.1% |
| Elementary School | 527 | 18.3% |
| Middle School | 724 | 25.2% |
| High School | 667 | 23.2% |
| College / Undergraduate | 449 | 15.6% |
| Graduate / Professional | 137 | 4.8% |
| Total | 2,877 | 100.0% |
School Enrollment by Age by Funding Source in Manchester
Out of a total of 2,877 students who are enrolled in schools in Manchester, 403 (14.0%) attend a private institution, while the remaining 2,474 (86.0%) are enrolled in public schools. The age group of 3 to 4 year olds has the highest likelihood of being enrolled in private schools, with 59 (65.6% in the age bracket) enrolled. Conversely, the age group of 5 to 9 year old has the lowest likelihood of being enrolled in a private school, with 755 (97.7% in the age bracket) attending a public institution.
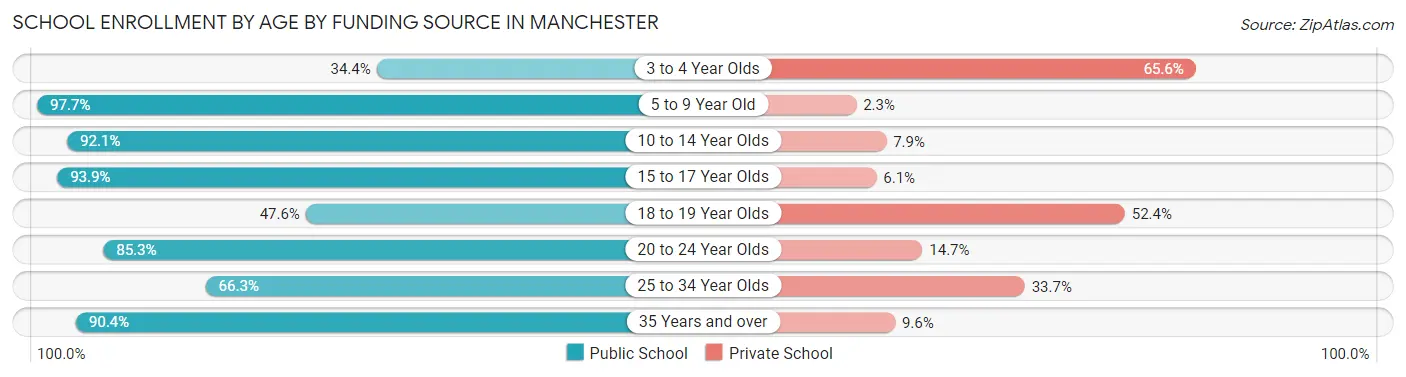
| Age Bracket | Public School | Private School |
| 3 to 4 Year Olds | 31 (34.4%) | 59 (65.6%) |
| 5 to 9 Year Old | 755 (97.7%) | 18 (2.3%) |
| 10 to 14 Year Olds | 744 (92.1%) | 64 (7.9%) |
| 15 to 17 Year Olds | 479 (93.9%) | 31 (6.1%) |
| 18 to 19 Year Olds | 131 (47.6%) | 144 (52.4%) |
| 20 to 24 Year Olds | 99 (85.3%) | 17 (14.7%) |
| 25 to 34 Year Olds | 112 (66.3%) | 57 (33.7%) |
| 35 Years and over | 123 (90.4%) | 13 (9.6%) |
| Total | 2,474 (86.0%) | 403 (14.0%) |
Educational Attainment by Field of Study in Manchester
Business (936 | 27.8%), science & technology (347 | 10.3%), education (299 | 8.9%), psychology (289 | 8.6%), and bio, nature & agricultural (228 | 6.8%) are the most common fields of study among 3,371 individuals in Manchester who have obtained a bachelor's degree or higher.
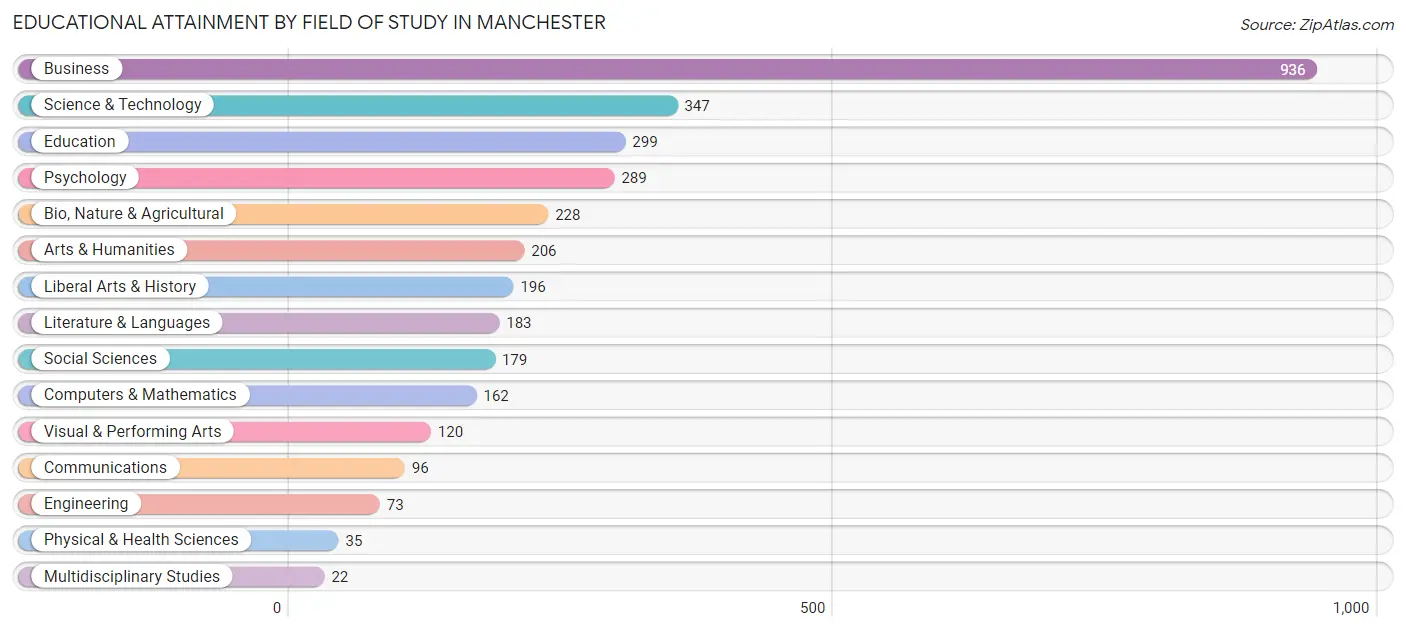
| Field of Study | # Graduates | % Graduates |
| Computers & Mathematics | 162 | 4.8% |
| Bio, Nature & Agricultural | 228 | 6.8% |
| Physical & Health Sciences | 35 | 1.0% |
| Psychology | 289 | 8.6% |
| Social Sciences | 179 | 5.3% |
| Engineering | 73 | 2.2% |
| Multidisciplinary Studies | 22 | 0.6% |
| Science & Technology | 347 | 10.3% |
| Business | 936 | 27.8% |
| Education | 299 | 8.9% |
| Literature & Languages | 183 | 5.4% |
| Liberal Arts & History | 196 | 5.8% |
| Visual & Performing Arts | 120 | 3.6% |
| Communications | 96 | 2.9% |
| Arts & Humanities | 206 | 6.1% |
| Total | 3,371 | 100.0% |
Transportation & Commute in Manchester
Vehicle Availability by Sex in Manchester
The most prevalent vehicle ownership categories in Manchester are males with 2 vehicles (1,527, accounting for 50.2%) and females with 2 vehicles (1,649, making up 44.8%).
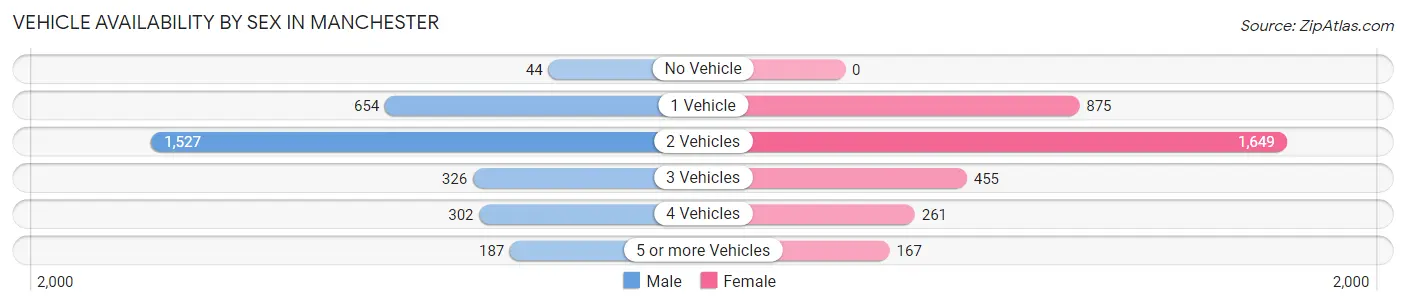
| Vehicles Available | Male | Female |
| No Vehicle | 44 (1.5%) | 0 (0.0%) |
| 1 Vehicle | 654 (21.5%) | 875 (25.7%) |
| 2 Vehicles | 1,527 (50.2%) | 1,649 (48.4%) |
| 3 Vehicles | 326 (10.7%) | 455 (13.4%) |
| 4 Vehicles | 302 (9.9%) | 261 (7.7%) |
| 5 or more Vehicles | 187 (6.1%) | 167 (4.9%) |
| Total | 3,040 (100.0%) | 3,407 (100.0%) |
Commute Time in Manchester
The most frequently occuring commute durations in Manchester are 30 to 34 minutes (1,175 commuters, 21.3%), 20 to 24 minutes (1,067 commuters, 19.3%), and 15 to 19 minutes (1,032 commuters, 18.7%).
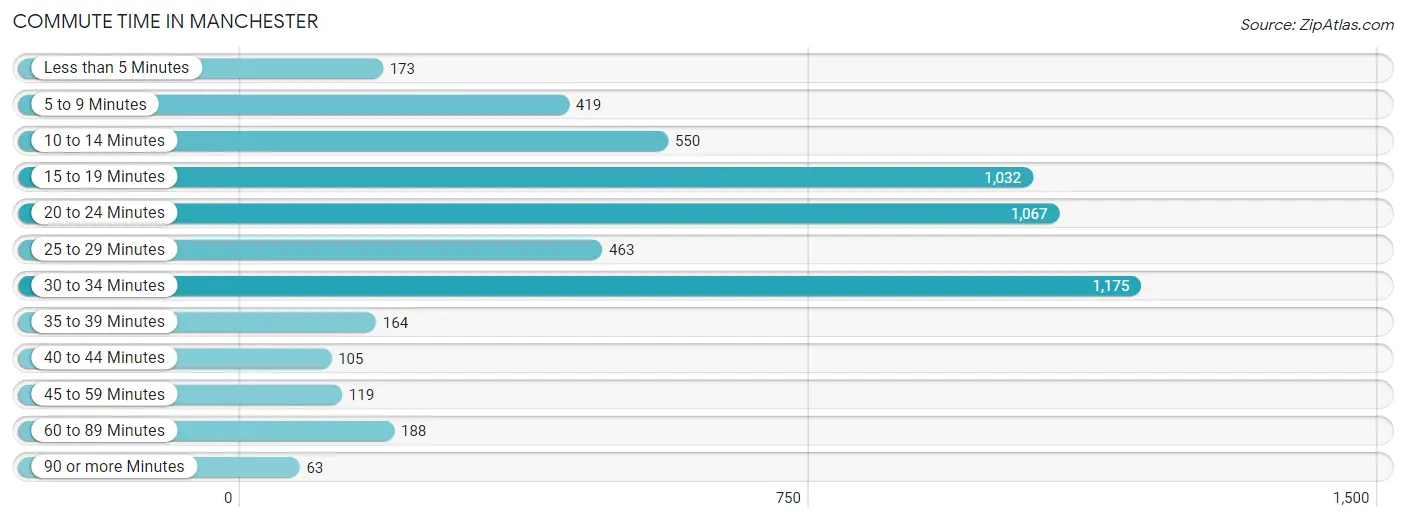
| Commute Time | # Commuters | % Commuters |
| Less than 5 Minutes | 173 | 3.1% |
| 5 to 9 Minutes | 419 | 7.6% |
| 10 to 14 Minutes | 550 | 10.0% |
| 15 to 19 Minutes | 1,032 | 18.7% |
| 20 to 24 Minutes | 1,067 | 19.3% |
| 25 to 29 Minutes | 463 | 8.4% |
| 30 to 34 Minutes | 1,175 | 21.3% |
| 35 to 39 Minutes | 164 | 3.0% |
| 40 to 44 Minutes | 105 | 1.9% |
| 45 to 59 Minutes | 119 | 2.2% |
| 60 to 89 Minutes | 188 | 3.4% |
| 90 or more Minutes | 63 | 1.1% |
Commute Time by Sex in Manchester
The most common commute times in Manchester are 15 to 19 minutes (463 commuters, 18.7%) for males and 30 to 34 minutes (718 commuters, 23.6%) for females.
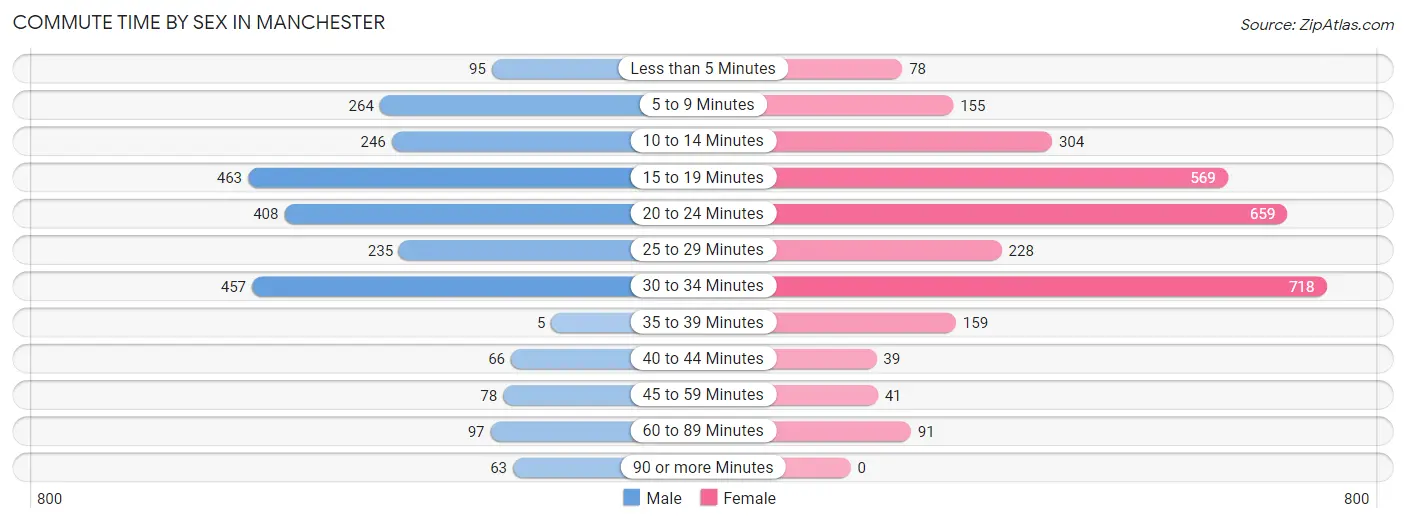
| Commute Time | Male | Female |
| Less than 5 Minutes | 95 (3.8%) | 78 (2.6%) |
| 5 to 9 Minutes | 264 (10.7%) | 155 (5.1%) |
| 10 to 14 Minutes | 246 (9.9%) | 304 (10.0%) |
| 15 to 19 Minutes | 463 (18.7%) | 569 (18.7%) |
| 20 to 24 Minutes | 408 (16.5%) | 659 (21.7%) |
| 25 to 29 Minutes | 235 (9.5%) | 228 (7.5%) |
| 30 to 34 Minutes | 457 (18.4%) | 718 (23.6%) |
| 35 to 39 Minutes | 5 (0.2%) | 159 (5.2%) |
| 40 to 44 Minutes | 66 (2.7%) | 39 (1.3%) |
| 45 to 59 Minutes | 78 (3.2%) | 41 (1.3%) |
| 60 to 89 Minutes | 97 (3.9%) | 91 (3.0%) |
| 90 or more Minutes | 63 (2.5%) | 0 (0.0%) |
Time of Departure to Work by Sex in Manchester
The most frequent times of departure to work in Manchester are 8:00 AM to 8:29 AM (441, 17.8%) for males and 8:00 AM to 8:29 AM (510, 16.8%) for females.
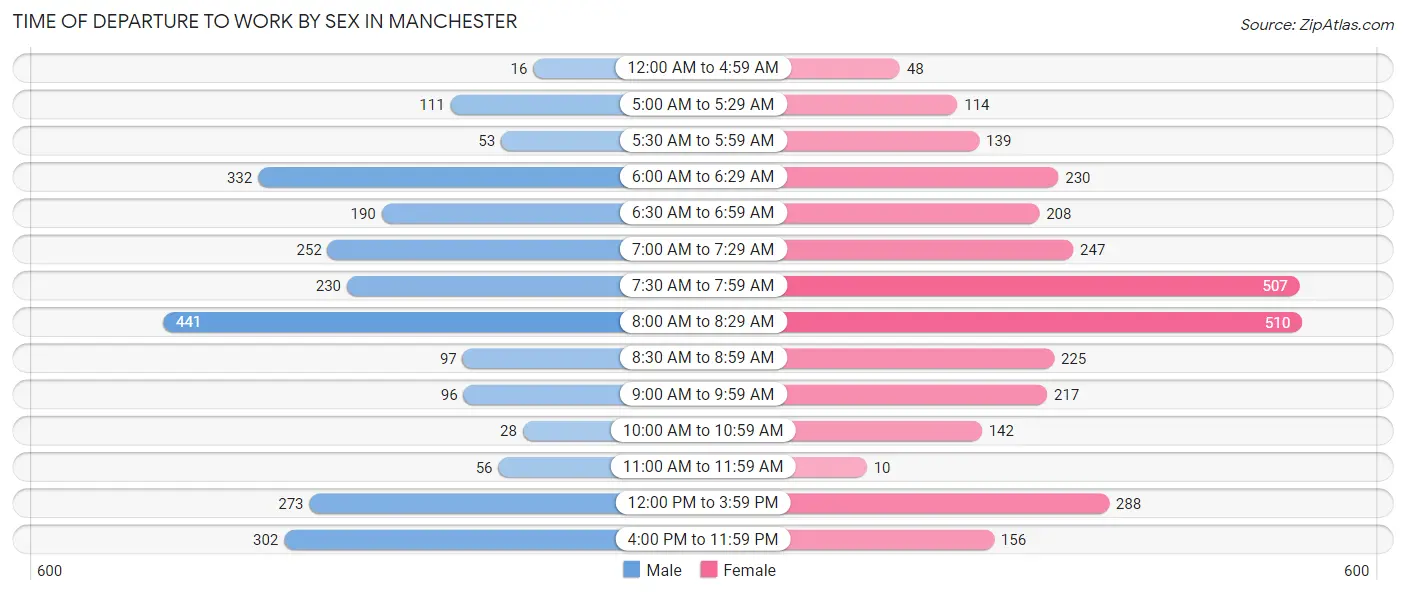
| Time of Departure | Male | Female |
| 12:00 AM to 4:59 AM | 16 (0.6%) | 48 (1.6%) |
| 5:00 AM to 5:29 AM | 111 (4.5%) | 114 (3.7%) |
| 5:30 AM to 5:59 AM | 53 (2.1%) | 139 (4.6%) |
| 6:00 AM to 6:29 AM | 332 (13.4%) | 230 (7.6%) |
| 6:30 AM to 6:59 AM | 190 (7.7%) | 208 (6.8%) |
| 7:00 AM to 7:29 AM | 252 (10.2%) | 247 (8.1%) |
| 7:30 AM to 7:59 AM | 230 (9.3%) | 507 (16.7%) |
| 8:00 AM to 8:29 AM | 441 (17.8%) | 510 (16.8%) |
| 8:30 AM to 8:59 AM | 97 (3.9%) | 225 (7.4%) |
| 9:00 AM to 9:59 AM | 96 (3.9%) | 217 (7.1%) |
| 10:00 AM to 10:59 AM | 28 (1.1%) | 142 (4.7%) |
| 11:00 AM to 11:59 AM | 56 (2.3%) | 10 (0.3%) |
| 12:00 PM to 3:59 PM | 273 (11.0%) | 288 (9.5%) |
| 4:00 PM to 11:59 PM | 302 (12.2%) | 156 (5.1%) |
| Total | 2,477 (100.0%) | 3,041 (100.0%) |
Housing Occupancy in Manchester
Occupancy by Ownership in Manchester
Of the total 4,924 dwellings in Manchester, owner-occupied units account for 2,856 (58.0%), while renter-occupied units make up 2,068 (42.0%).
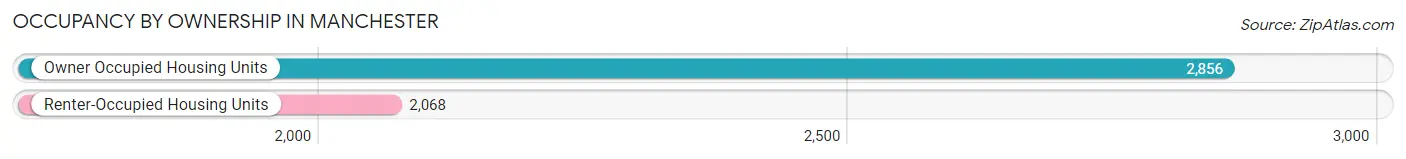
| Occupancy | # Housing Units | % Housing Units |
| Owner Occupied Housing Units | 2,856 | 58.0% |
| Renter-Occupied Housing Units | 2,068 | 42.0% |
| Total Occupied Housing Units | 4,924 | 100.0% |
Occupancy by Household Size in Manchester
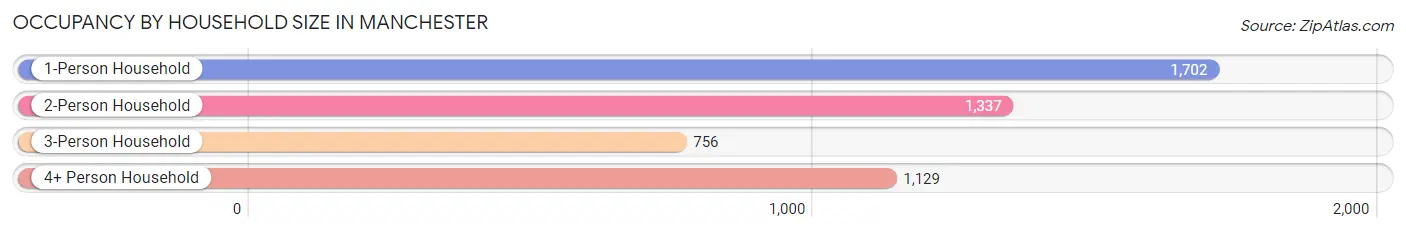
| Household Size | # Housing Units | % Housing Units |
| 1-Person Household | 1,702 | 34.6% |
| 2-Person Household | 1,337 | 27.2% |
| 3-Person Household | 756 | 15.3% |
| 4+ Person Household | 1,129 | 22.9% |
| Total Housing Units | 4,924 | 100.0% |
Occupancy by Ownership by Household Size in Manchester
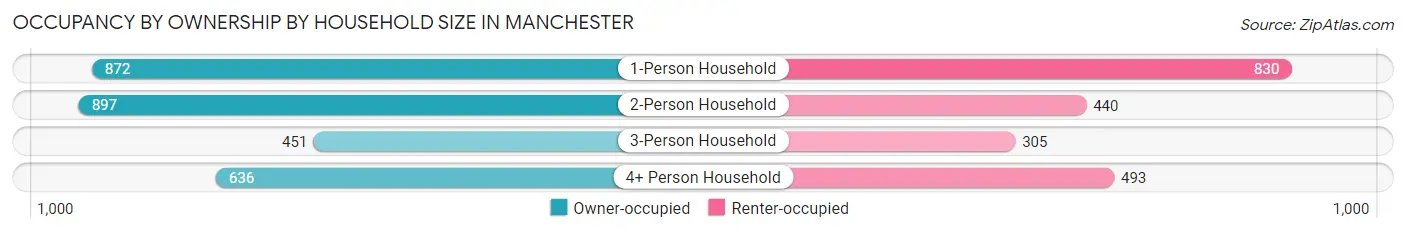
| Household Size | Owner-occupied | Renter-occupied |
| 1-Person Household | 872 (51.2%) | 830 (48.8%) |
| 2-Person Household | 897 (67.1%) | 440 (32.9%) |
| 3-Person Household | 451 (59.7%) | 305 (40.3%) |
| 4+ Person Household | 636 (56.3%) | 493 (43.7%) |
| Total Housing Units | 2,856 (58.0%) | 2,068 (42.0%) |
Occupancy by Educational Attainment in Manchester
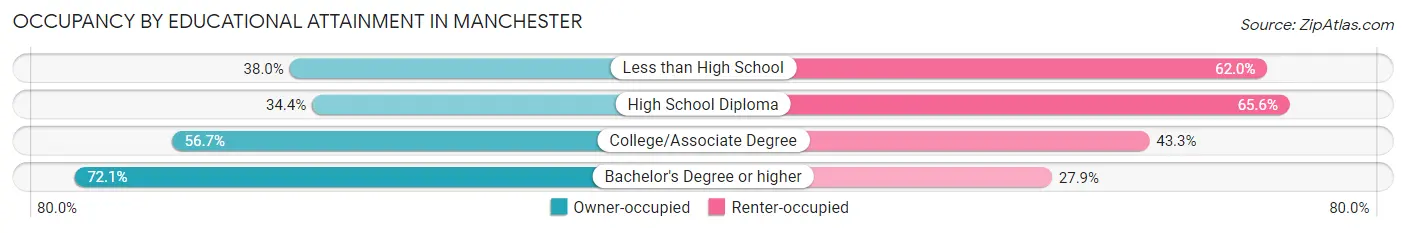
| Household Size | Owner-occupied | Renter-occupied |
| Less than High School | 112 (38.0%) | 183 (62.0%) |
| High School Diploma | 321 (34.4%) | 612 (65.6%) |
| College/Associate Degree | 891 (56.7%) | 681 (43.3%) |
| Bachelor's Degree or higher | 1,532 (72.1%) | 592 (27.9%) |
Occupancy by Age of Householder in Manchester
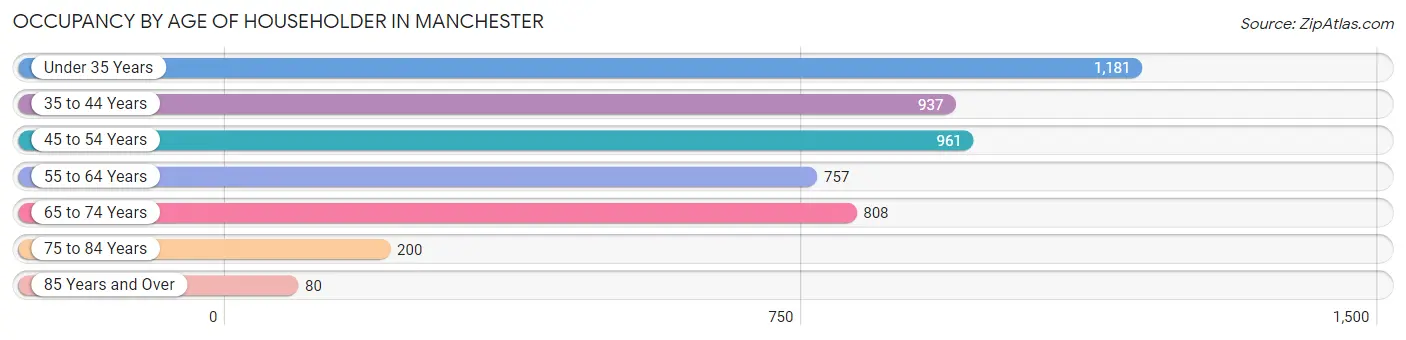
| Age Bracket | # Households | % Households |
| Under 35 Years | 1,181 | 24.0% |
| 35 to 44 Years | 937 | 19.0% |
| 45 to 54 Years | 961 | 19.5% |
| 55 to 64 Years | 757 | 15.4% |
| 65 to 74 Years | 808 | 16.4% |
| 75 to 84 Years | 200 | 4.1% |
| 85 Years and Over | 80 | 1.6% |
| Total | 4,924 | 100.0% |
Housing Finances in Manchester
Median Income by Occupancy in Manchester
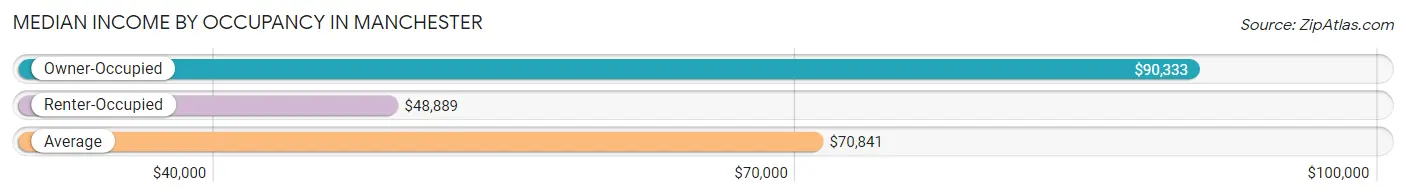
| Occupancy Type | # Households | Median Income |
| Owner-Occupied | 2,856 (58.0%) | $90,333 |
| Renter-Occupied | 2,068 (42.0%) | $48,889 |
| Average | 4,924 (100.0%) | $70,841 |
Occupancy by Householder Income Bracket in Manchester
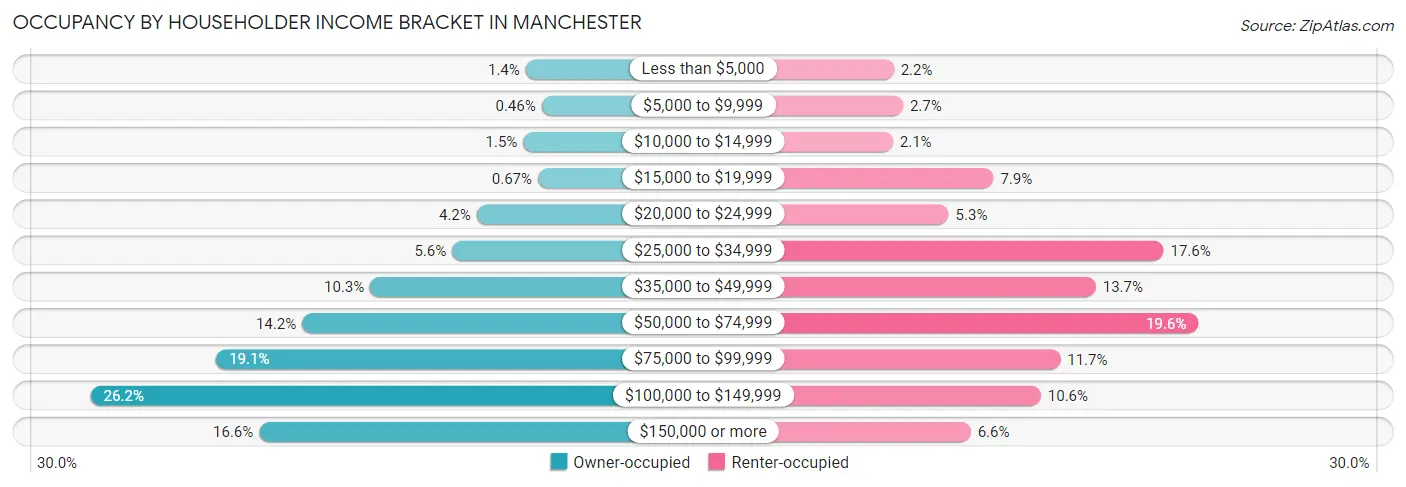
| Income Bracket | Owner-occupied | Renter-occupied |
| Less than $5,000 | 39 (1.4%) | 45 (2.2%) |
| $5,000 to $9,999 | 13 (0.5%) | 56 (2.7%) |
| $10,000 to $14,999 | 43 (1.5%) | 44 (2.1%) |
| $15,000 to $19,999 | 19 (0.7%) | 163 (7.9%) |
| $20,000 to $24,999 | 119 (4.2%) | 110 (5.3%) |
| $25,000 to $34,999 | 159 (5.6%) | 364 (17.6%) |
| $35,000 to $49,999 | 293 (10.3%) | 284 (13.7%) |
| $50,000 to $74,999 | 404 (14.1%) | 405 (19.6%) |
| $75,000 to $99,999 | 544 (19.1%) | 242 (11.7%) |
| $100,000 to $149,999 | 749 (26.2%) | 219 (10.6%) |
| $150,000 or more | 474 (16.6%) | 136 (6.6%) |
| Total | 2,856 (100.0%) | 2,068 (100.0%) |
Monthly Housing Cost Tiers in Manchester
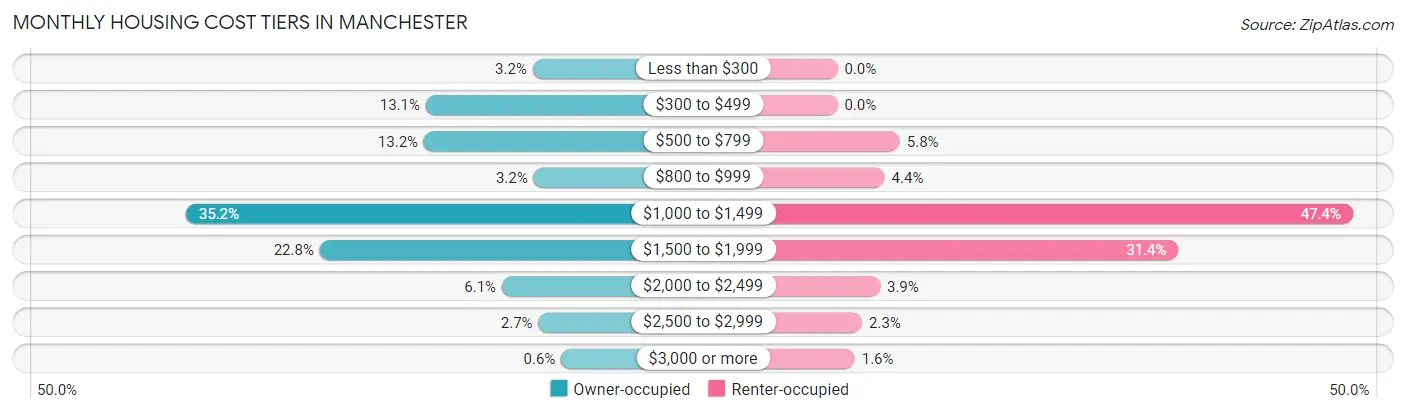
| Monthly Cost | Owner-occupied | Renter-occupied |
| Less than $300 | 92 (3.2%) | 0 (0.0%) |
| $300 to $499 | 373 (13.1%) | 0 (0.0%) |
| $500 to $799 | 378 (13.2%) | 119 (5.8%) |
| $800 to $999 | 90 (3.2%) | 90 (4.3%) |
| $1,000 to $1,499 | 1,004 (35.1%) | 981 (47.4%) |
| $1,500 to $1,999 | 652 (22.8%) | 649 (31.4%) |
| $2,000 to $2,499 | 173 (6.1%) | 81 (3.9%) |
| $2,500 to $2,999 | 77 (2.7%) | 47 (2.3%) |
| $3,000 or more | 17 (0.6%) | 33 (1.6%) |
| Total | 2,856 (100.0%) | 2,068 (100.0%) |
Physical Housing Characteristics in Manchester
Housing Structures in Manchester
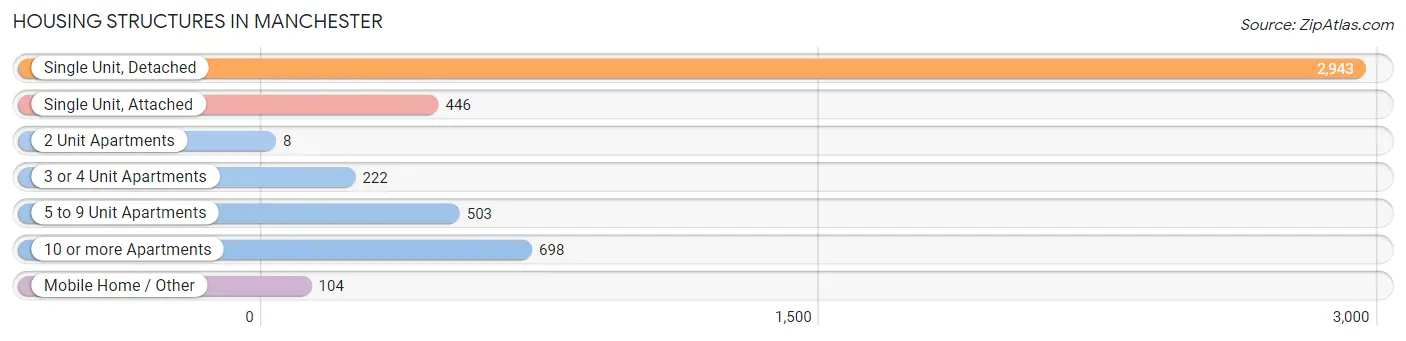
| Structure Type | # Housing Units | % Housing Units |
| Single Unit, Detached | 2,943 | 59.8% |
| Single Unit, Attached | 446 | 9.1% |
| 2 Unit Apartments | 8 | 0.2% |
| 3 or 4 Unit Apartments | 222 | 4.5% |
| 5 to 9 Unit Apartments | 503 | 10.2% |
| 10 or more Apartments | 698 | 14.2% |
| Mobile Home / Other | 104 | 2.1% |
| Total | 4,924 | 100.0% |
Housing Structures by Occupancy in Manchester
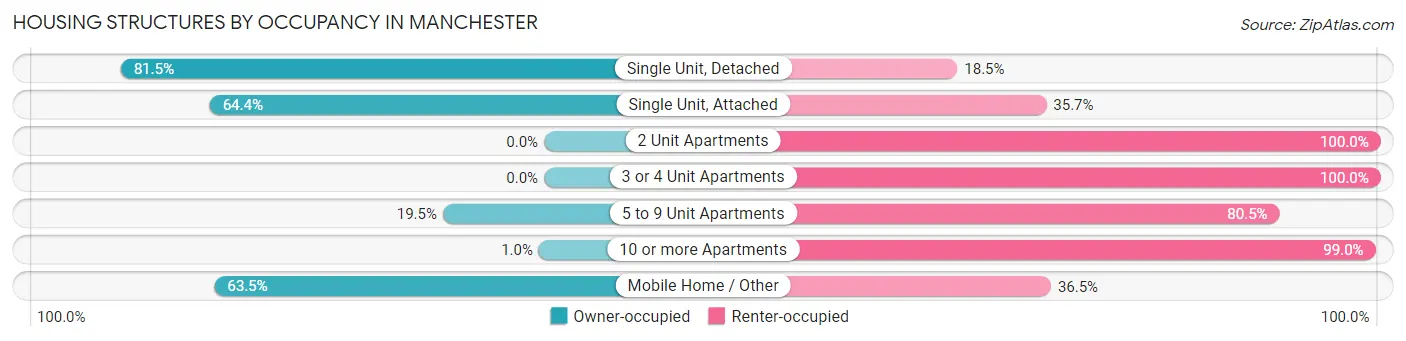
| Structure Type | Owner-occupied | Renter-occupied |
| Single Unit, Detached | 2,398 (81.5%) | 545 (18.5%) |
| Single Unit, Attached | 287 (64.3%) | 159 (35.6%) |
| 2 Unit Apartments | 0 (0.0%) | 8 (100.0%) |
| 3 or 4 Unit Apartments | 0 (0.0%) | 222 (100.0%) |
| 5 to 9 Unit Apartments | 98 (19.5%) | 405 (80.5%) |
| 10 or more Apartments | 7 (1.0%) | 691 (99.0%) |
| Mobile Home / Other | 66 (63.5%) | 38 (36.5%) |
| Total | 2,856 (58.0%) | 2,068 (42.0%) |
Housing Structures by Number of Rooms in Manchester
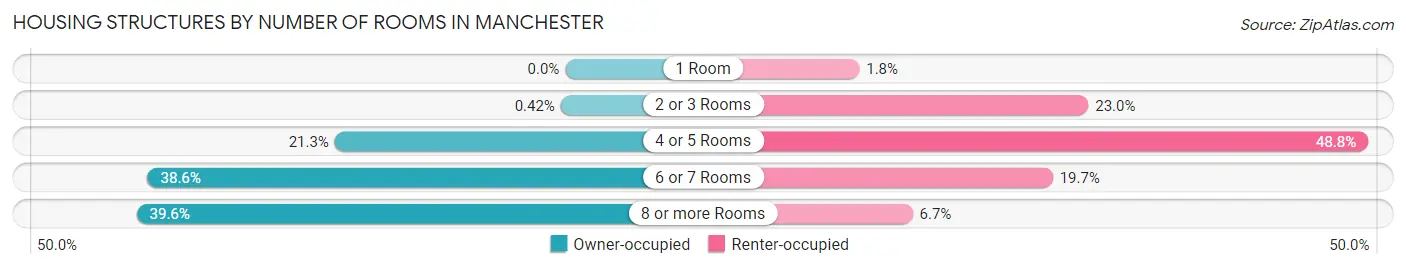
| Number of Rooms | Owner-occupied | Renter-occupied |
| 1 Room | 0 (0.0%) | 37 (1.8%) |
| 2 or 3 Rooms | 12 (0.4%) | 475 (23.0%) |
| 4 or 5 Rooms | 609 (21.3%) | 1,010 (48.8%) |
| 6 or 7 Rooms | 1,103 (38.6%) | 407 (19.7%) |
| 8 or more Rooms | 1,132 (39.6%) | 139 (6.7%) |
| Total | 2,856 (100.0%) | 2,068 (100.0%) |
Housing Structure by Heating Type in Manchester
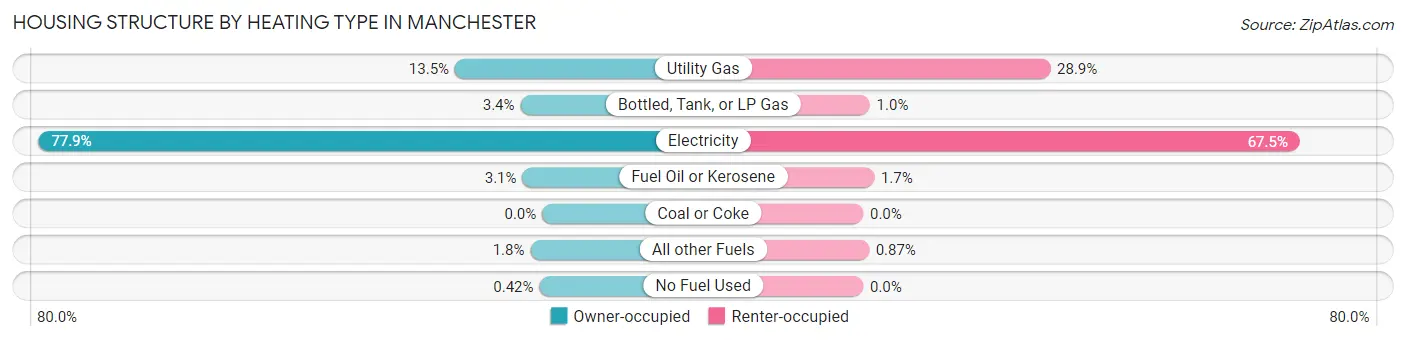
| Heating Type | Owner-occupied | Renter-occupied |
| Utility Gas | 385 (13.5%) | 598 (28.9%) |
| Bottled, Tank, or LP Gas | 96 (3.4%) | 21 (1.0%) |
| Electricity | 2,224 (77.9%) | 1,396 (67.5%) |
| Fuel Oil or Kerosene | 87 (3.0%) | 35 (1.7%) |
| Coal or Coke | 0 (0.0%) | 0 (0.0%) |
| All other Fuels | 52 (1.8%) | 18 (0.9%) |
| No Fuel Used | 12 (0.4%) | 0 (0.0%) |
| Total | 2,856 (100.0%) | 2,068 (100.0%) |
Household Vehicle Usage in Manchester
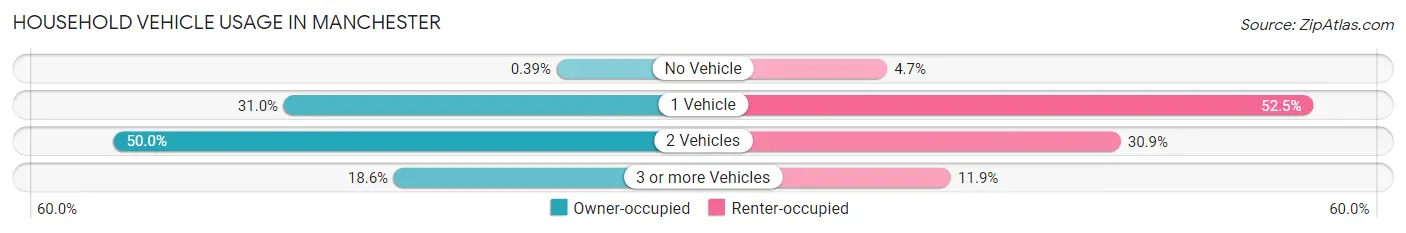
| Vehicles per Household | Owner-occupied | Renter-occupied |
| No Vehicle | 11 (0.4%) | 98 (4.7%) |
| 1 Vehicle | 884 (30.9%) | 1,085 (52.5%) |
| 2 Vehicles | 1,429 (50.0%) | 639 (30.9%) |
| 3 or more Vehicles | 532 (18.6%) | 246 (11.9%) |
| Total | 2,856 (100.0%) | 2,068 (100.0%) |
Real Estate & Mortgages in Manchester
Real Estate and Mortgage Overview in Manchester
| Characteristic | Without Mortgage | With Mortgage |
| Housing Units | 775 | 2,081 |
| Median Property Value | $243,100 | $263,900 |
| Median Household Income | $75,265 | $436 |
| Monthly Housing Costs | $474 | $17 |
| Real Estate Taxes | $2,156 | $12 |
Property Value by Mortgage Status in Manchester
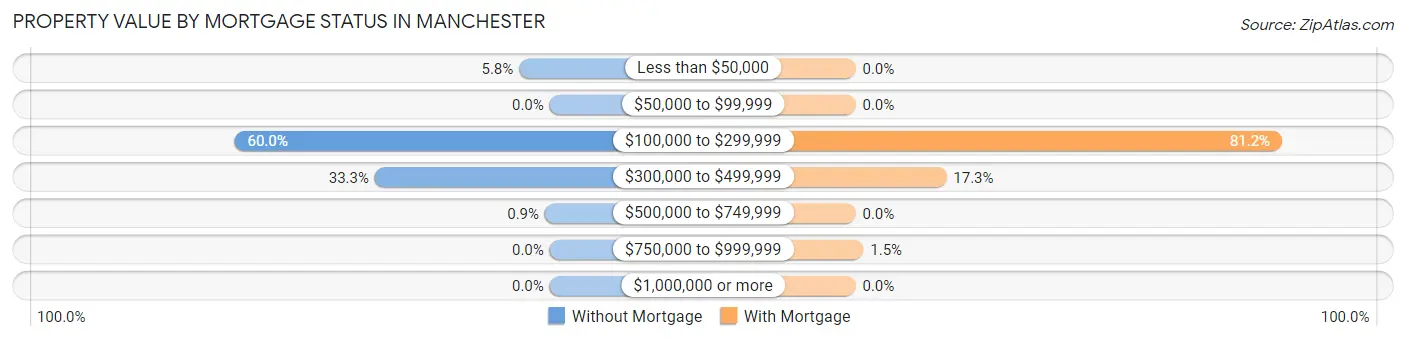
| Property Value | Without Mortgage | With Mortgage |
| Less than $50,000 | 45 (5.8%) | 0 (0.0%) |
| $50,000 to $99,999 | 0 (0.0%) | 0 (0.0%) |
| $100,000 to $299,999 | 465 (60.0%) | 1,690 (81.2%) |
| $300,000 to $499,999 | 258 (33.3%) | 360 (17.3%) |
| $500,000 to $749,999 | 7 (0.9%) | 0 (0.0%) |
| $750,000 to $999,999 | 0 (0.0%) | 31 (1.5%) |
| $1,000,000 or more | 0 (0.0%) | 0 (0.0%) |
| Total | 775 (100.0%) | 2,081 (100.0%) |
Household Income by Mortgage Status in Manchester
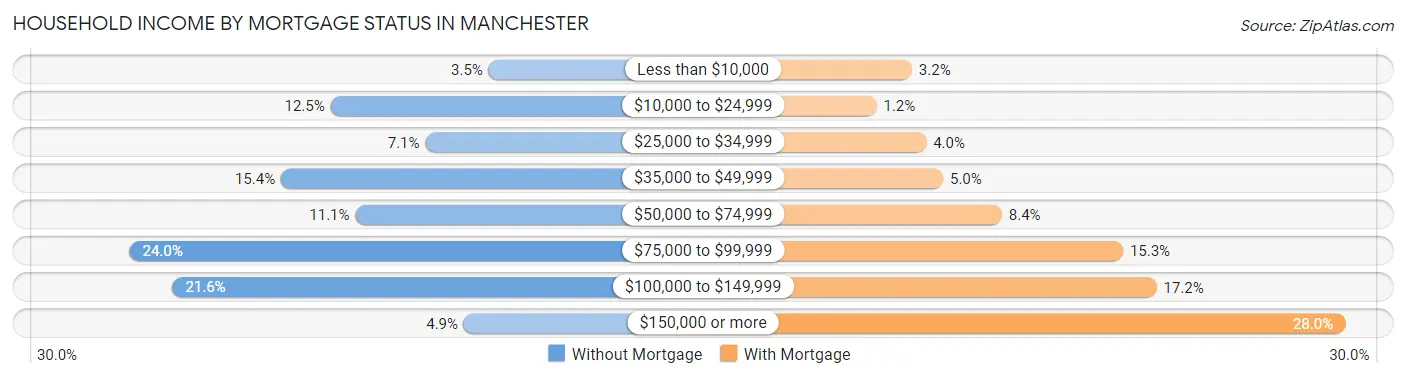
| Household Income | Without Mortgage | With Mortgage |
| Less than $10,000 | 27 (3.5%) | 67 (3.2%) |
| $10,000 to $24,999 | 97 (12.5%) | 25 (1.2%) |
| $25,000 to $34,999 | 55 (7.1%) | 84 (4.0%) |
| $35,000 to $49,999 | 119 (15.3%) | 104 (5.0%) |
| $50,000 to $74,999 | 86 (11.1%) | 174 (8.4%) |
| $75,000 to $99,999 | 186 (24.0%) | 318 (15.3%) |
| $100,000 to $149,999 | 167 (21.5%) | 358 (17.2%) |
| $150,000 or more | 38 (4.9%) | 582 (28.0%) |
| Total | 775 (100.0%) | 2,081 (100.0%) |
Property Value to Household Income Ratio in Manchester
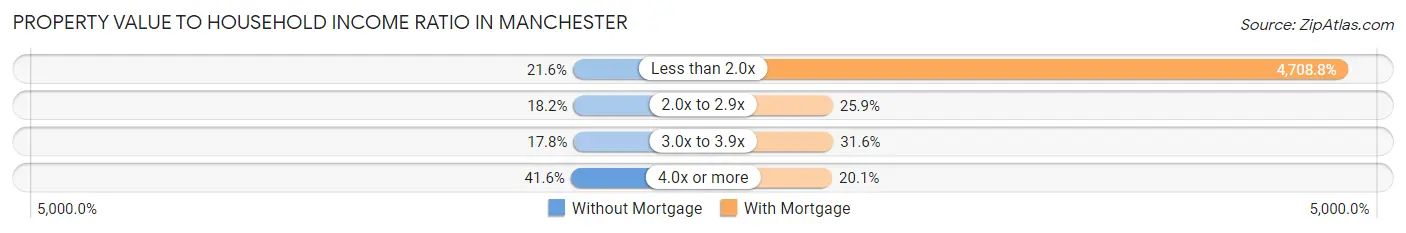
| Value-to-Income Ratio | Without Mortgage | With Mortgage |
| Less than 2.0x | 167 (21.5%) | 97,991 (4,708.8%) |
| 2.0x to 2.9x | 141 (18.2%) | 538 (25.9%) |
| 3.0x to 3.9x | 138 (17.8%) | 658 (31.6%) |
| 4.0x or more | 322 (41.5%) | 418 (20.1%) |
| Total | 775 (100.0%) | 2,081 (100.0%) |
Real Estate Taxes by Mortgage Status in Manchester
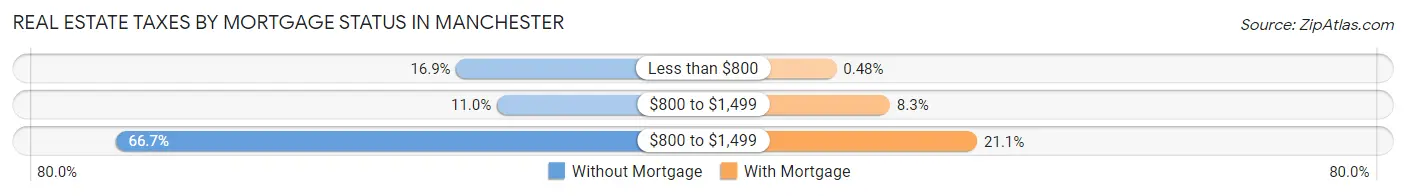
| Property Taxes | Without Mortgage | With Mortgage |
| Less than $800 | 131 (16.9%) | 10 (0.5%) |
| $800 to $1,499 | 85 (11.0%) | 173 (8.3%) |
| $800 to $1,499 | 517 (66.7%) | 438 (21.0%) |
| Total | 775 (100.0%) | 2,081 (100.0%) |
Health & Disability in Manchester
Health Insurance Coverage by Age in Manchester
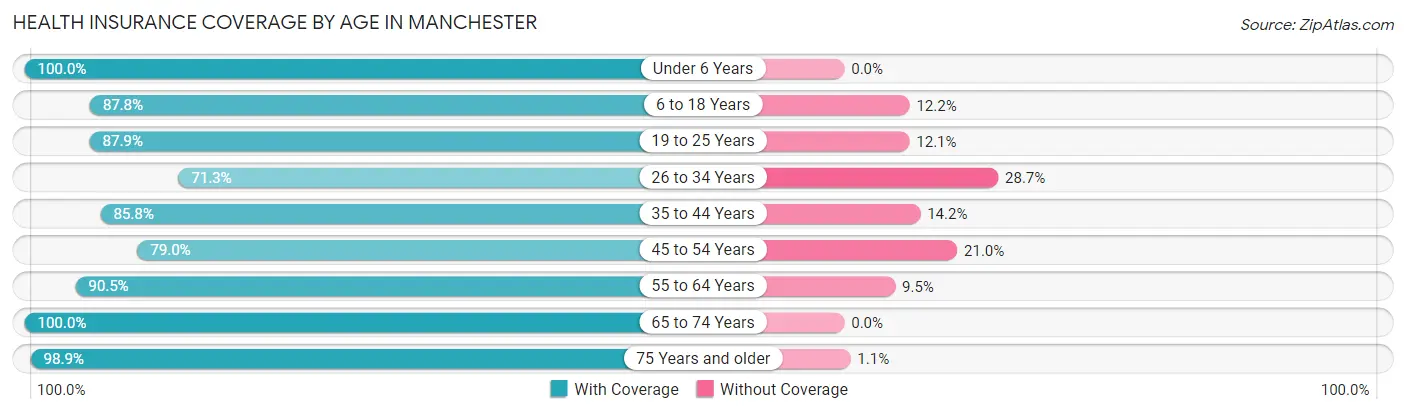
| Age Bracket | With Coverage | Without Coverage |
| Under 6 Years | 947 (100.0%) | 0 (0.0%) |
| 6 to 18 Years | 2,123 (87.8%) | 294 (12.2%) |
| 19 to 25 Years | 782 (87.9%) | 108 (12.1%) |
| 26 to 34 Years | 1,395 (71.3%) | 561 (28.7%) |
| 35 to 44 Years | 1,394 (85.8%) | 230 (14.2%) |
| 45 to 54 Years | 1,186 (79.0%) | 316 (21.0%) |
| 55 to 64 Years | 898 (90.5%) | 94 (9.5%) |
| 65 to 74 Years | 1,132 (100.0%) | 0 (0.0%) |
| 75 Years and older | 432 (98.9%) | 5 (1.1%) |
| Total | 10,289 (86.5%) | 1,608 (13.5%) |
Health Insurance Coverage by Citizenship Status in Manchester
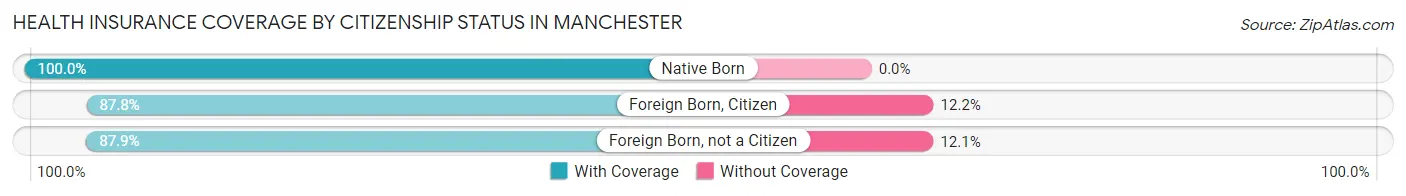
| Citizenship Status | With Coverage | Without Coverage |
| Native Born | 947 (100.0%) | 0 (0.0%) |
| Foreign Born, Citizen | 2,123 (87.8%) | 294 (12.2%) |
| Foreign Born, not a Citizen | 782 (87.9%) | 108 (12.1%) |
Health Insurance Coverage by Household Income in Manchester
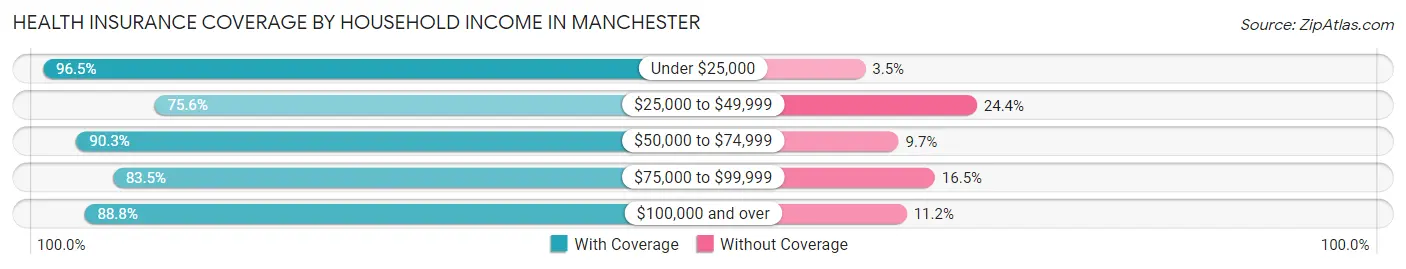
| Household Income | With Coverage | Without Coverage |
| Under $25,000 | 1,169 (96.5%) | 42 (3.5%) |
| $25,000 to $49,999 | 1,654 (75.6%) | 533 (24.4%) |
| $50,000 to $74,999 | 1,487 (90.3%) | 160 (9.7%) |
| $75,000 to $99,999 | 1,648 (83.5%) | 326 (16.5%) |
| $100,000 and over | 4,324 (88.8%) | 547 (11.2%) |
Public vs Private Health Insurance Coverage by Age in Manchester
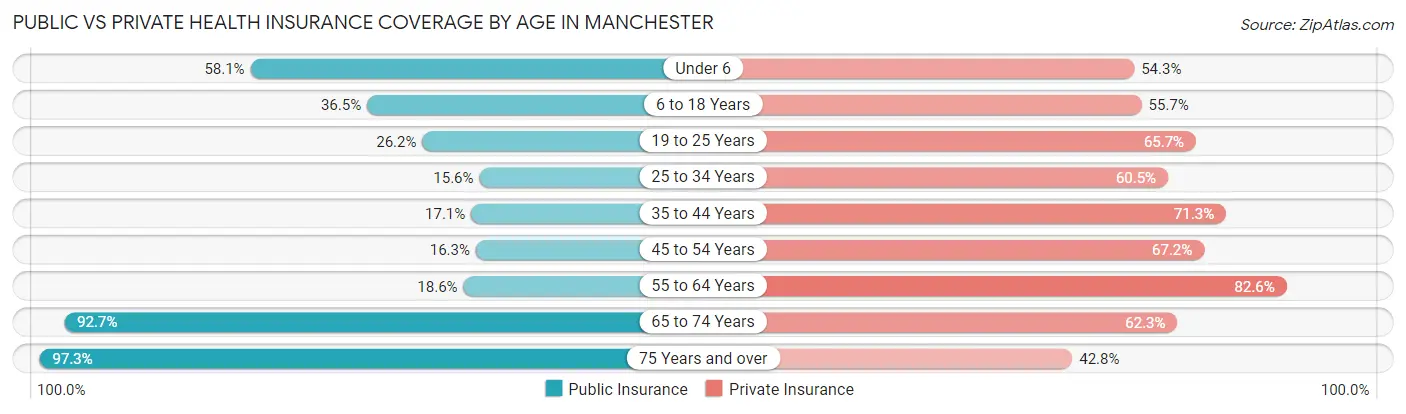
| Age Bracket | Public Insurance | Private Insurance |
| Under 6 | 550 (58.1%) | 514 (54.3%) |
| 6 to 18 Years | 881 (36.4%) | 1,345 (55.6%) |
| 19 to 25 Years | 233 (26.2%) | 585 (65.7%) |
| 25 to 34 Years | 305 (15.6%) | 1,184 (60.5%) |
| 35 to 44 Years | 278 (17.1%) | 1,158 (71.3%) |
| 45 to 54 Years | 244 (16.3%) | 1,010 (67.2%) |
| 55 to 64 Years | 184 (18.5%) | 819 (82.6%) |
| 65 to 74 Years | 1,049 (92.7%) | 705 (62.3%) |
| 75 Years and over | 425 (97.3%) | 187 (42.8%) |
| Total | 4,149 (34.9%) | 7,507 (63.1%) |
Disability Status by Sex by Age in Manchester
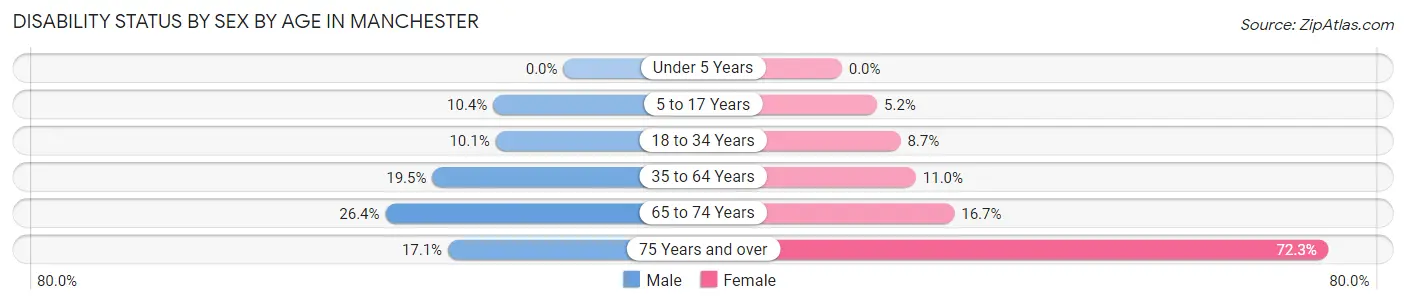
| Age Bracket | Male | Female |
| Under 5 Years | 0 (0.0%) | 0 (0.0%) |
| 5 to 17 Years | 120 (10.4%) | 56 (5.2%) |
| 18 to 34 Years | 157 (10.1%) | 150 (8.7%) |
| 35 to 64 Years | 359 (19.5%) | 250 (11.0%) |
| 65 to 74 Years | 152 (26.4%) | 93 (16.7%) |
| 75 Years and over | 18 (17.1%) | 240 (72.3%) |
Disability Class by Sex by Age in Manchester
Disability Class: Hearing Difficulty
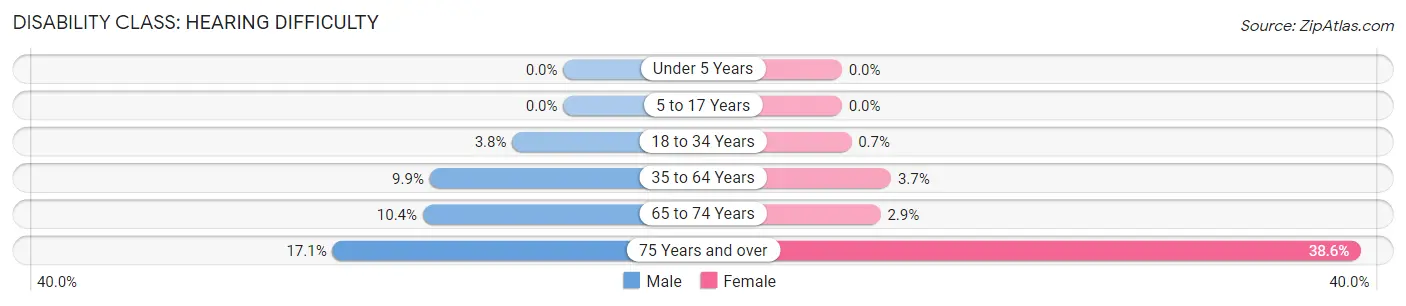
| Age Bracket | Male | Female |
| Under 5 Years | 0 (0.0%) | 0 (0.0%) |
| 5 to 17 Years | 0 (0.0%) | 0 (0.0%) |
| 18 to 34 Years | 59 (3.8%) | 12 (0.7%) |
| 35 to 64 Years | 183 (9.9%) | 83 (3.6%) |
| 65 to 74 Years | 60 (10.4%) | 16 (2.9%) |
| 75 Years and over | 18 (17.1%) | 128 (38.6%) |
Disability Class: Vision Difficulty
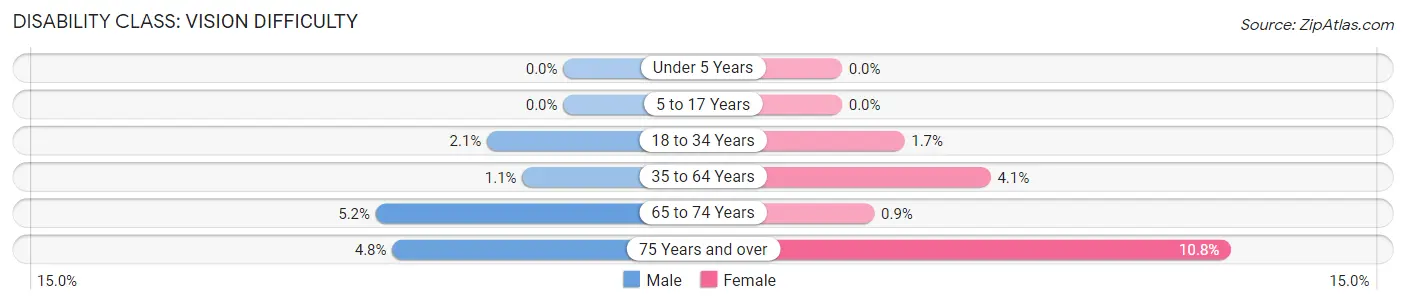
| Age Bracket | Male | Female |
| Under 5 Years | 0 (0.0%) | 0 (0.0%) |
| 5 to 17 Years | 0 (0.0%) | 0 (0.0%) |
| 18 to 34 Years | 33 (2.1%) | 30 (1.7%) |
| 35 to 64 Years | 21 (1.1%) | 94 (4.1%) |
| 65 to 74 Years | 30 (5.2%) | 5 (0.9%) |
| 75 Years and over | 5 (4.8%) | 36 (10.8%) |
Disability Class: Cognitive Difficulty
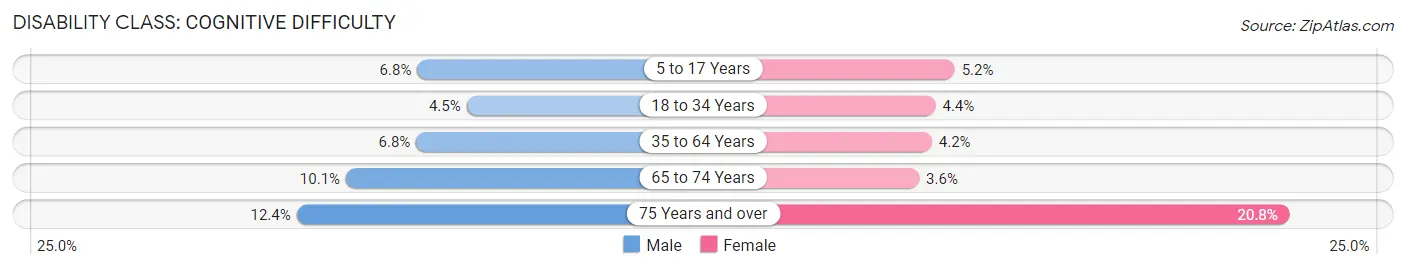
| Age Bracket | Male | Female |
| 5 to 17 Years | 78 (6.8%) | 56 (5.2%) |
| 18 to 34 Years | 70 (4.5%) | 75 (4.3%) |
| 35 to 64 Years | 126 (6.8%) | 95 (4.2%) |
| 65 to 74 Years | 58 (10.1%) | 20 (3.6%) |
| 75 Years and over | 13 (12.4%) | 69 (20.8%) |
Disability Class: Ambulatory Difficulty
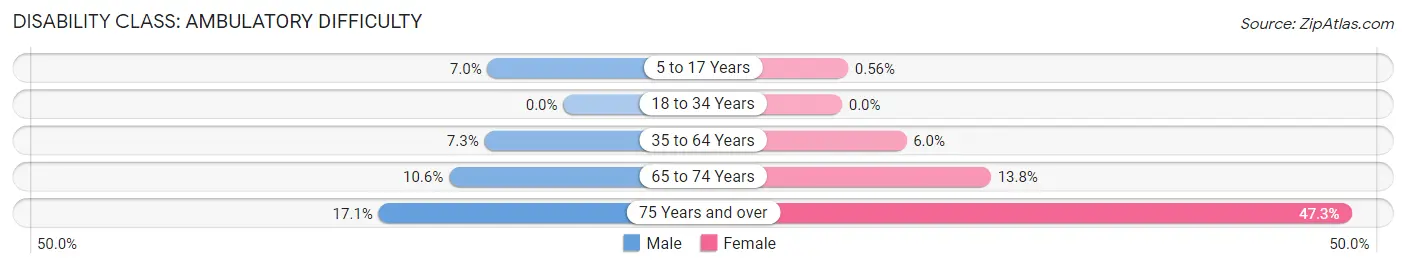
| Age Bracket | Male | Female |
| 5 to 17 Years | 81 (7.0%) | 6 (0.6%) |
| 18 to 34 Years | 0 (0.0%) | 0 (0.0%) |
| 35 to 64 Years | 135 (7.3%) | 136 (6.0%) |
| 65 to 74 Years | 61 (10.6%) | 77 (13.8%) |
| 75 Years and over | 18 (17.1%) | 157 (47.3%) |
Disability Class: Self-Care Difficulty
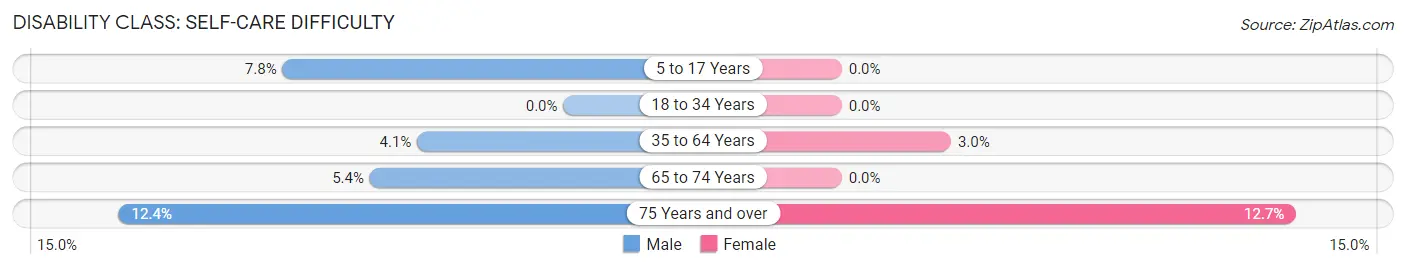
| Age Bracket | Male | Female |
| 5 to 17 Years | 90 (7.8%) | 0 (0.0%) |
| 18 to 34 Years | 0 (0.0%) | 0 (0.0%) |
| 35 to 64 Years | 75 (4.1%) | 69 (3.0%) |
| 65 to 74 Years | 31 (5.4%) | 0 (0.0%) |
| 75 Years and over | 13 (12.4%) | 42 (12.7%) |
Technology Access in Manchester
Computing Device Access in Manchester
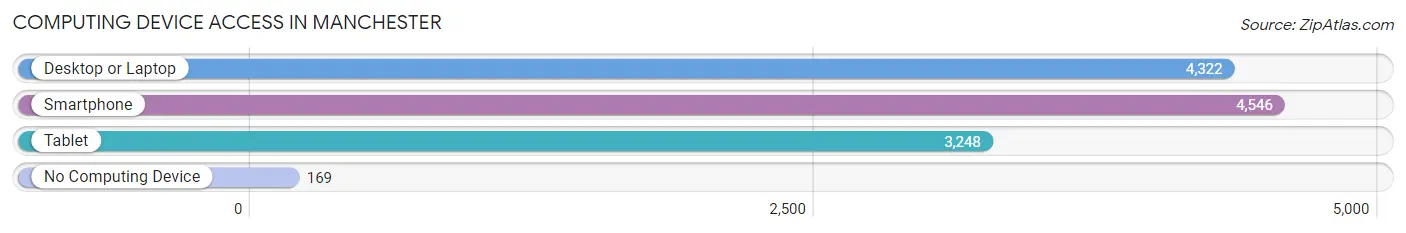
| Device Type | # Households | % Households |
| Desktop or Laptop | 4,322 | 87.8% |
| Smartphone | 4,546 | 92.3% |
| Tablet | 3,248 | 66.0% |
| No Computing Device | 169 | 3.4% |
| Total | 4,924 | 100.0% |
Internet Access in Manchester
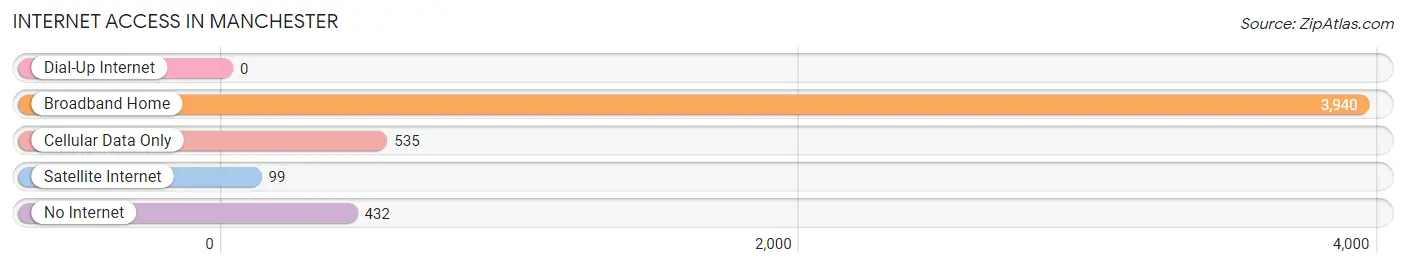
| Internet Type | # Households | % Households |
| Dial-Up Internet | 0 | 0.0% |
| Broadband Home | 3,940 | 80.0% |
| Cellular Data Only | 535 | 10.9% |
| Satellite Internet | 99 | 2.0% |
| No Internet | 432 | 8.8% |
| Total | 4,924 | 100.0% |
Manchester Summary
Manchester is a town located in the Central Region of Virginia, United States. It is part of the Richmond-Petersburg Metropolitan Statistical Area and is located in Chesterfield County. The town was founded in 1874 and has a population of approximately 8,000 people.
Geography
Manchester is located in the Central Region of Virginia, approximately 20 miles south of Richmond and 40 miles north of Petersburg. The town is situated on the Appomattox River, which is a tributary of the James River. The town is surrounded by the counties of Chesterfield, Dinwiddie, and Prince George. The town is located in a rural area and is surrounded by farmland and forests.
The town has a total area of 4.2 square miles, of which 4.1 square miles is land and 0.1 square miles is water. The terrain is mostly flat with some rolling hills. The climate is humid subtropical, with hot, humid summers and mild winters.
Economy
Manchester’s economy is largely based on agriculture and manufacturing. The town is home to several large farms, which produce a variety of crops, including corn, soybeans, wheat, and hay. The town is also home to several manufacturing companies, which produce a variety of products, including furniture, textiles, and automotive parts.
The town is also home to several small businesses, including restaurants, retail stores, and service providers. The town is also home to several government offices, including the Chesterfield County Courthouse and the Manchester Police Department.
Demographics
As of the 2010 census, Manchester had a population of 8,000 people. The racial makeup of the town was 79.2% White, 15.2% African American, 0.3% Native American, 0.7% Asian, 0.1% Pacific Islander, and 4.5% from other races. Hispanic or Latino of any race were 2.2% of the population.
The median income for a household in the town was $45,000, and the median income for a family was $50,000. The per capita income for the town was $20,000. About 11.2% of families and 13.2% of the population were below the poverty line, including 17.2% of those under age 18 and 8.2% of those age 65 or over.
Manchester is served by the Chesterfield County Public Schools system. The town is home to Manchester High School, which serves grades 9-12. The town is also home to several private schools, including Manchester Christian Academy and Manchester Academy.
Manchester is served by the Chesterfield County Public Library system. The town is home to the Manchester Public Library, which offers a variety of services, including books, magazines, newspapers, and audio-visual materials. The library also offers a variety of programs, including story times, book clubs, and computer classes.
Manchester is served by the Chesterfield County Fire and Rescue Department. The department provides fire protection and emergency medical services to the town and surrounding areas. The department also provides public education and fire prevention services.
Manchester is served by the Chesterfield County Sheriff’s Office. The office provides law enforcement services to the town and surrounding areas. The office also provides public safety services, such as crime prevention and community outreach.
Common Questions
What is Per Capita Income in Manchester?
Per Capita income in Manchester is $34,044.
What is the Median Family Income in Manchester?
Median Family Income in Manchester is $89,274.
What is the Median Household income in Manchester?
Median Household Income in Manchester is $70,841.
What is Income or Wage Gap in Manchester?
Income or Wage Gap in Manchester is 6.4%.
Women in Manchester earn 93.6 cents for every dollar earned by a man.
What is Inequality or Gini Index in Manchester?
Inequality or Gini Index in Manchester is 0.38.
What is the Total Population of Manchester?
Total Population of Manchester is 11,929.
What is the Total Male Population of Manchester?
Total Male Population of Manchester is 5,658.
What is the Total Female Population of Manchester?
Total Female Population of Manchester is 6,271.
What is the Ratio of Males per 100 Females in Manchester?
There are 90.22 Males per 100 Females in Manchester.
What is the Ratio of Females per 100 Males in Manchester?
There are 110.83 Females per 100 Males in Manchester.
What is the Median Population Age in Manchester?
Median Population Age in Manchester is 34.1 Years.
What is the Average Family Size in Manchester
Average Family Size in Manchester is 3.2 People.
What is the Average Household Size in Manchester
Average Household Size in Manchester is 2.4 People.
How Large is the Labor Force in Manchester?
There are 7,107 People in the Labor Forcein in Manchester.
What is the Percentage of People in the Labor Force in Manchester?
75.7% of People are in the Labor Force in Manchester.
What is the Unemployment Rate in Manchester?
Unemployment Rate in Manchester is 7.8%.