Laurel Hill, VA Map & Demographics
Laurel Hill Map
Laurel Hill Overview
$55,815
PER CAPITA INCOME
$148,964
AVG FAMILY INCOME
$128,239
AVG HOUSEHOLD INCOME
41.4%
WAGE / INCOME GAP [ % ]
58.6¢/ $1
WAGE / INCOME GAP [ $ ]
0.37
INEQUALITY / GINI INDEX
7,338
TOTAL POPULATION
3,565
MALE POPULATION
3,773
FEMALE POPULATION
94.49
MALES / 100 FEMALES
105.83
FEMALES / 100 MALES
40.5
MEDIAN AGE
3.4
AVG FAMILY SIZE
2.7
AVG HOUSEHOLD SIZE
4,305
LABOR FORCE [ PEOPLE ]
73.7%
PERCENT IN LABOR FORCE
5.4%
UNEMPLOYMENT RATE
Income in Laurel Hill
Income Overview in Laurel Hill
Per Capita Income in Laurel Hill is $55,815, while median incomes of families and households are $148,964 and $128,239 respectively.
| Characteristic | Number | Measure |
| Per Capita Income | 7,338 | $55,815 |
| Median Family Income | 1,882 | $148,964 |
| Mean Family Income | 1,882 | $173,113 |
| Median Household Income | 2,731 | $128,239 |
| Mean Household Income | 2,731 | $146,512 |
| Income Deficit | 1,882 | $0 |
| Wage / Income Gap (%) | 7,338 | 41.36% |
| Wage / Income Gap ($) | 7,338 | 58.64¢ per $1 |
| Gini / Inequality Index | 7,338 | 0.37 |
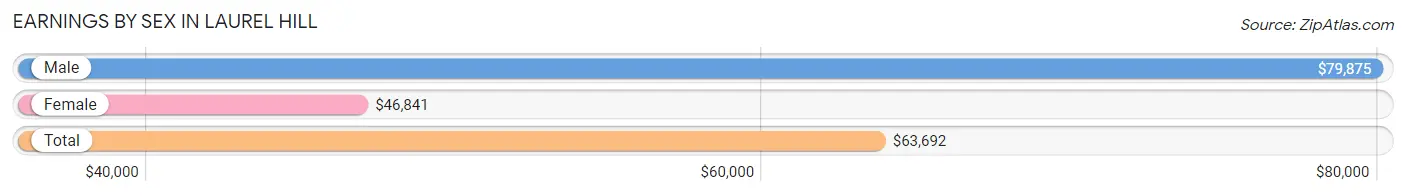
Earnings by Sex in Laurel Hill
Average Earnings in Laurel Hill are $63,692, $79,875 for men and $46,841 for women, a difference of 41.4%.
| Sex | Number | Average Earnings |
| Male | 2,283 (51.8%) | $79,875 |
| Female | 2,121 (48.2%) | $46,841 |
| Total | 4,404 (100.0%) | $63,692 |
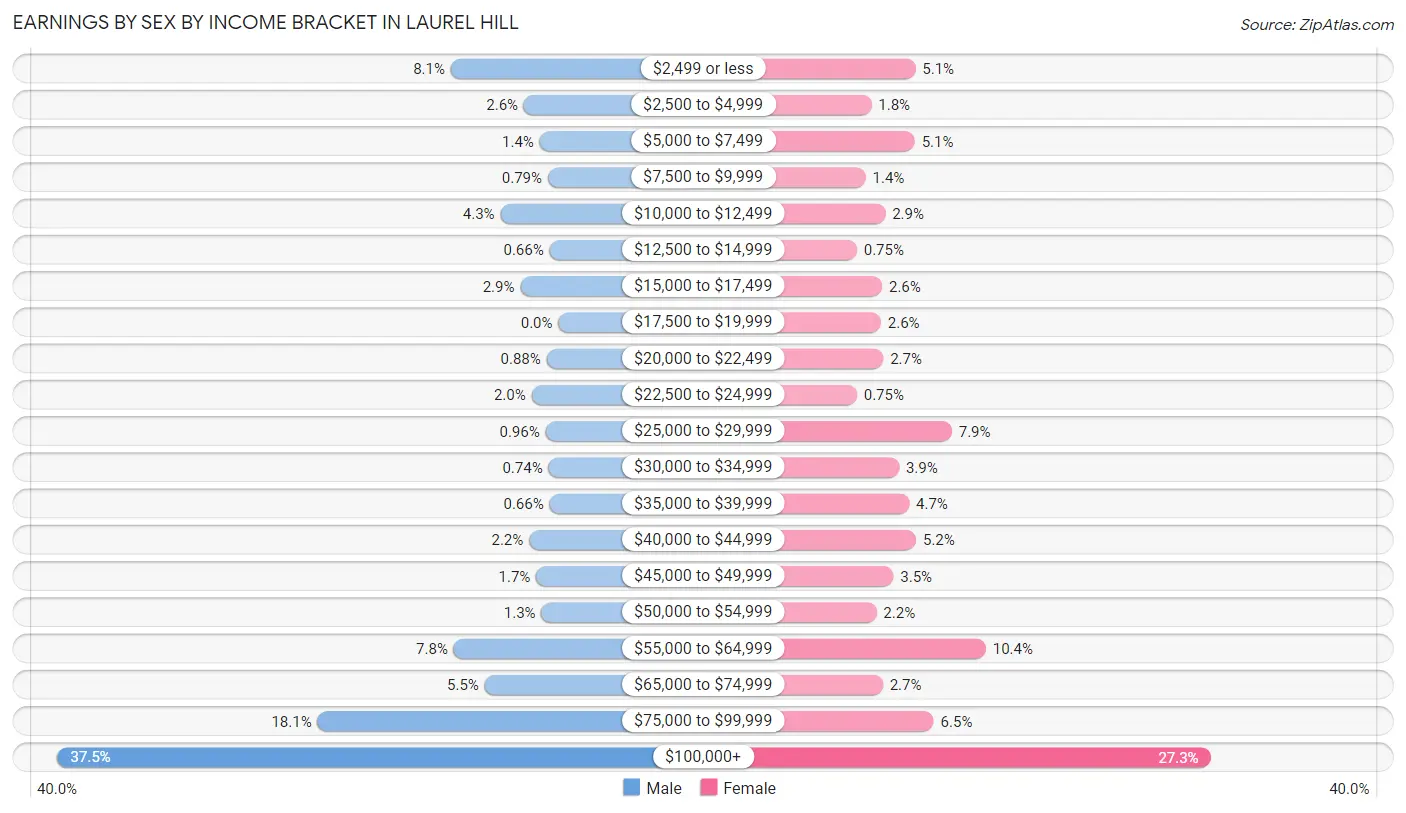
Earnings by Sex by Income Bracket in Laurel Hill
The most common earnings brackets in Laurel Hill are $100,000+ for men (857 | 37.5%) and $100,000+ for women (578 | 27.3%).
| Income | Male | Female |
| $2,499 or less | 184 (8.1%) | 109 (5.1%) |
| $2,500 to $4,999 | 59 (2.6%) | 39 (1.8%) |
| $5,000 to $7,499 | 32 (1.4%) | 108 (5.1%) |
| $7,500 to $9,999 | 18 (0.8%) | 30 (1.4%) |
| $10,000 to $12,499 | 99 (4.3%) | 61 (2.9%) |
| $12,500 to $14,999 | 15 (0.7%) | 16 (0.7%) |
| $15,000 to $17,499 | 65 (2.9%) | 56 (2.6%) |
| $17,500 to $19,999 | 0 (0.0%) | 54 (2.5%) |
| $20,000 to $22,499 | 20 (0.9%) | 58 (2.7%) |
| $22,500 to $24,999 | 46 (2.0%) | 16 (0.7%) |
| $25,000 to $29,999 | 22 (1.0%) | 167 (7.9%) |
| $30,000 to $34,999 | 17 (0.7%) | 83 (3.9%) |
| $35,000 to $39,999 | 15 (0.7%) | 99 (4.7%) |
| $40,000 to $44,999 | 50 (2.2%) | 110 (5.2%) |
| $45,000 to $49,999 | 38 (1.7%) | 74 (3.5%) |
| $50,000 to $54,999 | 29 (1.3%) | 47 (2.2%) |
| $55,000 to $64,999 | 179 (7.8%) | 221 (10.4%) |
| $65,000 to $74,999 | 126 (5.5%) | 57 (2.7%) |
| $75,000 to $99,999 | 412 (18.0%) | 138 (6.5%) |
| $100,000+ | 857 (37.5%) | 578 (27.3%) |
| Total | 2,283 (100.0%) | 2,121 (100.0%) |
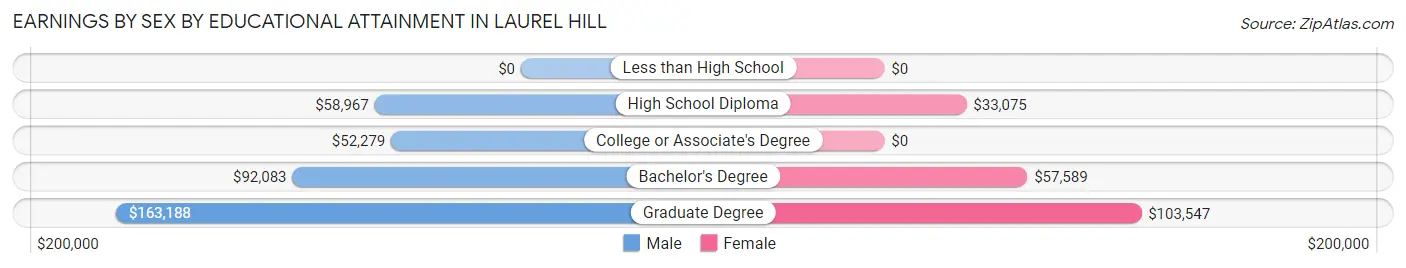
Earnings by Sex by Educational Attainment in Laurel Hill
Average earnings in Laurel Hill are $87,852 for men and $58,067 for women, a difference of 33.9%. Men with an educational attainment of graduate degree enjoy the highest average annual earnings of $163,188, while those with college or associate's degree education earn the least with $52,279. Women with an educational attainment of graduate degree earn the most with the average annual earnings of $103,547, while those with high school diploma education have the smallest earnings of $33,075.
| Educational Attainment | Male Income | Female Income |
| Less than High School | - | - |
| High School Diploma | $58,967 | $33,075 |
| College or Associate's Degree | $52,279 | $0 |
| Bachelor's Degree | $92,083 | $57,589 |
| Graduate Degree | $163,188 | $103,547 |
| Total | $87,852 | $58,067 |
Family Income in Laurel Hill
Family Income Brackets in Laurel Hill
According to the Laurel Hill family income data, there are 683 families falling into the $200,000+ income range, which is the most common income bracket and makes up 36.3% of all families.
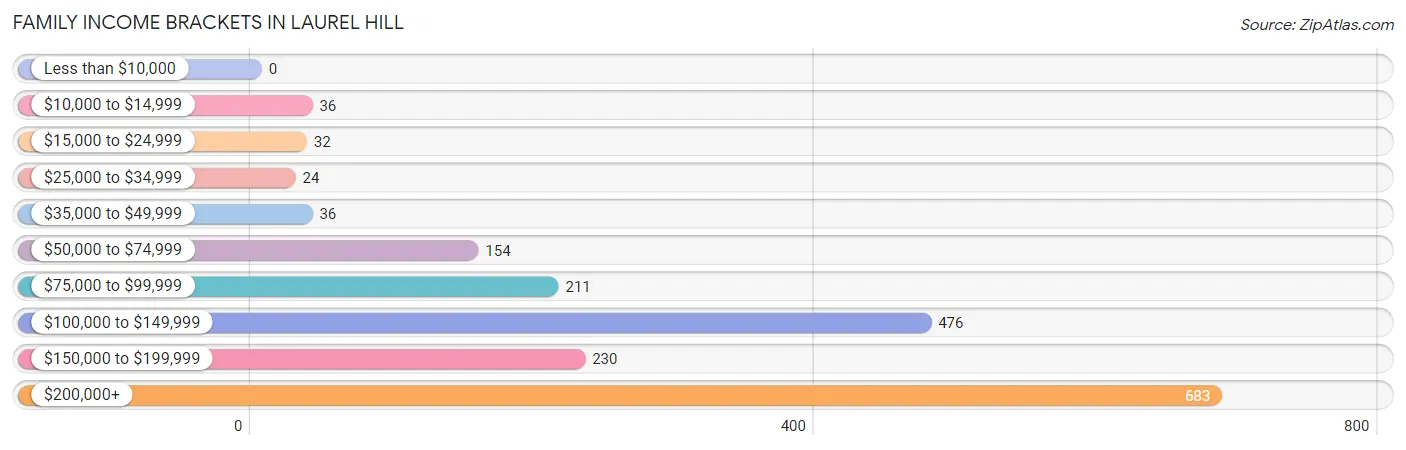
| Income Bracket | # Families | % Families |
| Less than $10,000 | 0 | 0.0% |
| $10,000 to $14,999 | 36 | 1.9% |
| $15,000 to $24,999 | 32 | 1.7% |
| $25,000 to $34,999 | 24 | 1.3% |
| $35,000 to $49,999 | 36 | 1.9% |
| $50,000 to $74,999 | 154 | 8.2% |
| $75,000 to $99,999 | 211 | 11.2% |
| $100,000 to $149,999 | 476 | 25.3% |
| $150,000 to $199,999 | 230 | 12.2% |
| $200,000+ | 683 | 36.3% |
Family Income by Famaliy Size in Laurel Hill
5-person families (224 | 11.9%) account for the highest median family income in Laurel Hill with $223,125 per family, while 2-person families (693 | 36.8%) have the highest median income of $63,125 per family member.
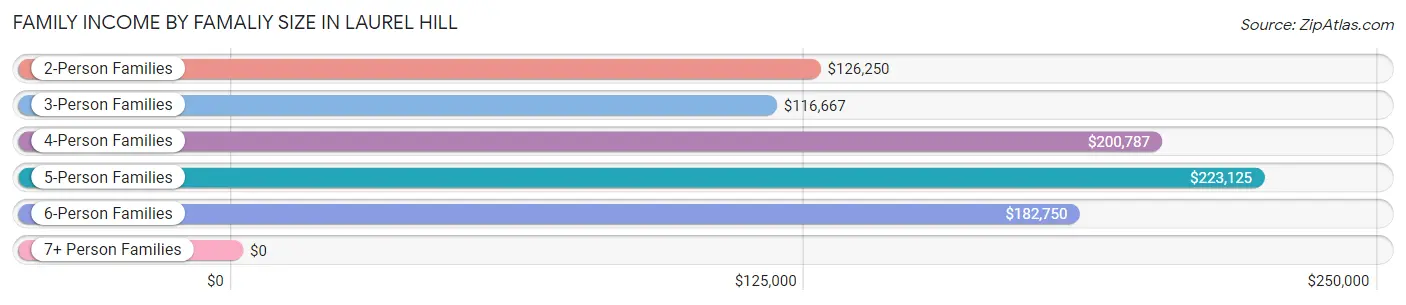
| Income Bracket | # Families | Median Income |
| 2-Person Families | 693 (36.8%) | $126,250 |
| 3-Person Families | 416 (22.1%) | $116,667 |
| 4-Person Families | 510 (27.1%) | $200,787 |
| 5-Person Families | 224 (11.9%) | $223,125 |
| 6-Person Families | 36 (1.9%) | $182,750 |
| 7+ Person Families | 3 (0.2%) | $0 |
| Total | 1,882 (100.0%) | $148,964 |
Family Income by Number of Earners in Laurel Hill
The median family income in Laurel Hill is $148,964, with families comprising 3+ earners (302) having the highest median family income of $225,950, while families with no earners (107) have the lowest median family income of $97,772, accounting for 16.1% and 5.7% of families, respectively.
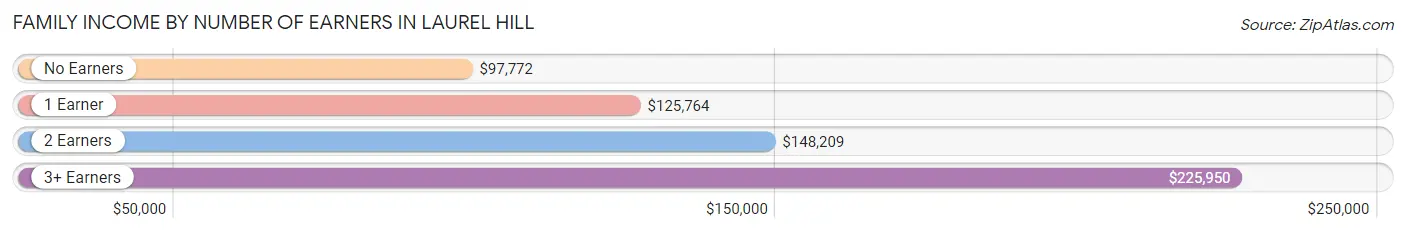
| Number of Earners | # Families | Median Income |
| No Earners | 107 (5.7%) | $97,772 |
| 1 Earner | 495 (26.3%) | $125,764 |
| 2 Earners | 978 (52.0%) | $148,209 |
| 3+ Earners | 302 (16.1%) | $225,950 |
| Total | 1,882 (100.0%) | $148,964 |
Household Income in Laurel Hill
Household Income Brackets in Laurel Hill
With 729 households falling in the category, the $200,000+ income range is the most frequent in Laurel Hill, accounting for 26.7% of all households. In contrast, only 19 households (0.7%) fall into the less than $10,000 income bracket, making it the least populous group.
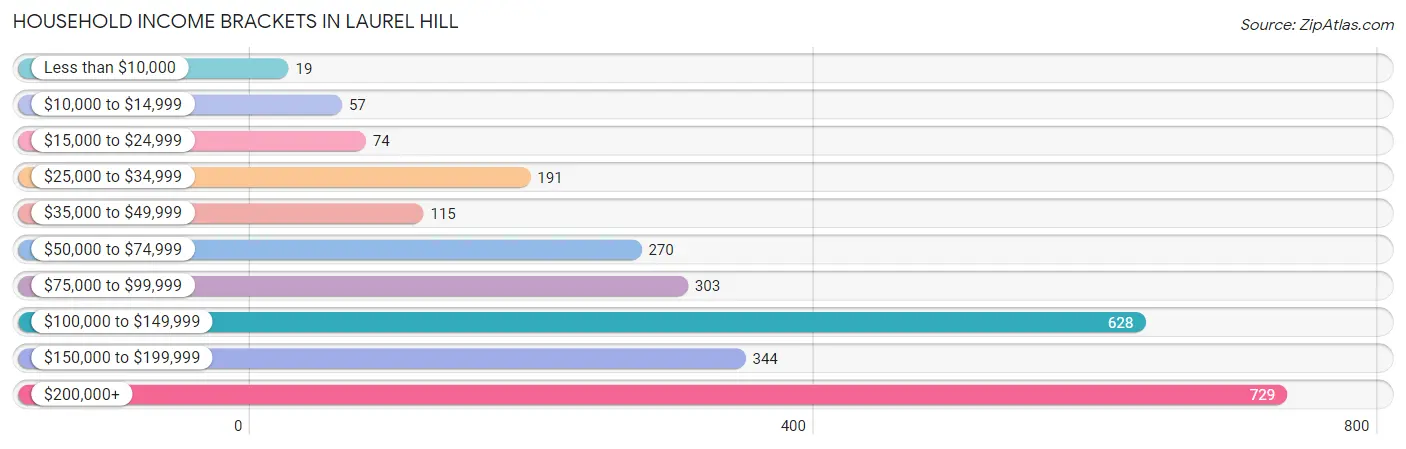
| Income Bracket | # Households | % Households |
| Less than $10,000 | 19 | 0.7% |
| $10,000 to $14,999 | 57 | 2.1% |
| $15,000 to $24,999 | 74 | 2.7% |
| $25,000 to $34,999 | 191 | 7.0% |
| $35,000 to $49,999 | 115 | 4.2% |
| $50,000 to $74,999 | 270 | 9.9% |
| $75,000 to $99,999 | 303 | 11.1% |
| $100,000 to $149,999 | 628 | 23.0% |
| $150,000 to $199,999 | 344 | 12.6% |
| $200,000+ | 729 | 26.7% |
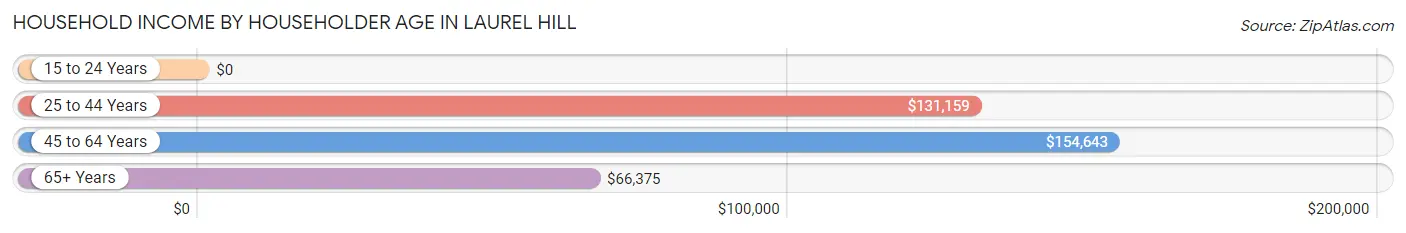
Household Income by Householder Age in Laurel Hill
The median household income in Laurel Hill is $128,239, with the highest median household income of $154,643 found in the 45 to 64 years age bracket for the primary householder. A total of 1,292 households (47.3%) fall into this category. Meanwhile, the 15 to 24 years age bracket for the primary householder has the lowest median household income of $0, with 53 households (1.9%) in this group.
| Income Bracket | # Households | Median Income |
| 15 to 24 Years | 53 (1.9%) | $0 |
| 25 to 44 Years | 919 (33.7%) | $131,159 |
| 45 to 64 Years | 1,292 (47.3%) | $154,643 |
| 65+ Years | 467 (17.1%) | $66,375 |
| Total | 2,731 (100.0%) | $128,239 |
Poverty in Laurel Hill
Income Below Poverty by Sex and Age in Laurel Hill
With 2.4% poverty level for males and 2.3% for females among the residents of Laurel Hill, 18 to 24 year old males and 45 to 54 year old females are the most vulnerable to poverty, with 36 males (12.5%) and 42 females (7.2%) in their respective age groups living below the poverty level.
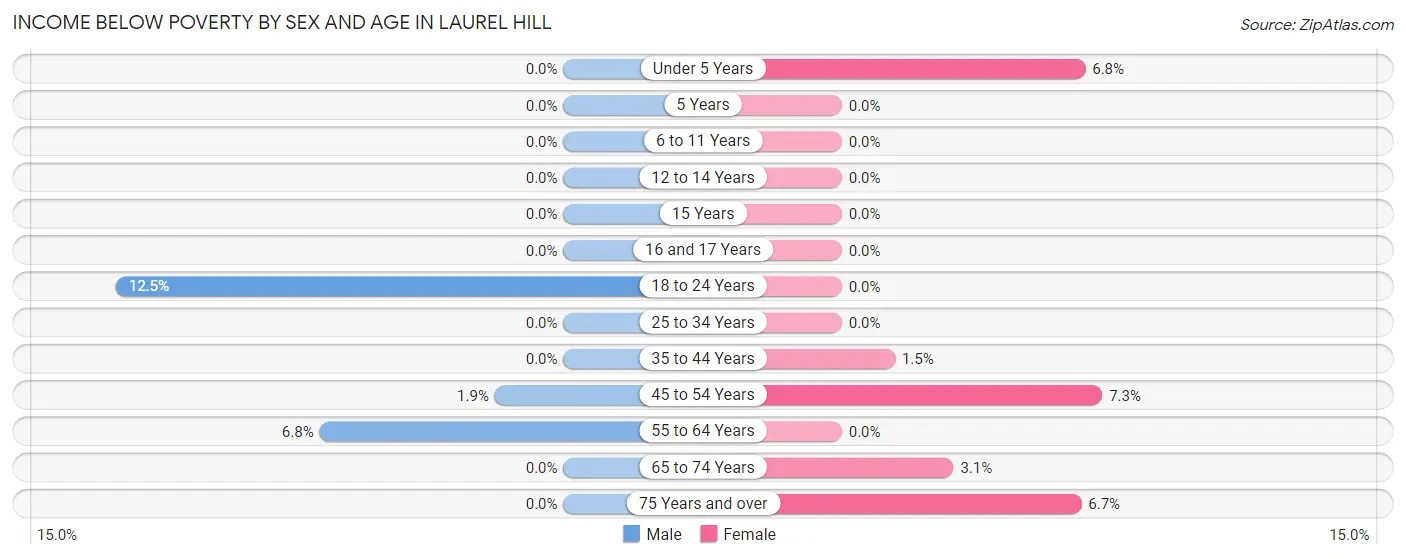
| Age Bracket | Male | Female |
| Under 5 Years | 0 (0.0%) | 12 (6.8%) |
| 5 Years | 0 (0.0%) | 0 (0.0%) |
| 6 to 11 Years | 0 (0.0%) | 0 (0.0%) |
| 12 to 14 Years | 0 (0.0%) | 0 (0.0%) |
| 15 Years | 0 (0.0%) | 0 (0.0%) |
| 16 and 17 Years | 0 (0.0%) | 0 (0.0%) |
| 18 to 24 Years | 36 (12.5%) | 0 (0.0%) |
| 25 to 34 Years | 0 (0.0%) | 0 (0.0%) |
| 35 to 44 Years | 0 (0.0%) | 11 (1.5%) |
| 45 to 54 Years | 11 (1.9%) | 42 (7.2%) |
| 55 to 64 Years | 37 (6.8%) | 0 (0.0%) |
| 65 to 74 Years | 0 (0.0%) | 10 (3.1%) |
| 75 Years and over | 0 (0.0%) | 13 (6.7%) |
| Total | 84 (2.4%) | 88 (2.3%) |
Income Above Poverty by Sex and Age in Laurel Hill
According to the poverty statistics in Laurel Hill, males aged under 5 years and females aged 6 to 11 years are the age groups that are most secure financially, with 100.0% of males and 100.0% of females in these age groups living above the poverty line.
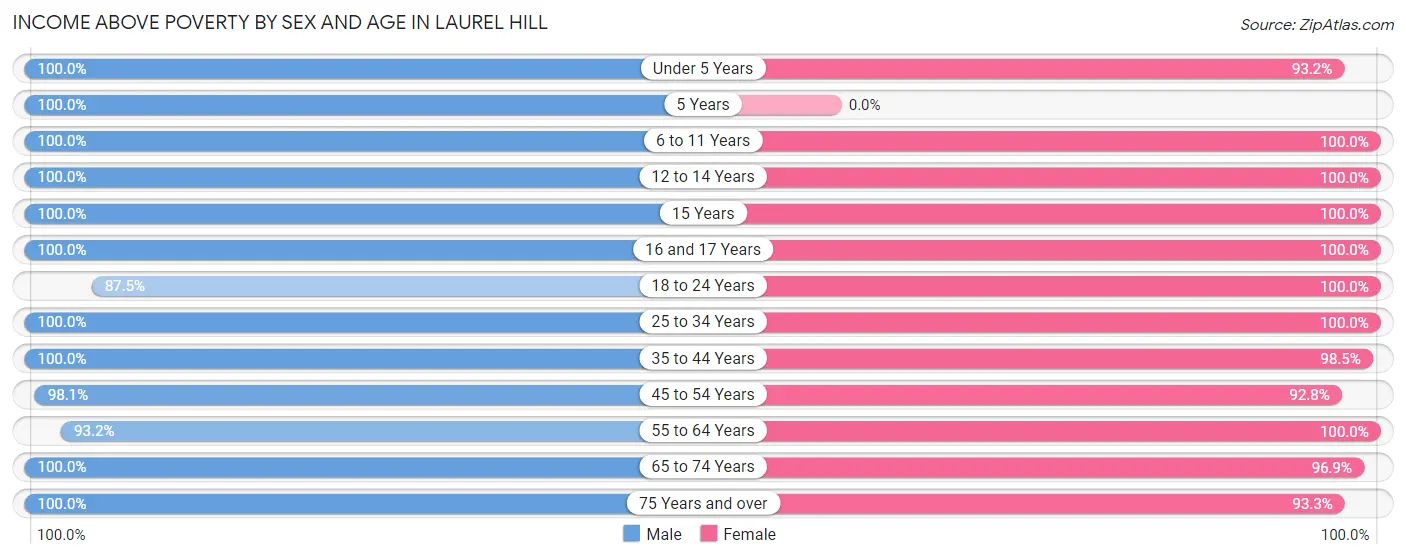
| Age Bracket | Male | Female |
| Under 5 Years | 151 (100.0%) | 165 (93.2%) |
| 5 Years | 21 (100.0%) | 0 (0.0%) |
| 6 to 11 Years | 431 (100.0%) | 121 (100.0%) |
| 12 to 14 Years | 164 (100.0%) | 186 (100.0%) |
| 15 Years | 96 (100.0%) | 150 (100.0%) |
| 16 and 17 Years | 85 (100.0%) | 133 (100.0%) |
| 18 to 24 Years | 253 (87.5%) | 295 (100.0%) |
| 25 to 34 Years | 355 (100.0%) | 288 (100.0%) |
| 35 to 44 Years | 561 (100.0%) | 733 (98.5%) |
| 45 to 54 Years | 565 (98.1%) | 537 (92.7%) |
| 55 to 64 Years | 508 (93.2%) | 583 (100.0%) |
| 65 to 74 Years | 202 (100.0%) | 312 (96.9%) |
| 75 Years and over | 89 (100.0%) | 182 (93.3%) |
| Total | 3,481 (97.6%) | 3,685 (97.7%) |
Income Below Poverty Among Married-Couple Families in Laurel Hill
The poverty statistics for married-couple families in Laurel Hill show that 0.7% or 11 of the total 1,545 families live below the poverty line. Families with 1 or 2 children have the highest poverty rate of 1.6%, comprising of 11 families. On the other hand, families with no children have the lowest poverty rate of 0.0%, which includes 0 families.
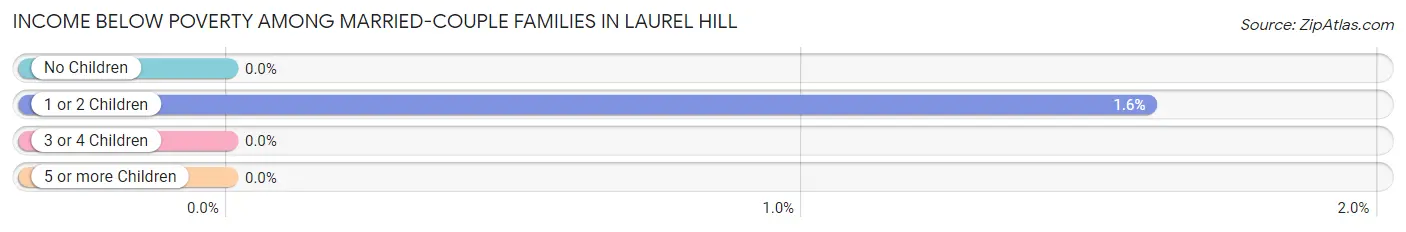
| Children | Above Poverty | Below Poverty |
| No Children | 770 (100.0%) | 0 (0.0%) |
| 1 or 2 Children | 677 (98.4%) | 11 (1.6%) |
| 3 or 4 Children | 87 (100.0%) | 0 (0.0%) |
| 5 or more Children | 0 (0.0%) | 0 (0.0%) |
| Total | 1,534 (99.3%) | 11 (0.7%) |
Income Below Poverty Among Single-Parent Households in Laurel Hill
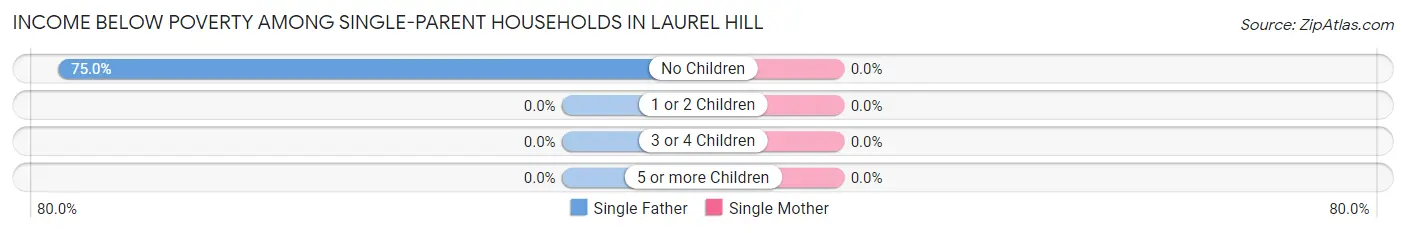
| Children | Single Father | Single Mother |
| No Children | 36 (75.0%) | 0 (0.0%) |
| 1 or 2 Children | 0 (0.0%) | 0 (0.0%) |
| 3 or 4 Children | 0 (0.0%) | 0 (0.0%) |
| 5 or more Children | 0 (0.0%) | 0 (0.0%) |
| Total | 36 (49.3%) | 0 (0.0%) |
Income Below Poverty Among Married-Couple vs Single-Parent Households in Laurel Hill
The poverty data for Laurel Hill shows that 11 of the married-couple family households (0.7%) and 36 of the single-parent households (10.7%) are living below the poverty level. Within the married-couple family households, those with 1 or 2 children have the highest poverty rate, with 11 households (1.6%) falling below the poverty line. Among the single-parent households, those with no children have the highest poverty rate, with 36 household (31.0%) living below poverty.
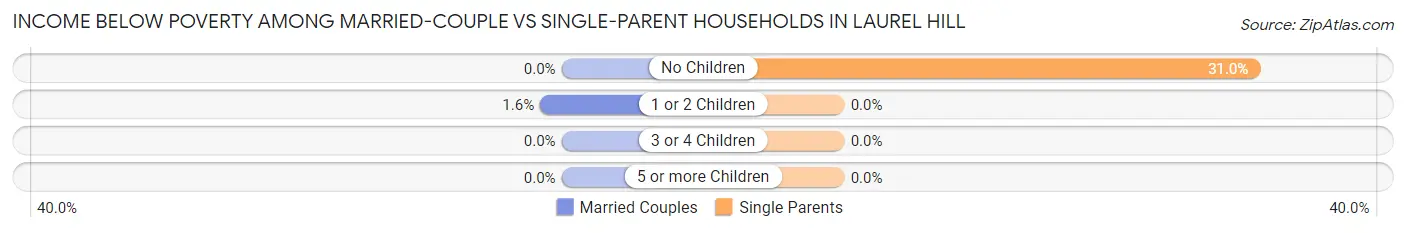
| Children | Married-Couple Families | Single-Parent Households |
| No Children | 0 (0.0%) | 36 (31.0%) |
| 1 or 2 Children | 11 (1.6%) | 0 (0.0%) |
| 3 or 4 Children | 0 (0.0%) | 0 (0.0%) |
| 5 or more Children | 0 (0.0%) | 0 (0.0%) |
| Total | 11 (0.7%) | 36 (10.7%) |
Race in Laurel Hill
The most populous races in Laurel Hill are White / Caucasian (3,037 | 41.4%), Asian (1,855 | 25.3%), and Black / African American (1,411 | 19.2%).
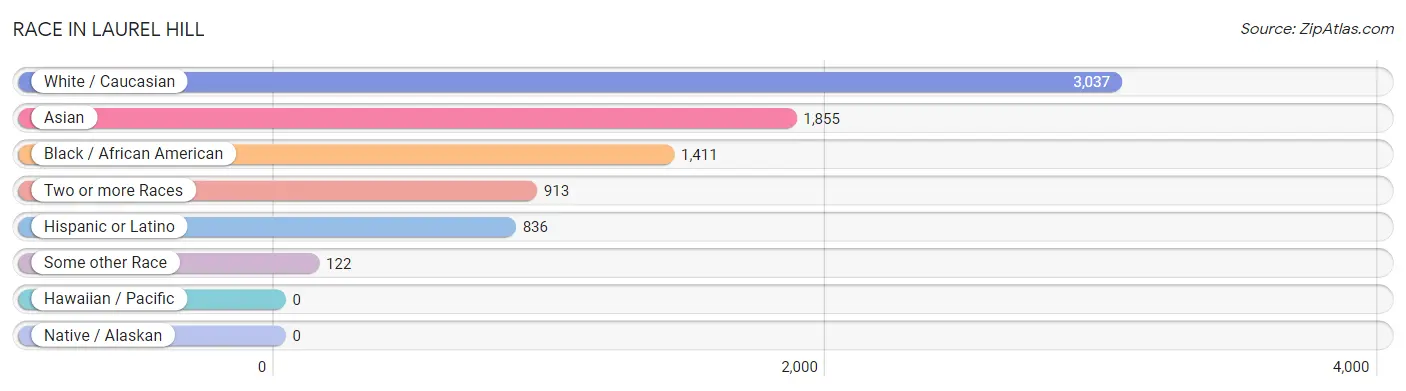
| Race | # Population | % Population |
| Asian | 1,855 | 25.3% |
| Black / African American | 1,411 | 19.2% |
| Hawaiian / Pacific | 0 | 0.0% |
| Hispanic or Latino | 836 | 11.4% |
| Native / Alaskan | 0 | 0.0% |
| White / Caucasian | 3,037 | 41.4% |
| Two or more Races | 913 | 12.4% |
| Some other Race | 122 | 1.7% |
| Total | 7,338 | 100.0% |
Ancestry in Laurel Hill
The most populous ancestries reported in Laurel Hill are Irish (767 | 10.4%), Thai (718 | 9.8%), English (646 | 8.8%), South American (631 | 8.6%), and German (547 | 7.4%), together accounting for 45.1% of all Laurel Hill residents.
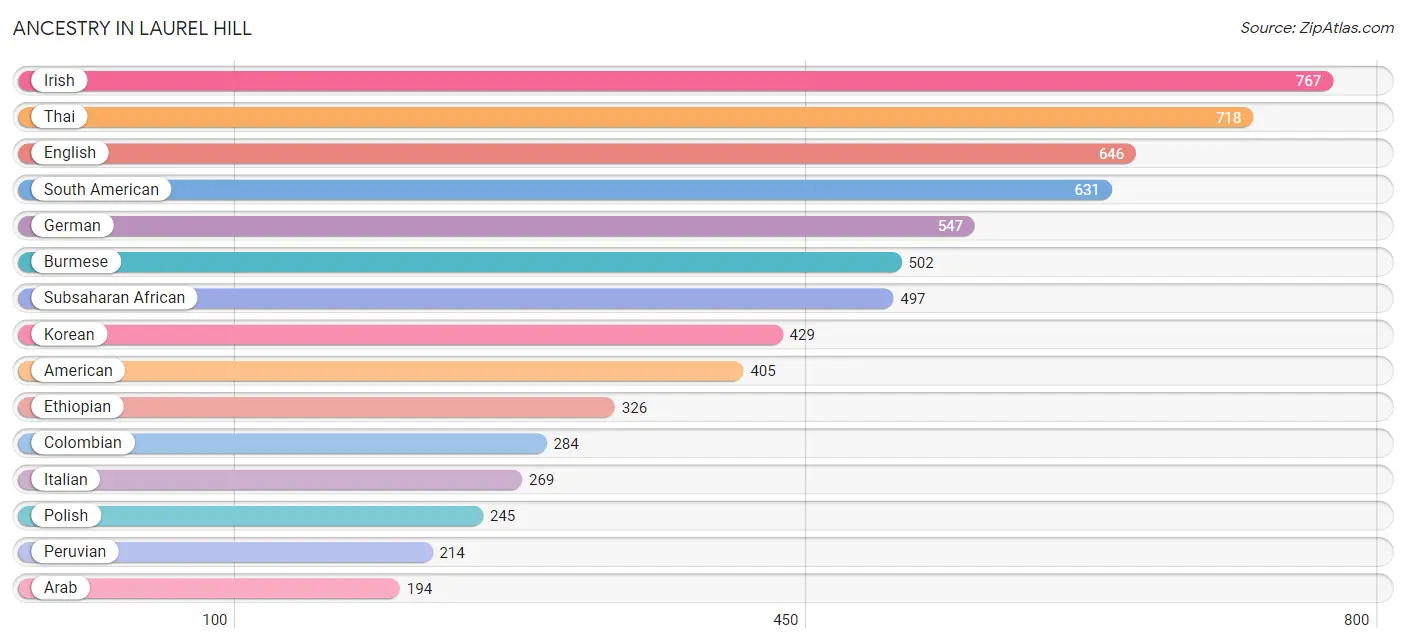
| Ancestry | # Population | % Population |
| Afghan | 11 | 0.2% |
| African | 116 | 1.6% |
| American | 405 | 5.5% |
| Arab | 194 | 2.6% |
| Bhutanese | 96 | 1.3% |
| Bolivian | 53 | 0.7% |
| Brazilian | 17 | 0.2% |
| British | 28 | 0.4% |
| Burmese | 502 | 6.8% |
| Canadian | 48 | 0.6% |
| Central American | 50 | 0.7% |
| Chilean | 28 | 0.4% |
| Choctaw | 116 | 1.6% |
| Colombian | 284 | 3.9% |
| Croatian | 14 | 0.2% |
| Czechoslovakian | 17 | 0.2% |
| Dutch | 50 | 0.7% |
| Eastern European | 54 | 0.7% |
| Ecuadorian | 13 | 0.2% |
| Egyptian | 94 | 1.3% |
| English | 646 | 8.8% |
| Estonian | 42 | 0.6% |
| Ethiopian | 326 | 4.4% |
| European | 44 | 0.6% |
| Finnish | 17 | 0.2% |
| French | 91 | 1.2% |
| French Canadian | 18 | 0.3% |
| German | 547 | 7.4% |
| Ghanaian | 28 | 0.4% |
| Greek | 23 | 0.3% |
| Honduran | 50 | 0.7% |
| Hungarian | 23 | 0.3% |
| Indian (Asian) | 83 | 1.1% |
| Iranian | 88 | 1.2% |
| Irish | 767 | 10.4% |
| Italian | 269 | 3.7% |
| Jamaican | 42 | 0.6% |
| Japanese | 28 | 0.4% |
| Korean | 429 | 5.9% |
| Lebanese | 51 | 0.7% |
| Mexican | 47 | 0.6% |
| Native Hawaiian | 12 | 0.2% |
| Nigerian | 63 | 0.9% |
| Norwegian | 25 | 0.3% |
| Peruvian | 214 | 2.9% |
| Polish | 245 | 3.3% |
| Portuguese | 25 | 0.3% |
| Puerto Rican | 108 | 1.5% |
| Russian | 51 | 0.7% |
| Scandinavian | 15 | 0.2% |
| Scotch-Irish | 74 | 1.0% |
| Scottish | 45 | 0.6% |
| South American | 631 | 8.6% |
| Sri Lankan | 110 | 1.5% |
| Subsaharan African | 497 | 6.8% |
| Swedish | 25 | 0.3% |
| Thai | 718 | 9.8% |
| Turkish | 60 | 0.8% |
| Venezuelan | 39 | 0.5% |
| Vietnamese | 9 | 0.1% |
| Welsh | 30 | 0.4% | View All 61 Rows |
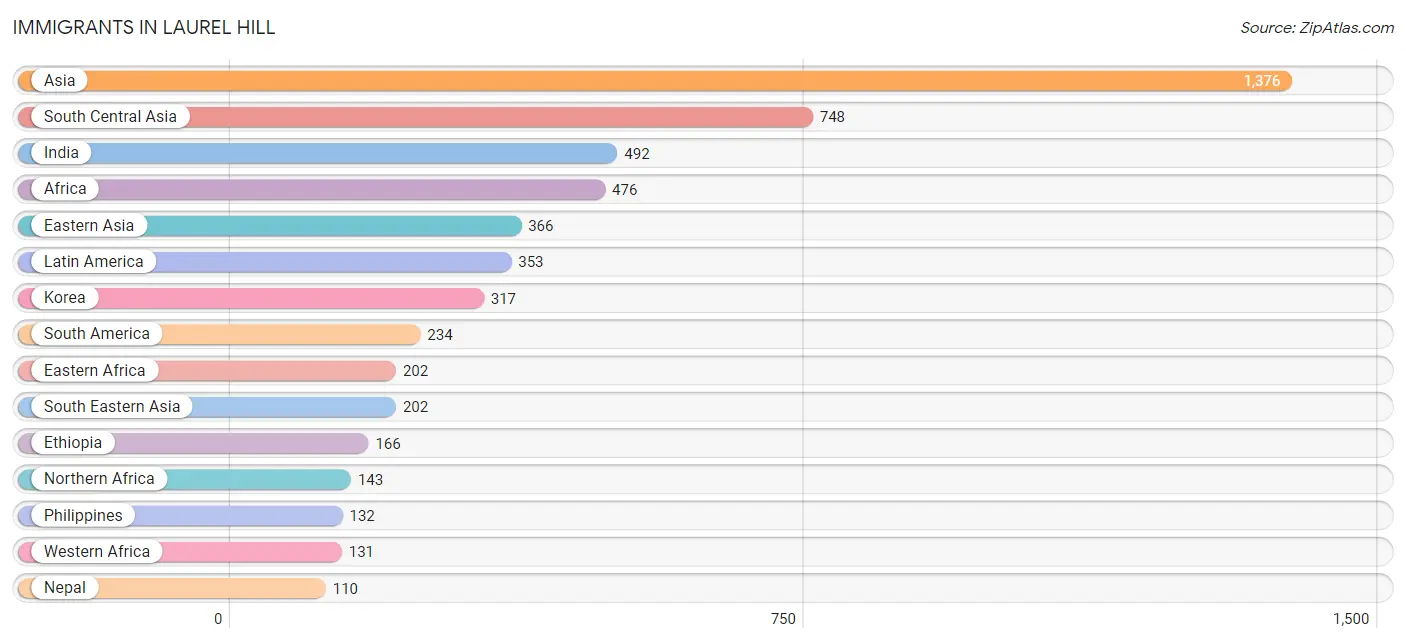
Immigrants in Laurel Hill
The most numerous immigrant groups reported in Laurel Hill came from Asia (1,376 | 18.8%), South Central Asia (748 | 10.2%), India (492 | 6.7%), Africa (476 | 6.5%), and Eastern Asia (366 | 5.0%), together accounting for 47.1% of all Laurel Hill residents.
| Immigration Origin | # Population | % Population |
| Afghanistan | 21 | 0.3% |
| Africa | 476 | 6.5% |
| Asia | 1,376 | 18.8% |
| Australia | 10 | 0.1% |
| Bangladesh | 9 | 0.1% |
| Bolivia | 53 | 0.7% |
| Brazil | 17 | 0.2% |
| Cambodia | 4 | 0.1% |
| Canada | 29 | 0.4% |
| Caribbean | 42 | 0.6% |
| Central America | 77 | 1.1% |
| Chile | 28 | 0.4% |
| China | 49 | 0.7% |
| Colombia | 60 | 0.8% |
| Eastern Africa | 202 | 2.8% |
| Eastern Asia | 366 | 5.0% |
| Eastern Europe | 54 | 0.7% |
| Ecuador | 13 | 0.2% |
| Egypt | 94 | 1.3% |
| El Salvador | 15 | 0.2% |
| Eritrea | 36 | 0.5% |
| Ethiopia | 166 | 2.3% |
| Europe | 61 | 0.8% |
| Germany | 7 | 0.1% |
| Ghana | 47 | 0.6% |
| Honduras | 50 | 0.7% |
| Hungary | 11 | 0.2% |
| India | 492 | 6.7% |
| Iran | 49 | 0.7% |
| Jamaica | 42 | 0.6% |
| Korea | 317 | 4.3% |
| Latin America | 353 | 4.8% |
| Lebanon | 15 | 0.2% |
| Mexico | 12 | 0.2% |
| Morocco | 49 | 0.7% |
| Nepal | 110 | 1.5% |
| Nigeria | 37 | 0.5% |
| Northern Africa | 143 | 1.9% |
| Oceania | 10 | 0.1% |
| Pakistan | 67 | 0.9% |
| Peru | 24 | 0.3% |
| Philippines | 132 | 1.8% |
| Poland | 43 | 0.6% |
| Sierra Leone | 35 | 0.5% |
| South America | 234 | 3.2% |
| South Central Asia | 748 | 10.2% |
| South Eastern Asia | 202 | 2.8% |
| Thailand | 12 | 0.2% |
| Turkey | 45 | 0.6% |
| Venezuela | 39 | 0.5% |
| Vietnam | 54 | 0.7% |
| Western Africa | 131 | 1.8% |
| Western Asia | 60 | 0.8% |
| Western Europe | 7 | 0.1% | View All 54 Rows |
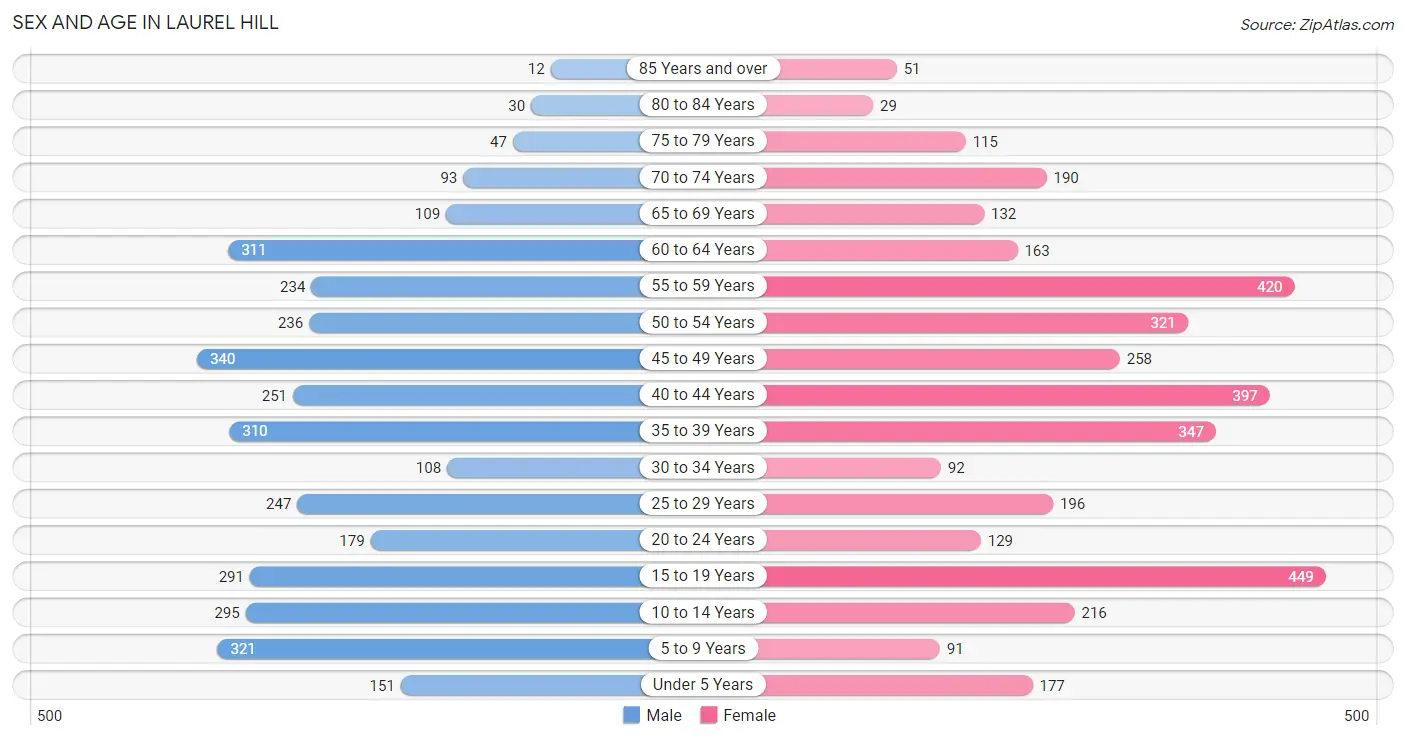
Sex and Age in Laurel Hill
Sex and Age in Laurel Hill
The most populous age groups in Laurel Hill are 45 to 49 Years (340 | 9.5%) for men and 15 to 19 Years (449 | 11.9%) for women.
| Age Bracket | Male | Female |
| Under 5 Years | 151 (4.2%) | 177 (4.7%) |
| 5 to 9 Years | 321 (9.0%) | 91 (2.4%) |
| 10 to 14 Years | 295 (8.3%) | 216 (5.7%) |
| 15 to 19 Years | 291 (8.2%) | 449 (11.9%) |
| 20 to 24 Years | 179 (5.0%) | 129 (3.4%) |
| 25 to 29 Years | 247 (6.9%) | 196 (5.2%) |
| 30 to 34 Years | 108 (3.0%) | 92 (2.4%) |
| 35 to 39 Years | 310 (8.7%) | 347 (9.2%) |
| 40 to 44 Years | 251 (7.0%) | 397 (10.5%) |
| 45 to 49 Years | 340 (9.5%) | 258 (6.8%) |
| 50 to 54 Years | 236 (6.6%) | 321 (8.5%) |
| 55 to 59 Years | 234 (6.6%) | 420 (11.1%) |
| 60 to 64 Years | 311 (8.7%) | 163 (4.3%) |
| 65 to 69 Years | 109 (3.1%) | 132 (3.5%) |
| 70 to 74 Years | 93 (2.6%) | 190 (5.0%) |
| 75 to 79 Years | 47 (1.3%) | 115 (3.0%) |
| 80 to 84 Years | 30 (0.8%) | 29 (0.8%) |
| 85 Years and over | 12 (0.3%) | 51 (1.3%) |
| Total | 3,565 (100.0%) | 3,773 (100.0%) |
Families and Households in Laurel Hill
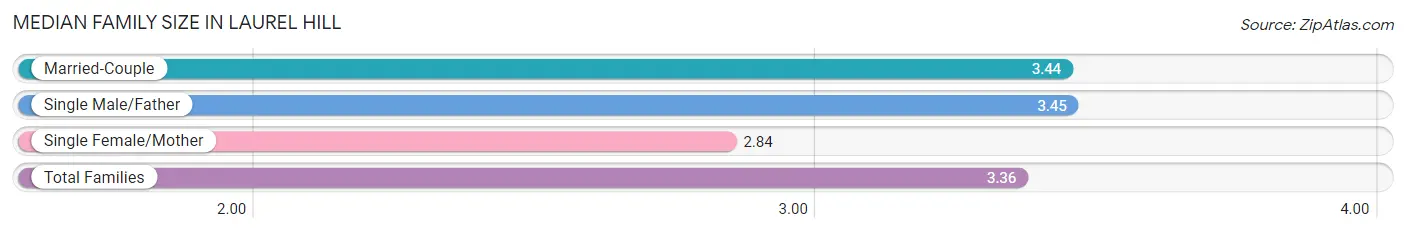
Median Family Size in Laurel Hill
The median family size in Laurel Hill is 3.36 persons per family, with single male/father families (73 | 3.9%) accounting for the largest median family size of 3.45 persons per family. On the other hand, single female/mother families (264 | 14.0%) represent the smallest median family size with 2.84 persons per family.
| Family Type | # Families | Family Size |
| Married-Couple | 1,545 (82.1%) | 3.44 |
| Single Male/Father | 73 (3.9%) | 3.45 |
| Single Female/Mother | 264 (14.0%) | 2.84 |
| Total Families | 1,882 (100.0%) | 3.36 |
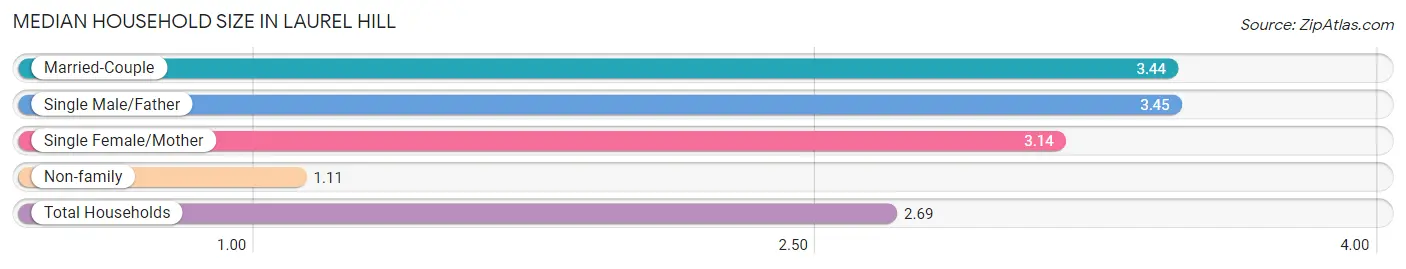
Median Household Size in Laurel Hill
The median household size in Laurel Hill is 2.69 persons per household, with single male/father households (73 | 2.7%) accounting for the largest median household size of 3.45 persons per household. non-family households (849 | 31.1%) represent the smallest median household size with 1.11 persons per household.
| Household Type | # Households | Household Size |
| Married-Couple | 1,545 (56.6%) | 3.44 |
| Single Male/Father | 73 (2.7%) | 3.45 |
| Single Female/Mother | 264 (9.7%) | 3.14 |
| Non-family | 849 (31.1%) | 1.11 |
| Total Households | 2,731 (100.0%) | 2.69 |
Household Size by Marriage Status in Laurel Hill
Out of a total of 2,731 households in Laurel Hill, 1,882 (68.9%) are family households, while 849 (31.1%) are nonfamily households. The most numerous type of family households are 2-person households, comprising 693, and the most common type of nonfamily households are 1-person households, comprising 752.
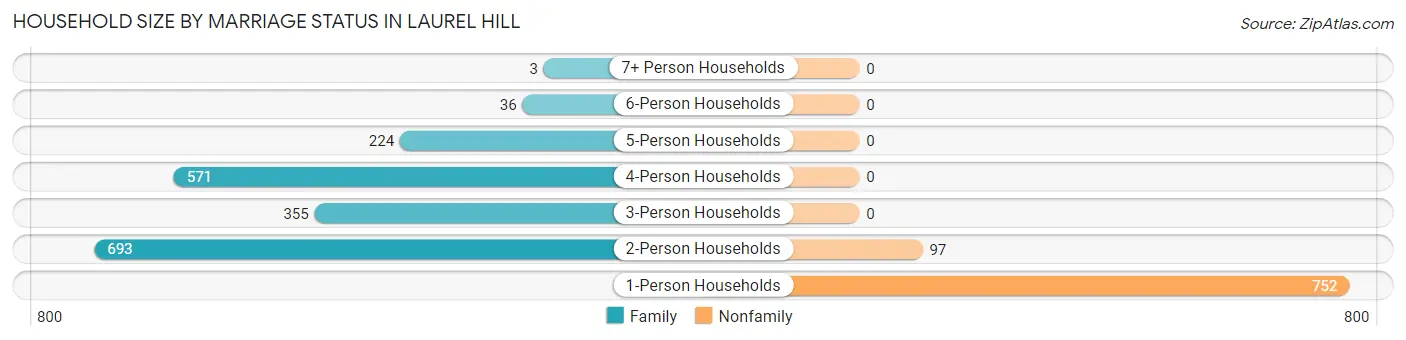
| Household Size | Family Households | Nonfamily Households |
| 1-Person Households | - | 752 (27.5%) |
| 2-Person Households | 693 (25.4%) | 97 (3.5%) |
| 3-Person Households | 355 (13.0%) | 0 (0.0%) |
| 4-Person Households | 571 (20.9%) | 0 (0.0%) |
| 5-Person Households | 224 (8.2%) | 0 (0.0%) |
| 6-Person Households | 36 (1.3%) | 0 (0.0%) |
| 7+ Person Households | 3 (0.1%) | 0 (0.0%) |
| Total | 1,882 (68.9%) | 849 (31.1%) |
Female Fertility in Laurel Hill
Fertility by Age in Laurel Hill
Average fertility rate in Laurel Hill is 36.0 births per 1,000 women. Women in the age bracket of 20 to 34 years have the highest fertility rate with 58.0 births per 1,000 women. Women in the age bracket of 35 to 50 years acount for 64.7% of all women with births.
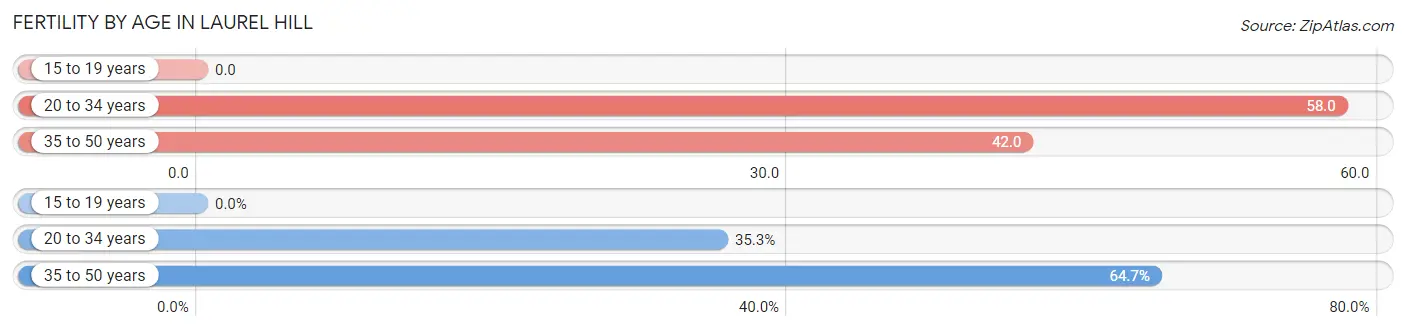
| Age Bracket | Women with Births | Births / 1,000 Women |
| 15 to 19 years | 0 (0.0%) | 0.0 |
| 20 to 34 years | 24 (35.3%) | 58.0 |
| 35 to 50 years | 44 (64.7%) | 42.0 |
| Total | 68 (100.0%) | 36.0 |
Fertility by Age by Marriage Status in Laurel Hill
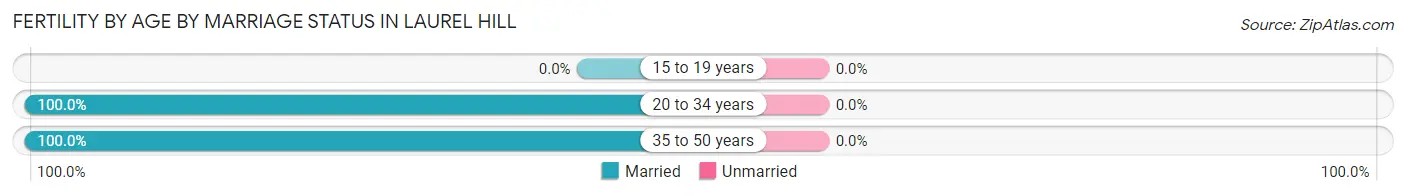
| Age Bracket | Married | Unmarried |
| 15 to 19 years | 0 (0.0%) | 0 (0.0%) |
| 20 to 34 years | 24 (100.0%) | 0 (0.0%) |
| 35 to 50 years | 44 (100.0%) | 0 (0.0%) |
| Total | 68 (100.0%) | 0 (0.0%) |
Fertility by Education in Laurel Hill
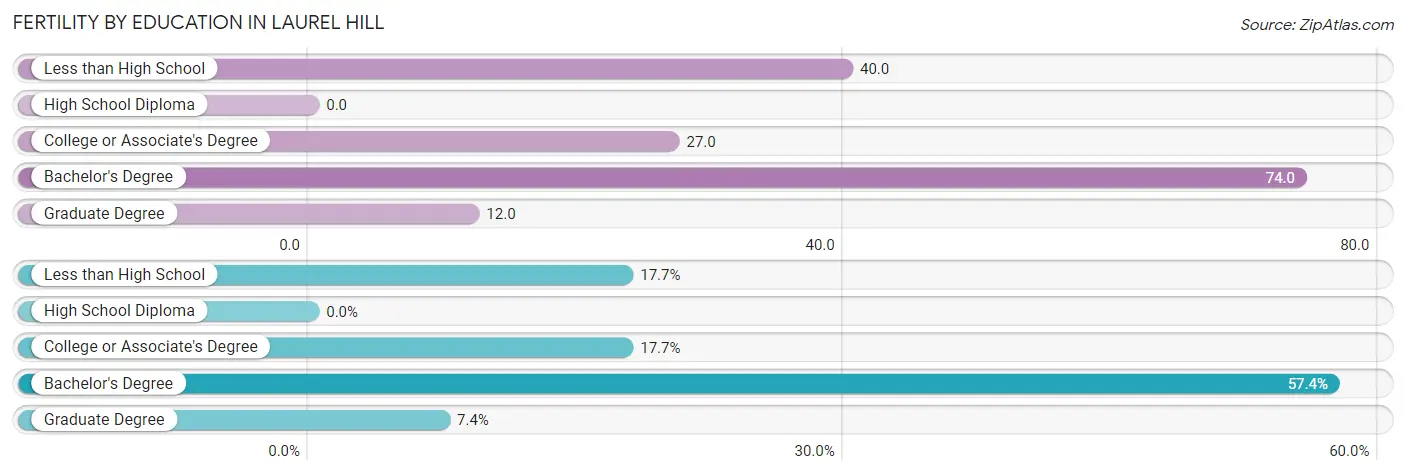
| Educational Attainment | Women with Births | Births / 1,000 Women |
| Less than High School | 12 (17.6%) | 40.0 |
| High School Diploma | 0 (0.0%) | 0.0 |
| College or Associate's Degree | 12 (17.6%) | 27.0 |
| Bachelor's Degree | 39 (57.4%) | 74.0 |
| Graduate Degree | 5 (7.3%) | 12.0 |
| Total | 68 (100.0%) | 36.0 |
Fertility by Education by Marriage Status in Laurel Hill
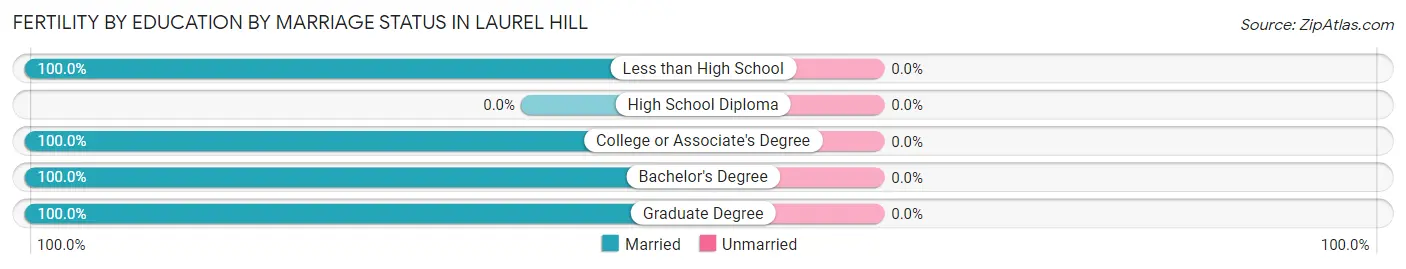
| Educational Attainment | Married | Unmarried |
| Less than High School | 12 (100.0%) | 0 (0.0%) |
| High School Diploma | 0 (0.0%) | 0 (0.0%) |
| College or Associate's Degree | 12 (100.0%) | 0 (0.0%) |
| Bachelor's Degree | 39 (100.0%) | 0 (0.0%) |
| Graduate Degree | 5 (100.0%) | 0 (0.0%) |
| Total | 68 (100.0%) | 0 (0.0%) |
Employment Characteristics in Laurel Hill
Employment by Class of Employer in Laurel Hill
Among the 4,075 employed individuals in Laurel Hill, private company employees (2,041 | 50.1%), federal government employees (1,014 | 24.9%), and local government employees (423 | 10.4%) make up the most common classes of employment.
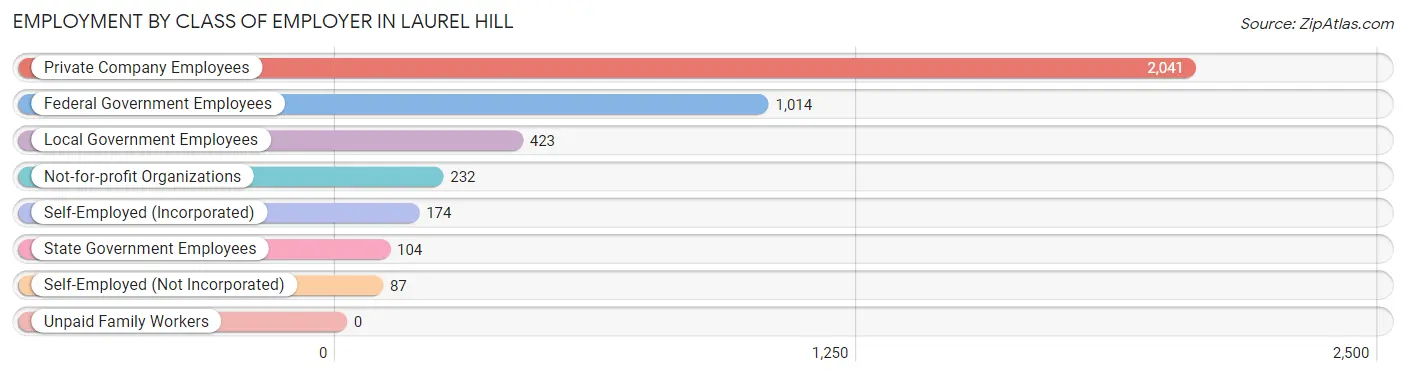
| Employer Class | # Employees | % Employees |
| Private Company Employees | 2,041 | 50.1% |
| Self-Employed (Incorporated) | 174 | 4.3% |
| Self-Employed (Not Incorporated) | 87 | 2.1% |
| Not-for-profit Organizations | 232 | 5.7% |
| Local Government Employees | 423 | 10.4% |
| State Government Employees | 104 | 2.5% |
| Federal Government Employees | 1,014 | 24.9% |
| Unpaid Family Workers | 0 | 0.0% |
| Total | 4,075 | 100.0% |
Employment Status by Age in Laurel Hill
According to the labor force statistics for Laurel Hill, out of the total population over 16 years of age (5,841), 73.7% or 4,305 individuals are in the labor force, with 5.4% or 232 of them unemployed. The age group with the highest labor force participation rate is 25 to 29 years, with 95.0% or 421 individuals in the labor force. Within the labor force, the 16 to 19 years age range has the highest percentage of unemployed individuals, with 56.5% or 104 of them being unemployed.
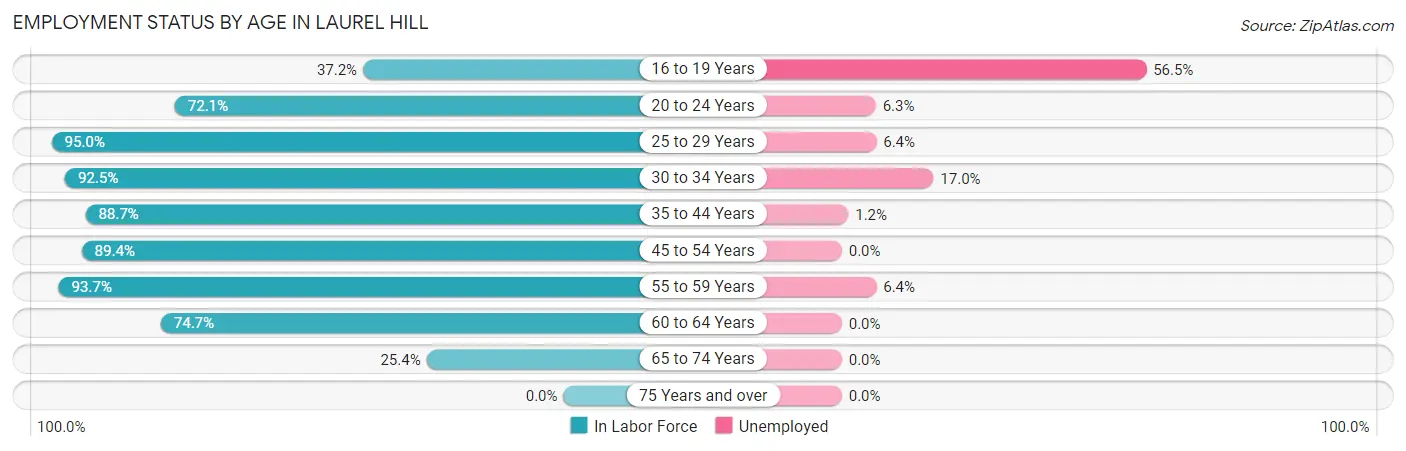
| Age Bracket | In Labor Force | Unemployed |
| 16 to 19 Years | 184 (37.2%) | 104 (56.5%) |
| 20 to 24 Years | 222 (72.1%) | 14 (6.3%) |
| 25 to 29 Years | 421 (95.0%) | 27 (6.4%) |
| 30 to 34 Years | 185 (92.5%) | 31 (17.0%) |
| 35 to 44 Years | 1,158 (88.7%) | 14 (1.2%) |
| 45 to 54 Years | 1,033 (89.4%) | 0 (0.0%) |
| 55 to 59 Years | 613 (93.7%) | 39 (6.4%) |
| 60 to 64 Years | 354 (74.7%) | 0 (0.0%) |
| 65 to 74 Years | 133 (25.4%) | 0 (0.0%) |
| 75 Years and over | 0 (0.0%) | 0 (0.0%) |
| Total | 4,305 (73.7%) | 232 (5.4%) |
Employment Status by Educational Attainment in Laurel Hill
According to labor force statistics for Laurel Hill, 88.9% of individuals (3,761) out of the total population between 25 and 64 years of age (4,231) are in the labor force, with 3.0% or 113 of them being unemployed. The group with the highest labor force participation rate are those with the educational attainment of bachelor's degree or higher, with 93.1% or 2,408 individuals in the labor force. Within the labor force, individuals with college / associate degree education have the highest percentage of unemployment, with 4.9% or 43 of them being unemployed.
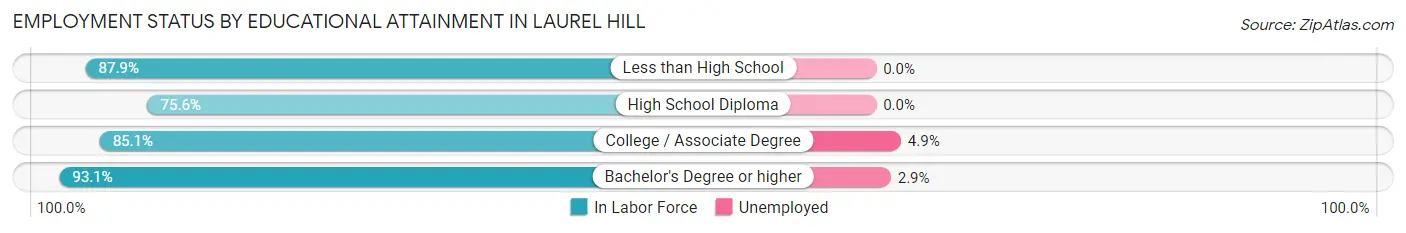
| Educational Attainment | In Labor Force | Unemployed |
| Less than High School | 87 (87.9%) | 0 (0.0%) |
| High School Diploma | 381 (75.6%) | 0 (0.0%) |
| College / Associate Degree | 886 (85.1%) | 51 (4.9%) |
| Bachelor's Degree or higher | 2,408 (93.1%) | 75 (2.9%) |
| Total | 3,761 (88.9%) | 127 (3.0%) |
Employment Occupations by Sex in Laurel Hill
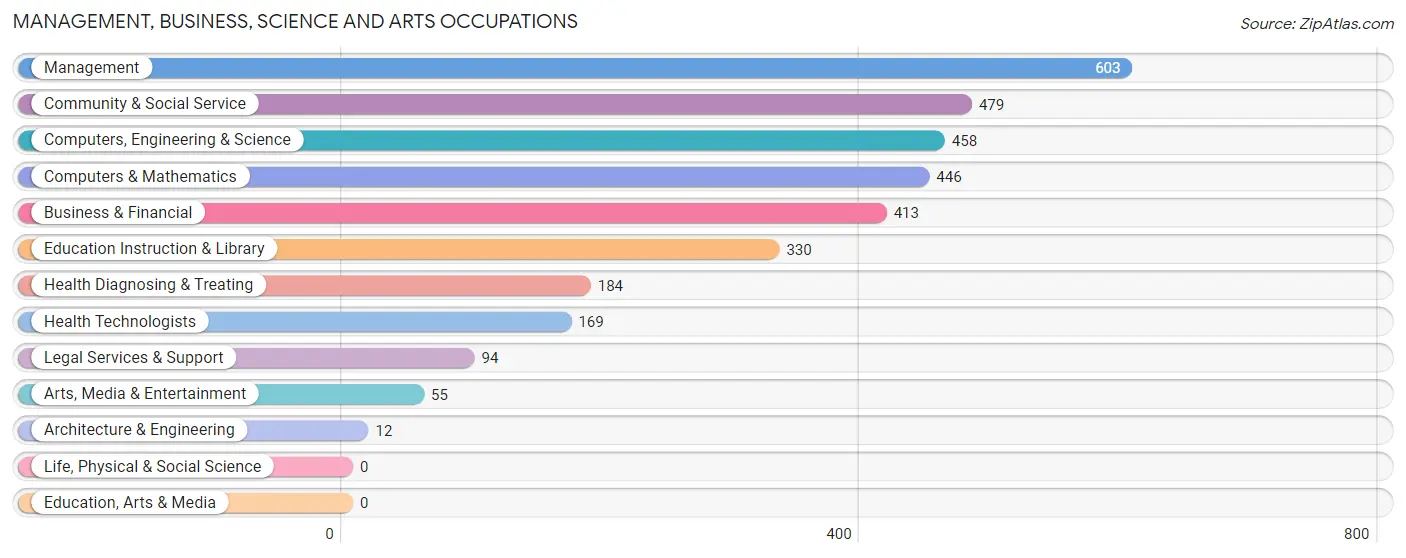
Management, Business, Science and Arts Occupations
The most common Management, Business, Science and Arts occupations in Laurel Hill are Management (603 | 15.2%), Community & Social Service (479 | 12.1%), Computers, Engineering & Science (458 | 11.6%), Computers & Mathematics (446 | 11.3%), and Business & Financial (413 | 10.4%).
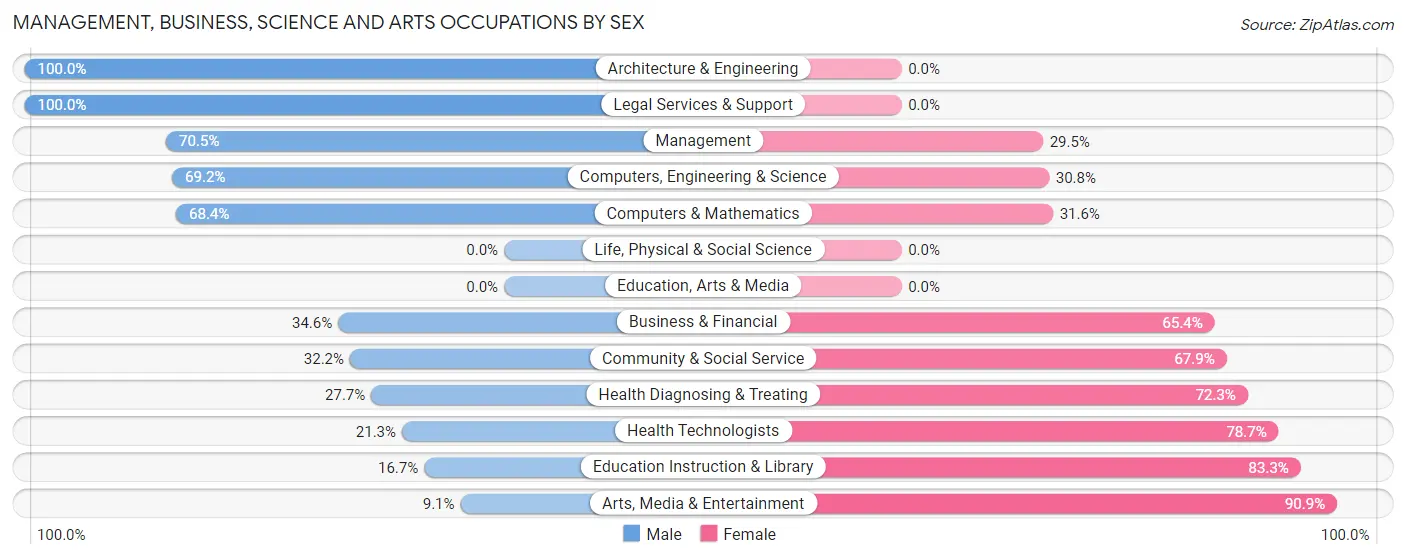
Management, Business, Science and Arts Occupations by Sex
Within the Management, Business, Science and Arts occupations in Laurel Hill, the most male-oriented occupations are Architecture & Engineering (100.0%), Legal Services & Support (100.0%), and Management (70.5%), while the most female-oriented occupations are Arts, Media & Entertainment (90.9%), Education Instruction & Library (83.3%), and Health Technologists (78.7%).
| Occupation | Male | Female |
| Management | 425 (70.5%) | 178 (29.5%) |
| Business & Financial | 143 (34.6%) | 270 (65.4%) |
| Computers, Engineering & Science | 317 (69.2%) | 141 (30.8%) |
| Computers & Mathematics | 305 (68.4%) | 141 (31.6%) |
| Architecture & Engineering | 12 (100.0%) | 0 (0.0%) |
| Life, Physical & Social Science | 0 (0.0%) | 0 (0.0%) |
| Community & Social Service | 154 (32.2%) | 325 (67.8%) |
| Education, Arts & Media | 0 (0.0%) | 0 (0.0%) |
| Legal Services & Support | 94 (100.0%) | 0 (0.0%) |
| Education Instruction & Library | 55 (16.7%) | 275 (83.3%) |
| Arts, Media & Entertainment | 5 (9.1%) | 50 (90.9%) |
| Health Diagnosing & Treating | 51 (27.7%) | 133 (72.3%) |
| Health Technologists | 36 (21.3%) | 133 (78.7%) |
| Total (Category) | 1,090 (51.0%) | 1,047 (49.0%) |
| Total (Overall) | 2,061 (52.0%) | 1,901 (48.0%) |
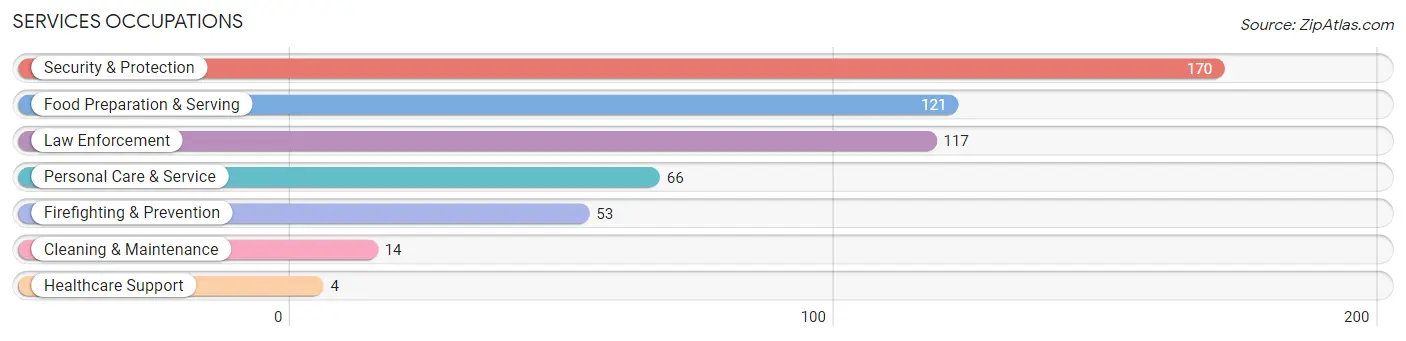
Services Occupations
The most common Services occupations in Laurel Hill are Security & Protection (170 | 4.3%), Food Preparation & Serving (121 | 3.0%), Law Enforcement (117 | 2.9%), Personal Care & Service (66 | 1.7%), and Firefighting & Prevention (53 | 1.3%).
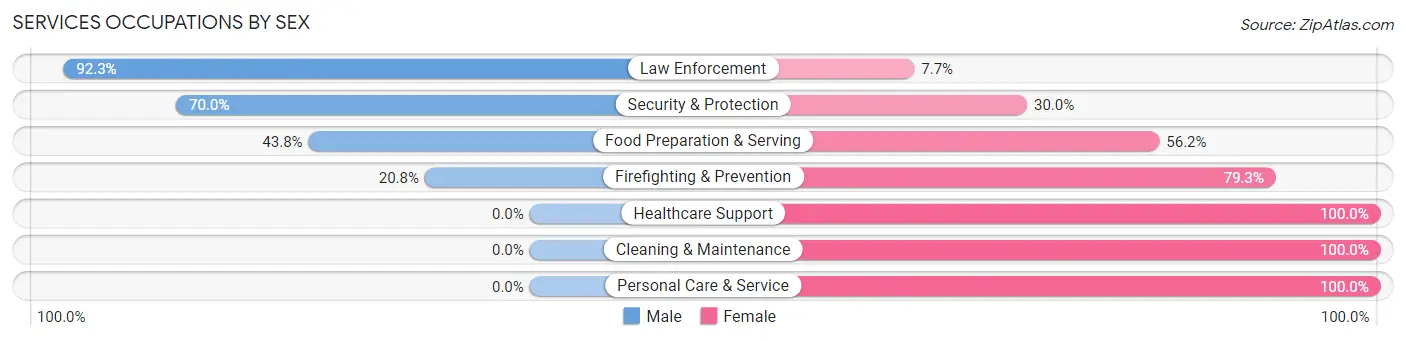
Services Occupations by Sex
Within the Services occupations in Laurel Hill, the most male-oriented occupations are Law Enforcement (92.3%), Security & Protection (70.0%), and Food Preparation & Serving (43.8%), while the most female-oriented occupations are Healthcare Support (100.0%), Cleaning & Maintenance (100.0%), and Personal Care & Service (100.0%).
| Occupation | Male | Female |
| Healthcare Support | 0 (0.0%) | 4 (100.0%) |
| Security & Protection | 119 (70.0%) | 51 (30.0%) |
| Firefighting & Prevention | 11 (20.7%) | 42 (79.2%) |
| Law Enforcement | 108 (92.3%) | 9 (7.7%) |
| Food Preparation & Serving | 53 (43.8%) | 68 (56.2%) |
| Cleaning & Maintenance | 0 (0.0%) | 14 (100.0%) |
| Personal Care & Service | 0 (0.0%) | 66 (100.0%) |
| Total (Category) | 172 (45.9%) | 203 (54.1%) |
| Total (Overall) | 2,061 (52.0%) | 1,901 (48.0%) |
Sales and Office Occupations
The most common Sales and Office occupations in Laurel Hill are Office & Administration (555 | 14.0%), and Sales & Related (407 | 10.3%).

Sales and Office Occupations by Sex

| Occupation | Male | Female |
| Sales & Related | 288 (70.8%) | 119 (29.2%) |
| Office & Administration | 94 (16.9%) | 461 (83.1%) |
| Total (Category) | 382 (39.7%) | 580 (60.3%) |
| Total (Overall) | 2,061 (52.0%) | 1,901 (48.0%) |
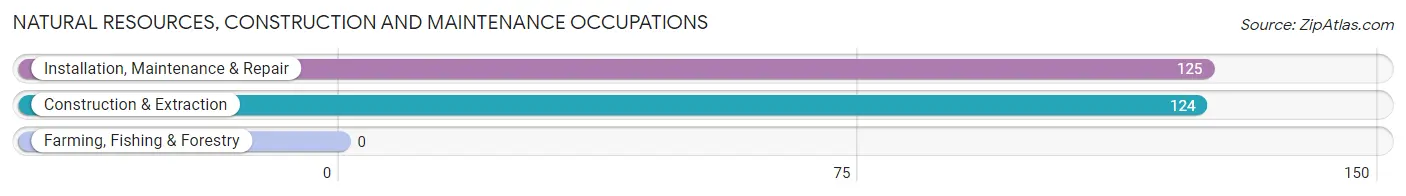
Natural Resources, Construction and Maintenance Occupations
The most common Natural Resources, Construction and Maintenance occupations in Laurel Hill are Installation, Maintenance & Repair (125 | 3.2%), and Construction & Extraction (124 | 3.1%).
Natural Resources, Construction and Maintenance Occupations by Sex
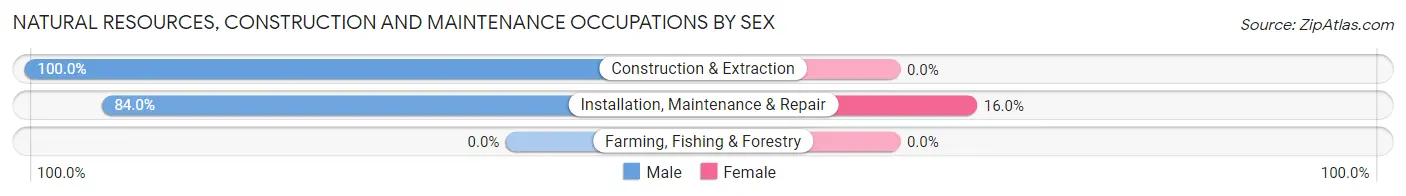
| Occupation | Male | Female |
| Farming, Fishing & Forestry | 0 (0.0%) | 0 (0.0%) |
| Construction & Extraction | 124 (100.0%) | 0 (0.0%) |
| Installation, Maintenance & Repair | 105 (84.0%) | 20 (16.0%) |
| Total (Category) | 229 (92.0%) | 20 (8.0%) |
| Total (Overall) | 2,061 (52.0%) | 1,901 (48.0%) |
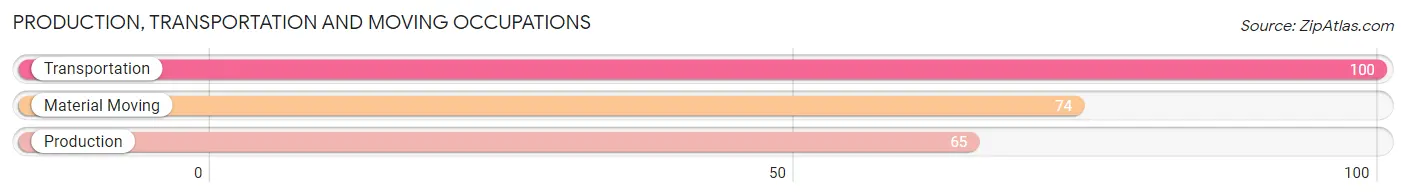
Production, Transportation and Moving Occupations
The most common Production, Transportation and Moving occupations in Laurel Hill are Transportation (100 | 2.5%), Material Moving (74 | 1.9%), and Production (65 | 1.6%).
Production, Transportation and Moving Occupations by Sex
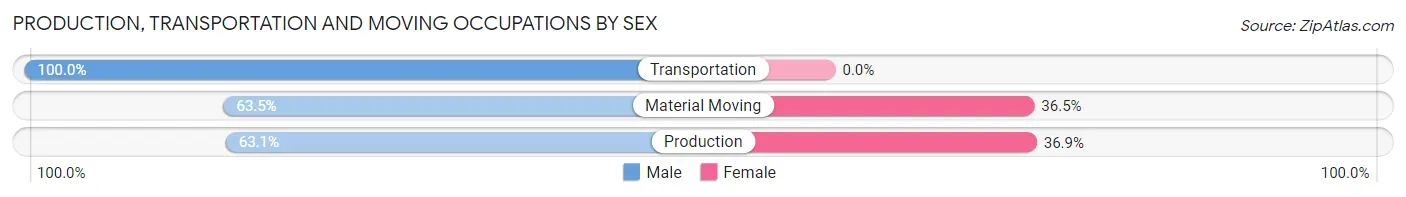
| Occupation | Male | Female |
| Production | 41 (63.1%) | 24 (36.9%) |
| Transportation | 100 (100.0%) | 0 (0.0%) |
| Material Moving | 47 (63.5%) | 27 (36.5%) |
| Total (Category) | 188 (78.7%) | 51 (21.3%) |
| Total (Overall) | 2,061 (52.0%) | 1,901 (48.0%) |
Employment Industries by Sex in Laurel Hill
Employment Industries in Laurel Hill
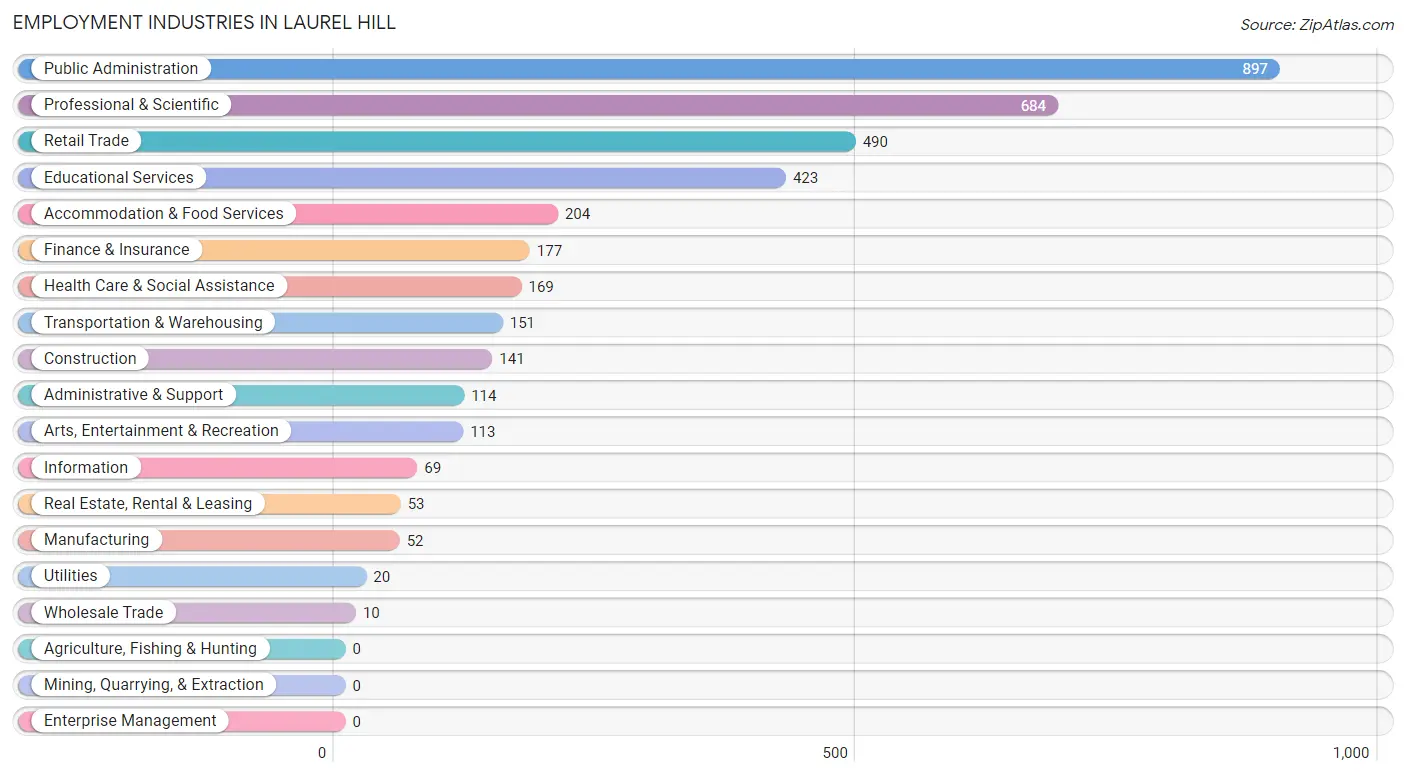
The major employment industries in Laurel Hill include Public Administration (897 | 22.6%), Professional & Scientific (684 | 17.3%), Retail Trade (490 | 12.4%), Educational Services (423 | 10.7%), and Accommodation & Food Services (204 | 5.1%).
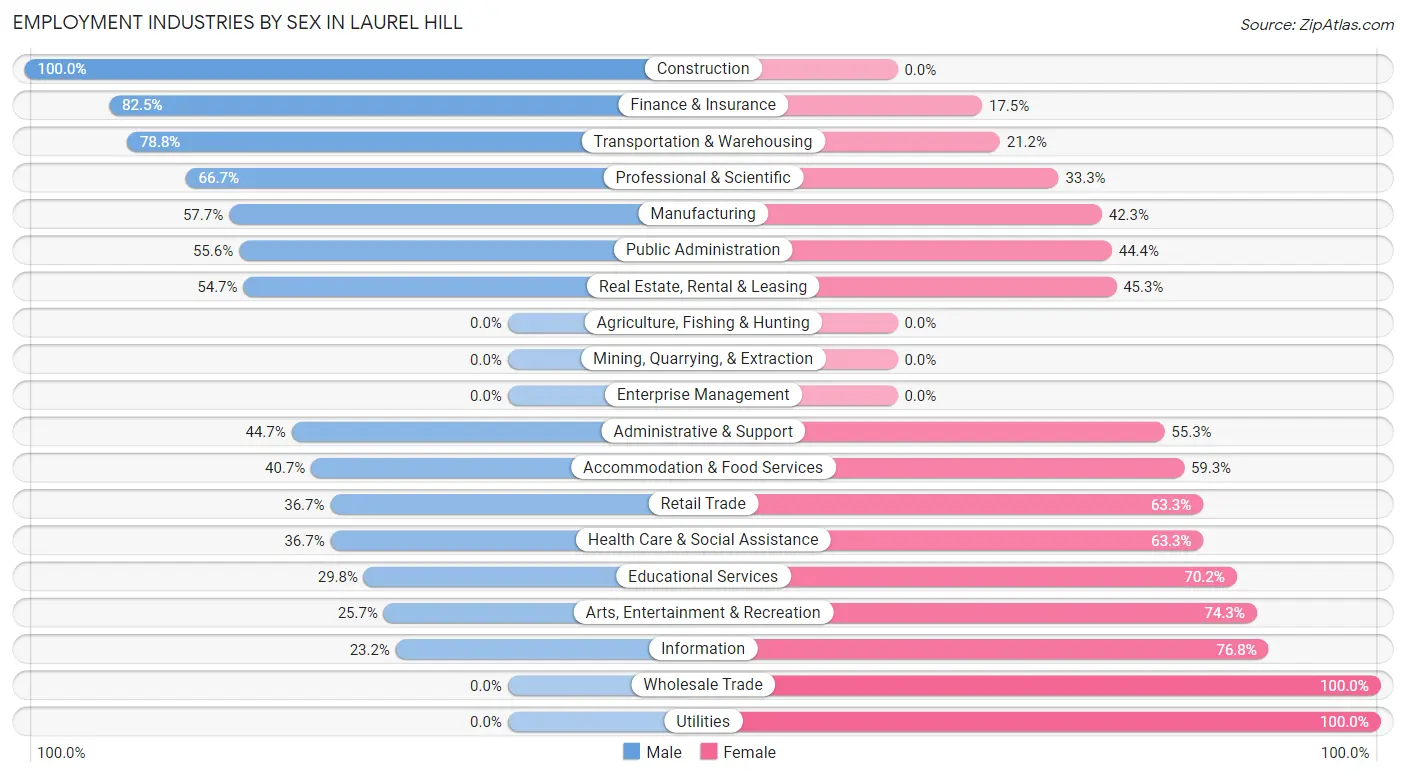
Employment Industries by Sex in Laurel Hill
The Laurel Hill industries that see more men than women are Construction (100.0%), Finance & Insurance (82.5%), and Transportation & Warehousing (78.8%), whereas the industries that tend to have a higher number of women are Wholesale Trade (100.0%), Utilities (100.0%), and Information (76.8%).
| Industry | Male | Female |
| Agriculture, Fishing & Hunting | 0 (0.0%) | 0 (0.0%) |
| Mining, Quarrying, & Extraction | 0 (0.0%) | 0 (0.0%) |
| Construction | 141 (100.0%) | 0 (0.0%) |
| Manufacturing | 30 (57.7%) | 22 (42.3%) |
| Wholesale Trade | 0 (0.0%) | 10 (100.0%) |
| Retail Trade | 180 (36.7%) | 310 (63.3%) |
| Transportation & Warehousing | 119 (78.8%) | 32 (21.2%) |
| Utilities | 0 (0.0%) | 20 (100.0%) |
| Information | 16 (23.2%) | 53 (76.8%) |
| Finance & Insurance | 146 (82.5%) | 31 (17.5%) |
| Real Estate, Rental & Leasing | 29 (54.7%) | 24 (45.3%) |
| Professional & Scientific | 456 (66.7%) | 228 (33.3%) |
| Enterprise Management | 0 (0.0%) | 0 (0.0%) |
| Administrative & Support | 51 (44.7%) | 63 (55.3%) |
| Educational Services | 126 (29.8%) | 297 (70.2%) |
| Health Care & Social Assistance | 62 (36.7%) | 107 (63.3%) |
| Arts, Entertainment & Recreation | 29 (25.7%) | 84 (74.3%) |
| Accommodation & Food Services | 83 (40.7%) | 121 (59.3%) |
| Public Administration | 499 (55.6%) | 398 (44.4%) |
| Total | 2,061 (52.0%) | 1,901 (48.0%) |
Education in Laurel Hill
School Enrollment in Laurel Hill
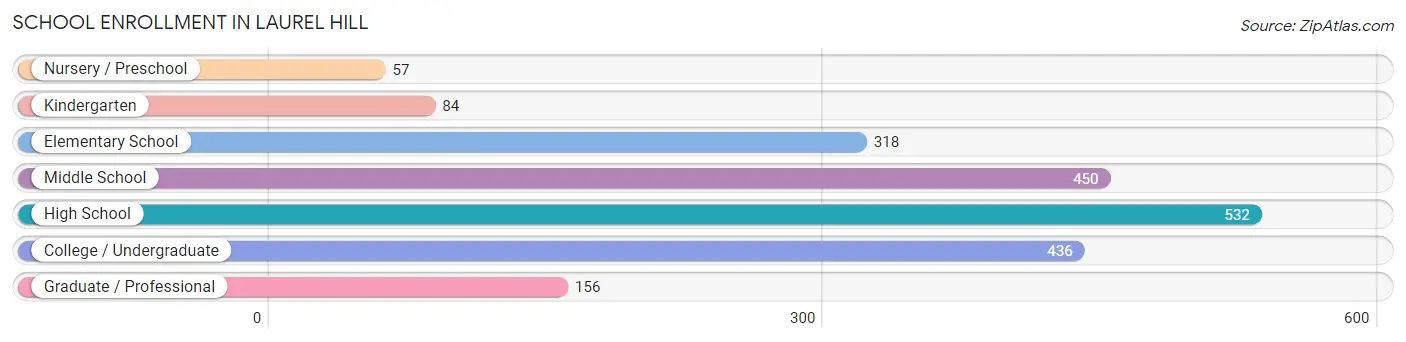
The most common levels of schooling among the 2,033 students in Laurel Hill are high school (532 | 26.2%), middle school (450 | 22.1%), and college / undergraduate (436 | 21.4%).
| School Level | # Students | % Students |
| Nursery / Preschool | 57 | 2.8% |
| Kindergarten | 84 | 4.1% |
| Elementary School | 318 | 15.6% |
| Middle School | 450 | 22.1% |
| High School | 532 | 26.2% |
| College / Undergraduate | 436 | 21.4% |
| Graduate / Professional | 156 | 7.7% |
| Total | 2,033 | 100.0% |
School Enrollment by Age by Funding Source in Laurel Hill
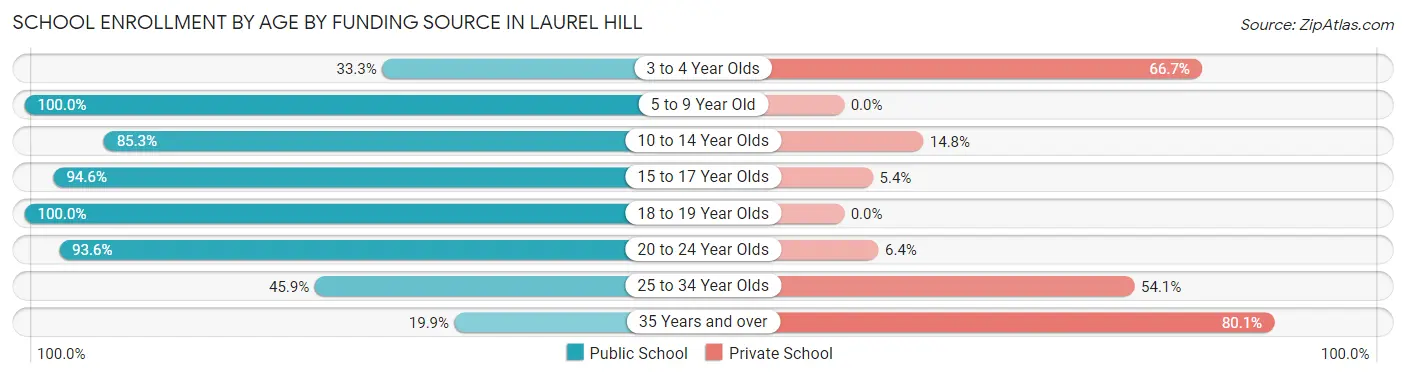
Out of a total of 2,033 students who are enrolled in schools in Laurel Hill, 295 (14.5%) attend a private institution, while the remaining 1,738 (85.5%) are enrolled in public schools. The age group of 35 years and over has the highest likelihood of being enrolled in private schools, with 113 (80.1% in the age bracket) enrolled. Conversely, the age group of 5 to 9 year old has the lowest likelihood of being enrolled in a private school, with 402 (100.0% in the age bracket) attending a public institution.
| Age Bracket | Public School | Private School |
| 3 to 4 Year Olds | 19 (33.3%) | 38 (66.7%) |
| 5 to 9 Year Old | 402 (100.0%) | 0 (0.0%) |
| 10 to 14 Year Olds | 416 (85.3%) | 72 (14.7%) |
| 15 to 17 Year Olds | 439 (94.6%) | 25 (5.4%) |
| 18 to 19 Year Olds | 202 (100.0%) | 0 (0.0%) |
| 20 to 24 Year Olds | 204 (93.6%) | 14 (6.4%) |
| 25 to 34 Year Olds | 28 (45.9%) | 33 (54.1%) |
| 35 Years and over | 28 (19.9%) | 113 (80.1%) |
| Total | 1,738 (85.5%) | 295 (14.5%) |
Educational Attainment by Field of Study in Laurel Hill
Business (878 | 27.5%), social sciences (283 | 8.8%), computers & mathematics (248 | 7.7%), education (240 | 7.5%), and arts & humanities (219 | 6.9%) are the most common fields of study among 3,198 individuals in Laurel Hill who have obtained a bachelor's degree or higher.
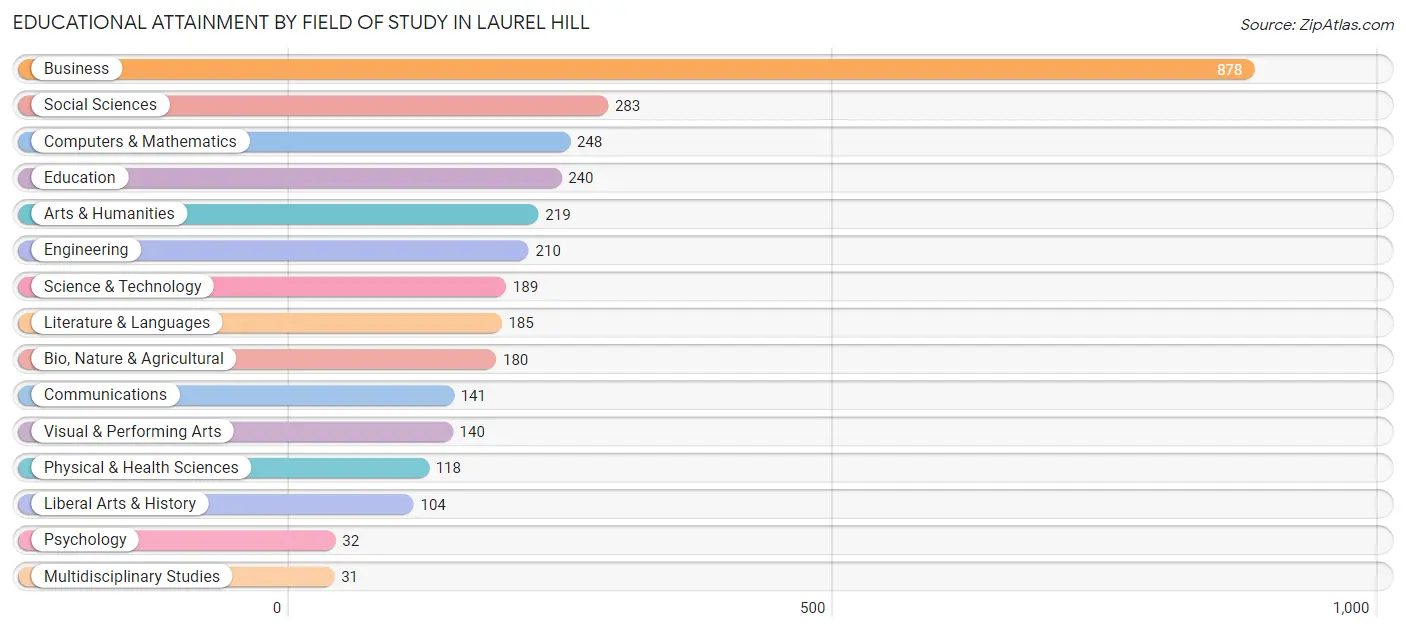
| Field of Study | # Graduates | % Graduates |
| Computers & Mathematics | 248 | 7.7% |
| Bio, Nature & Agricultural | 180 | 5.6% |
| Physical & Health Sciences | 118 | 3.7% |
| Psychology | 32 | 1.0% |
| Social Sciences | 283 | 8.8% |
| Engineering | 210 | 6.6% |
| Multidisciplinary Studies | 31 | 1.0% |
| Science & Technology | 189 | 5.9% |
| Business | 878 | 27.5% |
| Education | 240 | 7.5% |
| Literature & Languages | 185 | 5.8% |
| Liberal Arts & History | 104 | 3.3% |
| Visual & Performing Arts | 140 | 4.4% |
| Communications | 141 | 4.4% |
| Arts & Humanities | 219 | 6.9% |
| Total | 3,198 | 100.0% |
Transportation & Commute in Laurel Hill
Vehicle Availability by Sex in Laurel Hill
The most prevalent vehicle ownership categories in Laurel Hill are males with 2 vehicles (1,106, accounting for 51.9%) and females with 2 vehicles (926, making up 56.9%).
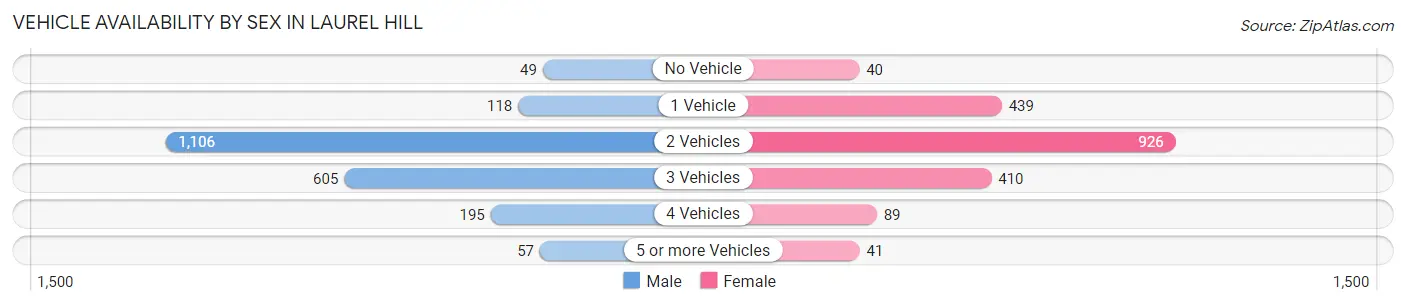
| Vehicles Available | Male | Female |
| No Vehicle | 49 (2.3%) | 40 (2.1%) |
| 1 Vehicle | 118 (5.5%) | 439 (22.6%) |
| 2 Vehicles | 1,106 (51.9%) | 926 (47.6%) |
| 3 Vehicles | 605 (28.4%) | 410 (21.1%) |
| 4 Vehicles | 195 (9.1%) | 89 (4.6%) |
| 5 or more Vehicles | 57 (2.7%) | 41 (2.1%) |
| Total | 2,130 (100.0%) | 1,945 (100.0%) |
Commute Time in Laurel Hill
The most frequently occuring commute durations in Laurel Hill are 30 to 34 minutes (855 commuters, 26.3%), 60 to 89 minutes (411 commuters, 12.7%), and 45 to 59 minutes (379 commuters, 11.7%).
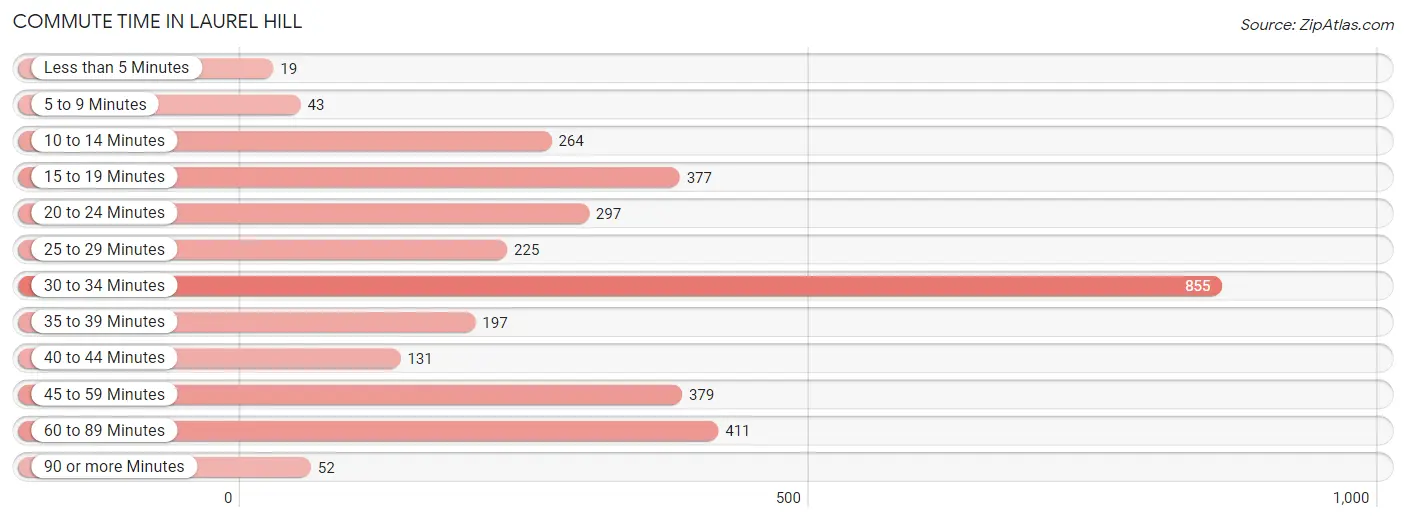
| Commute Time | # Commuters | % Commuters |
| Less than 5 Minutes | 19 | 0.6% |
| 5 to 9 Minutes | 43 | 1.3% |
| 10 to 14 Minutes | 264 | 8.1% |
| 15 to 19 Minutes | 377 | 11.6% |
| 20 to 24 Minutes | 297 | 9.1% |
| 25 to 29 Minutes | 225 | 6.9% |
| 30 to 34 Minutes | 855 | 26.3% |
| 35 to 39 Minutes | 197 | 6.1% |
| 40 to 44 Minutes | 131 | 4.0% |
| 45 to 59 Minutes | 379 | 11.7% |
| 60 to 89 Minutes | 411 | 12.7% |
| 90 or more Minutes | 52 | 1.6% |
Commute Time by Sex in Laurel Hill
The most common commute times in Laurel Hill are 30 to 34 minutes (595 commuters, 35.3%) for males and 15 to 19 minutes (308 commuters, 19.7%) for females.
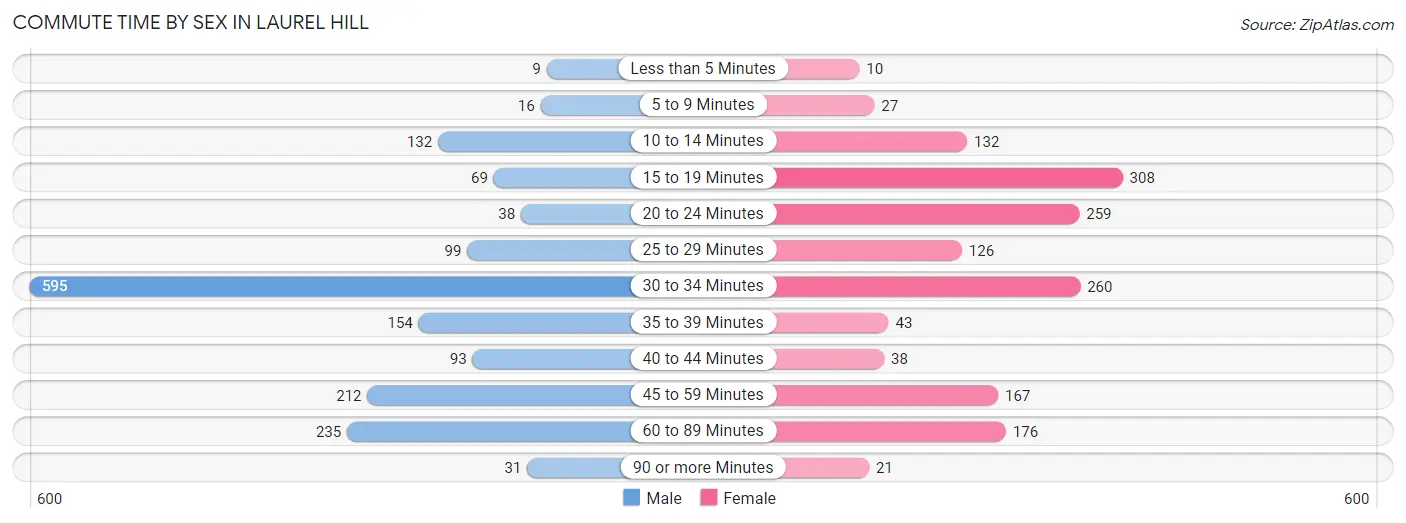
| Commute Time | Male | Female |
| Less than 5 Minutes | 9 (0.5%) | 10 (0.6%) |
| 5 to 9 Minutes | 16 (0.9%) | 27 (1.7%) |
| 10 to 14 Minutes | 132 (7.8%) | 132 (8.4%) |
| 15 to 19 Minutes | 69 (4.1%) | 308 (19.7%) |
| 20 to 24 Minutes | 38 (2.3%) | 259 (16.5%) |
| 25 to 29 Minutes | 99 (5.9%) | 126 (8.0%) |
| 30 to 34 Minutes | 595 (35.3%) | 260 (16.6%) |
| 35 to 39 Minutes | 154 (9.1%) | 43 (2.7%) |
| 40 to 44 Minutes | 93 (5.5%) | 38 (2.4%) |
| 45 to 59 Minutes | 212 (12.6%) | 167 (10.7%) |
| 60 to 89 Minutes | 235 (14.0%) | 176 (11.2%) |
| 90 or more Minutes | 31 (1.8%) | 21 (1.3%) |
Time of Departure to Work by Sex in Laurel Hill
The most frequent times of departure to work in Laurel Hill are 8:00 AM to 8:29 AM (260, 15.4%) for males and 7:30 AM to 7:59 AM (337, 21.5%) for females.
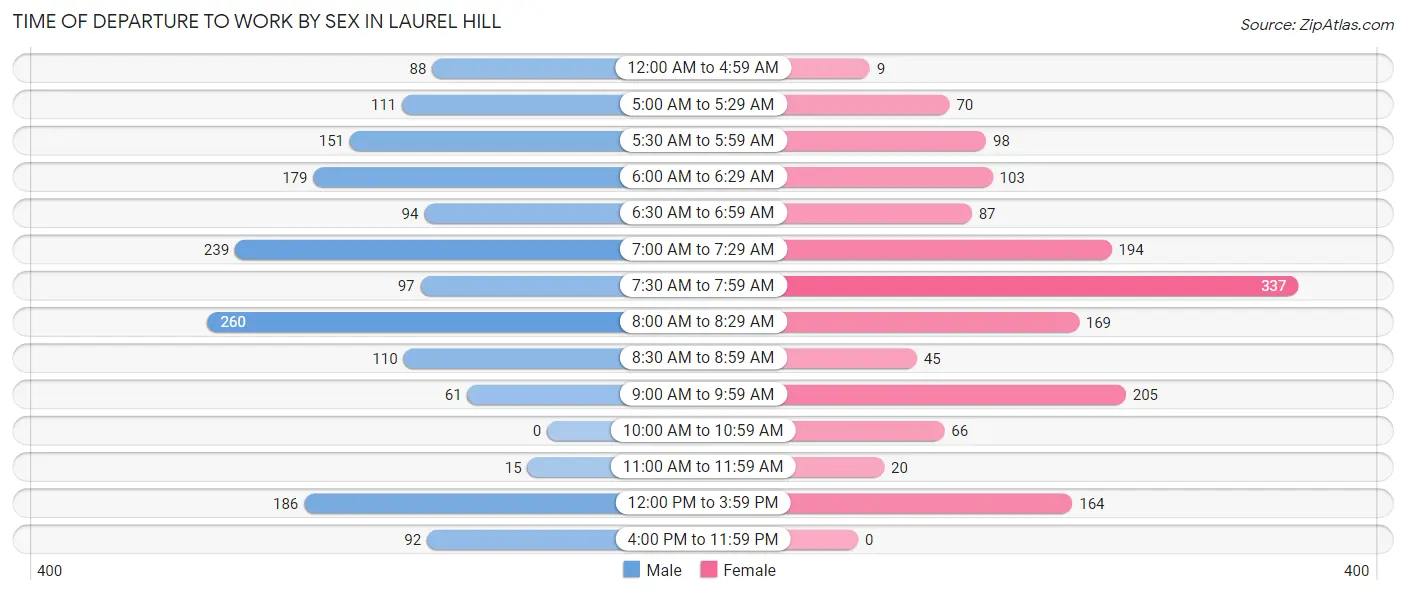
| Time of Departure | Male | Female |
| 12:00 AM to 4:59 AM | 88 (5.2%) | 9 (0.6%) |
| 5:00 AM to 5:29 AM | 111 (6.6%) | 70 (4.5%) |
| 5:30 AM to 5:59 AM | 151 (9.0%) | 98 (6.2%) |
| 6:00 AM to 6:29 AM | 179 (10.6%) | 103 (6.6%) |
| 6:30 AM to 6:59 AM | 94 (5.6%) | 87 (5.6%) |
| 7:00 AM to 7:29 AM | 239 (14.2%) | 194 (12.4%) |
| 7:30 AM to 7:59 AM | 97 (5.8%) | 337 (21.5%) |
| 8:00 AM to 8:29 AM | 260 (15.4%) | 169 (10.8%) |
| 8:30 AM to 8:59 AM | 110 (6.5%) | 45 (2.9%) |
| 9:00 AM to 9:59 AM | 61 (3.6%) | 205 (13.1%) |
| 10:00 AM to 10:59 AM | 0 (0.0%) | 66 (4.2%) |
| 11:00 AM to 11:59 AM | 15 (0.9%) | 20 (1.3%) |
| 12:00 PM to 3:59 PM | 186 (11.1%) | 164 (10.5%) |
| 4:00 PM to 11:59 PM | 92 (5.5%) | 0 (0.0%) |
| Total | 1,683 (100.0%) | 1,567 (100.0%) |
Housing Occupancy in Laurel Hill
Occupancy by Ownership in Laurel Hill
Of the total 2,731 dwellings in Laurel Hill, owner-occupied units account for 2,116 (77.5%), while renter-occupied units make up 615 (22.5%).
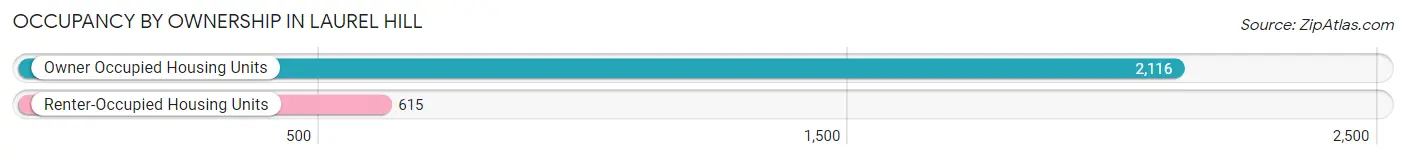
| Occupancy | # Housing Units | % Housing Units |
| Owner Occupied Housing Units | 2,116 | 77.5% |
| Renter-Occupied Housing Units | 615 | 22.5% |
| Total Occupied Housing Units | 2,731 | 100.0% |
Occupancy by Household Size in Laurel Hill
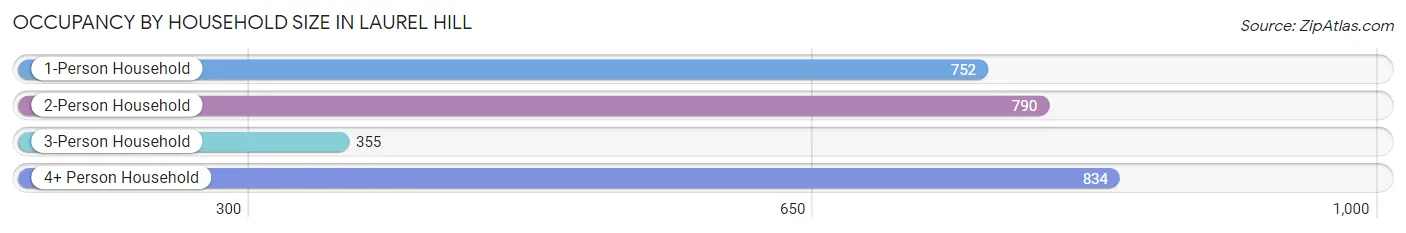
| Household Size | # Housing Units | % Housing Units |
| 1-Person Household | 752 | 27.5% |
| 2-Person Household | 790 | 28.9% |
| 3-Person Household | 355 | 13.0% |
| 4+ Person Household | 834 | 30.5% |
| Total Housing Units | 2,731 | 100.0% |
Occupancy by Ownership by Household Size in Laurel Hill
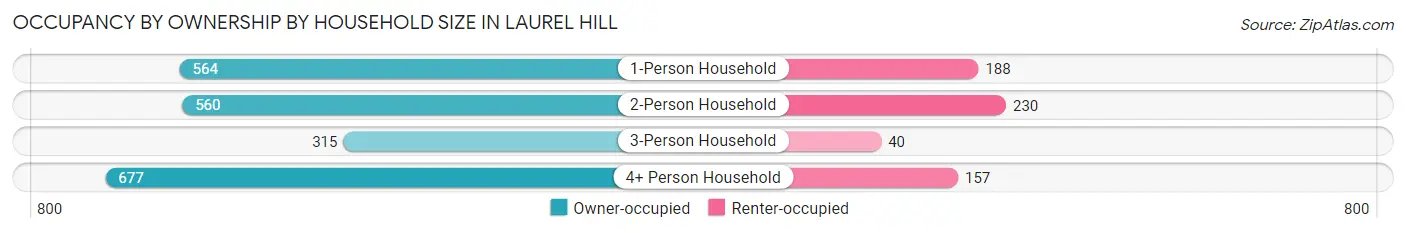
| Household Size | Owner-occupied | Renter-occupied |
| 1-Person Household | 564 (75.0%) | 188 (25.0%) |
| 2-Person Household | 560 (70.9%) | 230 (29.1%) |
| 3-Person Household | 315 (88.7%) | 40 (11.3%) |
| 4+ Person Household | 677 (81.2%) | 157 (18.8%) |
| Total Housing Units | 2,116 (77.5%) | 615 (22.5%) |
Occupancy by Educational Attainment in Laurel Hill
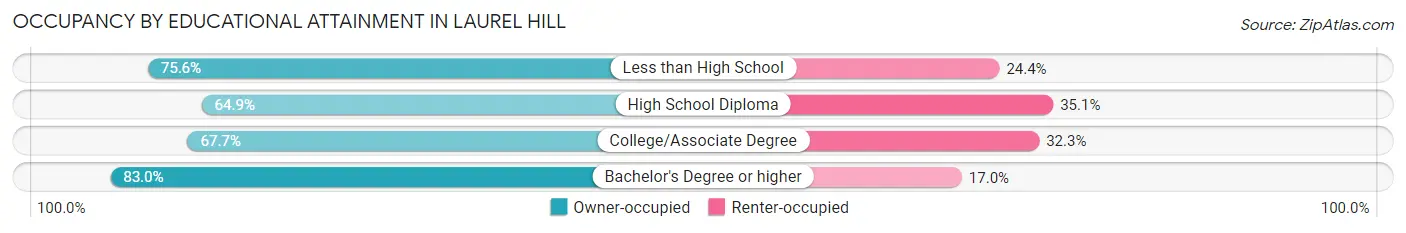
| Household Size | Owner-occupied | Renter-occupied |
| Less than High School | 34 (75.6%) | 11 (24.4%) |
| High School Diploma | 146 (64.9%) | 79 (35.1%) |
| College/Associate Degree | 471 (67.7%) | 225 (32.3%) |
| Bachelor's Degree or higher | 1,465 (83.0%) | 300 (17.0%) |
Occupancy by Age of Householder in Laurel Hill
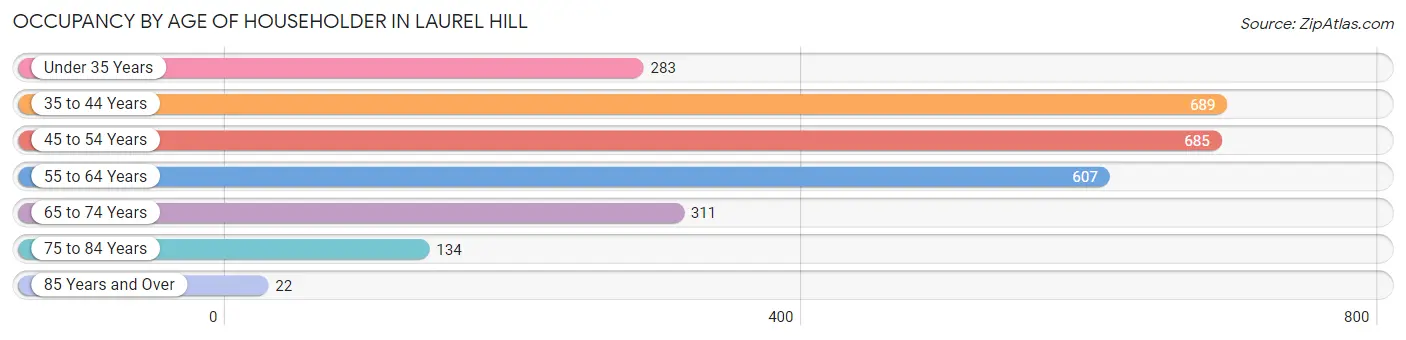
| Age Bracket | # Households | % Households |
| Under 35 Years | 283 | 10.4% |
| 35 to 44 Years | 689 | 25.2% |
| 45 to 54 Years | 685 | 25.1% |
| 55 to 64 Years | 607 | 22.2% |
| 65 to 74 Years | 311 | 11.4% |
| 75 to 84 Years | 134 | 4.9% |
| 85 Years and Over | 22 | 0.8% |
| Total | 2,731 | 100.0% |
Housing Finances in Laurel Hill
Median Income by Occupancy in Laurel Hill
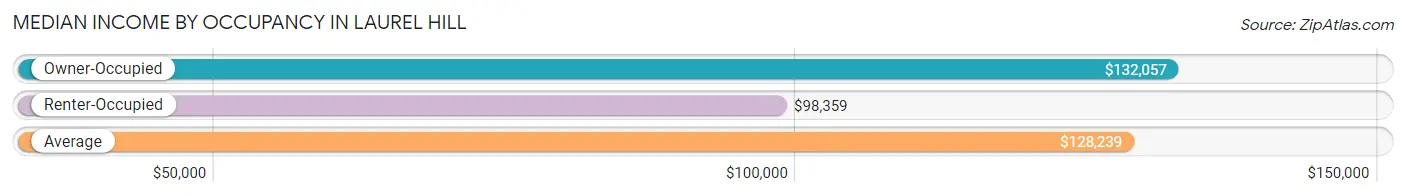
| Occupancy Type | # Households | Median Income |
| Owner-Occupied | 2,116 (77.5%) | $132,057 |
| Renter-Occupied | 615 (22.5%) | $98,359 |
| Average | 2,731 (100.0%) | $128,239 |
Occupancy by Householder Income Bracket in Laurel Hill
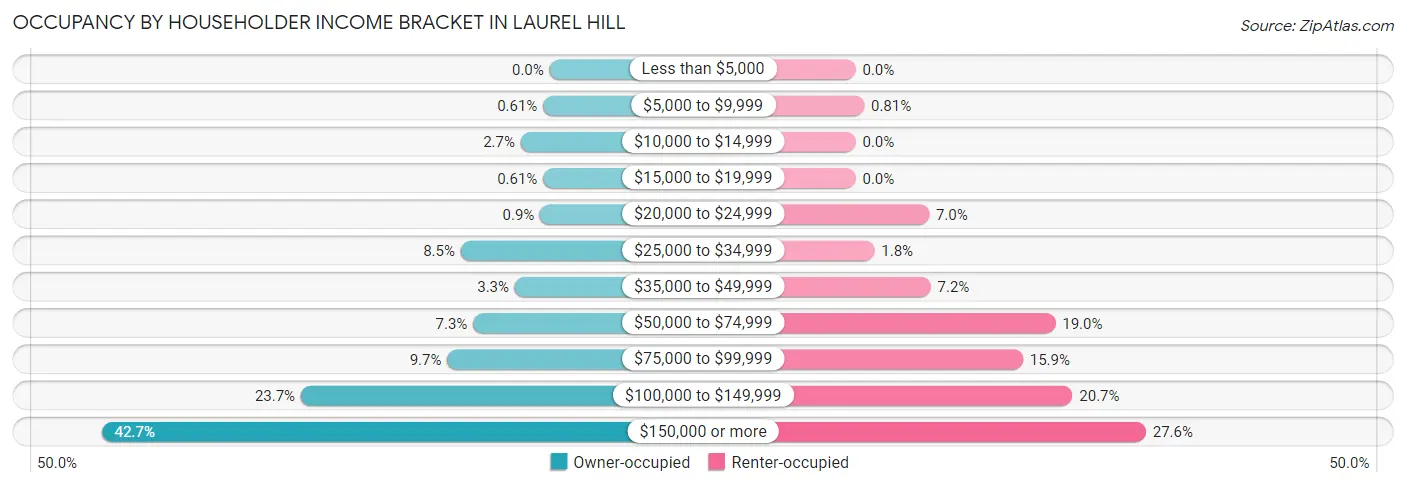
| Income Bracket | Owner-occupied | Renter-occupied |
| Less than $5,000 | 0 (0.0%) | 0 (0.0%) |
| $5,000 to $9,999 | 13 (0.6%) | 5 (0.8%) |
| $10,000 to $14,999 | 58 (2.7%) | 0 (0.0%) |
| $15,000 to $19,999 | 13 (0.6%) | 0 (0.0%) |
| $20,000 to $24,999 | 19 (0.9%) | 43 (7.0%) |
| $25,000 to $34,999 | 179 (8.5%) | 11 (1.8%) |
| $35,000 to $49,999 | 70 (3.3%) | 44 (7.1%) |
| $50,000 to $74,999 | 154 (7.3%) | 117 (19.0%) |
| $75,000 to $99,999 | 206 (9.7%) | 98 (15.9%) |
| $100,000 to $149,999 | 501 (23.7%) | 127 (20.6%) |
| $150,000 or more | 903 (42.7%) | 170 (27.6%) |
| Total | 2,116 (100.0%) | 615 (100.0%) |
Monthly Housing Cost Tiers in Laurel Hill
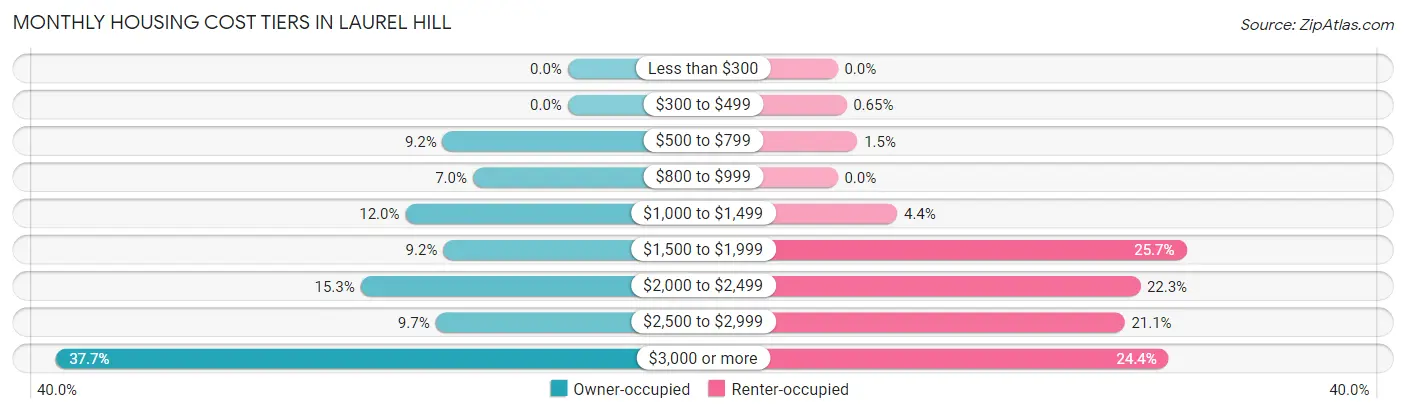
| Monthly Cost | Owner-occupied | Renter-occupied |
| Less than $300 | 0 (0.0%) | 0 (0.0%) |
| $300 to $499 | 0 (0.0%) | 4 (0.6%) |
| $500 to $799 | 195 (9.2%) | 9 (1.5%) |
| $800 to $999 | 148 (7.0%) | 0 (0.0%) |
| $1,000 to $1,499 | 253 (12.0%) | 27 (4.4%) |
| $1,500 to $1,999 | 194 (9.2%) | 158 (25.7%) |
| $2,000 to $2,499 | 323 (15.3%) | 137 (22.3%) |
| $2,500 to $2,999 | 206 (9.7%) | 130 (21.1%) |
| $3,000 or more | 797 (37.7%) | 150 (24.4%) |
| Total | 2,116 (100.0%) | 615 (100.0%) |
Physical Housing Characteristics in Laurel Hill
Housing Structures in Laurel Hill
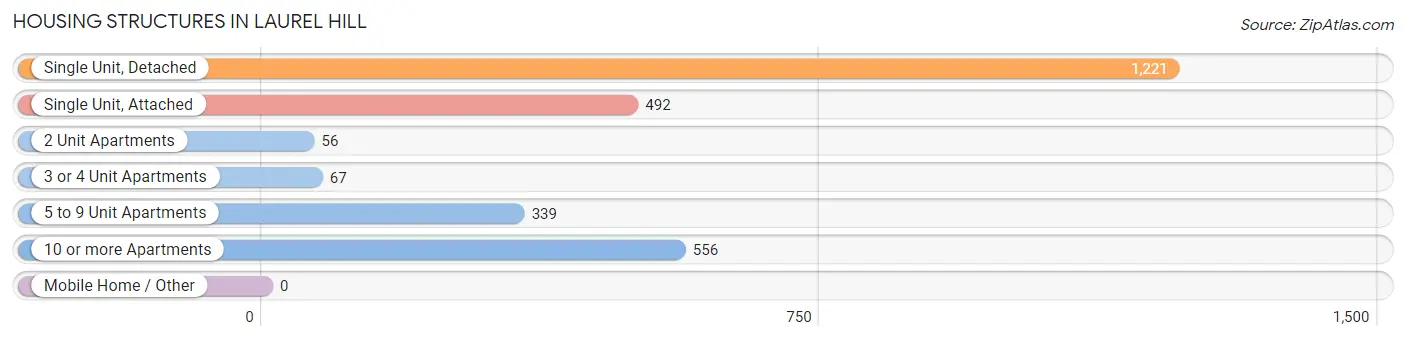
| Structure Type | # Housing Units | % Housing Units |
| Single Unit, Detached | 1,221 | 44.7% |
| Single Unit, Attached | 492 | 18.0% |
| 2 Unit Apartments | 56 | 2.1% |
| 3 or 4 Unit Apartments | 67 | 2.5% |
| 5 to 9 Unit Apartments | 339 | 12.4% |
| 10 or more Apartments | 556 | 20.4% |
| Mobile Home / Other | 0 | 0.0% |
| Total | 2,731 | 100.0% |
Housing Structures by Occupancy in Laurel Hill
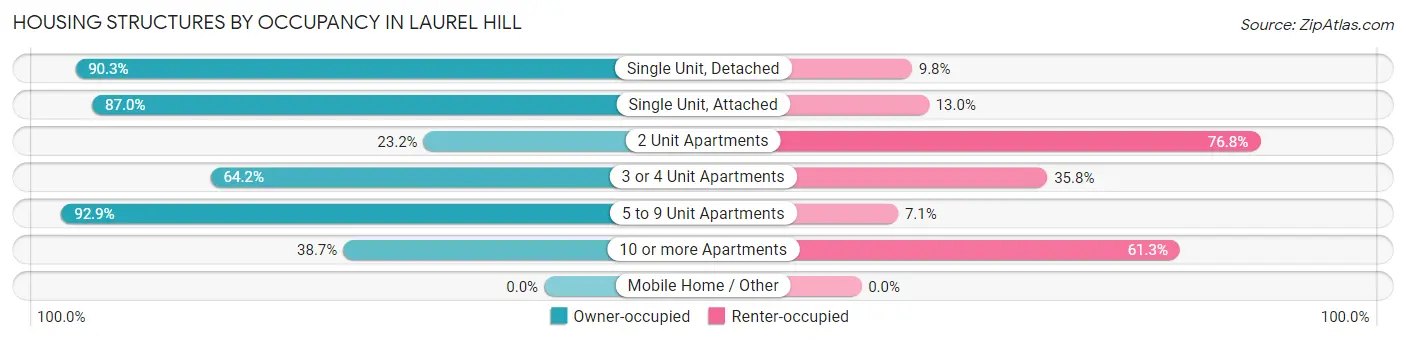
| Structure Type | Owner-occupied | Renter-occupied |
| Single Unit, Detached | 1,102 (90.2%) | 119 (9.8%) |
| Single Unit, Attached | 428 (87.0%) | 64 (13.0%) |
| 2 Unit Apartments | 13 (23.2%) | 43 (76.8%) |
| 3 or 4 Unit Apartments | 43 (64.2%) | 24 (35.8%) |
| 5 to 9 Unit Apartments | 315 (92.9%) | 24 (7.1%) |
| 10 or more Apartments | 215 (38.7%) | 341 (61.3%) |
| Mobile Home / Other | 0 (0.0%) | 0 (0.0%) |
| Total | 2,116 (77.5%) | 615 (22.5%) |
Housing Structures by Number of Rooms in Laurel Hill
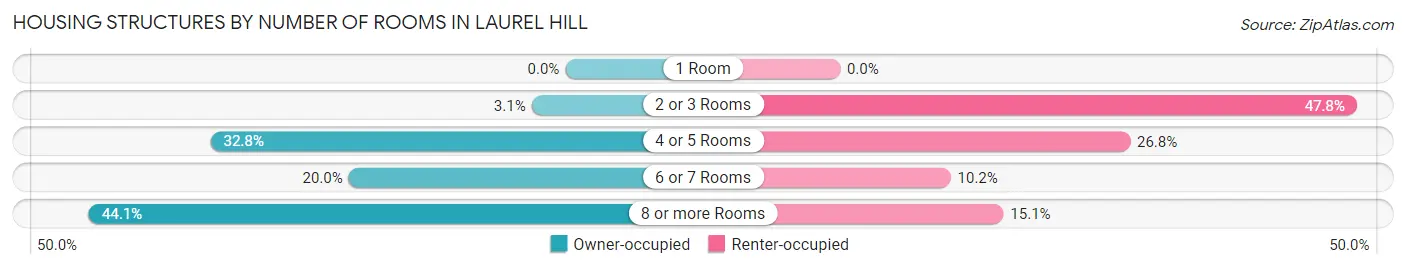
| Number of Rooms | Owner-occupied | Renter-occupied |
| 1 Room | 0 (0.0%) | 0 (0.0%) |
| 2 or 3 Rooms | 66 (3.1%) | 294 (47.8%) |
| 4 or 5 Rooms | 694 (32.8%) | 165 (26.8%) |
| 6 or 7 Rooms | 424 (20.0%) | 63 (10.2%) |
| 8 or more Rooms | 932 (44.1%) | 93 (15.1%) |
| Total | 2,116 (100.0%) | 615 (100.0%) |
Housing Structure by Heating Type in Laurel Hill
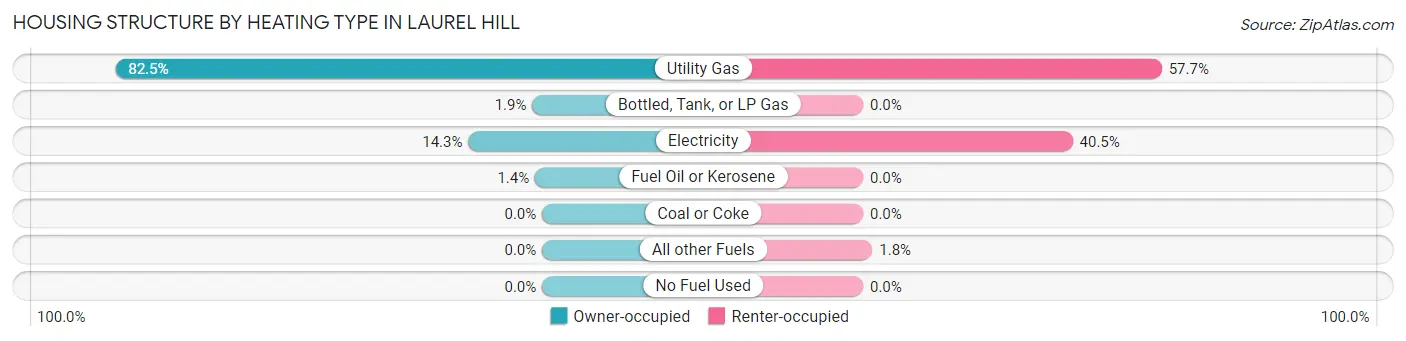
| Heating Type | Owner-occupied | Renter-occupied |
| Utility Gas | 1,745 (82.5%) | 355 (57.7%) |
| Bottled, Tank, or LP Gas | 40 (1.9%) | 0 (0.0%) |
| Electricity | 302 (14.3%) | 249 (40.5%) |
| Fuel Oil or Kerosene | 29 (1.4%) | 0 (0.0%) |
| Coal or Coke | 0 (0.0%) | 0 (0.0%) |
| All other Fuels | 0 (0.0%) | 11 (1.8%) |
| No Fuel Used | 0 (0.0%) | 0 (0.0%) |
| Total | 2,116 (100.0%) | 615 (100.0%) |
Household Vehicle Usage in Laurel Hill
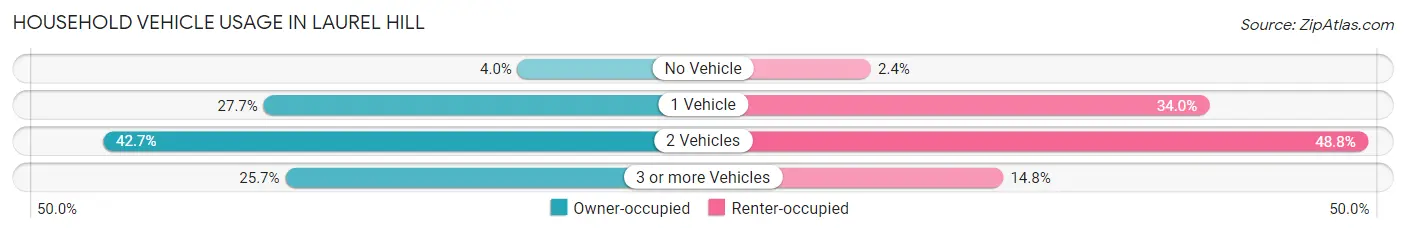
| Vehicles per Household | Owner-occupied | Renter-occupied |
| No Vehicle | 84 (4.0%) | 15 (2.4%) |
| 1 Vehicle | 586 (27.7%) | 209 (34.0%) |
| 2 Vehicles | 903 (42.7%) | 300 (48.8%) |
| 3 or more Vehicles | 543 (25.7%) | 91 (14.8%) |
| Total | 2,116 (100.0%) | 615 (100.0%) |
Real Estate & Mortgages in Laurel Hill
Real Estate and Mortgage Overview in Laurel Hill
| Characteristic | Without Mortgage | With Mortgage |
| Housing Units | 505 | 1,611 |
| Median Property Value | $460,600 | $656,300 |
| Median Household Income | $84,464 | $784 |
| Monthly Housing Costs | $910 | $797 |
| Real Estate Taxes | $4,260 | $122 |
Property Value by Mortgage Status in Laurel Hill
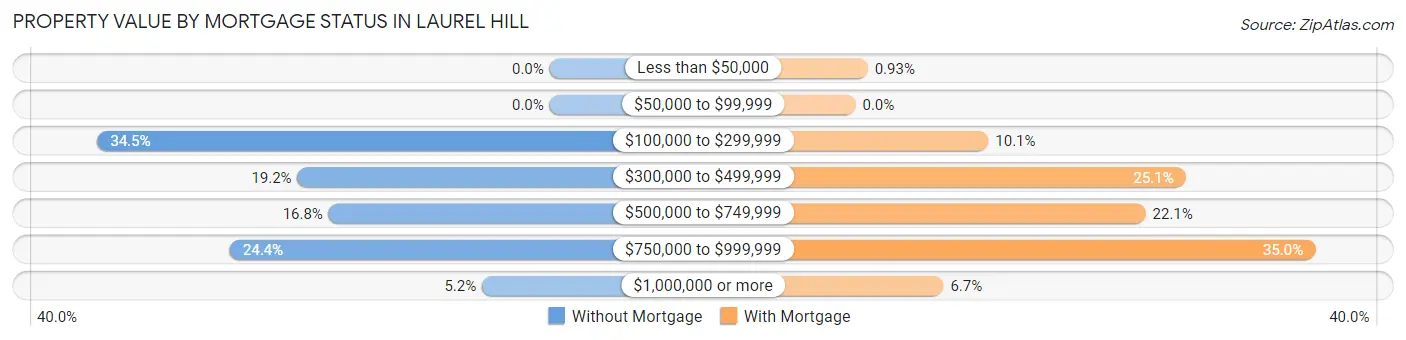
| Property Value | Without Mortgage | With Mortgage |
| Less than $50,000 | 0 (0.0%) | 15 (0.9%) |
| $50,000 to $99,999 | 0 (0.0%) | 0 (0.0%) |
| $100,000 to $299,999 | 174 (34.5%) | 163 (10.1%) |
| $300,000 to $499,999 | 97 (19.2%) | 405 (25.1%) |
| $500,000 to $749,999 | 85 (16.8%) | 356 (22.1%) |
| $750,000 to $999,999 | 123 (24.4%) | 564 (35.0%) |
| $1,000,000 or more | 26 (5.1%) | 108 (6.7%) |
| Total | 505 (100.0%) | 1,611 (100.0%) |
Household Income by Mortgage Status in Laurel Hill
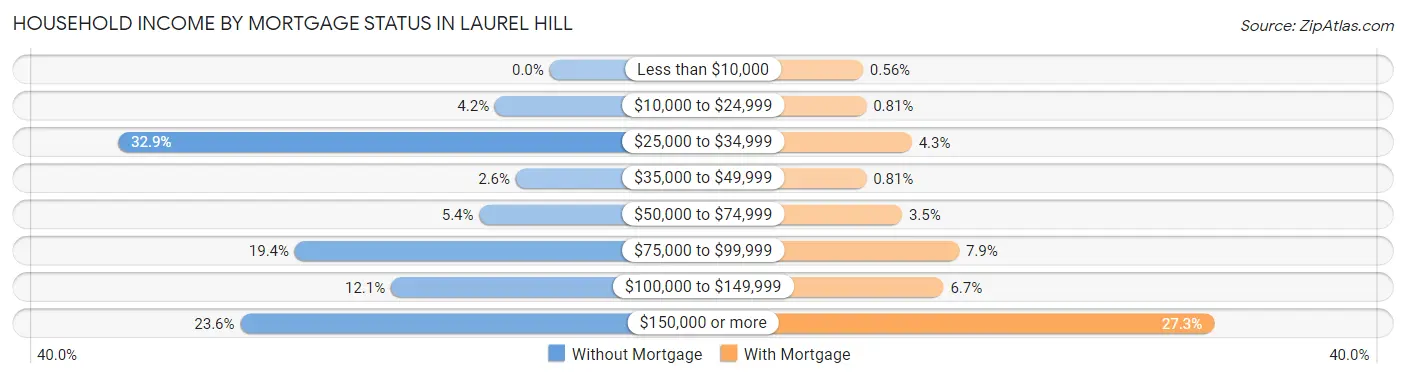
| Household Income | Without Mortgage | With Mortgage |
| Less than $10,000 | 0 (0.0%) | 9 (0.6%) |
| $10,000 to $24,999 | 21 (4.2%) | 13 (0.8%) |
| $25,000 to $34,999 | 166 (32.9%) | 69 (4.3%) |
| $35,000 to $49,999 | 13 (2.6%) | 13 (0.8%) |
| $50,000 to $74,999 | 27 (5.3%) | 57 (3.5%) |
| $75,000 to $99,999 | 98 (19.4%) | 127 (7.9%) |
| $100,000 to $149,999 | 61 (12.1%) | 108 (6.7%) |
| $150,000 or more | 119 (23.6%) | 440 (27.3%) |
| Total | 505 (100.0%) | 1,611 (100.0%) |
Property Value to Household Income Ratio in Laurel Hill
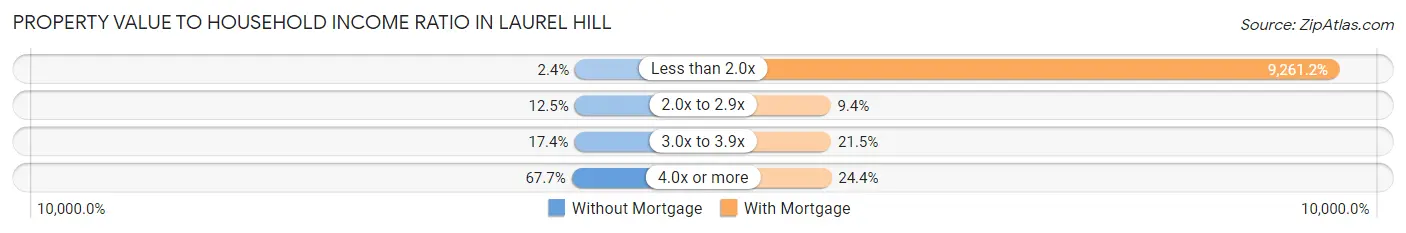
| Value-to-Income Ratio | Without Mortgage | With Mortgage |
| Less than 2.0x | 12 (2.4%) | 149,198 (9,261.2%) |
| 2.0x to 2.9x | 63 (12.5%) | 152 (9.4%) |
| 3.0x to 3.9x | 88 (17.4%) | 346 (21.5%) |
| 4.0x or more | 342 (67.7%) | 393 (24.4%) |
| Total | 505 (100.0%) | 1,611 (100.0%) |
Real Estate Taxes by Mortgage Status in Laurel Hill
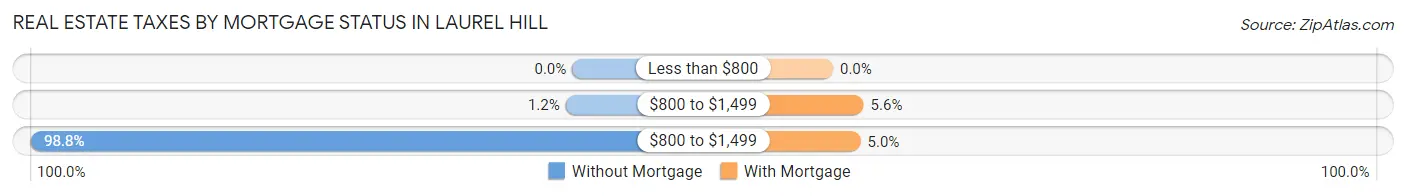
| Property Taxes | Without Mortgage | With Mortgage |
| Less than $800 | 0 (0.0%) | 0 (0.0%) |
| $800 to $1,499 | 6 (1.2%) | 90 (5.6%) |
| $800 to $1,499 | 499 (98.8%) | 81 (5.0%) |
| Total | 505 (100.0%) | 1,611 (100.0%) |
Health & Disability in Laurel Hill
Health Insurance Coverage by Age in Laurel Hill
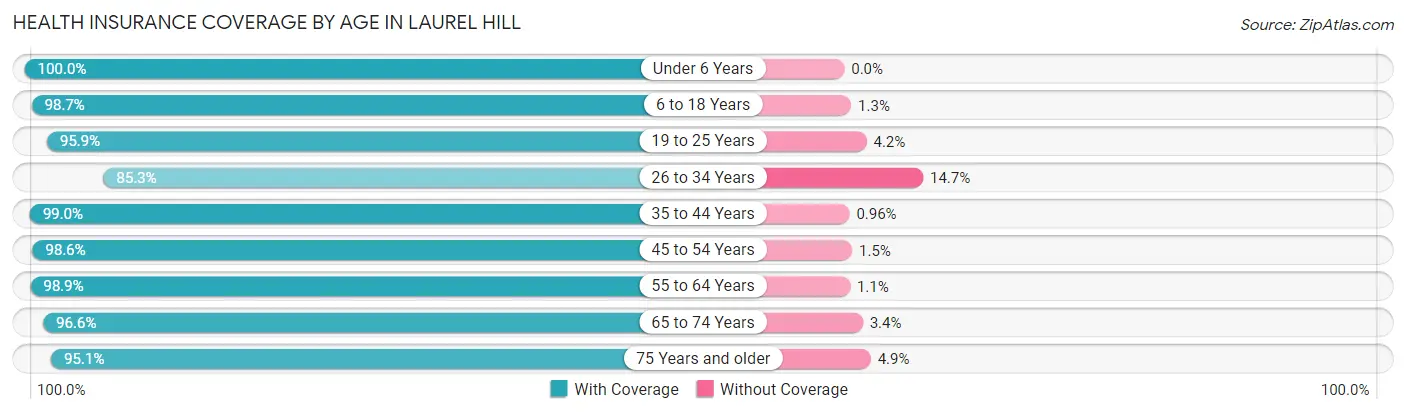
| Age Bracket | With Coverage | Without Coverage |
| Under 6 Years | 349 (100.0%) | 0 (0.0%) |
| 6 to 18 Years | 1,544 (98.7%) | 20 (1.3%) |
| 19 to 25 Years | 508 (95.9%) | 22 (4.2%) |
| 26 to 34 Years | 418 (85.3%) | 72 (14.7%) |
| 35 to 44 Years | 1,241 (99.0%) | 12 (1.0%) |
| 45 to 54 Years | 1,087 (98.6%) | 16 (1.5%) |
| 55 to 64 Years | 1,116 (98.9%) | 12 (1.1%) |
| 65 to 74 Years | 506 (96.6%) | 18 (3.4%) |
| 75 Years and older | 270 (95.1%) | 14 (4.9%) |
| Total | 7,039 (97.4%) | 186 (2.6%) |
Health Insurance Coverage by Citizenship Status in Laurel Hill

| Citizenship Status | With Coverage | Without Coverage |
| Native Born | 349 (100.0%) | 0 (0.0%) |
| Foreign Born, Citizen | 1,544 (98.7%) | 20 (1.3%) |
| Foreign Born, not a Citizen | 508 (95.9%) | 22 (4.2%) |
Health Insurance Coverage by Household Income in Laurel Hill
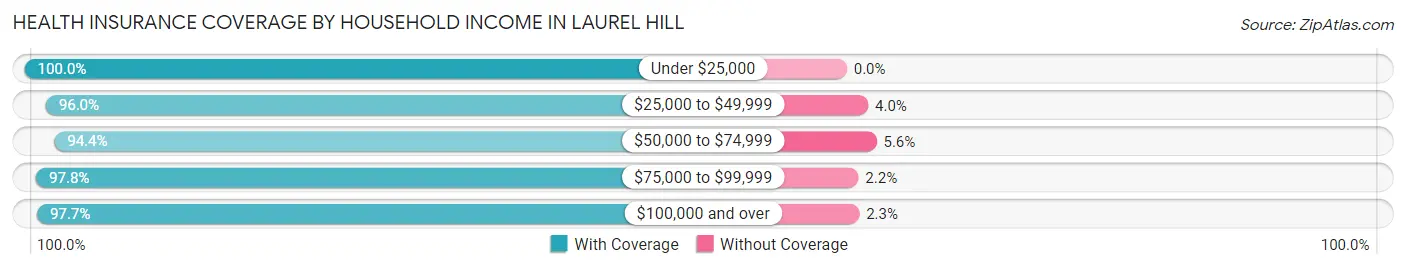
| Household Income | With Coverage | Without Coverage |
| Under $25,000 | 276 (100.0%) | 0 (0.0%) |
| $25,000 to $49,999 | 385 (96.0%) | 16 (4.0%) |
| $50,000 to $74,999 | 543 (94.4%) | 32 (5.6%) |
| $75,000 to $99,999 | 631 (97.8%) | 14 (2.2%) |
| $100,000 and over | 5,204 (97.7%) | 124 (2.3%) |
Public vs Private Health Insurance Coverage by Age in Laurel Hill
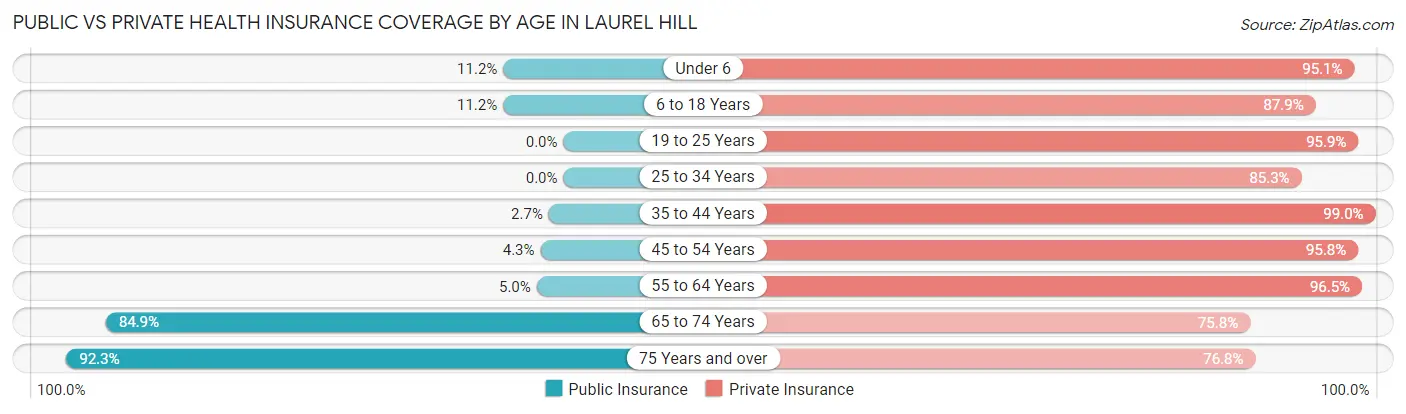
| Age Bracket | Public Insurance | Private Insurance |
| Under 6 | 39 (11.2%) | 332 (95.1%) |
| 6 to 18 Years | 175 (11.2%) | 1,375 (87.9%) |
| 19 to 25 Years | 0 (0.0%) | 508 (95.9%) |
| 25 to 34 Years | 0 (0.0%) | 418 (85.3%) |
| 35 to 44 Years | 34 (2.7%) | 1,241 (99.0%) |
| 45 to 54 Years | 47 (4.3%) | 1,057 (95.8%) |
| 55 to 64 Years | 56 (5.0%) | 1,089 (96.5%) |
| 65 to 74 Years | 445 (84.9%) | 397 (75.8%) |
| 75 Years and over | 262 (92.2%) | 218 (76.8%) |
| Total | 1,058 (14.6%) | 6,635 (91.8%) |
Disability Status by Sex by Age in Laurel Hill
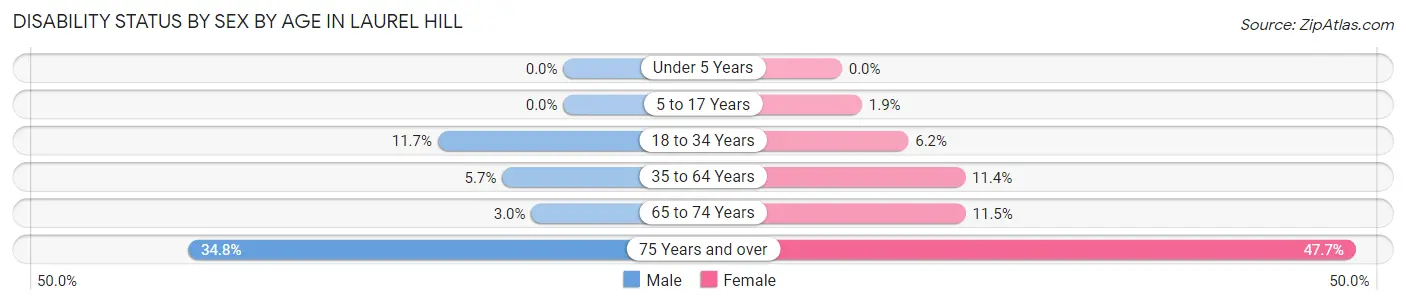
| Age Bracket | Male | Female |
| Under 5 Years | 0 (0.0%) | 0 (0.0%) |
| 5 to 17 Years | 0 (0.0%) | 11 (1.9%) |
| 18 to 34 Years | 74 (11.7%) | 36 (6.2%) |
| 35 to 64 Years | 92 (5.7%) | 213 (11.4%) |
| 65 to 74 Years | 6 (3.0%) | 37 (11.5%) |
| 75 Years and over | 31 (34.8%) | 93 (47.7%) |
Disability Class by Sex by Age in Laurel Hill
Disability Class: Hearing Difficulty
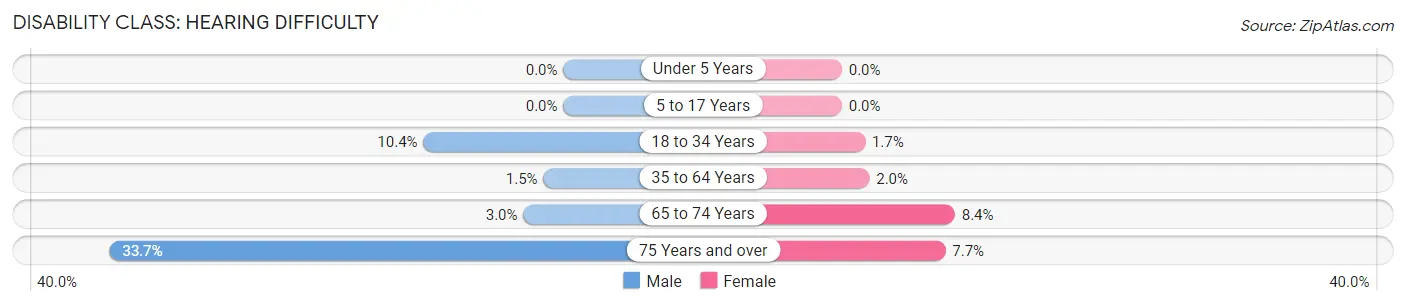
| Age Bracket | Male | Female |
| Under 5 Years | 0 (0.0%) | 0 (0.0%) |
| 5 to 17 Years | 0 (0.0%) | 0 (0.0%) |
| 18 to 34 Years | 66 (10.4%) | 10 (1.7%) |
| 35 to 64 Years | 24 (1.5%) | 38 (2.0%) |
| 65 to 74 Years | 6 (3.0%) | 27 (8.4%) |
| 75 Years and over | 30 (33.7%) | 15 (7.7%) |
Disability Class: Vision Difficulty
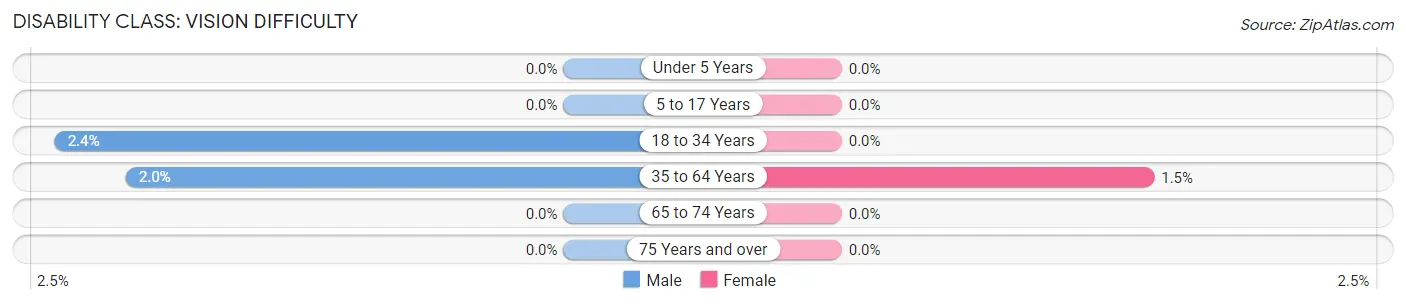
| Age Bracket | Male | Female |
| Under 5 Years | 0 (0.0%) | 0 (0.0%) |
| 5 to 17 Years | 0 (0.0%) | 0 (0.0%) |
| 18 to 34 Years | 15 (2.4%) | 0 (0.0%) |
| 35 to 64 Years | 33 (2.0%) | 27 (1.5%) |
| 65 to 74 Years | 0 (0.0%) | 0 (0.0%) |
| 75 Years and over | 0 (0.0%) | 0 (0.0%) |
Disability Class: Cognitive Difficulty
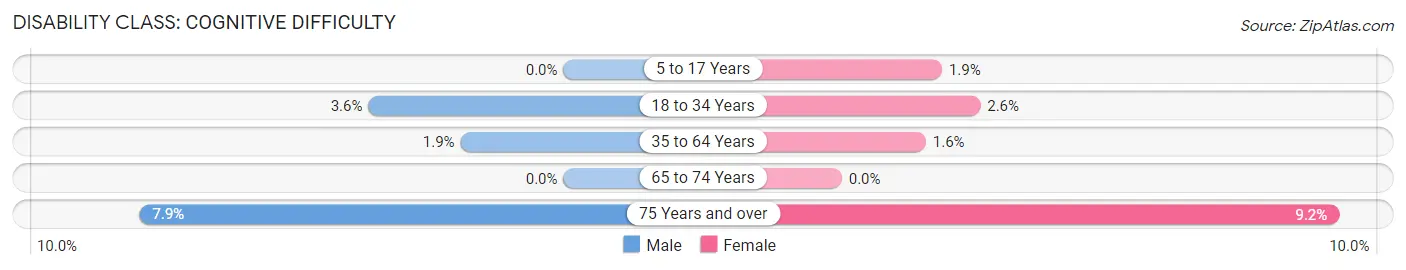
| Age Bracket | Male | Female |
| 5 to 17 Years | 0 (0.0%) | 11 (1.9%) |
| 18 to 34 Years | 23 (3.6%) | 15 (2.6%) |
| 35 to 64 Years | 31 (1.9%) | 29 (1.6%) |
| 65 to 74 Years | 0 (0.0%) | 0 (0.0%) |
| 75 Years and over | 7 (7.9%) | 18 (9.2%) |
Disability Class: Ambulatory Difficulty
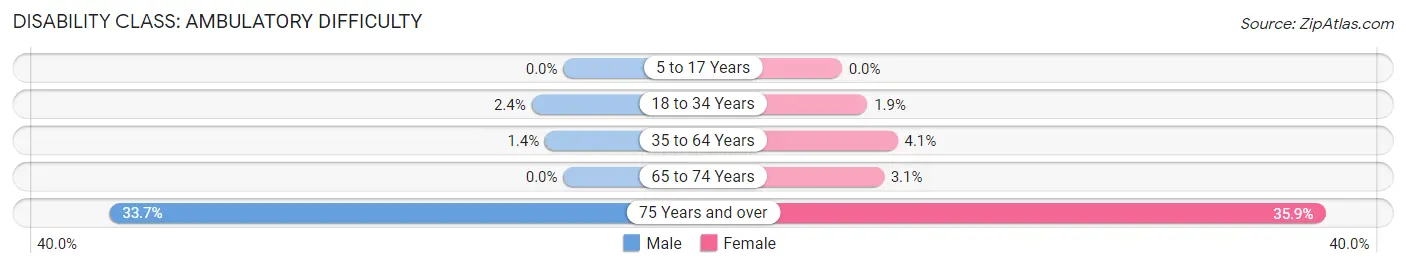
| Age Bracket | Male | Female |
| 5 to 17 Years | 0 (0.0%) | 0 (0.0%) |
| 18 to 34 Years | 15 (2.4%) | 11 (1.9%) |
| 35 to 64 Years | 22 (1.4%) | 77 (4.1%) |
| 65 to 74 Years | 0 (0.0%) | 10 (3.1%) |
| 75 Years and over | 30 (33.7%) | 70 (35.9%) |
Disability Class: Self-Care Difficulty
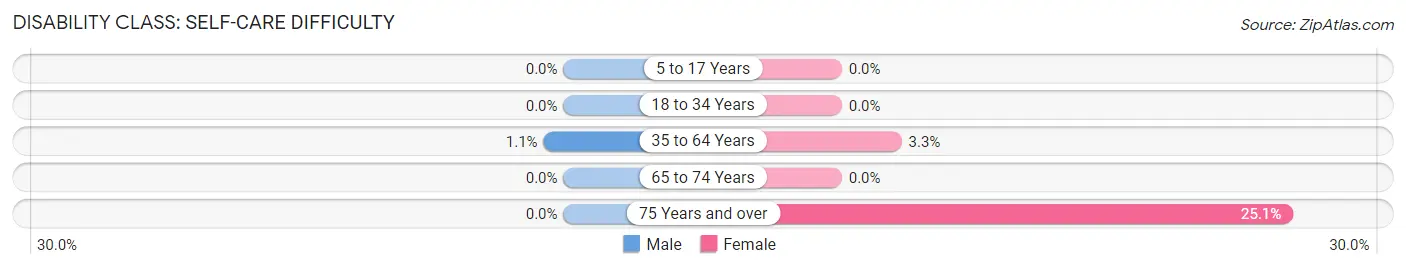
| Age Bracket | Male | Female |
| 5 to 17 Years | 0 (0.0%) | 0 (0.0%) |
| 18 to 34 Years | 0 (0.0%) | 0 (0.0%) |
| 35 to 64 Years | 18 (1.1%) | 62 (3.3%) |
| 65 to 74 Years | 0 (0.0%) | 0 (0.0%) |
| 75 Years and over | 0 (0.0%) | 49 (25.1%) |
Technology Access in Laurel Hill
Computing Device Access in Laurel Hill
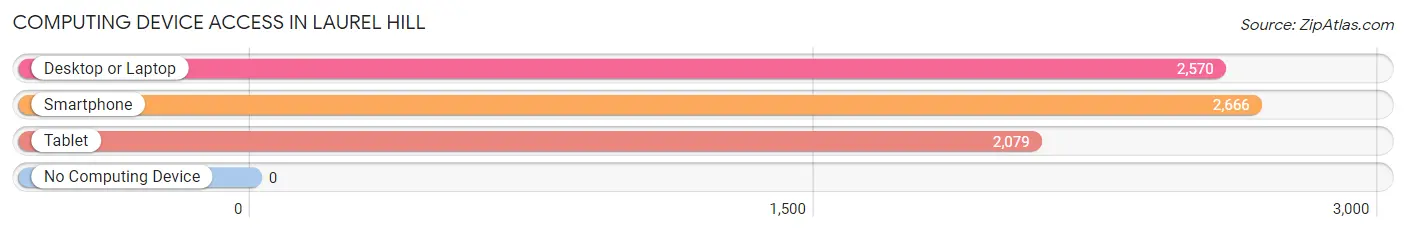
| Device Type | # Households | % Households |
| Desktop or Laptop | 2,570 | 94.1% |
| Smartphone | 2,666 | 97.6% |
| Tablet | 2,079 | 76.1% |
| No Computing Device | 0 | 0.0% |
| Total | 2,731 | 100.0% |
Internet Access in Laurel Hill
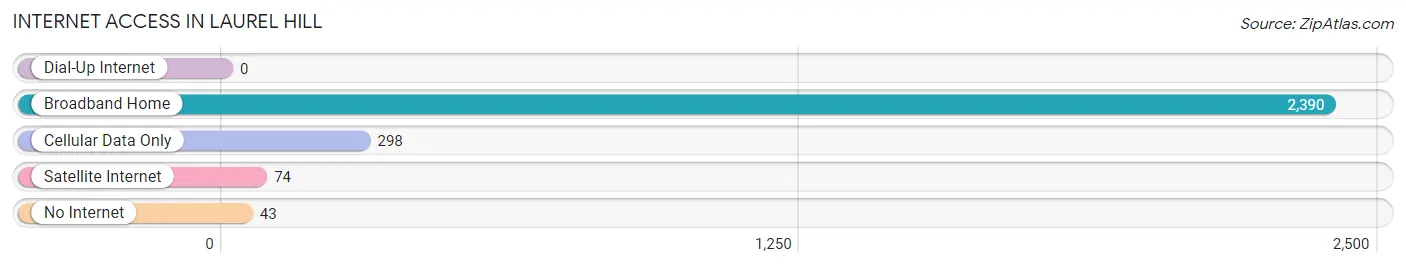
| Internet Type | # Households | % Households |
| Dial-Up Internet | 0 | 0.0% |
| Broadband Home | 2,390 | 87.5% |
| Cellular Data Only | 298 | 10.9% |
| Satellite Internet | 74 | 2.7% |
| No Internet | 43 | 1.6% |
| Total | 2,731 | 100.0% |
Laurel Hill Summary
Laurel Hill is a small unincorporated community located in Fauquier County, Virginia. It is situated in the foothills of the Blue Ridge Mountains, approximately 25 miles west of Washington, D.C. The community is home to a population of approximately 1,000 people, and is known for its rural charm and close-knit community.
History
The area that is now Laurel Hill was first settled in the late 1700s by a group of German immigrants. The community was originally known as “Mountain Run”, and was home to a number of small farms and businesses. In 1817, the community was renamed “Laurel Hill” after the abundance of laurel trees in the area.
In the mid-1800s, the community began to grow and prosper. The railroad arrived in 1854, bringing with it new opportunities for trade and commerce. The town also became a popular destination for tourists, who came to enjoy the area’s natural beauty and outdoor activities.
In the early 1900s, Laurel Hill experienced a period of decline. The railroad was abandoned, and many of the businesses and farms closed. However, the community was able to rebound in the mid-1900s, thanks to the efforts of local residents and businesses.
Geography
Laurel Hill is located in the foothills of the Blue Ridge Mountains, approximately 25 miles west of Washington, D.C. The community is situated in a rural area, surrounded by rolling hills and farmland. The area is known for its natural beauty, and is home to a number of parks and outdoor recreation areas.
The climate in Laurel Hill is temperate, with hot summers and cold winters. The average annual temperature is around 55 degrees Fahrenheit, and the average annual precipitation is around 40 inches.
Economy
The economy of Laurel Hill is largely based on agriculture and tourism. The area is home to a number of small farms, which produce a variety of crops, including corn, soybeans, and hay. The community is also a popular destination for tourists, who come to enjoy the area’s natural beauty and outdoor activities.
In addition to agriculture and tourism, the community is home to a number of small businesses, including restaurants, shops, and services. The area is also home to a number of wineries, which produce a variety of wines.
Demographics
As of the 2010 census, the population of Laurel Hill was 1,000. The racial makeup of the community was 94.2% White, 2.2% African American, 0.7% Native American, 0.7% Asian, and 2.2% from other races. The median household income was $50,000, and the median age was 44.
Conclusion
Laurel Hill is a small unincorporated community located in Fauquier County, Virginia. It is situated in the foothills of the Blue Ridge Mountains, approximately 25 miles west of Washington, D.C. The community is home to a population of approximately 1,000 people, and is known for its rural charm and close-knit community. The economy of Laurel Hill is largely based on agriculture and tourism, and the area is home to a number of small businesses, restaurants, shops, and services. The racial makeup of the community is 94.2% White, 2.2% African American, 0.7% Native American, 0.7% Asian, and 2.2% from other races. The median household income was $50,000, and the median age was 44.
Common Questions
What is Per Capita Income in Laurel Hill?
Per Capita income in Laurel Hill is $55,815.
What is the Median Family Income in Laurel Hill?
Median Family Income in Laurel Hill is $148,964.
What is the Median Household income in Laurel Hill?
Median Household Income in Laurel Hill is $128,239.
What is Income or Wage Gap in Laurel Hill?
Income or Wage Gap in Laurel Hill is 41.4%.
Women in Laurel Hill earn 58.6 cents for every dollar earned by a man.
What is Inequality or Gini Index in Laurel Hill?
Inequality or Gini Index in Laurel Hill is 0.37.
What is the Total Population of Laurel Hill?
Total Population of Laurel Hill is 7,338.
What is the Total Male Population of Laurel Hill?
Total Male Population of Laurel Hill is 3,565.
What is the Total Female Population of Laurel Hill?
Total Female Population of Laurel Hill is 3,773.
What is the Ratio of Males per 100 Females in Laurel Hill?
There are 94.49 Males per 100 Females in Laurel Hill.
What is the Ratio of Females per 100 Males in Laurel Hill?
There are 105.83 Females per 100 Males in Laurel Hill.
What is the Median Population Age in Laurel Hill?
Median Population Age in Laurel Hill is 40.5 Years.
What is the Average Family Size in Laurel Hill
Average Family Size in Laurel Hill is 3.4 People.
What is the Average Household Size in Laurel Hill
Average Household Size in Laurel Hill is 2.7 People.
How Large is the Labor Force in Laurel Hill?
There are 4,305 People in the Labor Forcein in Laurel Hill.
What is the Percentage of People in the Labor Force in Laurel Hill?
73.7% of People are in the Labor Force in Laurel Hill.
What is the Unemployment Rate in Laurel Hill?
Unemployment Rate in Laurel Hill is 5.4%.