Rockwood, VA Map & Demographics
Rockwood Map
Rockwood Overview
$45,196
PER CAPITA INCOME
$104,013
AVG FAMILY INCOME
$89,455
AVG HOUSEHOLD INCOME
28.7%
WAGE / INCOME GAP [ % ]
71.3¢/ $1
WAGE / INCOME GAP [ $ ]
0.36
INEQUALITY / GINI INDEX
8,076
TOTAL POPULATION
3,583
MALE POPULATION
4,493
FEMALE POPULATION
79.75
MALES / 100 FEMALES
125.40
FEMALES / 100 MALES
44.8
MEDIAN AGE
2.8
AVG FAMILY SIZE
2.4
AVG HOUSEHOLD SIZE
4,175
LABOR FORCE [ PEOPLE ]
61.7%
PERCENT IN LABOR FORCE
4.5%
UNEMPLOYMENT RATE
Income in Rockwood
Income Overview in Rockwood
Per Capita Income in Rockwood is $45,196, while median incomes of families and households are $104,013 and $89,455 respectively.
| Characteristic | Number | Measure |
| Per Capita Income | 8,076 | $45,196 |
| Median Family Income | 2,383 | $104,013 |
| Mean Family Income | 2,383 | $121,106 |
| Median Household Income | 3,292 | $89,455 |
| Mean Household Income | 3,292 | $107,987 |
| Income Deficit | 2,383 | $0 |
| Wage / Income Gap (%) | 8,076 | 28.66% |
| Wage / Income Gap ($) | 8,076 | 71.34¢ per $1 |
| Gini / Inequality Index | 8,076 | 0.36 |
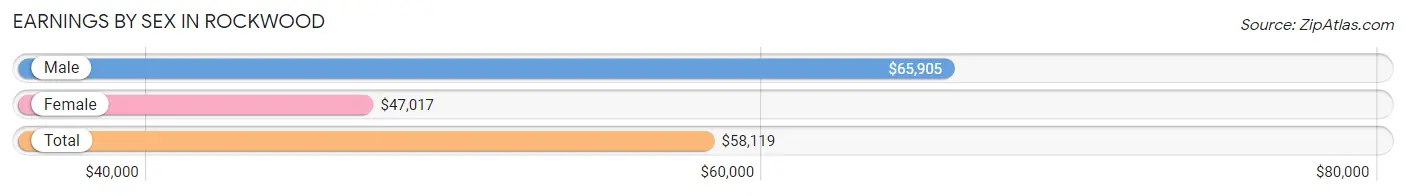
Earnings by Sex in Rockwood
Average Earnings in Rockwood are $58,119, $65,905 for men and $47,017 for women, a difference of 28.7%.
| Sex | Number | Average Earnings |
| Male | 2,065 (48.8%) | $65,905 |
| Female | 2,169 (51.2%) | $47,017 |
| Total | 4,234 (100.0%) | $58,119 |
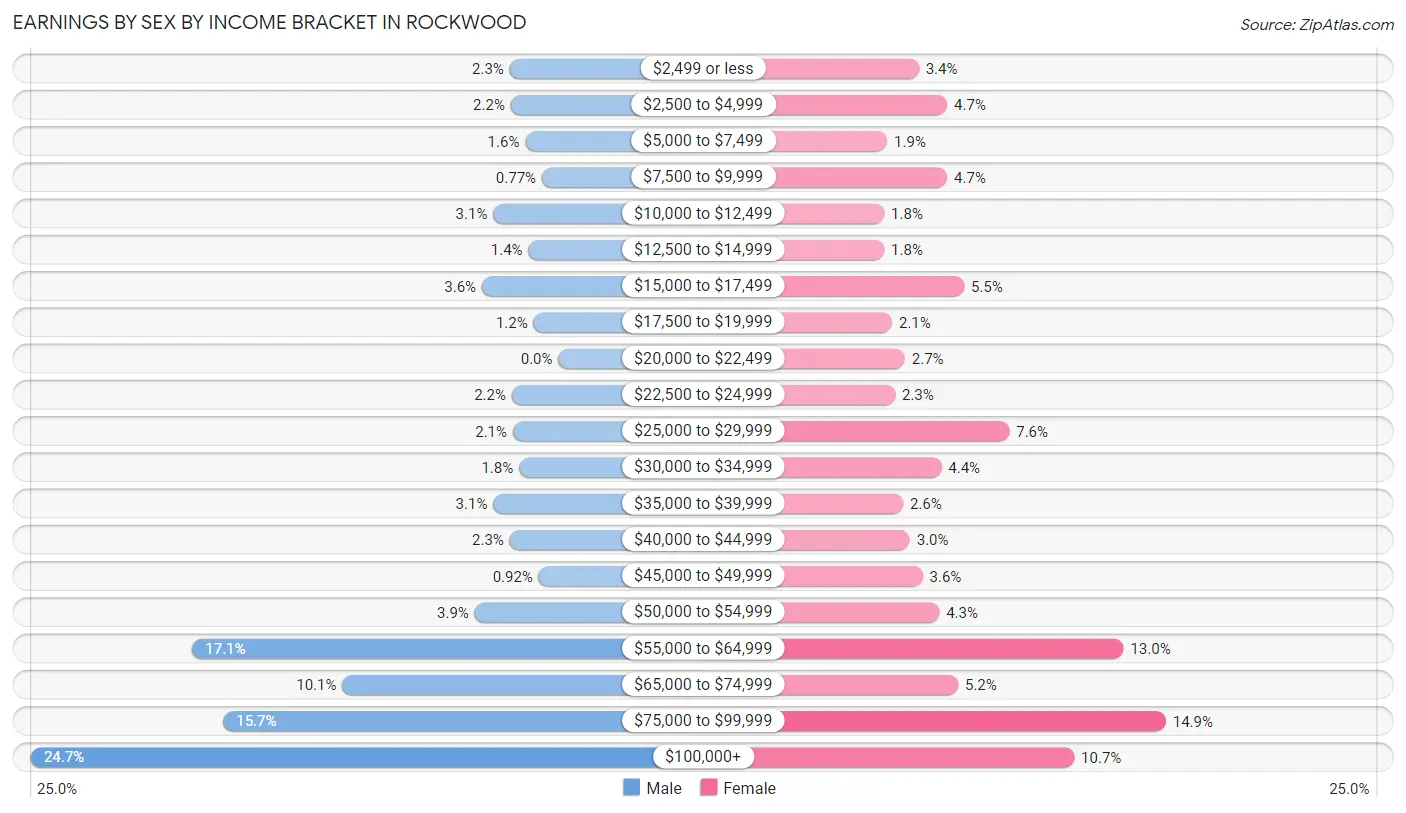
Earnings by Sex by Income Bracket in Rockwood
The most common earnings brackets in Rockwood are $100,000+ for men (510 | 24.7%) and $75,000 to $99,999 for women (324 | 14.9%).
| Income | Male | Female |
| $2,499 or less | 47 (2.3%) | 73 (3.4%) |
| $2,500 to $4,999 | 46 (2.2%) | 102 (4.7%) |
| $5,000 to $7,499 | 32 (1.5%) | 41 (1.9%) |
| $7,500 to $9,999 | 16 (0.8%) | 102 (4.7%) |
| $10,000 to $12,499 | 63 (3.0%) | 38 (1.8%) |
| $12,500 to $14,999 | 29 (1.4%) | 38 (1.8%) |
| $15,000 to $17,499 | 74 (3.6%) | 119 (5.5%) |
| $17,500 to $19,999 | 24 (1.2%) | 46 (2.1%) |
| $20,000 to $22,499 | 0 (0.0%) | 59 (2.7%) |
| $22,500 to $24,999 | 45 (2.2%) | 49 (2.3%) |
| $25,000 to $29,999 | 44 (2.1%) | 165 (7.6%) |
| $30,000 to $34,999 | 38 (1.8%) | 96 (4.4%) |
| $35,000 to $39,999 | 63 (3.0%) | 57 (2.6%) |
| $40,000 to $44,999 | 47 (2.3%) | 64 (2.9%) |
| $45,000 to $49,999 | 19 (0.9%) | 77 (3.5%) |
| $50,000 to $54,999 | 81 (3.9%) | 94 (4.3%) |
| $55,000 to $64,999 | 354 (17.1%) | 281 (13.0%) |
| $65,000 to $74,999 | 209 (10.1%) | 113 (5.2%) |
| $75,000 to $99,999 | 324 (15.7%) | 324 (14.9%) |
| $100,000+ | 510 (24.7%) | 231 (10.6%) |
| Total | 2,065 (100.0%) | 2,169 (100.0%) |
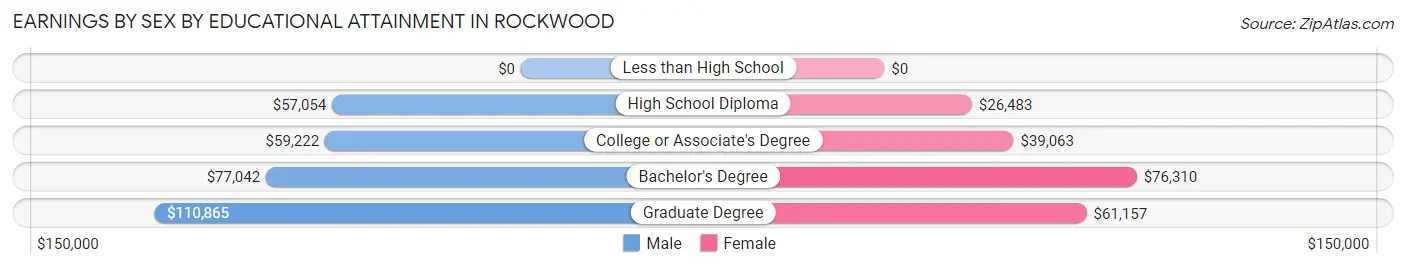
Earnings by Sex by Educational Attainment in Rockwood
Average earnings in Rockwood are $68,778 for men and $55,536 for women, a difference of 19.3%. Men with an educational attainment of graduate degree enjoy the highest average annual earnings of $110,865, while those with high school diploma education earn the least with $57,054. Women with an educational attainment of bachelor's degree earn the most with the average annual earnings of $76,310, while those with high school diploma education have the smallest earnings of $26,483.
| Educational Attainment | Male Income | Female Income |
| Less than High School | - | - |
| High School Diploma | $57,054 | $26,483 |
| College or Associate's Degree | $59,222 | $39,063 |
| Bachelor's Degree | $77,042 | $76,310 |
| Graduate Degree | $110,865 | $61,157 |
| Total | $68,778 | $55,536 |
Family Income in Rockwood
Family Income Brackets in Rockwood
According to the Rockwood family income data, there are 550 families falling into the $100,000 to $149,999 income range, which is the most common income bracket and makes up 23.1% of all families.
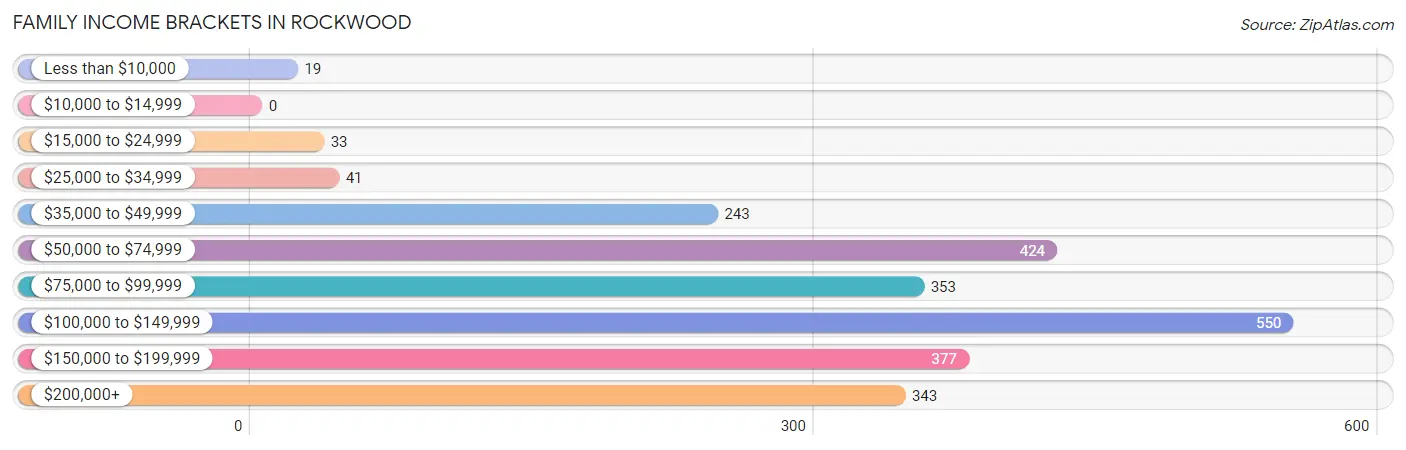
| Income Bracket | # Families | % Families |
| Less than $10,000 | 19 | 0.8% |
| $10,000 to $14,999 | 0 | 0.0% |
| $15,000 to $24,999 | 33 | 1.4% |
| $25,000 to $34,999 | 41 | 1.7% |
| $35,000 to $49,999 | 243 | 10.2% |
| $50,000 to $74,999 | 424 | 17.8% |
| $75,000 to $99,999 | 353 | 14.8% |
| $100,000 to $149,999 | 550 | 23.1% |
| $150,000 to $199,999 | 377 | 15.8% |
| $200,000+ | 343 | 14.4% |
Family Income by Famaliy Size in Rockwood
6-person families (30 | 1.3%) account for the highest median family income in Rockwood with $138,289 per family, while 2-person families (1,376 | 57.7%) have the highest median income of $48,362 per family member.
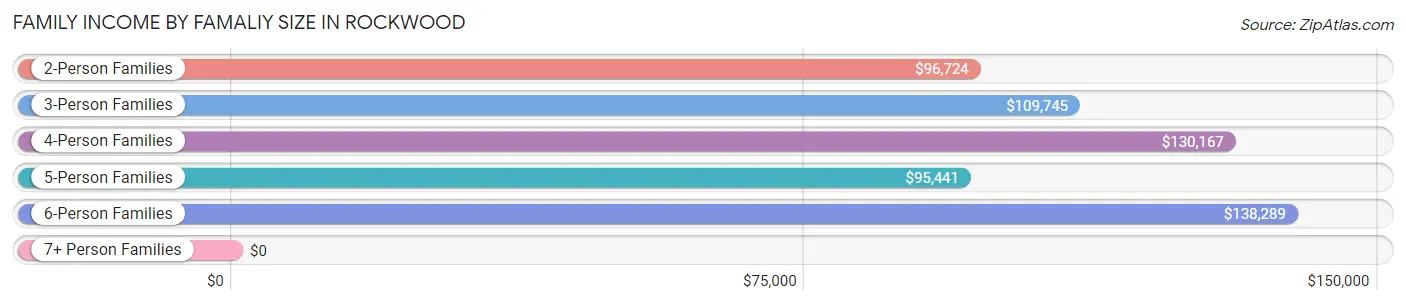
| Income Bracket | # Families | Median Income |
| 2-Person Families | 1,376 (57.7%) | $96,724 |
| 3-Person Families | 648 (27.2%) | $109,745 |
| 4-Person Families | 260 (10.9%) | $130,167 |
| 5-Person Families | 54 (2.3%) | $95,441 |
| 6-Person Families | 30 (1.3%) | $138,289 |
| 7+ Person Families | 15 (0.6%) | $0 |
| Total | 2,383 (100.0%) | $104,013 |
Family Income by Number of Earners in Rockwood
The median family income in Rockwood is $104,013, with families comprising 3+ earners (145) having the highest median family income of $160,893, while families with no earners (485) have the lowest median family income of $67,639, accounting for 6.1% and 20.3% of families, respectively.
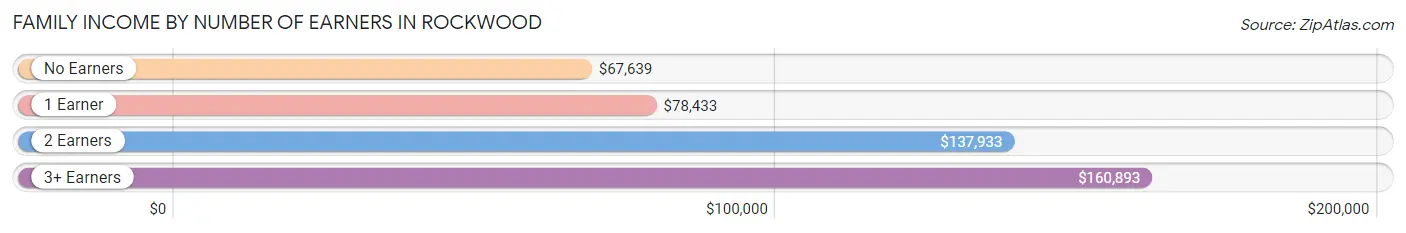
| Number of Earners | # Families | Median Income |
| No Earners | 485 (20.3%) | $67,639 |
| 1 Earner | 768 (32.2%) | $78,433 |
| 2 Earners | 985 (41.3%) | $137,933 |
| 3+ Earners | 145 (6.1%) | $160,893 |
| Total | 2,383 (100.0%) | $104,013 |
Household Income in Rockwood
Household Income Brackets in Rockwood
With 744 households falling in the category, the $50,000 to $74,999 income range is the most frequent in Rockwood, accounting for 22.6% of all households. In contrast, only 53 households (1.6%) fall into the $25,000 to $34,999 income bracket, making it the least populous group.
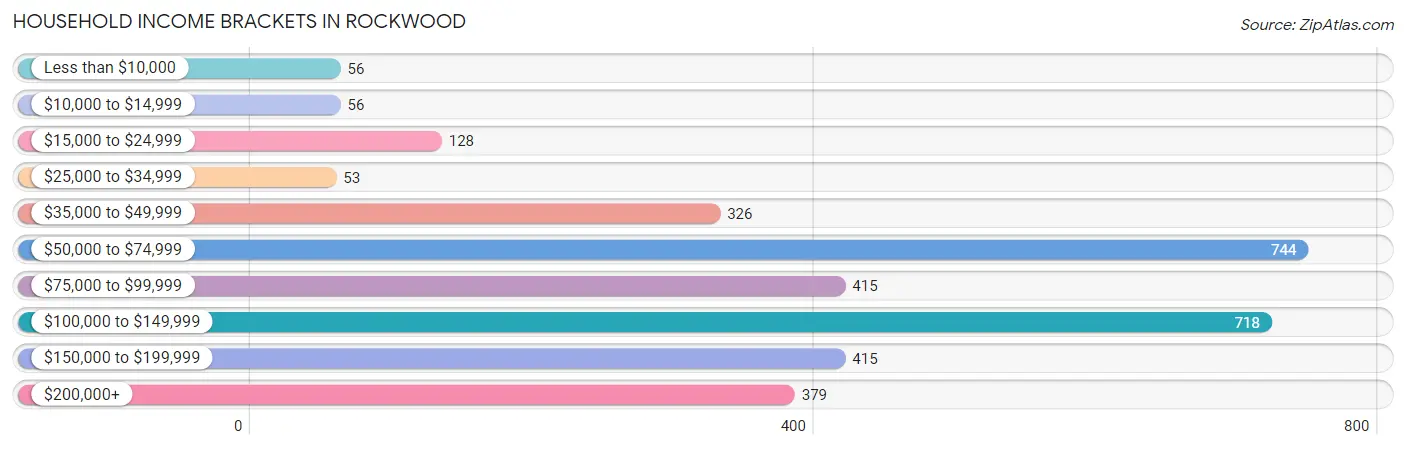
| Income Bracket | # Households | % Households |
| Less than $10,000 | 56 | 1.7% |
| $10,000 to $14,999 | 56 | 1.7% |
| $15,000 to $24,999 | 128 | 3.9% |
| $25,000 to $34,999 | 53 | 1.6% |
| $35,000 to $49,999 | 326 | 9.9% |
| $50,000 to $74,999 | 744 | 22.6% |
| $75,000 to $99,999 | 415 | 12.6% |
| $100,000 to $149,999 | 718 | 21.8% |
| $150,000 to $199,999 | 415 | 12.6% |
| $200,000+ | 379 | 11.5% |
Household Income by Householder Age in Rockwood
The median household income in Rockwood is $89,455, with the highest median household income of $108,021 found in the 25 to 44 years age bracket for the primary householder. A total of 928 households (28.2%) fall into this category. Meanwhile, the 65+ years age bracket for the primary householder has the lowest median household income of $63,093, with 1,029 households (31.3%) in this group.
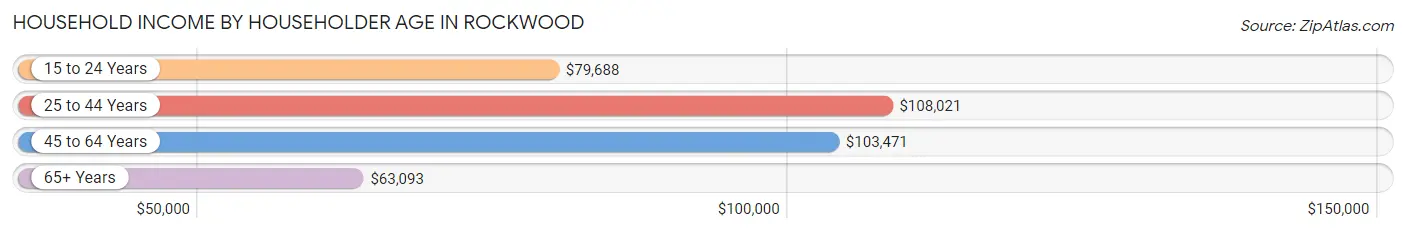
| Income Bracket | # Households | Median Income |
| 15 to 24 Years | 53 (1.6%) | $79,688 |
| 25 to 44 Years | 928 (28.2%) | $108,021 |
| 45 to 64 Years | 1,282 (38.9%) | $103,471 |
| 65+ Years | 1,029 (31.3%) | $63,093 |
| Total | 3,292 (100.0%) | $89,455 |
Poverty in Rockwood
Income Below Poverty by Sex and Age in Rockwood
With 3.5% poverty level for males and 9.2% for females among the residents of Rockwood, 6 to 11 year old males and 16 and 17 year old females are the most vulnerable to poverty, with 51 males (19.1%) and 31 females (22.6%) in their respective age groups living below the poverty level.
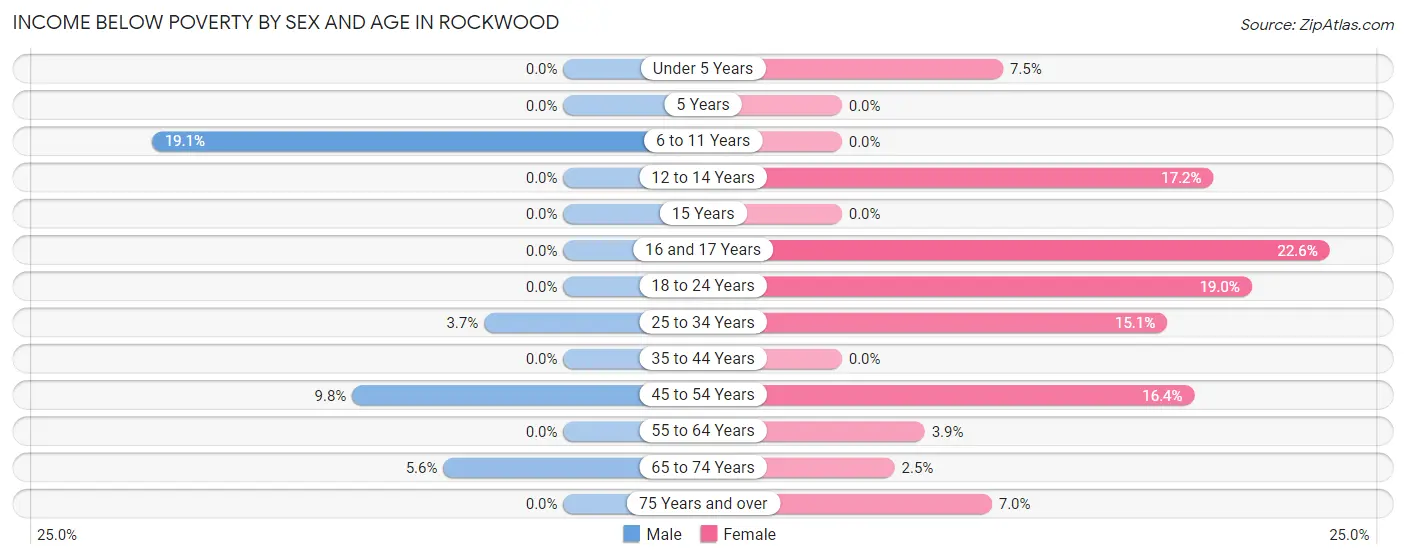
| Age Bracket | Male | Female |
| Under 5 Years | 0 (0.0%) | 24 (7.5%) |
| 5 Years | 0 (0.0%) | 0 (0.0%) |
| 6 to 11 Years | 51 (19.1%) | 0 (0.0%) |
| 12 to 14 Years | 0 (0.0%) | 25 (17.2%) |
| 15 Years | 0 (0.0%) | 0 (0.0%) |
| 16 and 17 Years | 0 (0.0%) | 31 (22.6%) |
| 18 to 24 Years | 0 (0.0%) | 74 (19.0%) |
| 25 to 34 Years | 14 (3.7%) | 83 (15.1%) |
| 35 to 44 Years | 0 (0.0%) | 0 (0.0%) |
| 45 to 54 Years | 34 (9.8%) | 106 (16.4%) |
| 55 to 64 Years | 0 (0.0%) | 22 (3.8%) |
| 65 to 74 Years | 27 (5.6%) | 16 (2.5%) |
| 75 Years and over | 0 (0.0%) | 24 (7.0%) |
| Total | 126 (3.5%) | 405 (9.2%) |
Income Above Poverty by Sex and Age in Rockwood
According to the poverty statistics in Rockwood, males aged under 5 years and females aged 5 years are the age groups that are most secure financially, with 100.0% of males and 100.0% of females in these age groups living above the poverty line.
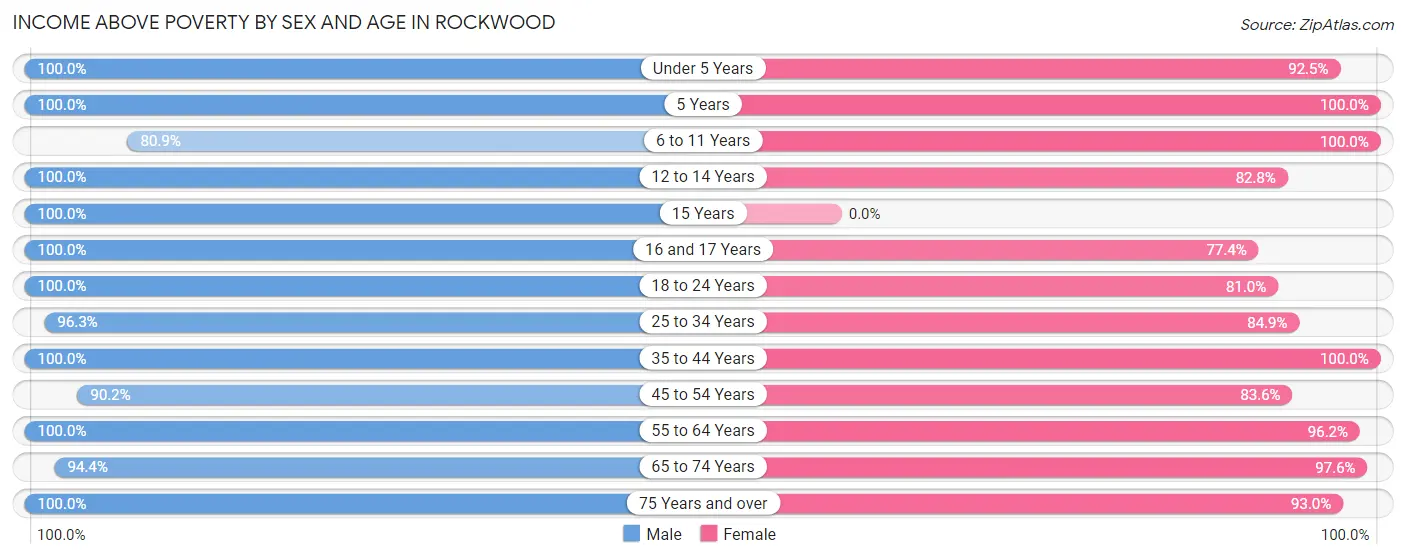
| Age Bracket | Male | Female |
| Under 5 Years | 249 (100.0%) | 297 (92.5%) |
| 5 Years | 50 (100.0%) | 62 (100.0%) |
| 6 to 11 Years | 216 (80.9%) | 80 (100.0%) |
| 12 to 14 Years | 40 (100.0%) | 120 (82.8%) |
| 15 Years | 15 (100.0%) | 0 (0.0%) |
| 16 and 17 Years | 106 (100.0%) | 106 (77.4%) |
| 18 to 24 Years | 127 (100.0%) | 315 (81.0%) |
| 25 to 34 Years | 366 (96.3%) | 467 (84.9%) |
| 35 to 44 Years | 561 (100.0%) | 507 (100.0%) |
| 45 to 54 Years | 313 (90.2%) | 542 (83.6%) |
| 55 to 64 Years | 648 (100.0%) | 550 (96.2%) |
| 65 to 74 Years | 458 (94.4%) | 638 (97.6%) |
| 75 Years and over | 308 (100.0%) | 321 (93.0%) |
| Total | 3,457 (96.5%) | 4,005 (90.8%) |
Income Below Poverty Among Married-Couple Families in Rockwood
The poverty statistics for married-couple families in Rockwood show that 0.5% or 9 of the total 1,849 families live below the poverty line. Families with 1 or 2 children have the highest poverty rate of 1.8%, comprising of 9 families. On the other hand, families with no children have the lowest poverty rate of 0.0%, which includes 0 families.
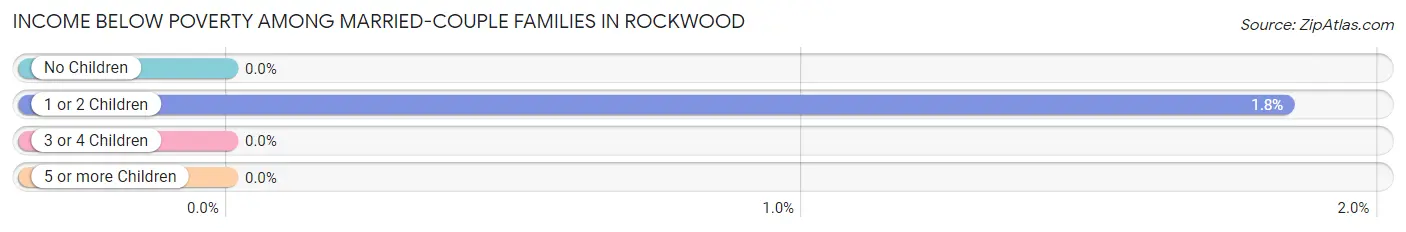
| Children | Above Poverty | Below Poverty |
| No Children | 1,288 (100.0%) | 0 (0.0%) |
| 1 or 2 Children | 481 (98.2%) | 9 (1.8%) |
| 3 or 4 Children | 71 (100.0%) | 0 (0.0%) |
| 5 or more Children | 0 (0.0%) | 0 (0.0%) |
| Total | 1,840 (99.5%) | 9 (0.5%) |
Income Below Poverty Among Single-Parent Households in Rockwood
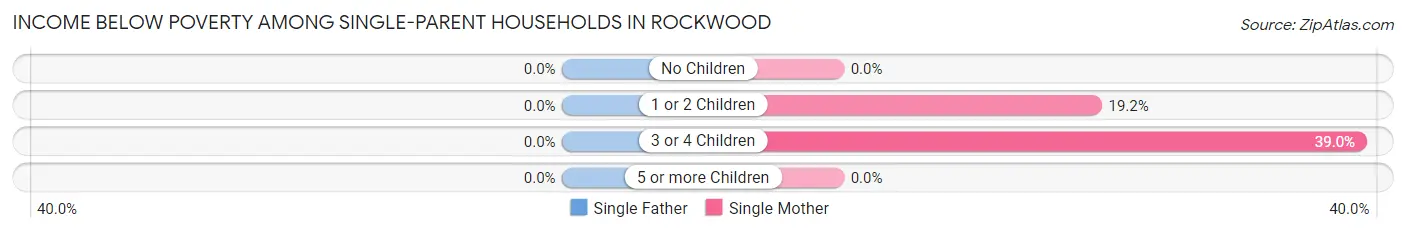
| Children | Single Father | Single Mother |
| No Children | 0 (0.0%) | 0 (0.0%) |
| 1 or 2 Children | 0 (0.0%) | 44 (19.2%) |
| 3 or 4 Children | 0 (0.0%) | 23 (39.0%) |
| 5 or more Children | 0 (0.0%) | 0 (0.0%) |
| Total | 0 (0.0%) | 67 (14.9%) |
Income Below Poverty Among Married-Couple vs Single-Parent Households in Rockwood
The poverty data for Rockwood shows that 9 of the married-couple family households (0.5%) and 67 of the single-parent households (12.6%) are living below the poverty level. Within the married-couple family households, those with 1 or 2 children have the highest poverty rate, with 9 households (1.8%) falling below the poverty line. Among the single-parent households, those with 3 or 4 children have the highest poverty rate, with 23 household (39.0%) living below poverty.
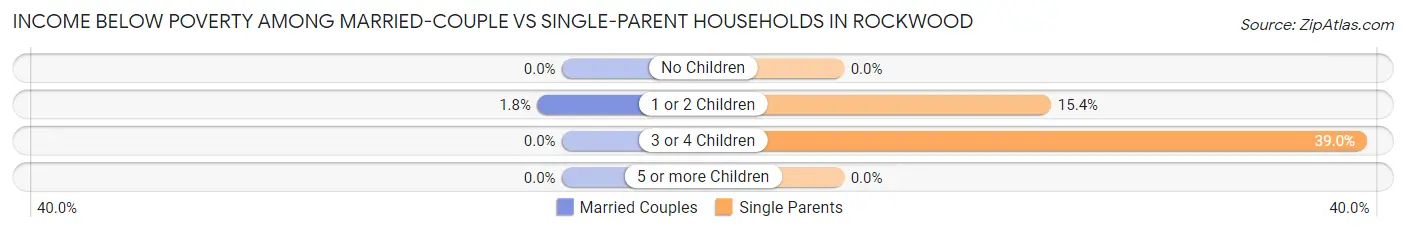
| Children | Married-Couple Families | Single-Parent Households |
| No Children | 0 (0.0%) | 0 (0.0%) |
| 1 or 2 Children | 9 (1.8%) | 44 (15.4%) |
| 3 or 4 Children | 0 (0.0%) | 23 (39.0%) |
| 5 or more Children | 0 (0.0%) | 0 (0.0%) |
| Total | 9 (0.5%) | 67 (12.6%) |
Race in Rockwood
The most populous races in Rockwood are White / Caucasian (5,752 | 71.2%), Black / African American (1,451 | 18.0%), and Two or more Races (408 | 5.1%).
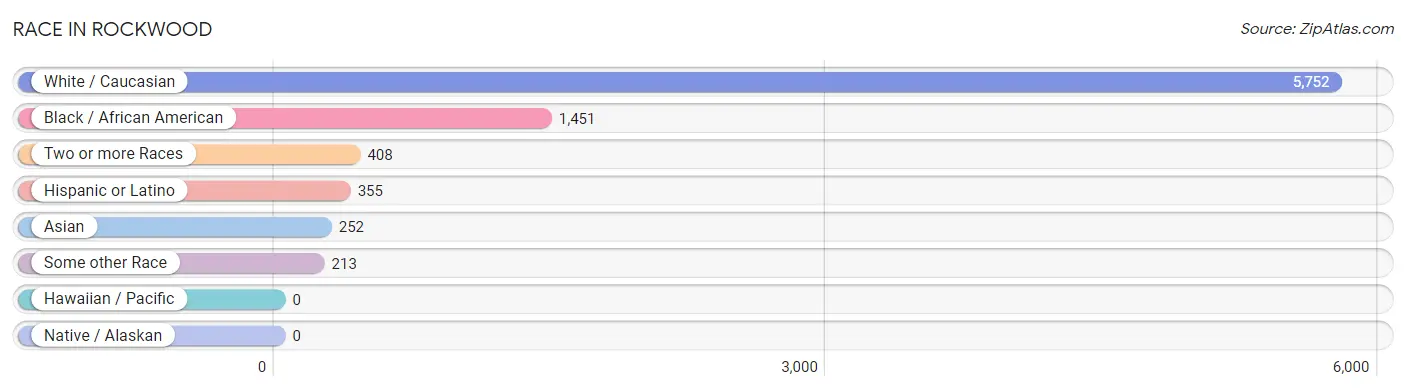
| Race | # Population | % Population |
| Asian | 252 | 3.1% |
| Black / African American | 1,451 | 18.0% |
| Hawaiian / Pacific | 0 | 0.0% |
| Hispanic or Latino | 355 | 4.4% |
| Native / Alaskan | 0 | 0.0% |
| White / Caucasian | 5,752 | 71.2% |
| Two or more Races | 408 | 5.1% |
| Some other Race | 213 | 2.6% |
| Total | 8,076 | 100.0% |
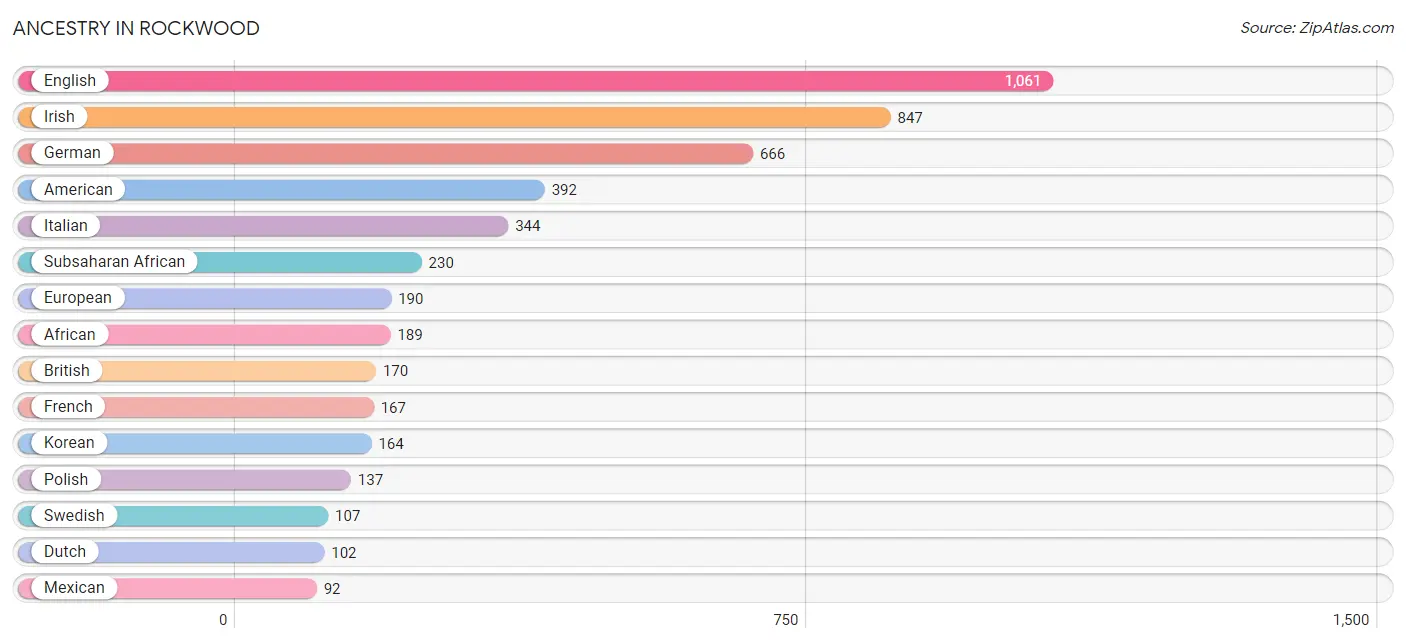
Ancestry in Rockwood
The most populous ancestries reported in Rockwood are English (1,061 | 13.1%), Irish (847 | 10.5%), German (666 | 8.3%), American (392 | 4.9%), and Italian (344 | 4.3%), together accounting for 41.0% of all Rockwood residents.
| Ancestry | # Population | % Population |
| African | 189 | 2.3% |
| American | 392 | 4.9% |
| Arab | 65 | 0.8% |
| Argentinean | 15 | 0.2% |
| Austrian | 27 | 0.3% |
| Bhutanese | 30 | 0.4% |
| British | 170 | 2.1% |
| Burmese | 38 | 0.5% |
| Central American | 54 | 0.7% |
| Colombian | 26 | 0.3% |
| Croatian | 11 | 0.1% |
| Cuban | 35 | 0.4% |
| Danish | 81 | 1.0% |
| Dominican | 38 | 0.5% |
| Dutch | 102 | 1.3% |
| Eastern European | 11 | 0.1% |
| English | 1,061 | 13.1% |
| Ethiopian | 1 | 0.0% |
| European | 190 | 2.4% |
| French | 167 | 2.1% |
| French Canadian | 37 | 0.5% |
| German | 666 | 8.3% |
| Greek | 19 | 0.2% |
| Guyanese | 9 | 0.1% |
| Hungarian | 11 | 0.1% |
| Indian (Asian) | 73 | 0.9% |
| Iraqi | 11 | 0.1% |
| Irish | 847 | 10.5% |
| Italian | 344 | 4.3% |
| Jamaican | 72 | 0.9% |
| Korean | 164 | 2.0% |
| Latvian | 9 | 0.1% |
| Lebanese | 54 | 0.7% |
| Malaysian | 31 | 0.4% |
| Mexican | 92 | 1.1% |
| Navajo | 7 | 0.1% |
| Nigerian | 8 | 0.1% |
| Norwegian | 11 | 0.1% |
| Pakistani | 7 | 0.1% |
| Peruvian | 21 | 0.3% |
| Polish | 137 | 1.7% |
| Puerto Rican | 48 | 0.6% |
| Russian | 15 | 0.2% |
| Salvadoran | 54 | 0.7% |
| Scotch-Irish | 18 | 0.2% |
| Scottish | 67 | 0.8% |
| Slovak | 10 | 0.1% |
| South African | 26 | 0.3% |
| South American | 62 | 0.8% |
| Spanish | 8 | 0.1% |
| Sri Lankan | 19 | 0.2% |
| Subsaharan African | 230 | 2.9% |
| Swedish | 107 | 1.3% |
| Thai | 15 | 0.2% |
| Turkish | 11 | 0.1% |
| Ukrainian | 7 | 0.1% |
| Welsh | 48 | 0.6% | View All 57 Rows |
Immigrants in Rockwood
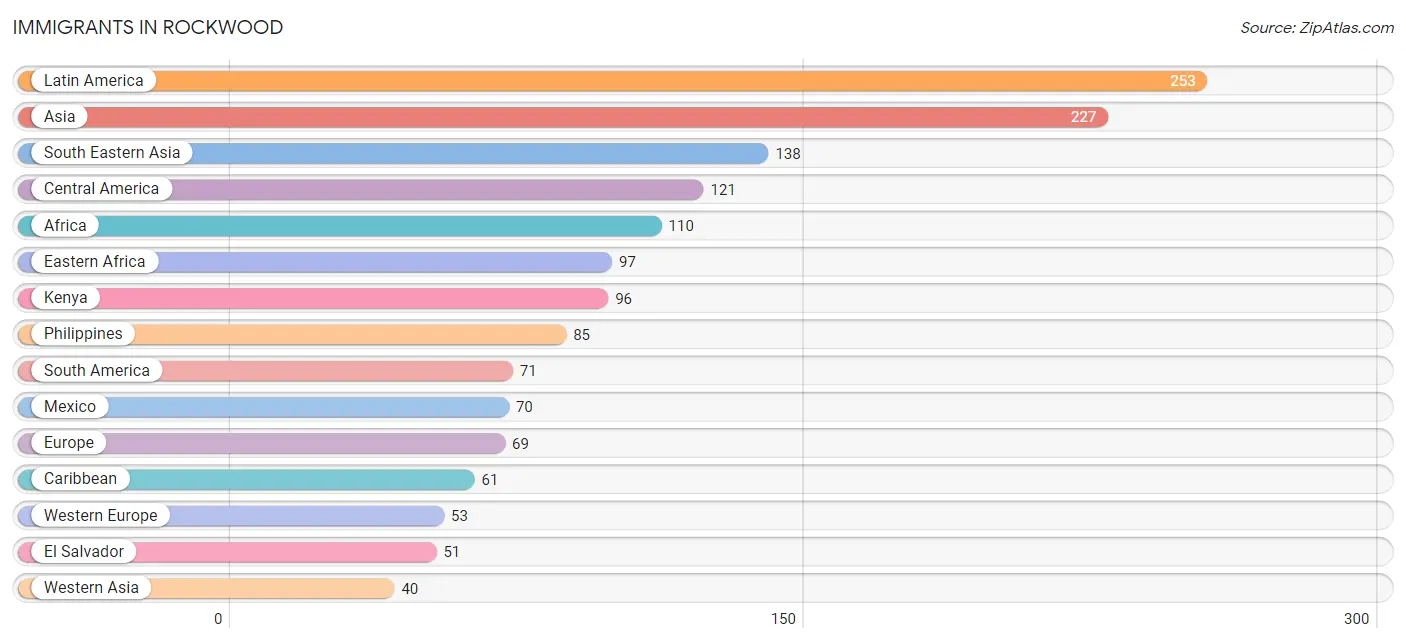
The most numerous immigrant groups reported in Rockwood came from Latin America (253 | 3.1%), Asia (227 | 2.8%), South Eastern Asia (138 | 1.7%), Central America (121 | 1.5%), and Africa (110 | 1.4%), together accounting for 10.5% of all Rockwood residents.
| Immigration Origin | # Population | % Population |
| Africa | 110 | 1.4% |
| Argentina | 15 | 0.2% |
| Asia | 227 | 2.8% |
| Austria | 8 | 0.1% |
| Brazil | 27 | 0.3% |
| Canada | 15 | 0.2% |
| Caribbean | 61 | 0.8% |
| Central America | 121 | 1.5% |
| Colombia | 9 | 0.1% |
| Cuba | 9 | 0.1% |
| Dominican Republic | 38 | 0.5% |
| Eastern Africa | 97 | 1.2% |
| Eastern Asia | 38 | 0.5% |
| El Salvador | 51 | 0.6% |
| Ethiopia | 1 | 0.0% |
| Europe | 69 | 0.9% |
| Germany | 31 | 0.4% |
| India | 11 | 0.1% |
| Iraq | 11 | 0.1% |
| Jamaica | 14 | 0.2% |
| Kenya | 96 | 1.2% |
| Korea | 38 | 0.5% |
| Laos | 14 | 0.2% |
| Latin America | 253 | 3.1% |
| Lebanon | 29 | 0.4% |
| Mexico | 70 | 0.9% |
| Netherlands | 14 | 0.2% |
| Northern Europe | 12 | 0.2% |
| Peru | 20 | 0.3% |
| Philippines | 85 | 1.1% |
| Singapore | 17 | 0.2% |
| South Africa | 13 | 0.2% |
| South America | 71 | 0.9% |
| South Central Asia | 11 | 0.1% |
| South Eastern Asia | 138 | 1.7% |
| Southern Europe | 4 | 0.1% |
| Spain | 4 | 0.1% |
| Thailand | 7 | 0.1% |
| Vietnam | 15 | 0.2% |
| Western Asia | 40 | 0.5% |
| Western Europe | 53 | 0.7% | View All 41 Rows |
Sex and Age in Rockwood
Sex and Age in Rockwood
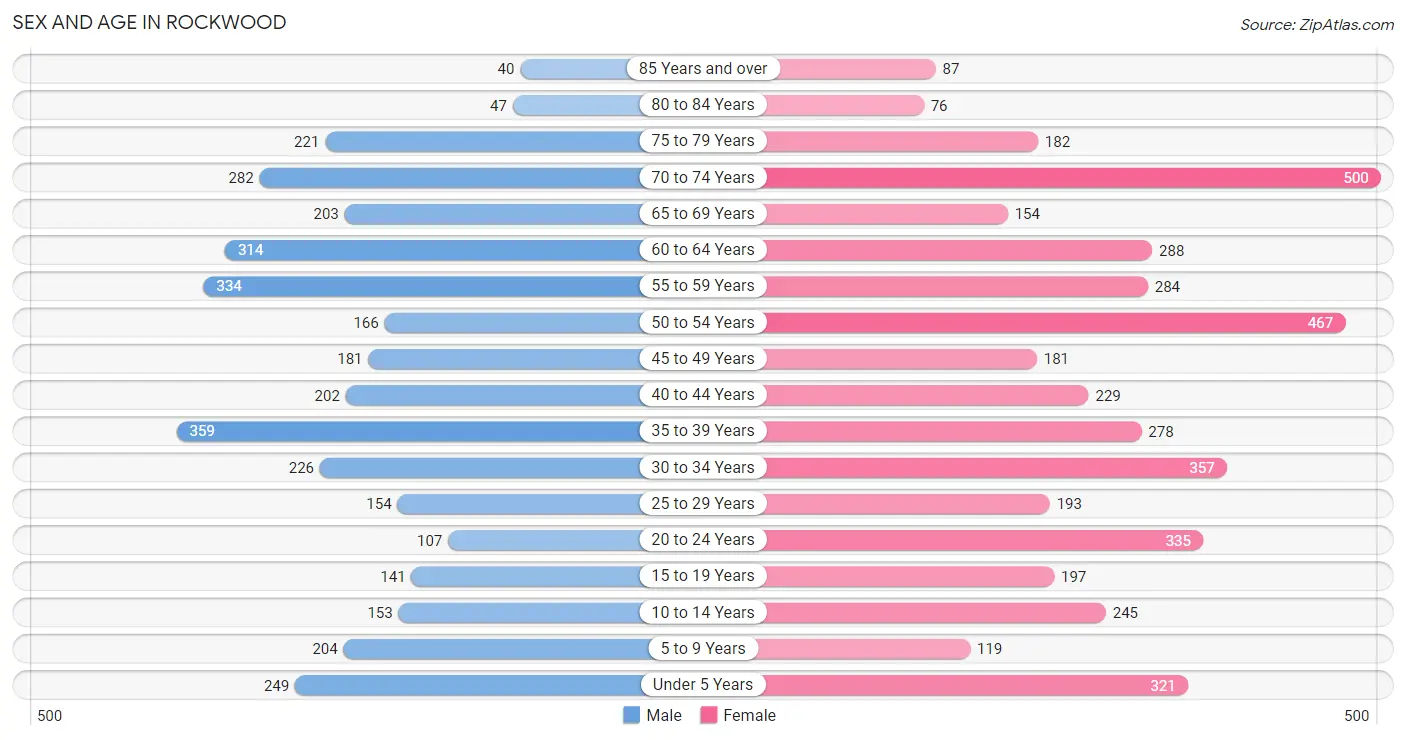
The most populous age groups in Rockwood are 35 to 39 Years (359 | 10.0%) for men and 70 to 74 Years (500 | 11.1%) for women.
| Age Bracket | Male | Female |
| Under 5 Years | 249 (7.0%) | 321 (7.1%) |
| 5 to 9 Years | 204 (5.7%) | 119 (2.6%) |
| 10 to 14 Years | 153 (4.3%) | 245 (5.4%) |
| 15 to 19 Years | 141 (3.9%) | 197 (4.4%) |
| 20 to 24 Years | 107 (3.0%) | 335 (7.5%) |
| 25 to 29 Years | 154 (4.3%) | 193 (4.3%) |
| 30 to 34 Years | 226 (6.3%) | 357 (8.0%) |
| 35 to 39 Years | 359 (10.0%) | 278 (6.2%) |
| 40 to 44 Years | 202 (5.6%) | 229 (5.1%) |
| 45 to 49 Years | 181 (5.1%) | 181 (4.0%) |
| 50 to 54 Years | 166 (4.6%) | 467 (10.4%) |
| 55 to 59 Years | 334 (9.3%) | 284 (6.3%) |
| 60 to 64 Years | 314 (8.8%) | 288 (6.4%) |
| 65 to 69 Years | 203 (5.7%) | 154 (3.4%) |
| 70 to 74 Years | 282 (7.9%) | 500 (11.1%) |
| 75 to 79 Years | 221 (6.2%) | 182 (4.1%) |
| 80 to 84 Years | 47 (1.3%) | 76 (1.7%) |
| 85 Years and over | 40 (1.1%) | 87 (1.9%) |
| Total | 3,583 (100.0%) | 4,493 (100.0%) |
Families and Households in Rockwood
Median Family Size in Rockwood
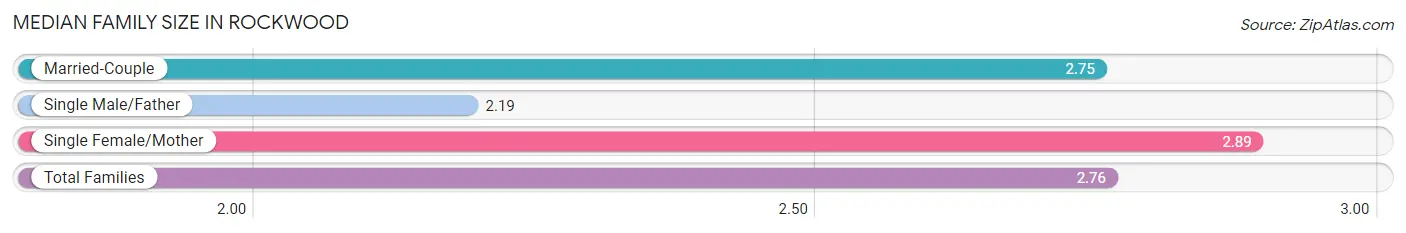
The median family size in Rockwood is 2.76 persons per family, with single female/mother families (451 | 18.9%) accounting for the largest median family size of 2.89 persons per family. On the other hand, single male/father families (83 | 3.5%) represent the smallest median family size with 2.19 persons per family.
| Family Type | # Families | Family Size |
| Married-Couple | 1,849 (77.6%) | 2.75 |
| Single Male/Father | 83 (3.5%) | 2.19 |
| Single Female/Mother | 451 (18.9%) | 2.89 |
| Total Families | 2,383 (100.0%) | 2.76 |
Median Household Size in Rockwood
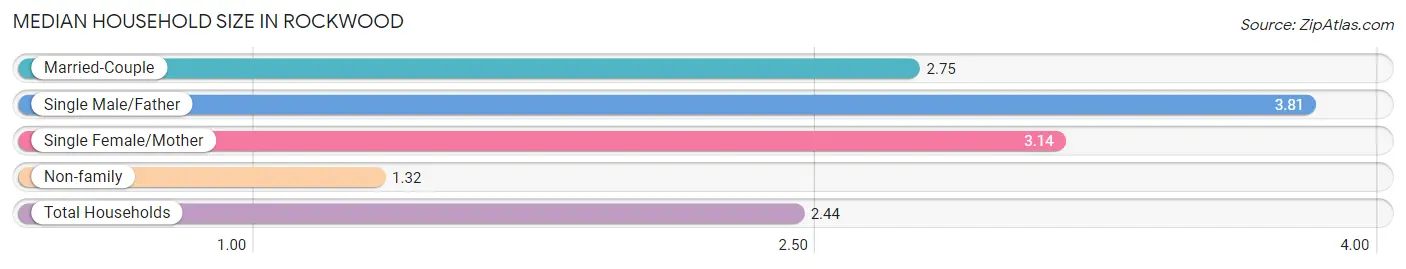
The median household size in Rockwood is 2.44 persons per household, with single male/father households (83 | 2.5%) accounting for the largest median household size of 3.81 persons per household. non-family households (909 | 27.6%) represent the smallest median household size with 1.32 persons per household.
| Household Type | # Households | Household Size |
| Married-Couple | 1,849 (56.2%) | 2.75 |
| Single Male/Father | 83 (2.5%) | 3.81 |
| Single Female/Mother | 451 (13.7%) | 3.14 |
| Non-family | 909 (27.6%) | 1.32 |
| Total Households | 3,292 (100.0%) | 2.44 |
Household Size by Marriage Status in Rockwood
Out of a total of 3,292 households in Rockwood, 2,383 (72.4%) are family households, while 909 (27.6%) are nonfamily households. The most numerous type of family households are 2-person households, comprising 1,273, and the most common type of nonfamily households are 1-person households, comprising 654.
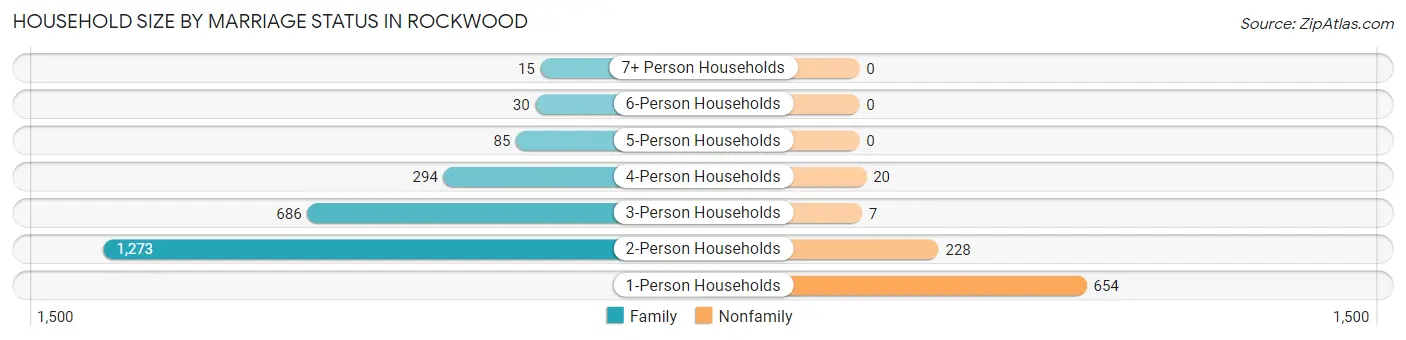
| Household Size | Family Households | Nonfamily Households |
| 1-Person Households | - | 654 (19.9%) |
| 2-Person Households | 1,273 (38.7%) | 228 (6.9%) |
| 3-Person Households | 686 (20.8%) | 7 (0.2%) |
| 4-Person Households | 294 (8.9%) | 20 (0.6%) |
| 5-Person Households | 85 (2.6%) | 0 (0.0%) |
| 6-Person Households | 30 (0.9%) | 0 (0.0%) |
| 7+ Person Households | 15 (0.5%) | 0 (0.0%) |
| Total | 2,383 (72.4%) | 909 (27.6%) |
Female Fertility in Rockwood
Fertility by Age in Rockwood
Average fertility rate in Rockwood is 30.0 births per 1,000 women. Women in the age bracket of 20 to 34 years have the highest fertility rate with 52.0 births per 1,000 women. Women in the age bracket of 20 to 34 years acount for 79.3% of all women with births.
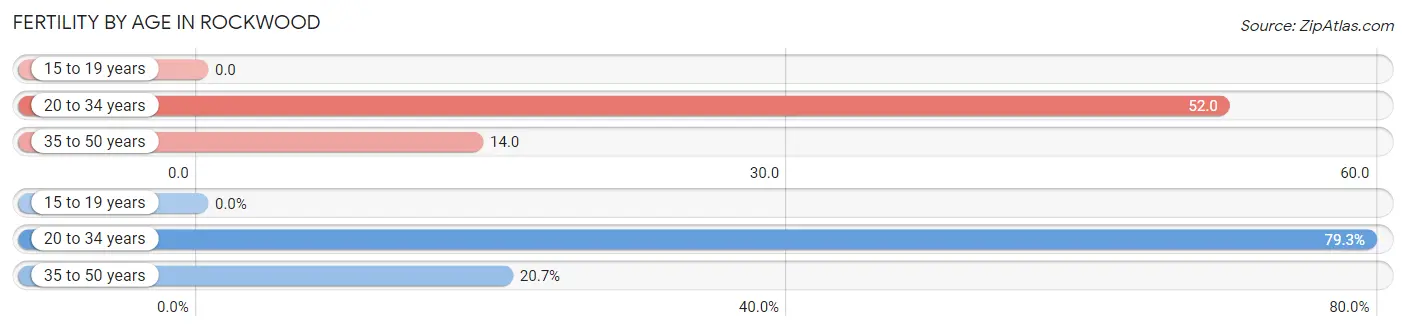
| Age Bracket | Women with Births | Births / 1,000 Women |
| 15 to 19 years | 0 (0.0%) | 0.0 |
| 20 to 34 years | 46 (79.3%) | 52.0 |
| 35 to 50 years | 12 (20.7%) | 14.0 |
| Total | 58 (100.0%) | 30.0 |
Fertility by Age by Marriage Status in Rockwood
46.6% of women with births (58) in Rockwood are married. The highest percentage of unmarried women with births falls into 20 to 34 years age bracket with 67.4% of them unmarried at the time of birth, while the lowest percentage of unmarried women with births belong to 35 to 50 years age bracket with 0.0% of them unmarried.

| Age Bracket | Married | Unmarried |
| 15 to 19 years | 0 (0.0%) | 0 (0.0%) |
| 20 to 34 years | 15 (32.6%) | 31 (67.4%) |
| 35 to 50 years | 12 (100.0%) | 0 (0.0%) |
| Total | 27 (46.6%) | 31 (53.4%) |
Fertility by Education in Rockwood
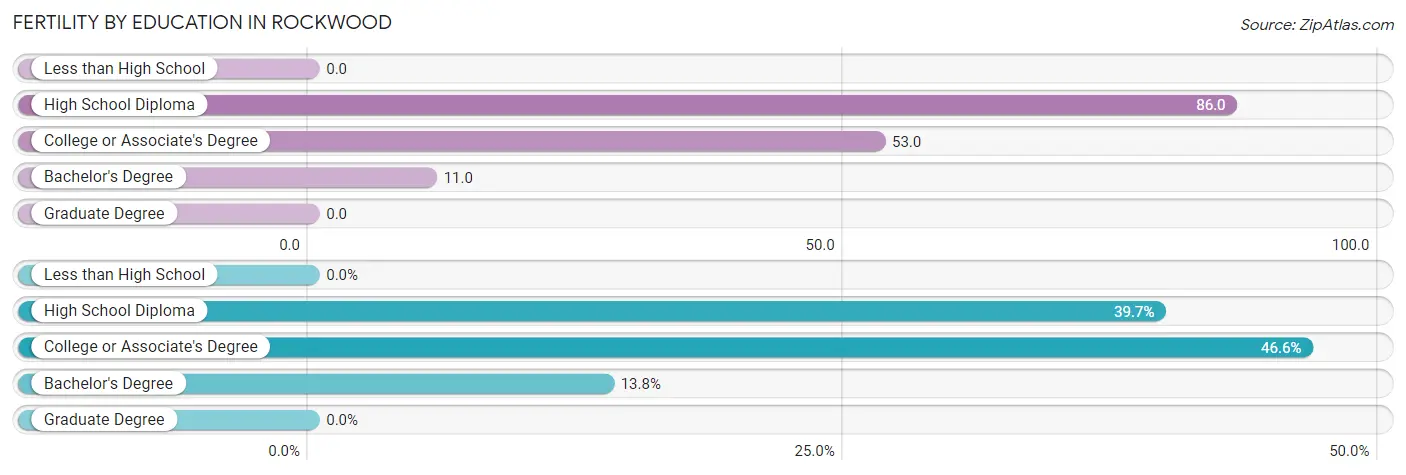
| Educational Attainment | Women with Births | Births / 1,000 Women |
| Less than High School | 0 (0.0%) | 0.0 |
| High School Diploma | 23 (39.7%) | 86.0 |
| College or Associate's Degree | 27 (46.6%) | 53.0 |
| Bachelor's Degree | 8 (13.8%) | 11.0 |
| Graduate Degree | 0 (0.0%) | 0.0 |
| Total | 58 (100.0%) | 30.0 |
Fertility by Education by Marriage Status in Rockwood
53.4% of women with births in Rockwood are unmarried. Women with the educational attainment of college or associate's degree are most likely to be married with 100.0% of them married at childbirth, while women with the educational attainment of high school diploma are least likely to be married with 100.0% of them unmarried at childbirth.
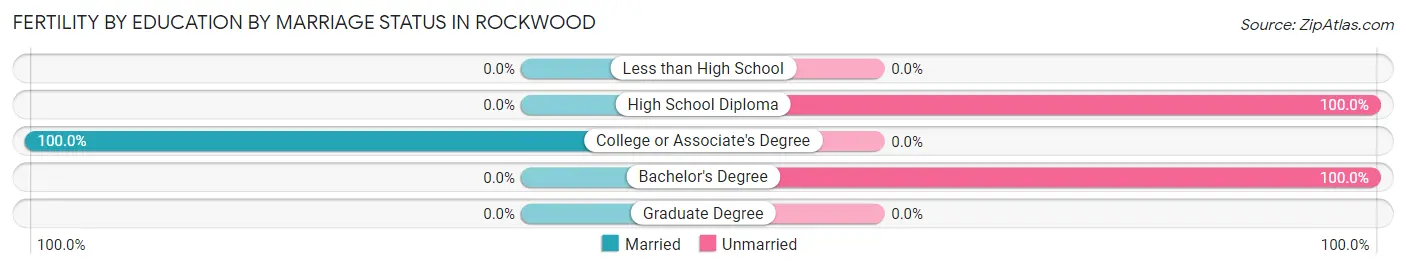
| Educational Attainment | Married | Unmarried |
| Less than High School | 0 (0.0%) | 0 (0.0%) |
| High School Diploma | 0 (0.0%) | 23 (100.0%) |
| College or Associate's Degree | 27 (100.0%) | 0 (0.0%) |
| Bachelor's Degree | 0 (0.0%) | 8 (100.0%) |
| Graduate Degree | 0 (0.0%) | 0 (0.0%) |
| Total | 27 (46.6%) | 31 (53.4%) |
Employment Characteristics in Rockwood
Employment by Class of Employer in Rockwood
Among the 3,935 employed individuals in Rockwood, private company employees (2,687 | 68.3%), local government employees (306 | 7.8%), and not-for-profit organizations (228 | 5.8%) make up the most common classes of employment.
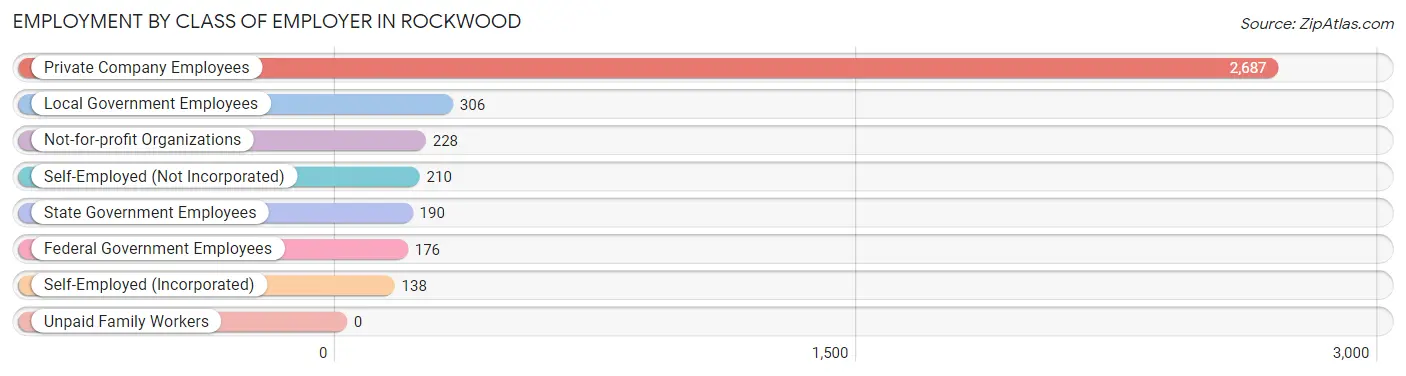
| Employer Class | # Employees | % Employees |
| Private Company Employees | 2,687 | 68.3% |
| Self-Employed (Incorporated) | 138 | 3.5% |
| Self-Employed (Not Incorporated) | 210 | 5.3% |
| Not-for-profit Organizations | 228 | 5.8% |
| Local Government Employees | 306 | 7.8% |
| State Government Employees | 190 | 4.8% |
| Federal Government Employees | 176 | 4.5% |
| Unpaid Family Workers | 0 | 0.0% |
| Total | 3,935 | 100.0% |
Employment Status by Age in Rockwood
According to the labor force statistics for Rockwood, out of the total population over 16 years of age (6,766), 61.7% or 4,175 individuals are in the labor force, with 4.5% or 188 of them unemployed. The age group with the highest labor force participation rate is 30 to 34 years, with 92.5% or 539 individuals in the labor force. Within the labor force, the 16 to 19 years age range has the highest percentage of unemployed individuals, with 31.6% or 25 of them being unemployed.
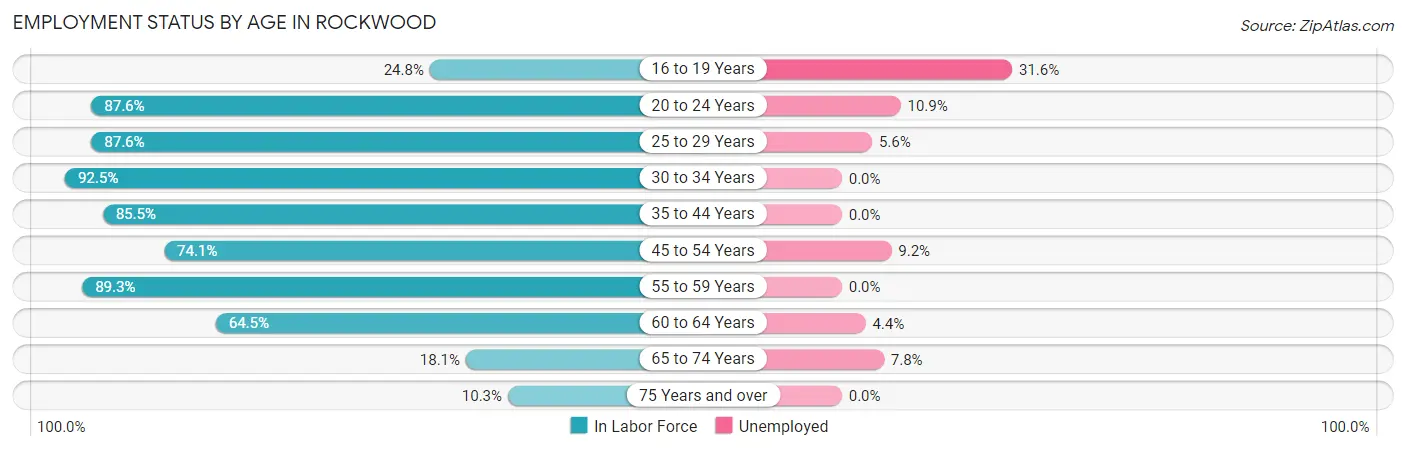
| Age Bracket | In Labor Force | Unemployed |
| 16 to 19 Years | 79 (24.8%) | 25 (31.6%) |
| 20 to 24 Years | 387 (87.6%) | 42 (10.9%) |
| 25 to 29 Years | 304 (87.6%) | 17 (5.6%) |
| 30 to 34 Years | 539 (92.5%) | 0 (0.0%) |
| 35 to 44 Years | 913 (85.5%) | 0 (0.0%) |
| 45 to 54 Years | 737 (74.1%) | 68 (9.2%) |
| 55 to 59 Years | 552 (89.3%) | 0 (0.0%) |
| 60 to 64 Years | 388 (64.5%) | 17 (4.4%) |
| 65 to 74 Years | 206 (18.1%) | 16 (7.8%) |
| 75 Years and over | 67 (10.3%) | 0 (0.0%) |
| Total | 4,175 (61.7%) | 188 (4.5%) |
Employment Status by Educational Attainment in Rockwood
According to labor force statistics for Rockwood, 81.5% of individuals (3,434) out of the total population between 25 and 64 years of age (4,213) are in the labor force, with 3.0% or 103 of them being unemployed. The group with the highest labor force participation rate are those with the educational attainment of high school diploma, with 87.1% or 716 individuals in the labor force. Within the labor force, individuals with college / associate degree education have the highest percentage of unemployment, with 10.3% or 98 of them being unemployed.
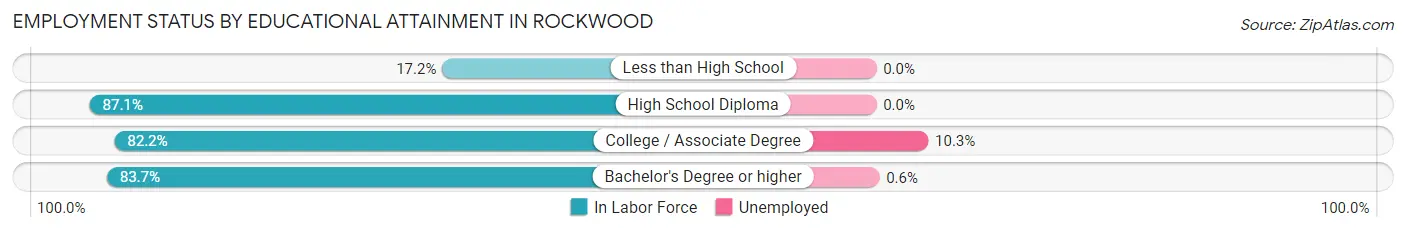
| Educational Attainment | In Labor Force | Unemployed |
| Less than High School | 27 (17.2%) | 0 (0.0%) |
| High School Diploma | 716 (87.1%) | 0 (0.0%) |
| College / Associate Degree | 948 (82.2%) | 119 (10.3%) |
| Bachelor's Degree or higher | 1,742 (83.7%) | 12 (0.6%) |
| Total | 3,434 (81.5%) | 126 (3.0%) |
Employment Occupations by Sex in Rockwood
Management, Business, Science and Arts Occupations
The most common Management, Business, Science and Arts occupations in Rockwood are Business & Financial (553 | 14.1%), Community & Social Service (460 | 11.7%), Management (399 | 10.2%), Education Instruction & Library (294 | 7.5%), and Health Diagnosing & Treating (293 | 7.4%).
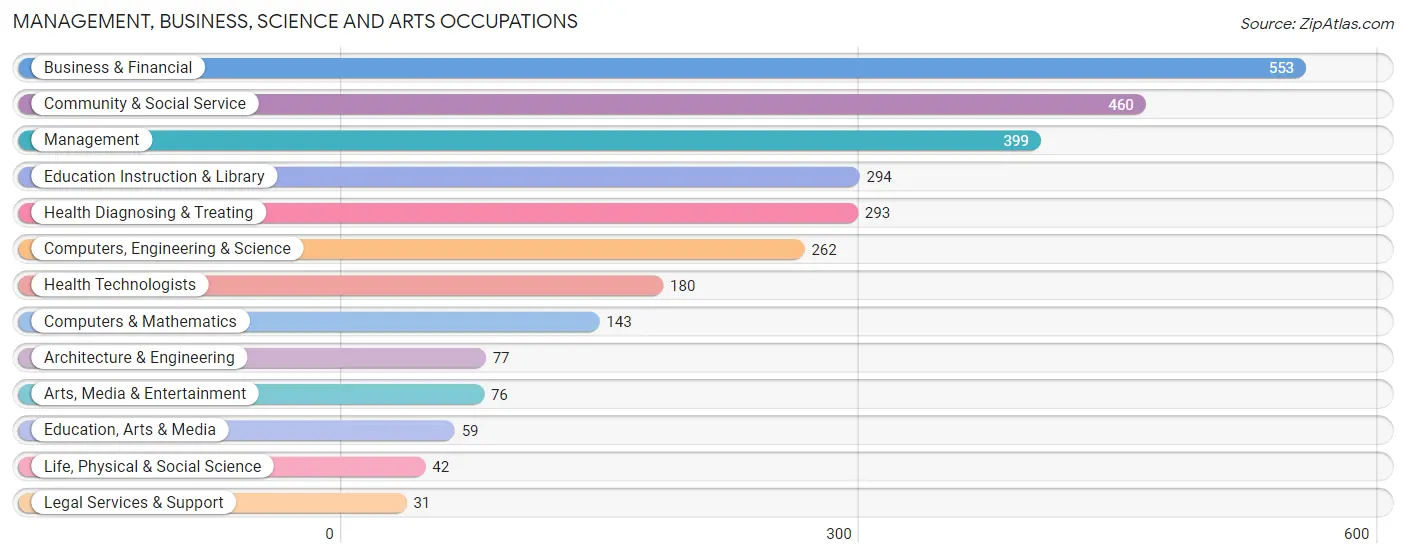
Management, Business, Science and Arts Occupations by Sex
Within the Management, Business, Science and Arts occupations in Rockwood, the most male-oriented occupations are Architecture & Engineering (100.0%), Computers & Mathematics (76.9%), and Computers, Engineering & Science (76.3%), while the most female-oriented occupations are Health Technologists (100.0%), Education Instruction & Library (74.2%), and Health Diagnosing & Treating (73.7%).
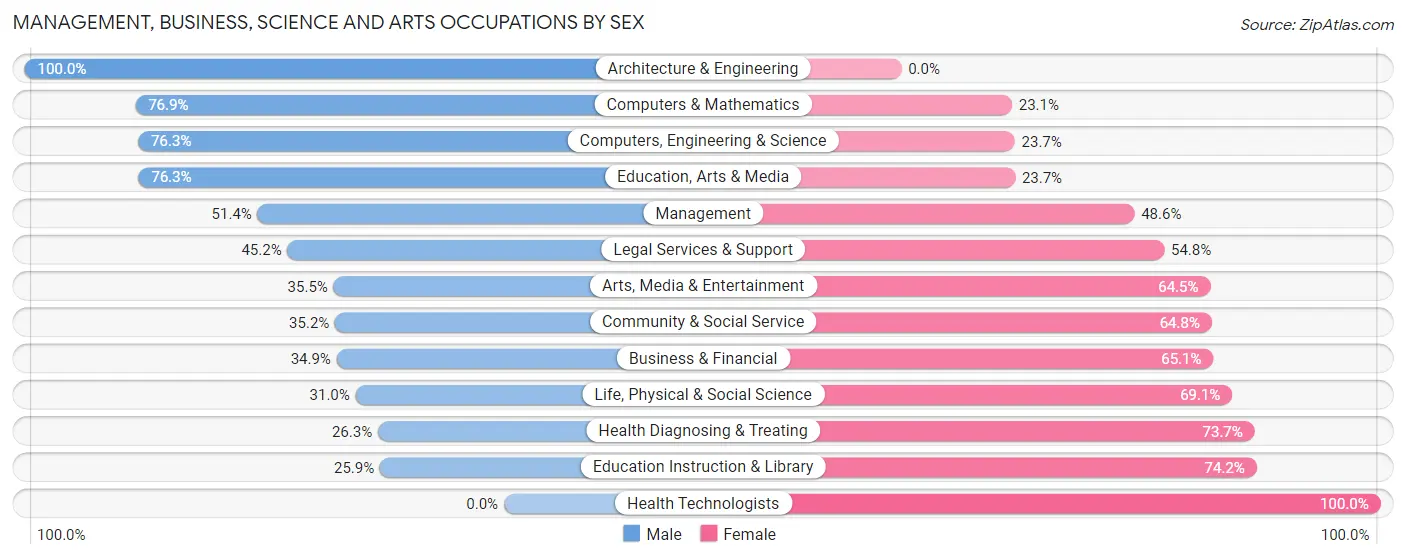
| Occupation | Male | Female |
| Management | 205 (51.4%) | 194 (48.6%) |
| Business & Financial | 193 (34.9%) | 360 (65.1%) |
| Computers, Engineering & Science | 200 (76.3%) | 62 (23.7%) |
| Computers & Mathematics | 110 (76.9%) | 33 (23.1%) |
| Architecture & Engineering | 77 (100.0%) | 0 (0.0%) |
| Life, Physical & Social Science | 13 (30.9%) | 29 (69.1%) |
| Community & Social Service | 162 (35.2%) | 298 (64.8%) |
| Education, Arts & Media | 45 (76.3%) | 14 (23.7%) |
| Legal Services & Support | 14 (45.2%) | 17 (54.8%) |
| Education Instruction & Library | 76 (25.9%) | 218 (74.2%) |
| Arts, Media & Entertainment | 27 (35.5%) | 49 (64.5%) |
| Health Diagnosing & Treating | 77 (26.3%) | 216 (73.7%) |
| Health Technologists | 0 (0.0%) | 180 (100.0%) |
| Total (Category) | 837 (42.5%) | 1,130 (57.5%) |
| Total (Overall) | 1,901 (48.4%) | 2,030 (51.6%) |
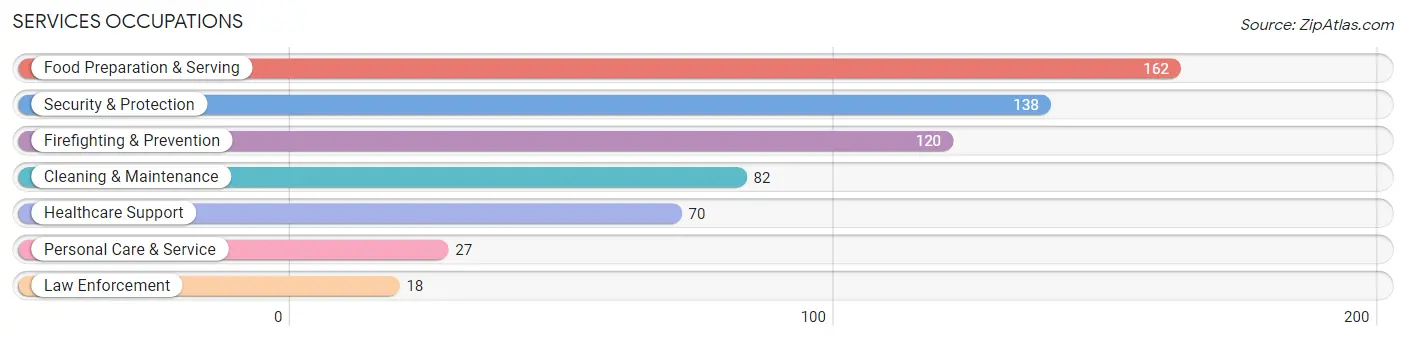
Services Occupations
The most common Services occupations in Rockwood are Food Preparation & Serving (162 | 4.1%), Security & Protection (138 | 3.5%), Firefighting & Prevention (120 | 3.0%), Cleaning & Maintenance (82 | 2.1%), and Healthcare Support (70 | 1.8%).
Services Occupations by Sex
Within the Services occupations in Rockwood, the most male-oriented occupations are Law Enforcement (100.0%), Security & Protection (92.7%), and Firefighting & Prevention (91.7%), while the most female-oriented occupations are Personal Care & Service (100.0%), Healthcare Support (71.4%), and Food Preparation & Serving (54.3%).
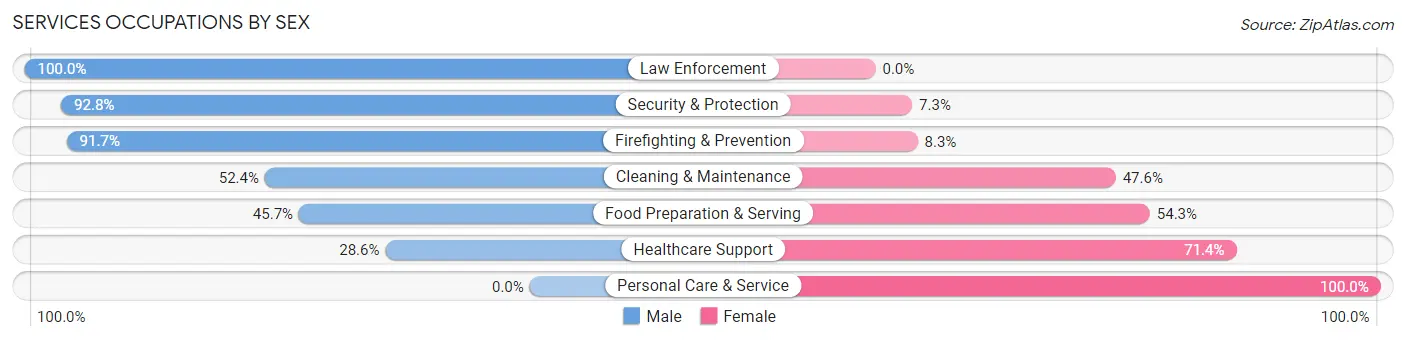
| Occupation | Male | Female |
| Healthcare Support | 20 (28.6%) | 50 (71.4%) |
| Security & Protection | 128 (92.7%) | 10 (7.2%) |
| Firefighting & Prevention | 110 (91.7%) | 10 (8.3%) |
| Law Enforcement | 18 (100.0%) | 0 (0.0%) |
| Food Preparation & Serving | 74 (45.7%) | 88 (54.3%) |
| Cleaning & Maintenance | 43 (52.4%) | 39 (47.6%) |
| Personal Care & Service | 0 (0.0%) | 27 (100.0%) |
| Total (Category) | 265 (55.3%) | 214 (44.7%) |
| Total (Overall) | 1,901 (48.4%) | 2,030 (51.6%) |
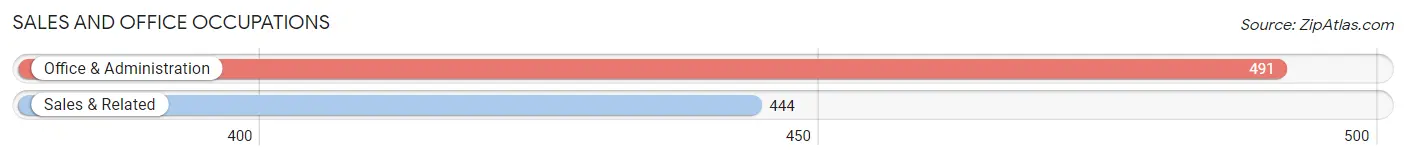
Sales and Office Occupations
The most common Sales and Office occupations in Rockwood are Office & Administration (491 | 12.5%), and Sales & Related (444 | 11.3%).
Sales and Office Occupations by Sex
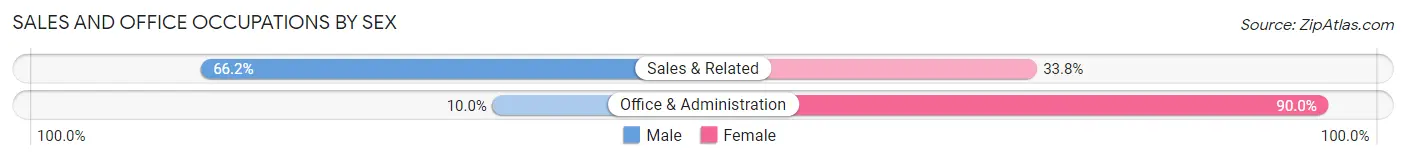
| Occupation | Male | Female |
| Sales & Related | 294 (66.2%) | 150 (33.8%) |
| Office & Administration | 49 (10.0%) | 442 (90.0%) |
| Total (Category) | 343 (36.7%) | 592 (63.3%) |
| Total (Overall) | 1,901 (48.4%) | 2,030 (51.6%) |
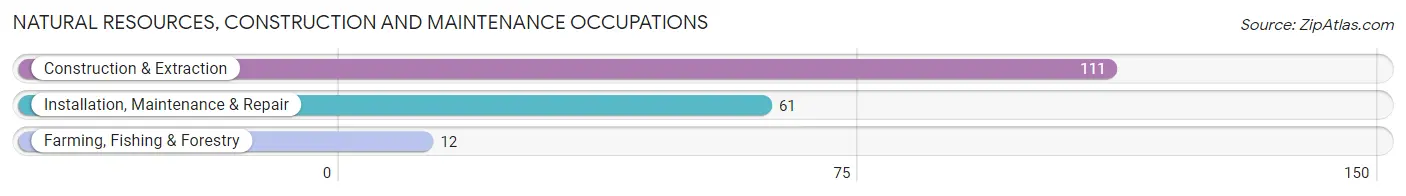
Natural Resources, Construction and Maintenance Occupations
The most common Natural Resources, Construction and Maintenance occupations in Rockwood are Construction & Extraction (111 | 2.8%), Installation, Maintenance & Repair (61 | 1.5%), and Farming, Fishing & Forestry (12 | 0.3%).
Natural Resources, Construction and Maintenance Occupations by Sex
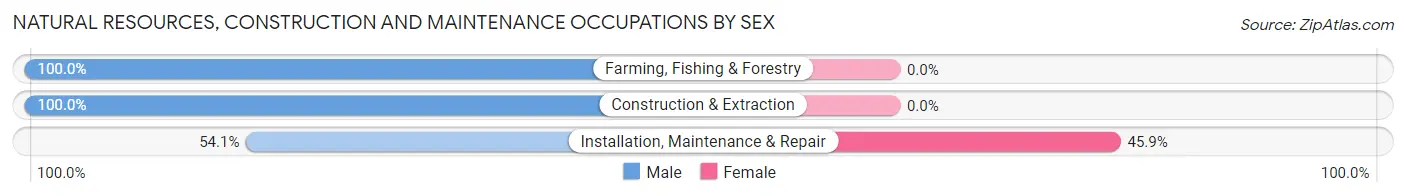
| Occupation | Male | Female |
| Farming, Fishing & Forestry | 12 (100.0%) | 0 (0.0%) |
| Construction & Extraction | 111 (100.0%) | 0 (0.0%) |
| Installation, Maintenance & Repair | 33 (54.1%) | 28 (45.9%) |
| Total (Category) | 156 (84.8%) | 28 (15.2%) |
| Total (Overall) | 1,901 (48.4%) | 2,030 (51.6%) |
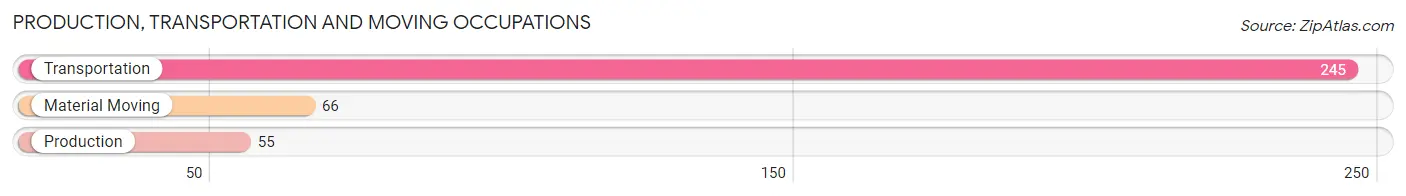
Production, Transportation and Moving Occupations
The most common Production, Transportation and Moving occupations in Rockwood are Transportation (245 | 6.2%), Material Moving (66 | 1.7%), and Production (55 | 1.4%).
Production, Transportation and Moving Occupations by Sex
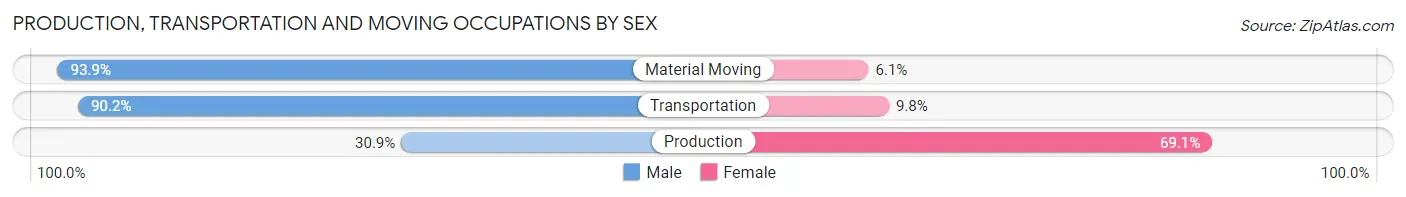
| Occupation | Male | Female |
| Production | 17 (30.9%) | 38 (69.1%) |
| Transportation | 221 (90.2%) | 24 (9.8%) |
| Material Moving | 62 (93.9%) | 4 (6.1%) |
| Total (Category) | 300 (82.0%) | 66 (18.0%) |
| Total (Overall) | 1,901 (48.4%) | 2,030 (51.6%) |
Employment Industries by Sex in Rockwood
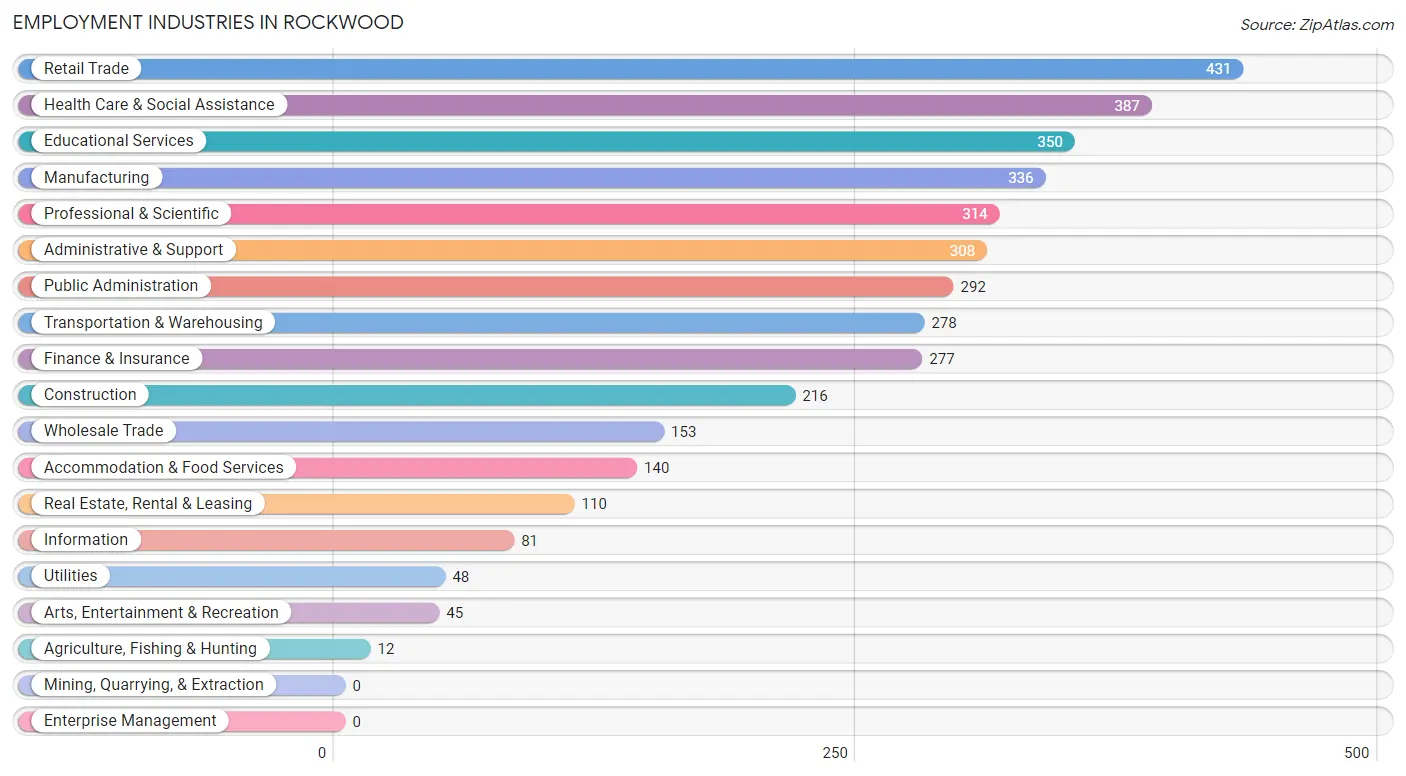
Employment Industries in Rockwood
The major employment industries in Rockwood include Retail Trade (431 | 11.0%), Health Care & Social Assistance (387 | 9.8%), Educational Services (350 | 8.9%), Manufacturing (336 | 8.6%), and Professional & Scientific (314 | 8.0%).
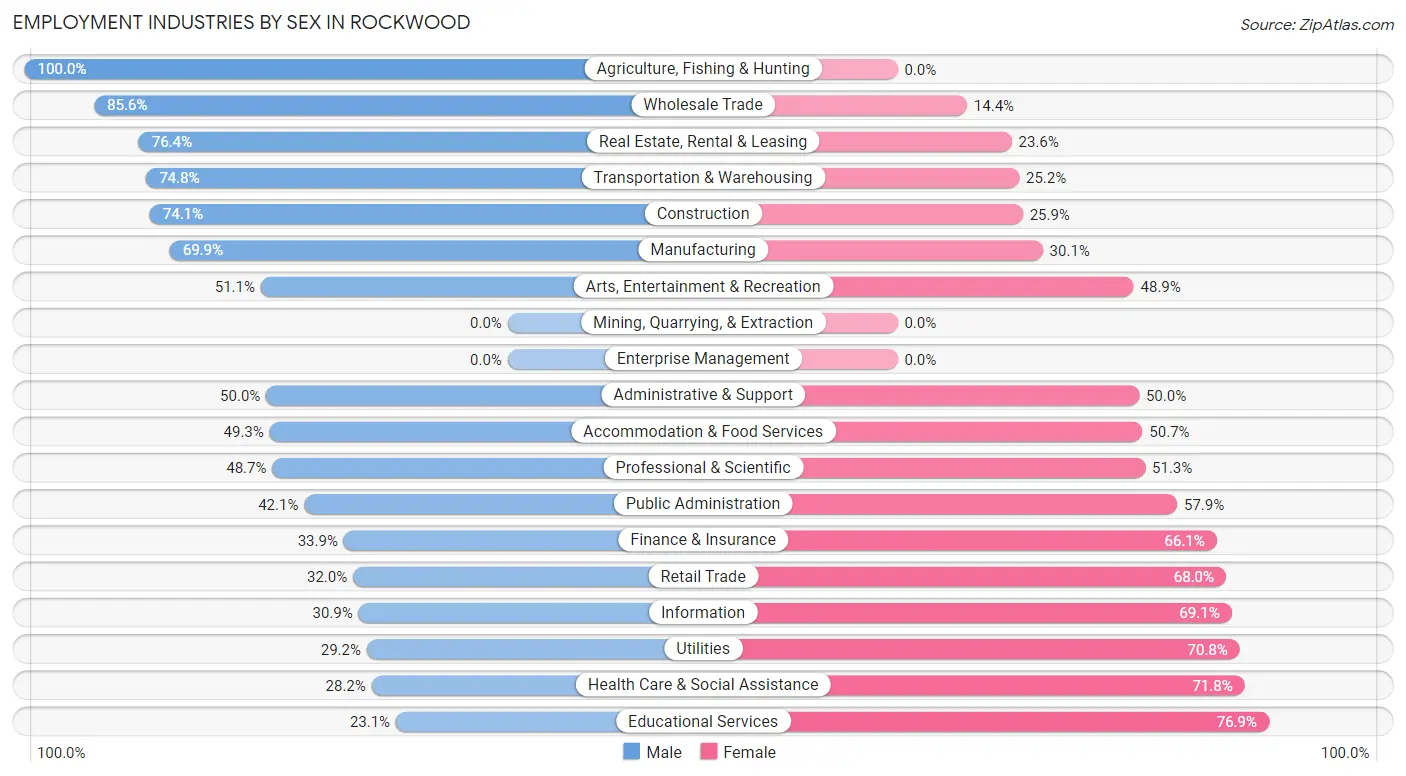
Employment Industries by Sex in Rockwood
The Rockwood industries that see more men than women are Agriculture, Fishing & Hunting (100.0%), Wholesale Trade (85.6%), and Real Estate, Rental & Leasing (76.4%), whereas the industries that tend to have a higher number of women are Educational Services (76.9%), Health Care & Social Assistance (71.8%), and Utilities (70.8%).
| Industry | Male | Female |
| Agriculture, Fishing & Hunting | 12 (100.0%) | 0 (0.0%) |
| Mining, Quarrying, & Extraction | 0 (0.0%) | 0 (0.0%) |
| Construction | 160 (74.1%) | 56 (25.9%) |
| Manufacturing | 235 (69.9%) | 101 (30.1%) |
| Wholesale Trade | 131 (85.6%) | 22 (14.4%) |
| Retail Trade | 138 (32.0%) | 293 (68.0%) |
| Transportation & Warehousing | 208 (74.8%) | 70 (25.2%) |
| Utilities | 14 (29.2%) | 34 (70.8%) |
| Information | 25 (30.9%) | 56 (69.1%) |
| Finance & Insurance | 94 (33.9%) | 183 (66.1%) |
| Real Estate, Rental & Leasing | 84 (76.4%) | 26 (23.6%) |
| Professional & Scientific | 153 (48.7%) | 161 (51.3%) |
| Enterprise Management | 0 (0.0%) | 0 (0.0%) |
| Administrative & Support | 154 (50.0%) | 154 (50.0%) |
| Educational Services | 81 (23.1%) | 269 (76.9%) |
| Health Care & Social Assistance | 109 (28.2%) | 278 (71.8%) |
| Arts, Entertainment & Recreation | 23 (51.1%) | 22 (48.9%) |
| Accommodation & Food Services | 69 (49.3%) | 71 (50.7%) |
| Public Administration | 123 (42.1%) | 169 (57.9%) |
| Total | 1,901 (48.4%) | 2,030 (51.6%) |
Education in Rockwood
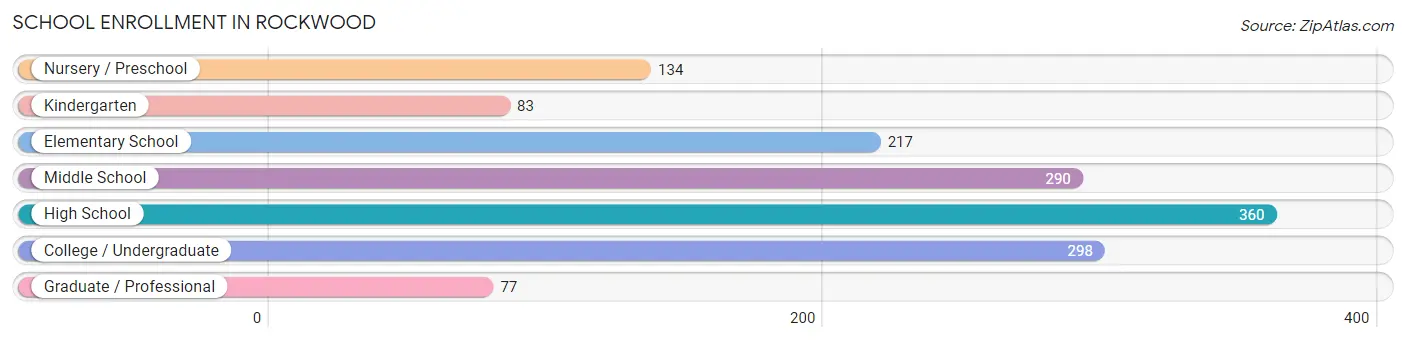
School Enrollment in Rockwood
The most common levels of schooling among the 1,459 students in Rockwood are high school (360 | 24.7%), college / undergraduate (298 | 20.4%), and middle school (290 | 19.9%).
| School Level | # Students | % Students |
| Nursery / Preschool | 134 | 9.2% |
| Kindergarten | 83 | 5.7% |
| Elementary School | 217 | 14.9% |
| Middle School | 290 | 19.9% |
| High School | 360 | 24.7% |
| College / Undergraduate | 298 | 20.4% |
| Graduate / Professional | 77 | 5.3% |
| Total | 1,459 | 100.0% |
School Enrollment by Age by Funding Source in Rockwood
Out of a total of 1,459 students who are enrolled in schools in Rockwood, 277 (19.0%) attend a private institution, while the remaining 1,182 (81.0%) are enrolled in public schools. The age group of 25 to 34 year olds has the highest likelihood of being enrolled in private schools, with 26 (55.3% in the age bracket) enrolled. Conversely, the age group of 18 to 19 year olds has the lowest likelihood of being enrolled in a private school, with 63 (100.0% in the age bracket) attending a public institution.
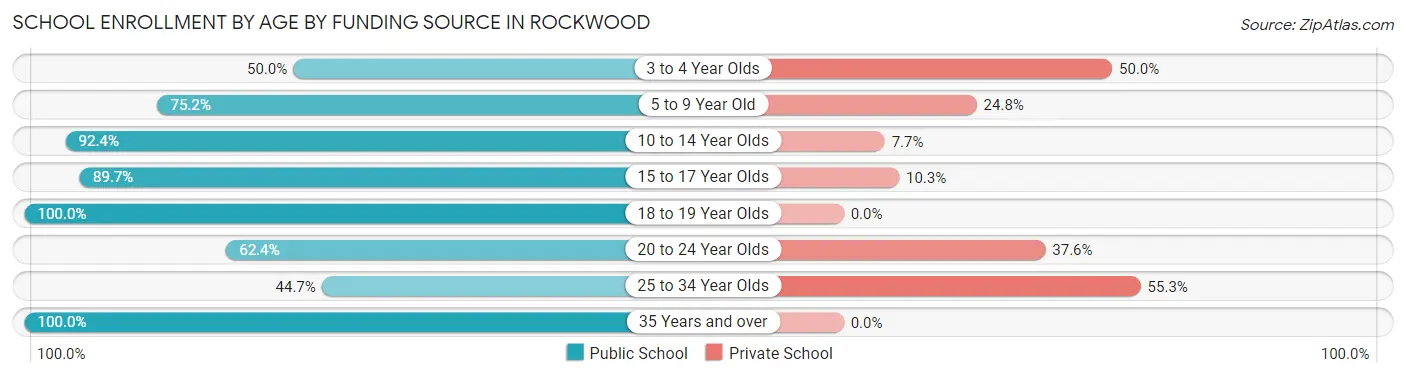
| Age Bracket | Public School | Private School |
| 3 to 4 Year Olds | 43 (50.0%) | 43 (50.0%) |
| 5 to 9 Year Old | 243 (75.2%) | 80 (24.8%) |
| 10 to 14 Year Olds | 362 (92.3%) | 30 (7.6%) |
| 15 to 17 Year Olds | 235 (89.7%) | 27 (10.3%) |
| 18 to 19 Year Olds | 63 (100.0%) | 0 (0.0%) |
| 20 to 24 Year Olds | 118 (62.4%) | 71 (37.6%) |
| 25 to 34 Year Olds | 21 (44.7%) | 26 (55.3%) |
| 35 Years and over | 97 (100.0%) | 0 (0.0%) |
| Total | 1,182 (81.0%) | 277 (19.0%) |
Educational Attainment by Field of Study in Rockwood
Business (631 | 20.9%), social sciences (357 | 11.8%), arts & humanities (295 | 9.8%), engineering (256 | 8.5%), and science & technology (251 | 8.3%) are the most common fields of study among 3,017 individuals in Rockwood who have obtained a bachelor's degree or higher.
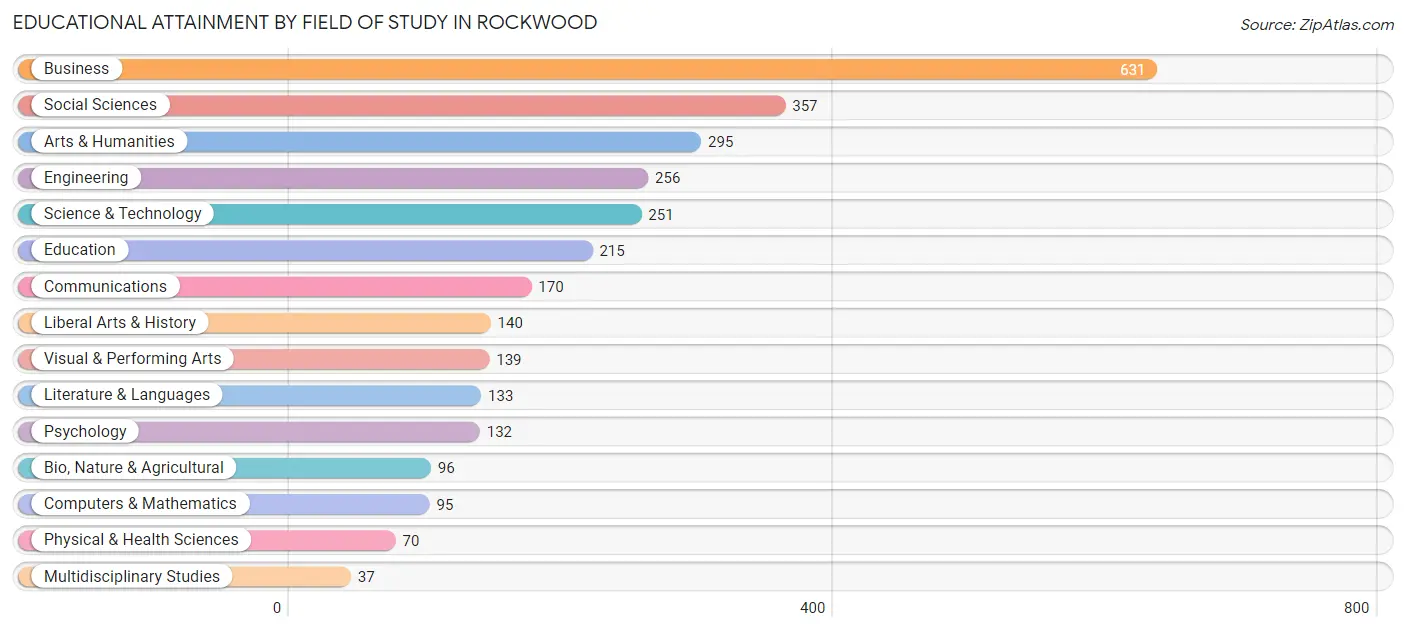
| Field of Study | # Graduates | % Graduates |
| Computers & Mathematics | 95 | 3.2% |
| Bio, Nature & Agricultural | 96 | 3.2% |
| Physical & Health Sciences | 70 | 2.3% |
| Psychology | 132 | 4.4% |
| Social Sciences | 357 | 11.8% |
| Engineering | 256 | 8.5% |
| Multidisciplinary Studies | 37 | 1.2% |
| Science & Technology | 251 | 8.3% |
| Business | 631 | 20.9% |
| Education | 215 | 7.1% |
| Literature & Languages | 133 | 4.4% |
| Liberal Arts & History | 140 | 4.6% |
| Visual & Performing Arts | 139 | 4.6% |
| Communications | 170 | 5.6% |
| Arts & Humanities | 295 | 9.8% |
| Total | 3,017 | 100.0% |
Transportation & Commute in Rockwood
Vehicle Availability by Sex in Rockwood
The most prevalent vehicle ownership categories in Rockwood are males with 2 vehicles (798, accounting for 41.6%) and females with 2 vehicles (894, making up 39.9%).
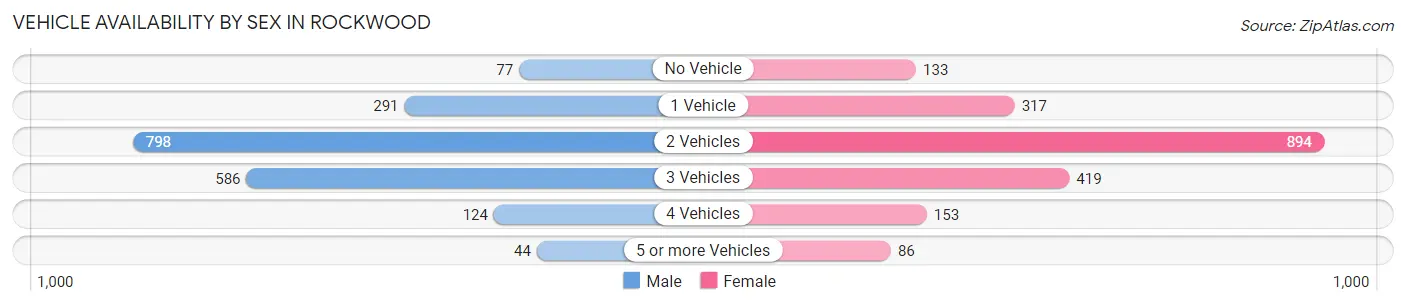
| Vehicles Available | Male | Female |
| No Vehicle | 77 (4.0%) | 133 (6.6%) |
| 1 Vehicle | 291 (15.2%) | 317 (15.8%) |
| 2 Vehicles | 798 (41.6%) | 894 (44.7%) |
| 3 Vehicles | 586 (30.5%) | 419 (20.9%) |
| 4 Vehicles | 124 (6.5%) | 153 (7.6%) |
| 5 or more Vehicles | 44 (2.3%) | 86 (4.3%) |
| Total | 1,920 (100.0%) | 2,002 (100.0%) |
Commute Time in Rockwood
The most frequently occuring commute durations in Rockwood are 30 to 34 minutes (640 commuters, 19.3%), 20 to 24 minutes (586 commuters, 17.7%), and 15 to 19 minutes (475 commuters, 14.3%).
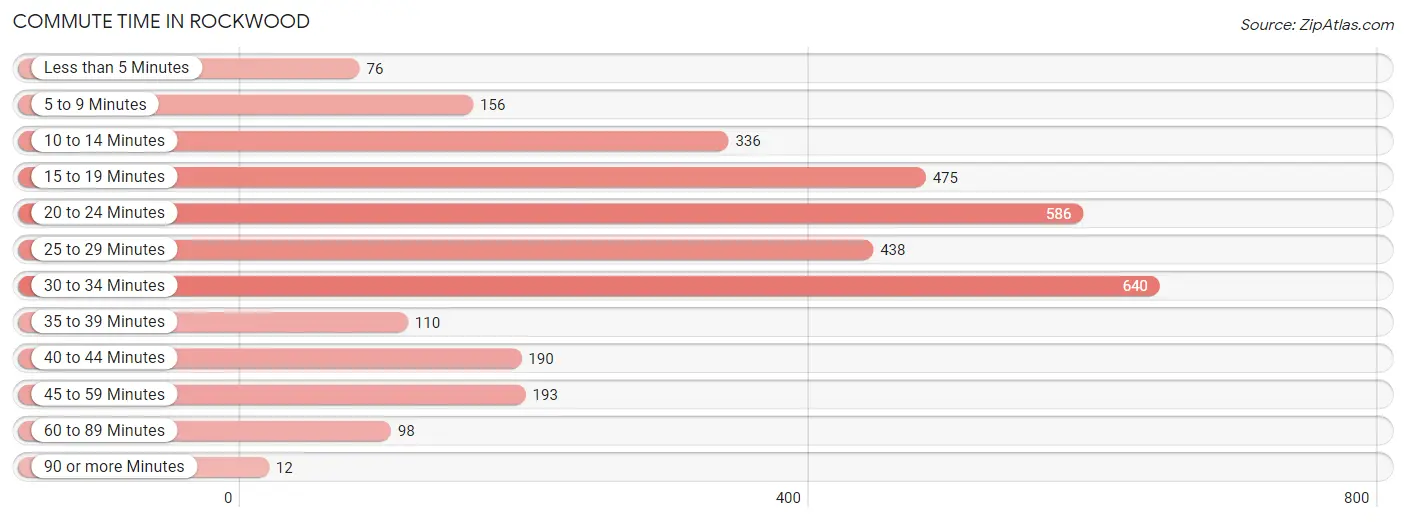
| Commute Time | # Commuters | % Commuters |
| Less than 5 Minutes | 76 | 2.3% |
| 5 to 9 Minutes | 156 | 4.7% |
| 10 to 14 Minutes | 336 | 10.2% |
| 15 to 19 Minutes | 475 | 14.3% |
| 20 to 24 Minutes | 586 | 17.7% |
| 25 to 29 Minutes | 438 | 13.2% |
| 30 to 34 Minutes | 640 | 19.3% |
| 35 to 39 Minutes | 110 | 3.3% |
| 40 to 44 Minutes | 190 | 5.7% |
| 45 to 59 Minutes | 193 | 5.8% |
| 60 to 89 Minutes | 98 | 3.0% |
| 90 or more Minutes | 12 | 0.4% |
Commute Time by Sex in Rockwood
The most common commute times in Rockwood are 20 to 24 minutes (340 commuters, 20.9%) for males and 15 to 19 minutes (349 commuters, 20.7%) for females.
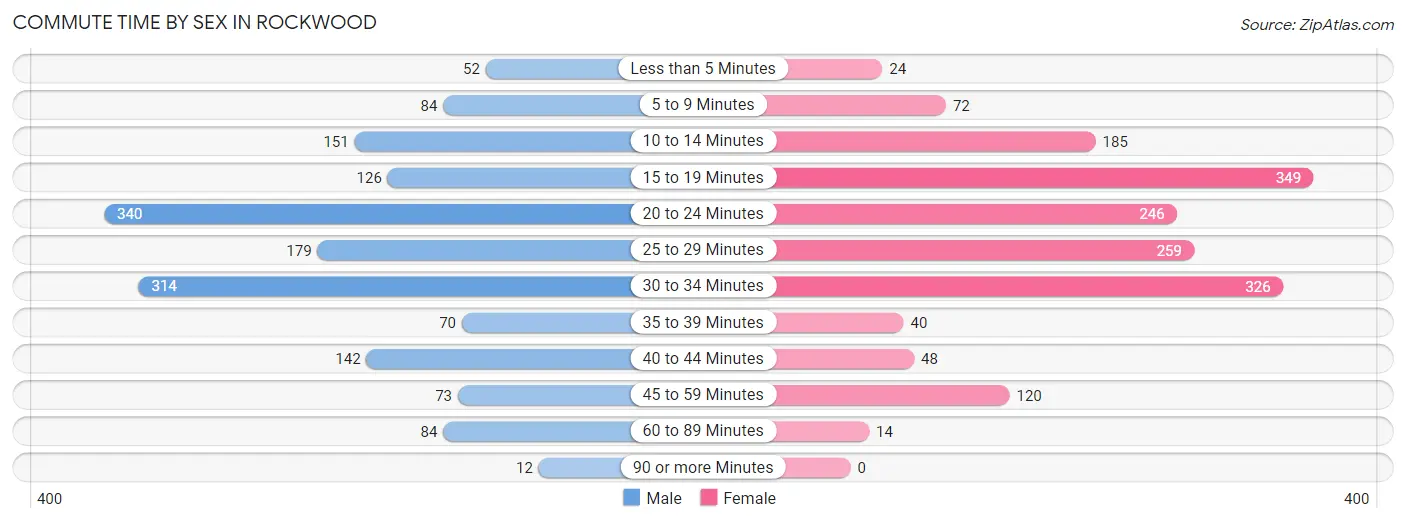
| Commute Time | Male | Female |
| Less than 5 Minutes | 52 (3.2%) | 24 (1.4%) |
| 5 to 9 Minutes | 84 (5.2%) | 72 (4.3%) |
| 10 to 14 Minutes | 151 (9.3%) | 185 (11.0%) |
| 15 to 19 Minutes | 126 (7.7%) | 349 (20.7%) |
| 20 to 24 Minutes | 340 (20.9%) | 246 (14.6%) |
| 25 to 29 Minutes | 179 (11.0%) | 259 (15.4%) |
| 30 to 34 Minutes | 314 (19.3%) | 326 (19.4%) |
| 35 to 39 Minutes | 70 (4.3%) | 40 (2.4%) |
| 40 to 44 Minutes | 142 (8.7%) | 48 (2.9%) |
| 45 to 59 Minutes | 73 (4.5%) | 120 (7.1%) |
| 60 to 89 Minutes | 84 (5.2%) | 14 (0.8%) |
| 90 or more Minutes | 12 (0.7%) | 0 (0.0%) |
Time of Departure to Work by Sex in Rockwood
The most frequent times of departure to work in Rockwood are 12:00 PM to 3:59 PM (311, 19.1%) for males and 7:00 AM to 7:29 AM (320, 19.0%) for females.
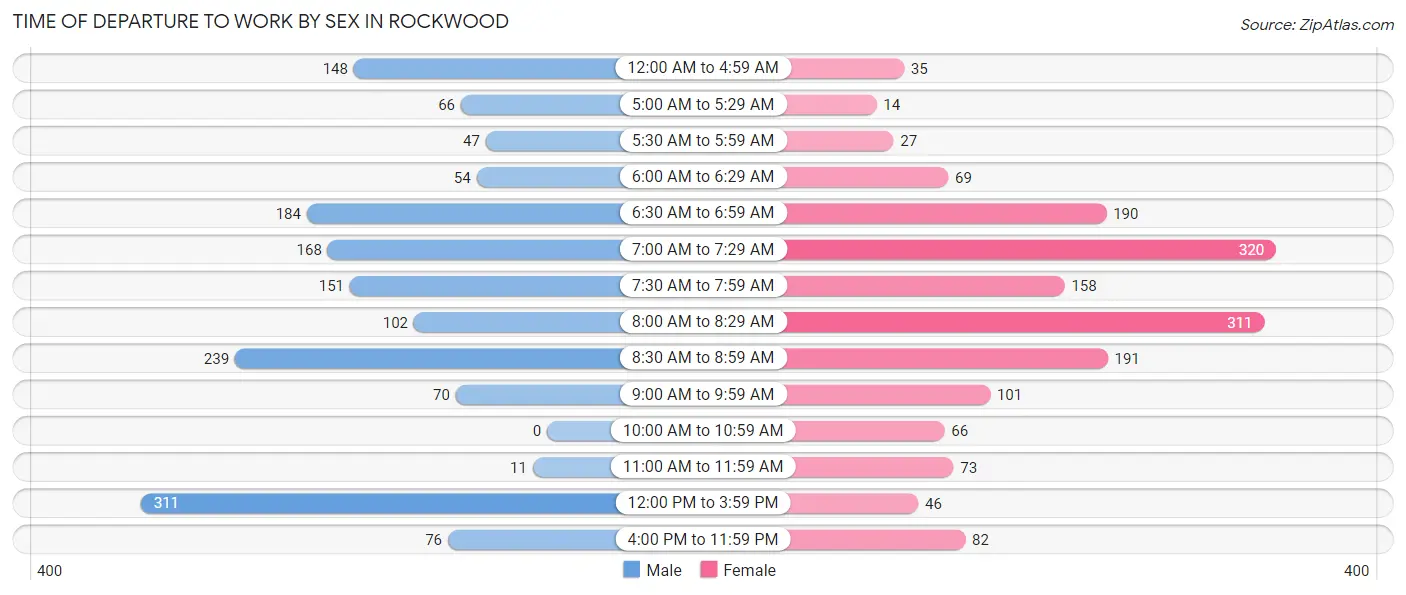
| Time of Departure | Male | Female |
| 12:00 AM to 4:59 AM | 148 (9.1%) | 35 (2.1%) |
| 5:00 AM to 5:29 AM | 66 (4.1%) | 14 (0.8%) |
| 5:30 AM to 5:59 AM | 47 (2.9%) | 27 (1.6%) |
| 6:00 AM to 6:29 AM | 54 (3.3%) | 69 (4.1%) |
| 6:30 AM to 6:59 AM | 184 (11.3%) | 190 (11.3%) |
| 7:00 AM to 7:29 AM | 168 (10.3%) | 320 (19.0%) |
| 7:30 AM to 7:59 AM | 151 (9.3%) | 158 (9.4%) |
| 8:00 AM to 8:29 AM | 102 (6.3%) | 311 (18.5%) |
| 8:30 AM to 8:59 AM | 239 (14.7%) | 191 (11.4%) |
| 9:00 AM to 9:59 AM | 70 (4.3%) | 101 (6.0%) |
| 10:00 AM to 10:59 AM | 0 (0.0%) | 66 (3.9%) |
| 11:00 AM to 11:59 AM | 11 (0.7%) | 73 (4.3%) |
| 12:00 PM to 3:59 PM | 311 (19.1%) | 46 (2.7%) |
| 4:00 PM to 11:59 PM | 76 (4.7%) | 82 (4.9%) |
| Total | 1,627 (100.0%) | 1,683 (100.0%) |
Housing Occupancy in Rockwood
Occupancy by Ownership in Rockwood
Of the total 3,292 dwellings in Rockwood, owner-occupied units account for 2,954 (89.7%), while renter-occupied units make up 338 (10.3%).
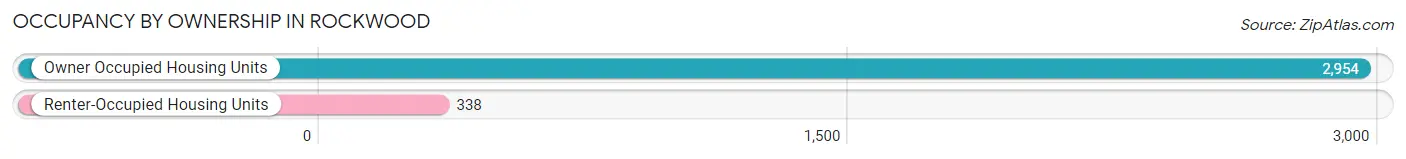
| Occupancy | # Housing Units | % Housing Units |
| Owner Occupied Housing Units | 2,954 | 89.7% |
| Renter-Occupied Housing Units | 338 | 10.3% |
| Total Occupied Housing Units | 3,292 | 100.0% |
Occupancy by Household Size in Rockwood
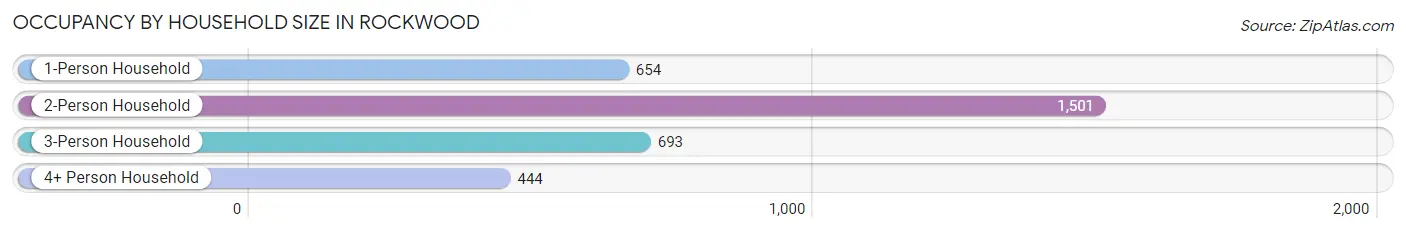
| Household Size | # Housing Units | % Housing Units |
| 1-Person Household | 654 | 19.9% |
| 2-Person Household | 1,501 | 45.6% |
| 3-Person Household | 693 | 21.0% |
| 4+ Person Household | 444 | 13.5% |
| Total Housing Units | 3,292 | 100.0% |
Occupancy by Ownership by Household Size in Rockwood
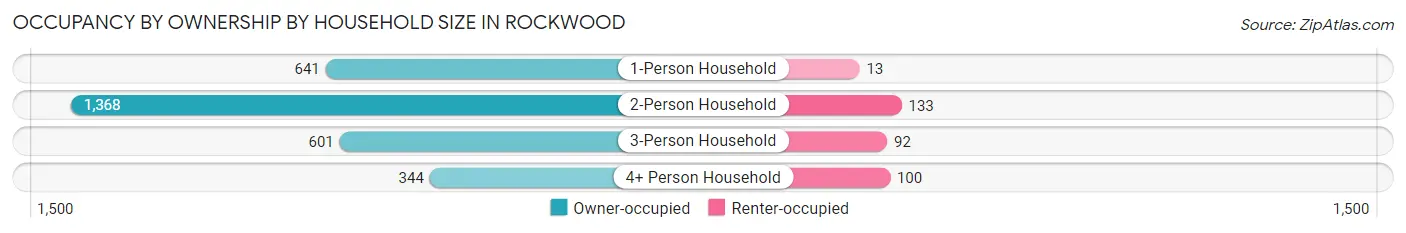
| Household Size | Owner-occupied | Renter-occupied |
| 1-Person Household | 641 (98.0%) | 13 (2.0%) |
| 2-Person Household | 1,368 (91.1%) | 133 (8.9%) |
| 3-Person Household | 601 (86.7%) | 92 (13.3%) |
| 4+ Person Household | 344 (77.5%) | 100 (22.5%) |
| Total Housing Units | 2,954 (89.7%) | 338 (10.3%) |
Occupancy by Educational Attainment in Rockwood
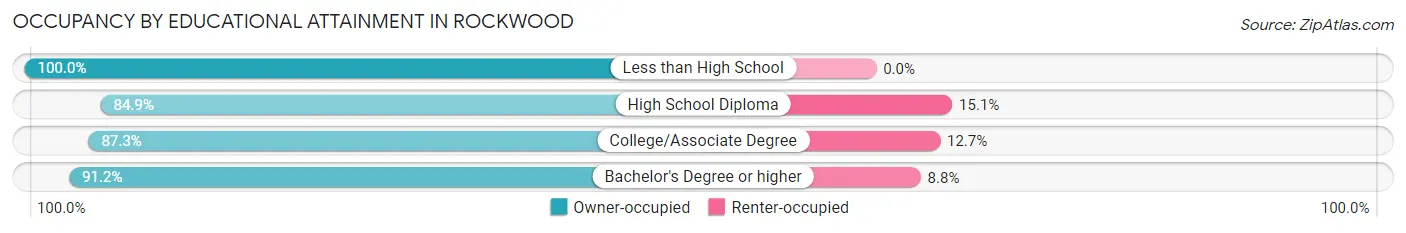
| Household Size | Owner-occupied | Renter-occupied |
| Less than High School | 183 (100.0%) | 0 (0.0%) |
| High School Diploma | 417 (84.9%) | 74 (15.1%) |
| College/Associate Degree | 751 (87.3%) | 109 (12.7%) |
| Bachelor's Degree or higher | 1,603 (91.2%) | 155 (8.8%) |
Occupancy by Age of Householder in Rockwood
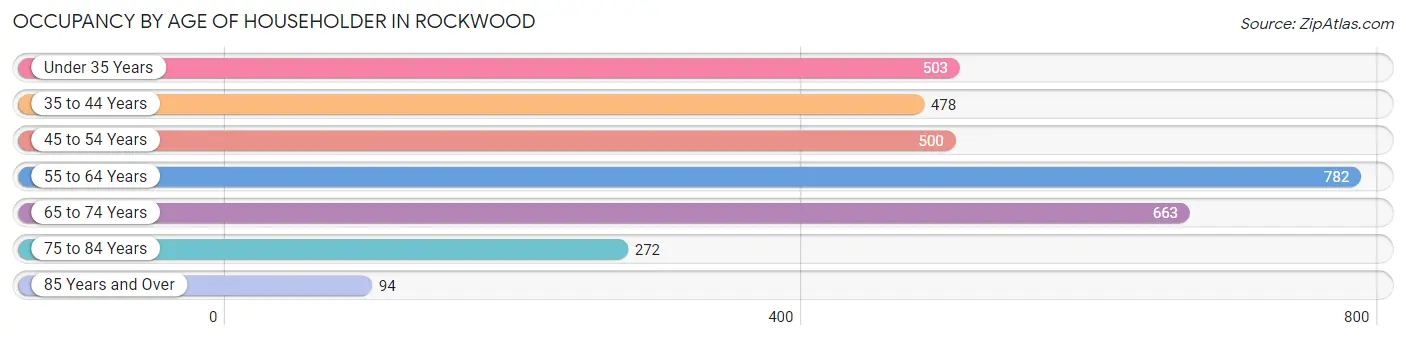
| Age Bracket | # Households | % Households |
| Under 35 Years | 503 | 15.3% |
| 35 to 44 Years | 478 | 14.5% |
| 45 to 54 Years | 500 | 15.2% |
| 55 to 64 Years | 782 | 23.7% |
| 65 to 74 Years | 663 | 20.1% |
| 75 to 84 Years | 272 | 8.3% |
| 85 Years and Over | 94 | 2.9% |
| Total | 3,292 | 100.0% |
Housing Finances in Rockwood
Median Income by Occupancy in Rockwood
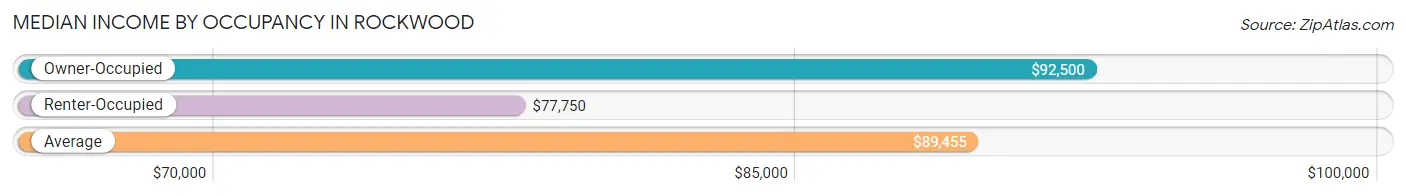
| Occupancy Type | # Households | Median Income |
| Owner-Occupied | 2,954 (89.7%) | $92,500 |
| Renter-Occupied | 338 (10.3%) | $77,750 |
| Average | 3,292 (100.0%) | $89,455 |
Occupancy by Householder Income Bracket in Rockwood
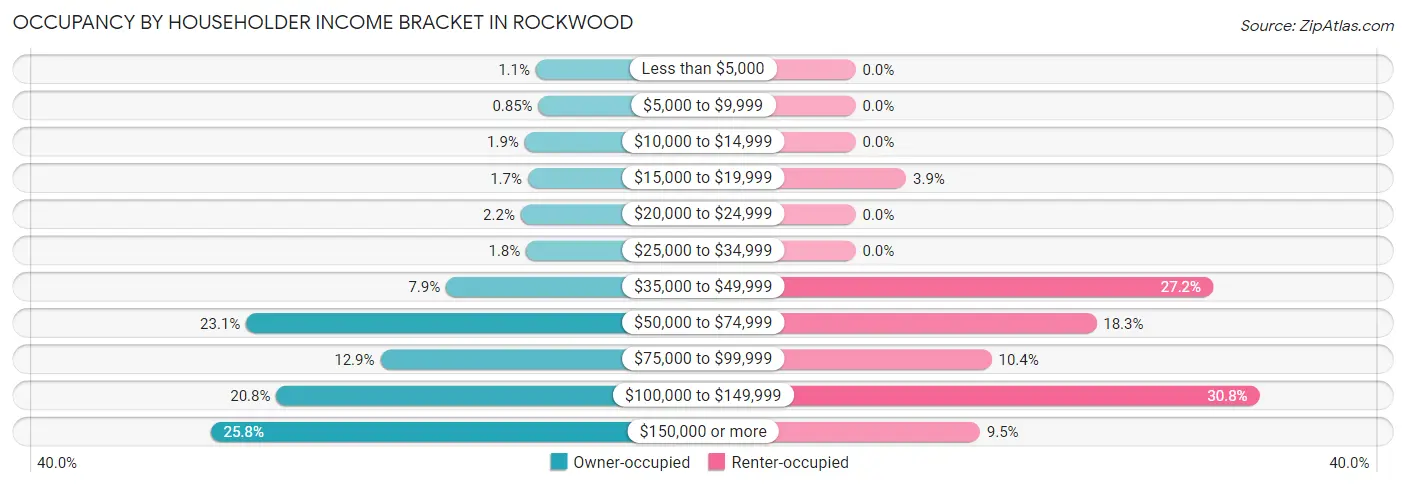
| Income Bracket | Owner-occupied | Renter-occupied |
| Less than $5,000 | 31 (1.1%) | 0 (0.0%) |
| $5,000 to $9,999 | 25 (0.9%) | 0 (0.0%) |
| $10,000 to $14,999 | 56 (1.9%) | 0 (0.0%) |
| $15,000 to $19,999 | 49 (1.7%) | 13 (3.8%) |
| $20,000 to $24,999 | 65 (2.2%) | 0 (0.0%) |
| $25,000 to $34,999 | 53 (1.8%) | 0 (0.0%) |
| $35,000 to $49,999 | 233 (7.9%) | 92 (27.2%) |
| $50,000 to $74,999 | 683 (23.1%) | 62 (18.3%) |
| $75,000 to $99,999 | 381 (12.9%) | 35 (10.4%) |
| $100,000 to $149,999 | 615 (20.8%) | 104 (30.8%) |
| $150,000 or more | 763 (25.8%) | 32 (9.5%) |
| Total | 2,954 (100.0%) | 338 (100.0%) |
Monthly Housing Cost Tiers in Rockwood
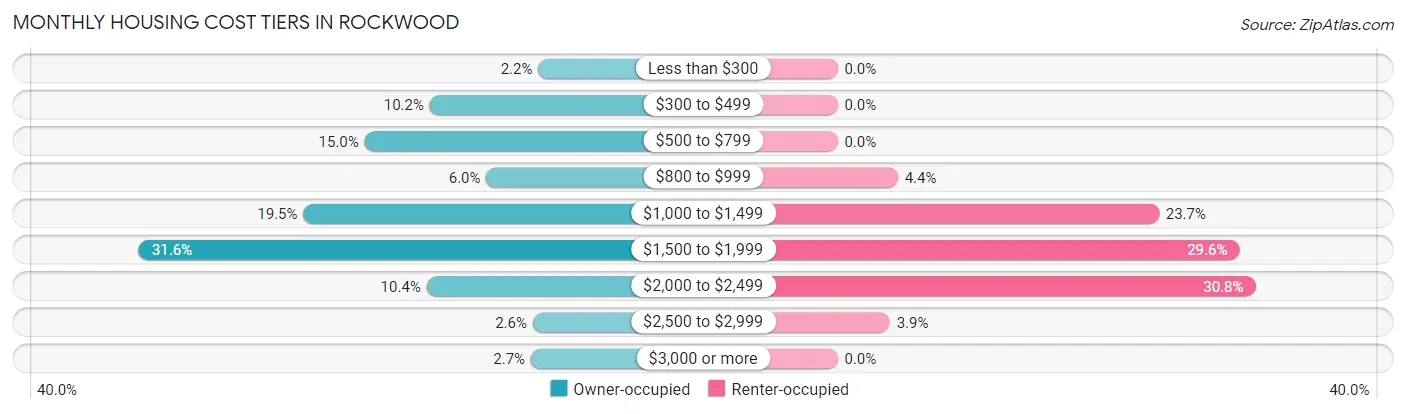
| Monthly Cost | Owner-occupied | Renter-occupied |
| Less than $300 | 64 (2.2%) | 0 (0.0%) |
| $300 to $499 | 300 (10.2%) | 0 (0.0%) |
| $500 to $799 | 442 (15.0%) | 0 (0.0%) |
| $800 to $999 | 177 (6.0%) | 15 (4.4%) |
| $1,000 to $1,499 | 575 (19.5%) | 80 (23.7%) |
| $1,500 to $1,999 | 933 (31.6%) | 100 (29.6%) |
| $2,000 to $2,499 | 307 (10.4%) | 104 (30.8%) |
| $2,500 to $2,999 | 76 (2.6%) | 13 (3.8%) |
| $3,000 or more | 80 (2.7%) | 0 (0.0%) |
| Total | 2,954 (100.0%) | 338 (100.0%) |
Physical Housing Characteristics in Rockwood
Housing Structures in Rockwood
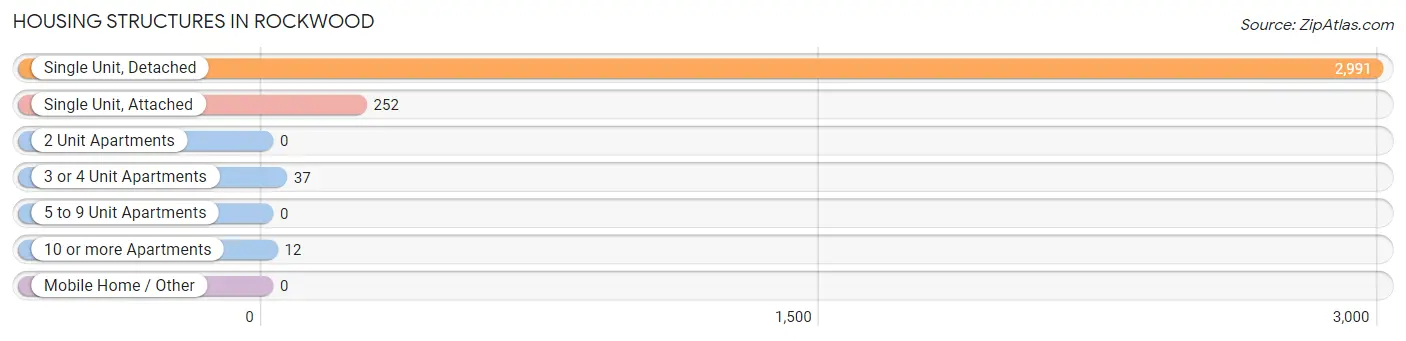
| Structure Type | # Housing Units | % Housing Units |
| Single Unit, Detached | 2,991 | 90.9% |
| Single Unit, Attached | 252 | 7.6% |
| 2 Unit Apartments | 0 | 0.0% |
| 3 or 4 Unit Apartments | 37 | 1.1% |
| 5 to 9 Unit Apartments | 0 | 0.0% |
| 10 or more Apartments | 12 | 0.4% |
| Mobile Home / Other | 0 | 0.0% |
| Total | 3,292 | 100.0% |
Housing Structures by Occupancy in Rockwood
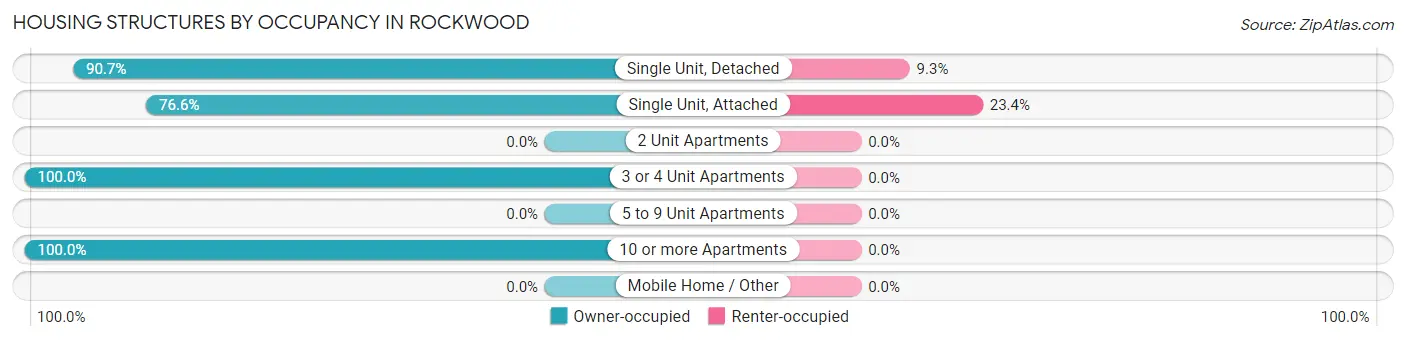
| Structure Type | Owner-occupied | Renter-occupied |
| Single Unit, Detached | 2,712 (90.7%) | 279 (9.3%) |
| Single Unit, Attached | 193 (76.6%) | 59 (23.4%) |
| 2 Unit Apartments | 0 (0.0%) | 0 (0.0%) |
| 3 or 4 Unit Apartments | 37 (100.0%) | 0 (0.0%) |
| 5 to 9 Unit Apartments | 0 (0.0%) | 0 (0.0%) |
| 10 or more Apartments | 12 (100.0%) | 0 (0.0%) |
| Mobile Home / Other | 0 (0.0%) | 0 (0.0%) |
| Total | 2,954 (89.7%) | 338 (10.3%) |
Housing Structures by Number of Rooms in Rockwood
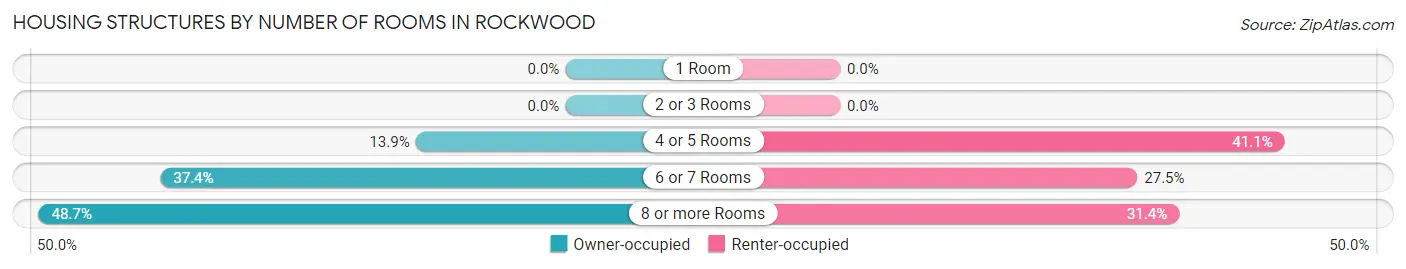
| Number of Rooms | Owner-occupied | Renter-occupied |
| 1 Room | 0 (0.0%) | 0 (0.0%) |
| 2 or 3 Rooms | 0 (0.0%) | 0 (0.0%) |
| 4 or 5 Rooms | 409 (13.9%) | 139 (41.1%) |
| 6 or 7 Rooms | 1,106 (37.4%) | 93 (27.5%) |
| 8 or more Rooms | 1,439 (48.7%) | 106 (31.4%) |
| Total | 2,954 (100.0%) | 338 (100.0%) |
Housing Structure by Heating Type in Rockwood
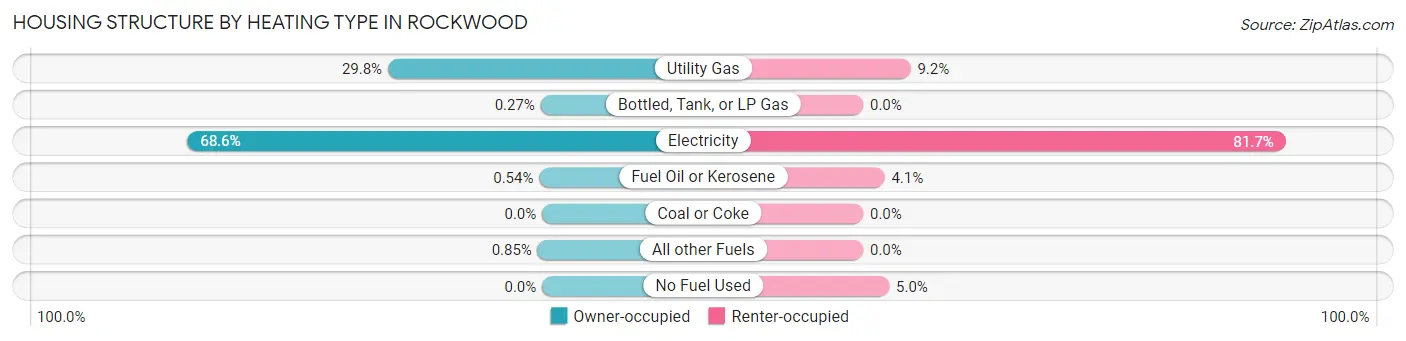
| Heating Type | Owner-occupied | Renter-occupied |
| Utility Gas | 880 (29.8%) | 31 (9.2%) |
| Bottled, Tank, or LP Gas | 8 (0.3%) | 0 (0.0%) |
| Electricity | 2,025 (68.5%) | 276 (81.7%) |
| Fuel Oil or Kerosene | 16 (0.5%) | 14 (4.1%) |
| Coal or Coke | 0 (0.0%) | 0 (0.0%) |
| All other Fuels | 25 (0.9%) | 0 (0.0%) |
| No Fuel Used | 0 (0.0%) | 17 (5.0%) |
| Total | 2,954 (100.0%) | 338 (100.0%) |
Household Vehicle Usage in Rockwood
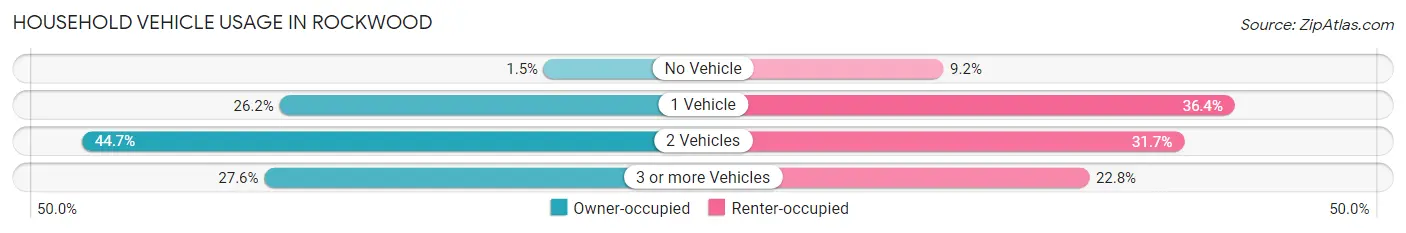
| Vehicles per Household | Owner-occupied | Renter-occupied |
| No Vehicle | 45 (1.5%) | 31 (9.2%) |
| 1 Vehicle | 774 (26.2%) | 123 (36.4%) |
| 2 Vehicles | 1,319 (44.7%) | 107 (31.7%) |
| 3 or more Vehicles | 816 (27.6%) | 77 (22.8%) |
| Total | 2,954 (100.0%) | 338 (100.0%) |
Real Estate & Mortgages in Rockwood
Real Estate and Mortgage Overview in Rockwood
| Characteristic | Without Mortgage | With Mortgage |
| Housing Units | 842 | 2,112 |
| Median Property Value | $294,000 | $282,300 |
| Median Household Income | $70,156 | $592 |
| Monthly Housing Costs | $544 | $68 |
| Real Estate Taxes | $2,504 | $43 |
Property Value by Mortgage Status in Rockwood
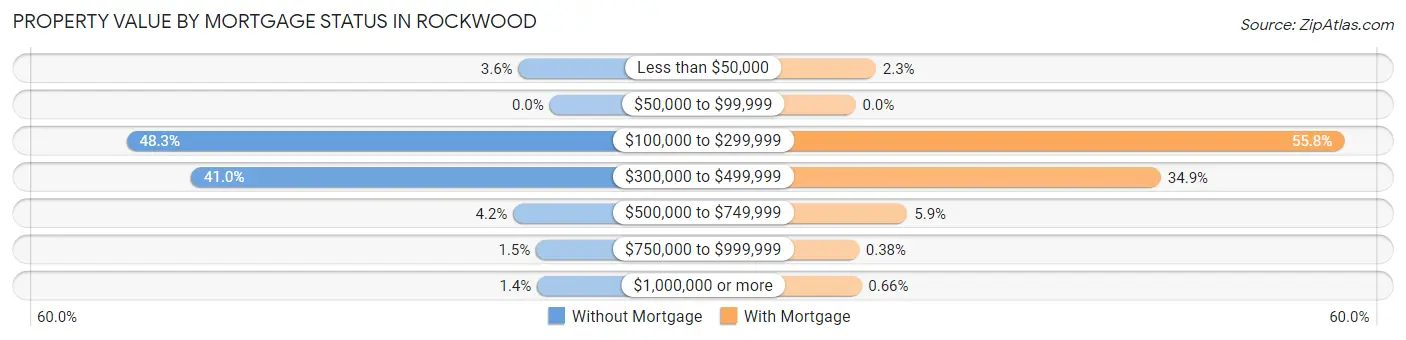
| Property Value | Without Mortgage | With Mortgage |
| Less than $50,000 | 30 (3.6%) | 49 (2.3%) |
| $50,000 to $99,999 | 0 (0.0%) | 0 (0.0%) |
| $100,000 to $299,999 | 407 (48.3%) | 1,179 (55.8%) |
| $300,000 to $499,999 | 345 (41.0%) | 737 (34.9%) |
| $500,000 to $749,999 | 35 (4.2%) | 125 (5.9%) |
| $750,000 to $999,999 | 13 (1.5%) | 8 (0.4%) |
| $1,000,000 or more | 12 (1.4%) | 14 (0.7%) |
| Total | 842 (100.0%) | 2,112 (100.0%) |
Household Income by Mortgage Status in Rockwood
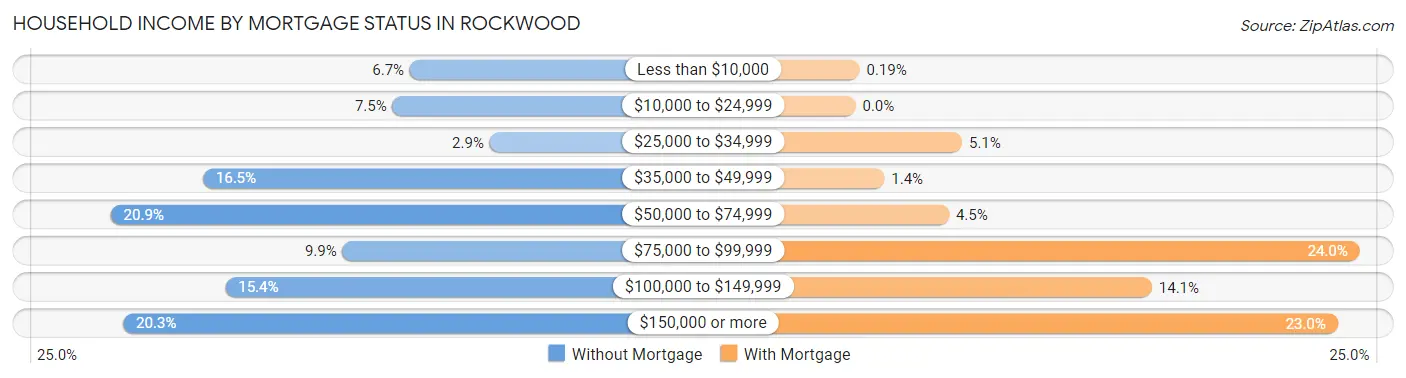
| Household Income | Without Mortgage | With Mortgage |
| Less than $10,000 | 56 (6.7%) | 4 (0.2%) |
| $10,000 to $24,999 | 63 (7.5%) | 0 (0.0%) |
| $25,000 to $34,999 | 24 (2.9%) | 107 (5.1%) |
| $35,000 to $49,999 | 139 (16.5%) | 29 (1.4%) |
| $50,000 to $74,999 | 176 (20.9%) | 94 (4.4%) |
| $75,000 to $99,999 | 83 (9.9%) | 507 (24.0%) |
| $100,000 to $149,999 | 130 (15.4%) | 298 (14.1%) |
| $150,000 or more | 171 (20.3%) | 485 (23.0%) |
| Total | 842 (100.0%) | 2,112 (100.0%) |
Property Value to Household Income Ratio in Rockwood
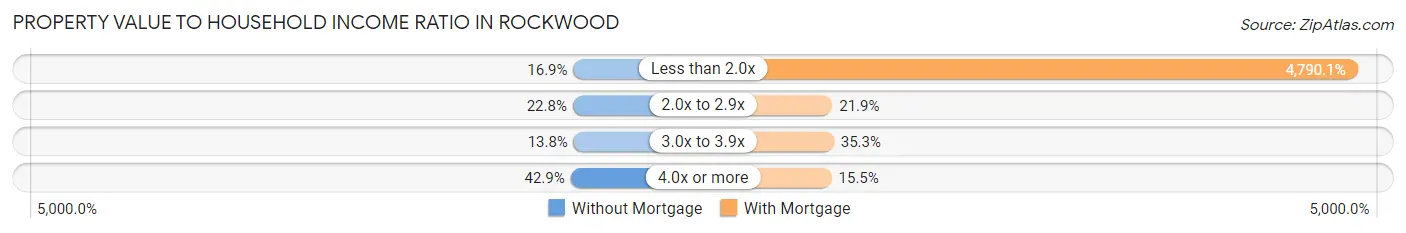
| Value-to-Income Ratio | Without Mortgage | With Mortgage |
| Less than 2.0x | 142 (16.9%) | 101,167 (4,790.1%) |
| 2.0x to 2.9x | 192 (22.8%) | 462 (21.9%) |
| 3.0x to 3.9x | 116 (13.8%) | 745 (35.3%) |
| 4.0x or more | 361 (42.9%) | 327 (15.5%) |
| Total | 842 (100.0%) | 2,112 (100.0%) |
Real Estate Taxes by Mortgage Status in Rockwood
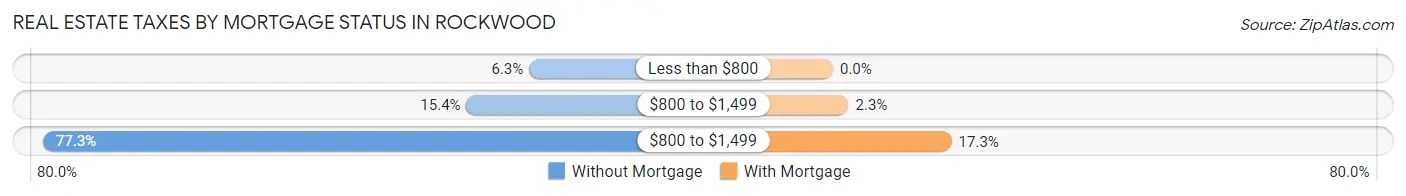
| Property Taxes | Without Mortgage | With Mortgage |
| Less than $800 | 53 (6.3%) | 0 (0.0%) |
| $800 to $1,499 | 130 (15.4%) | 48 (2.3%) |
| $800 to $1,499 | 651 (77.3%) | 366 (17.3%) |
| Total | 842 (100.0%) | 2,112 (100.0%) |
Health & Disability in Rockwood
Health Insurance Coverage by Age in Rockwood
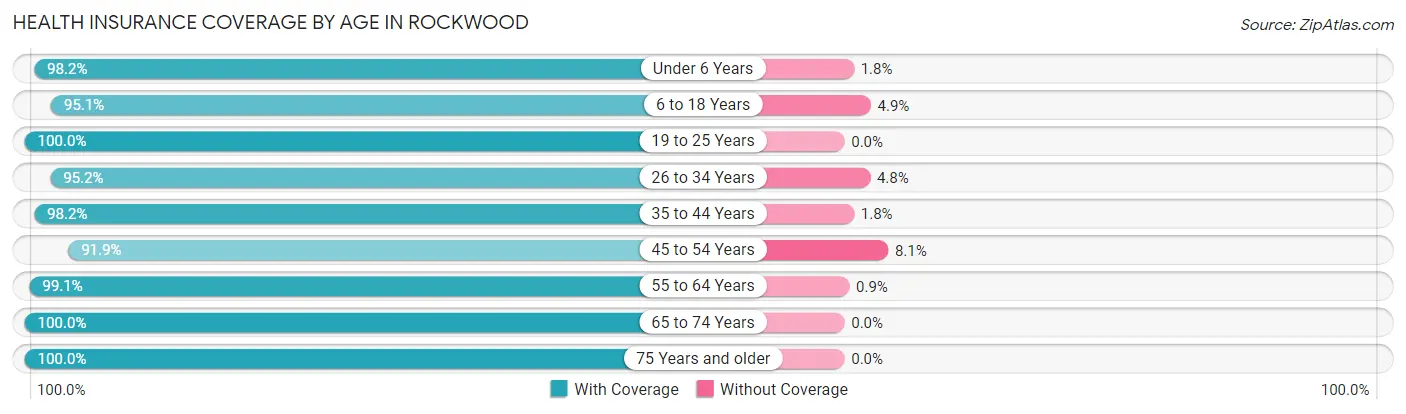
| Age Bracket | With Coverage | Without Coverage |
| Under 6 Years | 670 (98.2%) | 12 (1.8%) |
| 6 to 18 Years | 871 (95.1%) | 45 (4.9%) |
| 19 to 25 Years | 522 (100.0%) | 0 (0.0%) |
| 26 to 34 Years | 777 (95.2%) | 39 (4.8%) |
| 35 to 44 Years | 1,049 (98.2%) | 19 (1.8%) |
| 45 to 54 Years | 914 (91.9%) | 81 (8.1%) |
| 55 to 64 Years | 1,209 (99.1%) | 11 (0.9%) |
| 65 to 74 Years | 1,139 (100.0%) | 0 (0.0%) |
| 75 Years and older | 653 (100.0%) | 0 (0.0%) |
| Total | 7,804 (97.4%) | 207 (2.6%) |
Health Insurance Coverage by Citizenship Status in Rockwood
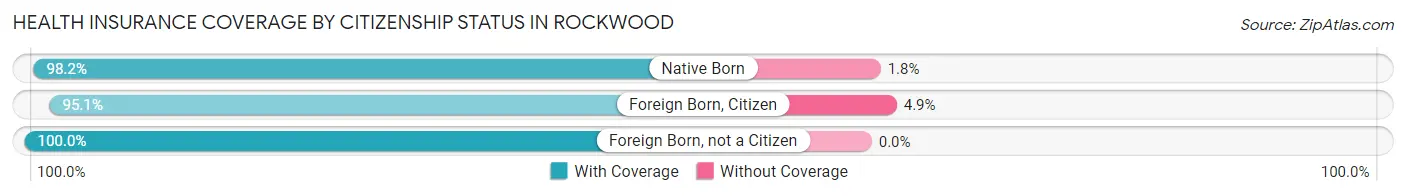
| Citizenship Status | With Coverage | Without Coverage |
| Native Born | 670 (98.2%) | 12 (1.8%) |
| Foreign Born, Citizen | 871 (95.1%) | 45 (4.9%) |
| Foreign Born, not a Citizen | 522 (100.0%) | 0 (0.0%) |
Health Insurance Coverage by Household Income in Rockwood
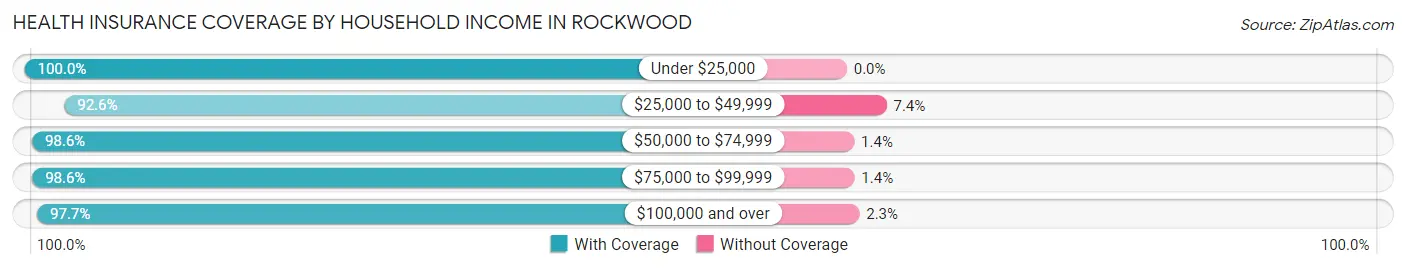
| Household Income | With Coverage | Without Coverage |
| Under $25,000 | 328 (100.0%) | 0 (0.0%) |
| $25,000 to $49,999 | 746 (92.6%) | 60 (7.4%) |
| $50,000 to $74,999 | 1,359 (98.6%) | 19 (1.4%) |
| $75,000 to $99,999 | 1,241 (98.6%) | 18 (1.4%) |
| $100,000 and over | 4,093 (97.7%) | 98 (2.3%) |
Public vs Private Health Insurance Coverage by Age in Rockwood
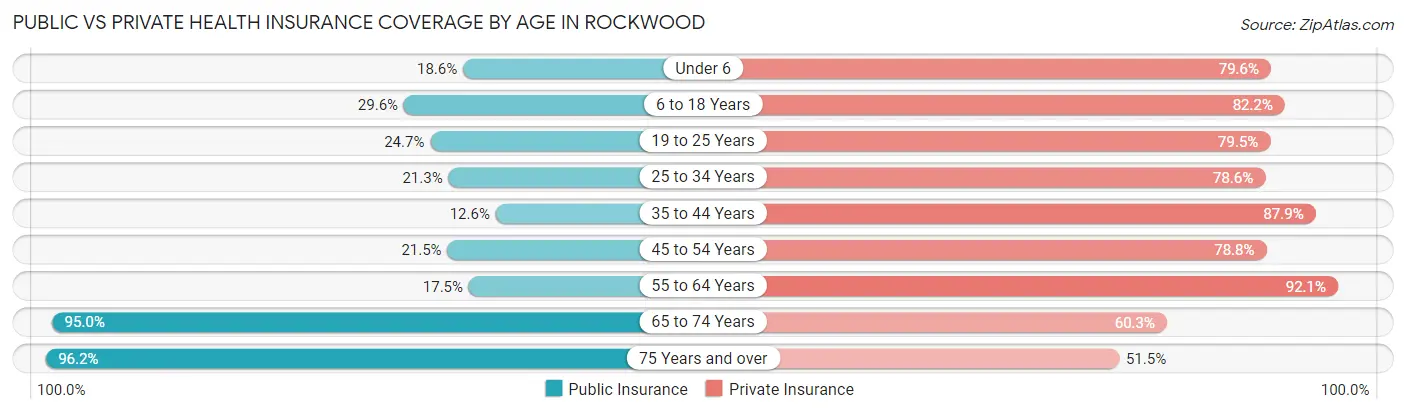
| Age Bracket | Public Insurance | Private Insurance |
| Under 6 | 127 (18.6%) | 543 (79.6%) |
| 6 to 18 Years | 271 (29.6%) | 753 (82.2%) |
| 19 to 25 Years | 129 (24.7%) | 415 (79.5%) |
| 25 to 34 Years | 174 (21.3%) | 641 (78.5%) |
| 35 to 44 Years | 134 (12.6%) | 939 (87.9%) |
| 45 to 54 Years | 214 (21.5%) | 784 (78.8%) |
| 55 to 64 Years | 214 (17.5%) | 1,123 (92.0%) |
| 65 to 74 Years | 1,082 (95.0%) | 687 (60.3%) |
| 75 Years and over | 628 (96.2%) | 336 (51.4%) |
| Total | 2,973 (37.1%) | 6,221 (77.7%) |
Disability Status by Sex by Age in Rockwood
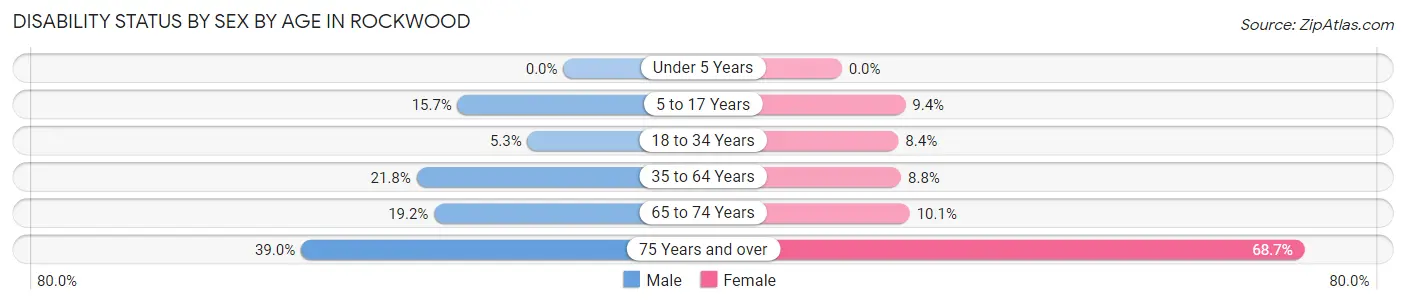
| Age Bracket | Male | Female |
| Under 5 Years | 0 (0.0%) | 0 (0.0%) |
| 5 to 17 Years | 75 (15.7%) | 47 (9.4%) |
| 18 to 34 Years | 24 (5.3%) | 79 (8.4%) |
| 35 to 64 Years | 339 (21.8%) | 152 (8.8%) |
| 65 to 74 Years | 93 (19.2%) | 66 (10.1%) |
| 75 Years and over | 120 (39.0%) | 237 (68.7%) |
Disability Class by Sex by Age in Rockwood
Disability Class: Hearing Difficulty
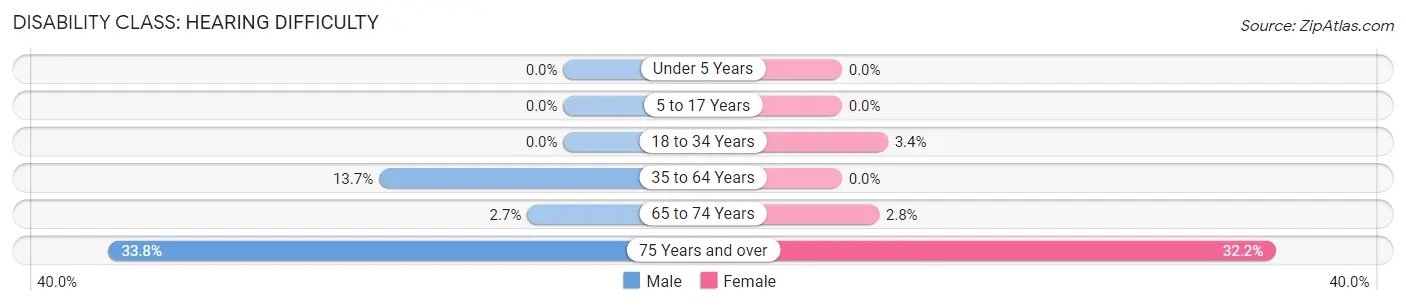
| Age Bracket | Male | Female |
| Under 5 Years | 0 (0.0%) | 0 (0.0%) |
| 5 to 17 Years | 0 (0.0%) | 0 (0.0%) |
| 18 to 34 Years | 0 (0.0%) | 32 (3.4%) |
| 35 to 64 Years | 213 (13.7%) | 0 (0.0%) |
| 65 to 74 Years | 13 (2.7%) | 18 (2.8%) |
| 75 Years and over | 104 (33.8%) | 111 (32.2%) |
Disability Class: Vision Difficulty
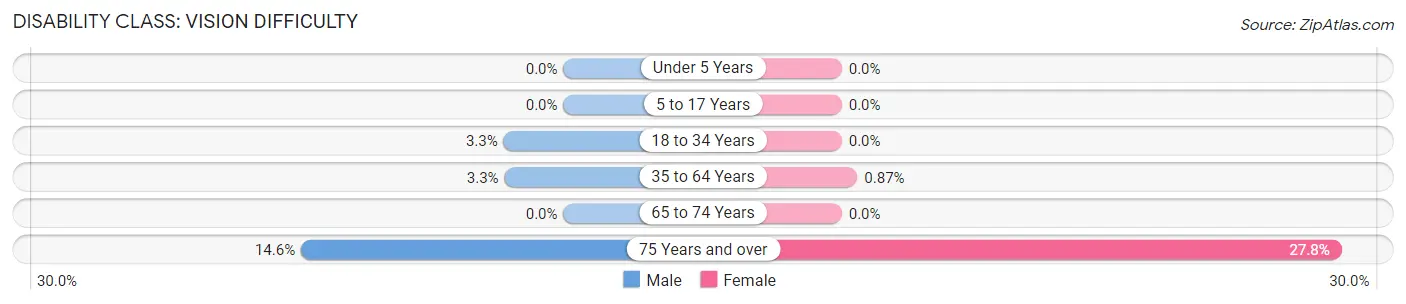
| Age Bracket | Male | Female |
| Under 5 Years | 0 (0.0%) | 0 (0.0%) |
| 5 to 17 Years | 0 (0.0%) | 0 (0.0%) |
| 18 to 34 Years | 15 (3.3%) | 0 (0.0%) |
| 35 to 64 Years | 51 (3.3%) | 15 (0.9%) |
| 65 to 74 Years | 0 (0.0%) | 0 (0.0%) |
| 75 Years and over | 45 (14.6%) | 96 (27.8%) |
Disability Class: Cognitive Difficulty
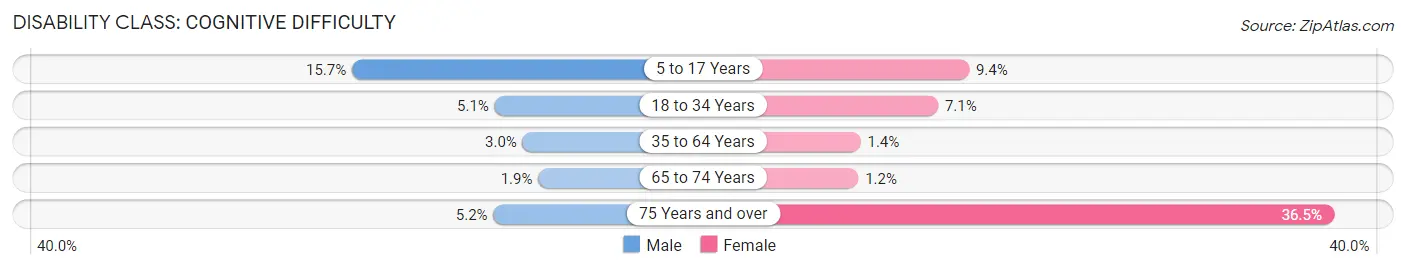
| Age Bracket | Male | Female |
| 5 to 17 Years | 75 (15.7%) | 47 (9.4%) |
| 18 to 34 Years | 23 (5.1%) | 67 (7.1%) |
| 35 to 64 Years | 47 (3.0%) | 24 (1.4%) |
| 65 to 74 Years | 9 (1.9%) | 8 (1.2%) |
| 75 Years and over | 16 (5.2%) | 126 (36.5%) |
Disability Class: Ambulatory Difficulty
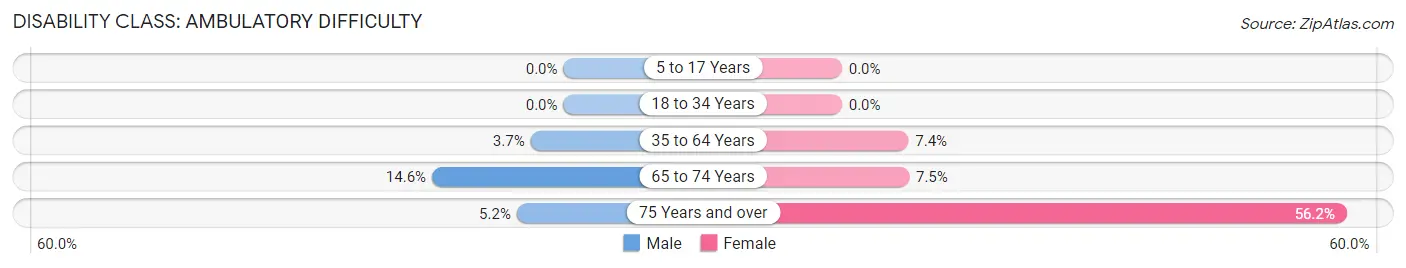
| Age Bracket | Male | Female |
| 5 to 17 Years | 0 (0.0%) | 0 (0.0%) |
| 18 to 34 Years | 0 (0.0%) | 0 (0.0%) |
| 35 to 64 Years | 57 (3.7%) | 128 (7.4%) |
| 65 to 74 Years | 71 (14.6%) | 49 (7.5%) |
| 75 Years and over | 16 (5.2%) | 194 (56.2%) |
Disability Class: Self-Care Difficulty
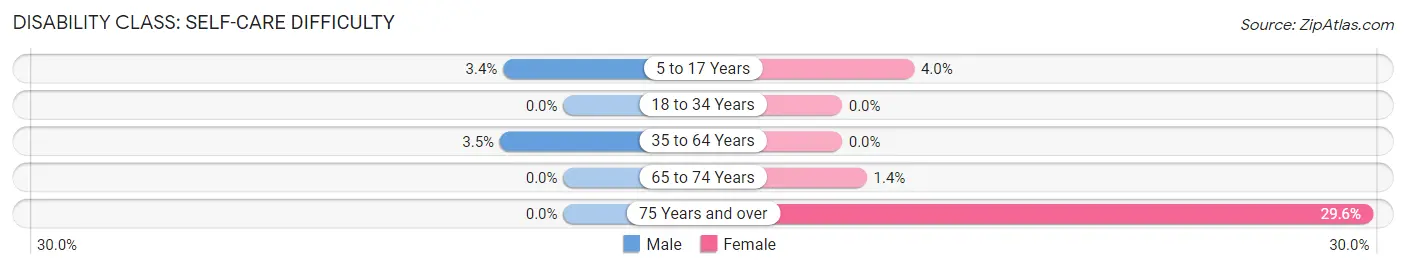
| Age Bracket | Male | Female |
| 5 to 17 Years | 16 (3.4%) | 20 (4.0%) |
| 18 to 34 Years | 0 (0.0%) | 0 (0.0%) |
| 35 to 64 Years | 55 (3.5%) | 0 (0.0%) |
| 65 to 74 Years | 0 (0.0%) | 9 (1.4%) |
| 75 Years and over | 0 (0.0%) | 102 (29.6%) |
Technology Access in Rockwood
Computing Device Access in Rockwood
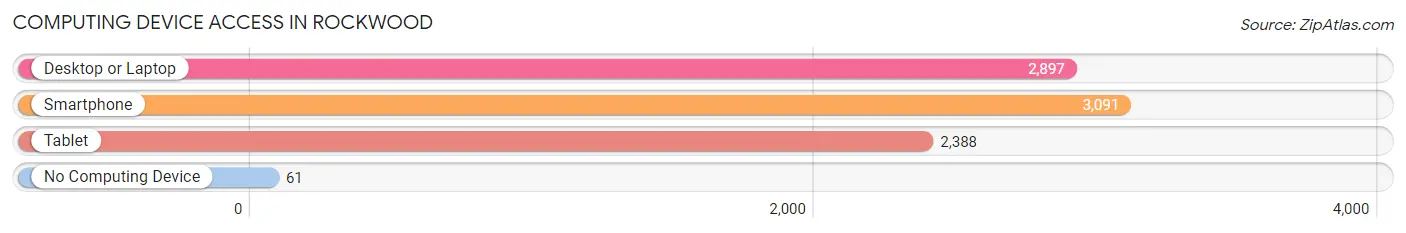
| Device Type | # Households | % Households |
| Desktop or Laptop | 2,897 | 88.0% |
| Smartphone | 3,091 | 93.9% |
| Tablet | 2,388 | 72.5% |
| No Computing Device | 61 | 1.8% |
| Total | 3,292 | 100.0% |
Internet Access in Rockwood
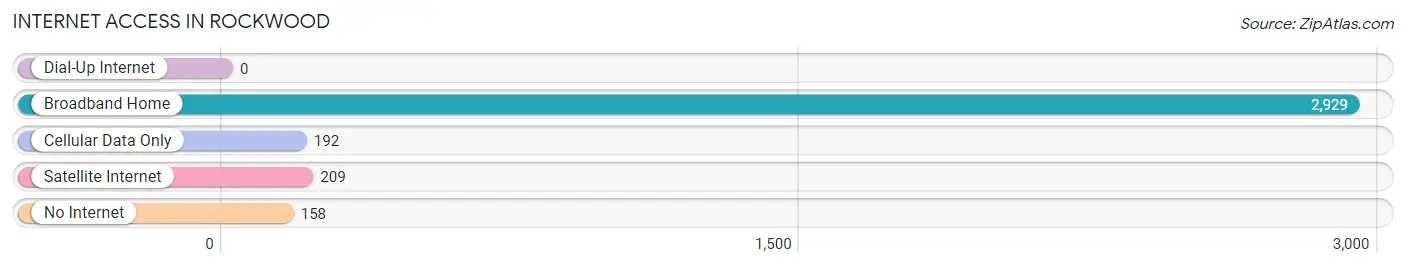
| Internet Type | # Households | % Households |
| Dial-Up Internet | 0 | 0.0% |
| Broadband Home | 2,929 | 89.0% |
| Cellular Data Only | 192 | 5.8% |
| Satellite Internet | 209 | 6.4% |
| No Internet | 158 | 4.8% |
| Total | 3,292 | 100.0% |
Rockwood Summary
Woodstock, Virginia is a small town located in the Shenandoah Valley of Virginia. It is situated in the northern part of Shenandoah County, and is the county seat. The town is located at the intersection of U.S. Route 11 and State Route 42, and is approximately 70 miles west of Washington, D.C. The population of Woodstock was estimated to be 2,845 in 2019.
History
Woodstock was founded in 1761 by German immigrants, and was originally known as Strasburg. The town was renamed Woodstock in 1778, after the Battle of Woodstock, which was fought nearby. The town was officially incorporated in 1808.
Woodstock was an important stop on the Valley Turnpike, which connected Winchester to Staunton. The turnpike was a major transportation route in the 19th century, and was used by stagecoaches, freight wagons, and military troops.
During the Civil War, Woodstock was the site of several skirmishes between Union and Confederate forces. The town was also the site of a Confederate hospital, and was the home of Confederate General Thomas J. "Stonewall" Jackson.
Geography
Woodstock is located in the northern part of Shenandoah County, in the Shenandoah Valley of Virginia. The town is situated at the intersection of U.S. Route 11 and State Route 42. The town is approximately 70 miles west of Washington, D.C.
The town is located in the Appalachian Mountains, and is surrounded by the Blue Ridge Mountains to the east and the Allegheny Mountains to the west. The town is situated in a valley, and is surrounded by rolling hills and farmland.
Economy
Woodstock's economy is largely based on agriculture and tourism. The town is home to several farms, which produce a variety of crops, including corn, wheat, hay, and apples. The town is also home to several wineries, which produce a variety of wines.
Tourism is an important part of the local economy, as the town is home to several historic sites, including the Woodstock Museum, the Woodstock Historic District, and the Woodstock Courthouse. The town is also home to several festivals and events, including the Shenandoah Valley Music Festival and the Woodstock Wine and Music Festival.
Demographics
As of 2019, the population of Woodstock was estimated to be 2,845. The town has a median age of 43.7, and a median household income of $50,945. The town is predominantly white (93.3%), with small percentages of African American (3.2%), Hispanic (1.7%), and Asian (1.2%) residents.
Woodstock is home to several churches, including the Woodstock United Methodist Church, the Woodstock Presbyterian Church, and the Woodstock Baptist Church. The town is also home to several schools, including Woodstock Elementary School, Woodstock Middle School, and Central High School.
Common Questions
What is Per Capita Income in Rockwood?
Per Capita income in Rockwood is $45,196.
What is the Median Family Income in Rockwood?
Median Family Income in Rockwood is $104,013.
What is the Median Household income in Rockwood?
Median Household Income in Rockwood is $89,455.
What is Income or Wage Gap in Rockwood?
Income or Wage Gap in Rockwood is 28.7%.
Women in Rockwood earn 71.3 cents for every dollar earned by a man.
What is Inequality or Gini Index in Rockwood?
Inequality or Gini Index in Rockwood is 0.36.
What is the Total Population of Rockwood?
Total Population of Rockwood is 8,076.
What is the Total Male Population of Rockwood?
Total Male Population of Rockwood is 3,583.
What is the Total Female Population of Rockwood?
Total Female Population of Rockwood is 4,493.
What is the Ratio of Males per 100 Females in Rockwood?
There are 79.75 Males per 100 Females in Rockwood.
What is the Ratio of Females per 100 Males in Rockwood?
There are 125.40 Females per 100 Males in Rockwood.
What is the Median Population Age in Rockwood?
Median Population Age in Rockwood is 44.8 Years.
What is the Average Family Size in Rockwood
Average Family Size in Rockwood is 2.8 People.
What is the Average Household Size in Rockwood
Average Household Size in Rockwood is 2.4 People.
How Large is the Labor Force in Rockwood?
There are 4,175 People in the Labor Forcein in Rockwood.
What is the Percentage of People in the Labor Force in Rockwood?
61.7% of People are in the Labor Force in Rockwood.
What is the Unemployment Rate in Rockwood?
Unemployment Rate in Rockwood is 4.5%.