Forest, VA Map & Demographics
Forest Map
Forest Overview
$45,115
PER CAPITA INCOME
$87,826
AVG FAMILY INCOME
$78,327
AVG HOUSEHOLD INCOME
19.0%
WAGE / INCOME GAP [ % ]
81.0¢/ $1
WAGE / INCOME GAP [ $ ]
$12,006
FAMILY INCOME DEFICIT
0.44
INEQUALITY / GINI INDEX
11,559
TOTAL POPULATION
5,369
MALE POPULATION
6,190
FEMALE POPULATION
86.74
MALES / 100 FEMALES
115.29
FEMALES / 100 MALES
44.7
MEDIAN AGE
2.9
AVG FAMILY SIZE
2.4
AVG HOUSEHOLD SIZE
5,891
LABOR FORCE [ PEOPLE ]
59.9%
PERCENT IN LABOR FORCE
4.6%
UNEMPLOYMENT RATE
Forest Zip Codes
Income in Forest
Income Overview in Forest
Per Capita Income in Forest is $45,115, while median incomes of families and households are $87,826 and $78,327 respectively.
| Characteristic | Number | Measure |
| Per Capita Income | 11,559 | $45,115 |
| Median Family Income | 3,165 | $87,826 |
| Mean Family Income | 3,165 | $119,812 |
| Median Household Income | 4,865 | $78,327 |
| Mean Household Income | 4,865 | $105,775 |
| Income Deficit | 3,165 | $12,006 |
| Wage / Income Gap (%) | 11,559 | 18.97% |
| Wage / Income Gap ($) | 11,559 | 81.03¢ per $1 |
| Gini / Inequality Index | 11,559 | 0.44 |
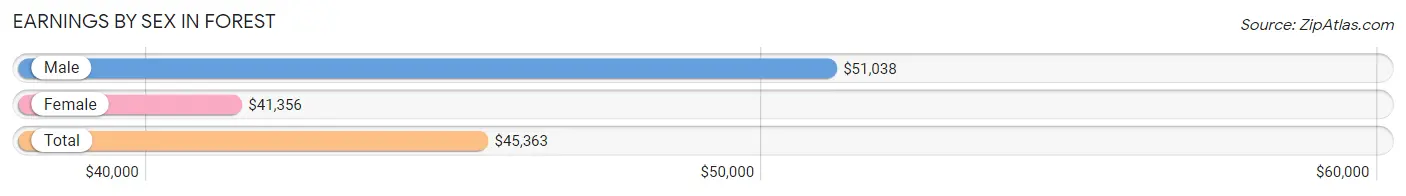
Earnings by Sex in Forest
Average Earnings in Forest are $45,363, $51,038 for men and $41,356 for women, a difference of 19.0%.
| Sex | Number | Average Earnings |
| Male | 3,235 (53.0%) | $51,038 |
| Female | 2,867 (47.0%) | $41,356 |
| Total | 6,102 (100.0%) | $45,363 |
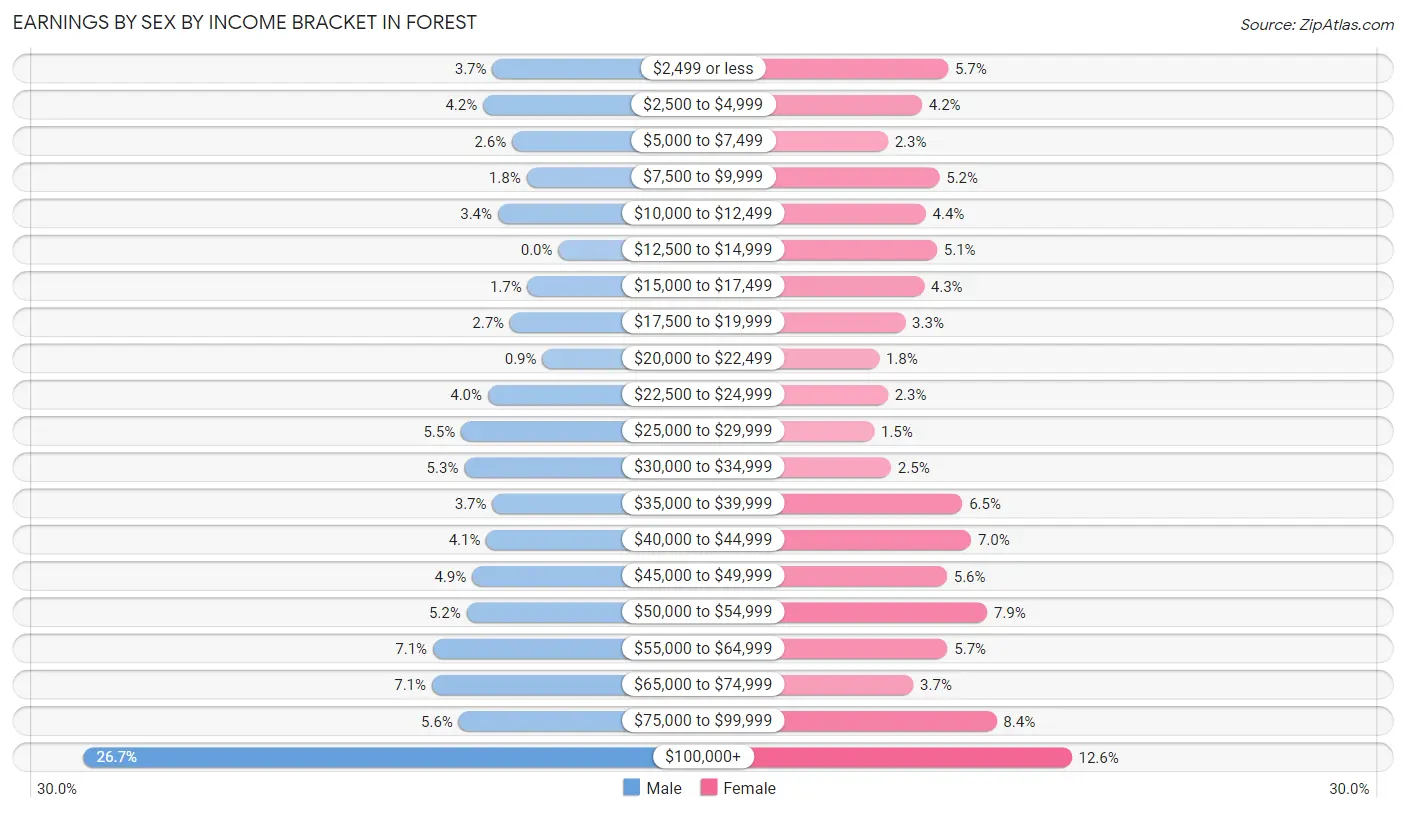
Earnings by Sex by Income Bracket in Forest
The most common earnings brackets in Forest are $100,000+ for men (863 | 26.7%) and $100,000+ for women (362 | 12.6%).
| Income | Male | Female |
| $2,499 or less | 120 (3.7%) | 163 (5.7%) |
| $2,500 to $4,999 | 137 (4.2%) | 121 (4.2%) |
| $5,000 to $7,499 | 84 (2.6%) | 66 (2.3%) |
| $7,500 to $9,999 | 58 (1.8%) | 149 (5.2%) |
| $10,000 to $12,499 | 110 (3.4%) | 127 (4.4%) |
| $12,500 to $14,999 | 0 (0.0%) | 145 (5.1%) |
| $15,000 to $17,499 | 56 (1.7%) | 124 (4.3%) |
| $17,500 to $19,999 | 88 (2.7%) | 94 (3.3%) |
| $20,000 to $22,499 | 29 (0.9%) | 52 (1.8%) |
| $22,500 to $24,999 | 128 (4.0%) | 66 (2.3%) |
| $25,000 to $29,999 | 177 (5.5%) | 44 (1.5%) |
| $30,000 to $34,999 | 171 (5.3%) | 71 (2.5%) |
| $35,000 to $39,999 | 120 (3.7%) | 186 (6.5%) |
| $40,000 to $44,999 | 131 (4.1%) | 200 (7.0%) |
| $45,000 to $49,999 | 157 (4.9%) | 161 (5.6%) |
| $50,000 to $54,999 | 167 (5.2%) | 226 (7.9%) |
| $55,000 to $64,999 | 228 (7.0%) | 162 (5.7%) |
| $65,000 to $74,999 | 230 (7.1%) | 107 (3.7%) |
| $75,000 to $99,999 | 181 (5.6%) | 241 (8.4%) |
| $100,000+ | 863 (26.7%) | 362 (12.6%) |
| Total | 3,235 (100.0%) | 2,867 (100.0%) |
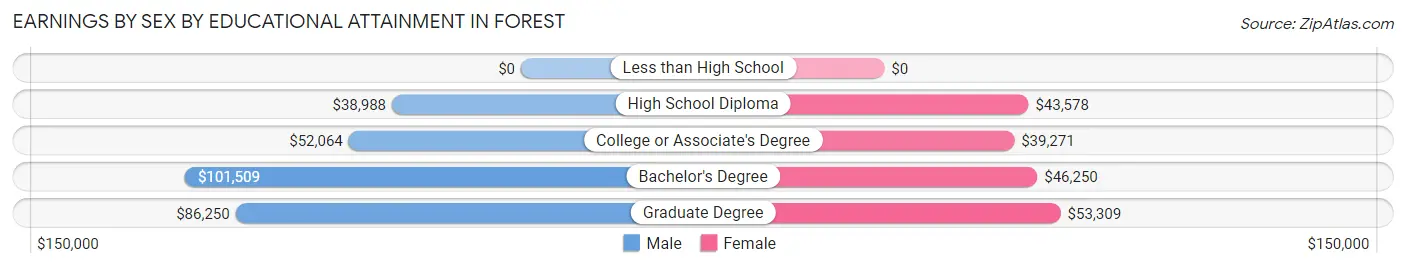
Earnings by Sex by Educational Attainment in Forest
Average earnings in Forest are $61,127 for men and $44,542 for women, a difference of 27.1%. Men with an educational attainment of bachelor's degree enjoy the highest average annual earnings of $101,509, while those with high school diploma education earn the least with $38,988. Women with an educational attainment of graduate degree earn the most with the average annual earnings of $53,309, while those with college or associate's degree education have the smallest earnings of $39,271.
| Educational Attainment | Male Income | Female Income |
| Less than High School | - | - |
| High School Diploma | $38,988 | $43,578 |
| College or Associate's Degree | $52,064 | $39,271 |
| Bachelor's Degree | $101,509 | $46,250 |
| Graduate Degree | $86,250 | $53,309 |
| Total | $61,127 | $44,542 |
Family Income in Forest
Family Income Brackets in Forest
According to the Forest family income data, there are 741 families falling into the $50,000 to $74,999 income range, which is the most common income bracket and makes up 23.4% of all families.
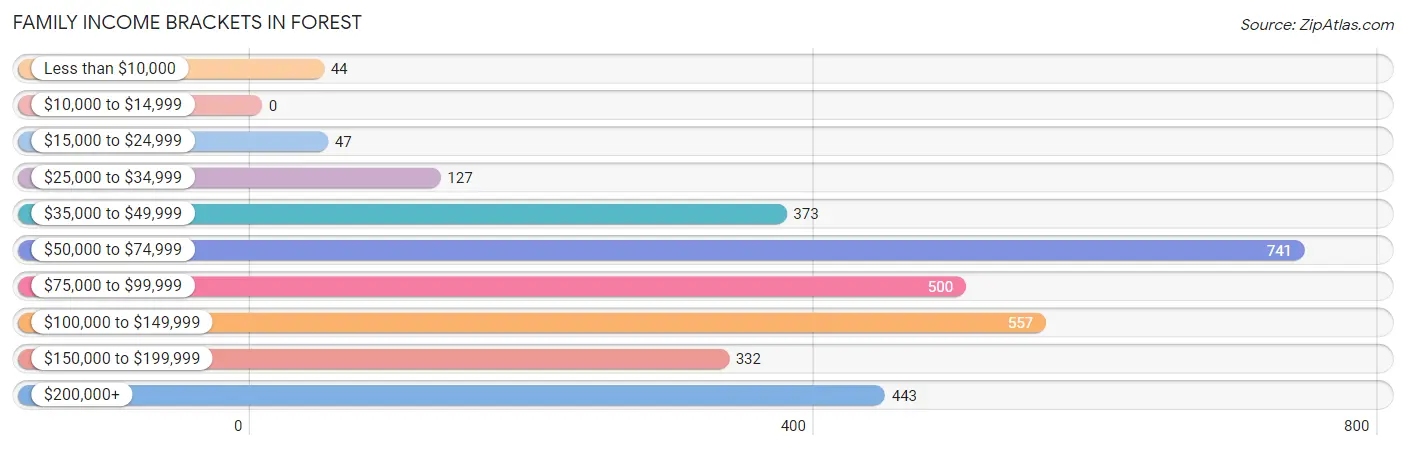
| Income Bracket | # Families | % Families |
| Less than $10,000 | 44 | 1.4% |
| $10,000 to $14,999 | 0 | 0.0% |
| $15,000 to $24,999 | 47 | 1.5% |
| $25,000 to $34,999 | 127 | 4.0% |
| $35,000 to $49,999 | 373 | 11.8% |
| $50,000 to $74,999 | 741 | 23.4% |
| $75,000 to $99,999 | 500 | 15.8% |
| $100,000 to $149,999 | 557 | 17.6% |
| $150,000 to $199,999 | 332 | 10.5% |
| $200,000+ | 443 | 14.0% |
Family Income by Famaliy Size in Forest
7+ person families (60 | 1.9%) account for the highest median family income in Forest with $250,001 per family, while 2-person families (1,772 | 56.0%) have the highest median income of $42,514 per family member.
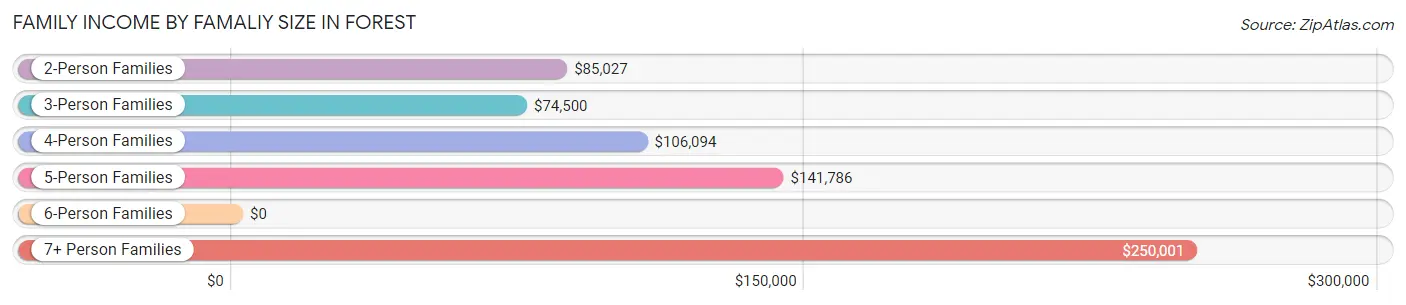
| Income Bracket | # Families | Median Income |
| 2-Person Families | 1,772 (56.0%) | $85,027 |
| 3-Person Families | 594 (18.8%) | $74,500 |
| 4-Person Families | 453 (14.3%) | $106,094 |
| 5-Person Families | 226 (7.1%) | $141,786 |
| 6-Person Families | 60 (1.9%) | $0 |
| 7+ Person Families | 60 (1.9%) | $250,001 |
| Total | 3,165 (100.0%) | $87,826 |
Family Income by Number of Earners in Forest
The median family income in Forest is $87,826, with families comprising 3+ earners (237) having the highest median family income of $139,712, while families with 1 earner (1,077) have the lowest median family income of $65,815, accounting for 7.5% and 34.0% of families, respectively.
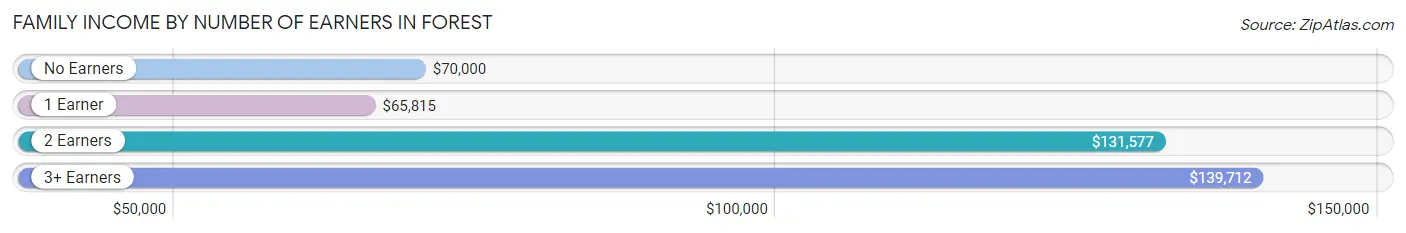
| Number of Earners | # Families | Median Income |
| No Earners | 640 (20.2%) | $70,000 |
| 1 Earner | 1,077 (34.0%) | $65,815 |
| 2 Earners | 1,211 (38.3%) | $131,577 |
| 3+ Earners | 237 (7.5%) | $139,712 |
| Total | 3,165 (100.0%) | $87,826 |
Household Income in Forest
Household Income Brackets in Forest
With 973 households falling in the category, the $50,000 to $74,999 income range is the most frequent in Forest, accounting for 20.0% of all households. In contrast, only 68 households (1.4%) fall into the $10,000 to $14,999 income bracket, making it the least populous group.
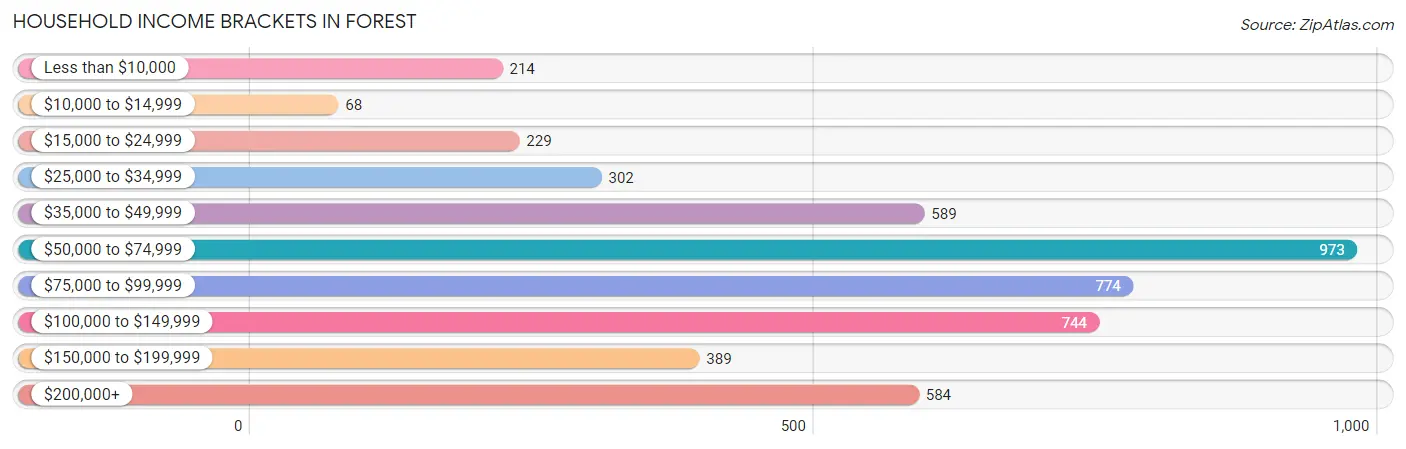
| Income Bracket | # Households | % Households |
| Less than $10,000 | 214 | 4.4% |
| $10,000 to $14,999 | 68 | 1.4% |
| $15,000 to $24,999 | 229 | 4.7% |
| $25,000 to $34,999 | 302 | 6.2% |
| $35,000 to $49,999 | 589 | 12.1% |
| $50,000 to $74,999 | 973 | 20.0% |
| $75,000 to $99,999 | 774 | 15.9% |
| $100,000 to $149,999 | 744 | 15.3% |
| $150,000 to $199,999 | 389 | 8.0% |
| $200,000+ | 584 | 12.0% |
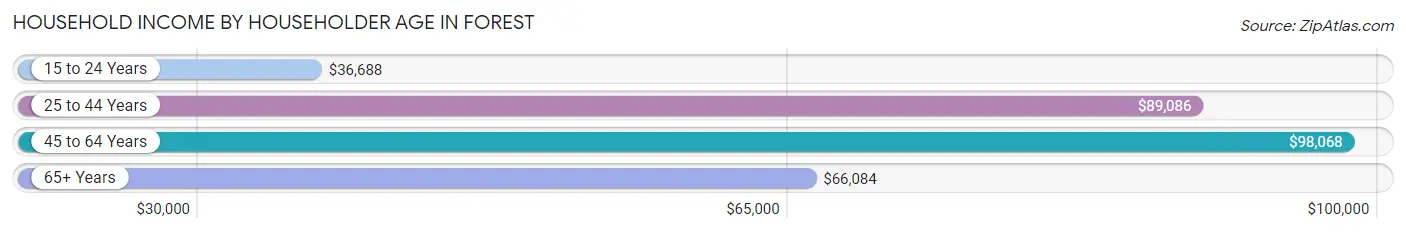
Household Income by Householder Age in Forest
The median household income in Forest is $78,327, with the highest median household income of $98,068 found in the 45 to 64 years age bracket for the primary householder. A total of 1,875 households (38.5%) fall into this category. Meanwhile, the 15 to 24 years age bracket for the primary householder has the lowest median household income of $36,688, with 227 households (4.7%) in this group.
| Income Bracket | # Households | Median Income |
| 15 to 24 Years | 227 (4.7%) | $36,688 |
| 25 to 44 Years | 1,338 (27.5%) | $89,086 |
| 45 to 64 Years | 1,875 (38.5%) | $98,068 |
| 65+ Years | 1,425 (29.3%) | $66,084 |
| Total | 4,865 (100.0%) | $78,327 |
Poverty in Forest
Income Below Poverty by Sex and Age in Forest
With 4.5% poverty level for males and 6.4% for females among the residents of Forest, 15 year old males and 18 to 24 year old females are the most vulnerable to poverty, with 22 males (75.9%) and 166 females (25.8%) in their respective age groups living below the poverty level.
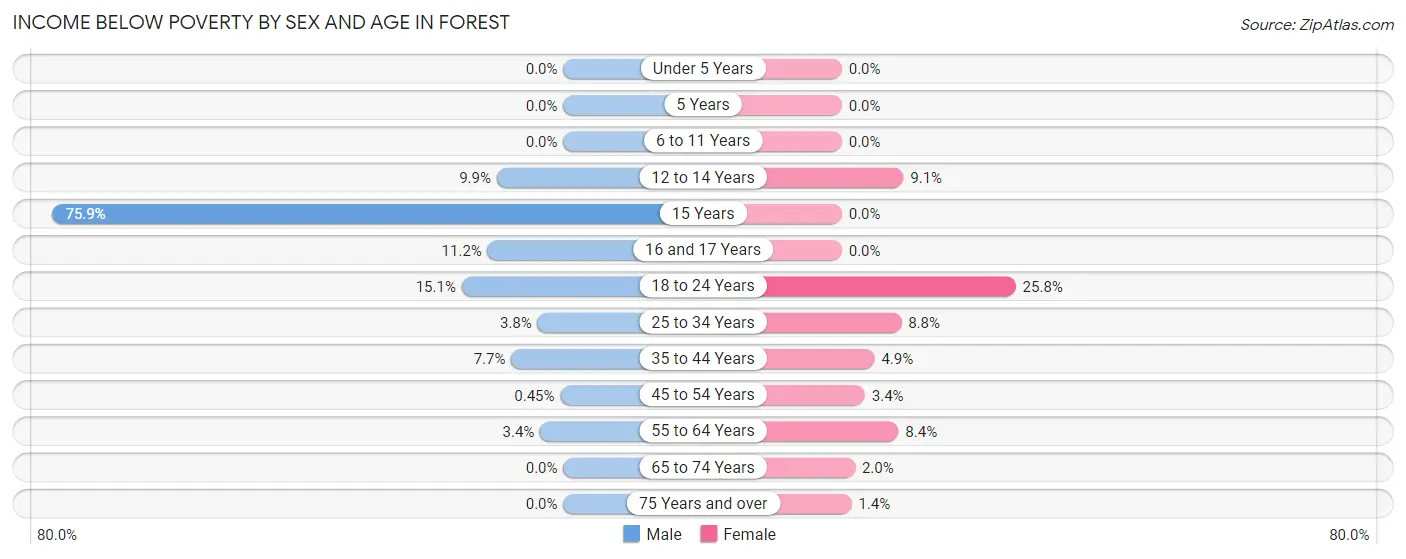
| Age Bracket | Male | Female |
| Under 5 Years | 0 (0.0%) | 0 (0.0%) |
| 5 Years | 0 (0.0%) | 0 (0.0%) |
| 6 to 11 Years | 0 (0.0%) | 0 (0.0%) |
| 12 to 14 Years | 16 (9.9%) | 16 (9.1%) |
| 15 Years | 22 (75.9%) | 0 (0.0%) |
| 16 and 17 Years | 10 (11.2%) | 0 (0.0%) |
| 18 to 24 Years | 88 (15.1%) | 166 (25.8%) |
| 25 to 34 Years | 25 (3.8%) | 61 (8.8%) |
| 35 to 44 Years | 46 (7.7%) | 31 (4.9%) |
| 45 to 54 Years | 3 (0.4%) | 26 (3.4%) |
| 55 to 64 Years | 32 (3.4%) | 71 (8.4%) |
| 65 to 74 Years | 0 (0.0%) | 14 (2.0%) |
| 75 Years and over | 0 (0.0%) | 11 (1.4%) |
| Total | 242 (4.5%) | 396 (6.4%) |
Income Above Poverty by Sex and Age in Forest
According to the poverty statistics in Forest, males aged under 5 years and females aged under 5 years are the age groups that are most secure financially, with 100.0% of males and 100.0% of females in these age groups living above the poverty line.
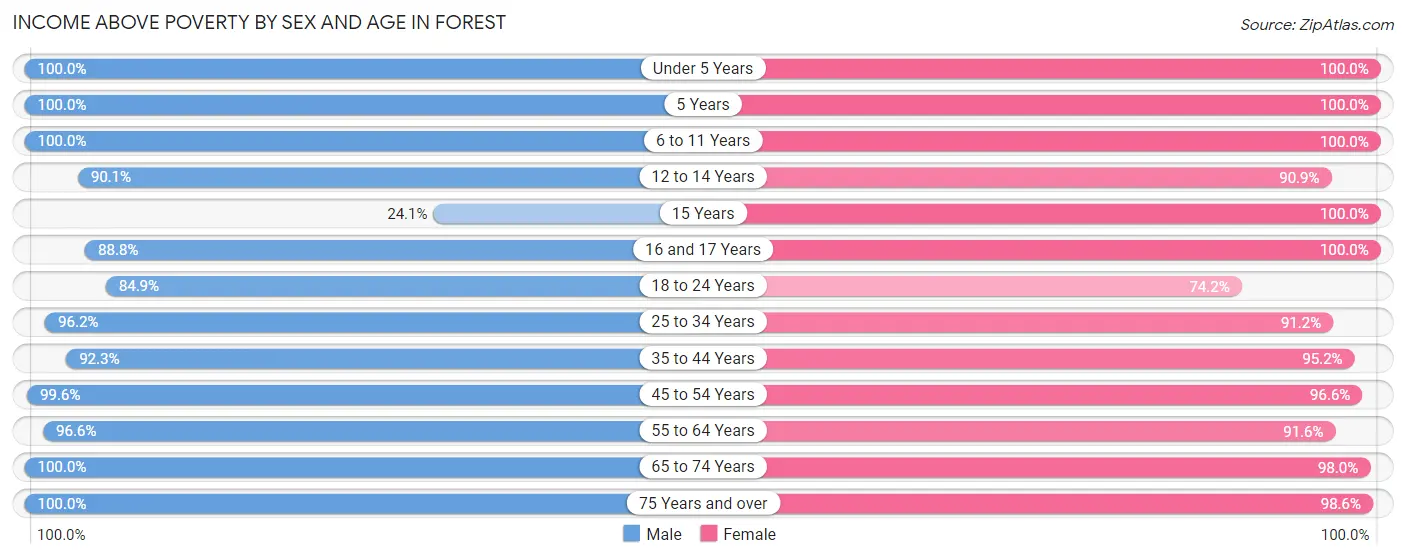
| Age Bracket | Male | Female |
| Under 5 Years | 241 (100.0%) | 276 (100.0%) |
| 5 Years | 56 (100.0%) | 36 (100.0%) |
| 6 to 11 Years | 322 (100.0%) | 384 (100.0%) |
| 12 to 14 Years | 146 (90.1%) | 159 (90.9%) |
| 15 Years | 7 (24.1%) | 27 (100.0%) |
| 16 and 17 Years | 79 (88.8%) | 206 (100.0%) |
| 18 to 24 Years | 495 (84.9%) | 477 (74.2%) |
| 25 to 34 Years | 629 (96.2%) | 631 (91.2%) |
| 35 to 44 Years | 549 (92.3%) | 608 (95.2%) |
| 45 to 54 Years | 660 (99.6%) | 734 (96.6%) |
| 55 to 64 Years | 898 (96.6%) | 773 (91.6%) |
| 65 to 74 Years | 543 (100.0%) | 702 (98.0%) |
| 75 Years and over | 473 (100.0%) | 755 (98.6%) |
| Total | 5,098 (95.5%) | 5,768 (93.6%) |
Income Below Poverty Among Married-Couple Families in Forest
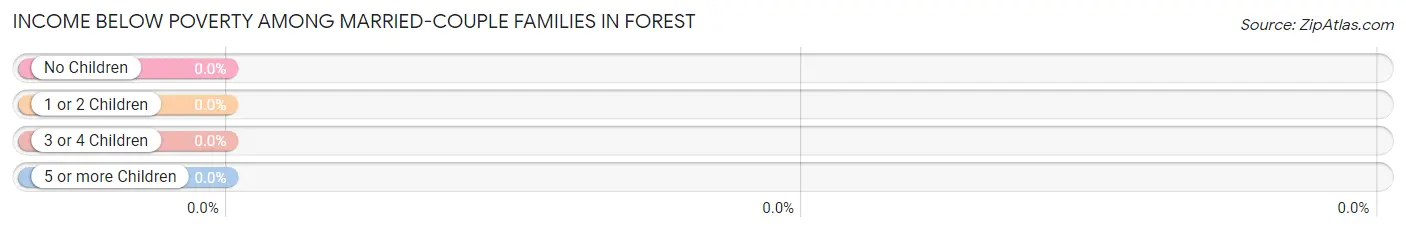
| Children | Above Poverty | Below Poverty |
| No Children | 1,915 (100.0%) | 0 (0.0%) |
| 1 or 2 Children | 670 (100.0%) | 0 (0.0%) |
| 3 or 4 Children | 211 (100.0%) | 0 (0.0%) |
| 5 or more Children | 0 (0.0%) | 0 (0.0%) |
| Total | 2,796 (100.0%) | 0 (0.0%) |
Income Below Poverty Among Single-Parent Households in Forest
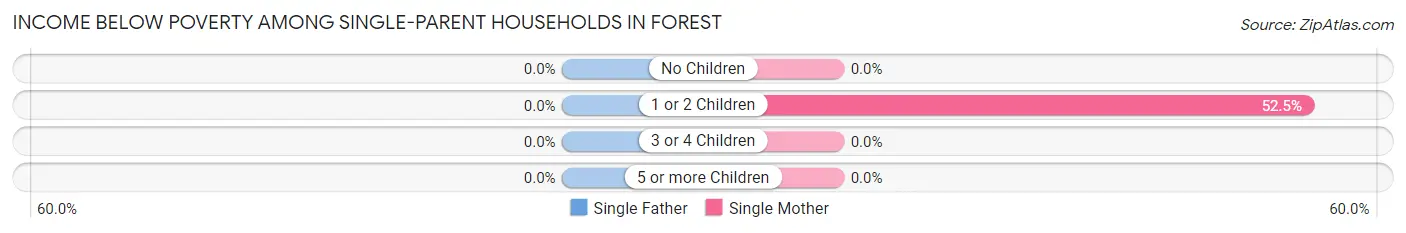
| Children | Single Father | Single Mother |
| No Children | 0 (0.0%) | 0 (0.0%) |
| 1 or 2 Children | 0 (0.0%) | 52 (52.5%) |
| 3 or 4 Children | 0 (0.0%) | 0 (0.0%) |
| 5 or more Children | 0 (0.0%) | 0 (0.0%) |
| Total | 0 (0.0%) | 52 (22.3%) |
Income Below Poverty Among Married-Couple vs Single-Parent Households in Forest
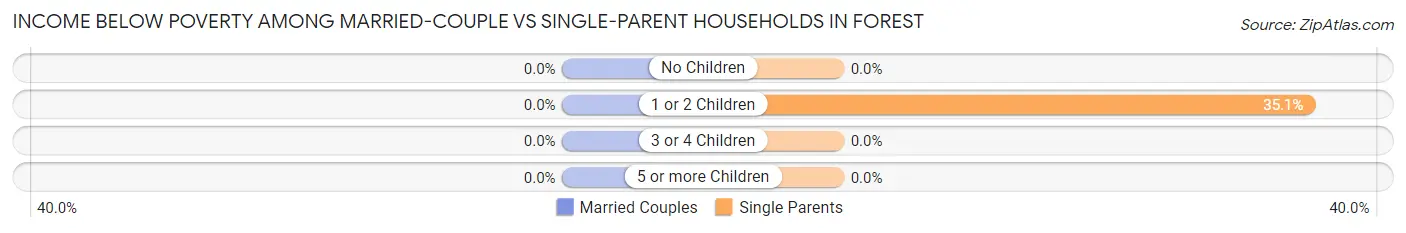
| Children | Married-Couple Families | Single-Parent Households |
| No Children | 0 (0.0%) | 0 (0.0%) |
| 1 or 2 Children | 0 (0.0%) | 52 (35.1%) |
| 3 or 4 Children | 0 (0.0%) | 0 (0.0%) |
| 5 or more Children | 0 (0.0%) | 0 (0.0%) |
| Total | 0 (0.0%) | 52 (14.1%) |
Race in Forest
The most populous races in Forest are White / Caucasian (9,096 | 78.7%), Black / African American (1,159 | 10.0%), and Two or more Races (876 | 7.6%).
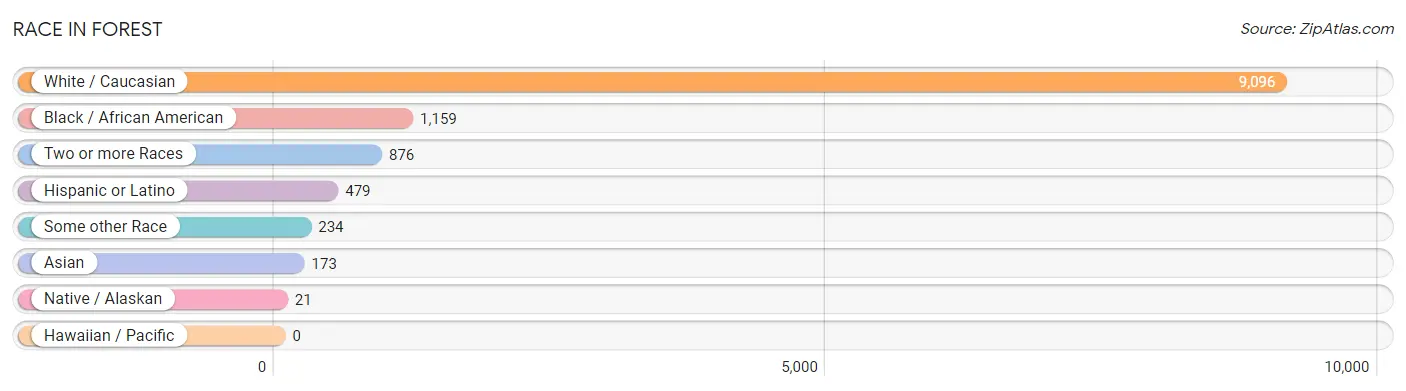
| Race | # Population | % Population |
| Asian | 173 | 1.5% |
| Black / African American | 1,159 | 10.0% |
| Hawaiian / Pacific | 0 | 0.0% |
| Hispanic or Latino | 479 | 4.1% |
| Native / Alaskan | 21 | 0.2% |
| White / Caucasian | 9,096 | 78.7% |
| Two or more Races | 876 | 7.6% |
| Some other Race | 234 | 2.0% |
| Total | 11,559 | 100.0% |
Ancestry in Forest
The most populous ancestries reported in Forest are American (1,651 | 14.3%), English (1,546 | 13.4%), German (1,327 | 11.5%), Irish (874 | 7.6%), and Polish (664 | 5.7%), together accounting for 52.4% of all Forest residents.
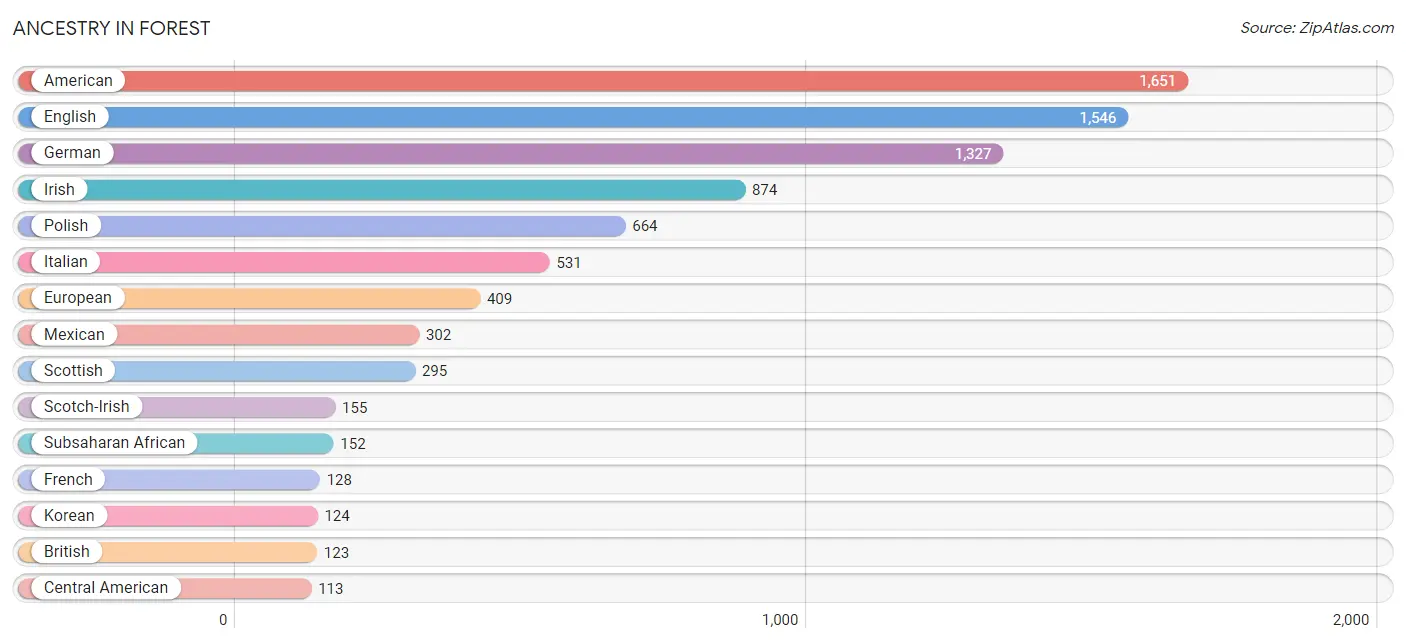
| Ancestry | # Population | % Population |
| African | 87 | 0.7% |
| American | 1,651 | 14.3% |
| Arab | 55 | 0.5% |
| Austrian | 24 | 0.2% |
| Belgian | 16 | 0.1% |
| Bhutanese | 28 | 0.2% |
| British | 123 | 1.1% |
| Burmese | 50 | 0.4% |
| Central American | 113 | 1.0% |
| Cherokee | 51 | 0.4% |
| Costa Rican | 7 | 0.1% |
| Cuban | 14 | 0.1% |
| Danish | 22 | 0.2% |
| Dutch | 64 | 0.5% |
| Eastern European | 44 | 0.4% |
| English | 1,546 | 13.4% |
| European | 409 | 3.5% |
| French | 128 | 1.1% |
| German | 1,327 | 11.5% |
| Greek | 28 | 0.2% |
| Guatemalan | 19 | 0.2% |
| Honduran | 29 | 0.3% |
| Hungarian | 77 | 0.7% |
| Indian (Asian) | 65 | 0.6% |
| Irish | 874 | 7.6% |
| Italian | 531 | 4.6% |
| Kenyan | 29 | 0.3% |
| Korean | 124 | 1.1% |
| Lebanese | 55 | 0.5% |
| Lithuanian | 22 | 0.2% |
| Mexican | 302 | 2.6% |
| Nicaraguan | 8 | 0.1% |
| Nigerian | 18 | 0.2% |
| Pennsylvania German | 10 | 0.1% |
| Peruvian | 12 | 0.1% |
| Polish | 664 | 5.7% |
| Portuguese | 9 | 0.1% |
| Puerto Rican | 14 | 0.1% |
| Russian | 24 | 0.2% |
| Salvadoran | 50 | 0.4% |
| Scandinavian | 50 | 0.4% |
| Scotch-Irish | 155 | 1.3% |
| Scottish | 295 | 2.5% |
| Slovak | 38 | 0.3% |
| South American | 18 | 0.2% |
| Spaniard | 8 | 0.1% |
| Spanish | 10 | 0.1% |
| Subsaharan African | 152 | 1.3% |
| Swedish | 25 | 0.2% |
| Swiss | 11 | 0.1% |
| Thai | 51 | 0.4% |
| Ukrainian | 27 | 0.2% |
| Uruguayan | 6 | 0.1% |
| Welsh | 55 | 0.5% |
| Zimbabwean | 18 | 0.2% | View All 55 Rows |
Immigrants in Forest
The most numerous immigrant groups reported in Forest came from Latin America (239 | 2.1%), Central America (212 | 1.8%), Asia (134 | 1.2%), Mexico (107 | 0.9%), and South Central Asia (58 | 0.5%), together accounting for 6.5% of all Forest residents.
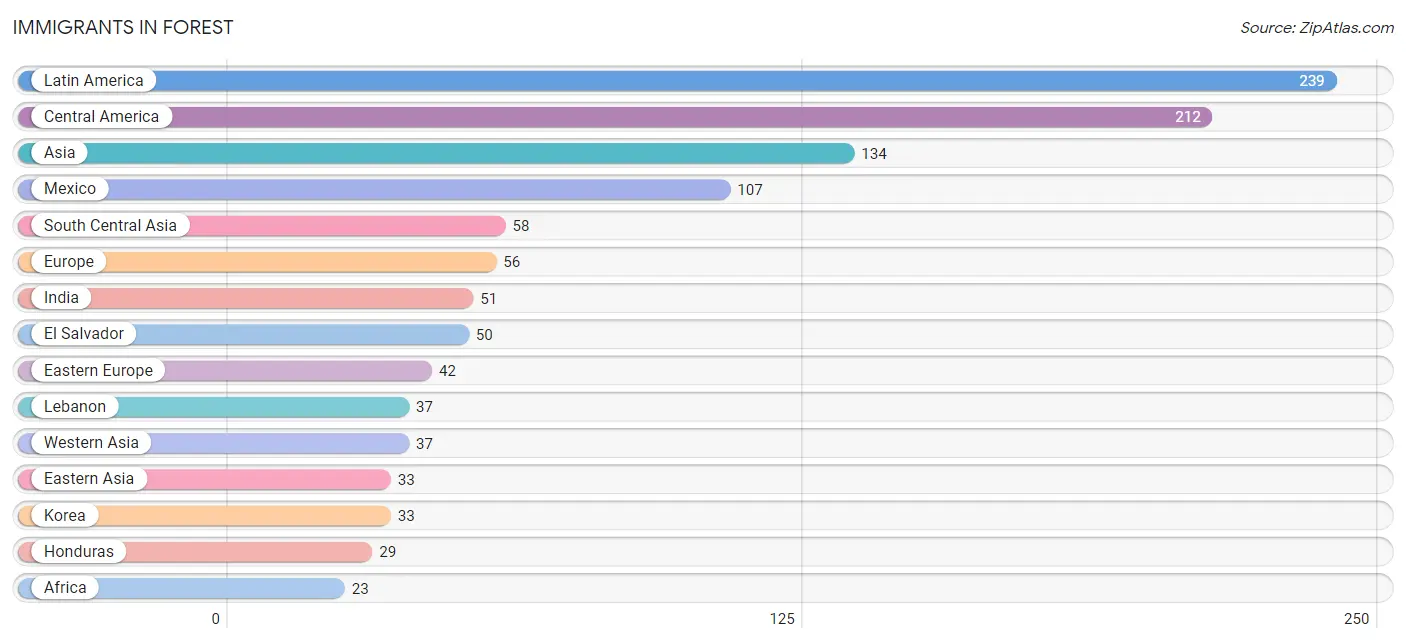
| Immigration Origin | # Population | % Population |
| Africa | 23 | 0.2% |
| Asia | 134 | 1.2% |
| Australia | 15 | 0.1% |
| Bahamas | 21 | 0.2% |
| Bangladesh | 7 | 0.1% |
| Canada | 9 | 0.1% |
| Caribbean | 21 | 0.2% |
| Central America | 212 | 1.8% |
| Costa Rica | 7 | 0.1% |
| Eastern Africa | 18 | 0.2% |
| Eastern Asia | 33 | 0.3% |
| Eastern Europe | 42 | 0.4% |
| El Salvador | 50 | 0.4% |
| Europe | 56 | 0.5% |
| Germany | 14 | 0.1% |
| Guatemala | 19 | 0.2% |
| Honduras | 29 | 0.3% |
| India | 51 | 0.4% |
| Korea | 33 | 0.3% |
| Latin America | 239 | 2.1% |
| Latvia | 13 | 0.1% |
| Lebanon | 37 | 0.3% |
| Mexico | 107 | 0.9% |
| Nigeria | 5 | 0.0% |
| Oceania | 15 | 0.1% |
| Russia | 11 | 0.1% |
| South America | 6 | 0.1% |
| South Central Asia | 58 | 0.5% |
| South Eastern Asia | 6 | 0.1% |
| Ukraine | 18 | 0.2% |
| Uruguay | 6 | 0.1% |
| Vietnam | 6 | 0.1% |
| Western Africa | 5 | 0.0% |
| Western Asia | 37 | 0.3% |
| Western Europe | 14 | 0.1% |
| Zimbabwe | 18 | 0.2% | View All 36 Rows |
Sex and Age in Forest
Sex and Age in Forest
The most populous age groups in Forest are 55 to 59 Years (511 | 9.5%) for men and 20 to 24 Years (552 | 8.9%) for women.
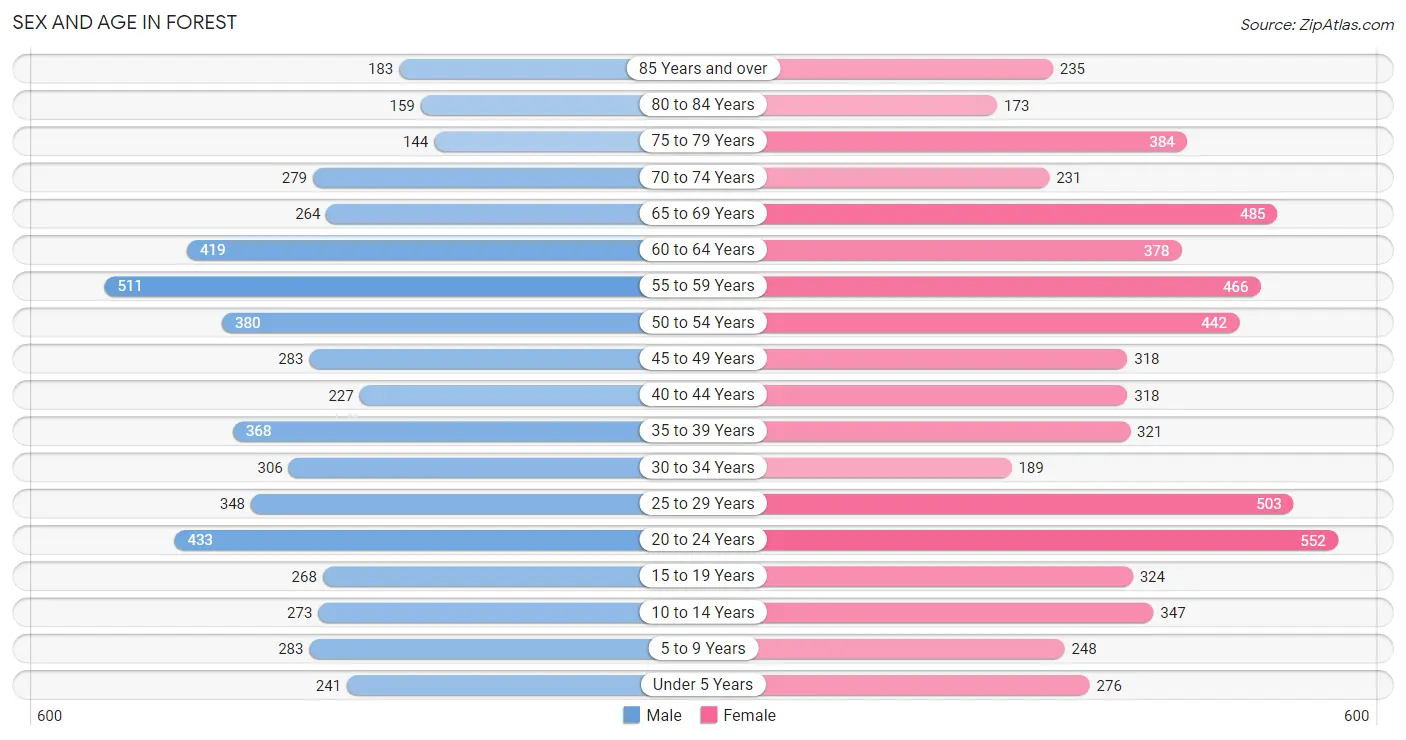
| Age Bracket | Male | Female |
| Under 5 Years | 241 (4.5%) | 276 (4.5%) |
| 5 to 9 Years | 283 (5.3%) | 248 (4.0%) |
| 10 to 14 Years | 273 (5.1%) | 347 (5.6%) |
| 15 to 19 Years | 268 (5.0%) | 324 (5.2%) |
| 20 to 24 Years | 433 (8.1%) | 552 (8.9%) |
| 25 to 29 Years | 348 (6.5%) | 503 (8.1%) |
| 30 to 34 Years | 306 (5.7%) | 189 (3.0%) |
| 35 to 39 Years | 368 (6.9%) | 321 (5.2%) |
| 40 to 44 Years | 227 (4.2%) | 318 (5.1%) |
| 45 to 49 Years | 283 (5.3%) | 318 (5.1%) |
| 50 to 54 Years | 380 (7.1%) | 442 (7.1%) |
| 55 to 59 Years | 511 (9.5%) | 466 (7.5%) |
| 60 to 64 Years | 419 (7.8%) | 378 (6.1%) |
| 65 to 69 Years | 264 (4.9%) | 485 (7.8%) |
| 70 to 74 Years | 279 (5.2%) | 231 (3.7%) |
| 75 to 79 Years | 144 (2.7%) | 384 (6.2%) |
| 80 to 84 Years | 159 (3.0%) | 173 (2.8%) |
| 85 Years and over | 183 (3.4%) | 235 (3.8%) |
| Total | 5,369 (100.0%) | 6,190 (100.0%) |
Families and Households in Forest
Median Family Size in Forest
The median family size in Forest is 2.88 persons per family, with married-couple families (2,796 | 88.3%) accounting for the largest median family size of 2.94 persons per family. On the other hand, single male/father families (136 | 4.3%) represent the smallest median family size with 2.25 persons per family.
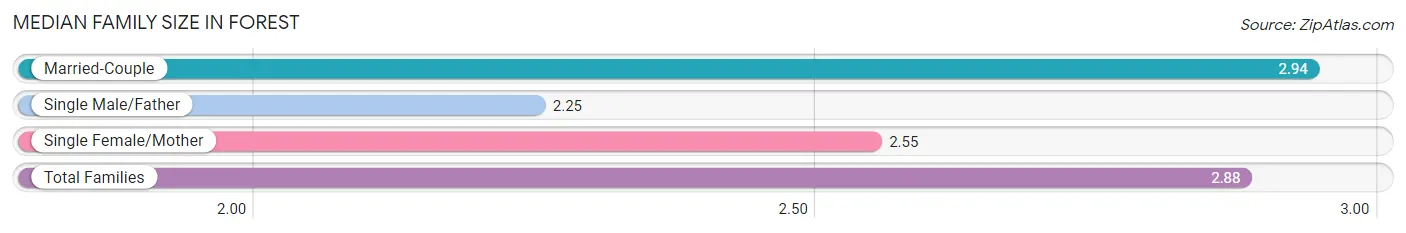
| Family Type | # Families | Family Size |
| Married-Couple | 2,796 (88.3%) | 2.94 |
| Single Male/Father | 136 (4.3%) | 2.25 |
| Single Female/Mother | 233 (7.4%) | 2.55 |
| Total Families | 3,165 (100.0%) | 2.88 |
Median Household Size in Forest
The median household size in Forest is 2.36 persons per household, with married-couple households (2,796 | 57.5%) accounting for the largest median household size of 2.97 persons per household. non-family households (1,700 | 34.9%) represent the smallest median household size with 1.30 persons per household.
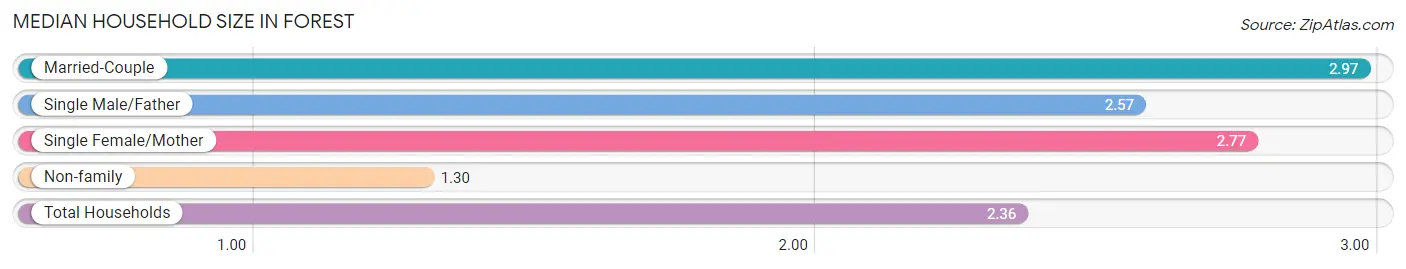
| Household Type | # Households | Household Size |
| Married-Couple | 2,796 (57.5%) | 2.97 |
| Single Male/Father | 136 (2.8%) | 2.57 |
| Single Female/Mother | 233 (4.8%) | 2.77 |
| Non-family | 1,700 (34.9%) | 1.30 |
| Total Households | 4,865 (100.0%) | 2.36 |
Household Size by Marriage Status in Forest
Out of a total of 4,865 households in Forest, 3,165 (65.1%) are family households, while 1,700 (34.9%) are nonfamily households. The most numerous type of family households are 2-person households, comprising 1,672, and the most common type of nonfamily households are 1-person households, comprising 1,389.
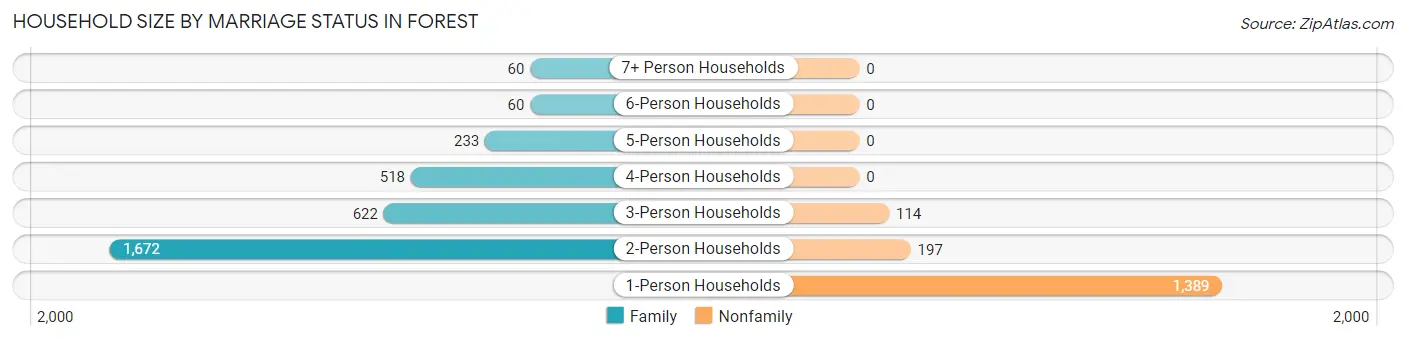
| Household Size | Family Households | Nonfamily Households |
| 1-Person Households | - | 1,389 (28.5%) |
| 2-Person Households | 1,672 (34.4%) | 197 (4.1%) |
| 3-Person Households | 622 (12.8%) | 114 (2.3%) |
| 4-Person Households | 518 (10.6%) | 0 (0.0%) |
| 5-Person Households | 233 (4.8%) | 0 (0.0%) |
| 6-Person Households | 60 (1.2%) | 0 (0.0%) |
| 7+ Person Households | 60 (1.2%) | 0 (0.0%) |
| Total | 3,165 (65.1%) | 1,700 (34.9%) |
Female Fertility in Forest
Fertility by Age in Forest
Average fertility rate in Forest is 28.0 births per 1,000 women. Women in the age bracket of 20 to 34 years have the highest fertility rate with 57.0 births per 1,000 women. Women in the age bracket of 20 to 34 years acount for 100.0% of all women with births.
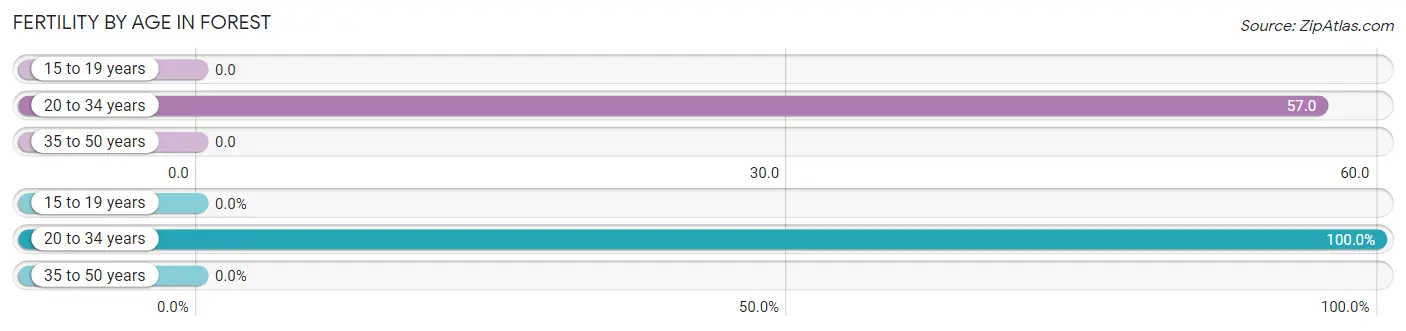
| Age Bracket | Women with Births | Births / 1,000 Women |
| 15 to 19 years | 0 (0.0%) | 0.0 |
| 20 to 34 years | 71 (100.0%) | 57.0 |
| 35 to 50 years | 0 (0.0%) | 0.0 |
| Total | 71 (100.0%) | 28.0 |
Fertility by Age by Marriage Status in Forest
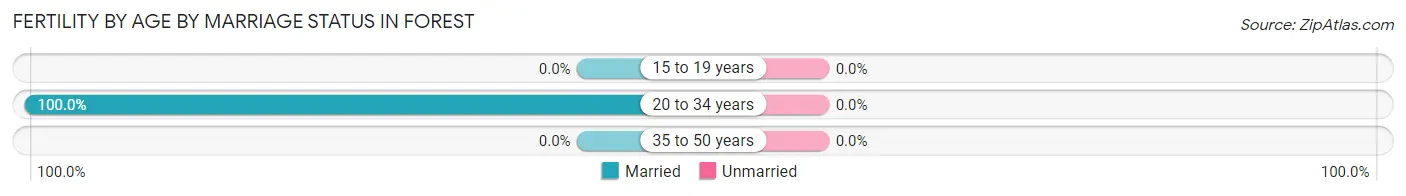
| Age Bracket | Married | Unmarried |
| 15 to 19 years | 0 (0.0%) | 0 (0.0%) |
| 20 to 34 years | 71 (100.0%) | 0 (0.0%) |
| 35 to 50 years | 0 (0.0%) | 0 (0.0%) |
| Total | 71 (100.0%) | 0 (0.0%) |
Fertility by Education in Forest
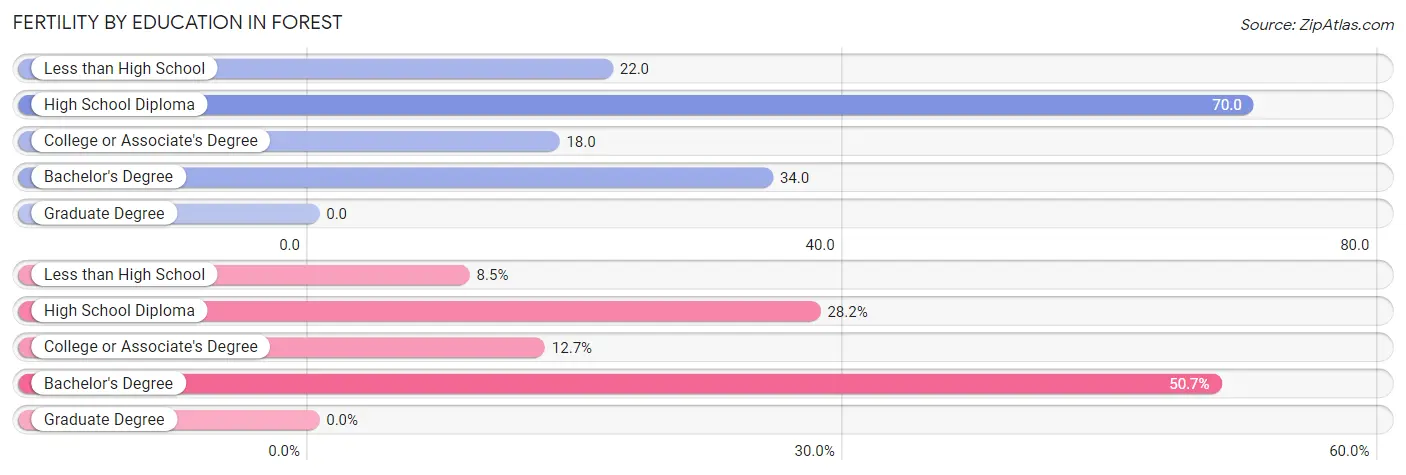
| Educational Attainment | Women with Births | Births / 1,000 Women |
| Less than High School | 6 (8.5%) | 22.0 |
| High School Diploma | 20 (28.2%) | 70.0 |
| College or Associate's Degree | 9 (12.7%) | 18.0 |
| Bachelor's Degree | 36 (50.7%) | 34.0 |
| Graduate Degree | 0 (0.0%) | 0.0 |
| Total | 71 (100.0%) | 28.0 |
Fertility by Education by Marriage Status in Forest
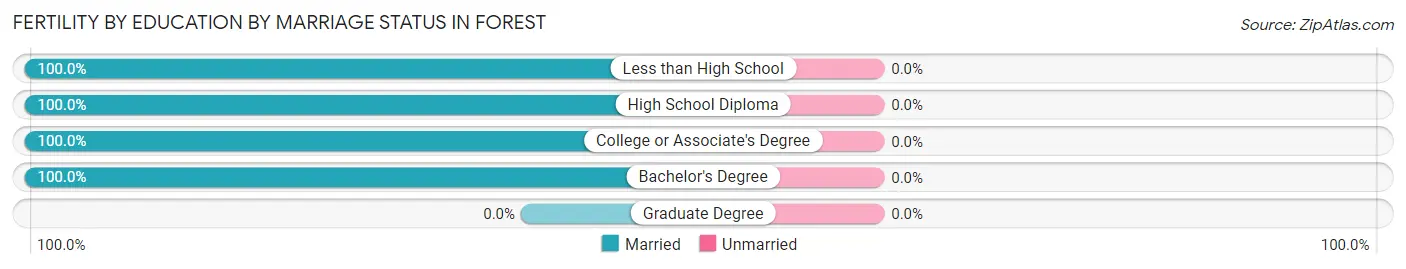
| Educational Attainment | Married | Unmarried |
| Less than High School | 6 (100.0%) | 0 (0.0%) |
| High School Diploma | 20 (100.0%) | 0 (0.0%) |
| College or Associate's Degree | 9 (100.0%) | 0 (0.0%) |
| Bachelor's Degree | 36 (100.0%) | 0 (0.0%) |
| Graduate Degree | 0 (0.0%) | 0 (0.0%) |
| Total | 71 (100.0%) | 0 (0.0%) |
Employment Characteristics in Forest
Employment by Class of Employer in Forest
Among the 5,528 employed individuals in Forest, private company employees (3,346 | 60.5%), not-for-profit organizations (769 | 13.9%), and local government employees (679 | 12.3%) make up the most common classes of employment.
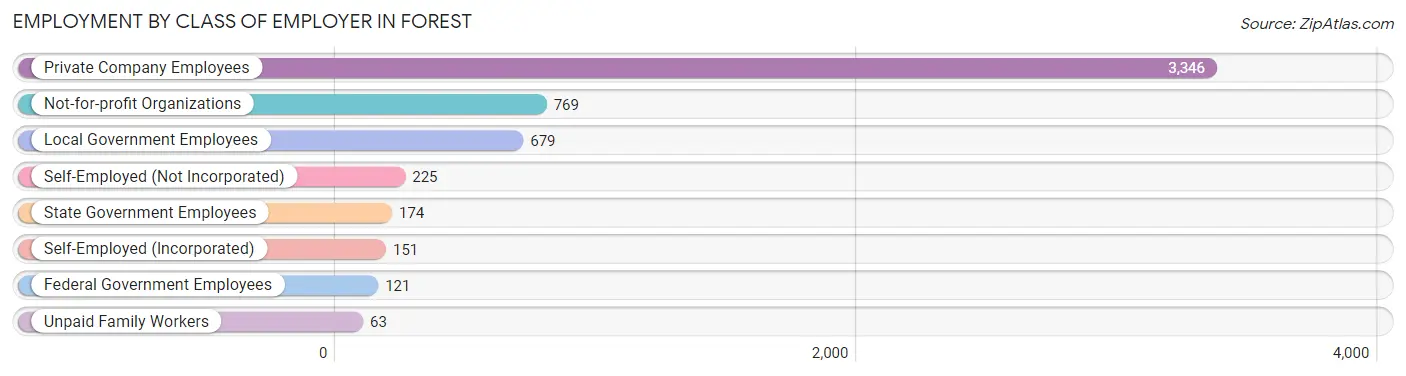
| Employer Class | # Employees | % Employees |
| Private Company Employees | 3,346 | 60.5% |
| Self-Employed (Incorporated) | 151 | 2.7% |
| Self-Employed (Not Incorporated) | 225 | 4.1% |
| Not-for-profit Organizations | 769 | 13.9% |
| Local Government Employees | 679 | 12.3% |
| State Government Employees | 174 | 3.2% |
| Federal Government Employees | 121 | 2.2% |
| Unpaid Family Workers | 63 | 1.1% |
| Total | 5,528 | 100.0% |
Employment Status by Age in Forest
According to the labor force statistics for Forest, out of the total population over 16 years of age (9,835), 59.9% or 5,891 individuals are in the labor force, with 4.6% or 271 of them unemployed. The age group with the highest labor force participation rate is 45 to 54 years, with 88.6% or 1,261 individuals in the labor force. Within the labor force, the 20 to 24 years age range has the highest percentage of unemployed individuals, with 15.2% or 122 of them being unemployed.
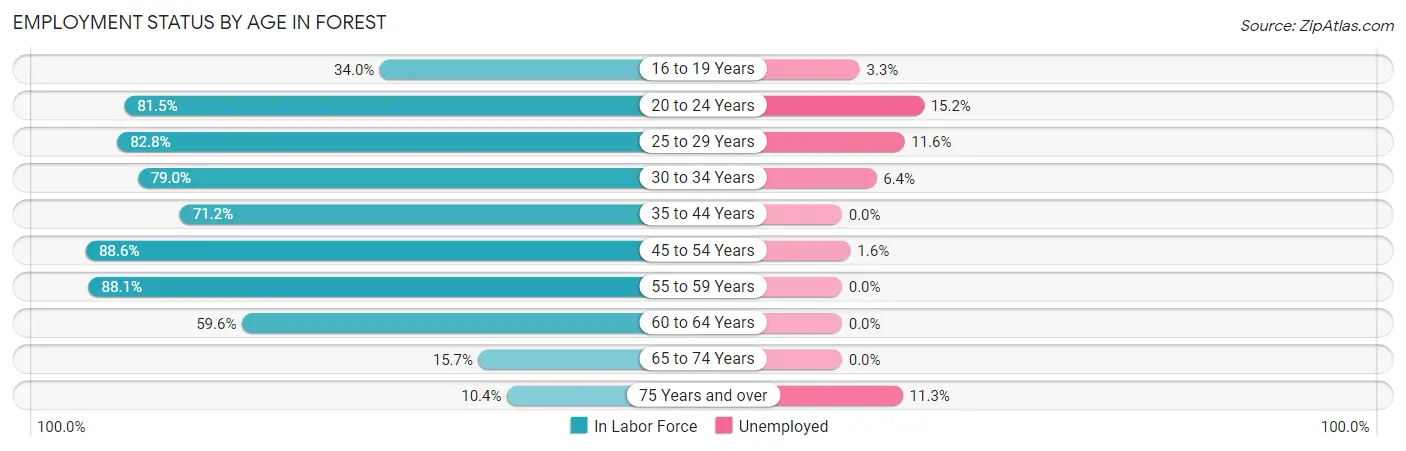
| Age Bracket | In Labor Force | Unemployed |
| 16 to 19 Years | 182 (34.0%) | 6 (3.3%) |
| 20 to 24 Years | 803 (81.5%) | 122 (15.2%) |
| 25 to 29 Years | 705 (82.8%) | 82 (11.6%) |
| 30 to 34 Years | 391 (79.0%) | 25 (6.4%) |
| 35 to 44 Years | 879 (71.2%) | 0 (0.0%) |
| 45 to 54 Years | 1,261 (88.6%) | 20 (1.6%) |
| 55 to 59 Years | 861 (88.1%) | 0 (0.0%) |
| 60 to 64 Years | 475 (59.6%) | 0 (0.0%) |
| 65 to 74 Years | 198 (15.7%) | 0 (0.0%) |
| 75 Years and over | 133 (10.4%) | 15 (11.3%) |
| Total | 5,891 (59.9%) | 271 (4.6%) |
Employment Status by Educational Attainment in Forest
According to labor force statistics for Forest, 79.1% of individuals (4,570) out of the total population between 25 and 64 years of age (5,777) are in the labor force, with 2.8% or 128 of them being unemployed. The group with the highest labor force participation rate are those with the educational attainment of bachelor's degree or higher, with 82.7% or 2,471 individuals in the labor force. Within the labor force, individuals with bachelor's degree or higher education have the highest percentage of unemployment, with 3.6% or 89 of them being unemployed.
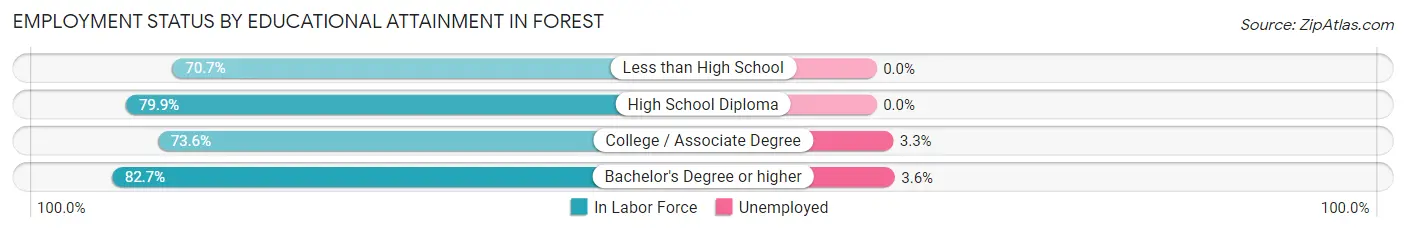
| Educational Attainment | In Labor Force | Unemployed |
| Less than High School | 174 (70.7%) | 0 (0.0%) |
| High School Diploma | 722 (79.9%) | 0 (0.0%) |
| College / Associate Degree | 1,206 (73.6%) | 54 (3.3%) |
| Bachelor's Degree or higher | 2,471 (82.7%) | 108 (3.6%) |
| Total | 4,570 (79.1%) | 162 (2.8%) |
Employment Occupations by Sex in Forest
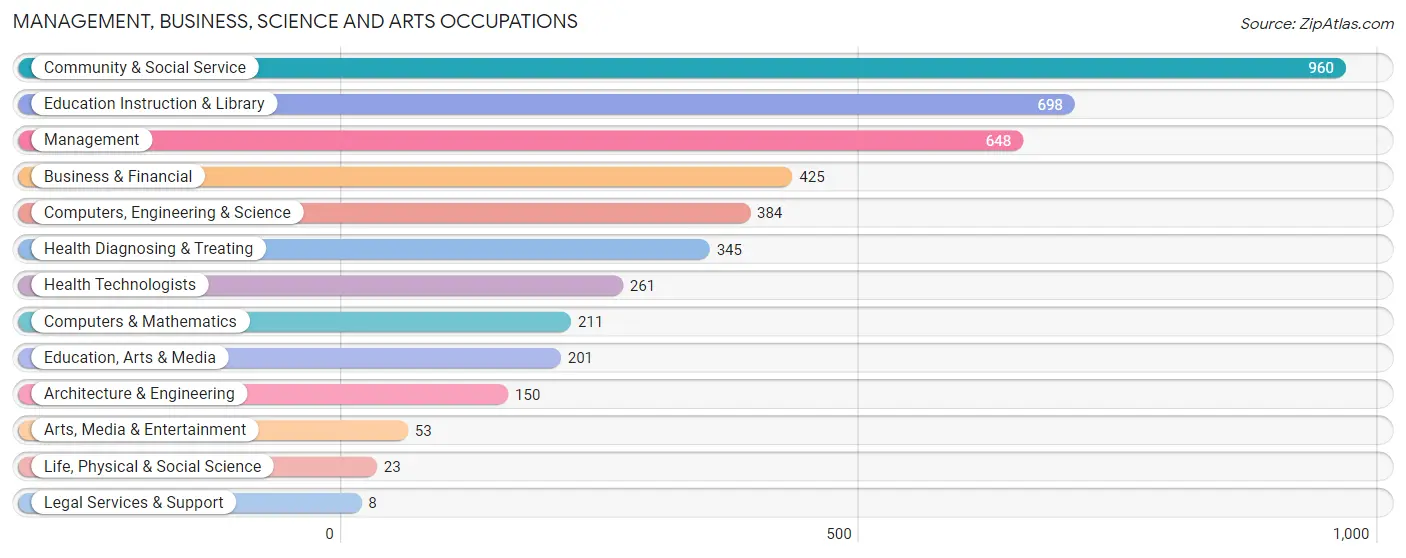
Management, Business, Science and Arts Occupations
The most common Management, Business, Science and Arts occupations in Forest are Community & Social Service (960 | 17.2%), Education Instruction & Library (698 | 12.5%), Management (648 | 11.6%), Business & Financial (425 | 7.6%), and Computers, Engineering & Science (384 | 6.9%).
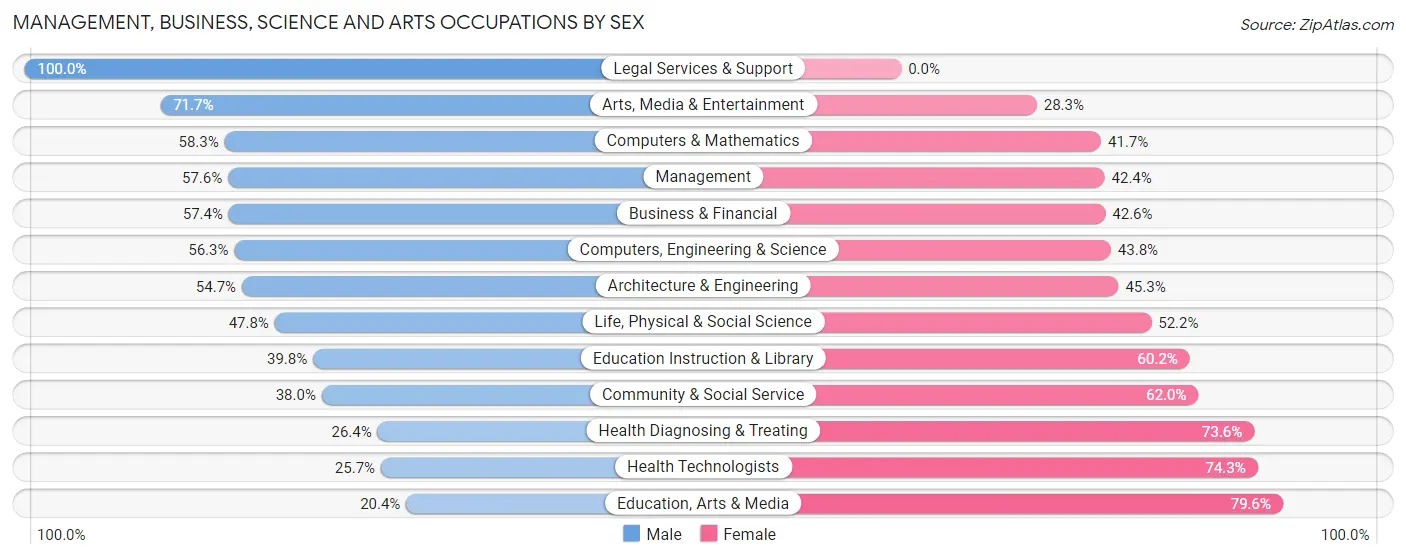
Management, Business, Science and Arts Occupations by Sex
Within the Management, Business, Science and Arts occupations in Forest, the most male-oriented occupations are Legal Services & Support (100.0%), Arts, Media & Entertainment (71.7%), and Computers & Mathematics (58.3%), while the most female-oriented occupations are Education, Arts & Media (79.6%), Health Technologists (74.3%), and Health Diagnosing & Treating (73.6%).
| Occupation | Male | Female |
| Management | 373 (57.6%) | 275 (42.4%) |
| Business & Financial | 244 (57.4%) | 181 (42.6%) |
| Computers, Engineering & Science | 216 (56.2%) | 168 (43.8%) |
| Computers & Mathematics | 123 (58.3%) | 88 (41.7%) |
| Architecture & Engineering | 82 (54.7%) | 68 (45.3%) |
| Life, Physical & Social Science | 11 (47.8%) | 12 (52.2%) |
| Community & Social Service | 365 (38.0%) | 595 (62.0%) |
| Education, Arts & Media | 41 (20.4%) | 160 (79.6%) |
| Legal Services & Support | 8 (100.0%) | 0 (0.0%) |
| Education Instruction & Library | 278 (39.8%) | 420 (60.2%) |
| Arts, Media & Entertainment | 38 (71.7%) | 15 (28.3%) |
| Health Diagnosing & Treating | 91 (26.4%) | 254 (73.6%) |
| Health Technologists | 67 (25.7%) | 194 (74.3%) |
| Total (Category) | 1,289 (46.7%) | 1,473 (53.3%) |
| Total (Overall) | 2,955 (53.0%) | 2,623 (47.0%) |
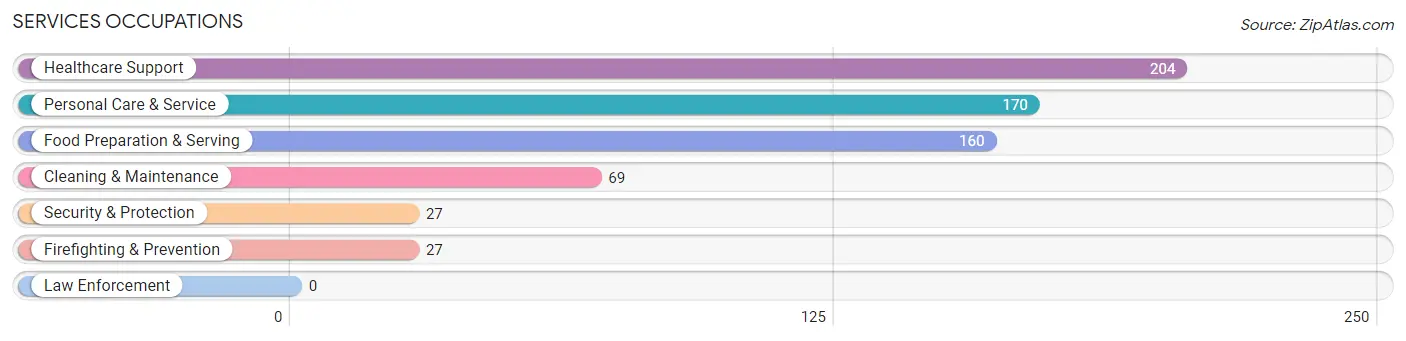
Services Occupations
The most common Services occupations in Forest are Healthcare Support (204 | 3.7%), Personal Care & Service (170 | 3.0%), Food Preparation & Serving (160 | 2.9%), Cleaning & Maintenance (69 | 1.2%), and Security & Protection (27 | 0.5%).
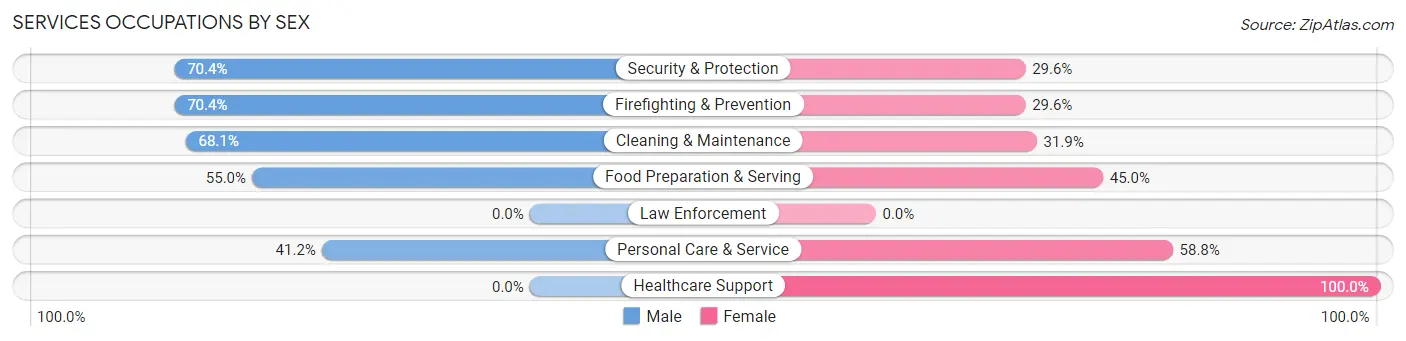
Services Occupations by Sex
Within the Services occupations in Forest, the most male-oriented occupations are Security & Protection (70.4%), Firefighting & Prevention (70.4%), and Cleaning & Maintenance (68.1%), while the most female-oriented occupations are Healthcare Support (100.0%), Personal Care & Service (58.8%), and Food Preparation & Serving (45.0%).
| Occupation | Male | Female |
| Healthcare Support | 0 (0.0%) | 204 (100.0%) |
| Security & Protection | 19 (70.4%) | 8 (29.6%) |
| Firefighting & Prevention | 19 (70.4%) | 8 (29.6%) |
| Law Enforcement | 0 (0.0%) | 0 (0.0%) |
| Food Preparation & Serving | 88 (55.0%) | 72 (45.0%) |
| Cleaning & Maintenance | 47 (68.1%) | 22 (31.9%) |
| Personal Care & Service | 70 (41.2%) | 100 (58.8%) |
| Total (Category) | 224 (35.6%) | 406 (64.4%) |
| Total (Overall) | 2,955 (53.0%) | 2,623 (47.0%) |
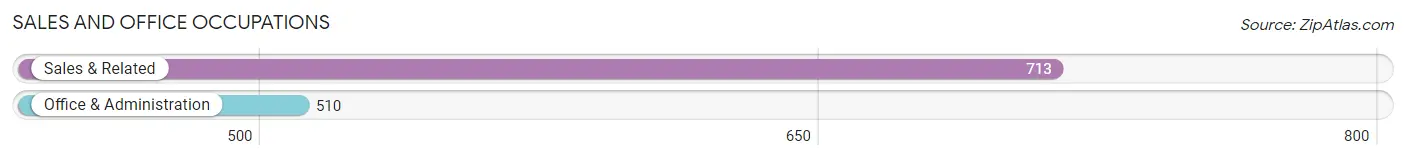
Sales and Office Occupations
The most common Sales and Office occupations in Forest are Sales & Related (713 | 12.8%), and Office & Administration (510 | 9.1%).
Sales and Office Occupations by Sex
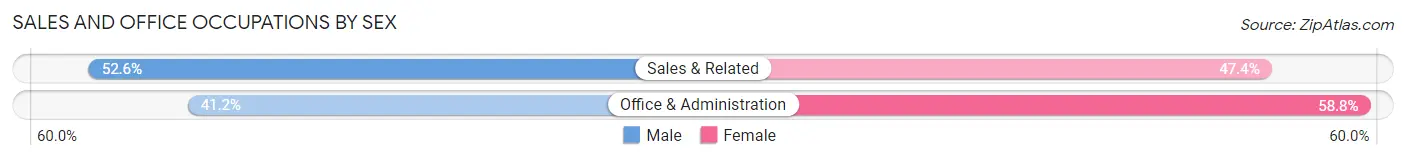
| Occupation | Male | Female |
| Sales & Related | 375 (52.6%) | 338 (47.4%) |
| Office & Administration | 210 (41.2%) | 300 (58.8%) |
| Total (Category) | 585 (47.8%) | 638 (52.2%) |
| Total (Overall) | 2,955 (53.0%) | 2,623 (47.0%) |
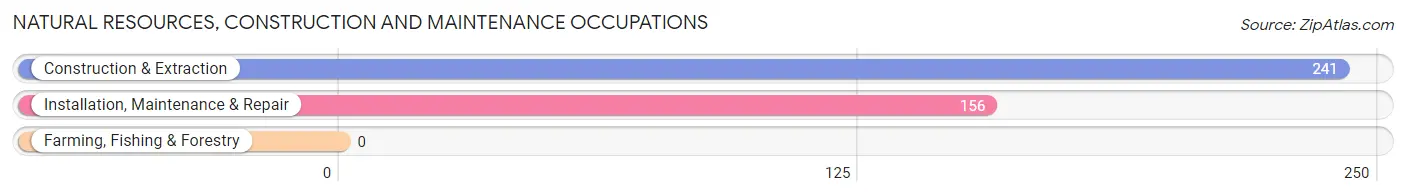
Natural Resources, Construction and Maintenance Occupations
The most common Natural Resources, Construction and Maintenance occupations in Forest are Construction & Extraction (241 | 4.3%), and Installation, Maintenance & Repair (156 | 2.8%).
Natural Resources, Construction and Maintenance Occupations by Sex
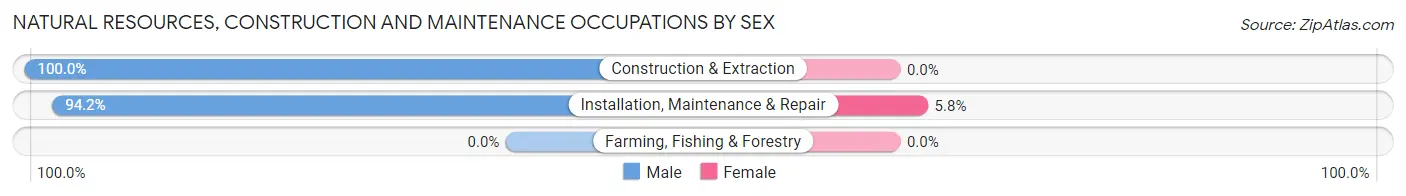
| Occupation | Male | Female |
| Farming, Fishing & Forestry | 0 (0.0%) | 0 (0.0%) |
| Construction & Extraction | 241 (100.0%) | 0 (0.0%) |
| Installation, Maintenance & Repair | 147 (94.2%) | 9 (5.8%) |
| Total (Category) | 388 (97.7%) | 9 (2.3%) |
| Total (Overall) | 2,955 (53.0%) | 2,623 (47.0%) |
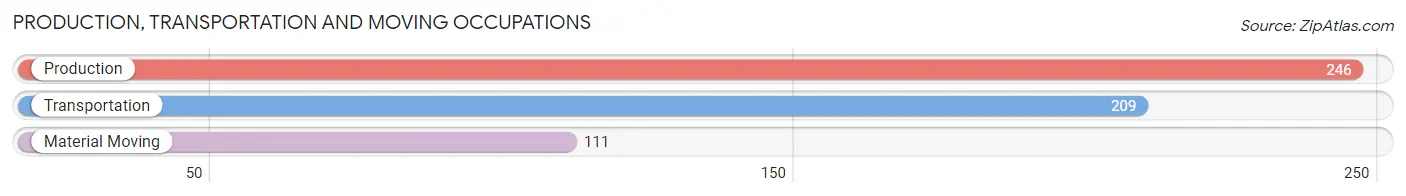
Production, Transportation and Moving Occupations
The most common Production, Transportation and Moving occupations in Forest are Production (246 | 4.4%), Transportation (209 | 3.7%), and Material Moving (111 | 2.0%).
Production, Transportation and Moving Occupations by Sex
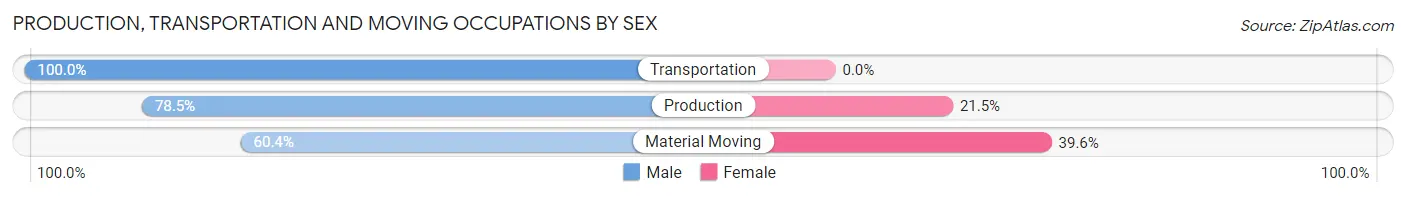
| Occupation | Male | Female |
| Production | 193 (78.5%) | 53 (21.5%) |
| Transportation | 209 (100.0%) | 0 (0.0%) |
| Material Moving | 67 (60.4%) | 44 (39.6%) |
| Total (Category) | 469 (82.9%) | 97 (17.1%) |
| Total (Overall) | 2,955 (53.0%) | 2,623 (47.0%) |
Employment Industries by Sex in Forest
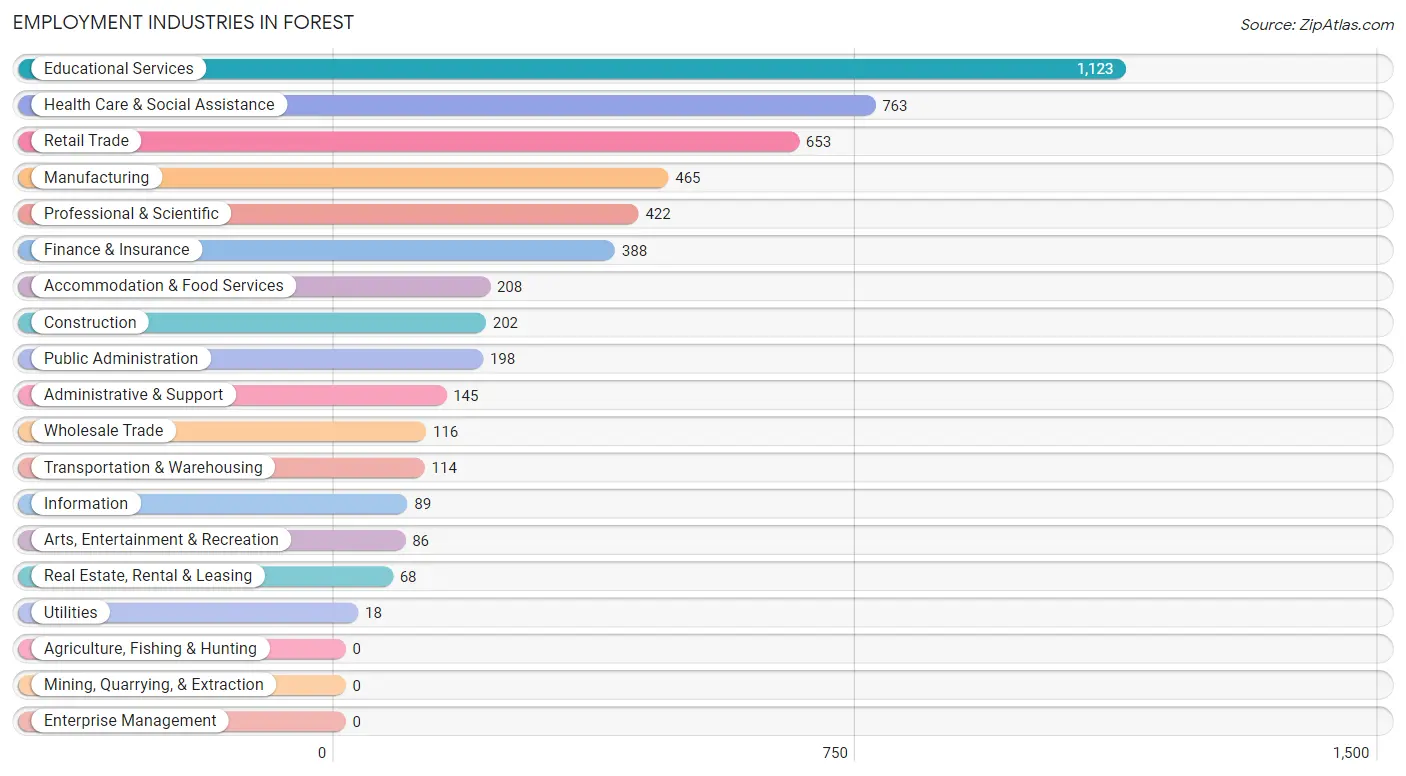
Employment Industries in Forest
The major employment industries in Forest include Educational Services (1,123 | 20.1%), Health Care & Social Assistance (763 | 13.7%), Retail Trade (653 | 11.7%), Manufacturing (465 | 8.3%), and Professional & Scientific (422 | 7.6%).
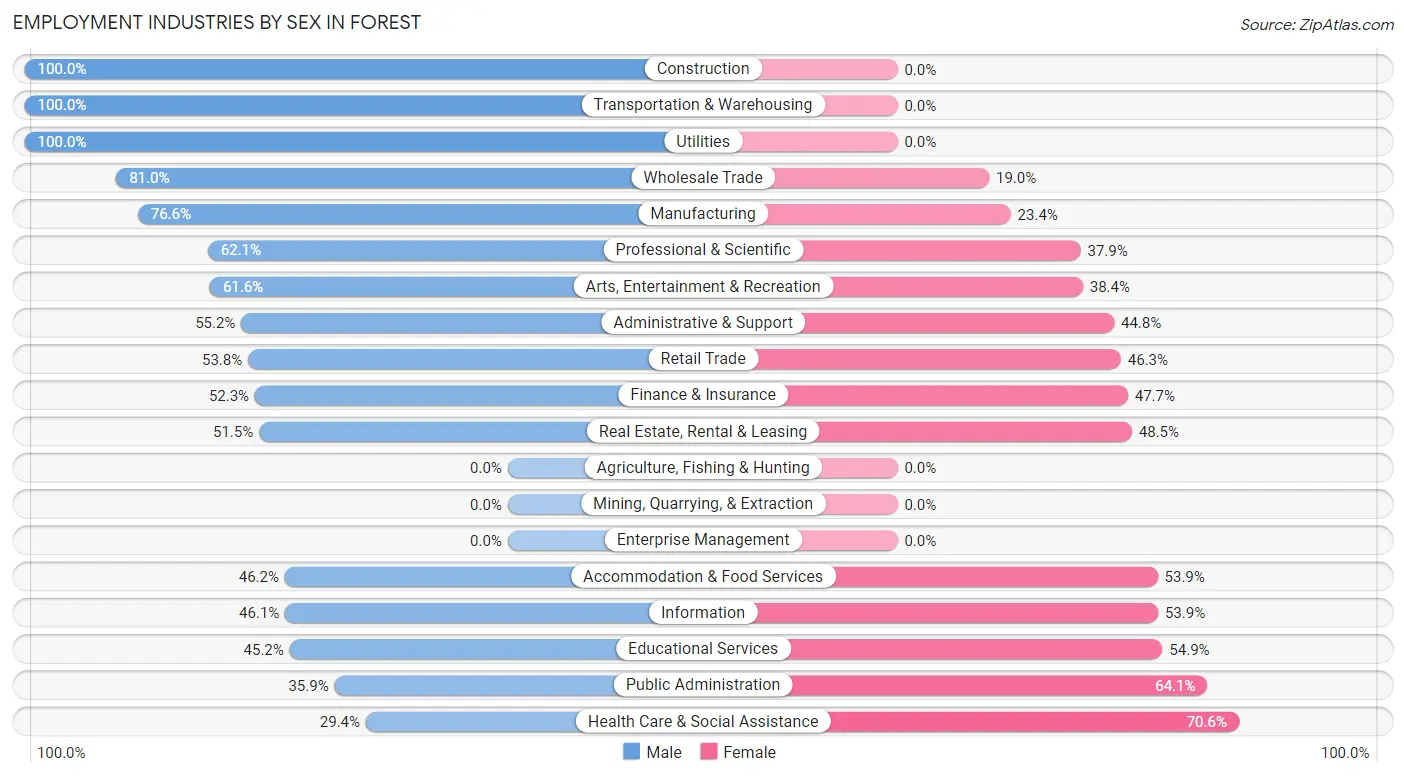
Employment Industries by Sex in Forest
The Forest industries that see more men than women are Construction (100.0%), Transportation & Warehousing (100.0%), and Utilities (100.0%), whereas the industries that tend to have a higher number of women are Health Care & Social Assistance (70.6%), Public Administration (64.1%), and Educational Services (54.8%).
| Industry | Male | Female |
| Agriculture, Fishing & Hunting | 0 (0.0%) | 0 (0.0%) |
| Mining, Quarrying, & Extraction | 0 (0.0%) | 0 (0.0%) |
| Construction | 202 (100.0%) | 0 (0.0%) |
| Manufacturing | 356 (76.6%) | 109 (23.4%) |
| Wholesale Trade | 94 (81.0%) | 22 (19.0%) |
| Retail Trade | 351 (53.7%) | 302 (46.3%) |
| Transportation & Warehousing | 114 (100.0%) | 0 (0.0%) |
| Utilities | 18 (100.0%) | 0 (0.0%) |
| Information | 41 (46.1%) | 48 (53.9%) |
| Finance & Insurance | 203 (52.3%) | 185 (47.7%) |
| Real Estate, Rental & Leasing | 35 (51.5%) | 33 (48.5%) |
| Professional & Scientific | 262 (62.1%) | 160 (37.9%) |
| Enterprise Management | 0 (0.0%) | 0 (0.0%) |
| Administrative & Support | 80 (55.2%) | 65 (44.8%) |
| Educational Services | 507 (45.2%) | 616 (54.8%) |
| Health Care & Social Assistance | 224 (29.4%) | 539 (70.6%) |
| Arts, Entertainment & Recreation | 53 (61.6%) | 33 (38.4%) |
| Accommodation & Food Services | 96 (46.2%) | 112 (53.8%) |
| Public Administration | 71 (35.9%) | 127 (64.1%) |
| Total | 2,955 (53.0%) | 2,623 (47.0%) |
Education in Forest
School Enrollment in Forest
The most common levels of schooling among the 2,808 students in Forest are graduate / professional (594 | 21.1%), middle school (509 | 18.1%), and high school (489 | 17.4%).
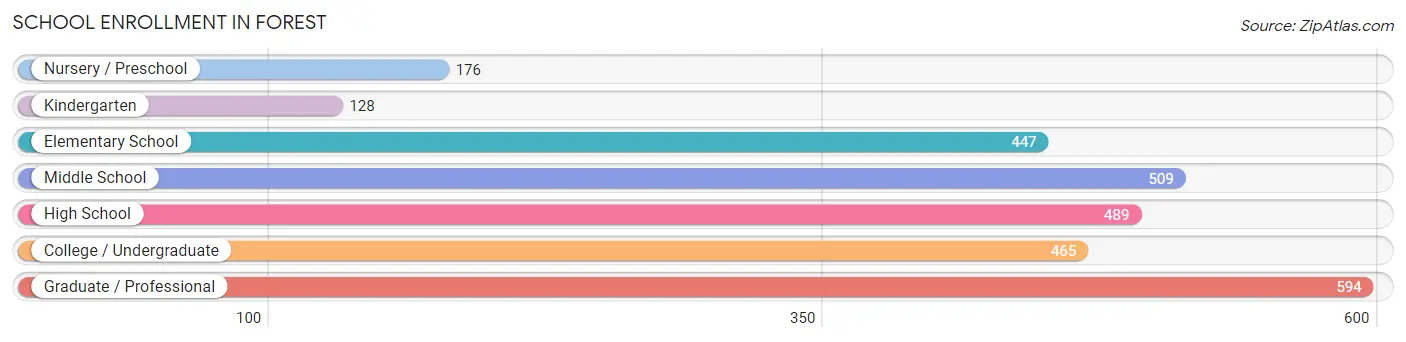
| School Level | # Students | % Students |
| Nursery / Preschool | 176 | 6.3% |
| Kindergarten | 128 | 4.6% |
| Elementary School | 447 | 15.9% |
| Middle School | 509 | 18.1% |
| High School | 489 | 17.4% |
| College / Undergraduate | 465 | 16.6% |
| Graduate / Professional | 594 | 21.1% |
| Total | 2,808 | 100.0% |
School Enrollment by Age by Funding Source in Forest
Out of a total of 2,808 students who are enrolled in schools in Forest, 1,320 (47.0%) attend a private institution, while the remaining 1,488 (53.0%) are enrolled in public schools. The age group of 3 to 4 year olds has the highest likelihood of being enrolled in private schools, with 157 (97.5% in the age bracket) enrolled. Conversely, the age group of 15 to 17 year olds has the lowest likelihood of being enrolled in a private school, with 279 (79.5% in the age bracket) attending a public institution.
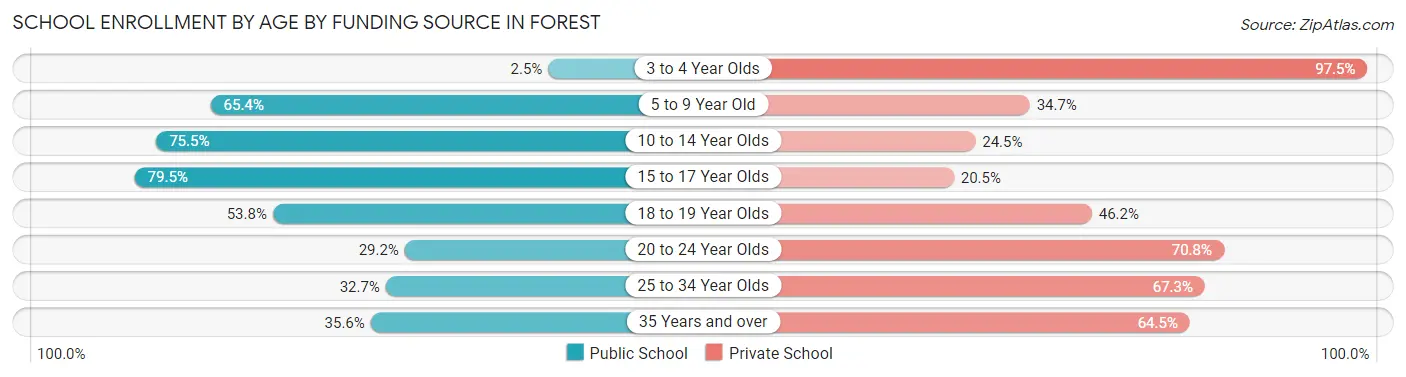
| Age Bracket | Public School | Private School |
| 3 to 4 Year Olds | 4 (2.5%) | 157 (97.5%) |
| 5 to 9 Year Old | 347 (65.3%) | 184 (34.6%) |
| 10 to 14 Year Olds | 468 (75.5%) | 152 (24.5%) |
| 15 to 17 Year Olds | 279 (79.5%) | 72 (20.5%) |
| 18 to 19 Year Olds | 64 (53.8%) | 55 (46.2%) |
| 20 to 24 Year Olds | 139 (29.2%) | 337 (70.8%) |
| 25 to 34 Year Olds | 111 (32.7%) | 228 (67.3%) |
| 35 Years and over | 75 (35.5%) | 136 (64.4%) |
| Total | 1,488 (53.0%) | 1,320 (47.0%) |
Educational Attainment by Field of Study in Forest
Business (601 | 13.3%), education (562 | 12.4%), science & technology (520 | 11.5%), psychology (423 | 9.4%), and social sciences (400 | 8.9%) are the most common fields of study among 4,517 individuals in Forest who have obtained a bachelor's degree or higher.
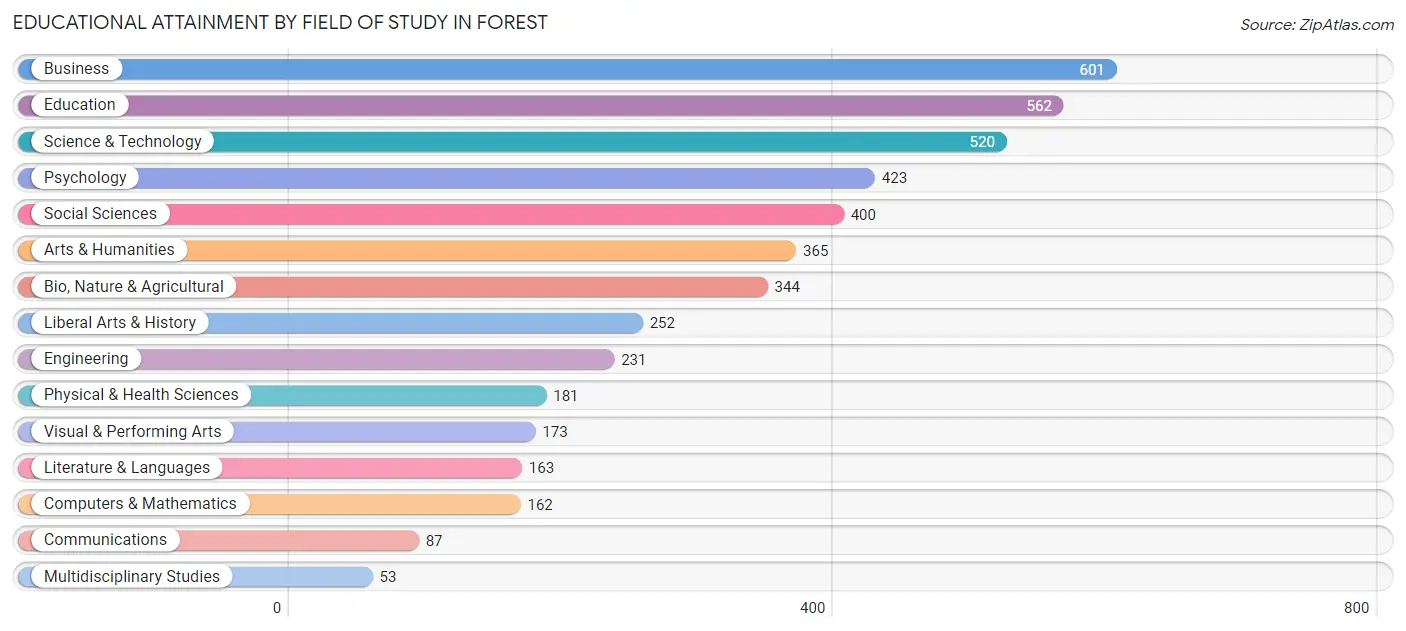
| Field of Study | # Graduates | % Graduates |
| Computers & Mathematics | 162 | 3.6% |
| Bio, Nature & Agricultural | 344 | 7.6% |
| Physical & Health Sciences | 181 | 4.0% |
| Psychology | 423 | 9.4% |
| Social Sciences | 400 | 8.9% |
| Engineering | 231 | 5.1% |
| Multidisciplinary Studies | 53 | 1.2% |
| Science & Technology | 520 | 11.5% |
| Business | 601 | 13.3% |
| Education | 562 | 12.4% |
| Literature & Languages | 163 | 3.6% |
| Liberal Arts & History | 252 | 5.6% |
| Visual & Performing Arts | 173 | 3.8% |
| Communications | 87 | 1.9% |
| Arts & Humanities | 365 | 8.1% |
| Total | 4,517 | 100.0% |
Transportation & Commute in Forest
Vehicle Availability by Sex in Forest
The most prevalent vehicle ownership categories in Forest are males with 2 vehicles (1,254, accounting for 42.7%) and females with 2 vehicles (1,071, making up 48.4%).
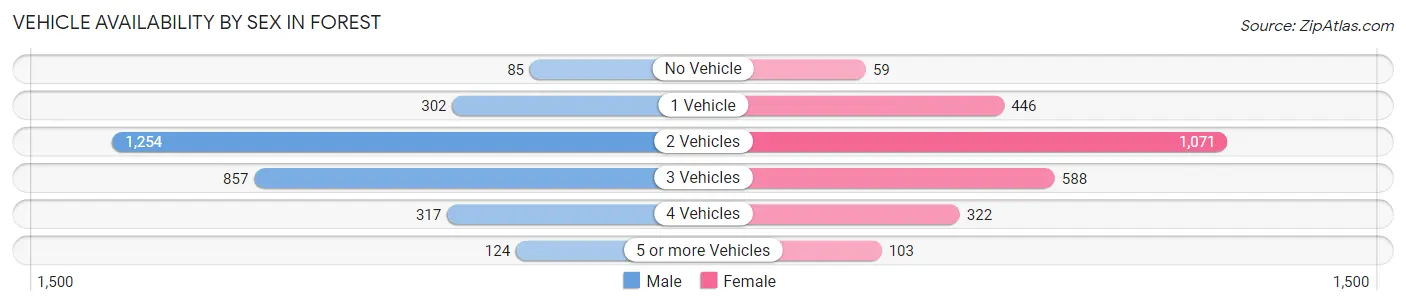
| Vehicles Available | Male | Female |
| No Vehicle | 85 (2.9%) | 59 (2.3%) |
| 1 Vehicle | 302 (10.3%) | 446 (17.2%) |
| 2 Vehicles | 1,254 (42.7%) | 1,071 (41.4%) |
| 3 Vehicles | 857 (29.2%) | 588 (22.7%) |
| 4 Vehicles | 317 (10.8%) | 322 (12.4%) |
| 5 or more Vehicles | 124 (4.2%) | 103 (4.0%) |
| Total | 2,939 (100.0%) | 2,589 (100.0%) |
Commute Time in Forest
The most frequently occuring commute durations in Forest are 15 to 19 minutes (1,216 commuters, 25.3%), 20 to 24 minutes (1,039 commuters, 21.6%), and 10 to 14 minutes (665 commuters, 13.8%).
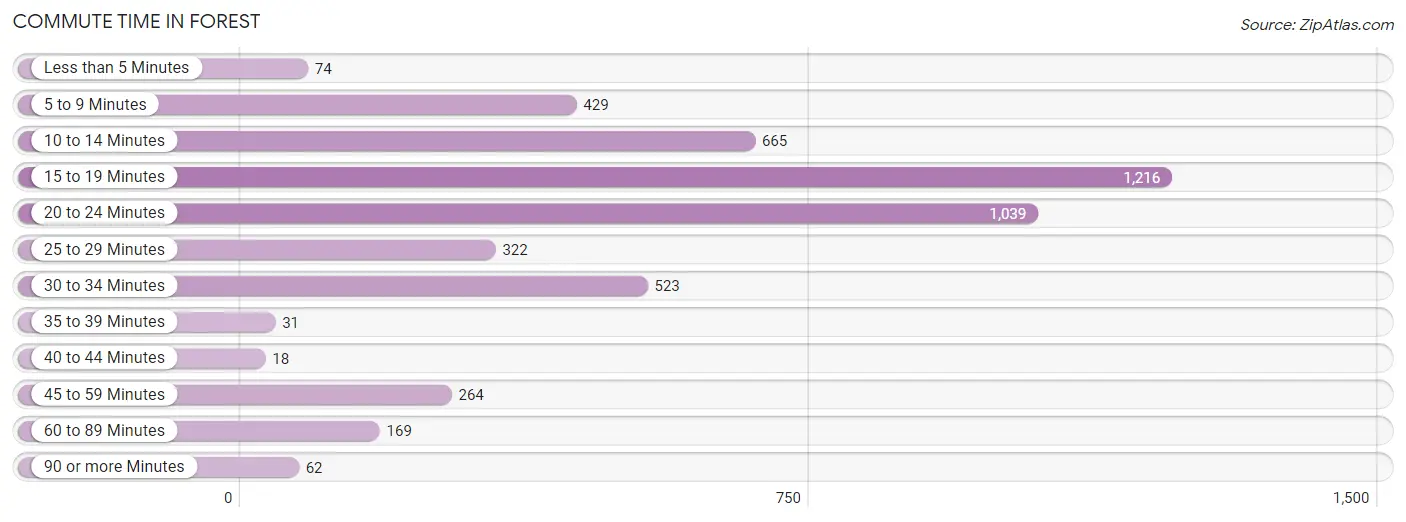
| Commute Time | # Commuters | % Commuters |
| Less than 5 Minutes | 74 | 1.5% |
| 5 to 9 Minutes | 429 | 8.9% |
| 10 to 14 Minutes | 665 | 13.8% |
| 15 to 19 Minutes | 1,216 | 25.3% |
| 20 to 24 Minutes | 1,039 | 21.6% |
| 25 to 29 Minutes | 322 | 6.7% |
| 30 to 34 Minutes | 523 | 10.9% |
| 35 to 39 Minutes | 31 | 0.6% |
| 40 to 44 Minutes | 18 | 0.4% |
| 45 to 59 Minutes | 264 | 5.5% |
| 60 to 89 Minutes | 169 | 3.5% |
| 90 or more Minutes | 62 | 1.3% |
Commute Time by Sex in Forest
The most common commute times in Forest are 15 to 19 minutes (656 commuters, 25.0%) for males and 20 to 24 minutes (631 commuters, 28.8%) for females.
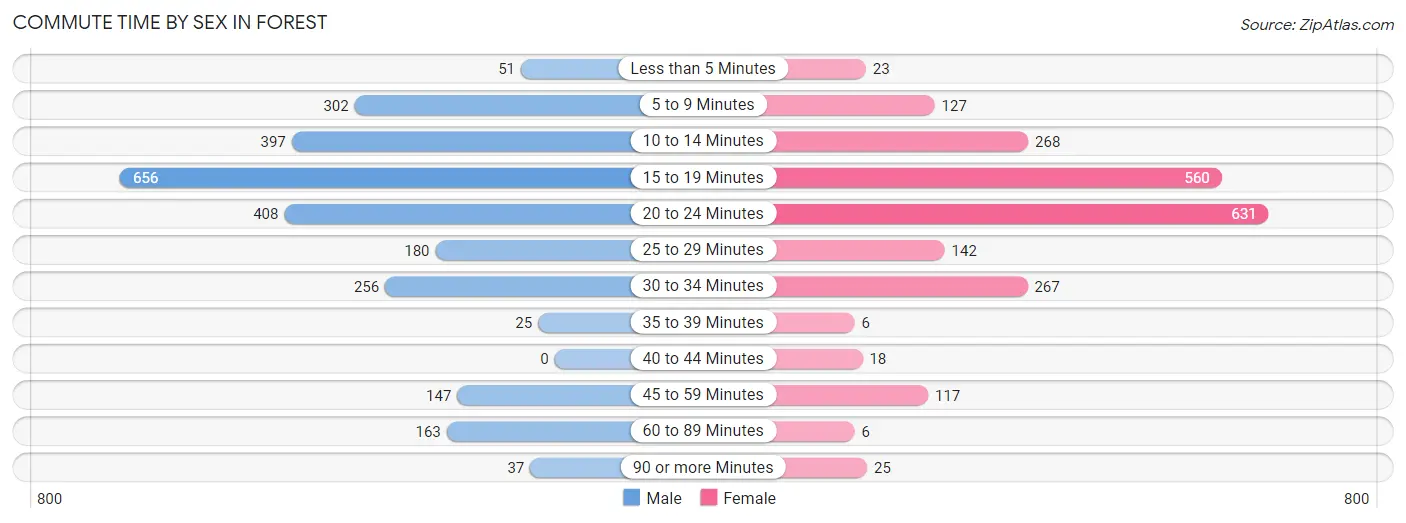
| Commute Time | Male | Female |
| Less than 5 Minutes | 51 (1.9%) | 23 (1.1%) |
| 5 to 9 Minutes | 302 (11.5%) | 127 (5.8%) |
| 10 to 14 Minutes | 397 (15.1%) | 268 (12.2%) |
| 15 to 19 Minutes | 656 (25.0%) | 560 (25.6%) |
| 20 to 24 Minutes | 408 (15.6%) | 631 (28.8%) |
| 25 to 29 Minutes | 180 (6.9%) | 142 (6.5%) |
| 30 to 34 Minutes | 256 (9.8%) | 267 (12.2%) |
| 35 to 39 Minutes | 25 (0.9%) | 6 (0.3%) |
| 40 to 44 Minutes | 0 (0.0%) | 18 (0.8%) |
| 45 to 59 Minutes | 147 (5.6%) | 117 (5.3%) |
| 60 to 89 Minutes | 163 (6.2%) | 6 (0.3%) |
| 90 or more Minutes | 37 (1.4%) | 25 (1.1%) |
Time of Departure to Work by Sex in Forest
The most frequent times of departure to work in Forest are 7:00 AM to 7:29 AM (544, 20.7%) for males and 8:00 AM to 8:29 AM (330, 15.1%) for females.
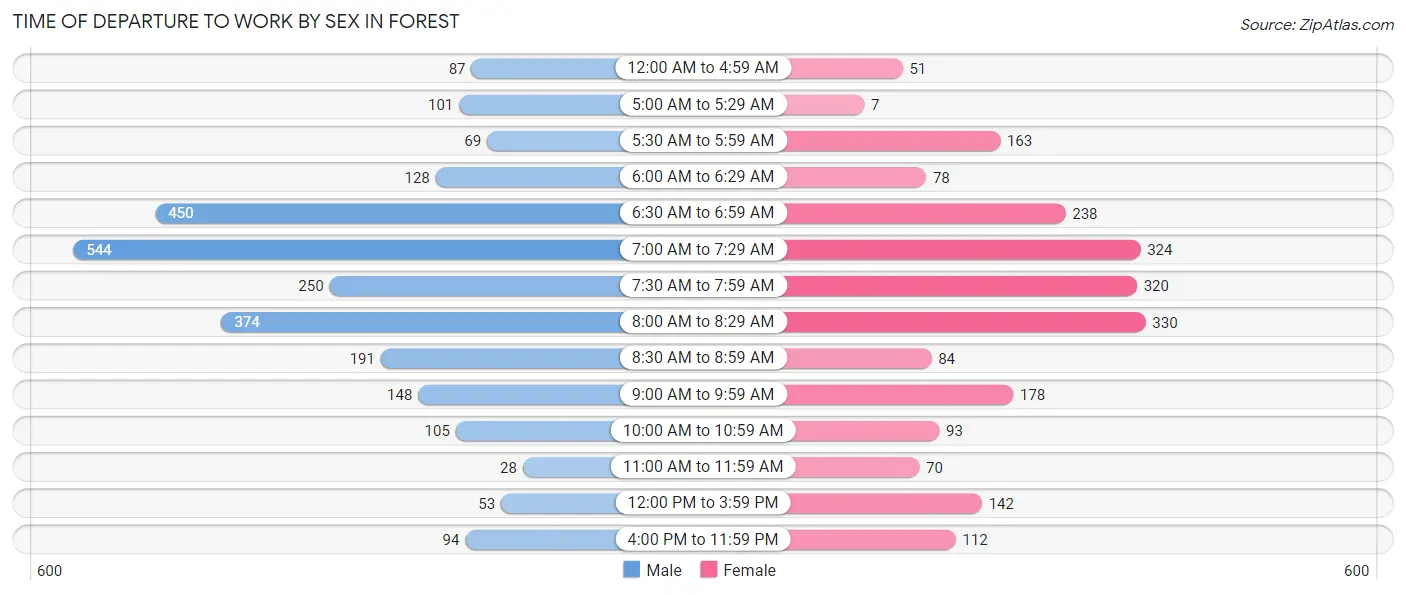
| Time of Departure | Male | Female |
| 12:00 AM to 4:59 AM | 87 (3.3%) | 51 (2.3%) |
| 5:00 AM to 5:29 AM | 101 (3.8%) | 7 (0.3%) |
| 5:30 AM to 5:59 AM | 69 (2.6%) | 163 (7.4%) |
| 6:00 AM to 6:29 AM | 128 (4.9%) | 78 (3.6%) |
| 6:30 AM to 6:59 AM | 450 (17.2%) | 238 (10.9%) |
| 7:00 AM to 7:29 AM | 544 (20.7%) | 324 (14.8%) |
| 7:30 AM to 7:59 AM | 250 (9.5%) | 320 (14.6%) |
| 8:00 AM to 8:29 AM | 374 (14.3%) | 330 (15.1%) |
| 8:30 AM to 8:59 AM | 191 (7.3%) | 84 (3.8%) |
| 9:00 AM to 9:59 AM | 148 (5.6%) | 178 (8.1%) |
| 10:00 AM to 10:59 AM | 105 (4.0%) | 93 (4.3%) |
| 11:00 AM to 11:59 AM | 28 (1.1%) | 70 (3.2%) |
| 12:00 PM to 3:59 PM | 53 (2.0%) | 142 (6.5%) |
| 4:00 PM to 11:59 PM | 94 (3.6%) | 112 (5.1%) |
| Total | 2,622 (100.0%) | 2,190 (100.0%) |
Housing Occupancy in Forest
Occupancy by Ownership in Forest
Of the total 4,865 dwellings in Forest, owner-occupied units account for 3,685 (75.7%), while renter-occupied units make up 1,180 (24.2%).
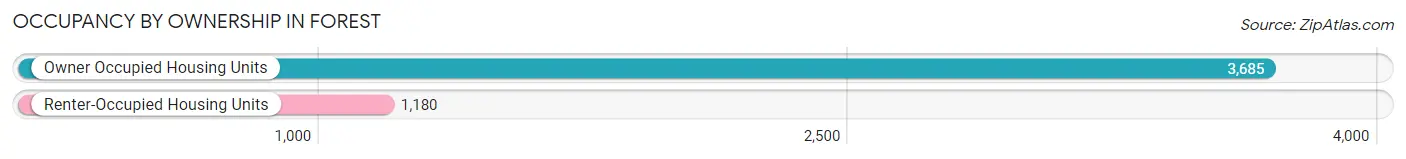
| Occupancy | # Housing Units | % Housing Units |
| Owner Occupied Housing Units | 3,685 | 75.7% |
| Renter-Occupied Housing Units | 1,180 | 24.2% |
| Total Occupied Housing Units | 4,865 | 100.0% |
Occupancy by Household Size in Forest
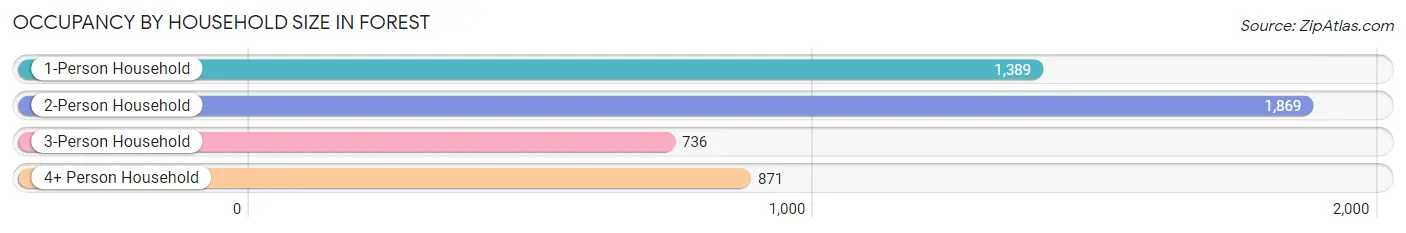
| Household Size | # Housing Units | % Housing Units |
| 1-Person Household | 1,389 | 28.5% |
| 2-Person Household | 1,869 | 38.4% |
| 3-Person Household | 736 | 15.1% |
| 4+ Person Household | 871 | 17.9% |
| Total Housing Units | 4,865 | 100.0% |
Occupancy by Ownership by Household Size in Forest
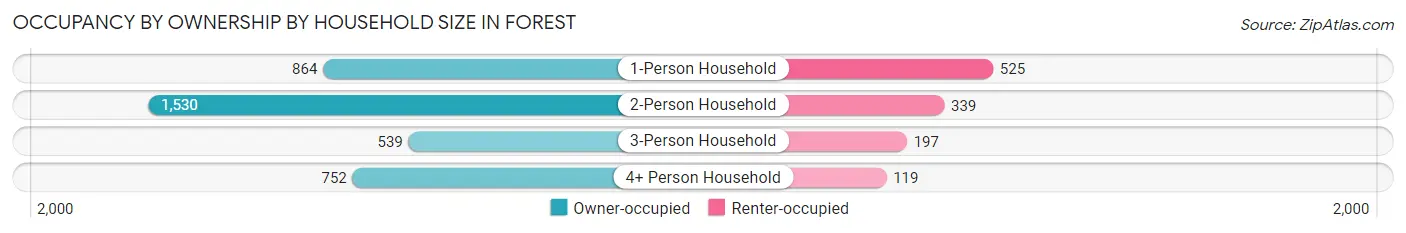
| Household Size | Owner-occupied | Renter-occupied |
| 1-Person Household | 864 (62.2%) | 525 (37.8%) |
| 2-Person Household | 1,530 (81.9%) | 339 (18.1%) |
| 3-Person Household | 539 (73.2%) | 197 (26.8%) |
| 4+ Person Household | 752 (86.3%) | 119 (13.7%) |
| Total Housing Units | 3,685 (75.7%) | 1,180 (24.2%) |
Occupancy by Educational Attainment in Forest
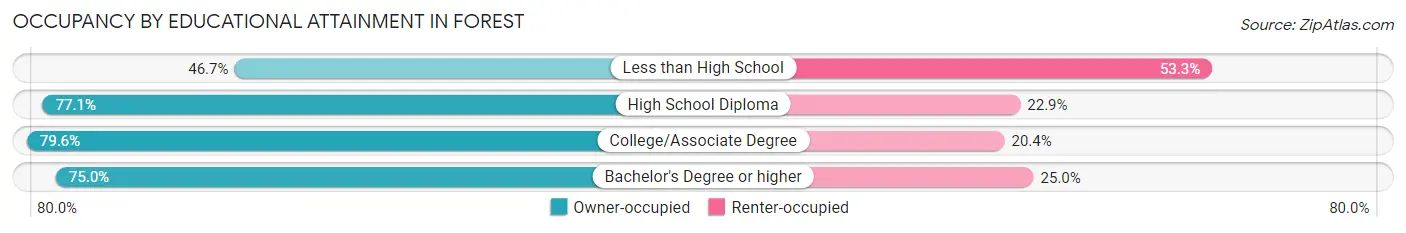
| Household Size | Owner-occupied | Renter-occupied |
| Less than High School | 86 (46.7%) | 98 (53.3%) |
| High School Diploma | 543 (77.1%) | 161 (22.9%) |
| College/Associate Degree | 1,244 (79.6%) | 318 (20.4%) |
| Bachelor's Degree or higher | 1,812 (75.0%) | 603 (25.0%) |
Occupancy by Age of Householder in Forest
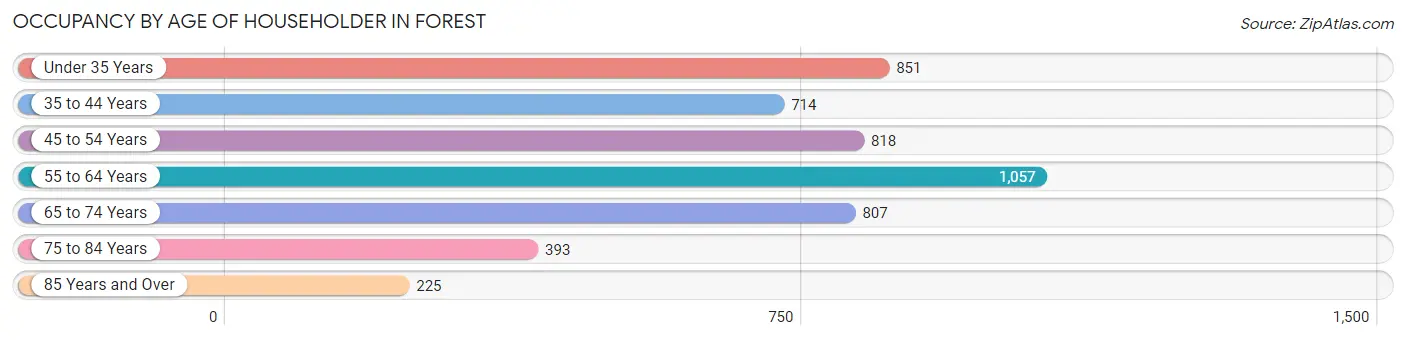
| Age Bracket | # Households | % Households |
| Under 35 Years | 851 | 17.5% |
| 35 to 44 Years | 714 | 14.7% |
| 45 to 54 Years | 818 | 16.8% |
| 55 to 64 Years | 1,057 | 21.7% |
| 65 to 74 Years | 807 | 16.6% |
| 75 to 84 Years | 393 | 8.1% |
| 85 Years and Over | 225 | 4.6% |
| Total | 4,865 | 100.0% |
Housing Finances in Forest
Median Income by Occupancy in Forest
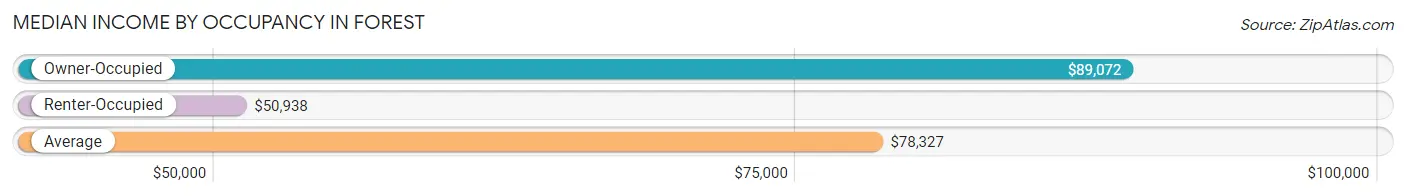
| Occupancy Type | # Households | Median Income |
| Owner-Occupied | 3,685 (75.7%) | $89,072 |
| Renter-Occupied | 1,180 (24.2%) | $50,938 |
| Average | 4,865 (100.0%) | $78,327 |
Occupancy by Householder Income Bracket in Forest
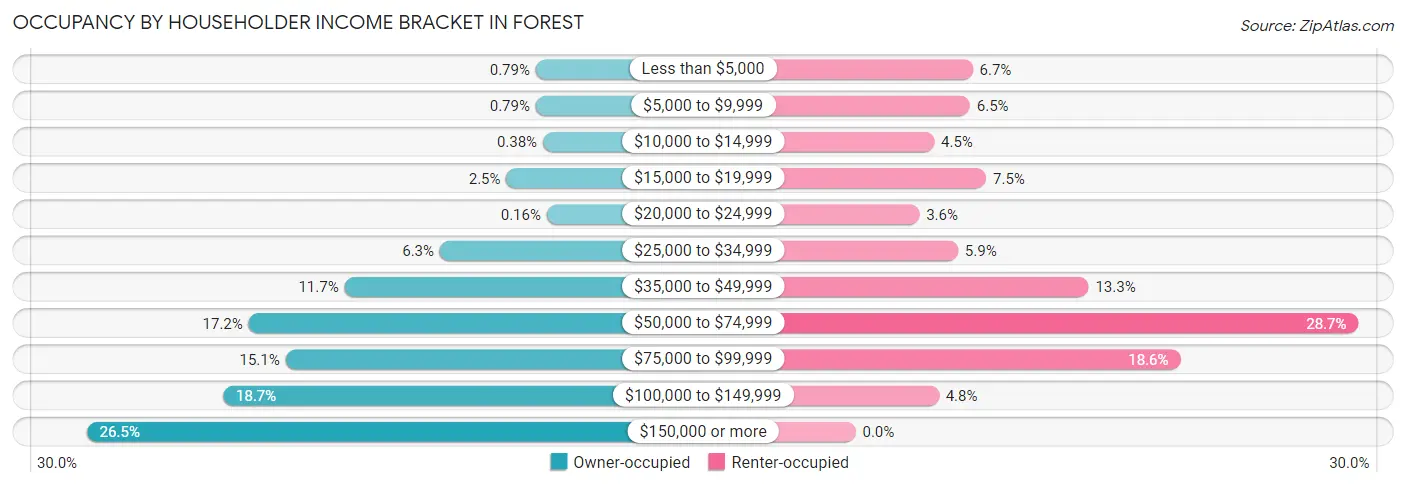
| Income Bracket | Owner-occupied | Renter-occupied |
| Less than $5,000 | 29 (0.8%) | 79 (6.7%) |
| $5,000 to $9,999 | 29 (0.8%) | 77 (6.5%) |
| $10,000 to $14,999 | 14 (0.4%) | 53 (4.5%) |
| $15,000 to $19,999 | 91 (2.5%) | 88 (7.5%) |
| $20,000 to $24,999 | 6 (0.2%) | 43 (3.6%) |
| $25,000 to $34,999 | 231 (6.3%) | 69 (5.9%) |
| $35,000 to $49,999 | 432 (11.7%) | 157 (13.3%) |
| $50,000 to $74,999 | 634 (17.2%) | 339 (28.7%) |
| $75,000 to $99,999 | 556 (15.1%) | 219 (18.6%) |
| $100,000 to $149,999 | 688 (18.7%) | 56 (4.8%) |
| $150,000 or more | 975 (26.5%) | 0 (0.0%) |
| Total | 3,685 (100.0%) | 1,180 (100.0%) |
Monthly Housing Cost Tiers in Forest
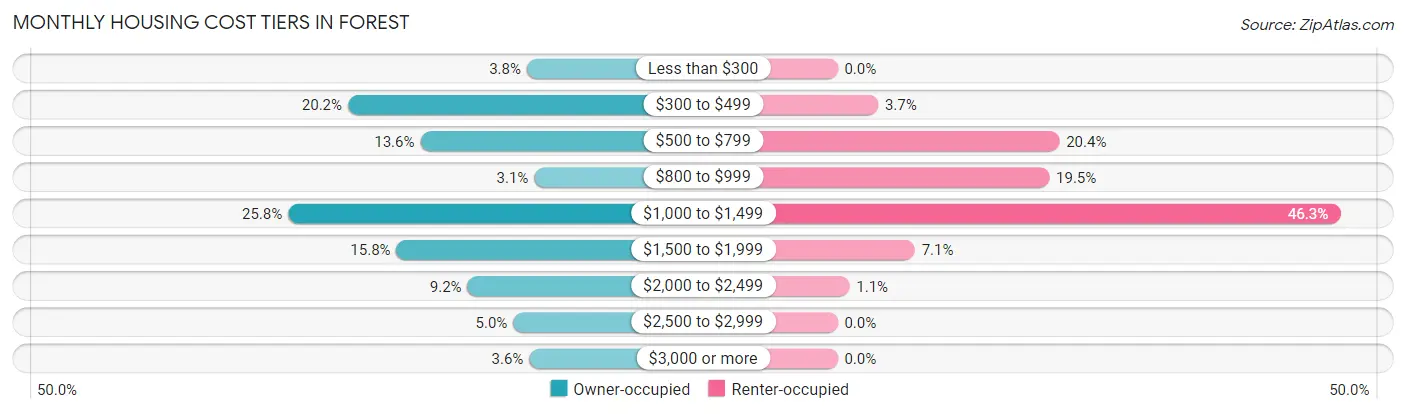
| Monthly Cost | Owner-occupied | Renter-occupied |
| Less than $300 | 139 (3.8%) | 0 (0.0%) |
| $300 to $499 | 746 (20.2%) | 44 (3.7%) |
| $500 to $799 | 500 (13.6%) | 241 (20.4%) |
| $800 to $999 | 114 (3.1%) | 230 (19.5%) |
| $1,000 to $1,499 | 949 (25.8%) | 546 (46.3%) |
| $1,500 to $1,999 | 581 (15.8%) | 84 (7.1%) |
| $2,000 to $2,499 | 340 (9.2%) | 13 (1.1%) |
| $2,500 to $2,999 | 185 (5.0%) | 0 (0.0%) |
| $3,000 or more | 131 (3.5%) | 0 (0.0%) |
| Total | 3,685 (100.0%) | 1,180 (100.0%) |
Physical Housing Characteristics in Forest
Housing Structures in Forest
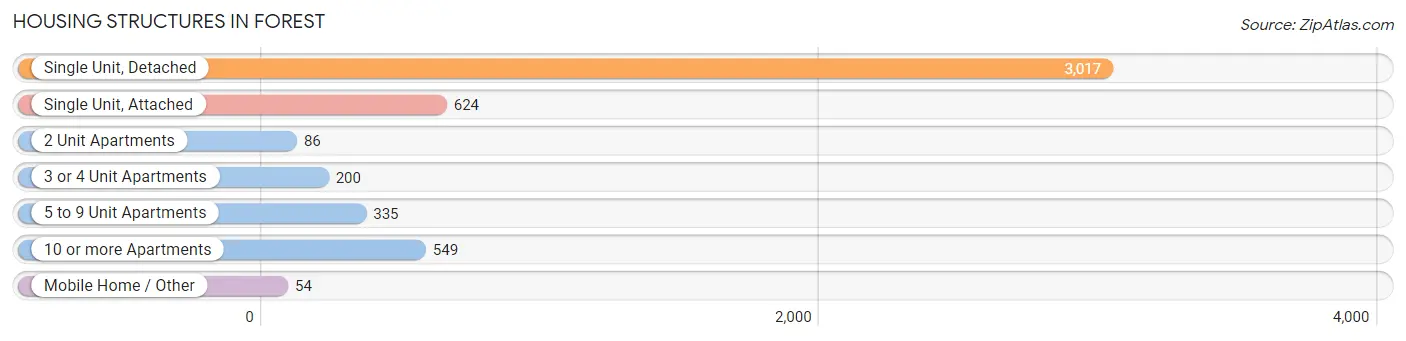
| Structure Type | # Housing Units | % Housing Units |
| Single Unit, Detached | 3,017 | 62.0% |
| Single Unit, Attached | 624 | 12.8% |
| 2 Unit Apartments | 86 | 1.8% |
| 3 or 4 Unit Apartments | 200 | 4.1% |
| 5 to 9 Unit Apartments | 335 | 6.9% |
| 10 or more Apartments | 549 | 11.3% |
| Mobile Home / Other | 54 | 1.1% |
| Total | 4,865 | 100.0% |
Housing Structures by Occupancy in Forest
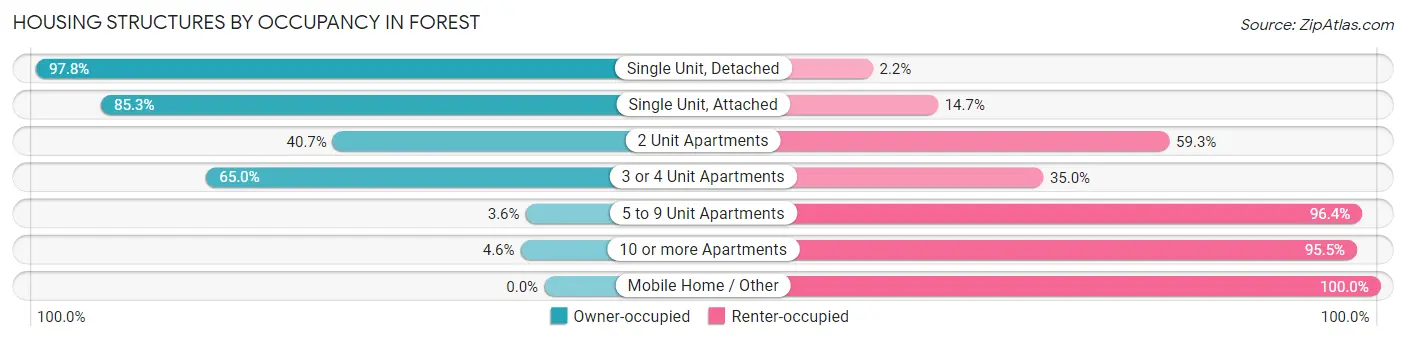
| Structure Type | Owner-occupied | Renter-occupied |
| Single Unit, Detached | 2,951 (97.8%) | 66 (2.2%) |
| Single Unit, Attached | 532 (85.3%) | 92 (14.7%) |
| 2 Unit Apartments | 35 (40.7%) | 51 (59.3%) |
| 3 or 4 Unit Apartments | 130 (65.0%) | 70 (35.0%) |
| 5 to 9 Unit Apartments | 12 (3.6%) | 323 (96.4%) |
| 10 or more Apartments | 25 (4.5%) | 524 (95.5%) |
| Mobile Home / Other | 0 (0.0%) | 54 (100.0%) |
| Total | 3,685 (75.7%) | 1,180 (24.2%) |
Housing Structures by Number of Rooms in Forest
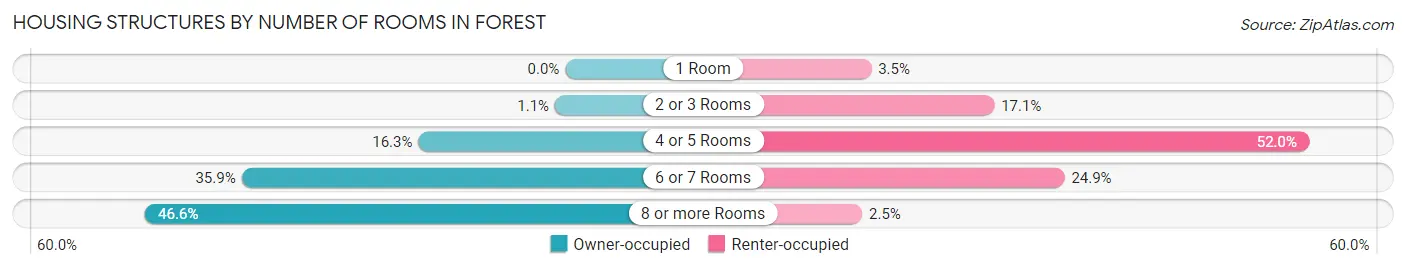
| Number of Rooms | Owner-occupied | Renter-occupied |
| 1 Room | 0 (0.0%) | 41 (3.5%) |
| 2 or 3 Rooms | 42 (1.1%) | 202 (17.1%) |
| 4 or 5 Rooms | 601 (16.3%) | 614 (52.0%) |
| 6 or 7 Rooms | 1,324 (35.9%) | 294 (24.9%) |
| 8 or more Rooms | 1,718 (46.6%) | 29 (2.5%) |
| Total | 3,685 (100.0%) | 1,180 (100.0%) |
Housing Structure by Heating Type in Forest
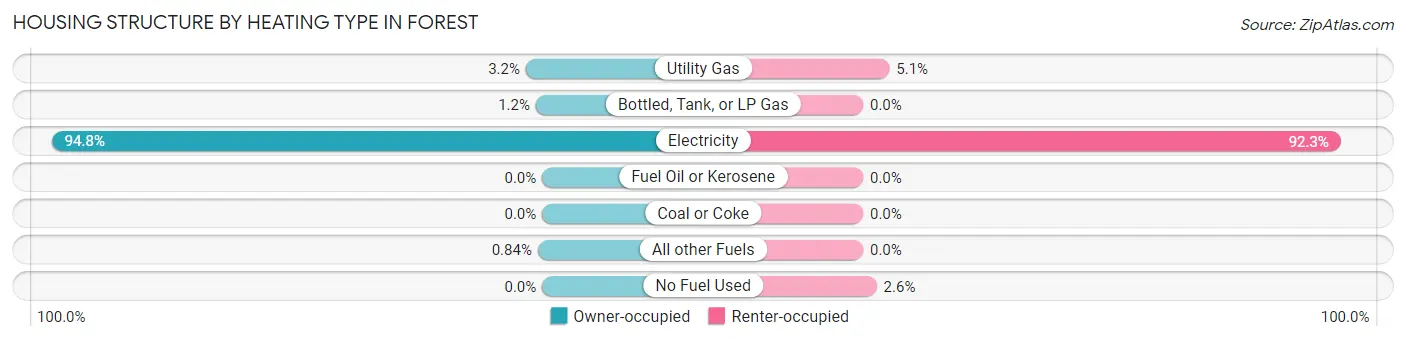
| Heating Type | Owner-occupied | Renter-occupied |
| Utility Gas | 116 (3.2%) | 60 (5.1%) |
| Bottled, Tank, or LP Gas | 45 (1.2%) | 0 (0.0%) |
| Electricity | 3,493 (94.8%) | 1,089 (92.3%) |
| Fuel Oil or Kerosene | 0 (0.0%) | 0 (0.0%) |
| Coal or Coke | 0 (0.0%) | 0 (0.0%) |
| All other Fuels | 31 (0.8%) | 0 (0.0%) |
| No Fuel Used | 0 (0.0%) | 31 (2.6%) |
| Total | 3,685 (100.0%) | 1,180 (100.0%) |
Household Vehicle Usage in Forest
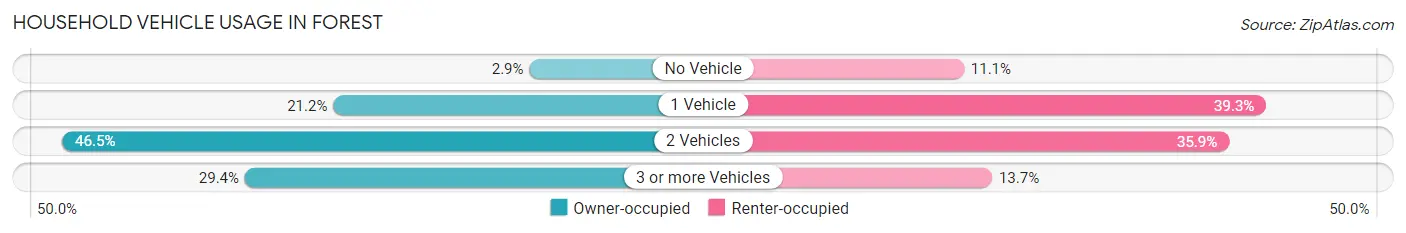
| Vehicles per Household | Owner-occupied | Renter-occupied |
| No Vehicle | 106 (2.9%) | 131 (11.1%) |
| 1 Vehicle | 781 (21.2%) | 464 (39.3%) |
| 2 Vehicles | 1,713 (46.5%) | 423 (35.8%) |
| 3 or more Vehicles | 1,085 (29.4%) | 162 (13.7%) |
| Total | 3,685 (100.0%) | 1,180 (100.0%) |
Real Estate & Mortgages in Forest
Real Estate and Mortgage Overview in Forest
| Characteristic | Without Mortgage | With Mortgage |
| Housing Units | 1,158 | 2,527 |
| Median Property Value | $295,100 | $316,700 |
| Median Household Income | $73,250 | $775 |
| Monthly Housing Costs | $423 | $131 |
| Real Estate Taxes | $1,349 | $227 |
Property Value by Mortgage Status in Forest
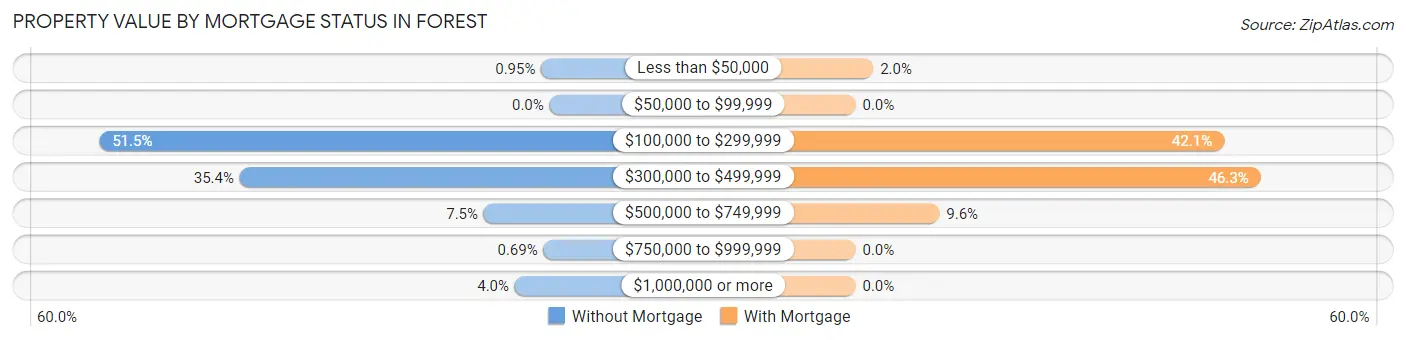
| Property Value | Without Mortgage | With Mortgage |
| Less than $50,000 | 11 (0.9%) | 51 (2.0%) |
| $50,000 to $99,999 | 0 (0.0%) | 0 (0.0%) |
| $100,000 to $299,999 | 596 (51.5%) | 1,064 (42.1%) |
| $300,000 to $499,999 | 410 (35.4%) | 1,170 (46.3%) |
| $500,000 to $749,999 | 87 (7.5%) | 242 (9.6%) |
| $750,000 to $999,999 | 8 (0.7%) | 0 (0.0%) |
| $1,000,000 or more | 46 (4.0%) | 0 (0.0%) |
| Total | 1,158 (100.0%) | 2,527 (100.0%) |
Household Income by Mortgage Status in Forest
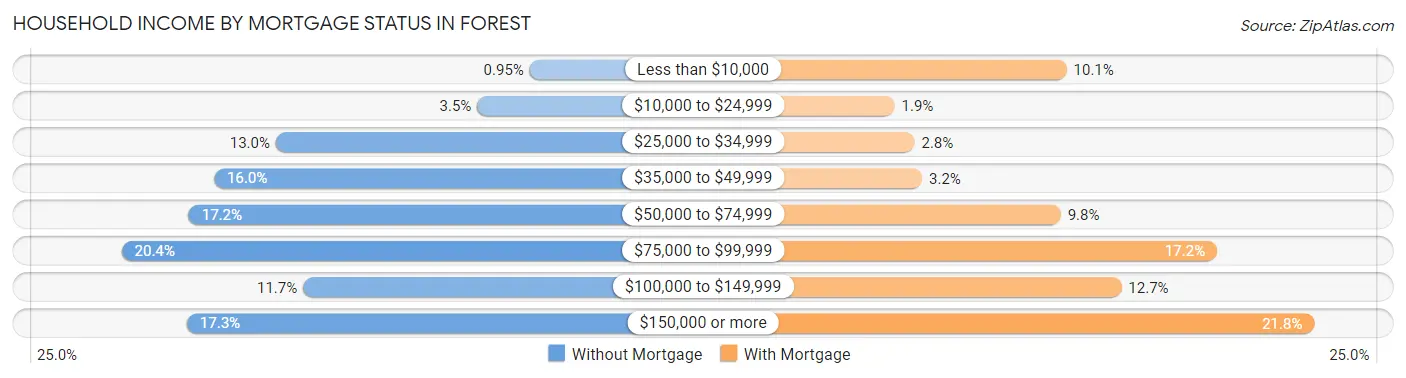
| Household Income | Without Mortgage | With Mortgage |
| Less than $10,000 | 11 (0.9%) | 254 (10.1%) |
| $10,000 to $24,999 | 40 (3.5%) | 47 (1.9%) |
| $25,000 to $34,999 | 151 (13.0%) | 71 (2.8%) |
| $35,000 to $49,999 | 185 (16.0%) | 80 (3.2%) |
| $50,000 to $74,999 | 199 (17.2%) | 247 (9.8%) |
| $75,000 to $99,999 | 236 (20.4%) | 435 (17.2%) |
| $100,000 to $149,999 | 136 (11.7%) | 320 (12.7%) |
| $150,000 or more | 200 (17.3%) | 552 (21.8%) |
| Total | 1,158 (100.0%) | 2,527 (100.0%) |
Property Value to Household Income Ratio in Forest
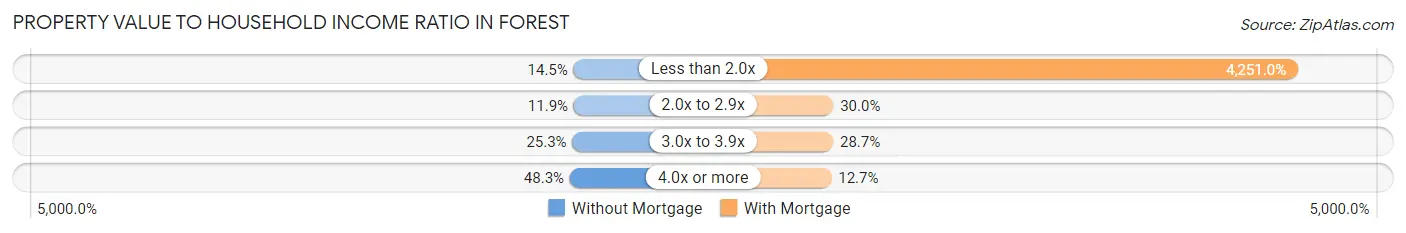
| Value-to-Income Ratio | Without Mortgage | With Mortgage |
| Less than 2.0x | 168 (14.5%) | 107,422 (4,251.0%) |
| 2.0x to 2.9x | 138 (11.9%) | 759 (30.0%) |
| 3.0x to 3.9x | 293 (25.3%) | 724 (28.6%) |
| 4.0x or more | 559 (48.3%) | 320 (12.7%) |
| Total | 1,158 (100.0%) | 2,527 (100.0%) |
Real Estate Taxes by Mortgage Status in Forest
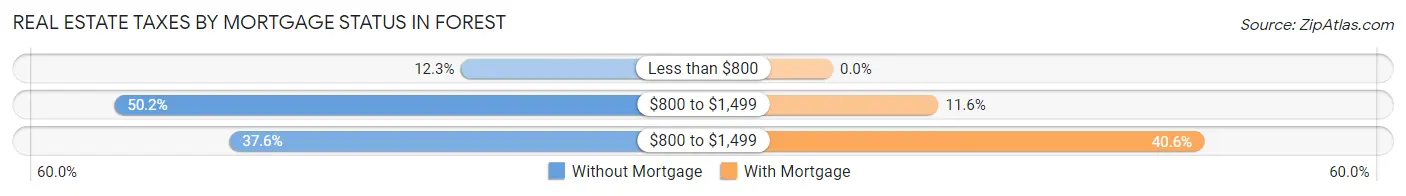
| Property Taxes | Without Mortgage | With Mortgage |
| Less than $800 | 142 (12.3%) | 0 (0.0%) |
| $800 to $1,499 | 581 (50.2%) | 292 (11.6%) |
| $800 to $1,499 | 435 (37.6%) | 1,027 (40.6%) |
| Total | 1,158 (100.0%) | 2,527 (100.0%) |
Health & Disability in Forest
Health Insurance Coverage by Age in Forest
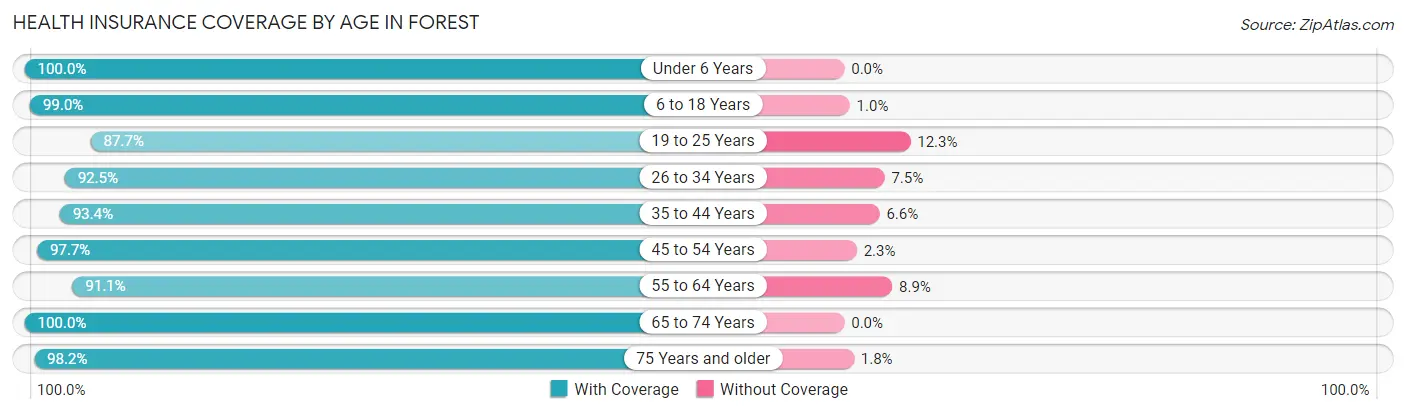
| Age Bracket | With Coverage | Without Coverage |
| Under 6 Years | 609 (100.0%) | 0 (0.0%) |
| 6 to 18 Years | 1,481 (99.0%) | 15 (1.0%) |
| 19 to 25 Years | 1,197 (87.7%) | 168 (12.3%) |
| 26 to 34 Years | 1,037 (92.5%) | 84 (7.5%) |
| 35 to 44 Years | 1,153 (93.4%) | 81 (6.6%) |
| 45 to 54 Years | 1,351 (97.7%) | 32 (2.3%) |
| 55 to 64 Years | 1,616 (91.1%) | 158 (8.9%) |
| 65 to 74 Years | 1,259 (100.0%) | 0 (0.0%) |
| 75 Years and older | 1,217 (98.2%) | 22 (1.8%) |
| Total | 10,920 (95.1%) | 560 (4.9%) |
Health Insurance Coverage by Citizenship Status in Forest
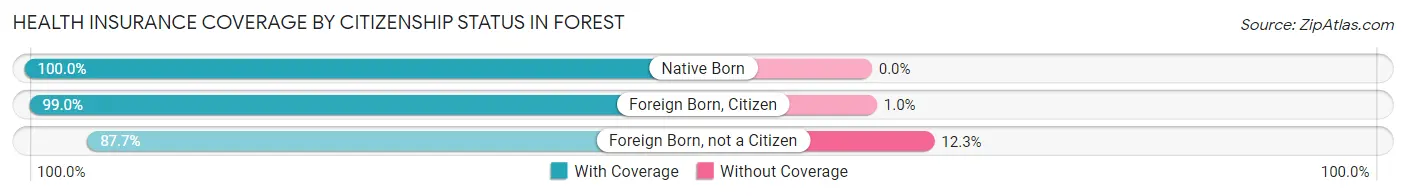
| Citizenship Status | With Coverage | Without Coverage |
| Native Born | 609 (100.0%) | 0 (0.0%) |
| Foreign Born, Citizen | 1,481 (99.0%) | 15 (1.0%) |
| Foreign Born, not a Citizen | 1,197 (87.7%) | 168 (12.3%) |
Health Insurance Coverage by Household Income in Forest
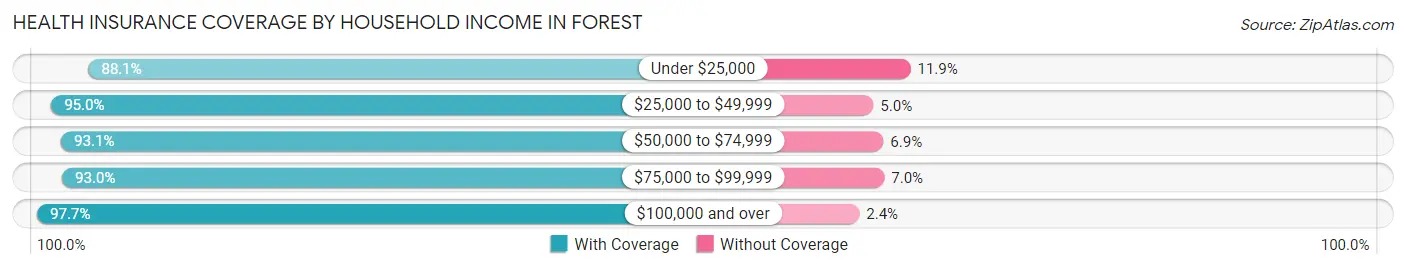
| Household Income | With Coverage | Without Coverage |
| Under $25,000 | 627 (88.1%) | 85 (11.9%) |
| $25,000 to $49,999 | 1,561 (95.0%) | 82 (5.0%) |
| $50,000 to $74,999 | 2,227 (93.1%) | 164 (6.9%) |
| $75,000 to $99,999 | 1,416 (93.0%) | 107 (7.0%) |
| $100,000 and over | 5,072 (97.7%) | 122 (2.4%) |
Public vs Private Health Insurance Coverage by Age in Forest
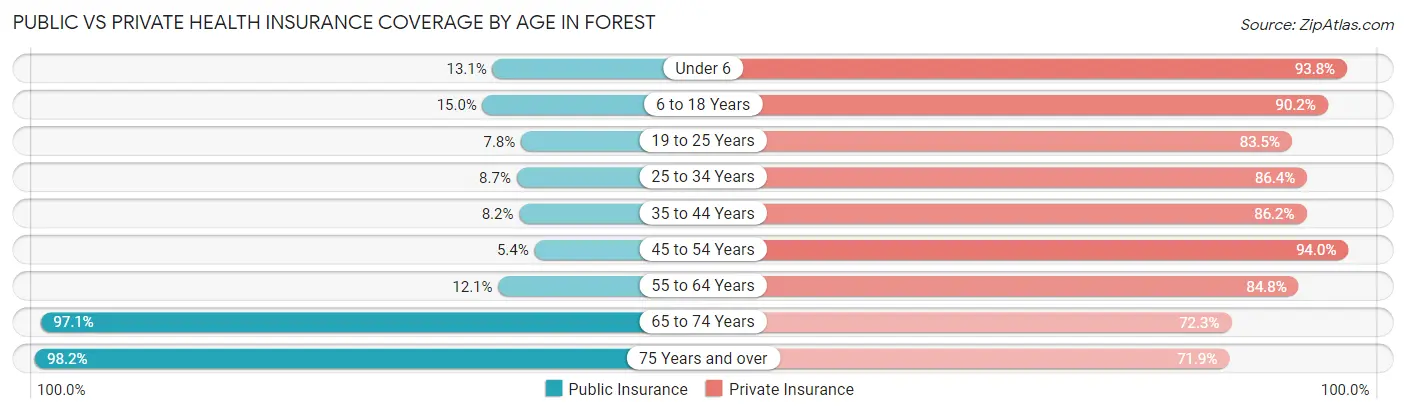
| Age Bracket | Public Insurance | Private Insurance |
| Under 6 | 80 (13.1%) | 571 (93.8%) |
| 6 to 18 Years | 224 (15.0%) | 1,349 (90.2%) |
| 19 to 25 Years | 107 (7.8%) | 1,140 (83.5%) |
| 25 to 34 Years | 97 (8.6%) | 968 (86.4%) |
| 35 to 44 Years | 101 (8.2%) | 1,064 (86.2%) |
| 45 to 54 Years | 74 (5.3%) | 1,300 (94.0%) |
| 55 to 64 Years | 214 (12.1%) | 1,504 (84.8%) |
| 65 to 74 Years | 1,222 (97.1%) | 910 (72.3%) |
| 75 Years and over | 1,217 (98.2%) | 891 (71.9%) |
| Total | 3,336 (29.1%) | 9,697 (84.5%) |
Disability Status by Sex by Age in Forest
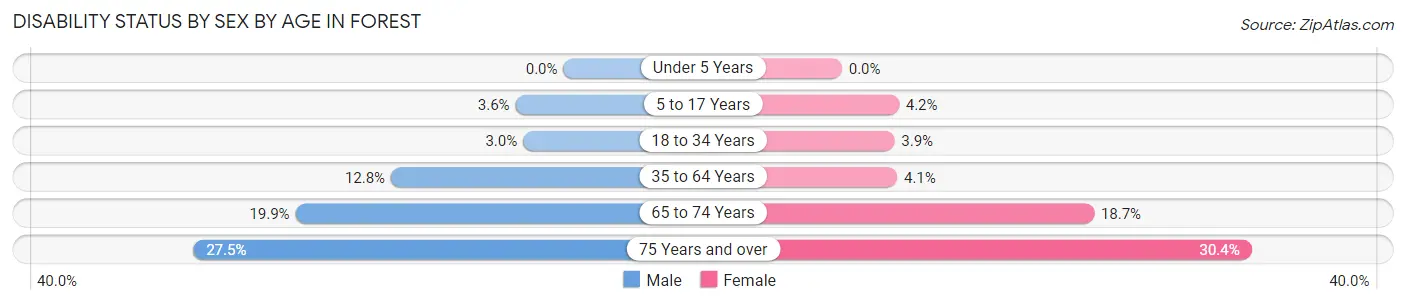
| Age Bracket | Male | Female |
| Under 5 Years | 0 (0.0%) | 0 (0.0%) |
| 5 to 17 Years | 24 (3.6%) | 35 (4.2%) |
| 18 to 34 Years | 37 (3.0%) | 52 (3.9%) |
| 35 to 64 Years | 275 (12.8%) | 92 (4.1%) |
| 65 to 74 Years | 108 (19.9%) | 134 (18.7%) |
| 75 Years and over | 130 (27.5%) | 233 (30.4%) |
Disability Class by Sex by Age in Forest
Disability Class: Hearing Difficulty
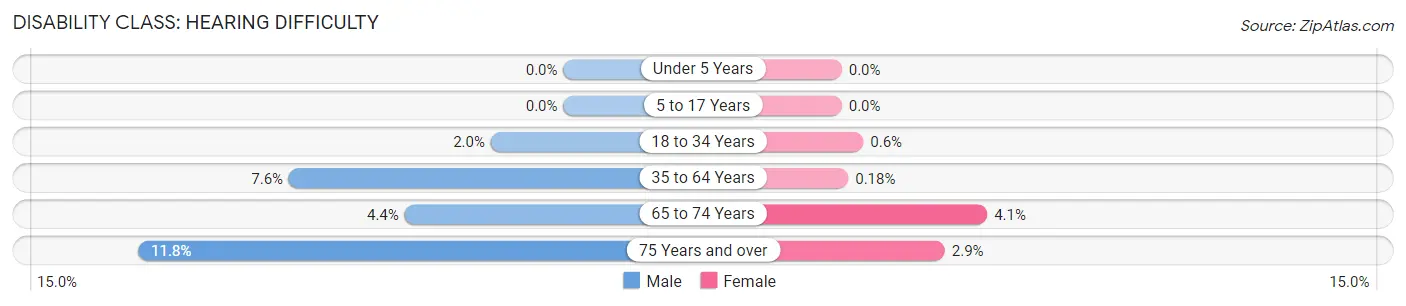
| Age Bracket | Male | Female |
| Under 5 Years | 0 (0.0%) | 0 (0.0%) |
| 5 to 17 Years | 0 (0.0%) | 0 (0.0%) |
| 18 to 34 Years | 25 (2.0%) | 8 (0.6%) |
| 35 to 64 Years | 164 (7.6%) | 4 (0.2%) |
| 65 to 74 Years | 24 (4.4%) | 29 (4.1%) |
| 75 Years and over | 56 (11.8%) | 22 (2.9%) |
Disability Class: Vision Difficulty
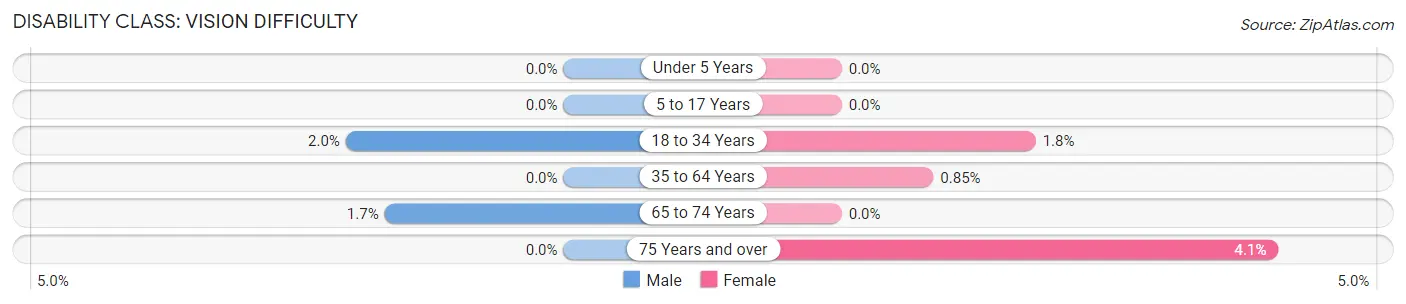
| Age Bracket | Male | Female |
| Under 5 Years | 0 (0.0%) | 0 (0.0%) |
| 5 to 17 Years | 0 (0.0%) | 0 (0.0%) |
| 18 to 34 Years | 25 (2.0%) | 24 (1.8%) |
| 35 to 64 Years | 0 (0.0%) | 19 (0.9%) |
| 65 to 74 Years | 9 (1.7%) | 0 (0.0%) |
| 75 Years and over | 0 (0.0%) | 31 (4.1%) |
Disability Class: Cognitive Difficulty
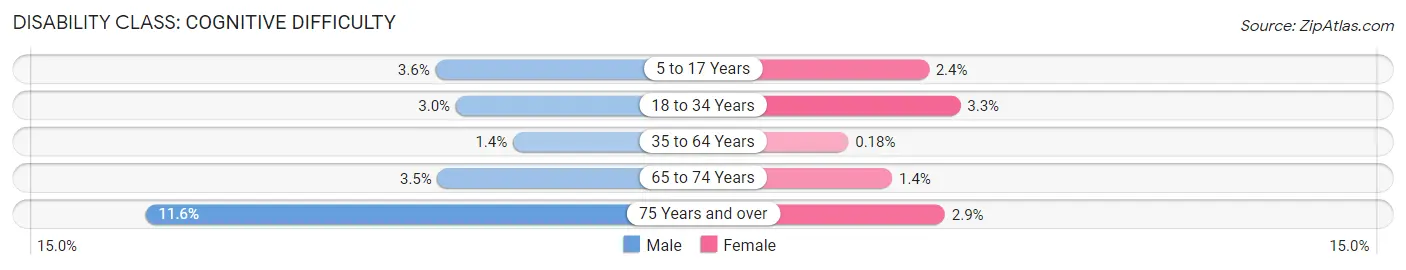
| Age Bracket | Male | Female |
| 5 to 17 Years | 24 (3.6%) | 20 (2.4%) |
| 18 to 34 Years | 37 (3.0%) | 44 (3.3%) |
| 35 to 64 Years | 30 (1.4%) | 4 (0.2%) |
| 65 to 74 Years | 19 (3.5%) | 10 (1.4%) |
| 75 Years and over | 55 (11.6%) | 22 (2.9%) |
Disability Class: Ambulatory Difficulty
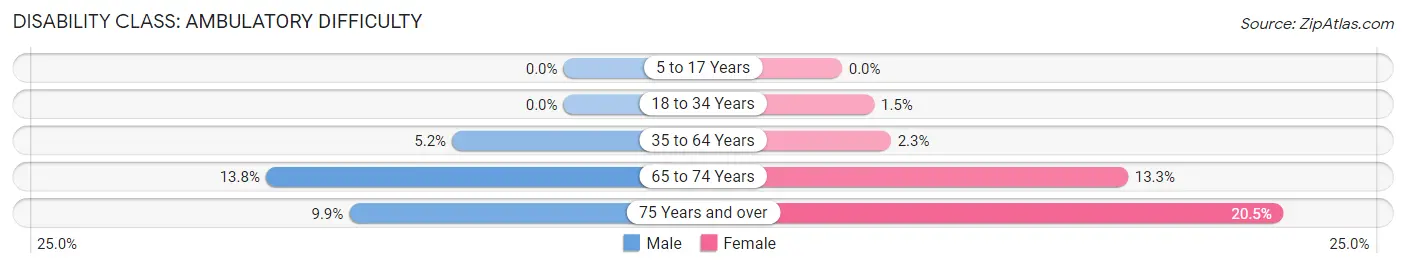
| Age Bracket | Male | Female |
| 5 to 17 Years | 0 (0.0%) | 0 (0.0%) |
| 18 to 34 Years | 0 (0.0%) | 20 (1.5%) |
| 35 to 64 Years | 111 (5.2%) | 51 (2.3%) |
| 65 to 74 Years | 75 (13.8%) | 95 (13.3%) |
| 75 Years and over | 47 (9.9%) | 157 (20.5%) |
Disability Class: Self-Care Difficulty
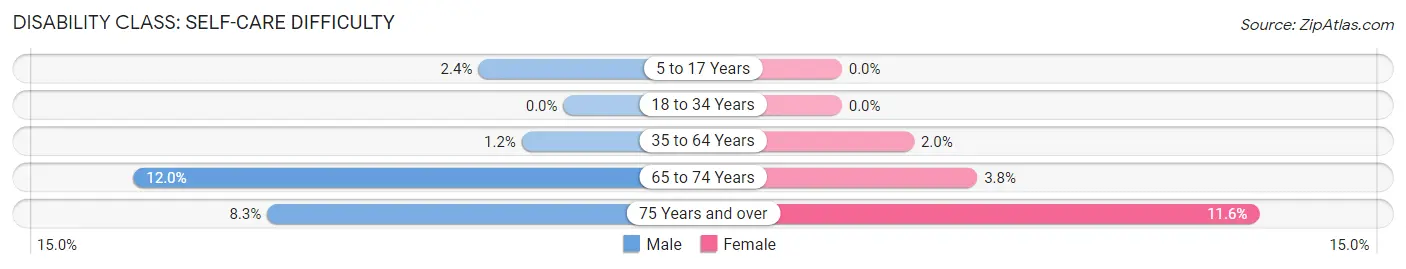
| Age Bracket | Male | Female |
| 5 to 17 Years | 16 (2.4%) | 0 (0.0%) |
| 18 to 34 Years | 0 (0.0%) | 0 (0.0%) |
| 35 to 64 Years | 25 (1.2%) | 45 (2.0%) |
| 65 to 74 Years | 65 (12.0%) | 27 (3.8%) |
| 75 Years and over | 39 (8.3%) | 89 (11.6%) |
Technology Access in Forest
Computing Device Access in Forest
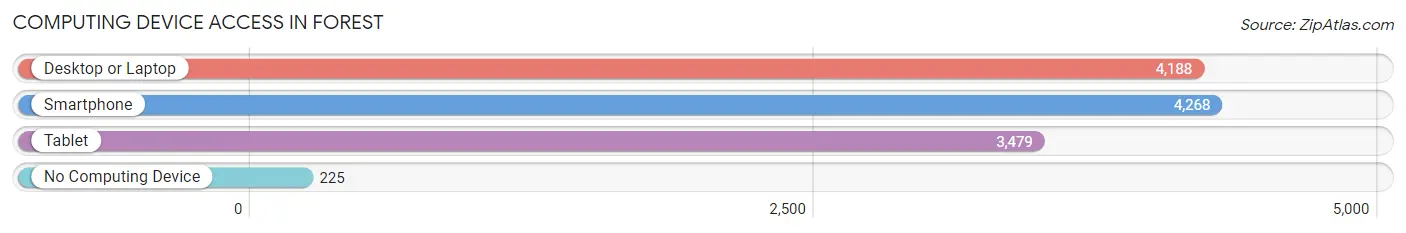
| Device Type | # Households | % Households |
| Desktop or Laptop | 4,188 | 86.1% |
| Smartphone | 4,268 | 87.7% |
| Tablet | 3,479 | 71.5% |
| No Computing Device | 225 | 4.6% |
| Total | 4,865 | 100.0% |
Internet Access in Forest
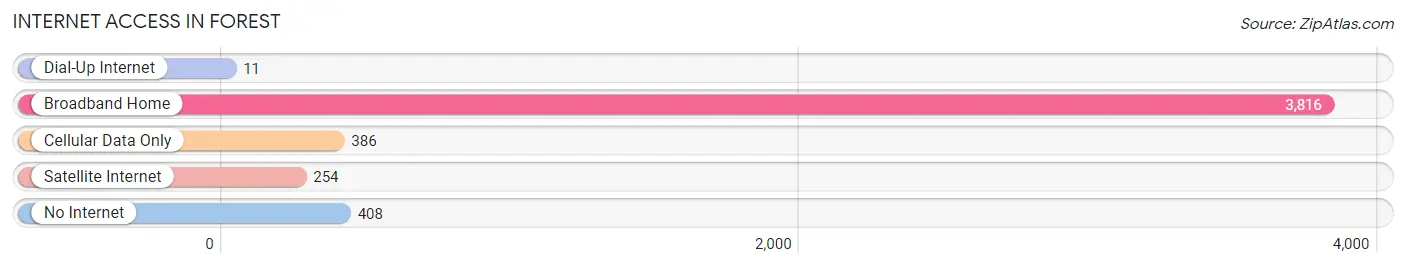
| Internet Type | # Households | % Households |
| Dial-Up Internet | 11 | 0.2% |
| Broadband Home | 3,816 | 78.4% |
| Cellular Data Only | 386 | 7.9% |
| Satellite Internet | 254 | 5.2% |
| No Internet | 408 | 8.4% |
| Total | 4,865 | 100.0% |
Forest Summary
Forest, Virginia is a small town located in Bedford County, Virginia. It is situated in the foothills of the Blue Ridge Mountains, and is part of the Lynchburg Metropolitan Statistical Area. The town has a population of approximately 1,500 people, and is known for its rural charm and small-town atmosphere.
Geography
Forest is located in the foothills of the Blue Ridge Mountains, and is situated in the Appalachian Mountains. The town is located in the western part of Bedford County, and is bordered by the city of Lynchburg to the east, and the town of Bedford to the south. The town is situated at an elevation of 1,000 feet above sea level, and is surrounded by rolling hills and lush forests. The town is located near the James River, and is home to several small lakes and streams.
Economy
The economy of Forest is largely based on agriculture and forestry. The town is home to several small farms, and the surrounding area is known for its production of apples, peaches, and other fruits and vegetables. The town is also home to several small businesses, including a grocery store, a hardware store, and a few restaurants. The town is also home to a small manufacturing plant, which produces furniture and other wood products.
Demographics
As of the 2010 census, the population of Forest was 1,500 people. The racial makeup of the town was 95.3% White, 1.7% African American, 0.3% Native American, 0.7% Asian, 0.3% from other races, and 1.7% from two or more races. Hispanic or Latino of any race were 1.3% of the population.
The median income for a household in Forest was $37,500, and the median income for a family was $45,000. The per capita income for the town was $19,000. About 11.7% of families and 14.3% of the population were below the poverty line, including 18.2% of those under age 18 and 8.3% of those age 65 or over.
History
The town of Forest was first settled in the early 1800s by a group of settlers from Pennsylvania. The town was originally known as “Forestville”, and was named after the surrounding forests. The town was incorporated in 1883, and the first post office was established in 1884. The town was a popular stop on the Lynchburg and Durham Railroad, and was home to several small businesses, including a sawmill, a gristmill, and a general store.
In the early 1900s, the town began to grow and develop, and several new businesses were established. The town was home to several churches, and a school was built in 1910. The town was also home to a movie theater, which opened in the 1920s.
In the 1950s, the town began to decline, and many of the businesses closed. The town was also affected by the construction of the Blue Ridge Parkway, which bypassed the town. In the late 1970s, the town began to experience a resurgence, and several new businesses opened. Today, the town is known for its rural charm and small-town atmosphere.
Common Questions
What is Per Capita Income in Forest?
Per Capita income in Forest is $45,115.
What is the Median Family Income in Forest?
Median Family Income in Forest is $87,826.
What is the Median Household income in Forest?
Median Household Income in Forest is $78,327.
What is Income or Wage Gap in Forest?
Income or Wage Gap in Forest is 19.0%.
Women in Forest earn 81.0 cents for every dollar earned by a man.
What is Family Income Deficit in Forest?
Family Income Deficit in Forest is $12,006.
Families that are below poverty line in Forest earn $12,006 less on average than the poverty threshold level.
What is Inequality or Gini Index in Forest?
Inequality or Gini Index in Forest is 0.44.
What is the Total Population of Forest?
Total Population of Forest is 11,559.
What is the Total Male Population of Forest?
Total Male Population of Forest is 5,369.
What is the Total Female Population of Forest?
Total Female Population of Forest is 6,190.
What is the Ratio of Males per 100 Females in Forest?
There are 86.74 Males per 100 Females in Forest.
What is the Ratio of Females per 100 Males in Forest?
There are 115.29 Females per 100 Males in Forest.
What is the Median Population Age in Forest?
Median Population Age in Forest is 44.7 Years.
What is the Average Family Size in Forest
Average Family Size in Forest is 2.9 People.
What is the Average Household Size in Forest
Average Household Size in Forest is 2.4 People.
How Large is the Labor Force in Forest?
There are 5,891 People in the Labor Forcein in Forest.
What is the Percentage of People in the Labor Force in Forest?
59.9% of People are in the Labor Force in Forest.
What is the Unemployment Rate in Forest?
Unemployment Rate in Forest is 4.6%.