Grottoes, VA Map & Demographics
Grottoes Map
Grottoes Overview
$41,563
PER CAPITA INCOME
$92,639
AVG FAMILY INCOME
$78,750
AVG HOUSEHOLD INCOME
32.7%
WAGE / INCOME GAP [ % ]
67.3¢/ $1
WAGE / INCOME GAP [ $ ]
0.42
INEQUALITY / GINI INDEX
2,904
TOTAL POPULATION
1,322
MALE POPULATION
1,582
FEMALE POPULATION
83.57
MALES / 100 FEMALES
119.67
FEMALES / 100 MALES
38.3
MEDIAN AGE
2.9
AVG FAMILY SIZE
2.5
AVG HOUSEHOLD SIZE
1,829
LABOR FORCE [ PEOPLE ]
75.5%
PERCENT IN LABOR FORCE
4.0%
UNEMPLOYMENT RATE
Grottoes Zip Codes
Grottoes Area Codes
Income in Grottoes
Income Overview in Grottoes
Per Capita Income in Grottoes is $41,563, while median incomes of families and households are $92,639 and $78,750 respectively.
| Characteristic | Number | Measure |
| Per Capita Income | 2,904 | $41,563 |
| Median Family Income | 740 | $92,639 |
| Mean Family Income | 740 | $110,555 |
| Median Household Income | 1,156 | $78,750 |
| Mean Household Income | 1,156 | $99,786 |
| Income Deficit | 740 | $0 |
| Wage / Income Gap (%) | 2,904 | 32.67% |
| Wage / Income Gap ($) | 2,904 | 67.33¢ per $1 |
| Gini / Inequality Index | 2,904 | 0.42 |
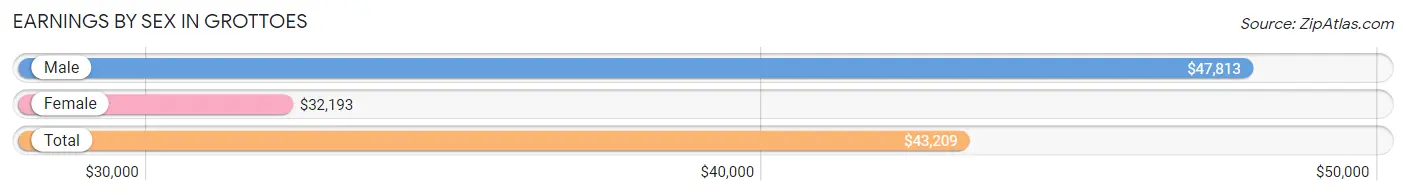
Earnings by Sex in Grottoes
Average Earnings in Grottoes are $43,209, $47,813 for men and $32,193 for women, a difference of 32.7%.
| Sex | Number | Average Earnings |
| Male | 927 (49.9%) | $47,813 |
| Female | 932 (50.1%) | $32,193 |
| Total | 1,859 (100.0%) | $43,209 |
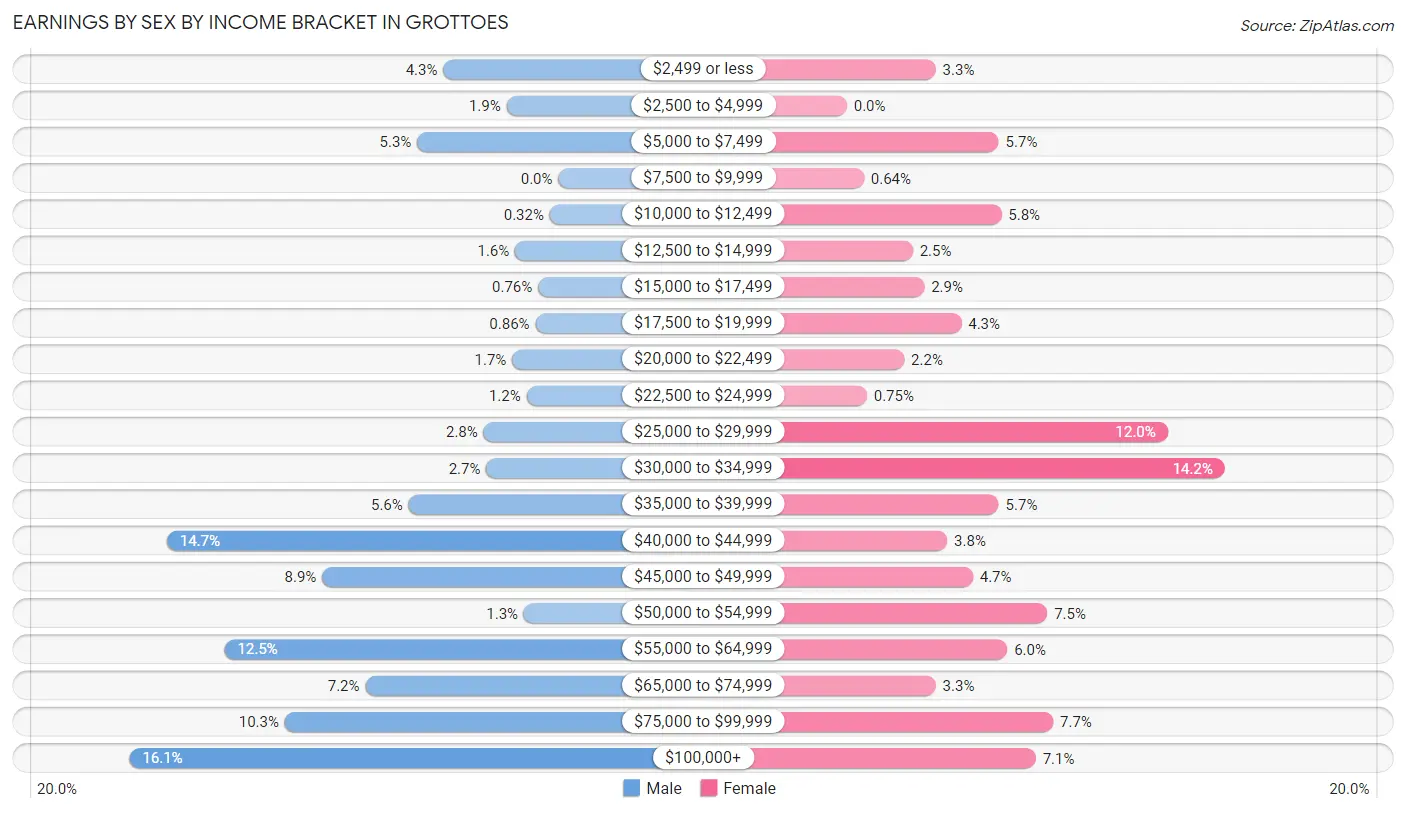
Earnings by Sex by Income Bracket in Grottoes
The most common earnings brackets in Grottoes are $100,000+ for men (149 | 16.1%) and $30,000 to $34,999 for women (132 | 14.2%).
| Income | Male | Female |
| $2,499 or less | 40 (4.3%) | 31 (3.3%) |
| $2,500 to $4,999 | 18 (1.9%) | 0 (0.0%) |
| $5,000 to $7,499 | 49 (5.3%) | 53 (5.7%) |
| $7,500 to $9,999 | 0 (0.0%) | 6 (0.6%) |
| $10,000 to $12,499 | 3 (0.3%) | 54 (5.8%) |
| $12,500 to $14,999 | 15 (1.6%) | 23 (2.5%) |
| $15,000 to $17,499 | 7 (0.8%) | 27 (2.9%) |
| $17,500 to $19,999 | 8 (0.9%) | 40 (4.3%) |
| $20,000 to $22,499 | 16 (1.7%) | 20 (2.1%) |
| $22,500 to $24,999 | 11 (1.2%) | 7 (0.7%) |
| $25,000 to $29,999 | 26 (2.8%) | 112 (12.0%) |
| $30,000 to $34,999 | 25 (2.7%) | 132 (14.2%) |
| $35,000 to $39,999 | 52 (5.6%) | 53 (5.7%) |
| $40,000 to $44,999 | 136 (14.7%) | 35 (3.8%) |
| $45,000 to $49,999 | 82 (8.8%) | 44 (4.7%) |
| $50,000 to $54,999 | 12 (1.3%) | 70 (7.5%) |
| $55,000 to $64,999 | 116 (12.5%) | 56 (6.0%) |
| $65,000 to $74,999 | 67 (7.2%) | 31 (3.3%) |
| $75,000 to $99,999 | 95 (10.2%) | 72 (7.7%) |
| $100,000+ | 149 (16.1%) | 66 (7.1%) |
| Total | 927 (100.0%) | 932 (100.0%) |
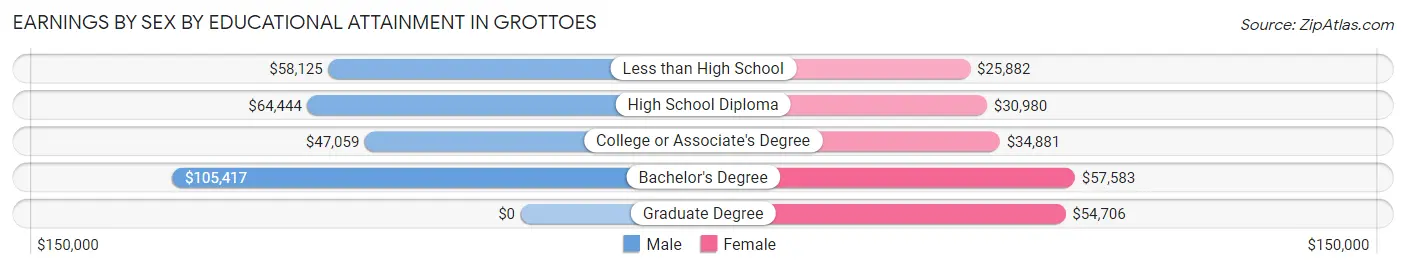
Earnings by Sex by Educational Attainment in Grottoes
Average earnings in Grottoes are $59,180 for men and $36,607 for women, a difference of 38.1%. Men with an educational attainment of bachelor's degree enjoy the highest average annual earnings of $105,417, while those with college or associate's degree education earn the least with $47,059. Women with an educational attainment of bachelor's degree earn the most with the average annual earnings of $57,583, while those with less than high school education have the smallest earnings of $25,882.
| Educational Attainment | Male Income | Female Income |
| Less than High School | $58,125 | $25,882 |
| High School Diploma | $64,444 | $30,980 |
| College or Associate's Degree | $47,059 | $34,881 |
| Bachelor's Degree | $105,417 | $57,583 |
| Graduate Degree | - | - |
| Total | $59,180 | $36,607 |
Family Income in Grottoes
Family Income Brackets in Grottoes
According to the Grottoes family income data, there are 182 families falling into the $50,000 to $74,999 income range, which is the most common income bracket and makes up 24.6% of all families. Conversely, the $10,000 to $14,999 income bracket is the least frequent group with only 3 families (0.4%) belonging to this category.
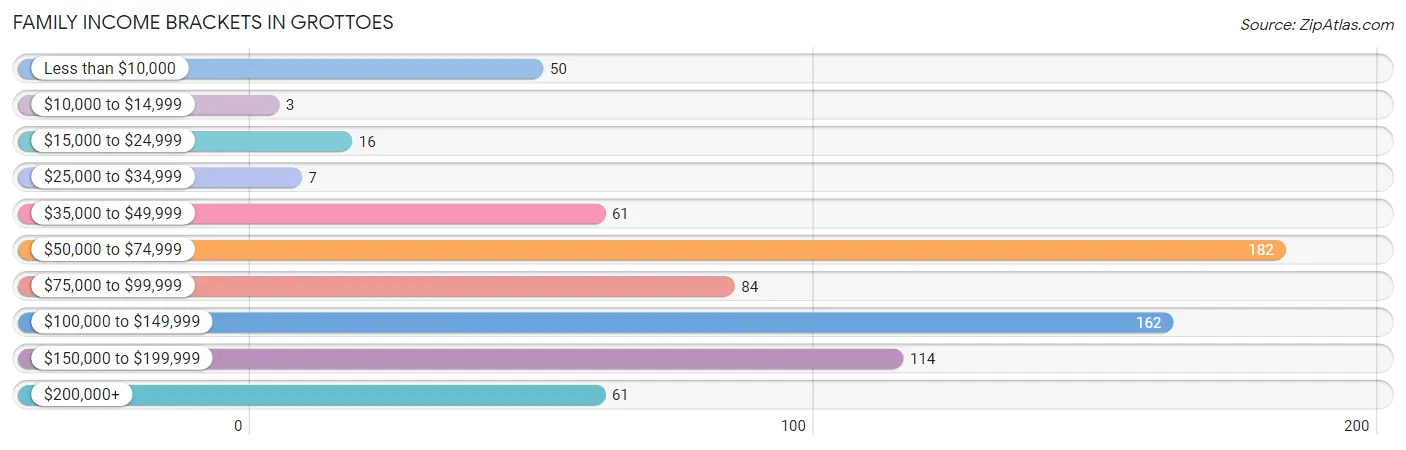
| Income Bracket | # Families | % Families |
| Less than $10,000 | 50 | 6.8% |
| $10,000 to $14,999 | 3 | 0.4% |
| $15,000 to $24,999 | 16 | 2.2% |
| $25,000 to $34,999 | 7 | 0.9% |
| $35,000 to $49,999 | 61 | 8.2% |
| $50,000 to $74,999 | 182 | 24.6% |
| $75,000 to $99,999 | 84 | 11.4% |
| $100,000 to $149,999 | 162 | 21.9% |
| $150,000 to $199,999 | 114 | 15.4% |
| $200,000+ | 61 | 8.2% |
Family Income by Famaliy Size in Grottoes
4-person families (158 | 21.3%) account for the highest median family income in Grottoes with $146,214 per family, while 2-person families (286 | 38.7%) have the highest median income of $38,438 per family member.
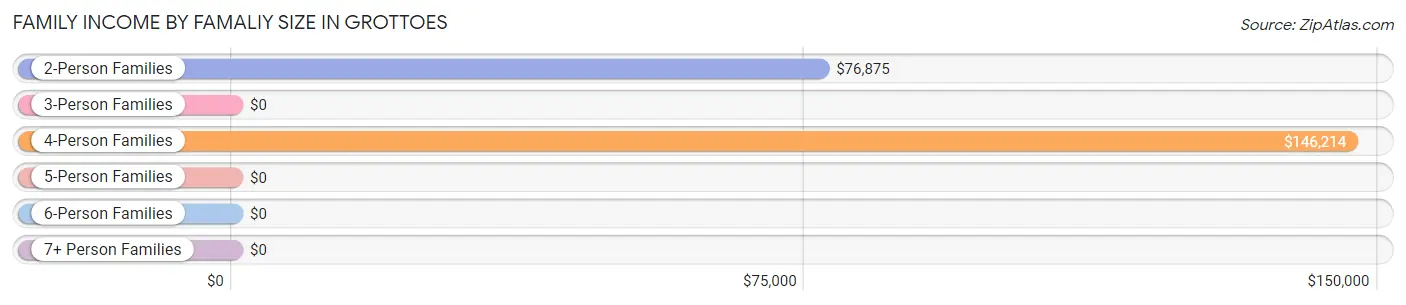
| Income Bracket | # Families | Median Income |
| 2-Person Families | 286 (38.7%) | $76,875 |
| 3-Person Families | 280 (37.8%) | $0 |
| 4-Person Families | 158 (21.3%) | $146,214 |
| 5-Person Families | 8 (1.1%) | $0 |
| 6-Person Families | 8 (1.1%) | $0 |
| 7+ Person Families | 0 (0.0%) | $0 |
| Total | 740 (100.0%) | $92,639 |
Family Income by Number of Earners in Grottoes
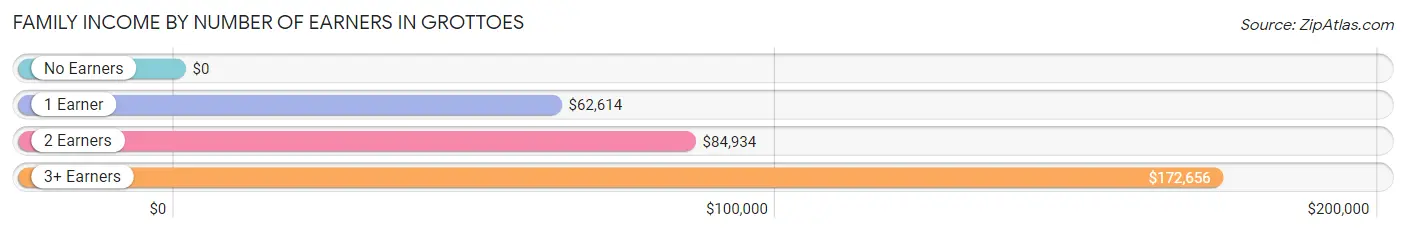
| Number of Earners | # Families | Median Income |
| No Earners | 113 (15.3%) | $0 |
| 1 Earner | 201 (27.2%) | $62,614 |
| 2 Earners | 261 (35.3%) | $84,934 |
| 3+ Earners | 165 (22.3%) | $172,656 |
| Total | 740 (100.0%) | $92,639 |
Household Income in Grottoes
Household Income Brackets in Grottoes
With 287 households falling in the category, the $50,000 to $74,999 income range is the most frequent in Grottoes, accounting for 24.8% of all households. In contrast, only 22 households (1.9%) fall into the $25,000 to $34,999 income bracket, making it the least populous group.
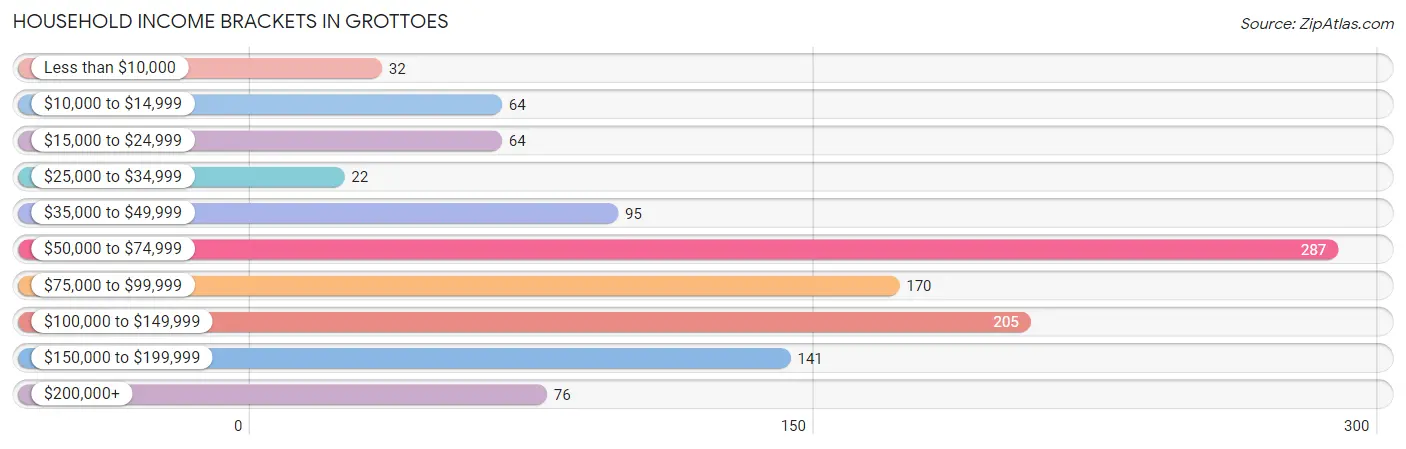
| Income Bracket | # Households | % Households |
| Less than $10,000 | 32 | 2.8% |
| $10,000 to $14,999 | 64 | 5.5% |
| $15,000 to $24,999 | 64 | 5.5% |
| $25,000 to $34,999 | 22 | 1.9% |
| $35,000 to $49,999 | 95 | 8.2% |
| $50,000 to $74,999 | 287 | 24.8% |
| $75,000 to $99,999 | 170 | 14.7% |
| $100,000 to $149,999 | 205 | 17.7% |
| $150,000 to $199,999 | 141 | 12.2% |
| $200,000+ | 76 | 6.6% |
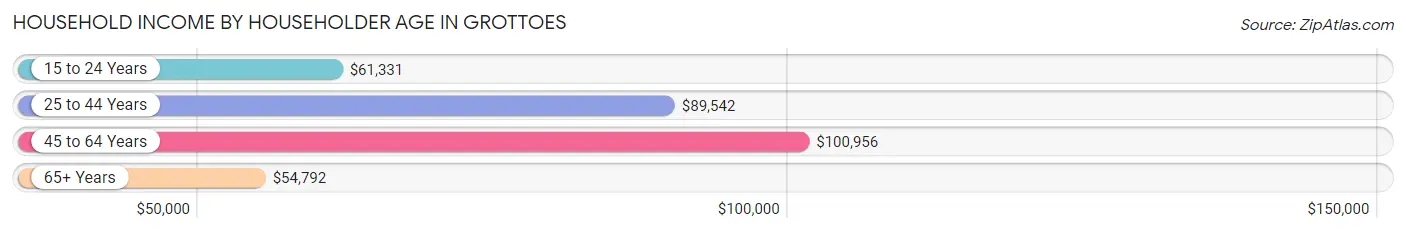
Household Income by Householder Age in Grottoes
The median household income in Grottoes is $78,750, with the highest median household income of $100,956 found in the 45 to 64 years age bracket for the primary householder. A total of 473 households (40.9%) fall into this category. Meanwhile, the 65+ years age bracket for the primary householder has the lowest median household income of $54,792, with 255 households (22.1%) in this group.
| Income Bracket | # Households | Median Income |
| 15 to 24 Years | 117 (10.1%) | $61,331 |
| 25 to 44 Years | 311 (26.9%) | $89,542 |
| 45 to 64 Years | 473 (40.9%) | $100,956 |
| 65+ Years | 255 (22.1%) | $54,792 |
| Total | 1,156 (100.0%) | $78,750 |
Poverty in Grottoes
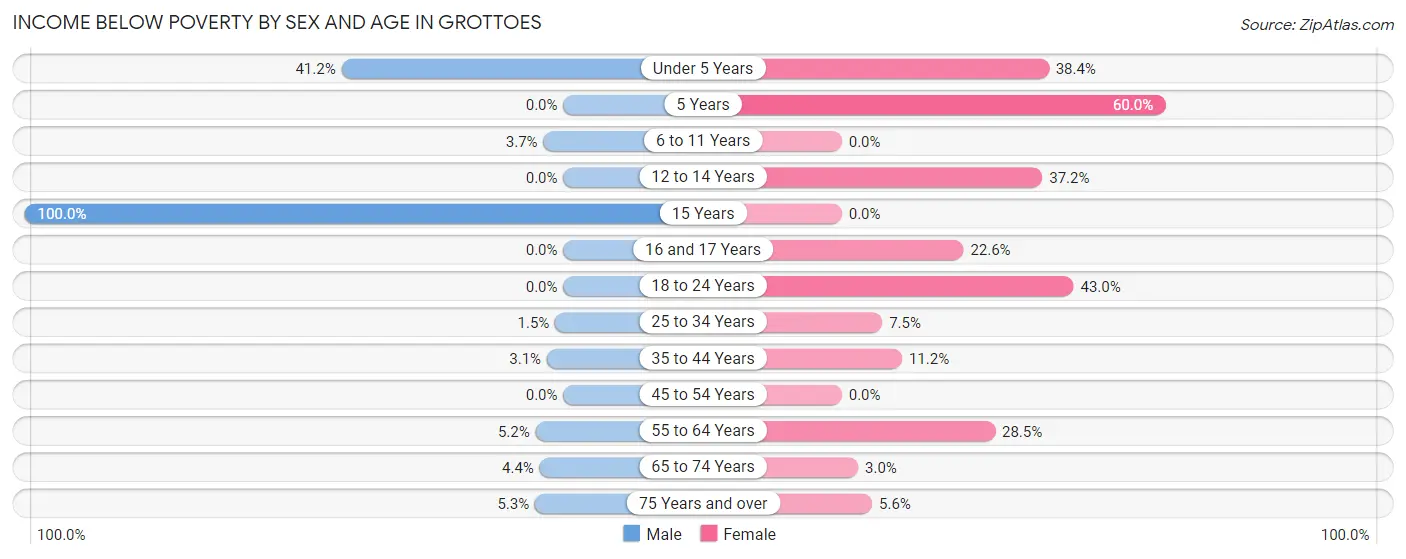
Income Below Poverty by Sex and Age in Grottoes
With 4.7% poverty level for males and 17.3% for females among the residents of Grottoes, 15 year old males and 5 year old females are the most vulnerable to poverty, with 6 males (100.0%) and 15 females (60.0%) in their respective age groups living below the poverty level.
| Age Bracket | Male | Female |
| Under 5 Years | 28 (41.2%) | 48 (38.4%) |
| 5 Years | 0 (0.0%) | 15 (60.0%) |
| 6 to 11 Years | 4 (3.7%) | 0 (0.0%) |
| 12 to 14 Years | 0 (0.0%) | 16 (37.2%) |
| 15 Years | 6 (100.0%) | 0 (0.0%) |
| 16 and 17 Years | 0 (0.0%) | 7 (22.6%) |
| 18 to 24 Years | 0 (0.0%) | 77 (43.0%) |
| 25 to 34 Years | 3 (1.5%) | 15 (7.5%) |
| 35 to 44 Years | 4 (3.0%) | 20 (11.2%) |
| 45 to 54 Years | 0 (0.0%) | 0 (0.0%) |
| 55 to 64 Years | 8 (5.2%) | 68 (28.4%) |
| 65 to 74 Years | 4 (4.4%) | 3 (3.0%) |
| 75 Years and over | 5 (5.3%) | 5 (5.6%) |
| Total | 62 (4.7%) | 274 (17.3%) |
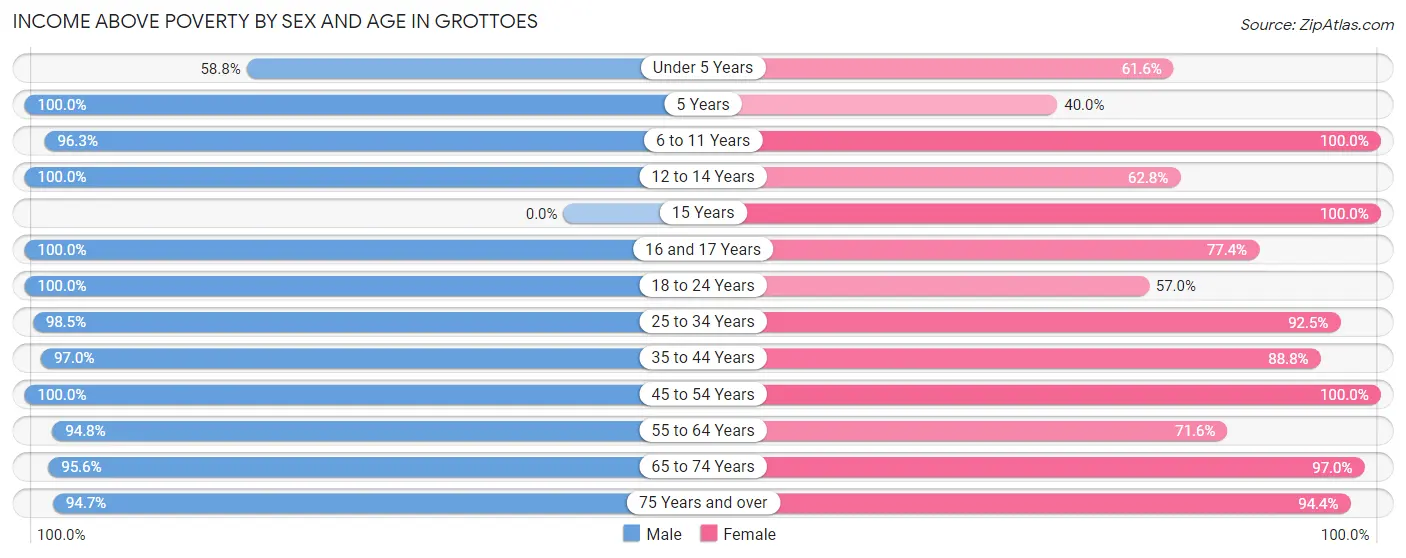
Income Above Poverty by Sex and Age in Grottoes
According to the poverty statistics in Grottoes, males aged 5 years and females aged 6 to 11 years are the age groups that are most secure financially, with 100.0% of males and 100.0% of females in these age groups living above the poverty line.
| Age Bracket | Male | Female |
| Under 5 Years | 40 (58.8%) | 77 (61.6%) |
| 5 Years | 4 (100.0%) | 10 (40.0%) |
| 6 to 11 Years | 104 (96.3%) | 46 (100.0%) |
| 12 to 14 Years | 24 (100.0%) | 27 (62.8%) |
| 15 Years | 0 (0.0%) | 33 (100.0%) |
| 16 and 17 Years | 52 (100.0%) | 24 (77.4%) |
| 18 to 24 Years | 200 (100.0%) | 102 (57.0%) |
| 25 to 34 Years | 194 (98.5%) | 185 (92.5%) |
| 35 to 44 Years | 127 (97.0%) | 159 (88.8%) |
| 45 to 54 Years | 191 (100.0%) | 294 (100.0%) |
| 55 to 64 Years | 147 (94.8%) | 171 (71.6%) |
| 65 to 74 Years | 87 (95.6%) | 96 (97.0%) |
| 75 Years and over | 90 (94.7%) | 84 (94.4%) |
| Total | 1,260 (95.3%) | 1,308 (82.7%) |
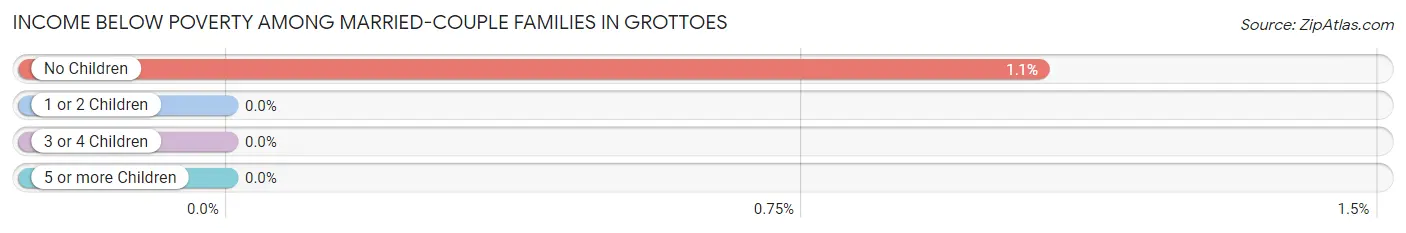
Income Below Poverty Among Married-Couple Families in Grottoes
The poverty statistics for married-couple families in Grottoes show that 0.7% or 4 of the total 545 families live below the poverty line. Families with no children have the highest poverty rate of 1.1%, comprising of 4 families. On the other hand, families with 1 or 2 children have the lowest poverty rate of 0.0%, which includes 0 families.
| Children | Above Poverty | Below Poverty |
| No Children | 373 (98.9%) | 4 (1.1%) |
| 1 or 2 Children | 168 (100.0%) | 0 (0.0%) |
| 3 or 4 Children | 0 (0.0%) | 0 (0.0%) |
| 5 or more Children | 0 (0.0%) | 0 (0.0%) |
| Total | 541 (99.3%) | 4 (0.7%) |
Income Below Poverty Among Single-Parent Households in Grottoes
According to the poverty data in Grottoes, 5.2% or 3 single-father households and 45.3% or 62 single-mother households are living below the poverty line. Among single-father households, those with 1 or 2 children have the highest poverty rate, with 3 households (5.9%) experiencing poverty. Likewise, among single-mother households, those with 3 or 4 children have the highest poverty rate, with 6 households (46.2%) falling below the poverty line.
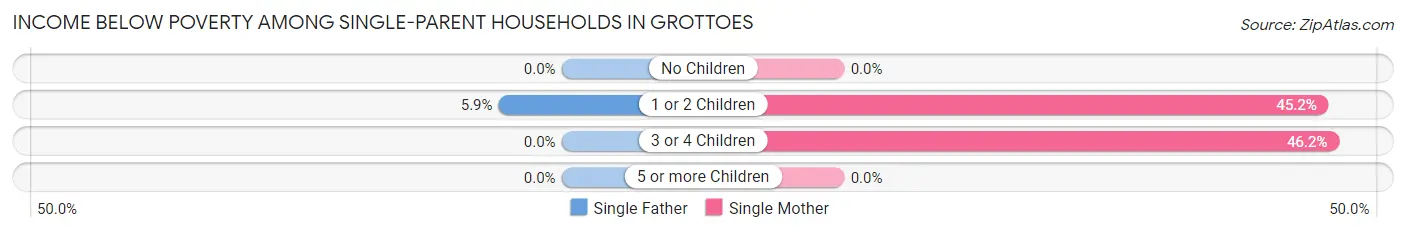
| Children | Single Father | Single Mother |
| No Children | 0 (0.0%) | 0 (0.0%) |
| 1 or 2 Children | 3 (5.9%) | 56 (45.2%) |
| 3 or 4 Children | 0 (0.0%) | 6 (46.2%) |
| 5 or more Children | 0 (0.0%) | 0 (0.0%) |
| Total | 3 (5.2%) | 62 (45.3%) |
Income Below Poverty Among Married-Couple vs Single-Parent Households in Grottoes
The poverty data for Grottoes shows that 4 of the married-couple family households (0.7%) and 65 of the single-parent households (33.3%) are living below the poverty level. Within the married-couple family households, those with no children have the highest poverty rate, with 4 households (1.1%) falling below the poverty line. Among the single-parent households, those with 3 or 4 children have the highest poverty rate, with 6 household (46.2%) living below poverty.
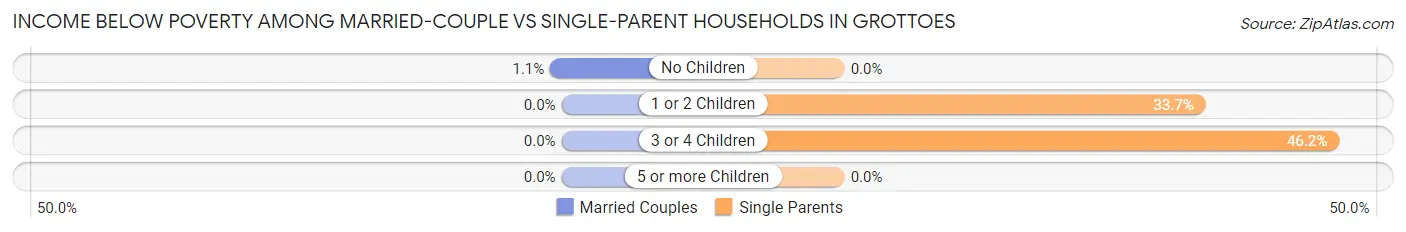
| Children | Married-Couple Families | Single-Parent Households |
| No Children | 4 (1.1%) | 0 (0.0%) |
| 1 or 2 Children | 0 (0.0%) | 59 (33.7%) |
| 3 or 4 Children | 0 (0.0%) | 6 (46.2%) |
| 5 or more Children | 0 (0.0%) | 0 (0.0%) |
| Total | 4 (0.7%) | 65 (33.3%) |
Race in Grottoes
The most populous races in Grottoes are White / Caucasian (2,577 | 88.7%), Two or more Races (221 | 7.6%), and Hispanic or Latino (134 | 4.6%).
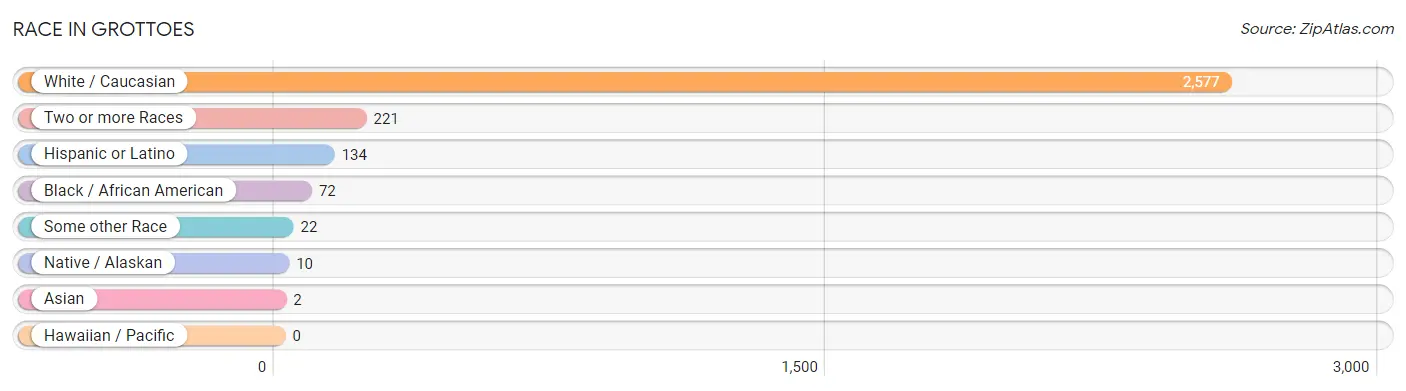
| Race | # Population | % Population |
| Asian | 2 | 0.1% |
| Black / African American | 72 | 2.5% |
| Hawaiian / Pacific | 0 | 0.0% |
| Hispanic or Latino | 134 | 4.6% |
| Native / Alaskan | 10 | 0.3% |
| White / Caucasian | 2,577 | 88.7% |
| Two or more Races | 221 | 7.6% |
| Some other Race | 22 | 0.8% |
| Total | 2,904 | 100.0% |
Ancestry in Grottoes
The most populous ancestries reported in Grottoes are American (408 | 14.1%), German (396 | 13.6%), English (290 | 10.0%), Irish (230 | 7.9%), and French (122 | 4.2%), together accounting for 49.8% of all Grottoes residents.
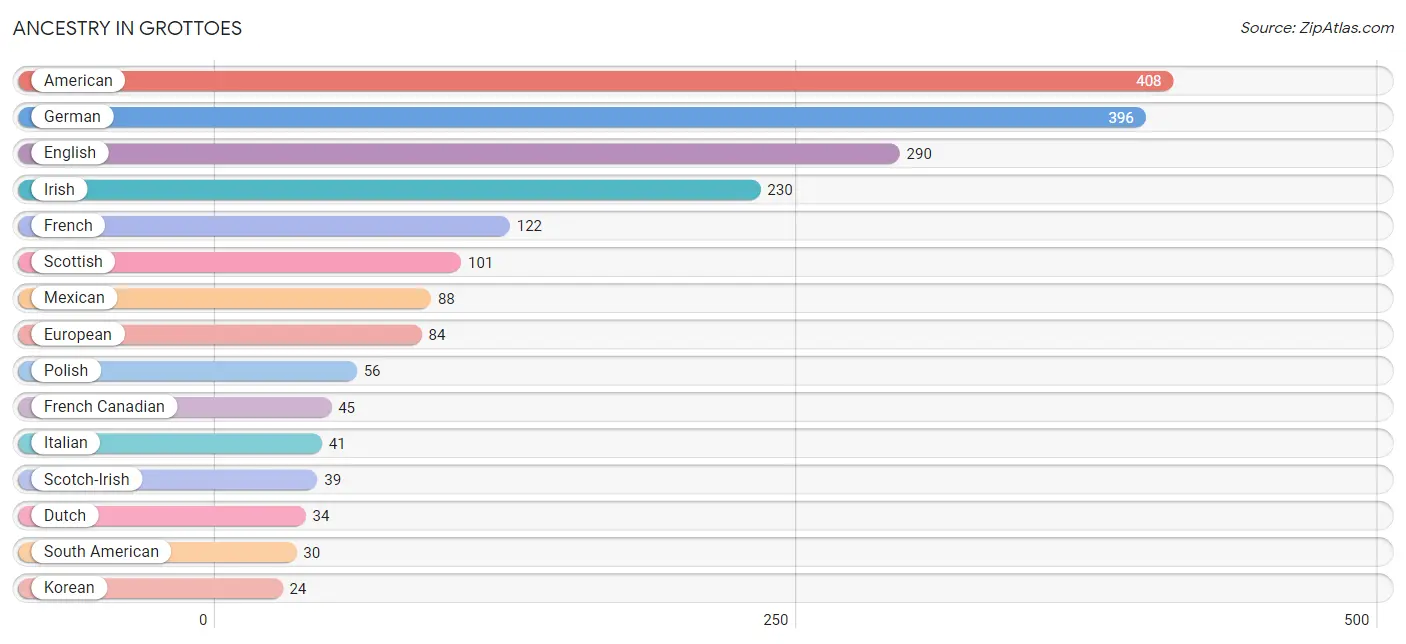
| Ancestry | # Population | % Population |
| American | 408 | 14.1% |
| British | 22 | 0.8% |
| Cherokee | 5 | 0.2% |
| Colombian | 21 | 0.7% |
| Cuban | 16 | 0.5% |
| Dutch | 34 | 1.2% |
| Eastern European | 5 | 0.2% |
| English | 290 | 10.0% |
| European | 84 | 2.9% |
| French | 122 | 4.2% |
| French Canadian | 45 | 1.5% |
| German | 396 | 13.6% |
| Irish | 230 | 7.9% |
| Italian | 41 | 1.4% |
| Korean | 24 | 0.8% |
| Mexican | 88 | 3.0% |
| Pakistani | 2 | 0.1% |
| Pennsylvania German | 7 | 0.2% |
| Polish | 56 | 1.9% |
| Russian | 9 | 0.3% |
| Scotch-Irish | 39 | 1.3% |
| Scottish | 101 | 3.5% |
| South American | 30 | 1.0% |
| Swedish | 3 | 0.1% |
| Swiss | 13 | 0.4% |
| Uruguayan | 9 | 0.3% |
| Welsh | 12 | 0.4% | View All 27 Rows |
Immigrants in Grottoes
The most numerous immigrant groups reported in Grottoes came from Latin America (84 | 2.9%), Central America (54 | 1.9%), Mexico (54 | 1.9%), South America (30 | 1.0%), and Colombia (21 | 0.7%), together accounting for 8.4% of all Grottoes residents.
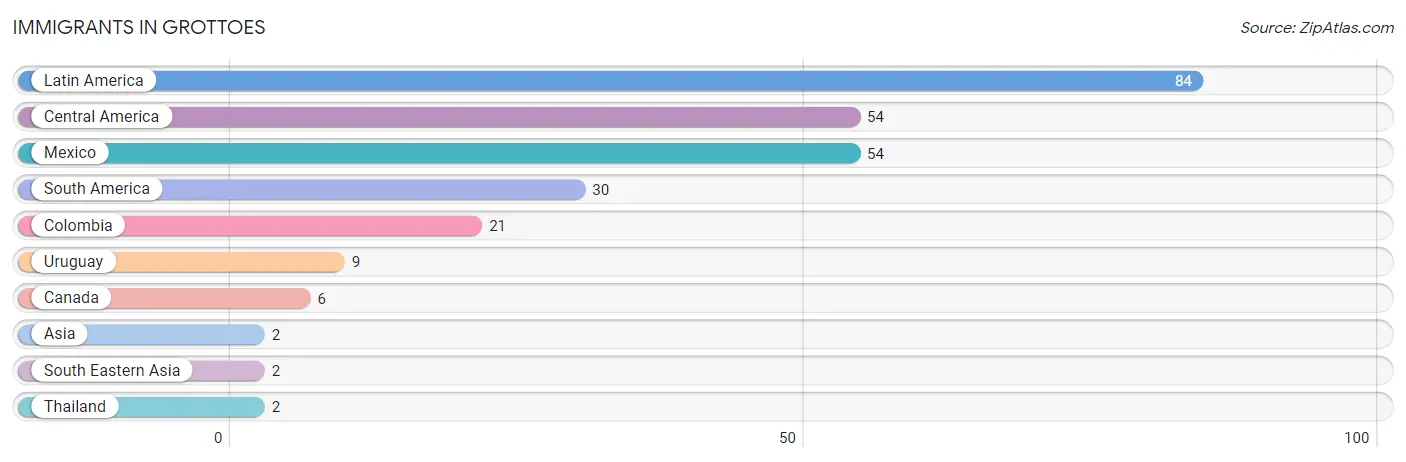
| Immigration Origin | # Population | % Population |
| Asia | 2 | 0.1% |
| Canada | 6 | 0.2% |
| Central America | 54 | 1.9% |
| Colombia | 21 | 0.7% |
| Latin America | 84 | 2.9% |
| Mexico | 54 | 1.9% |
| South America | 30 | 1.0% |
| South Eastern Asia | 2 | 0.1% |
| Thailand | 2 | 0.1% |
| Uruguay | 9 | 0.3% | View All 10 Rows |
Sex and Age in Grottoes
Sex and Age in Grottoes
The most populous age groups in Grottoes are 20 to 24 Years (155 | 11.7%) for men and 45 to 49 Years (169 | 10.7%) for women.
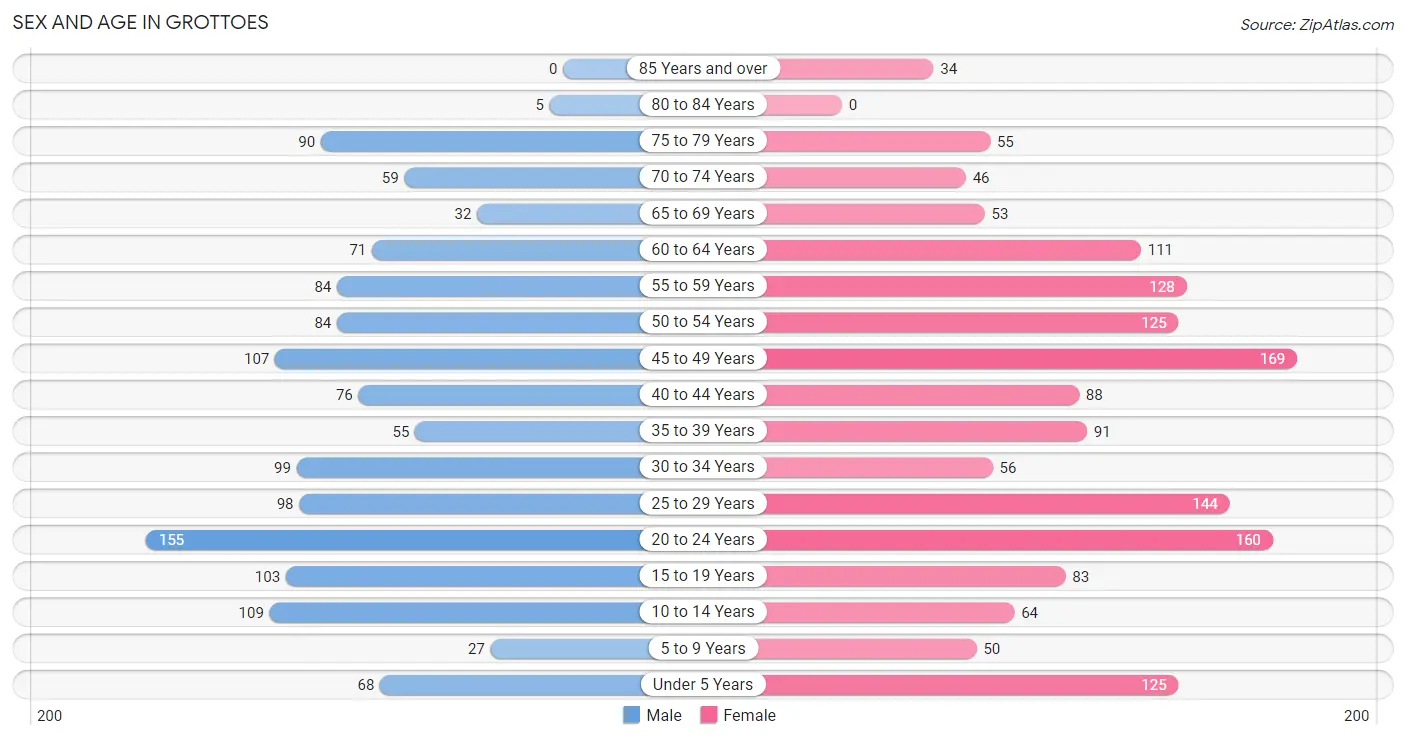
| Age Bracket | Male | Female |
| Under 5 Years | 68 (5.1%) | 125 (7.9%) |
| 5 to 9 Years | 27 (2.0%) | 50 (3.2%) |
| 10 to 14 Years | 109 (8.3%) | 64 (4.1%) |
| 15 to 19 Years | 103 (7.8%) | 83 (5.2%) |
| 20 to 24 Years | 155 (11.7%) | 160 (10.1%) |
| 25 to 29 Years | 98 (7.4%) | 144 (9.1%) |
| 30 to 34 Years | 99 (7.5%) | 56 (3.5%) |
| 35 to 39 Years | 55 (4.2%) | 91 (5.8%) |
| 40 to 44 Years | 76 (5.8%) | 88 (5.6%) |
| 45 to 49 Years | 107 (8.1%) | 169 (10.7%) |
| 50 to 54 Years | 84 (6.4%) | 125 (7.9%) |
| 55 to 59 Years | 84 (6.4%) | 128 (8.1%) |
| 60 to 64 Years | 71 (5.4%) | 111 (7.0%) |
| 65 to 69 Years | 32 (2.4%) | 53 (3.4%) |
| 70 to 74 Years | 59 (4.5%) | 46 (2.9%) |
| 75 to 79 Years | 90 (6.8%) | 55 (3.5%) |
| 80 to 84 Years | 5 (0.4%) | 0 (0.0%) |
| 85 Years and over | 0 (0.0%) | 34 (2.1%) |
| Total | 1,322 (100.0%) | 1,582 (100.0%) |
Families and Households in Grottoes
Median Family Size in Grottoes
The median family size in Grottoes is 2.93 persons per family, with single female/mother families (137 | 18.5%) accounting for the largest median family size of 3.16 persons per family. On the other hand, single male/father families (58 | 7.8%) represent the smallest median family size with 2.59 persons per family.
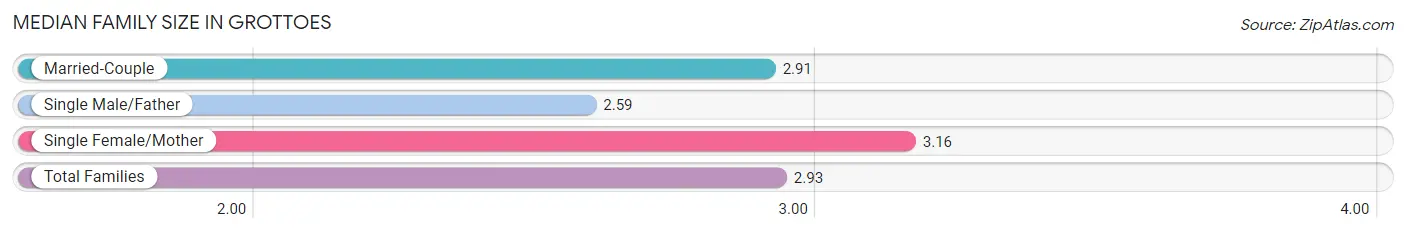
| Family Type | # Families | Family Size |
| Married-Couple | 545 (73.7%) | 2.91 |
| Single Male/Father | 58 (7.8%) | 2.59 |
| Single Female/Mother | 137 (18.5%) | 3.16 |
| Total Families | 740 (100.0%) | 2.93 |
Median Household Size in Grottoes
The median household size in Grottoes is 2.51 persons per household, with single female/mother households (137 | 11.8%) accounting for the largest median household size of 3.64 persons per household. non-family households (416 | 36.0%) represent the smallest median household size with 1.53 persons per household.
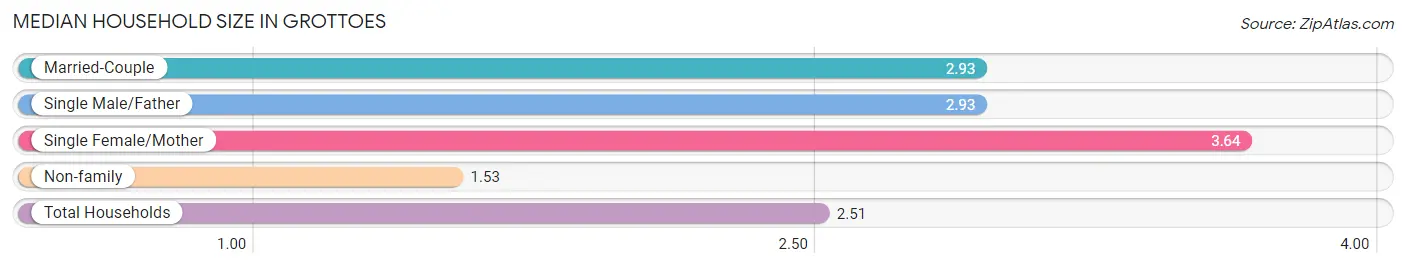
| Household Type | # Households | Household Size |
| Married-Couple | 545 (47.1%) | 2.93 |
| Single Male/Father | 58 (5.0%) | 2.93 |
| Single Female/Mother | 137 (11.8%) | 3.64 |
| Non-family | 416 (36.0%) | 1.53 |
| Total Households | 1,156 (100.0%) | 2.51 |
Household Size by Marriage Status in Grottoes
Out of a total of 1,156 households in Grottoes, 740 (64.0%) are family households, while 416 (36.0%) are nonfamily households. The most numerous type of family households are 2-person households, comprising 272, and the most common type of nonfamily households are 1-person households, comprising 279.
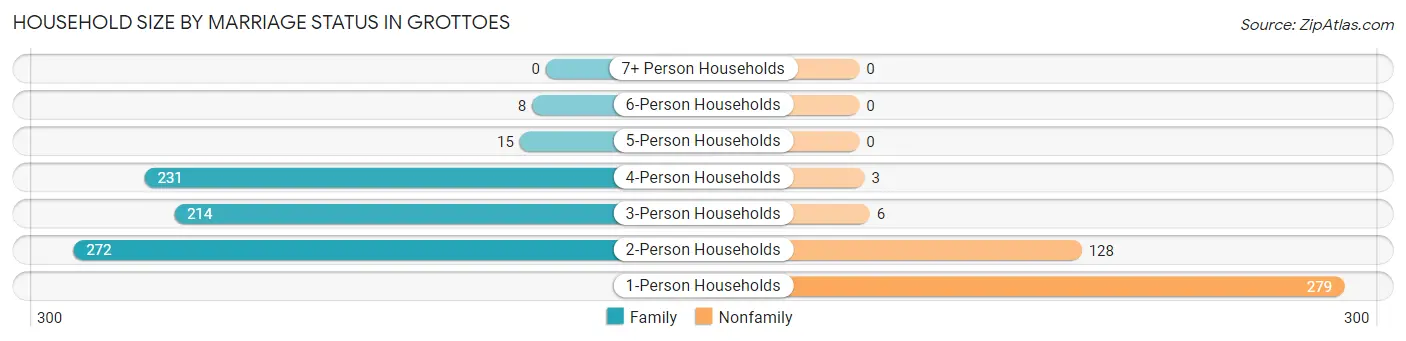
| Household Size | Family Households | Nonfamily Households |
| 1-Person Households | - | 279 (24.1%) |
| 2-Person Households | 272 (23.5%) | 128 (11.1%) |
| 3-Person Households | 214 (18.5%) | 6 (0.5%) |
| 4-Person Households | 231 (20.0%) | 3 (0.3%) |
| 5-Person Households | 15 (1.3%) | 0 (0.0%) |
| 6-Person Households | 8 (0.7%) | 0 (0.0%) |
| 7+ Person Households | 0 (0.0%) | 0 (0.0%) |
| Total | 740 (64.0%) | 416 (36.0%) |
Female Fertility in Grottoes
Fertility by Age in Grottoes
Average fertility rate in Grottoes is 67.0 births per 1,000 women. Women in the age bracket of 20 to 34 years have the highest fertility rate with 136.0 births per 1,000 women. Women in the age bracket of 20 to 34 years acount for 87.5% of all women with births.
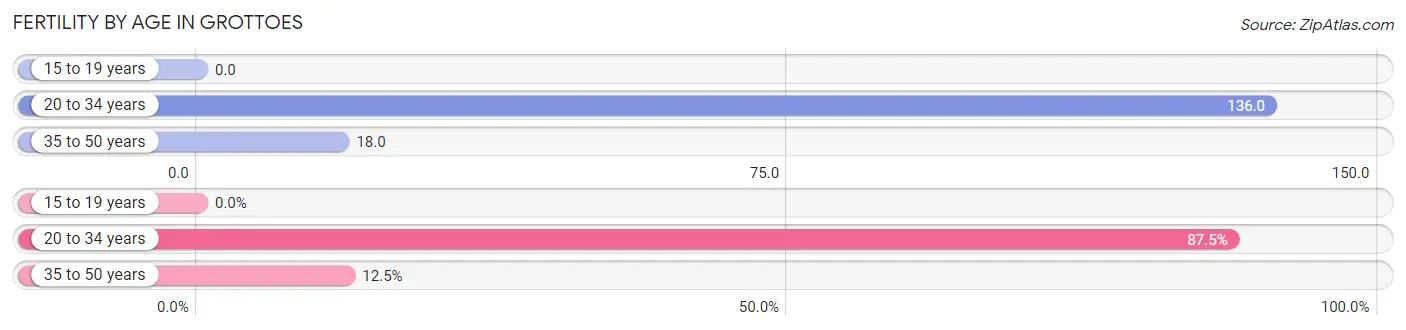
| Age Bracket | Women with Births | Births / 1,000 Women |
| 15 to 19 years | 0 (0.0%) | 0.0 |
| 20 to 34 years | 49 (87.5%) | 136.0 |
| 35 to 50 years | 7 (12.5%) | 18.0 |
| Total | 56 (100.0%) | 67.0 |
Fertility by Age by Marriage Status in Grottoes
41.1% of women with births (56) in Grottoes are married. The highest percentage of unmarried women with births falls into 35 to 50 years age bracket with 100.0% of them unmarried at the time of birth, while the lowest percentage of unmarried women with births belong to 20 to 34 years age bracket with 53.1% of them unmarried.
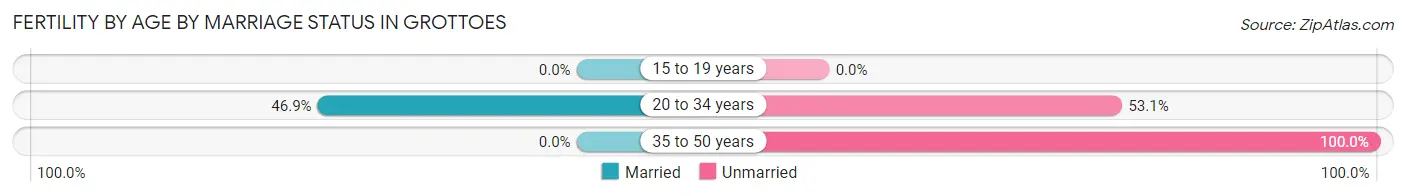
| Age Bracket | Married | Unmarried |
| 15 to 19 years | 0 (0.0%) | 0 (0.0%) |
| 20 to 34 years | 23 (46.9%) | 26 (53.1%) |
| 35 to 50 years | 0 (0.0%) | 7 (100.0%) |
| Total | 23 (41.1%) | 33 (58.9%) |
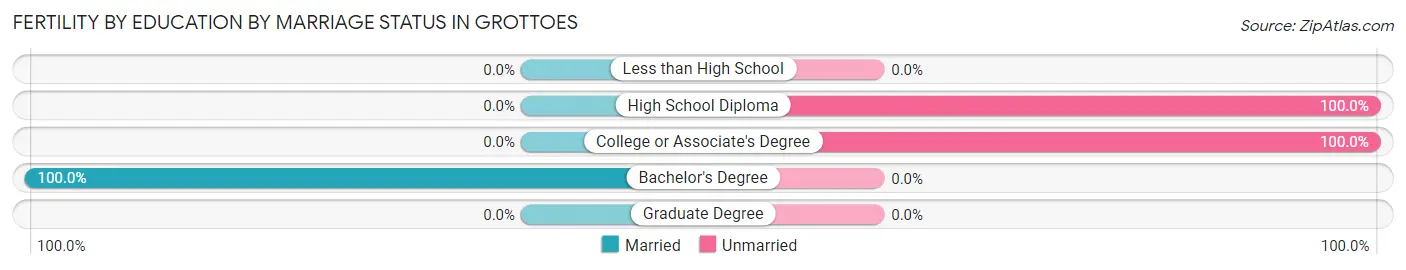
Fertility by Education in Grottoes
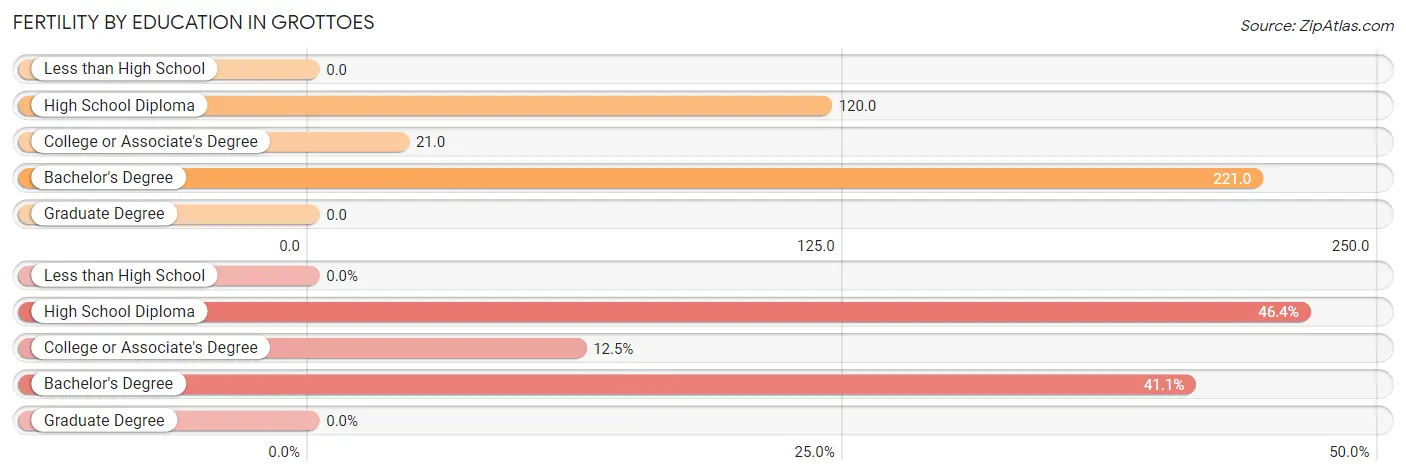
| Educational Attainment | Women with Births | Births / 1,000 Women |
| Less than High School | 0 (0.0%) | 0.0 |
| High School Diploma | 26 (46.4%) | 120.0 |
| College or Associate's Degree | 7 (12.5%) | 21.0 |
| Bachelor's Degree | 23 (41.1%) | 221.0 |
| Graduate Degree | 0 (0.0%) | 0.0 |
| Total | 56 (100.0%) | 67.0 |
Fertility by Education by Marriage Status in Grottoes
58.9% of women with births in Grottoes are unmarried. Women with the educational attainment of bachelor's degree are most likely to be married with 100.0% of them married at childbirth, while women with the educational attainment of high school diploma are least likely to be married with 100.0% of them unmarried at childbirth.
| Educational Attainment | Married | Unmarried |
| Less than High School | 0 (0.0%) | 0 (0.0%) |
| High School Diploma | 0 (0.0%) | 26 (100.0%) |
| College or Associate's Degree | 0 (0.0%) | 7 (100.0%) |
| Bachelor's Degree | 23 (100.0%) | 0 (0.0%) |
| Graduate Degree | 0 (0.0%) | 0 (0.0%) |
| Total | 23 (41.1%) | 33 (58.9%) |
Employment Characteristics in Grottoes
Employment by Class of Employer in Grottoes
Among the 1,679 employed individuals in Grottoes, private company employees (1,173 | 69.9%), local government employees (161 | 9.6%), and state government employees (144 | 8.6%) make up the most common classes of employment.
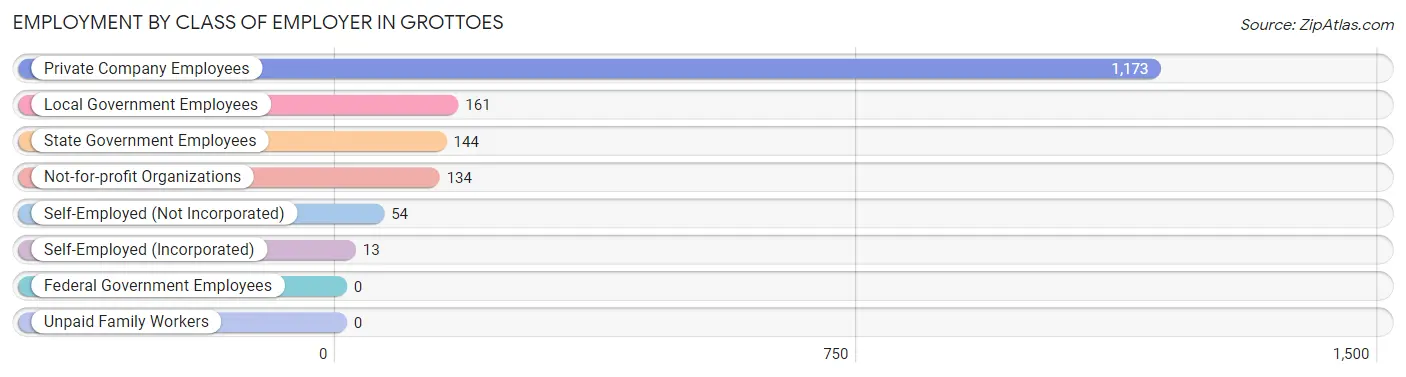
| Employer Class | # Employees | % Employees |
| Private Company Employees | 1,173 | 69.9% |
| Self-Employed (Incorporated) | 13 | 0.8% |
| Self-Employed (Not Incorporated) | 54 | 3.2% |
| Not-for-profit Organizations | 134 | 8.0% |
| Local Government Employees | 161 | 9.6% |
| State Government Employees | 144 | 8.6% |
| Federal Government Employees | 0 | 0.0% |
| Unpaid Family Workers | 0 | 0.0% |
| Total | 1,679 | 100.0% |
Employment Status by Age in Grottoes
According to the labor force statistics for Grottoes, out of the total population over 16 years of age (2,422), 75.5% or 1,829 individuals are in the labor force, with 4.0% or 73 of them unemployed. The age group with the highest labor force participation rate is 25 to 29 years, with 100.0% or 242 individuals in the labor force. Within the labor force, the 55 to 59 years age range has the highest percentage of unemployed individuals, with 25.0% or 46 of them being unemployed.
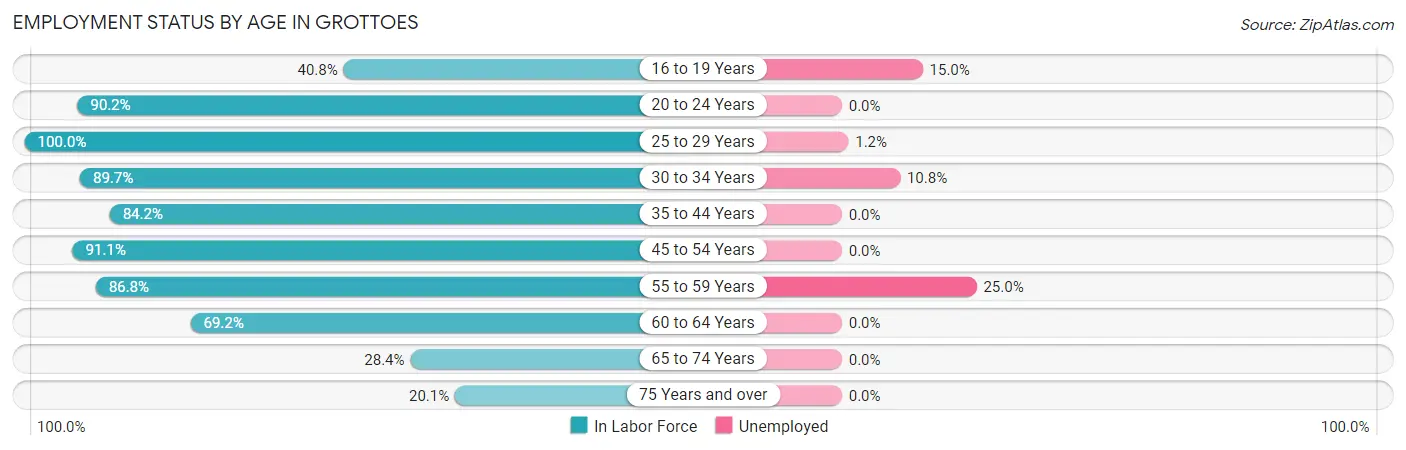
| Age Bracket | In Labor Force | Unemployed |
| 16 to 19 Years | 60 (40.8%) | 9 (15.0%) |
| 20 to 24 Years | 284 (90.2%) | 0 (0.0%) |
| 25 to 29 Years | 242 (100.0%) | 3 (1.2%) |
| 30 to 34 Years | 139 (89.7%) | 15 (10.8%) |
| 35 to 44 Years | 261 (84.2%) | 0 (0.0%) |
| 45 to 54 Years | 442 (91.1%) | 0 (0.0%) |
| 55 to 59 Years | 184 (86.8%) | 46 (25.0%) |
| 60 to 64 Years | 126 (69.2%) | 0 (0.0%) |
| 65 to 74 Years | 54 (28.4%) | 0 (0.0%) |
| 75 Years and over | 37 (20.1%) | 0 (0.0%) |
| Total | 1,829 (75.5%) | 73 (4.0%) |
Employment Status by Educational Attainment in Grottoes
According to labor force statistics for Grottoes, 87.9% of individuals (1,394) out of the total population between 25 and 64 years of age (1,586) are in the labor force, with 4.6% or 64 of them being unemployed. The group with the highest labor force participation rate are those with the educational attainment of bachelor's degree or higher, with 97.3% or 358 individuals in the labor force. Within the labor force, individuals with bachelor's degree or higher education have the highest percentage of unemployment, with 8.4% or 30 of them being unemployed.
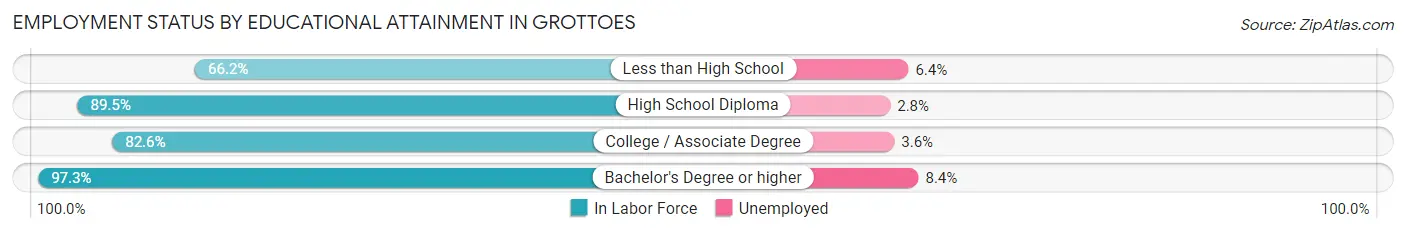
| Educational Attainment | In Labor Force | Unemployed |
| Less than High School | 47 (66.2%) | 5 (6.4%) |
| High School Diploma | 544 (89.5%) | 17 (2.8%) |
| College / Associate Degree | 445 (82.6%) | 19 (3.6%) |
| Bachelor's Degree or higher | 358 (97.3%) | 31 (8.4%) |
| Total | 1,394 (87.9%) | 73 (4.6%) |
Employment Occupations by Sex in Grottoes
Management, Business, Science and Arts Occupations
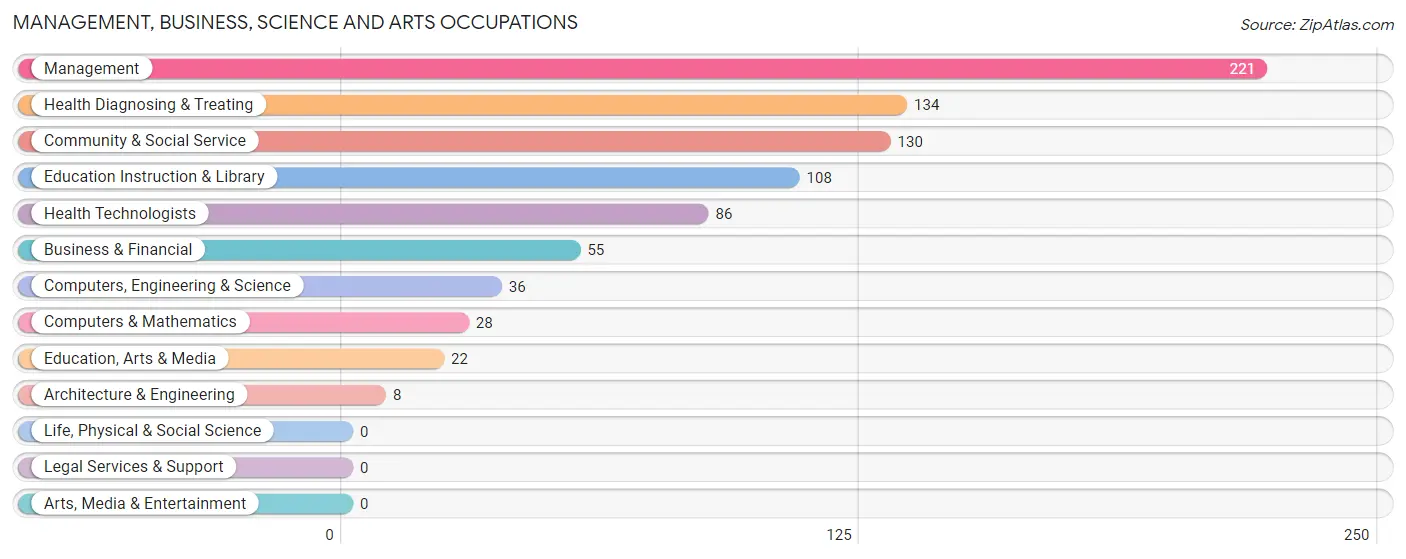
The most common Management, Business, Science and Arts occupations in Grottoes are Management (221 | 12.6%), Health Diagnosing & Treating (134 | 7.6%), Community & Social Service (130 | 7.4%), Education Instruction & Library (108 | 6.1%), and Health Technologists (86 | 4.9%).
Management, Business, Science and Arts Occupations by Sex
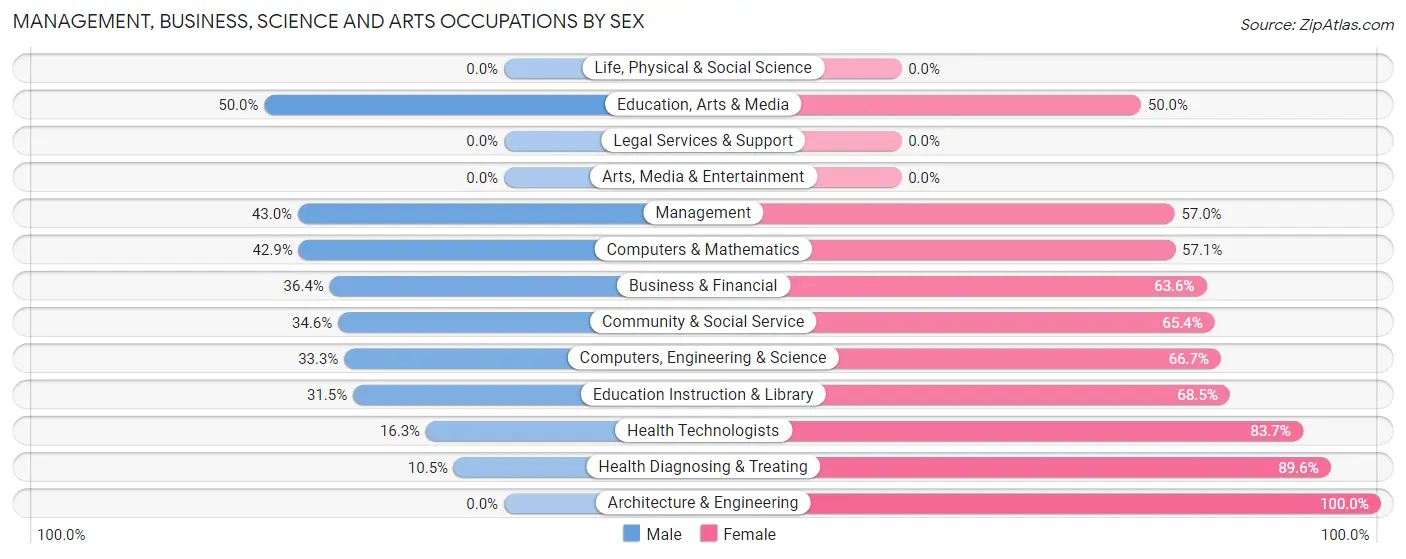
Within the Management, Business, Science and Arts occupations in Grottoes, the most male-oriented occupations are Education, Arts & Media (50.0%), Management (43.0%), and Computers & Mathematics (42.9%), while the most female-oriented occupations are Architecture & Engineering (100.0%), Health Diagnosing & Treating (89.5%), and Health Technologists (83.7%).
| Occupation | Male | Female |
| Management | 95 (43.0%) | 126 (57.0%) |
| Business & Financial | 20 (36.4%) | 35 (63.6%) |
| Computers, Engineering & Science | 12 (33.3%) | 24 (66.7%) |
| Computers & Mathematics | 12 (42.9%) | 16 (57.1%) |
| Architecture & Engineering | 0 (0.0%) | 8 (100.0%) |
| Life, Physical & Social Science | 0 (0.0%) | 0 (0.0%) |
| Community & Social Service | 45 (34.6%) | 85 (65.4%) |
| Education, Arts & Media | 11 (50.0%) | 11 (50.0%) |
| Legal Services & Support | 0 (0.0%) | 0 (0.0%) |
| Education Instruction & Library | 34 (31.5%) | 74 (68.5%) |
| Arts, Media & Entertainment | 0 (0.0%) | 0 (0.0%) |
| Health Diagnosing & Treating | 14 (10.4%) | 120 (89.5%) |
| Health Technologists | 14 (16.3%) | 72 (83.7%) |
| Total (Category) | 186 (32.3%) | 390 (67.7%) |
| Total (Overall) | 832 (47.4%) | 924 (52.6%) |
Services Occupations
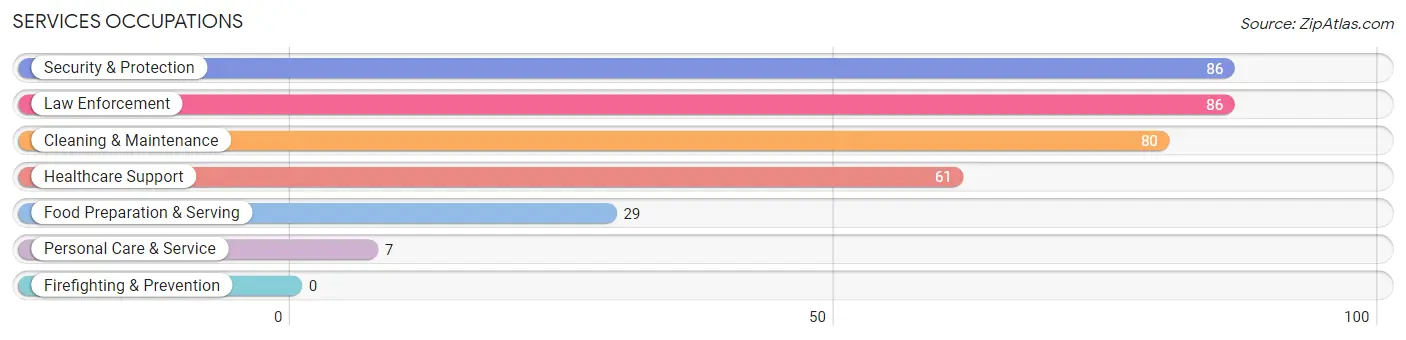
The most common Services occupations in Grottoes are Security & Protection (86 | 4.9%), Law Enforcement (86 | 4.9%), Cleaning & Maintenance (80 | 4.6%), Healthcare Support (61 | 3.5%), and Food Preparation & Serving (29 | 1.7%).
Services Occupations by Sex
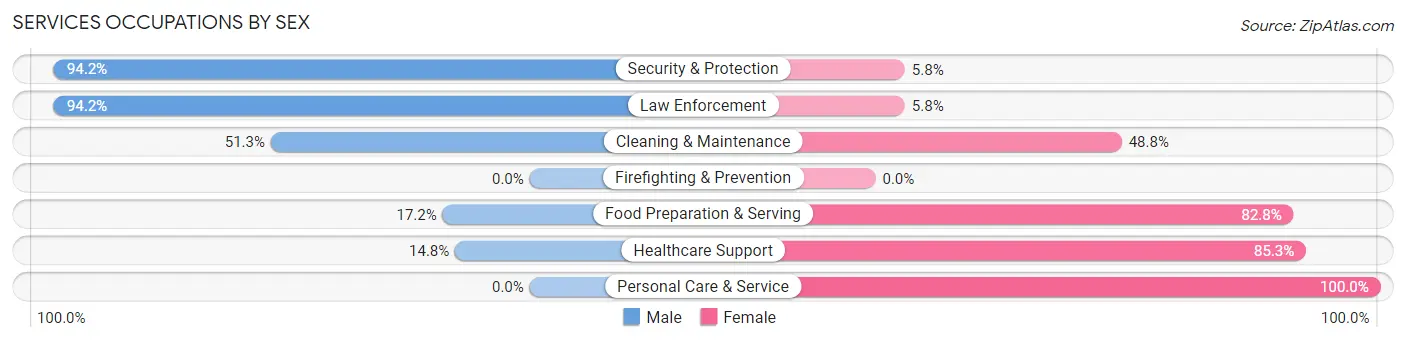
Within the Services occupations in Grottoes, the most male-oriented occupations are Security & Protection (94.2%), Law Enforcement (94.2%), and Cleaning & Maintenance (51.2%), while the most female-oriented occupations are Personal Care & Service (100.0%), Healthcare Support (85.3%), and Food Preparation & Serving (82.8%).
| Occupation | Male | Female |
| Healthcare Support | 9 (14.7%) | 52 (85.3%) |
| Security & Protection | 81 (94.2%) | 5 (5.8%) |
| Firefighting & Prevention | 0 (0.0%) | 0 (0.0%) |
| Law Enforcement | 81 (94.2%) | 5 (5.8%) |
| Food Preparation & Serving | 5 (17.2%) | 24 (82.8%) |
| Cleaning & Maintenance | 41 (51.2%) | 39 (48.7%) |
| Personal Care & Service | 0 (0.0%) | 7 (100.0%) |
| Total (Category) | 136 (51.7%) | 127 (48.3%) |
| Total (Overall) | 832 (47.4%) | 924 (52.6%) |
Sales and Office Occupations
The most common Sales and Office occupations in Grottoes are Sales & Related (209 | 11.9%), and Office & Administration (198 | 11.3%).
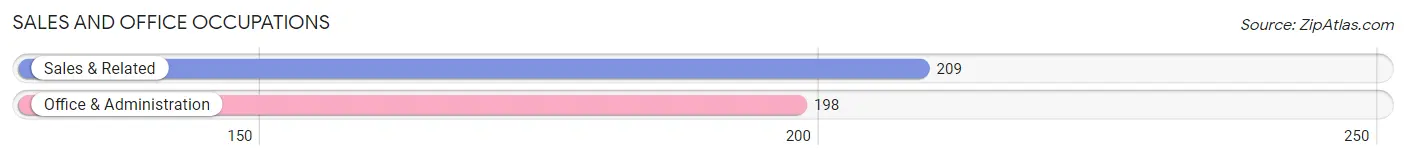
Sales and Office Occupations by Sex
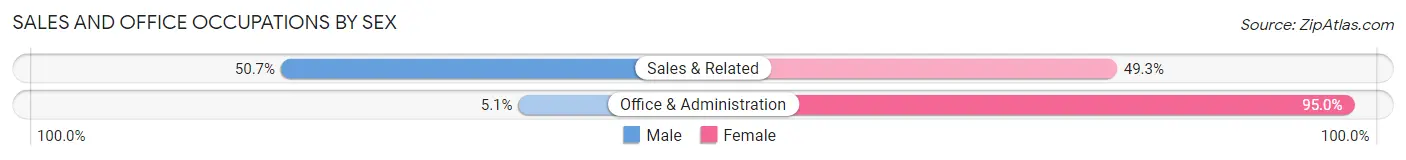
| Occupation | Male | Female |
| Sales & Related | 106 (50.7%) | 103 (49.3%) |
| Office & Administration | 10 (5.1%) | 188 (95.0%) |
| Total (Category) | 116 (28.5%) | 291 (71.5%) |
| Total (Overall) | 832 (47.4%) | 924 (52.6%) |
Natural Resources, Construction and Maintenance Occupations
The most common Natural Resources, Construction and Maintenance occupations in Grottoes are Construction & Extraction (122 | 7.0%), and Installation, Maintenance & Repair (44 | 2.5%).
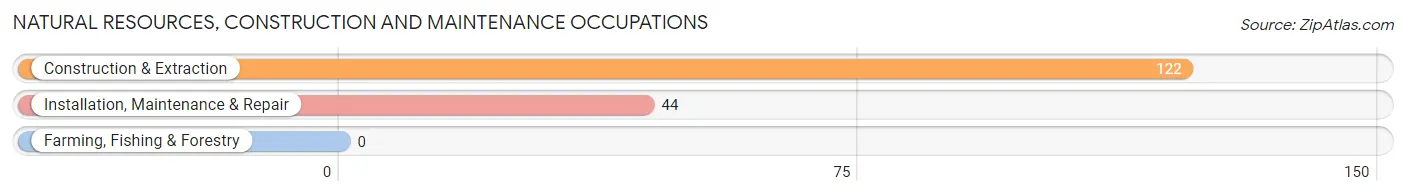
Natural Resources, Construction and Maintenance Occupations by Sex
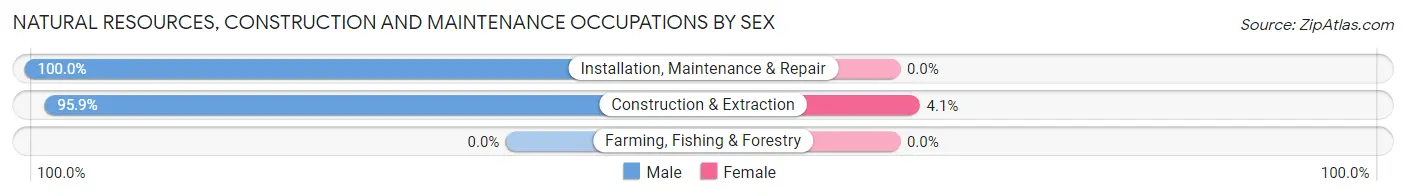
| Occupation | Male | Female |
| Farming, Fishing & Forestry | 0 (0.0%) | 0 (0.0%) |
| Construction & Extraction | 117 (95.9%) | 5 (4.1%) |
| Installation, Maintenance & Repair | 44 (100.0%) | 0 (0.0%) |
| Total (Category) | 161 (97.0%) | 5 (3.0%) |
| Total (Overall) | 832 (47.4%) | 924 (52.6%) |
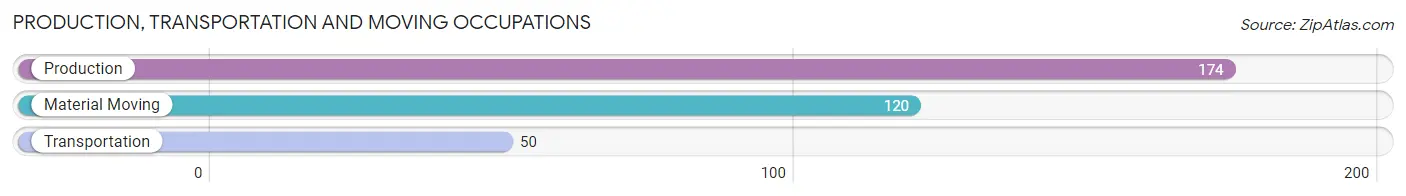
Production, Transportation and Moving Occupations
The most common Production, Transportation and Moving occupations in Grottoes are Production (174 | 9.9%), Material Moving (120 | 6.8%), and Transportation (50 | 2.9%).
Production, Transportation and Moving Occupations by Sex
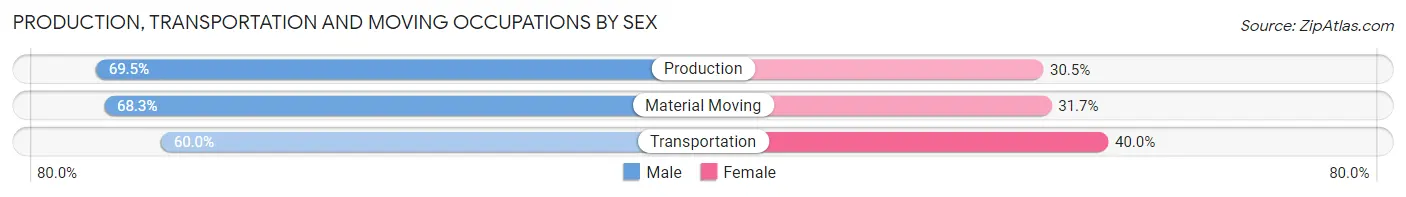
| Occupation | Male | Female |
| Production | 121 (69.5%) | 53 (30.5%) |
| Transportation | 30 (60.0%) | 20 (40.0%) |
| Material Moving | 82 (68.3%) | 38 (31.7%) |
| Total (Category) | 233 (67.7%) | 111 (32.3%) |
| Total (Overall) | 832 (47.4%) | 924 (52.6%) |
Employment Industries by Sex in Grottoes
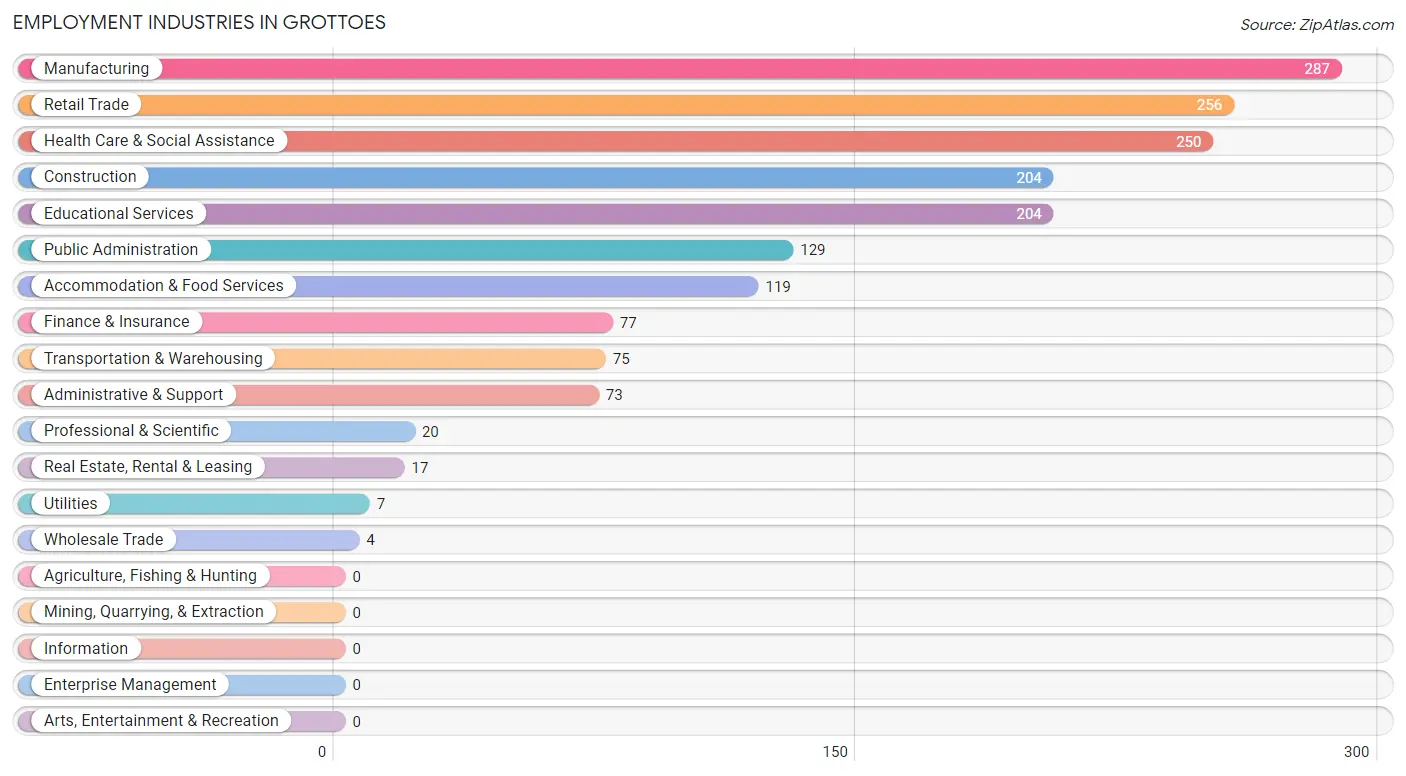
Employment Industries in Grottoes
The major employment industries in Grottoes include Manufacturing (287 | 16.3%), Retail Trade (256 | 14.6%), Health Care & Social Assistance (250 | 14.2%), Construction (204 | 11.6%), and Educational Services (204 | 11.6%).
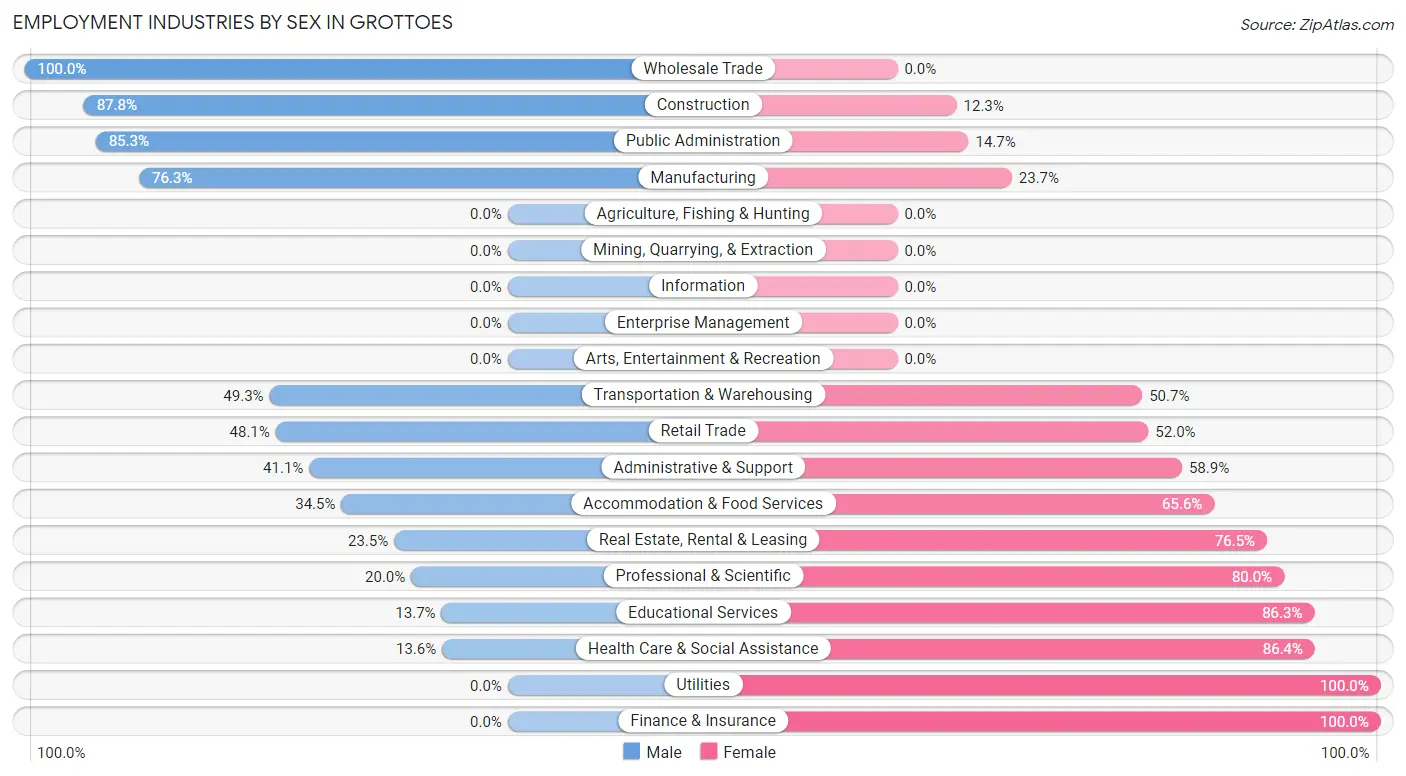
Employment Industries by Sex in Grottoes
The Grottoes industries that see more men than women are Wholesale Trade (100.0%), Construction (87.7%), and Public Administration (85.3%), whereas the industries that tend to have a higher number of women are Utilities (100.0%), Finance & Insurance (100.0%), and Health Care & Social Assistance (86.4%).
| Industry | Male | Female |
| Agriculture, Fishing & Hunting | 0 (0.0%) | 0 (0.0%) |
| Mining, Quarrying, & Extraction | 0 (0.0%) | 0 (0.0%) |
| Construction | 179 (87.7%) | 25 (12.2%) |
| Manufacturing | 219 (76.3%) | 68 (23.7%) |
| Wholesale Trade | 4 (100.0%) | 0 (0.0%) |
| Retail Trade | 123 (48.0%) | 133 (51.9%) |
| Transportation & Warehousing | 37 (49.3%) | 38 (50.7%) |
| Utilities | 0 (0.0%) | 7 (100.0%) |
| Information | 0 (0.0%) | 0 (0.0%) |
| Finance & Insurance | 0 (0.0%) | 77 (100.0%) |
| Real Estate, Rental & Leasing | 4 (23.5%) | 13 (76.5%) |
| Professional & Scientific | 4 (20.0%) | 16 (80.0%) |
| Enterprise Management | 0 (0.0%) | 0 (0.0%) |
| Administrative & Support | 30 (41.1%) | 43 (58.9%) |
| Educational Services | 28 (13.7%) | 176 (86.3%) |
| Health Care & Social Assistance | 34 (13.6%) | 216 (86.4%) |
| Arts, Entertainment & Recreation | 0 (0.0%) | 0 (0.0%) |
| Accommodation & Food Services | 41 (34.4%) | 78 (65.5%) |
| Public Administration | 110 (85.3%) | 19 (14.7%) |
| Total | 832 (47.4%) | 924 (52.6%) |
Education in Grottoes
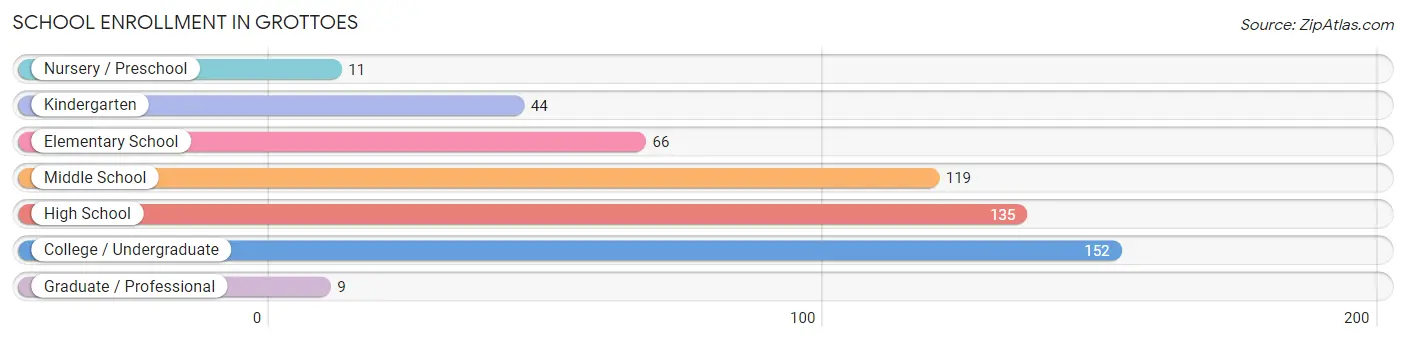
School Enrollment in Grottoes
The most common levels of schooling among the 536 students in Grottoes are college / undergraduate (152 | 28.4%), high school (135 | 25.2%), and middle school (119 | 22.2%).
| School Level | # Students | % Students |
| Nursery / Preschool | 11 | 2.1% |
| Kindergarten | 44 | 8.2% |
| Elementary School | 66 | 12.3% |
| Middle School | 119 | 22.2% |
| High School | 135 | 25.2% |
| College / Undergraduate | 152 | 28.4% |
| Graduate / Professional | 9 | 1.7% |
| Total | 536 | 100.0% |
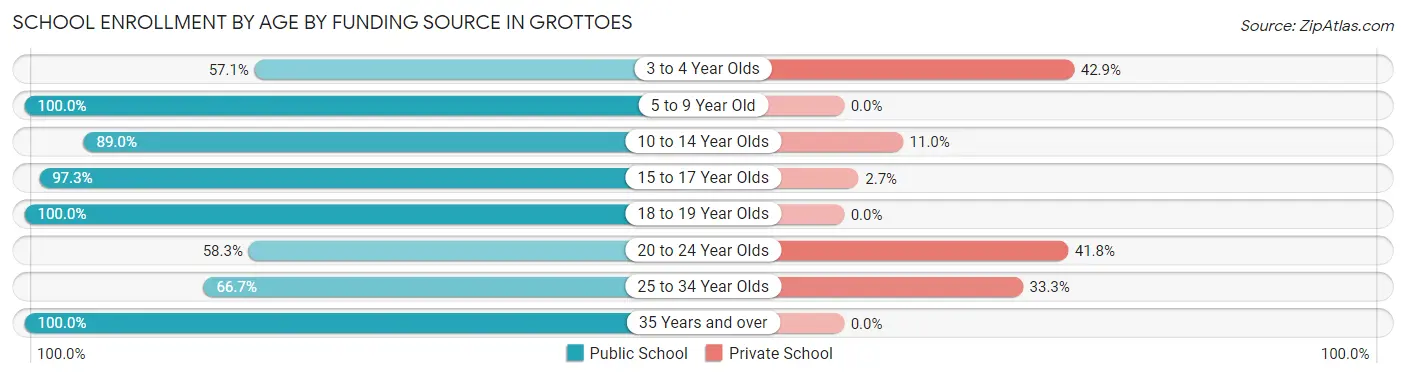
School Enrollment by Age by Funding Source in Grottoes
Out of a total of 536 students who are enrolled in schools in Grottoes, 77 (14.4%) attend a private institution, while the remaining 459 (85.6%) are enrolled in public schools. The age group of 3 to 4 year olds has the highest likelihood of being enrolled in private schools, with 3 (42.9% in the age bracket) enrolled. Conversely, the age group of 5 to 9 year old has the lowest likelihood of being enrolled in a private school, with 77 (100.0% in the age bracket) attending a public institution.
| Age Bracket | Public School | Private School |
| 3 to 4 Year Olds | 4 (57.1%) | 3 (42.9%) |
| 5 to 9 Year Old | 77 (100.0%) | 0 (0.0%) |
| 10 to 14 Year Olds | 154 (89.0%) | 19 (11.0%) |
| 15 to 17 Year Olds | 107 (97.3%) | 3 (2.7%) |
| 18 to 19 Year Olds | 26 (100.0%) | 0 (0.0%) |
| 20 to 24 Year Olds | 60 (58.3%) | 43 (41.7%) |
| 25 to 34 Year Olds | 18 (66.7%) | 9 (33.3%) |
| 35 Years and over | 13 (100.0%) | 0 (0.0%) |
| Total | 459 (85.6%) | 77 (14.4%) |
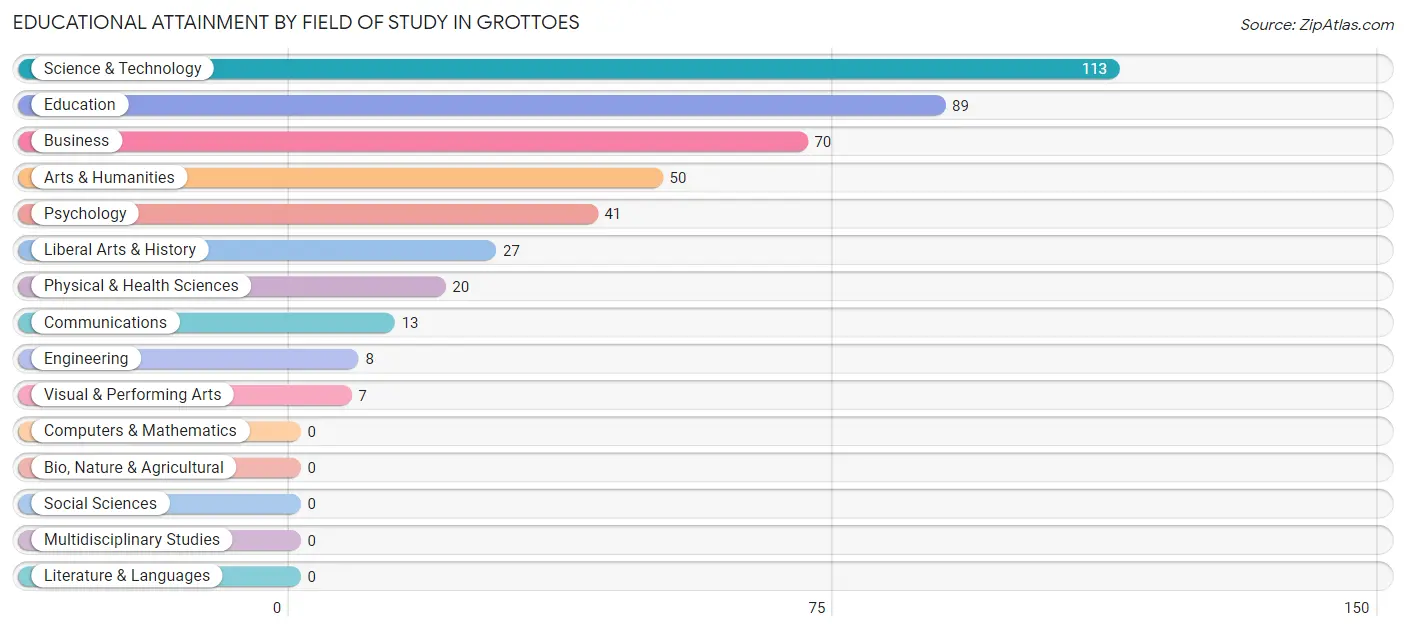
Educational Attainment by Field of Study in Grottoes
Science & technology (113 | 25.8%), education (89 | 20.3%), business (70 | 16.0%), arts & humanities (50 | 11.4%), and psychology (41 | 9.4%) are the most common fields of study among 438 individuals in Grottoes who have obtained a bachelor's degree or higher.
| Field of Study | # Graduates | % Graduates |
| Computers & Mathematics | 0 | 0.0% |
| Bio, Nature & Agricultural | 0 | 0.0% |
| Physical & Health Sciences | 20 | 4.6% |
| Psychology | 41 | 9.4% |
| Social Sciences | 0 | 0.0% |
| Engineering | 8 | 1.8% |
| Multidisciplinary Studies | 0 | 0.0% |
| Science & Technology | 113 | 25.8% |
| Business | 70 | 16.0% |
| Education | 89 | 20.3% |
| Literature & Languages | 0 | 0.0% |
| Liberal Arts & History | 27 | 6.2% |
| Visual & Performing Arts | 7 | 1.6% |
| Communications | 13 | 3.0% |
| Arts & Humanities | 50 | 11.4% |
| Total | 438 | 100.0% |
Transportation & Commute in Grottoes
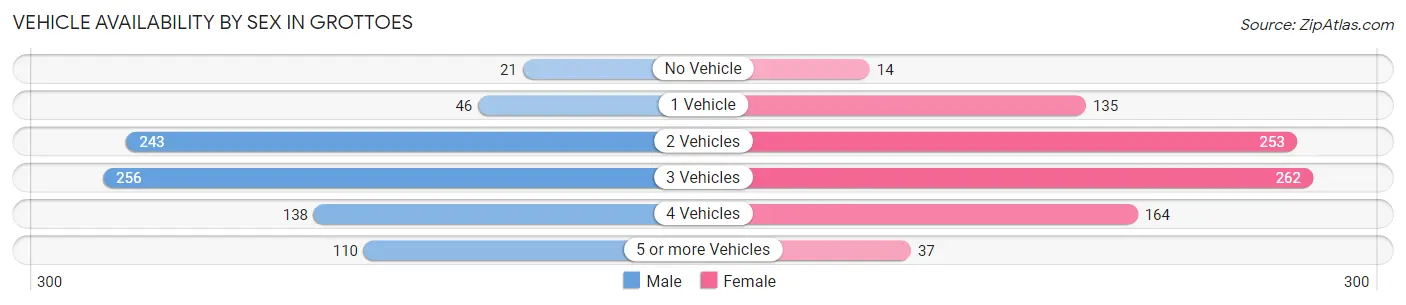
Vehicle Availability by Sex in Grottoes
The most prevalent vehicle ownership categories in Grottoes are males with 3 vehicles (256, accounting for 31.5%) and females with 3 vehicles (262, making up 29.6%).
| Vehicles Available | Male | Female |
| No Vehicle | 21 (2.6%) | 14 (1.6%) |
| 1 Vehicle | 46 (5.7%) | 135 (15.6%) |
| 2 Vehicles | 243 (29.8%) | 253 (29.2%) |
| 3 Vehicles | 256 (31.5%) | 262 (30.3%) |
| 4 Vehicles | 138 (17.0%) | 164 (19.0%) |
| 5 or more Vehicles | 110 (13.5%) | 37 (4.3%) |
| Total | 814 (100.0%) | 865 (100.0%) |
Commute Time in Grottoes
The most frequently occuring commute durations in Grottoes are 20 to 24 minutes (372 commuters, 23.2%), 30 to 34 minutes (348 commuters, 21.7%), and 25 to 29 minutes (259 commuters, 16.2%).
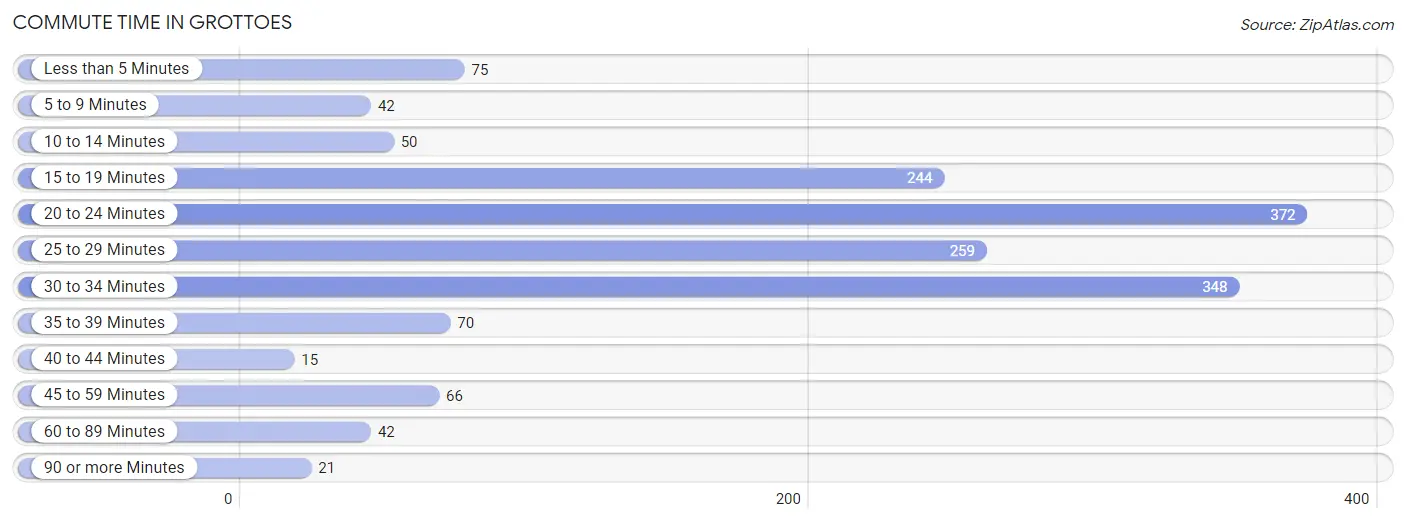
| Commute Time | # Commuters | % Commuters |
| Less than 5 Minutes | 75 | 4.7% |
| 5 to 9 Minutes | 42 | 2.6% |
| 10 to 14 Minutes | 50 | 3.1% |
| 15 to 19 Minutes | 244 | 15.2% |
| 20 to 24 Minutes | 372 | 23.2% |
| 25 to 29 Minutes | 259 | 16.2% |
| 30 to 34 Minutes | 348 | 21.7% |
| 35 to 39 Minutes | 70 | 4.4% |
| 40 to 44 Minutes | 15 | 0.9% |
| 45 to 59 Minutes | 66 | 4.1% |
| 60 to 89 Minutes | 42 | 2.6% |
| 90 or more Minutes | 21 | 1.3% |
Commute Time by Sex in Grottoes
The most common commute times in Grottoes are 20 to 24 minutes (161 commuters, 20.8%) for males and 20 to 24 minutes (211 commuters, 25.5%) for females.
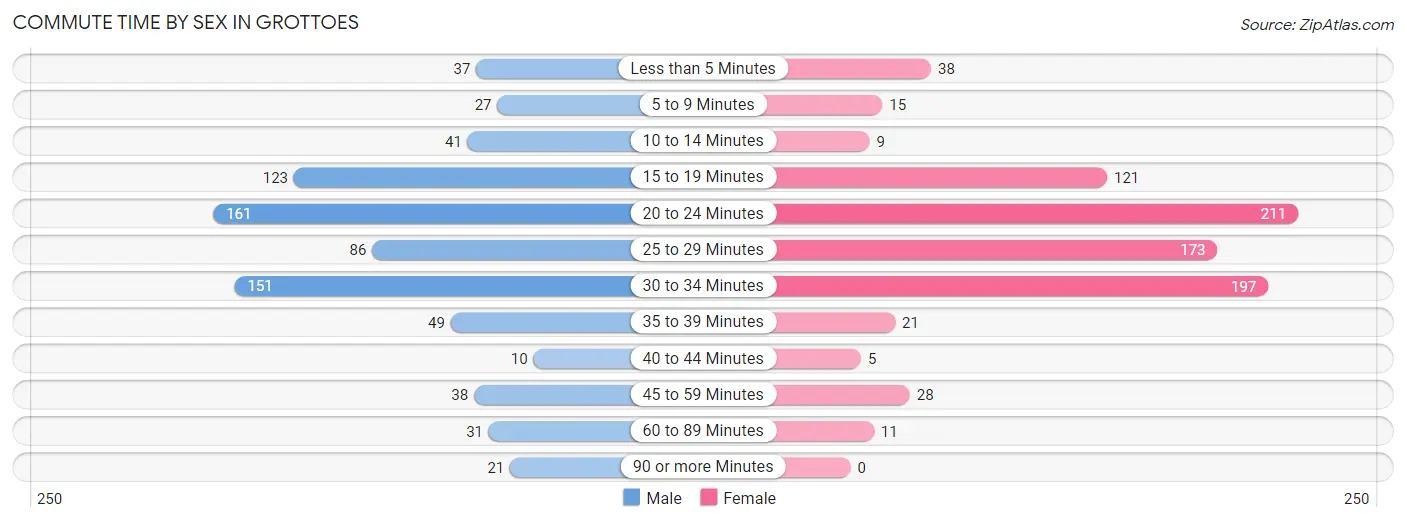
| Commute Time | Male | Female |
| Less than 5 Minutes | 37 (4.8%) | 38 (4.6%) |
| 5 to 9 Minutes | 27 (3.5%) | 15 (1.8%) |
| 10 to 14 Minutes | 41 (5.3%) | 9 (1.1%) |
| 15 to 19 Minutes | 123 (15.9%) | 121 (14.6%) |
| 20 to 24 Minutes | 161 (20.8%) | 211 (25.5%) |
| 25 to 29 Minutes | 86 (11.1%) | 173 (20.9%) |
| 30 to 34 Minutes | 151 (19.5%) | 197 (23.8%) |
| 35 to 39 Minutes | 49 (6.3%) | 21 (2.5%) |
| 40 to 44 Minutes | 10 (1.3%) | 5 (0.6%) |
| 45 to 59 Minutes | 38 (4.9%) | 28 (3.4%) |
| 60 to 89 Minutes | 31 (4.0%) | 11 (1.3%) |
| 90 or more Minutes | 21 (2.7%) | 0 (0.0%) |
Time of Departure to Work by Sex in Grottoes
The most frequent times of departure to work in Grottoes are 7:00 AM to 7:29 AM (124, 16.0%) for males and 7:00 AM to 7:29 AM (125, 15.1%) for females.
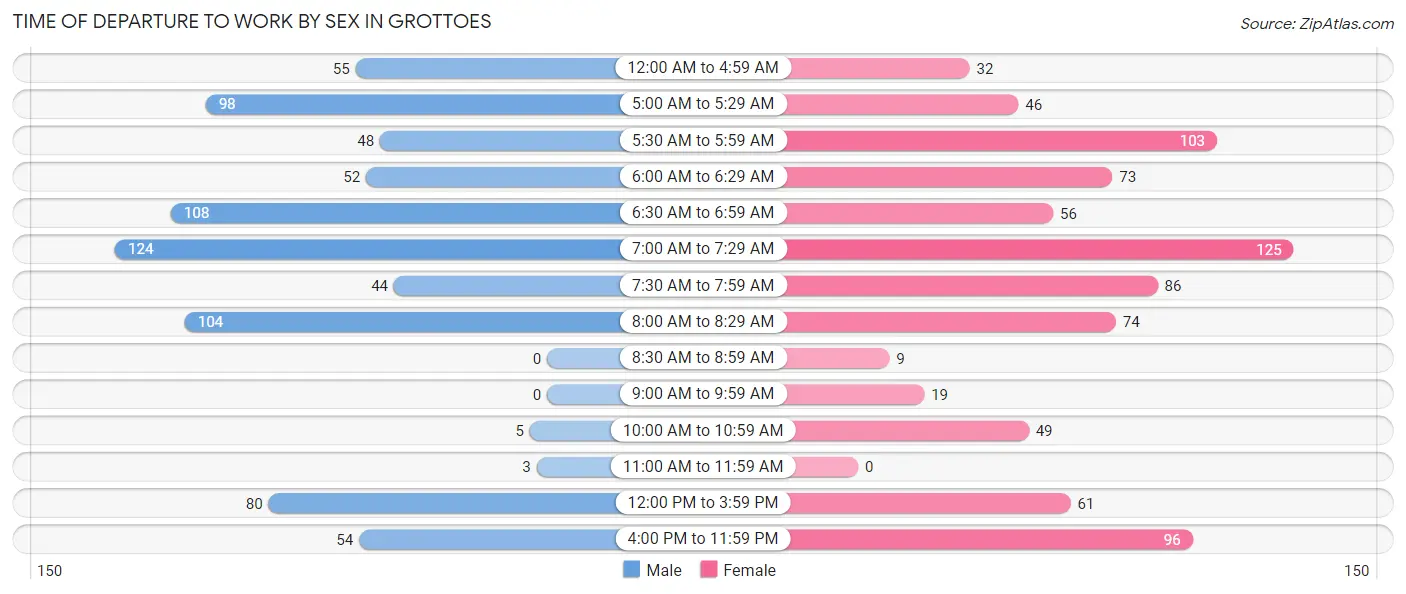
| Time of Departure | Male | Female |
| 12:00 AM to 4:59 AM | 55 (7.1%) | 32 (3.9%) |
| 5:00 AM to 5:29 AM | 98 (12.7%) | 46 (5.6%) |
| 5:30 AM to 5:59 AM | 48 (6.2%) | 103 (12.4%) |
| 6:00 AM to 6:29 AM | 52 (6.7%) | 73 (8.8%) |
| 6:30 AM to 6:59 AM | 108 (13.9%) | 56 (6.8%) |
| 7:00 AM to 7:29 AM | 124 (16.0%) | 125 (15.1%) |
| 7:30 AM to 7:59 AM | 44 (5.7%) | 86 (10.4%) |
| 8:00 AM to 8:29 AM | 104 (13.4%) | 74 (8.9%) |
| 8:30 AM to 8:59 AM | 0 (0.0%) | 9 (1.1%) |
| 9:00 AM to 9:59 AM | 0 (0.0%) | 19 (2.3%) |
| 10:00 AM to 10:59 AM | 5 (0.6%) | 49 (5.9%) |
| 11:00 AM to 11:59 AM | 3 (0.4%) | 0 (0.0%) |
| 12:00 PM to 3:59 PM | 80 (10.3%) | 61 (7.4%) |
| 4:00 PM to 11:59 PM | 54 (7.0%) | 96 (11.6%) |
| Total | 775 (100.0%) | 829 (100.0%) |
Housing Occupancy in Grottoes
Occupancy by Ownership in Grottoes
Of the total 1,156 dwellings in Grottoes, owner-occupied units account for 844 (73.0%), while renter-occupied units make up 312 (27.0%).
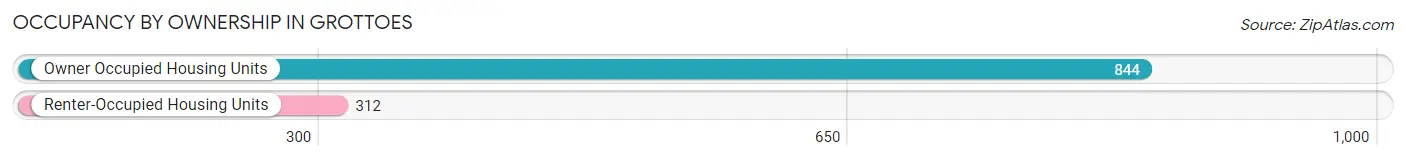
| Occupancy | # Housing Units | % Housing Units |
| Owner Occupied Housing Units | 844 | 73.0% |
| Renter-Occupied Housing Units | 312 | 27.0% |
| Total Occupied Housing Units | 1,156 | 100.0% |
Occupancy by Household Size in Grottoes
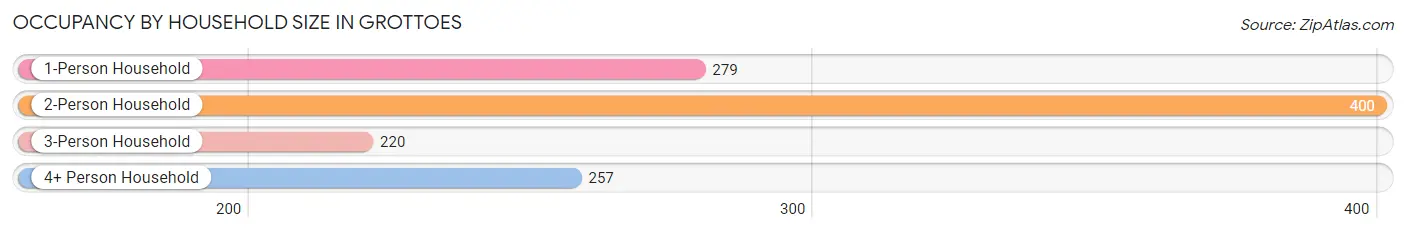
| Household Size | # Housing Units | % Housing Units |
| 1-Person Household | 279 | 24.1% |
| 2-Person Household | 400 | 34.6% |
| 3-Person Household | 220 | 19.0% |
| 4+ Person Household | 257 | 22.2% |
| Total Housing Units | 1,156 | 100.0% |
Occupancy by Ownership by Household Size in Grottoes
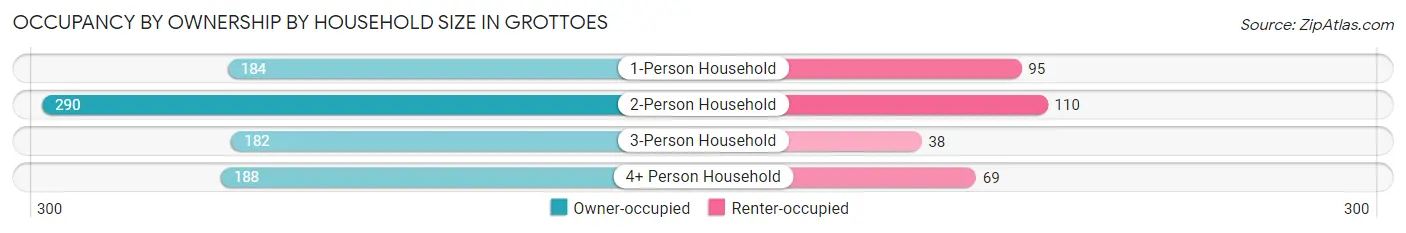
| Household Size | Owner-occupied | Renter-occupied |
| 1-Person Household | 184 (65.9%) | 95 (34.1%) |
| 2-Person Household | 290 (72.5%) | 110 (27.5%) |
| 3-Person Household | 182 (82.7%) | 38 (17.3%) |
| 4+ Person Household | 188 (73.2%) | 69 (26.9%) |
| Total Housing Units | 844 (73.0%) | 312 (27.0%) |
Occupancy by Educational Attainment in Grottoes
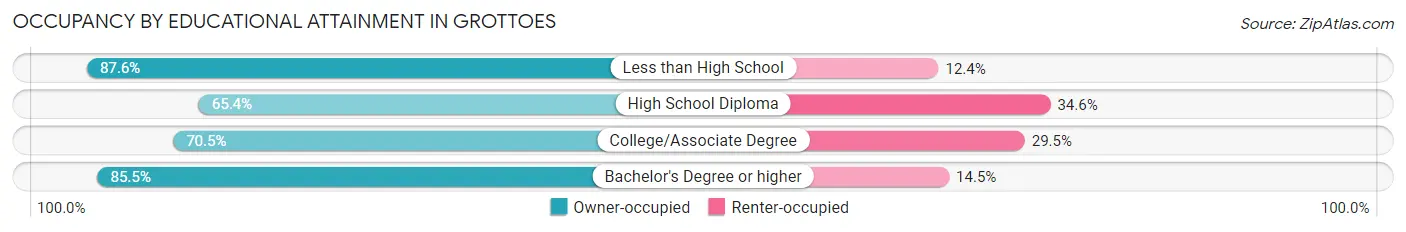
| Household Size | Owner-occupied | Renter-occupied |
| Less than High School | 85 (87.6%) | 12 (12.4%) |
| High School Diploma | 284 (65.4%) | 150 (34.6%) |
| College/Associate Degree | 280 (70.5%) | 117 (29.5%) |
| Bachelor's Degree or higher | 195 (85.5%) | 33 (14.5%) |
Occupancy by Age of Householder in Grottoes
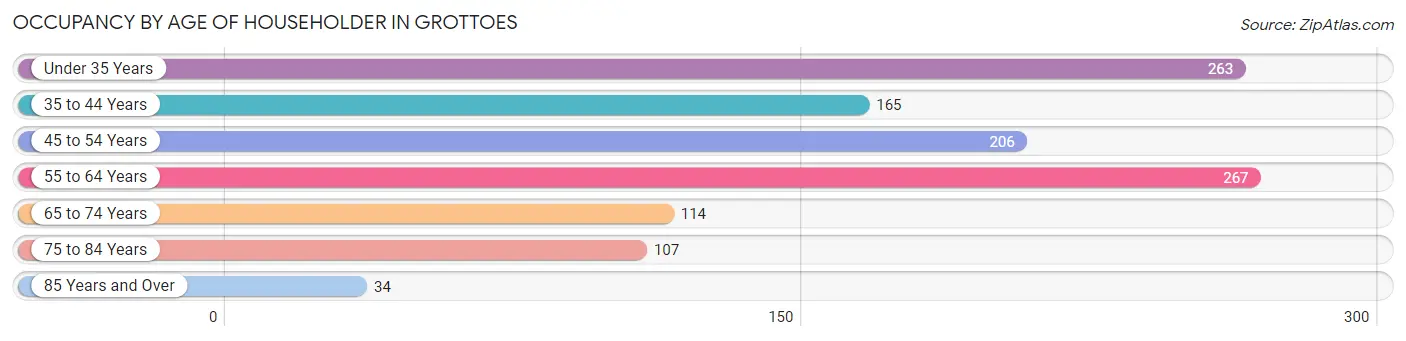
| Age Bracket | # Households | % Households |
| Under 35 Years | 263 | 22.8% |
| 35 to 44 Years | 165 | 14.3% |
| 45 to 54 Years | 206 | 17.8% |
| 55 to 64 Years | 267 | 23.1% |
| 65 to 74 Years | 114 | 9.9% |
| 75 to 84 Years | 107 | 9.3% |
| 85 Years and Over | 34 | 2.9% |
| Total | 1,156 | 100.0% |
Housing Finances in Grottoes
Median Income by Occupancy in Grottoes
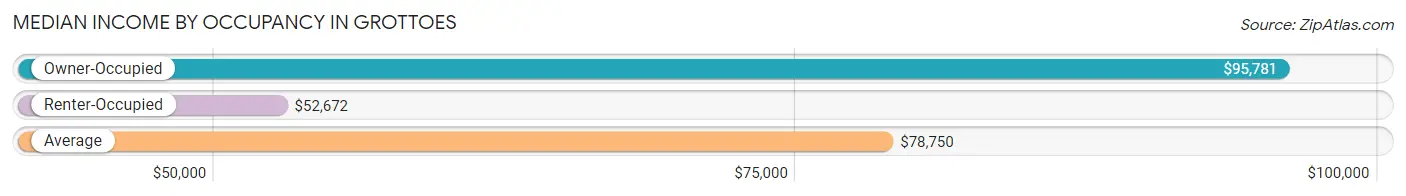
| Occupancy Type | # Households | Median Income |
| Owner-Occupied | 844 (73.0%) | $95,781 |
| Renter-Occupied | 312 (27.0%) | $52,672 |
| Average | 1,156 (100.0%) | $78,750 |
Occupancy by Householder Income Bracket in Grottoes
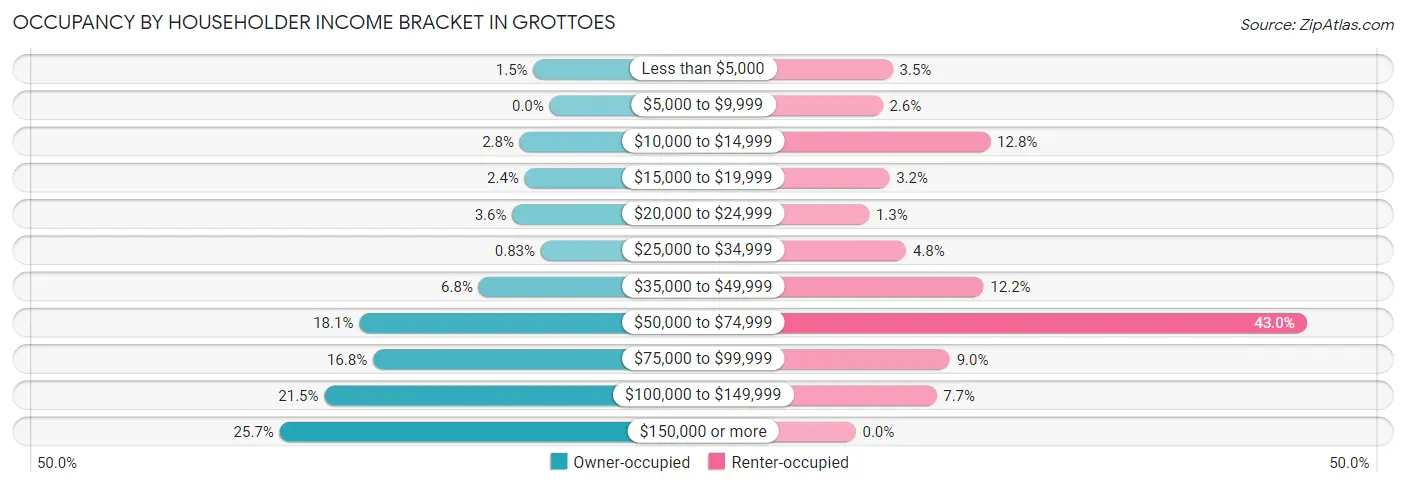
| Income Bracket | Owner-occupied | Renter-occupied |
| Less than $5,000 | 13 (1.5%) | 11 (3.5%) |
| $5,000 to $9,999 | 0 (0.0%) | 8 (2.6%) |
| $10,000 to $14,999 | 24 (2.8%) | 40 (12.8%) |
| $15,000 to $19,999 | 20 (2.4%) | 10 (3.2%) |
| $20,000 to $24,999 | 30 (3.5%) | 4 (1.3%) |
| $25,000 to $34,999 | 7 (0.8%) | 15 (4.8%) |
| $35,000 to $49,999 | 57 (6.8%) | 38 (12.2%) |
| $50,000 to $74,999 | 153 (18.1%) | 134 (42.9%) |
| $75,000 to $99,999 | 142 (16.8%) | 28 (9.0%) |
| $100,000 to $149,999 | 181 (21.4%) | 24 (7.7%) |
| $150,000 or more | 217 (25.7%) | 0 (0.0%) |
| Total | 844 (100.0%) | 312 (100.0%) |
Monthly Housing Cost Tiers in Grottoes
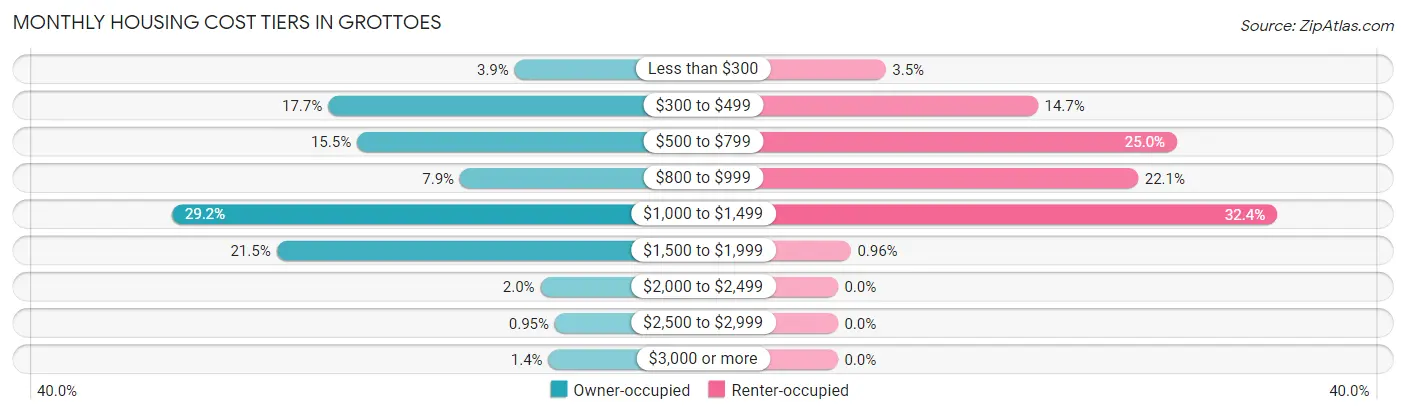
| Monthly Cost | Owner-occupied | Renter-occupied |
| Less than $300 | 33 (3.9%) | 11 (3.5%) |
| $300 to $499 | 149 (17.6%) | 46 (14.7%) |
| $500 to $799 | 131 (15.5%) | 78 (25.0%) |
| $800 to $999 | 67 (7.9%) | 69 (22.1%) |
| $1,000 to $1,499 | 246 (29.1%) | 101 (32.4%) |
| $1,500 to $1,999 | 181 (21.4%) | 3 (1.0%) |
| $2,000 to $2,499 | 17 (2.0%) | 0 (0.0%) |
| $2,500 to $2,999 | 8 (0.9%) | 0 (0.0%) |
| $3,000 or more | 12 (1.4%) | 0 (0.0%) |
| Total | 844 (100.0%) | 312 (100.0%) |
Physical Housing Characteristics in Grottoes
Housing Structures in Grottoes
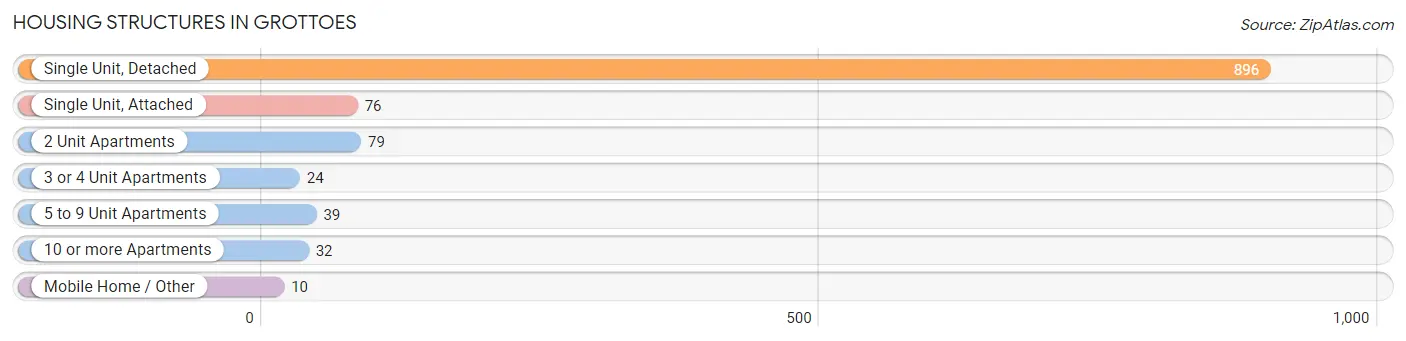
| Structure Type | # Housing Units | % Housing Units |
| Single Unit, Detached | 896 | 77.5% |
| Single Unit, Attached | 76 | 6.6% |
| 2 Unit Apartments | 79 | 6.8% |
| 3 or 4 Unit Apartments | 24 | 2.1% |
| 5 to 9 Unit Apartments | 39 | 3.4% |
| 10 or more Apartments | 32 | 2.8% |
| Mobile Home / Other | 10 | 0.9% |
| Total | 1,156 | 100.0% |
Housing Structures by Occupancy in Grottoes
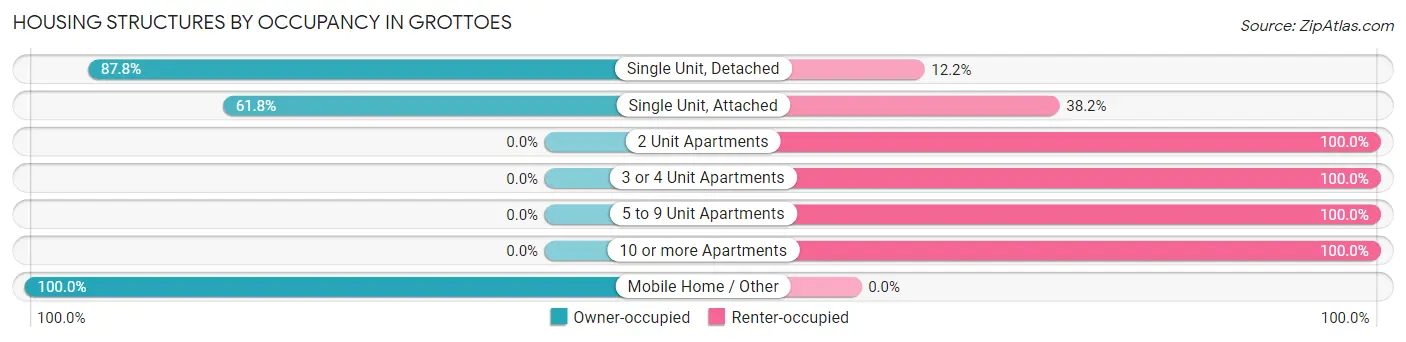
| Structure Type | Owner-occupied | Renter-occupied |
| Single Unit, Detached | 787 (87.8%) | 109 (12.2%) |
| Single Unit, Attached | 47 (61.8%) | 29 (38.2%) |
| 2 Unit Apartments | 0 (0.0%) | 79 (100.0%) |
| 3 or 4 Unit Apartments | 0 (0.0%) | 24 (100.0%) |
| 5 to 9 Unit Apartments | 0 (0.0%) | 39 (100.0%) |
| 10 or more Apartments | 0 (0.0%) | 32 (100.0%) |
| Mobile Home / Other | 10 (100.0%) | 0 (0.0%) |
| Total | 844 (73.0%) | 312 (27.0%) |
Housing Structures by Number of Rooms in Grottoes
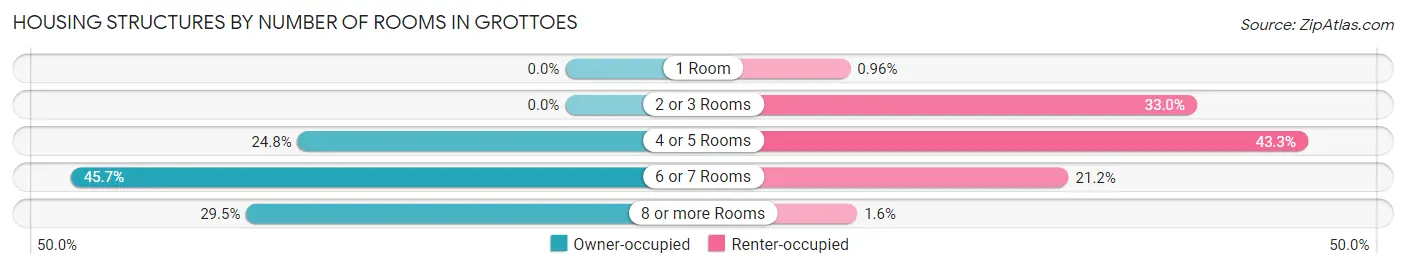
| Number of Rooms | Owner-occupied | Renter-occupied |
| 1 Room | 0 (0.0%) | 3 (1.0%) |
| 2 or 3 Rooms | 0 (0.0%) | 103 (33.0%) |
| 4 or 5 Rooms | 209 (24.8%) | 135 (43.3%) |
| 6 or 7 Rooms | 386 (45.7%) | 66 (21.1%) |
| 8 or more Rooms | 249 (29.5%) | 5 (1.6%) |
| Total | 844 (100.0%) | 312 (100.0%) |
Housing Structure by Heating Type in Grottoes
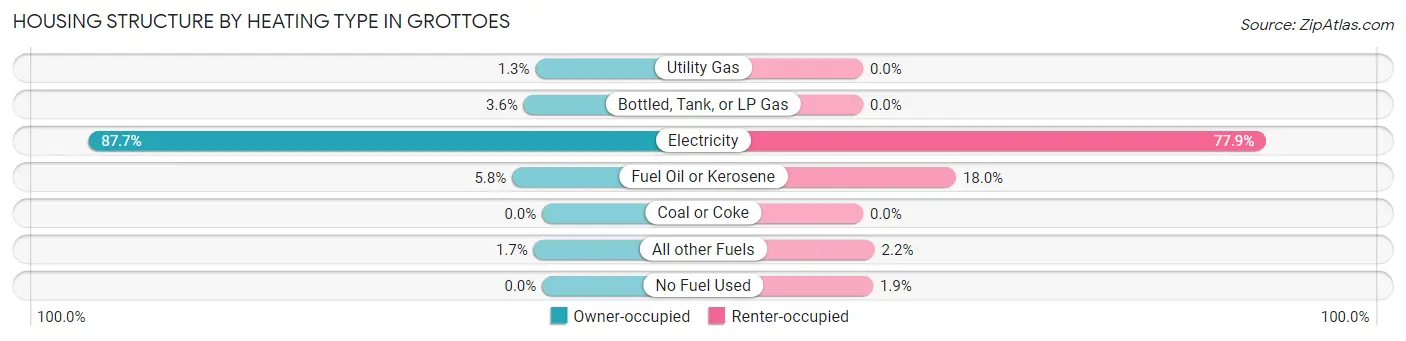
| Heating Type | Owner-occupied | Renter-occupied |
| Utility Gas | 11 (1.3%) | 0 (0.0%) |
| Bottled, Tank, or LP Gas | 30 (3.5%) | 0 (0.0%) |
| Electricity | 740 (87.7%) | 243 (77.9%) |
| Fuel Oil or Kerosene | 49 (5.8%) | 56 (17.9%) |
| Coal or Coke | 0 (0.0%) | 0 (0.0%) |
| All other Fuels | 14 (1.7%) | 7 (2.2%) |
| No Fuel Used | 0 (0.0%) | 6 (1.9%) |
| Total | 844 (100.0%) | 312 (100.0%) |
Household Vehicle Usage in Grottoes
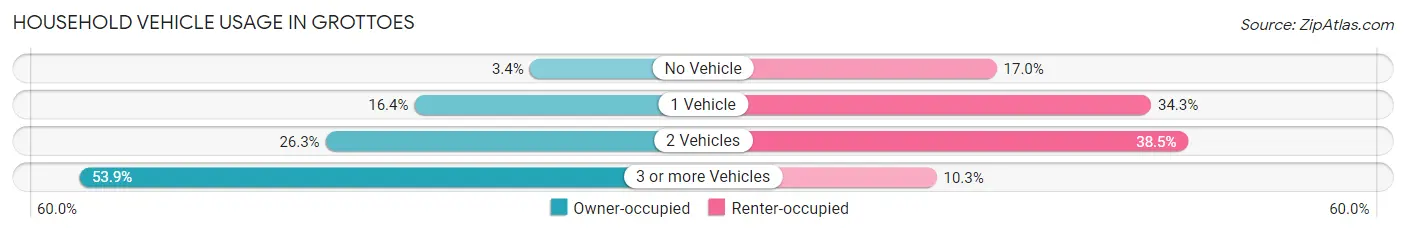
| Vehicles per Household | Owner-occupied | Renter-occupied |
| No Vehicle | 29 (3.4%) | 53 (17.0%) |
| 1 Vehicle | 138 (16.4%) | 107 (34.3%) |
| 2 Vehicles | 222 (26.3%) | 120 (38.5%) |
| 3 or more Vehicles | 455 (53.9%) | 32 (10.3%) |
| Total | 844 (100.0%) | 312 (100.0%) |
Real Estate & Mortgages in Grottoes
Real Estate and Mortgage Overview in Grottoes
| Characteristic | Without Mortgage | With Mortgage |
| Housing Units | 246 | 598 |
| Median Property Value | $250,000 | $233,900 |
| Median Household Income | $96,667 | $127 |
| Monthly Housing Costs | $451 | $12 |
| Real Estate Taxes | $1,723 | $18 |
Property Value by Mortgage Status in Grottoes
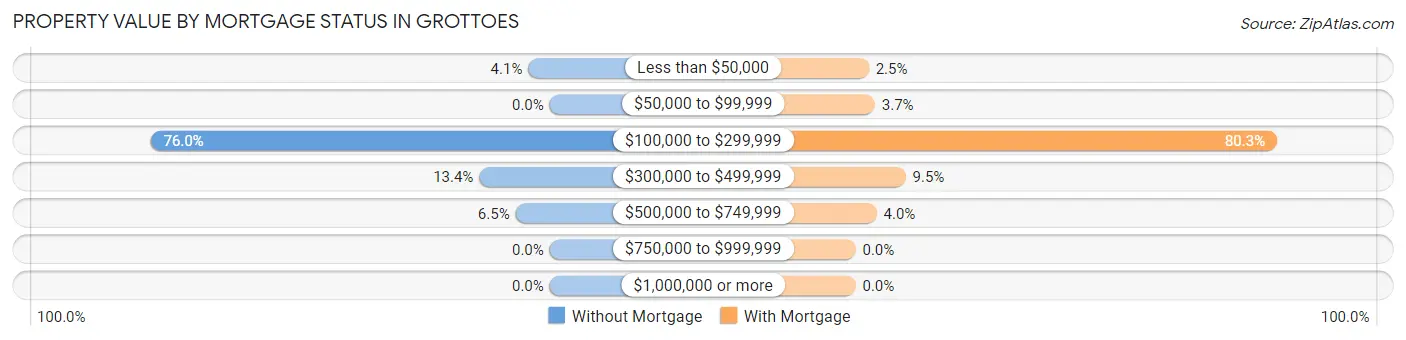
| Property Value | Without Mortgage | With Mortgage |
| Less than $50,000 | 10 (4.1%) | 15 (2.5%) |
| $50,000 to $99,999 | 0 (0.0%) | 22 (3.7%) |
| $100,000 to $299,999 | 187 (76.0%) | 480 (80.3%) |
| $300,000 to $499,999 | 33 (13.4%) | 57 (9.5%) |
| $500,000 to $749,999 | 16 (6.5%) | 24 (4.0%) |
| $750,000 to $999,999 | 0 (0.0%) | 0 (0.0%) |
| $1,000,000 or more | 0 (0.0%) | 0 (0.0%) |
| Total | 246 (100.0%) | 598 (100.0%) |
Household Income by Mortgage Status in Grottoes
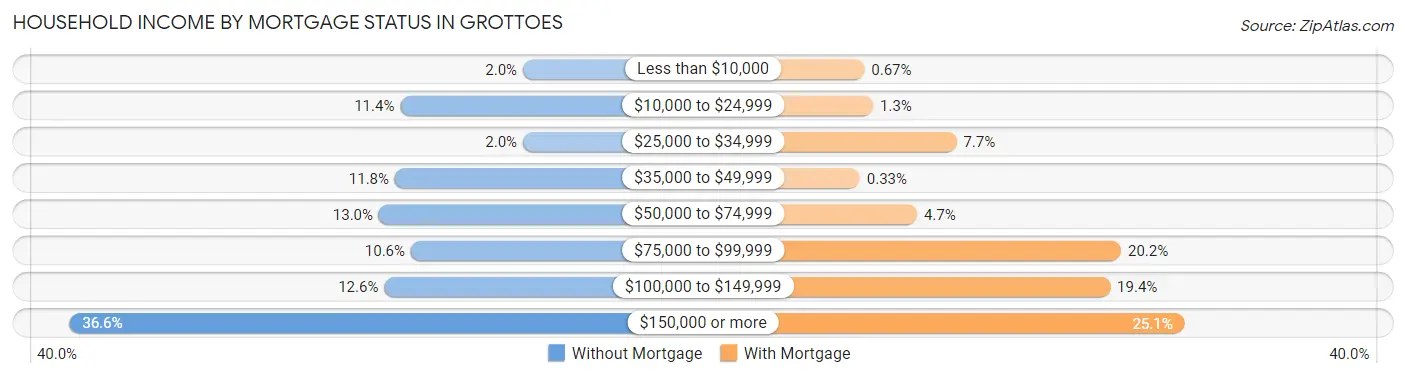
| Household Income | Without Mortgage | With Mortgage |
| Less than $10,000 | 5 (2.0%) | 4 (0.7%) |
| $10,000 to $24,999 | 28 (11.4%) | 8 (1.3%) |
| $25,000 to $34,999 | 5 (2.0%) | 46 (7.7%) |
| $35,000 to $49,999 | 29 (11.8%) | 2 (0.3%) |
| $50,000 to $74,999 | 32 (13.0%) | 28 (4.7%) |
| $75,000 to $99,999 | 26 (10.6%) | 121 (20.2%) |
| $100,000 to $149,999 | 31 (12.6%) | 116 (19.4%) |
| $150,000 or more | 90 (36.6%) | 150 (25.1%) |
| Total | 246 (100.0%) | 598 (100.0%) |
Property Value to Household Income Ratio in Grottoes
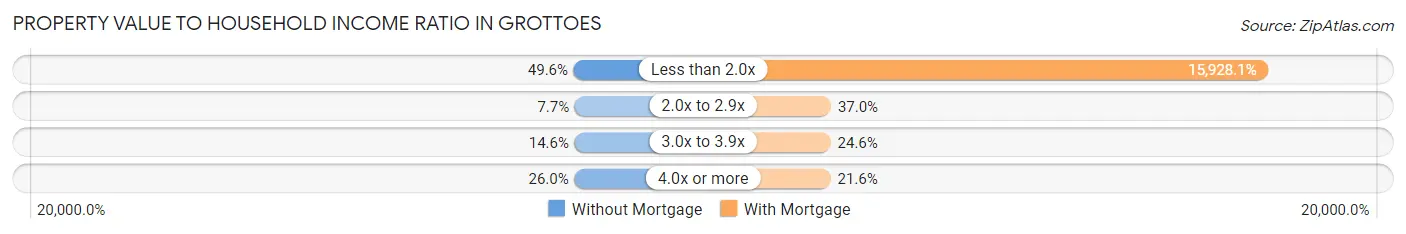
| Value-to-Income Ratio | Without Mortgage | With Mortgage |
| Less than 2.0x | 122 (49.6%) | 95,250 (15,928.1%) |
| 2.0x to 2.9x | 19 (7.7%) | 221 (37.0%) |
| 3.0x to 3.9x | 36 (14.6%) | 147 (24.6%) |
| 4.0x or more | 64 (26.0%) | 129 (21.6%) |
| Total | 246 (100.0%) | 598 (100.0%) |
Real Estate Taxes by Mortgage Status in Grottoes
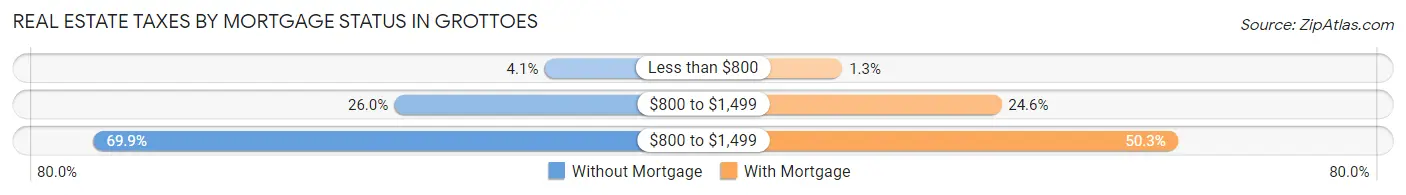
| Property Taxes | Without Mortgage | With Mortgage |
| Less than $800 | 10 (4.1%) | 8 (1.3%) |
| $800 to $1,499 | 64 (26.0%) | 147 (24.6%) |
| $800 to $1,499 | 172 (69.9%) | 301 (50.3%) |
| Total | 246 (100.0%) | 598 (100.0%) |
Health & Disability in Grottoes
Health Insurance Coverage by Age in Grottoes
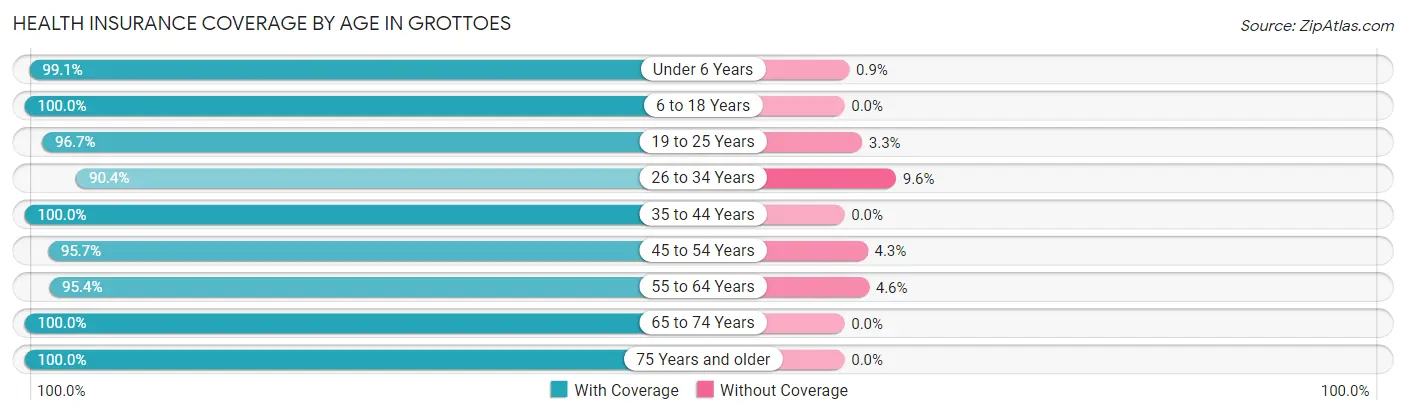
| Age Bracket | With Coverage | Without Coverage |
| Under 6 Years | 220 (99.1%) | 2 (0.9%) |
| 6 to 18 Years | 360 (100.0%) | 0 (0.0%) |
| 19 to 25 Years | 442 (96.7%) | 15 (3.3%) |
| 26 to 34 Years | 273 (90.4%) | 29 (9.6%) |
| 35 to 44 Years | 310 (100.0%) | 0 (0.0%) |
| 45 to 54 Years | 464 (95.7%) | 21 (4.3%) |
| 55 to 64 Years | 376 (95.4%) | 18 (4.6%) |
| 65 to 74 Years | 190 (100.0%) | 0 (0.0%) |
| 75 Years and older | 184 (100.0%) | 0 (0.0%) |
| Total | 2,819 (97.1%) | 85 (2.9%) |
Health Insurance Coverage by Citizenship Status in Grottoes
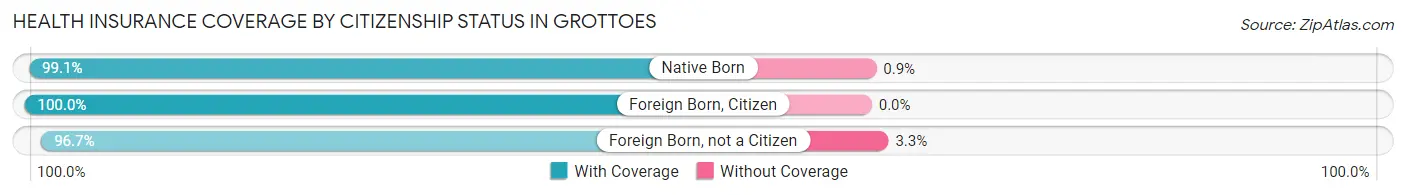
| Citizenship Status | With Coverage | Without Coverage |
| Native Born | 220 (99.1%) | 2 (0.9%) |
| Foreign Born, Citizen | 360 (100.0%) | 0 (0.0%) |
| Foreign Born, not a Citizen | 442 (96.7%) | 15 (3.3%) |
Health Insurance Coverage by Household Income in Grottoes
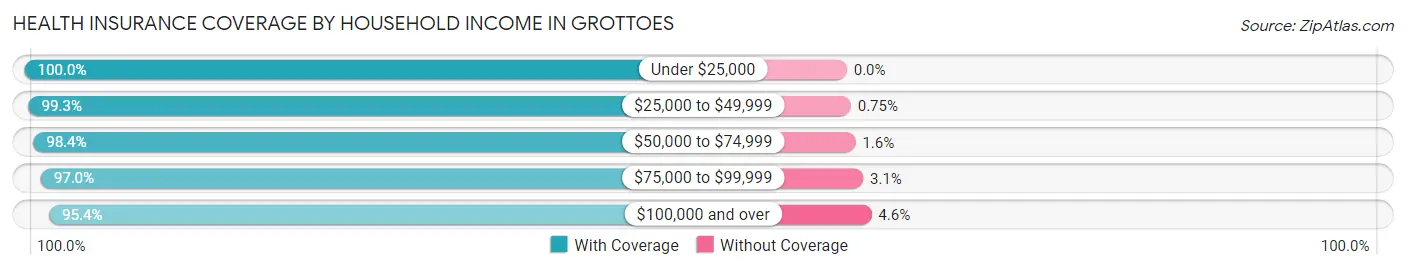
| Household Income | With Coverage | Without Coverage |
| Under $25,000 | 205 (100.0%) | 0 (0.0%) |
| $25,000 to $49,999 | 265 (99.3%) | 2 (0.7%) |
| $50,000 to $74,999 | 725 (98.4%) | 12 (1.6%) |
| $75,000 to $99,999 | 445 (97.0%) | 14 (3.0%) |
| $100,000 and over | 1,179 (95.4%) | 57 (4.6%) |
Public vs Private Health Insurance Coverage by Age in Grottoes
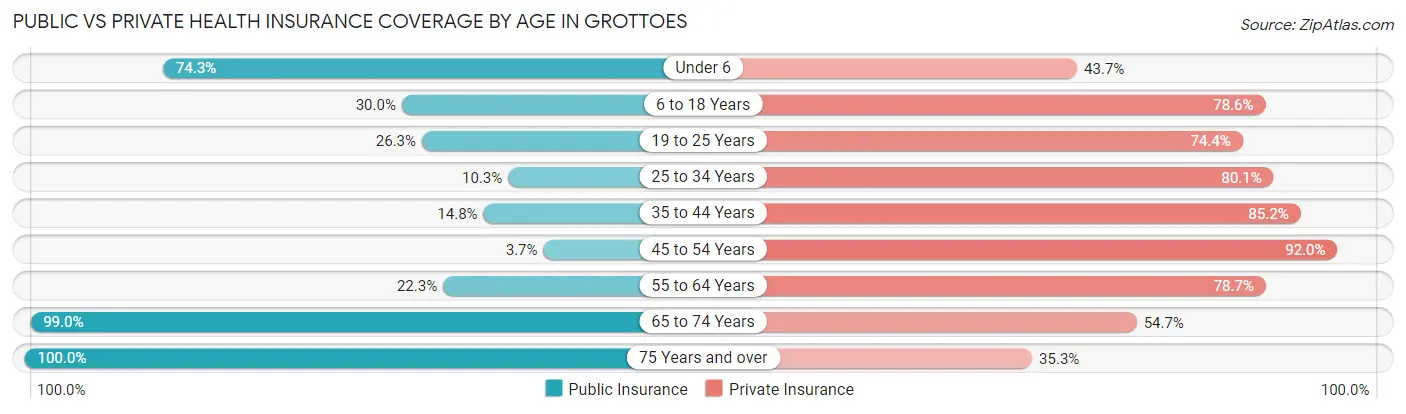
| Age Bracket | Public Insurance | Private Insurance |
| Under 6 | 165 (74.3%) | 97 (43.7%) |
| 6 to 18 Years | 108 (30.0%) | 283 (78.6%) |
| 19 to 25 Years | 120 (26.3%) | 340 (74.4%) |
| 25 to 34 Years | 31 (10.3%) | 242 (80.1%) |
| 35 to 44 Years | 46 (14.8%) | 264 (85.2%) |
| 45 to 54 Years | 18 (3.7%) | 446 (92.0%) |
| 55 to 64 Years | 88 (22.3%) | 310 (78.7%) |
| 65 to 74 Years | 188 (99.0%) | 104 (54.7%) |
| 75 Years and over | 184 (100.0%) | 65 (35.3%) |
| Total | 948 (32.6%) | 2,151 (74.1%) |
Disability Status by Sex by Age in Grottoes
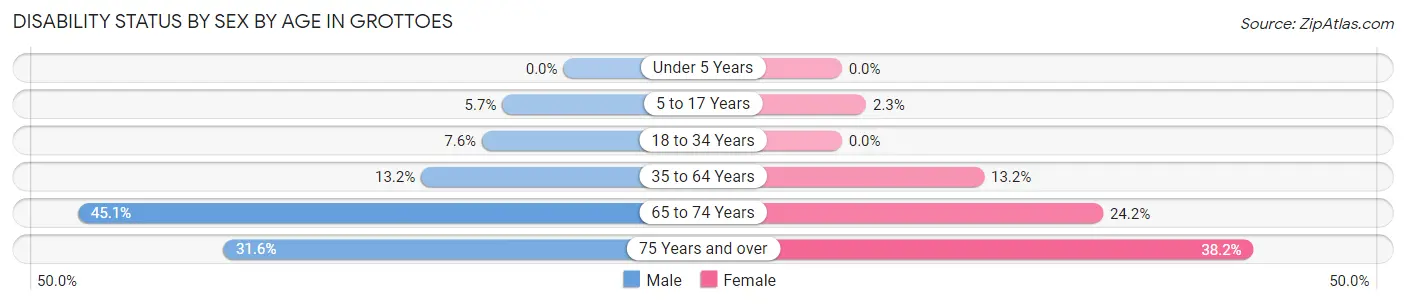
| Age Bracket | Male | Female |
| Under 5 Years | 0 (0.0%) | 0 (0.0%) |
| 5 to 17 Years | 11 (5.7%) | 4 (2.2%) |
| 18 to 34 Years | 30 (7.6%) | 0 (0.0%) |
| 35 to 64 Years | 63 (13.2%) | 94 (13.2%) |
| 65 to 74 Years | 41 (45.1%) | 24 (24.2%) |
| 75 Years and over | 30 (31.6%) | 34 (38.2%) |
Disability Class by Sex by Age in Grottoes
Disability Class: Hearing Difficulty
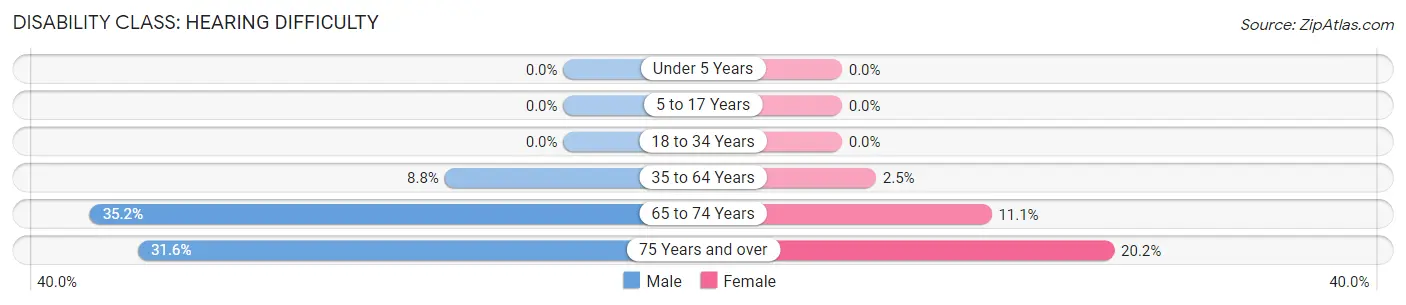
| Age Bracket | Male | Female |
| Under 5 Years | 0 (0.0%) | 0 (0.0%) |
| 5 to 17 Years | 0 (0.0%) | 0 (0.0%) |
| 18 to 34 Years | 0 (0.0%) | 0 (0.0%) |
| 35 to 64 Years | 42 (8.8%) | 18 (2.5%) |
| 65 to 74 Years | 32 (35.2%) | 11 (11.1%) |
| 75 Years and over | 30 (31.6%) | 18 (20.2%) |
Disability Class: Vision Difficulty
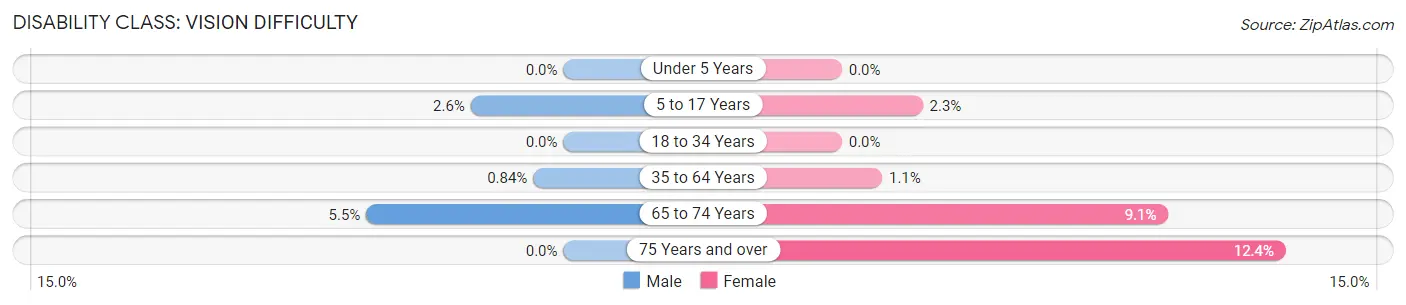
| Age Bracket | Male | Female |
| Under 5 Years | 0 (0.0%) | 0 (0.0%) |
| 5 to 17 Years | 5 (2.6%) | 4 (2.2%) |
| 18 to 34 Years | 0 (0.0%) | 0 (0.0%) |
| 35 to 64 Years | 4 (0.8%) | 8 (1.1%) |
| 65 to 74 Years | 5 (5.5%) | 9 (9.1%) |
| 75 Years and over | 0 (0.0%) | 11 (12.4%) |
Disability Class: Cognitive Difficulty
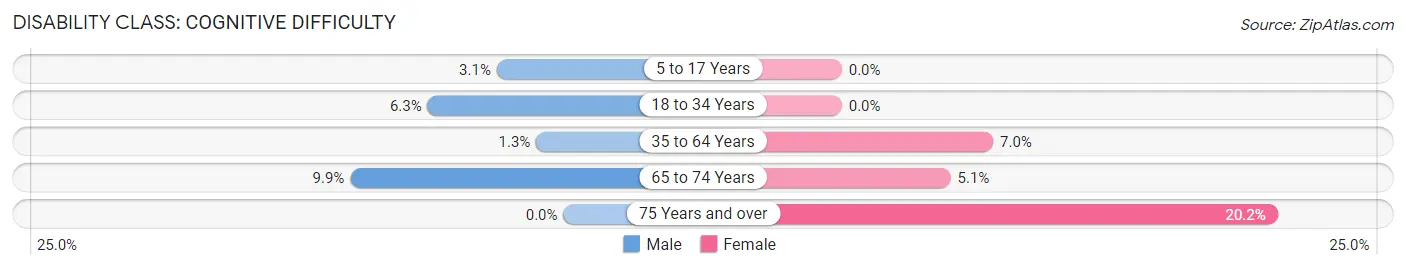
| Age Bracket | Male | Female |
| 5 to 17 Years | 6 (3.1%) | 0 (0.0%) |
| 18 to 34 Years | 25 (6.3%) | 0 (0.0%) |
| 35 to 64 Years | 6 (1.3%) | 50 (7.0%) |
| 65 to 74 Years | 9 (9.9%) | 5 (5.1%) |
| 75 Years and over | 0 (0.0%) | 18 (20.2%) |
Disability Class: Ambulatory Difficulty
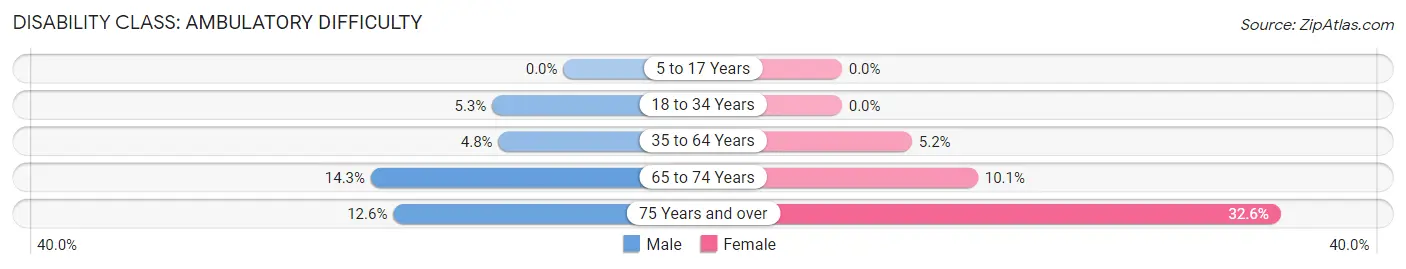
| Age Bracket | Male | Female |
| 5 to 17 Years | 0 (0.0%) | 0 (0.0%) |
| 18 to 34 Years | 21 (5.3%) | 0 (0.0%) |
| 35 to 64 Years | 23 (4.8%) | 37 (5.2%) |
| 65 to 74 Years | 13 (14.3%) | 10 (10.1%) |
| 75 Years and over | 12 (12.6%) | 29 (32.6%) |
Disability Class: Self-Care Difficulty
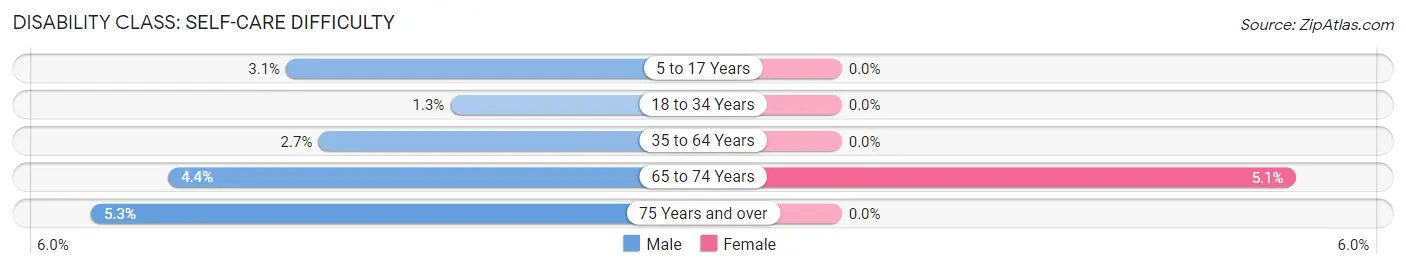
| Age Bracket | Male | Female |
| 5 to 17 Years | 6 (3.1%) | 0 (0.0%) |
| 18 to 34 Years | 5 (1.3%) | 0 (0.0%) |
| 35 to 64 Years | 13 (2.7%) | 0 (0.0%) |
| 65 to 74 Years | 4 (4.4%) | 5 (5.1%) |
| 75 Years and over | 5 (5.3%) | 0 (0.0%) |
Technology Access in Grottoes
Computing Device Access in Grottoes
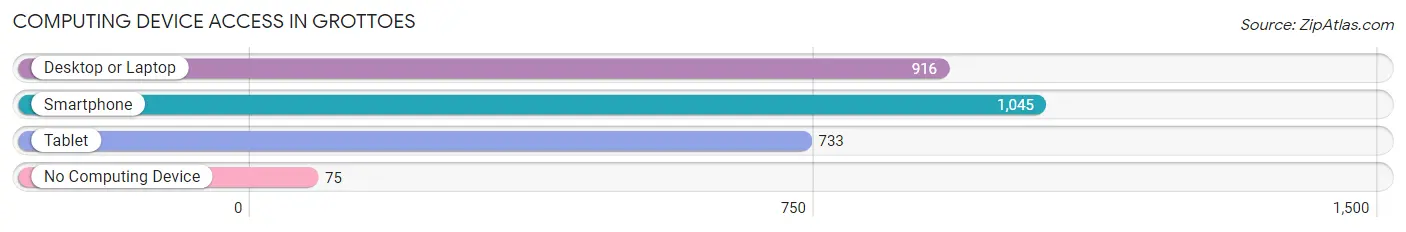
| Device Type | # Households | % Households |
| Desktop or Laptop | 916 | 79.2% |
| Smartphone | 1,045 | 90.4% |
| Tablet | 733 | 63.4% |
| No Computing Device | 75 | 6.5% |
| Total | 1,156 | 100.0% |
Internet Access in Grottoes
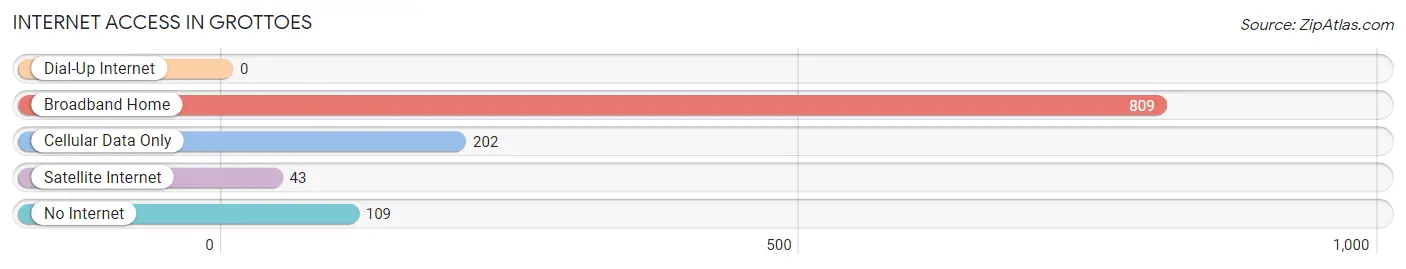
| Internet Type | # Households | % Households |
| Dial-Up Internet | 0 | 0.0% |
| Broadband Home | 809 | 70.0% |
| Cellular Data Only | 202 | 17.5% |
| Satellite Internet | 43 | 3.7% |
| No Internet | 109 | 9.4% |
| Total | 1,156 | 100.0% |
Grottoes Summary
Grottoes is a small town located in the Shenandoah Valley of Virginia, in the United States. It is situated in the northern part of Rockingham County, and is part of the Harrisonburg Metropolitan Statistical Area. The town has a population of 1,845 people, according to the 2010 census.
History
The area that is now Grottoes was first settled in the late 1700s by German immigrants. The town was originally known as “Grotts”, and was named after a nearby cave. The town was officially incorporated in 1891.
In the early 1900s, Grottoes was a thriving agricultural community. The town was home to several mills, including a grist mill, a saw mill, and a flour mill. The town also had a cannery, a brickyard, and a tannery.
In the mid-1900s, Grottoes began to experience a decline in its economy. The mills and other businesses began to close, and the population began to decline. In the late 1970s, the town began to experience a resurgence in its economy, as new businesses began to move into the area.
Geography
Grottoes is located in the northern part of Rockingham County, in the Shenandoah Valley of Virginia. The town is situated at the intersection of US Route 11 and US Route 340. The town is located approximately 10 miles south of Harrisonburg, and approximately 50 miles west of Washington, D.C.
The town is situated in a hilly area, with the Blue Ridge Mountains to the east and the Allegheny Mountains to the west. The town is located in a temperate climate, with hot summers and cold winters.
Economy
The economy of Grottoes is largely based on agriculture and tourism. The town is home to several farms, which produce a variety of crops, including corn, soybeans, wheat, and hay. The town is also home to several wineries, which produce a variety of wines.
The town is also home to several businesses, including restaurants, retail stores, and service providers. The town is also home to several manufacturing companies, which produce a variety of products, including furniture, clothing, and electronics.
Demographics
According to the 2010 census, the population of Grottoes was 1,845 people. The town has a median household income of $41,944, and a median age of 41.7 years. The town is predominantly white, with a population that is 94.3% white, 2.2% African American, 0.7% Asian, and 0.6% Hispanic or Latino.
Conclusion
Grottoes is a small town located in the Shenandoah Valley of Virginia. The town has a population of 1,845 people, and is predominantly white. The town’s economy is largely based on agriculture and tourism, and the town is home to several businesses, including restaurants, retail stores, and service providers.
Common Questions
What is Per Capita Income in Grottoes?
Per Capita income in Grottoes is $41,563.
What is the Median Family Income in Grottoes?
Median Family Income in Grottoes is $92,639.
What is the Median Household income in Grottoes?
Median Household Income in Grottoes is $78,750.
What is Income or Wage Gap in Grottoes?
Income or Wage Gap in Grottoes is 32.7%.
Women in Grottoes earn 67.3 cents for every dollar earned by a man.
What is Inequality or Gini Index in Grottoes?
Inequality or Gini Index in Grottoes is 0.42.
What is the Total Population of Grottoes?
Total Population of Grottoes is 2,904.
What is the Total Male Population of Grottoes?
Total Male Population of Grottoes is 1,322.
What is the Total Female Population of Grottoes?
Total Female Population of Grottoes is 1,582.
What is the Ratio of Males per 100 Females in Grottoes?
There are 83.57 Males per 100 Females in Grottoes.
What is the Ratio of Females per 100 Males in Grottoes?
There are 119.67 Females per 100 Males in Grottoes.
What is the Median Population Age in Grottoes?
Median Population Age in Grottoes is 38.3 Years.
What is the Average Family Size in Grottoes
Average Family Size in Grottoes is 2.9 People.
What is the Average Household Size in Grottoes
Average Household Size in Grottoes is 2.5 People.
How Large is the Labor Force in Grottoes?
There are 1,829 People in the Labor Forcein in Grottoes.
What is the Percentage of People in the Labor Force in Grottoes?
75.5% of People are in the Labor Force in Grottoes.
What is the Unemployment Rate in Grottoes?
Unemployment Rate in Grottoes is 4.0%.