Mount Hermon, VA Map & Demographics
Mount Hermon Map
Mount Hermon Overview
$40,292
PER CAPITA INCOME
$97,450
AVG FAMILY INCOME
$85,357
AVG HOUSEHOLD INCOME
7.0%
WAGE / INCOME GAP [ % ]
93.0¢/ $1
WAGE / INCOME GAP [ $ ]
0.38
INEQUALITY / GINI INDEX
4,434
TOTAL POPULATION
2,020
MALE POPULATION
2,414
FEMALE POPULATION
83.68
MALES / 100 FEMALES
119.50
FEMALES / 100 MALES
48.8
MEDIAN AGE
2.9
AVG FAMILY SIZE
2.5
AVG HOUSEHOLD SIZE
2,601
LABOR FORCE [ PEOPLE ]
64.9%
PERCENT IN LABOR FORCE
5.6%
UNEMPLOYMENT RATE
Income in Mount Hermon
Income Overview in Mount Hermon
Per Capita Income in Mount Hermon is $40,292, while median incomes of families and households are $97,450 and $85,357 respectively.
| Characteristic | Number | Measure |
| Per Capita Income | 4,434 | $40,292 |
| Median Family Income | 1,335 | $97,450 |
| Mean Family Income | 1,335 | $104,713 |
| Median Household Income | 1,758 | $85,357 |
| Mean Household Income | 1,758 | $98,507 |
| Income Deficit | 1,335 | $0 |
| Wage / Income Gap (%) | 4,434 | 7.04% |
| Wage / Income Gap ($) | 4,434 | 92.96¢ per $1 |
| Gini / Inequality Index | 4,434 | 0.38 |
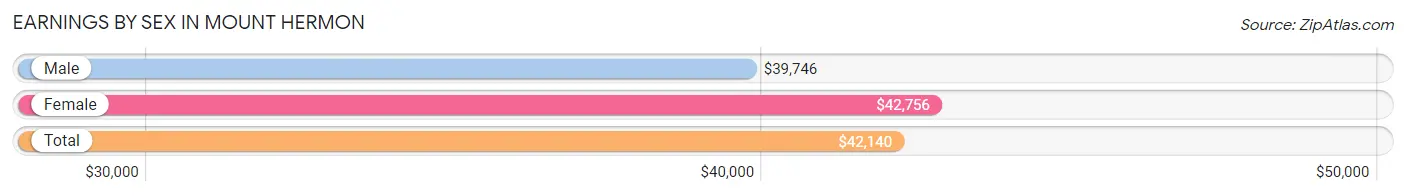
Earnings by Sex in Mount Hermon
Average Earnings in Mount Hermon are $42,140, $39,746 for men and $42,756 for women, a difference of 7.0%.
| Sex | Number | Average Earnings |
| Male | 1,288 (48.9%) | $39,746 |
| Female | 1,343 (51.0%) | $42,756 |
| Total | 2,631 (100.0%) | $42,140 |
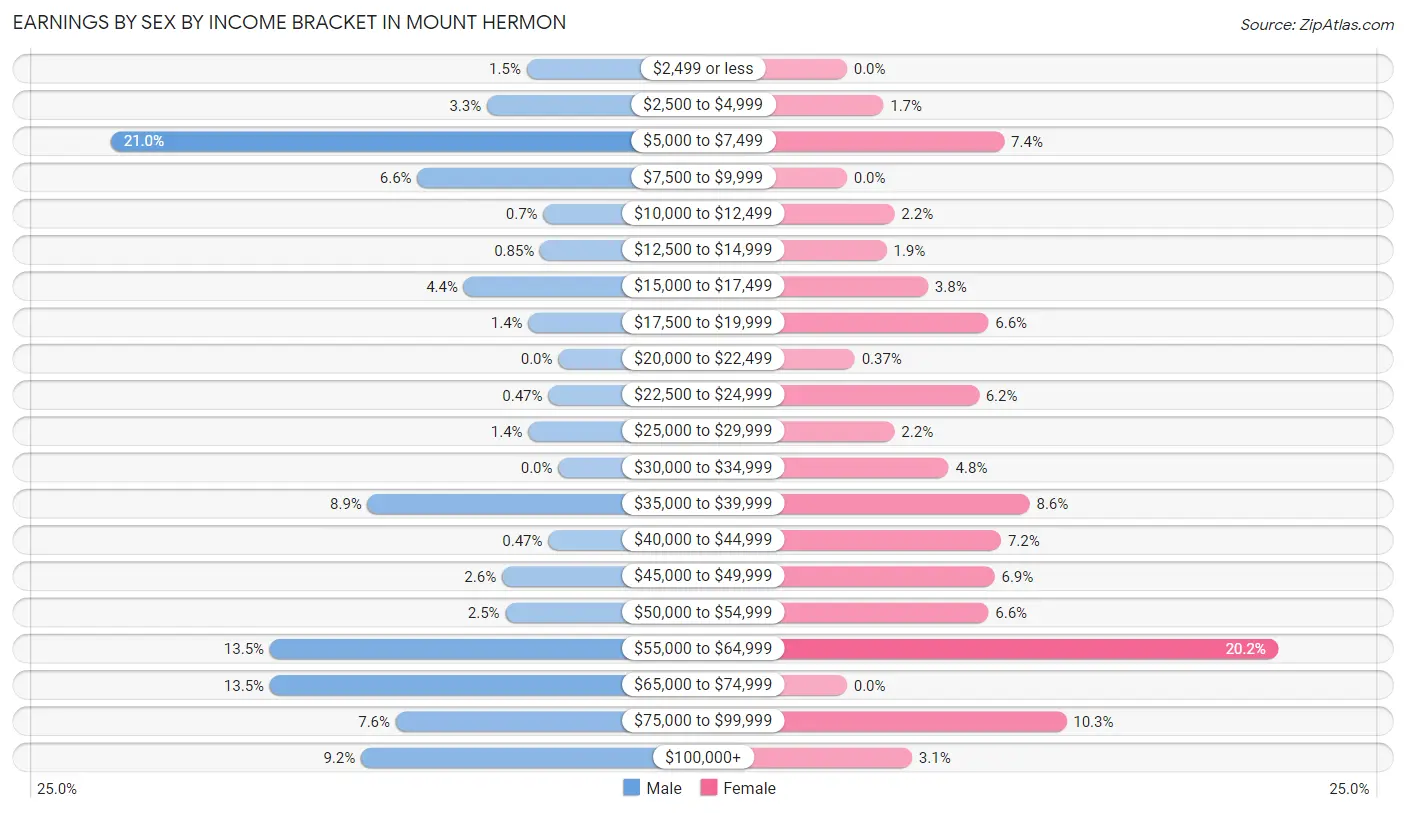
Earnings by Sex by Income Bracket in Mount Hermon
The most common earnings brackets in Mount Hermon are $5,000 to $7,499 for men (270 | 21.0%) and $55,000 to $64,999 for women (271 | 20.2%).
| Income | Male | Female |
| $2,499 or less | 19 (1.5%) | 0 (0.0%) |
| $2,500 to $4,999 | 43 (3.3%) | 23 (1.7%) |
| $5,000 to $7,499 | 270 (21.0%) | 99 (7.4%) |
| $7,500 to $9,999 | 85 (6.6%) | 0 (0.0%) |
| $10,000 to $12,499 | 9 (0.7%) | 30 (2.2%) |
| $12,500 to $14,999 | 11 (0.9%) | 25 (1.9%) |
| $15,000 to $17,499 | 57 (4.4%) | 51 (3.8%) |
| $17,500 to $19,999 | 18 (1.4%) | 89 (6.6%) |
| $20,000 to $22,499 | 0 (0.0%) | 5 (0.4%) |
| $22,500 to $24,999 | 6 (0.5%) | 83 (6.2%) |
| $25,000 to $29,999 | 18 (1.4%) | 30 (2.2%) |
| $30,000 to $34,999 | 0 (0.0%) | 64 (4.8%) |
| $35,000 to $39,999 | 115 (8.9%) | 115 (8.6%) |
| $40,000 to $44,999 | 6 (0.5%) | 97 (7.2%) |
| $45,000 to $49,999 | 34 (2.6%) | 93 (6.9%) |
| $50,000 to $54,999 | 32 (2.5%) | 89 (6.6%) |
| $55,000 to $64,999 | 174 (13.5%) | 271 (20.2%) |
| $65,000 to $74,999 | 174 (13.5%) | 0 (0.0%) |
| $75,000 to $99,999 | 98 (7.6%) | 138 (10.3%) |
| $100,000+ | 119 (9.2%) | 41 (3.0%) |
| Total | 1,288 (100.0%) | 1,343 (100.0%) |
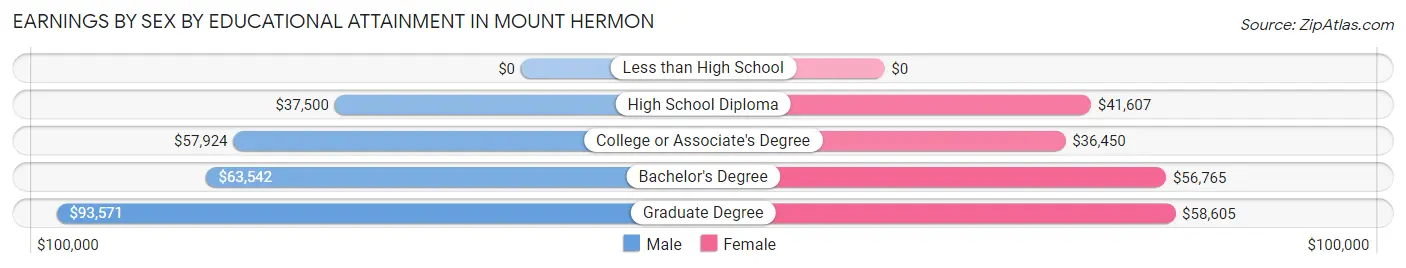
Earnings by Sex by Educational Attainment in Mount Hermon
Average earnings in Mount Hermon are $56,037 for men and $48,025 for women, a difference of 14.3%. Men with an educational attainment of graduate degree enjoy the highest average annual earnings of $93,571, while those with high school diploma education earn the least with $37,500. Women with an educational attainment of graduate degree earn the most with the average annual earnings of $58,605, while those with college or associate's degree education have the smallest earnings of $36,450.
| Educational Attainment | Male Income | Female Income |
| Less than High School | - | - |
| High School Diploma | $37,500 | $41,607 |
| College or Associate's Degree | $57,924 | $36,450 |
| Bachelor's Degree | $63,542 | $56,765 |
| Graduate Degree | $93,571 | $58,605 |
| Total | $56,037 | $48,025 |
Family Income in Mount Hermon
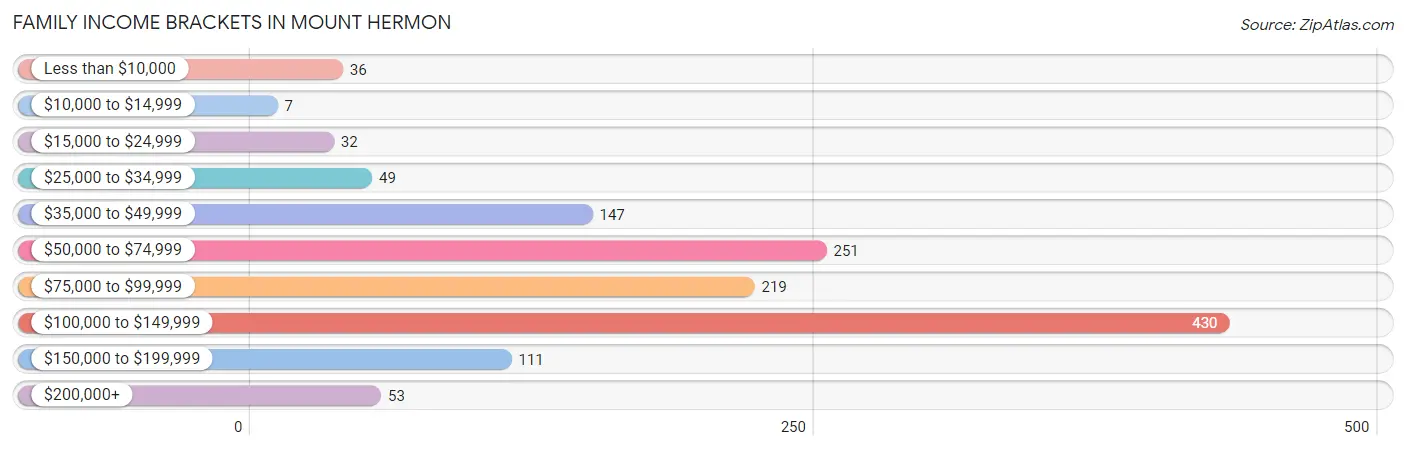
Family Income Brackets in Mount Hermon
According to the Mount Hermon family income data, there are 430 families falling into the $100,000 to $149,999 income range, which is the most common income bracket and makes up 32.2% of all families. Conversely, the $10,000 to $14,999 income bracket is the least frequent group with only 7 families (0.5%) belonging to this category.
| Income Bracket | # Families | % Families |
| Less than $10,000 | 36 | 2.7% |
| $10,000 to $14,999 | 7 | 0.5% |
| $15,000 to $24,999 | 32 | 2.4% |
| $25,000 to $34,999 | 49 | 3.7% |
| $35,000 to $49,999 | 147 | 11.0% |
| $50,000 to $74,999 | 251 | 18.8% |
| $75,000 to $99,999 | 219 | 16.4% |
| $100,000 to $149,999 | 430 | 32.2% |
| $150,000 to $199,999 | 111 | 8.3% |
| $200,000+ | 53 | 4.0% |
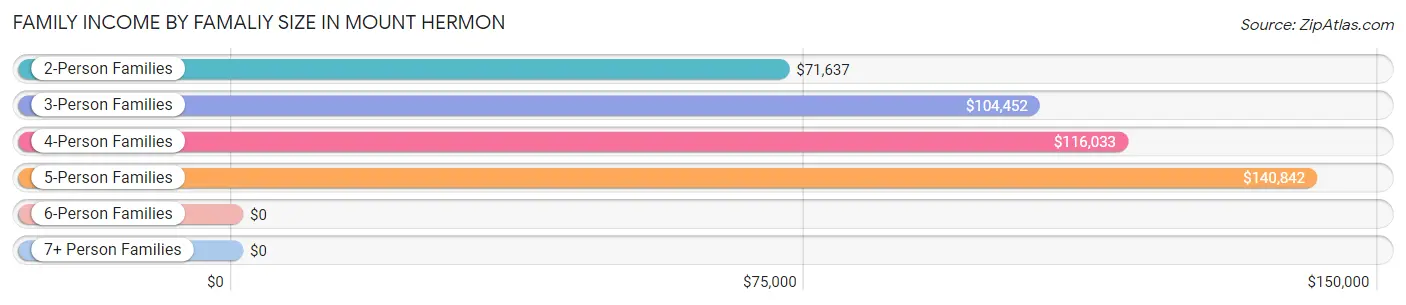
Family Income by Famaliy Size in Mount Hermon
5-person families (119 | 8.9%) account for the highest median family income in Mount Hermon with $140,842 per family, while 2-person families (863 | 64.6%) have the highest median income of $35,818 per family member.
| Income Bracket | # Families | Median Income |
| 2-Person Families | 863 (64.6%) | $71,637 |
| 3-Person Families | 219 (16.4%) | $104,452 |
| 4-Person Families | 108 (8.1%) | $116,033 |
| 5-Person Families | 119 (8.9%) | $140,842 |
| 6-Person Families | 26 (1.9%) | $0 |
| 7+ Person Families | 0 (0.0%) | $0 |
| Total | 1,335 (100.0%) | $97,450 |
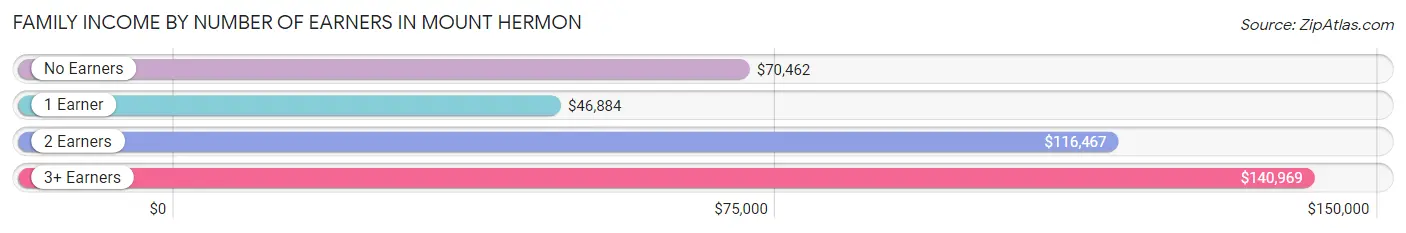
Family Income by Number of Earners in Mount Hermon
The median family income in Mount Hermon is $97,450, with families comprising 3+ earners (110) having the highest median family income of $140,969, while families with 1 earner (279) have the lowest median family income of $46,884, accounting for 8.2% and 20.9% of families, respectively.
| Number of Earners | # Families | Median Income |
| No Earners | 270 (20.2%) | $70,462 |
| 1 Earner | 279 (20.9%) | $46,884 |
| 2 Earners | 676 (50.6%) | $116,467 |
| 3+ Earners | 110 (8.2%) | $140,969 |
| Total | 1,335 (100.0%) | $97,450 |
Household Income in Mount Hermon
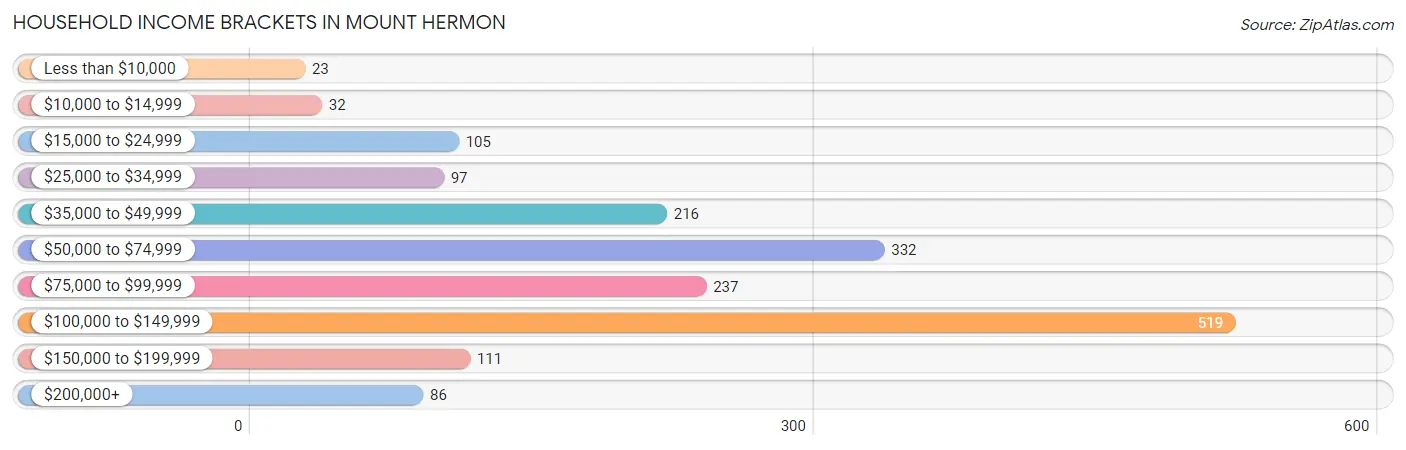
Household Income Brackets in Mount Hermon
With 519 households falling in the category, the $100,000 to $149,999 income range is the most frequent in Mount Hermon, accounting for 29.5% of all households. In contrast, only 23 households (1.3%) fall into the less than $10,000 income bracket, making it the least populous group.
| Income Bracket | # Households | % Households |
| Less than $10,000 | 23 | 1.3% |
| $10,000 to $14,999 | 32 | 1.8% |
| $15,000 to $24,999 | 105 | 6.0% |
| $25,000 to $34,999 | 97 | 5.5% |
| $35,000 to $49,999 | 216 | 12.3% |
| $50,000 to $74,999 | 332 | 18.9% |
| $75,000 to $99,999 | 237 | 13.5% |
| $100,000 to $149,999 | 519 | 29.5% |
| $150,000 to $199,999 | 111 | 6.3% |
| $200,000+ | 86 | 4.9% |
Household Income by Householder Age in Mount Hermon
The median household income in Mount Hermon is $85,357, with the highest median household income of $115,679 found in the 45 to 64 years age bracket for the primary householder. A total of 791 households (45.0%) fall into this category. Meanwhile, the 15 to 24 years age bracket for the primary householder has the lowest median household income of $0, with 37 households (2.1%) in this group.
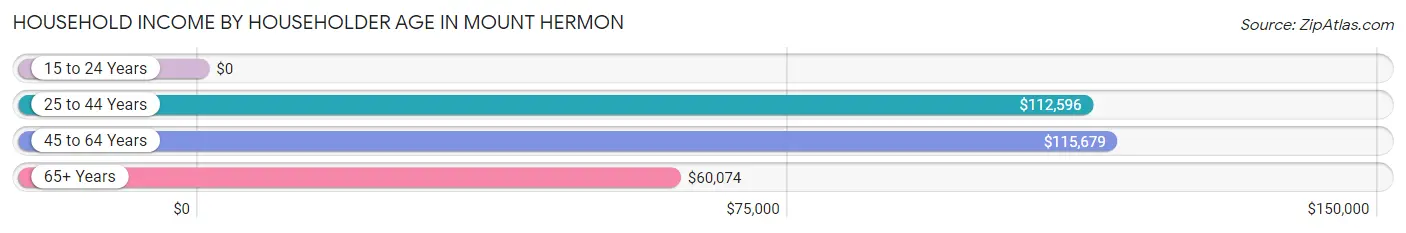
| Income Bracket | # Households | Median Income |
| 15 to 24 Years | 37 (2.1%) | $0 |
| 25 to 44 Years | 329 (18.7%) | $112,596 |
| 45 to 64 Years | 791 (45.0%) | $115,679 |
| 65+ Years | 601 (34.2%) | $60,074 |
| Total | 1,758 (100.0%) | $85,357 |
Poverty in Mount Hermon
Income Below Poverty by Sex and Age in Mount Hermon
With 3.2% poverty level for males and 4.8% for females among the residents of Mount Hermon, 35 to 44 year old males and under 5 year old females are the most vulnerable to poverty, with 29 males (11.1%) and 35 females (45.5%) in their respective age groups living below the poverty level.
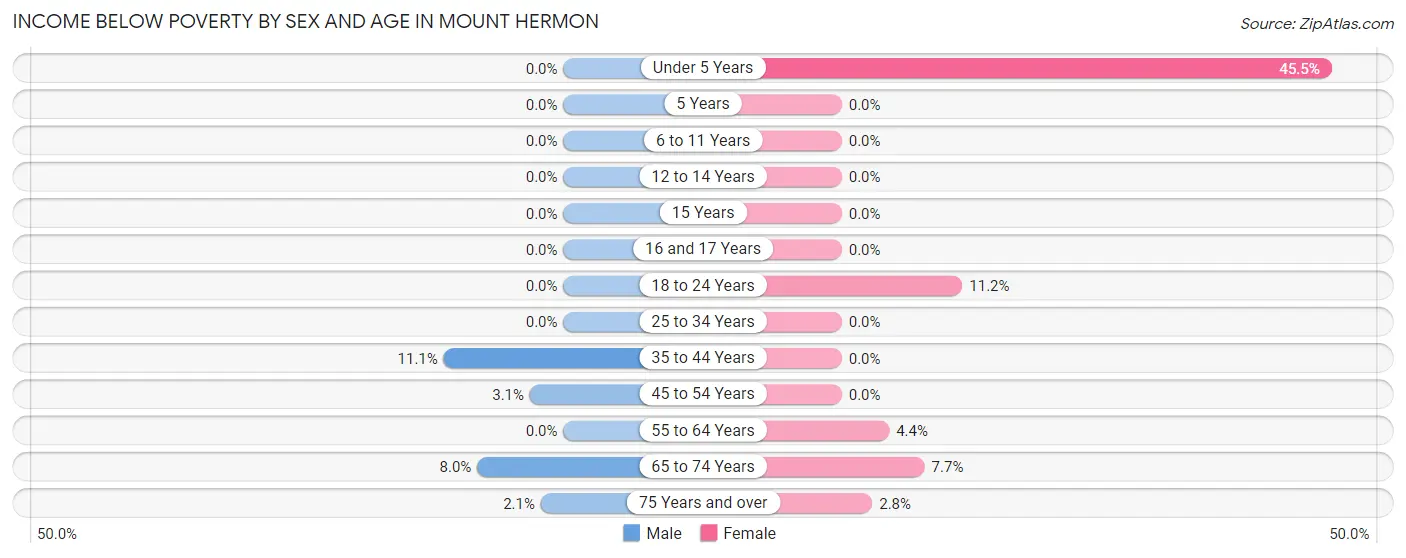
| Age Bracket | Male | Female |
| Under 5 Years | 0 (0.0%) | 35 (45.5%) |
| 5 Years | 0 (0.0%) | 0 (0.0%) |
| 6 to 11 Years | 0 (0.0%) | 0 (0.0%) |
| 12 to 14 Years | 0 (0.0%) | 0 (0.0%) |
| 15 Years | 0 (0.0%) | 0 (0.0%) |
| 16 and 17 Years | 0 (0.0%) | 0 (0.0%) |
| 18 to 24 Years | 0 (0.0%) | 32 (11.2%) |
| 25 to 34 Years | 0 (0.0%) | 0 (0.0%) |
| 35 to 44 Years | 29 (11.1%) | 0 (0.0%) |
| 45 to 54 Years | 13 (3.1%) | 0 (0.0%) |
| 55 to 64 Years | 0 (0.0%) | 20 (4.4%) |
| 65 to 74 Years | 18 (8.0%) | 23 (7.7%) |
| 75 Years and over | 4 (2.1%) | 6 (2.8%) |
| Total | 64 (3.2%) | 116 (4.8%) |
Income Above Poverty by Sex and Age in Mount Hermon
According to the poverty statistics in Mount Hermon, males aged under 5 years and females aged 5 years are the age groups that are most secure financially, with 100.0% of males and 100.0% of females in these age groups living above the poverty line.
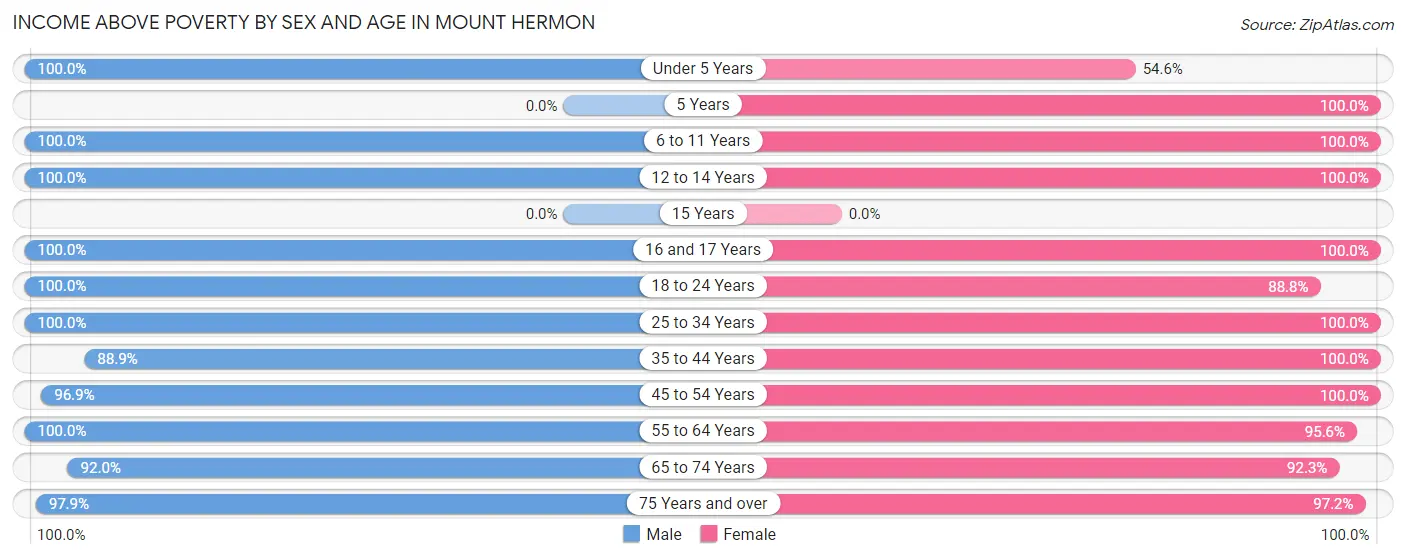
| Age Bracket | Male | Female |
| Under 5 Years | 58 (100.0%) | 42 (54.5%) |
| 5 Years | 0 (0.0%) | 16 (100.0%) |
| 6 to 11 Years | 44 (100.0%) | 135 (100.0%) |
| 12 to 14 Years | 41 (100.0%) | 43 (100.0%) |
| 15 Years | 0 (0.0%) | 0 (0.0%) |
| 16 and 17 Years | 7 (100.0%) | 53 (100.0%) |
| 18 to 24 Years | 231 (100.0%) | 254 (88.8%) |
| 25 to 34 Years | 166 (100.0%) | 154 (100.0%) |
| 35 to 44 Years | 232 (88.9%) | 361 (100.0%) |
| 45 to 54 Years | 405 (96.9%) | 323 (100.0%) |
| 55 to 64 Years | 365 (100.0%) | 435 (95.6%) |
| 65 to 74 Years | 207 (92.0%) | 276 (92.3%) |
| 75 Years and over | 187 (97.9%) | 206 (97.2%) |
| Total | 1,943 (96.8%) | 2,298 (95.2%) |
Income Below Poverty Among Married-Couple Families in Mount Hermon
The poverty statistics for married-couple families in Mount Hermon show that 1.5% or 16 of the total 1,098 families live below the poverty line. Families with no children have the highest poverty rate of 1.8%, comprising of 16 families. On the other hand, families with 1 or 2 children have the lowest poverty rate of 0.0%, which includes 0 families.
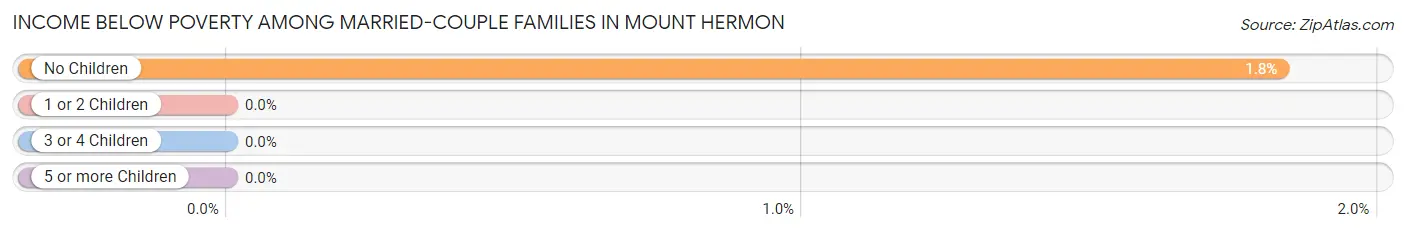
| Children | Above Poverty | Below Poverty |
| No Children | 857 (98.2%) | 16 (1.8%) |
| 1 or 2 Children | 178 (100.0%) | 0 (0.0%) |
| 3 or 4 Children | 47 (100.0%) | 0 (0.0%) |
| 5 or more Children | 0 (0.0%) | 0 (0.0%) |
| Total | 1,082 (98.5%) | 16 (1.5%) |
Income Below Poverty Among Single-Parent Households in Mount Hermon
According to the poverty data in Mount Hermon, 24.5% or 13 single-father households and 18.5% or 34 single-mother households are living below the poverty line. Among single-father households, those with 1 or 2 children have the highest poverty rate, with 13 households (100.0%) experiencing poverty. Likewise, among single-mother households, those with no children have the highest poverty rate, with 20 households (39.2%) falling below the poverty line.
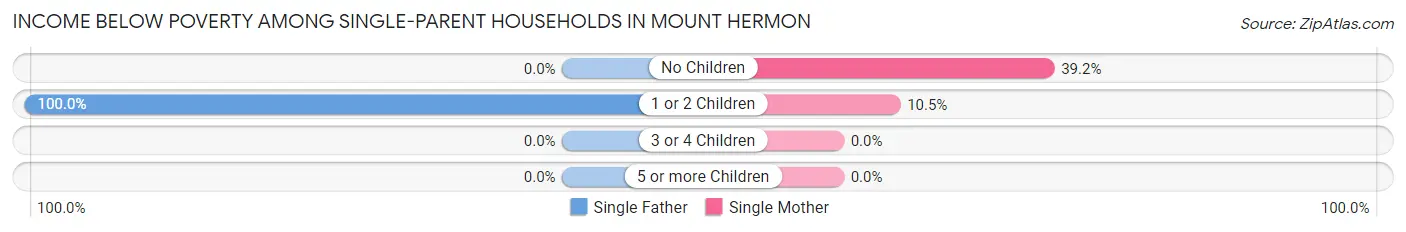
| Children | Single Father | Single Mother |
| No Children | 0 (0.0%) | 20 (39.2%) |
| 1 or 2 Children | 13 (100.0%) | 14 (10.5%) |
| 3 or 4 Children | 0 (0.0%) | 0 (0.0%) |
| 5 or more Children | 0 (0.0%) | 0 (0.0%) |
| Total | 13 (24.5%) | 34 (18.5%) |
Income Below Poverty Among Married-Couple vs Single-Parent Households in Mount Hermon
The poverty data for Mount Hermon shows that 16 of the married-couple family households (1.5%) and 47 of the single-parent households (19.8%) are living below the poverty level. Within the married-couple family households, those with no children have the highest poverty rate, with 16 households (1.8%) falling below the poverty line. Among the single-parent households, those with no children have the highest poverty rate, with 20 household (22.0%) living below poverty.
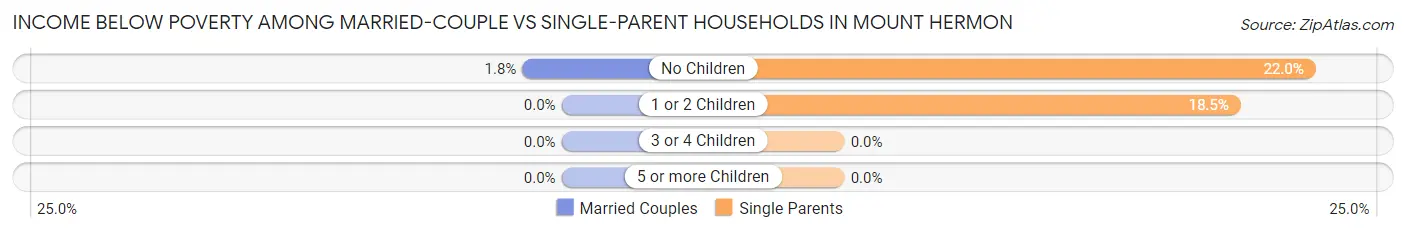
| Children | Married-Couple Families | Single-Parent Households |
| No Children | 16 (1.8%) | 20 (22.0%) |
| 1 or 2 Children | 0 (0.0%) | 27 (18.5%) |
| 3 or 4 Children | 0 (0.0%) | 0 (0.0%) |
| 5 or more Children | 0 (0.0%) | 0 (0.0%) |
| Total | 16 (1.5%) | 47 (19.8%) |
Race in Mount Hermon
The most populous races in Mount Hermon are White / Caucasian (3,622 | 81.7%), Black / African American (692 | 15.6%), and Asian (70 | 1.6%).
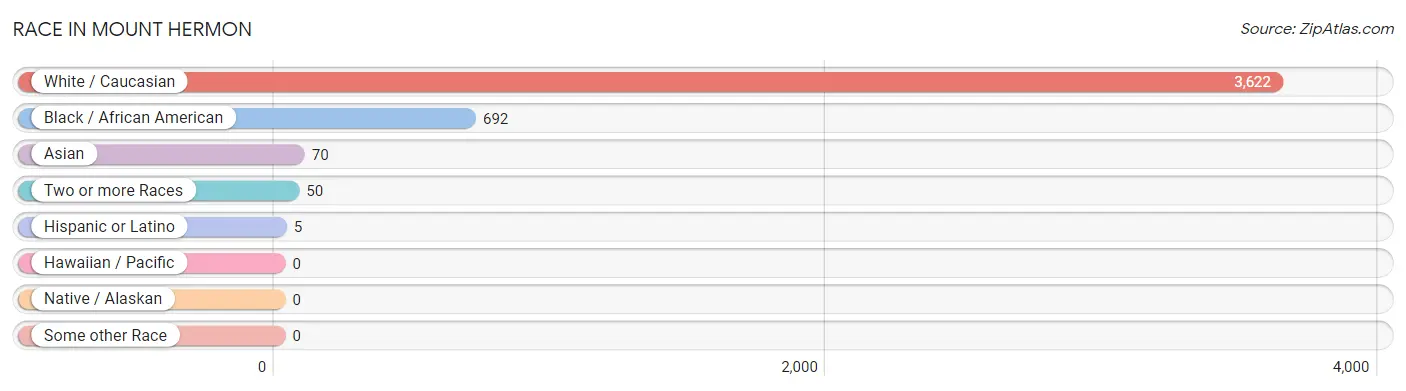
| Race | # Population | % Population |
| Asian | 70 | 1.6% |
| Black / African American | 692 | 15.6% |
| Hawaiian / Pacific | 0 | 0.0% |
| Hispanic or Latino | 5 | 0.1% |
| Native / Alaskan | 0 | 0.0% |
| White / Caucasian | 3,622 | 81.7% |
| Two or more Races | 50 | 1.1% |
| Some other Race | 0 | 0.0% |
| Total | 4,434 | 100.0% |
Ancestry in Mount Hermon
The most populous ancestries reported in Mount Hermon are American (1,135 | 25.6%), English (729 | 16.4%), German (635 | 14.3%), Irish (302 | 6.8%), and Scottish (228 | 5.1%), together accounting for 68.3% of all Mount Hermon residents.
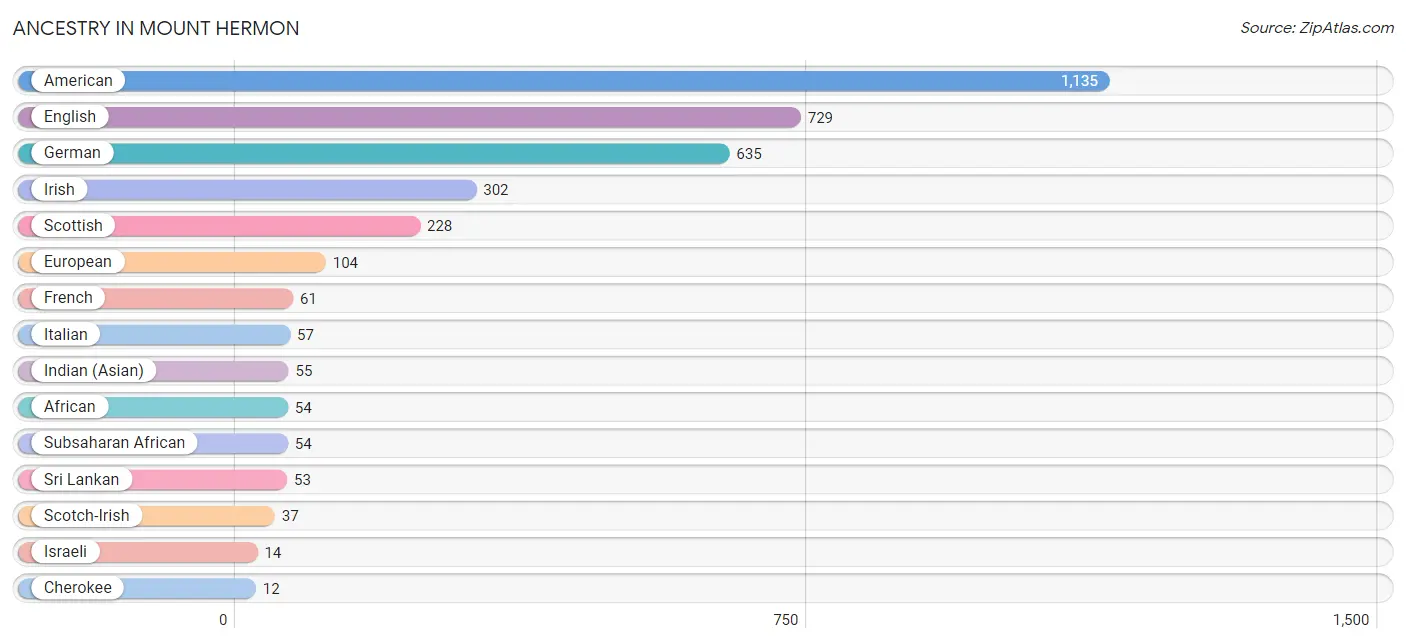
| Ancestry | # Population | % Population |
| African | 54 | 1.2% |
| American | 1,135 | 25.6% |
| Cherokee | 12 | 0.3% |
| Colombian | 5 | 0.1% |
| Czech | 10 | 0.2% |
| English | 729 | 16.4% |
| European | 104 | 2.4% |
| French | 61 | 1.4% |
| German | 635 | 14.3% |
| Greek | 9 | 0.2% |
| Indian (Asian) | 55 | 1.2% |
| Irish | 302 | 6.8% |
| Israeli | 14 | 0.3% |
| Italian | 57 | 1.3% |
| Scotch-Irish | 37 | 0.8% |
| Scottish | 228 | 5.1% |
| South American | 5 | 0.1% |
| Sri Lankan | 53 | 1.2% |
| Subsaharan African | 54 | 1.2% | View All 19 Rows |
Immigrants in Mount Hermon
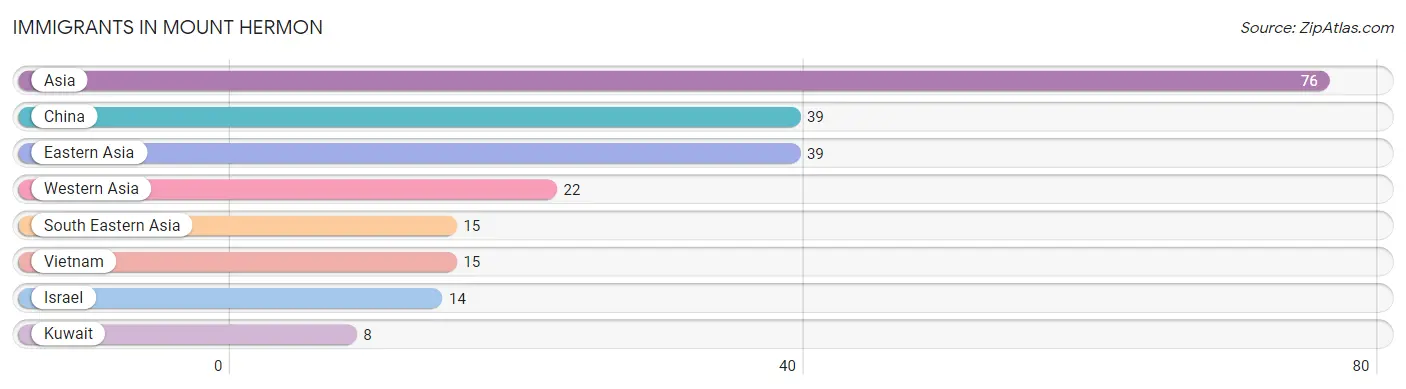
The most numerous immigrant groups reported in Mount Hermon came from Asia (76 | 1.7%), China (39 | 0.9%), Eastern Asia (39 | 0.9%), Western Asia (22 | 0.5%), and South Eastern Asia (15 | 0.3%), together accounting for 4.3% of all Mount Hermon residents.
| Immigration Origin | # Population | % Population |
| Asia | 76 | 1.7% |
| China | 39 | 0.9% |
| Eastern Asia | 39 | 0.9% |
| Israel | 14 | 0.3% |
| Kuwait | 8 | 0.2% |
| South Eastern Asia | 15 | 0.3% |
| Vietnam | 15 | 0.3% |
| Western Asia | 22 | 0.5% | View All 8 Rows |
Sex and Age in Mount Hermon
Sex and Age in Mount Hermon
The most populous age groups in Mount Hermon are 50 to 54 Years (279 | 13.8%) for men and 60 to 64 Years (245 | 10.2%) for women.
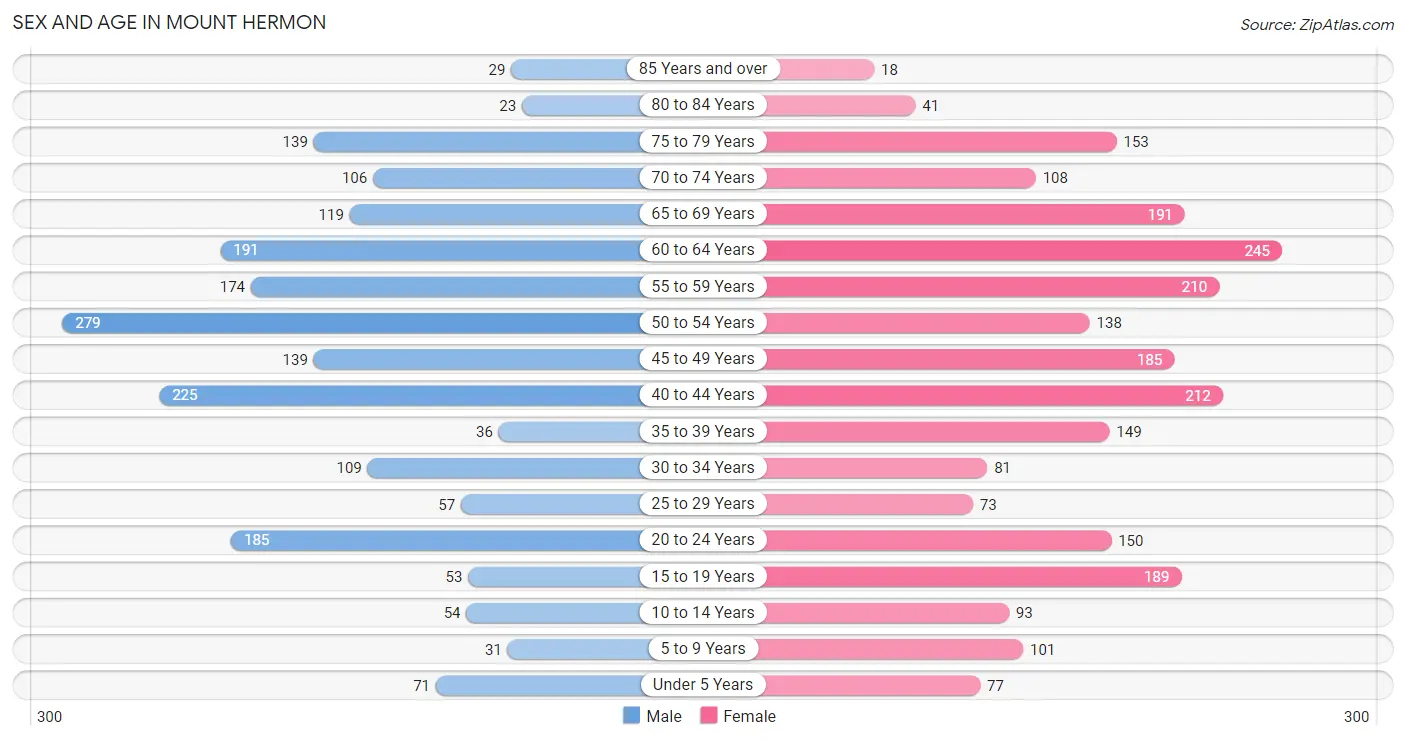
| Age Bracket | Male | Female |
| Under 5 Years | 71 (3.5%) | 77 (3.2%) |
| 5 to 9 Years | 31 (1.5%) | 101 (4.2%) |
| 10 to 14 Years | 54 (2.7%) | 93 (3.8%) |
| 15 to 19 Years | 53 (2.6%) | 189 (7.8%) |
| 20 to 24 Years | 185 (9.2%) | 150 (6.2%) |
| 25 to 29 Years | 57 (2.8%) | 73 (3.0%) |
| 30 to 34 Years | 109 (5.4%) | 81 (3.4%) |
| 35 to 39 Years | 36 (1.8%) | 149 (6.2%) |
| 40 to 44 Years | 225 (11.1%) | 212 (8.8%) |
| 45 to 49 Years | 139 (6.9%) | 185 (7.7%) |
| 50 to 54 Years | 279 (13.8%) | 138 (5.7%) |
| 55 to 59 Years | 174 (8.6%) | 210 (8.7%) |
| 60 to 64 Years | 191 (9.5%) | 245 (10.2%) |
| 65 to 69 Years | 119 (5.9%) | 191 (7.9%) |
| 70 to 74 Years | 106 (5.2%) | 108 (4.5%) |
| 75 to 79 Years | 139 (6.9%) | 153 (6.3%) |
| 80 to 84 Years | 23 (1.1%) | 41 (1.7%) |
| 85 Years and over | 29 (1.4%) | 18 (0.7%) |
| Total | 2,020 (100.0%) | 2,414 (100.0%) |
Families and Households in Mount Hermon
Median Family Size in Mount Hermon
The median family size in Mount Hermon is 2.86 persons per family, with married-couple families (1,098 | 82.3%) accounting for the largest median family size of 2.88 persons per family. On the other hand, single male/father families (53 | 4.0%) represent the smallest median family size with 2.55 persons per family.
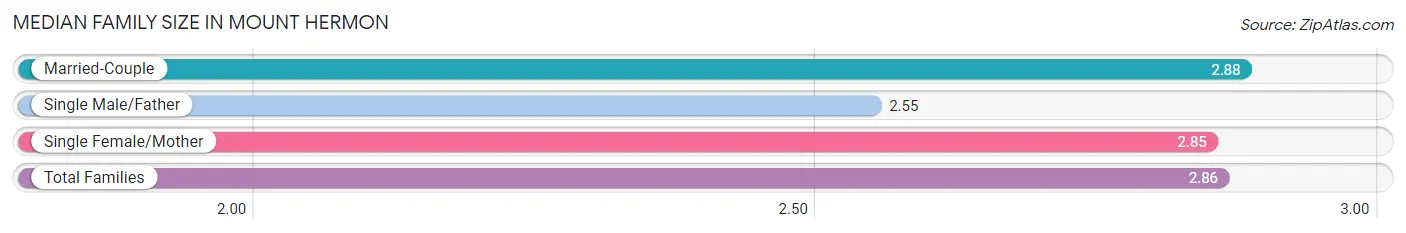
| Family Type | # Families | Family Size |
| Married-Couple | 1,098 (82.3%) | 2.88 |
| Single Male/Father | 53 (4.0%) | 2.55 |
| Single Female/Mother | 184 (13.8%) | 2.85 |
| Total Families | 1,335 (100.0%) | 2.86 |
Median Household Size in Mount Hermon
The median household size in Mount Hermon is 2.52 persons per household, with single female/mother households (184 | 10.5%) accounting for the largest median household size of 3.14 persons per household. non-family households (423 | 24.1%) represent the smallest median household size with 1.28 persons per household.
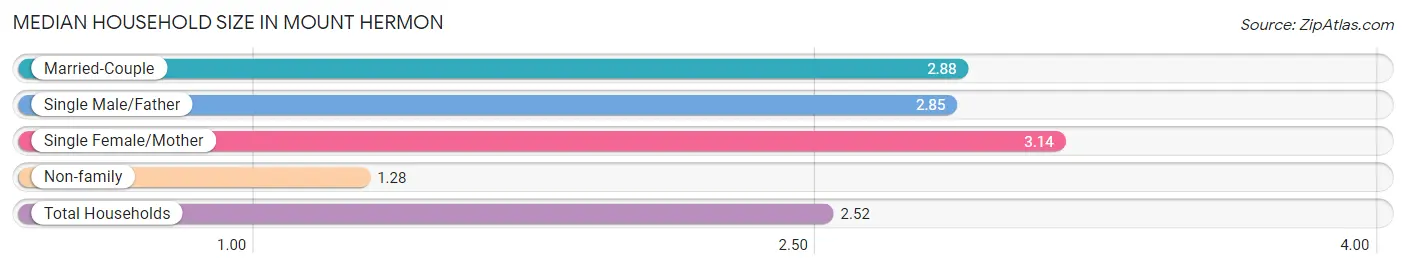
| Household Type | # Households | Household Size |
| Married-Couple | 1,098 (62.5%) | 2.88 |
| Single Male/Father | 53 (3.0%) | 2.85 |
| Single Female/Mother | 184 (10.5%) | 3.14 |
| Non-family | 423 (24.1%) | 1.28 |
| Total Households | 1,758 (100.0%) | 2.52 |
Household Size by Marriage Status in Mount Hermon
Out of a total of 1,758 households in Mount Hermon, 1,335 (75.9%) are family households, while 423 (24.1%) are nonfamily households. The most numerous type of family households are 2-person households, comprising 850, and the most common type of nonfamily households are 1-person households, comprising 341.
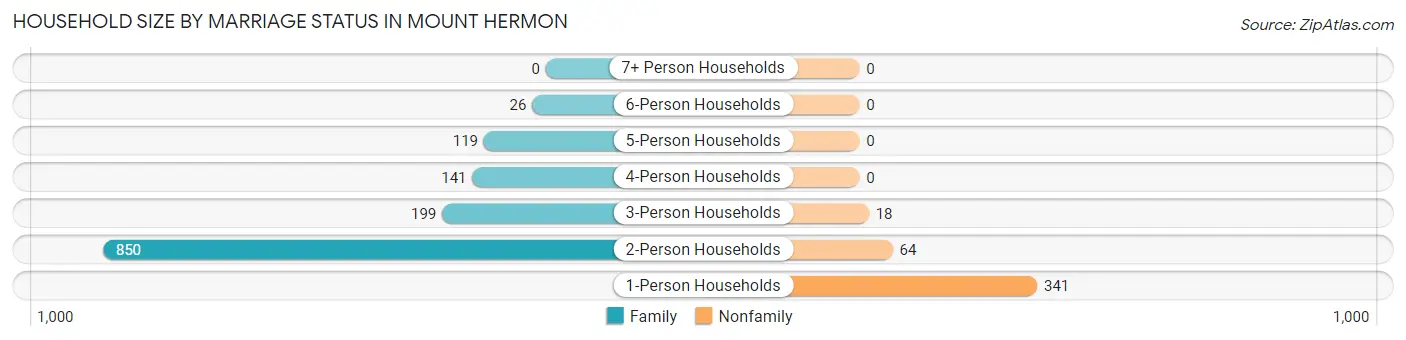
| Household Size | Family Households | Nonfamily Households |
| 1-Person Households | - | 341 (19.4%) |
| 2-Person Households | 850 (48.3%) | 64 (3.6%) |
| 3-Person Households | 199 (11.3%) | 18 (1.0%) |
| 4-Person Households | 141 (8.0%) | 0 (0.0%) |
| 5-Person Households | 119 (6.8%) | 0 (0.0%) |
| 6-Person Households | 26 (1.5%) | 0 (0.0%) |
| 7+ Person Households | 0 (0.0%) | 0 (0.0%) |
| Total | 1,335 (75.9%) | 423 (24.1%) |
Female Fertility in Mount Hermon
Fertility by Age in Mount Hermon
Average fertility rate in Mount Hermon is 27.0 births per 1,000 women. Women in the age bracket of 20 to 34 years have the highest fertility rate with 43.0 births per 1,000 women. Women in the age bracket of 35 to 50 years acount for 55.2% of all women with births.
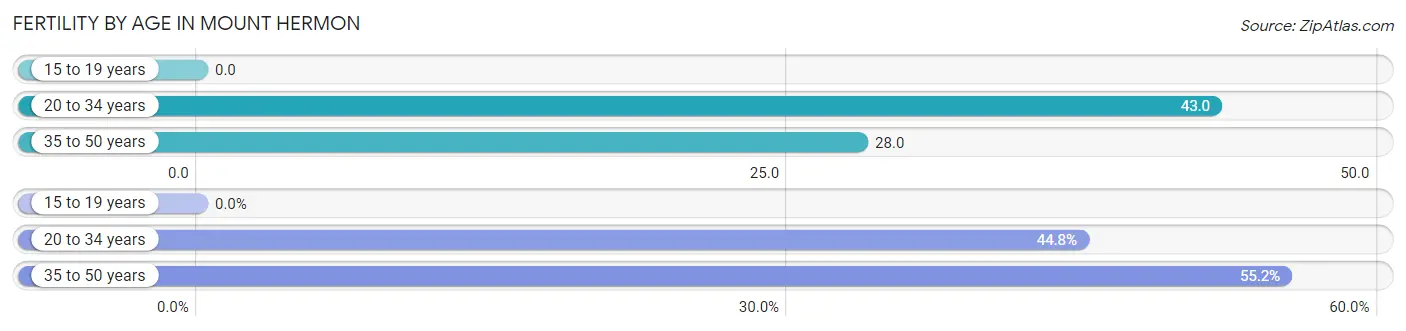
| Age Bracket | Women with Births | Births / 1,000 Women |
| 15 to 19 years | 0 (0.0%) | 0.0 |
| 20 to 34 years | 13 (44.8%) | 43.0 |
| 35 to 50 years | 16 (55.2%) | 28.0 |
| Total | 29 (100.0%) | 27.0 |
Fertility by Age by Marriage Status in Mount Hermon
55.2% of women with births (29) in Mount Hermon are married. The highest percentage of unmarried women with births falls into 20 to 34 years age bracket with 100.0% of them unmarried at the time of birth, while the lowest percentage of unmarried women with births belong to 35 to 50 years age bracket with 0.0% of them unmarried.
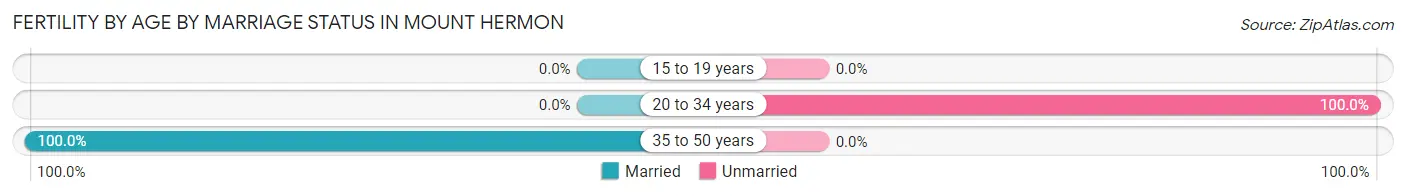
| Age Bracket | Married | Unmarried |
| 15 to 19 years | 0 (0.0%) | 0 (0.0%) |
| 20 to 34 years | 0 (0.0%) | 13 (100.0%) |
| 35 to 50 years | 16 (100.0%) | 0 (0.0%) |
| Total | 16 (55.2%) | 13 (44.8%) |
Fertility by Education in Mount Hermon
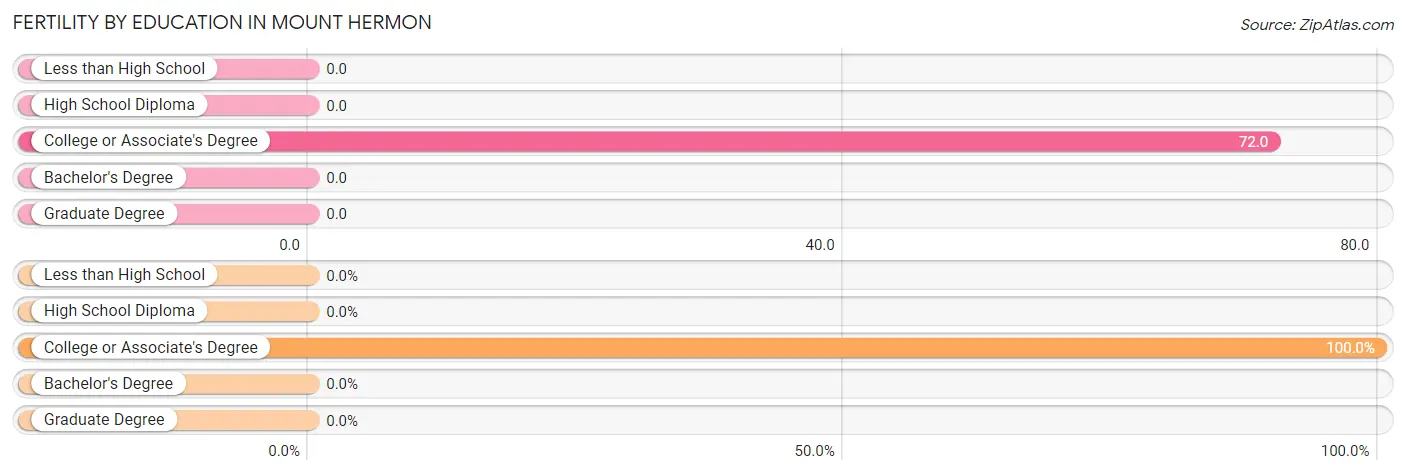
| Educational Attainment | Women with Births | Births / 1,000 Women |
| Less than High School | 0 (0.0%) | 0.0 |
| High School Diploma | 0 (0.0%) | 0.0 |
| College or Associate's Degree | 29 (100.0%) | 72.0 |
| Bachelor's Degree | 0 (0.0%) | 0.0 |
| Graduate Degree | 0 (0.0%) | 0.0 |
| Total | 29 (100.0%) | 27.0 |
Fertility by Education by Marriage Status in Mount Hermon
44.8% of women with births in Mount Hermon are unmarried. Women with the educational attainment of college or associate's degree are most likely to be married with 55.2% of them married at childbirth, while women with the educational attainment of college or associate's degree are least likely to be married with 44.8% of them unmarried at childbirth.
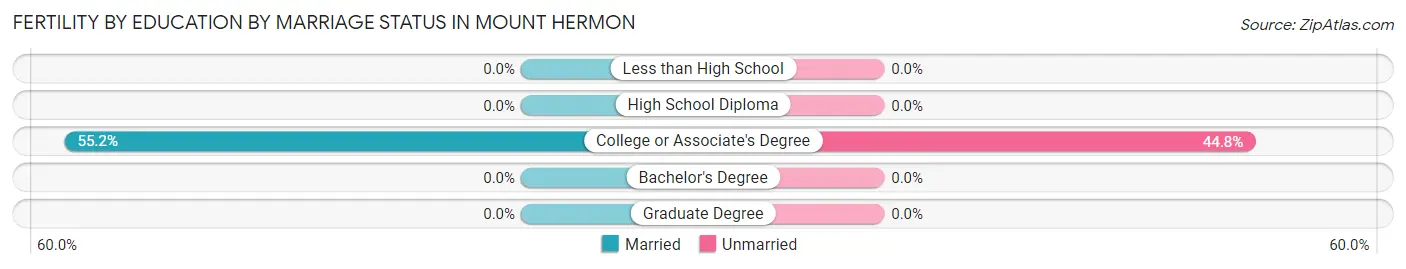
| Educational Attainment | Married | Unmarried |
| Less than High School | 0 (0.0%) | 0 (0.0%) |
| High School Diploma | 0 (0.0%) | 0 (0.0%) |
| College or Associate's Degree | 16 (55.2%) | 13 (44.8%) |
| Bachelor's Degree | 0 (0.0%) | 0 (0.0%) |
| Graduate Degree | 0 (0.0%) | 0 (0.0%) |
| Total | 16 (55.2%) | 13 (44.8%) |
Employment Characteristics in Mount Hermon
Employment by Class of Employer in Mount Hermon
Among the 2,442 employed individuals in Mount Hermon, private company employees (1,689 | 69.2%), local government employees (392 | 16.1%), and state government employees (165 | 6.8%) make up the most common classes of employment.
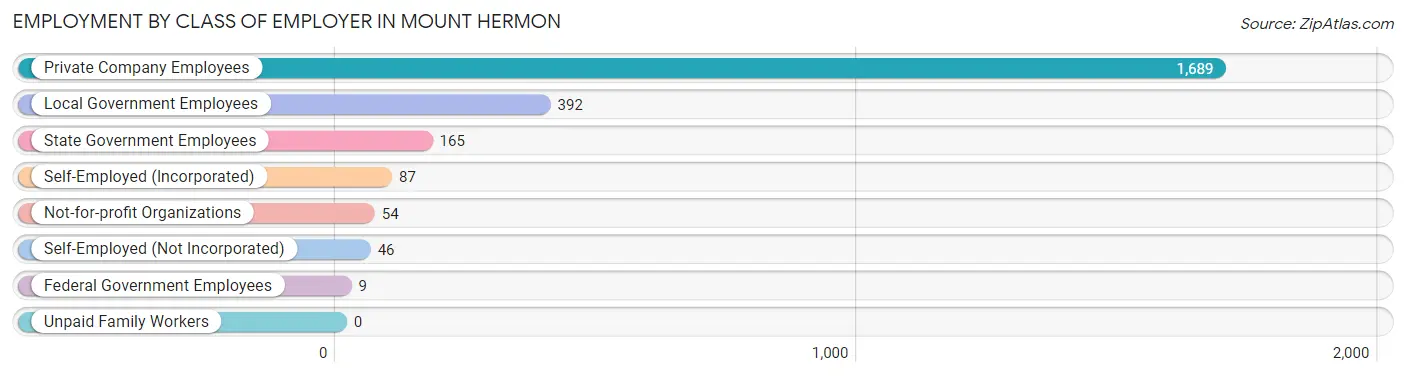
| Employer Class | # Employees | % Employees |
| Private Company Employees | 1,689 | 69.2% |
| Self-Employed (Incorporated) | 87 | 3.6% |
| Self-Employed (Not Incorporated) | 46 | 1.9% |
| Not-for-profit Organizations | 54 | 2.2% |
| Local Government Employees | 392 | 16.1% |
| State Government Employees | 165 | 6.8% |
| Federal Government Employees | 9 | 0.4% |
| Unpaid Family Workers | 0 | 0.0% |
| Total | 2,442 | 100.0% |
Employment Status by Age in Mount Hermon
According to the labor force statistics for Mount Hermon, out of the total population over 16 years of age (4,007), 64.9% or 2,601 individuals are in the labor force, with 5.6% or 146 of them unemployed. The age group with the highest labor force participation rate is 25 to 29 years, with 100.0% or 130 individuals in the labor force. Within the labor force, the 16 to 19 years age range has the highest percentage of unemployed individuals, with 20.2% or 18 of them being unemployed.
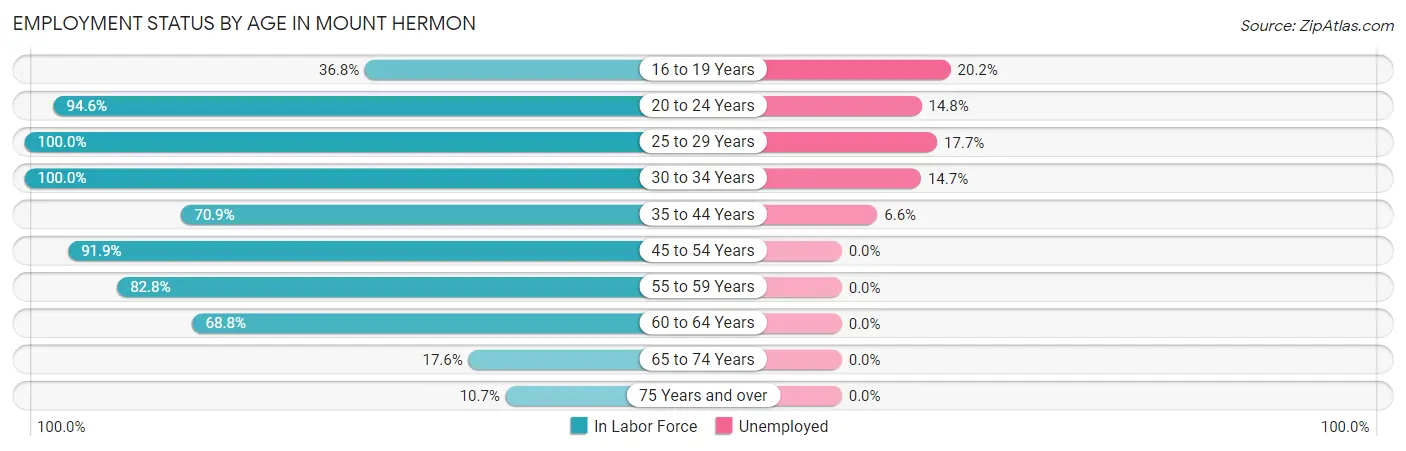
| Age Bracket | In Labor Force | Unemployed |
| 16 to 19 Years | 89 (36.8%) | 18 (20.2%) |
| 20 to 24 Years | 317 (94.6%) | 47 (14.8%) |
| 25 to 29 Years | 130 (100.0%) | 23 (17.7%) |
| 30 to 34 Years | 190 (100.0%) | 28 (14.7%) |
| 35 to 44 Years | 441 (70.9%) | 29 (6.6%) |
| 45 to 54 Years | 681 (91.9%) | 0 (0.0%) |
| 55 to 59 Years | 318 (82.8%) | 0 (0.0%) |
| 60 to 64 Years | 300 (68.8%) | 0 (0.0%) |
| 65 to 74 Years | 92 (17.6%) | 0 (0.0%) |
| 75 Years and over | 43 (10.7%) | 0 (0.0%) |
| Total | 2,601 (64.9%) | 146 (5.6%) |
Employment Status by Educational Attainment in Mount Hermon
According to labor force statistics for Mount Hermon, 82.3% of individuals (2,060) out of the total population between 25 and 64 years of age (2,503) are in the labor force, with 3.9% or 80 of them being unemployed. The group with the highest labor force participation rate are those with the educational attainment of bachelor's degree or higher, with 95.6% or 734 individuals in the labor force. Within the labor force, individuals with college / associate degree education have the highest percentage of unemployment, with 6.3% or 52 of them being unemployed.
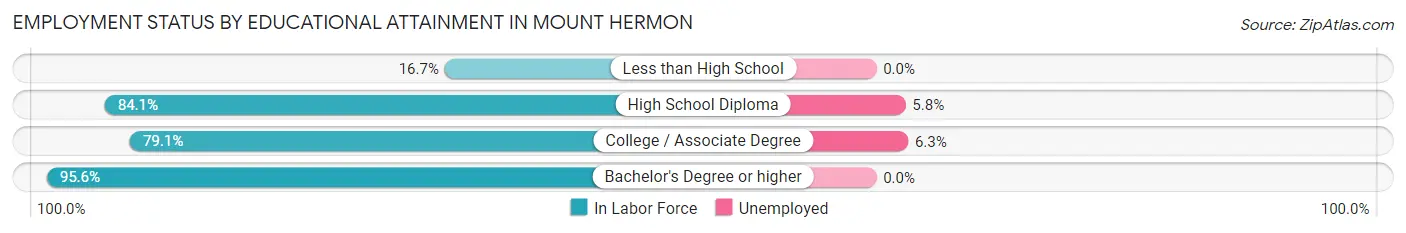
| Educational Attainment | In Labor Force | Unemployed |
| Less than High School | 20 (16.7%) | 0 (0.0%) |
| High School Diploma | 486 (84.1%) | 34 (5.8%) |
| College / Associate Degree | 820 (79.1%) | 65 (6.3%) |
| Bachelor's Degree or higher | 734 (95.6%) | 0 (0.0%) |
| Total | 2,060 (82.3%) | 98 (3.9%) |
Employment Occupations by Sex in Mount Hermon
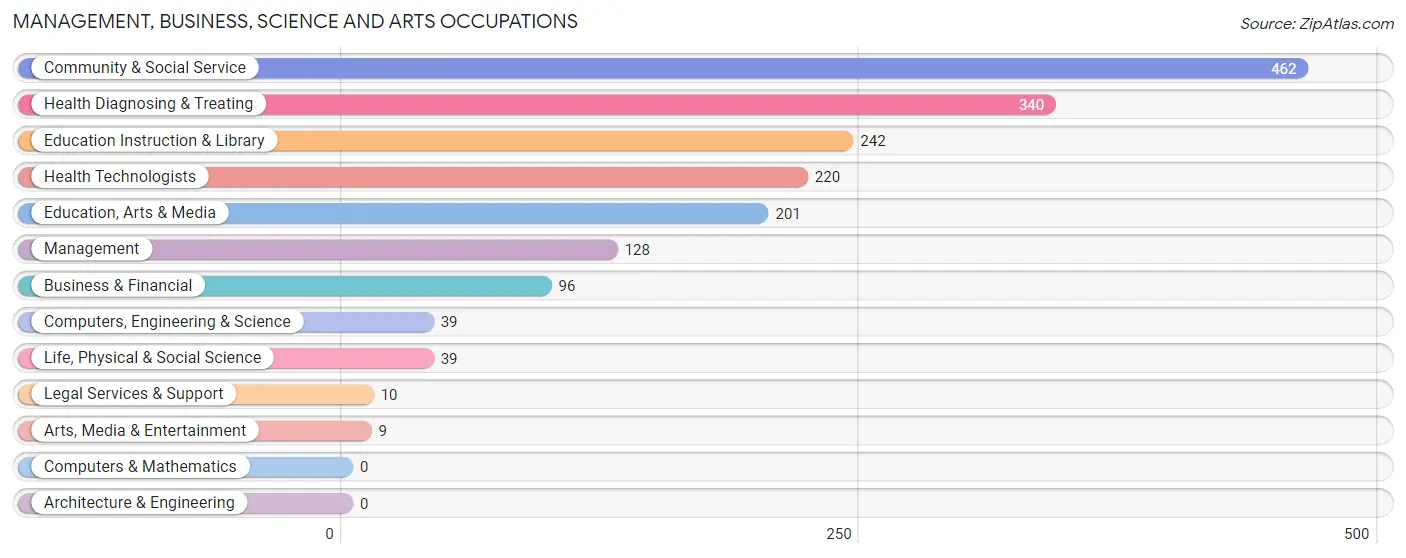
Management, Business, Science and Arts Occupations
The most common Management, Business, Science and Arts occupations in Mount Hermon are Community & Social Service (462 | 18.8%), Health Diagnosing & Treating (340 | 13.8%), Education Instruction & Library (242 | 9.9%), Health Technologists (220 | 9.0%), and Education, Arts & Media (201 | 8.2%).
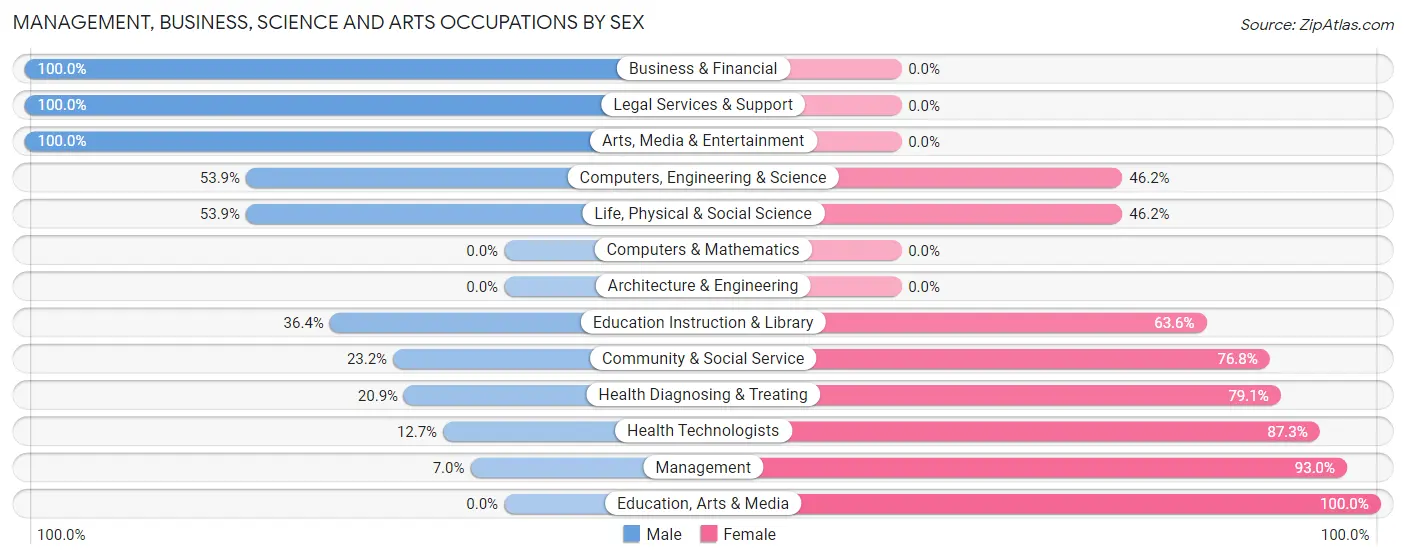
Management, Business, Science and Arts Occupations by Sex
Within the Management, Business, Science and Arts occupations in Mount Hermon, the most male-oriented occupations are Business & Financial (100.0%), Legal Services & Support (100.0%), and Arts, Media & Entertainment (100.0%), while the most female-oriented occupations are Education, Arts & Media (100.0%), Management (93.0%), and Health Technologists (87.3%).
| Occupation | Male | Female |
| Management | 9 (7.0%) | 119 (93.0%) |
| Business & Financial | 96 (100.0%) | 0 (0.0%) |
| Computers, Engineering & Science | 21 (53.8%) | 18 (46.2%) |
| Computers & Mathematics | 0 (0.0%) | 0 (0.0%) |
| Architecture & Engineering | 0 (0.0%) | 0 (0.0%) |
| Life, Physical & Social Science | 21 (53.8%) | 18 (46.2%) |
| Community & Social Service | 107 (23.2%) | 355 (76.8%) |
| Education, Arts & Media | 0 (0.0%) | 201 (100.0%) |
| Legal Services & Support | 10 (100.0%) | 0 (0.0%) |
| Education Instruction & Library | 88 (36.4%) | 154 (63.6%) |
| Arts, Media & Entertainment | 9 (100.0%) | 0 (0.0%) |
| Health Diagnosing & Treating | 71 (20.9%) | 269 (79.1%) |
| Health Technologists | 28 (12.7%) | 192 (87.3%) |
| Total (Category) | 304 (28.5%) | 761 (71.5%) |
| Total (Overall) | 1,150 (46.8%) | 1,306 (53.2%) |
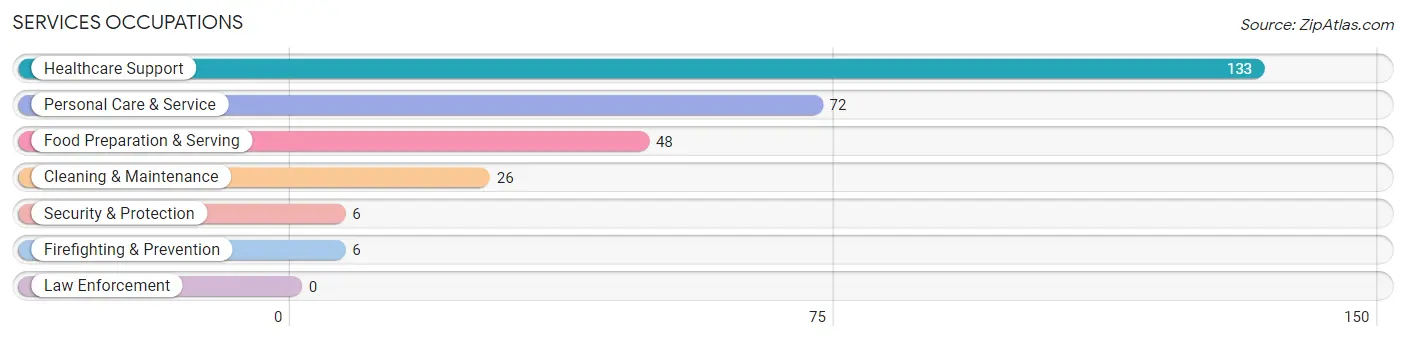
Services Occupations
The most common Services occupations in Mount Hermon are Healthcare Support (133 | 5.4%), Personal Care & Service (72 | 2.9%), Food Preparation & Serving (48 | 1.9%), Cleaning & Maintenance (26 | 1.1%), and Security & Protection (6 | 0.2%).
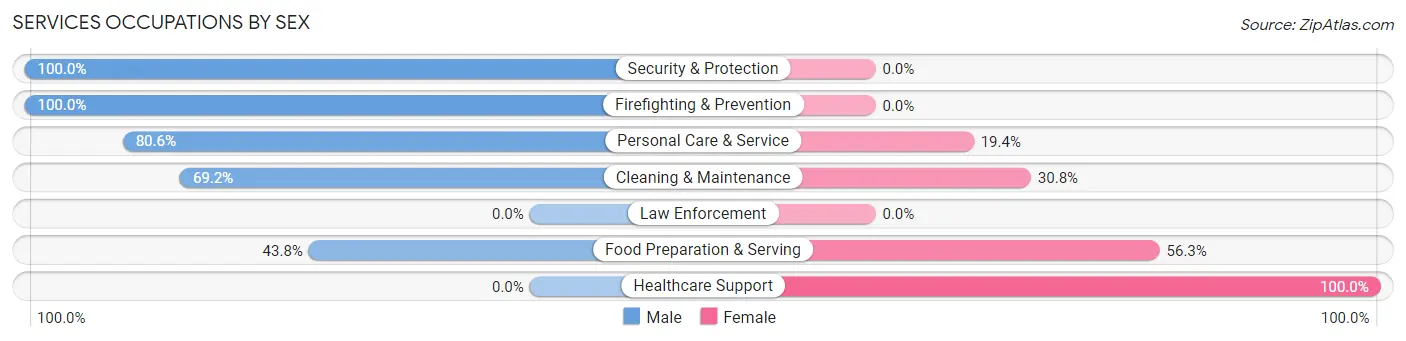
Services Occupations by Sex
Within the Services occupations in Mount Hermon, the most male-oriented occupations are Security & Protection (100.0%), Firefighting & Prevention (100.0%), and Personal Care & Service (80.6%), while the most female-oriented occupations are Healthcare Support (100.0%), Food Preparation & Serving (56.2%), and Cleaning & Maintenance (30.8%).
| Occupation | Male | Female |
| Healthcare Support | 0 (0.0%) | 133 (100.0%) |
| Security & Protection | 6 (100.0%) | 0 (0.0%) |
| Firefighting & Prevention | 6 (100.0%) | 0 (0.0%) |
| Law Enforcement | 0 (0.0%) | 0 (0.0%) |
| Food Preparation & Serving | 21 (43.8%) | 27 (56.2%) |
| Cleaning & Maintenance | 18 (69.2%) | 8 (30.8%) |
| Personal Care & Service | 58 (80.6%) | 14 (19.4%) |
| Total (Category) | 103 (36.1%) | 182 (63.9%) |
| Total (Overall) | 1,150 (46.8%) | 1,306 (53.2%) |
Sales and Office Occupations
The most common Sales and Office occupations in Mount Hermon are Sales & Related (334 | 13.6%), and Office & Administration (272 | 11.1%).
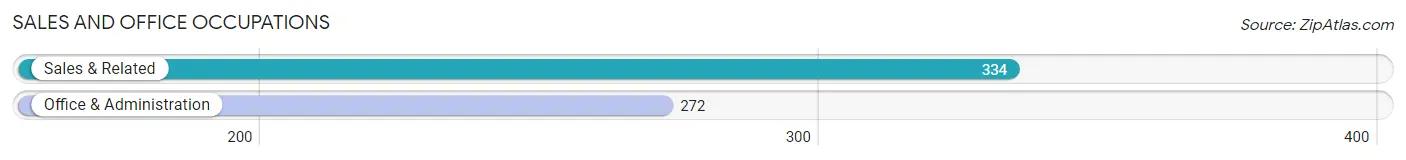
Sales and Office Occupations by Sex
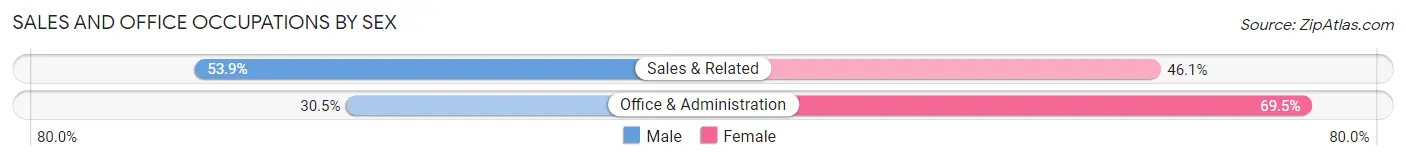
| Occupation | Male | Female |
| Sales & Related | 180 (53.9%) | 154 (46.1%) |
| Office & Administration | 83 (30.5%) | 189 (69.5%) |
| Total (Category) | 263 (43.4%) | 343 (56.6%) |
| Total (Overall) | 1,150 (46.8%) | 1,306 (53.2%) |
Natural Resources, Construction and Maintenance Occupations
The most common Natural Resources, Construction and Maintenance occupations in Mount Hermon are Installation, Maintenance & Repair (39 | 1.6%), and Construction & Extraction (24 | 1.0%).
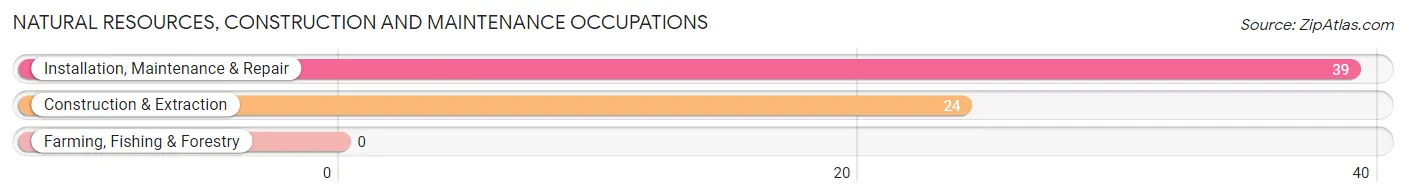
Natural Resources, Construction and Maintenance Occupations by Sex
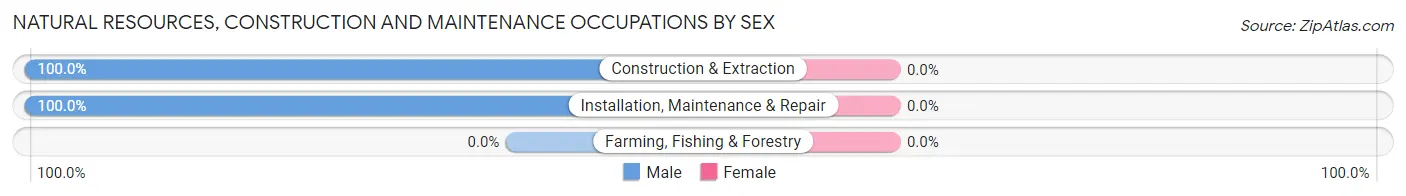
| Occupation | Male | Female |
| Farming, Fishing & Forestry | 0 (0.0%) | 0 (0.0%) |
| Construction & Extraction | 24 (100.0%) | 0 (0.0%) |
| Installation, Maintenance & Repair | 39 (100.0%) | 0 (0.0%) |
| Total (Category) | 63 (100.0%) | 0 (0.0%) |
| Total (Overall) | 1,150 (46.8%) | 1,306 (53.2%) |
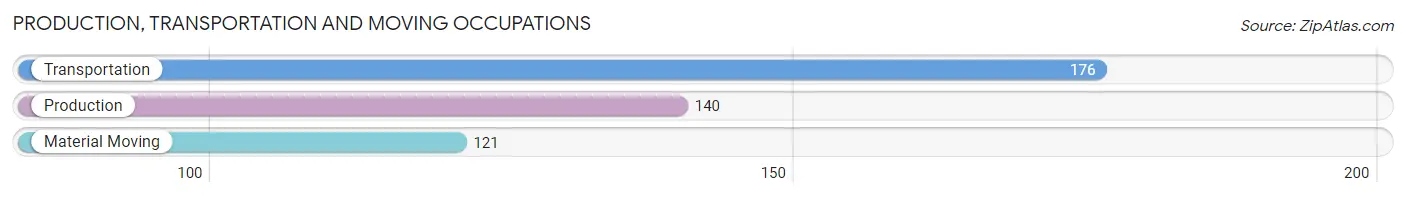
Production, Transportation and Moving Occupations
The most common Production, Transportation and Moving occupations in Mount Hermon are Transportation (176 | 7.2%), Production (140 | 5.7%), and Material Moving (121 | 4.9%).
Production, Transportation and Moving Occupations by Sex
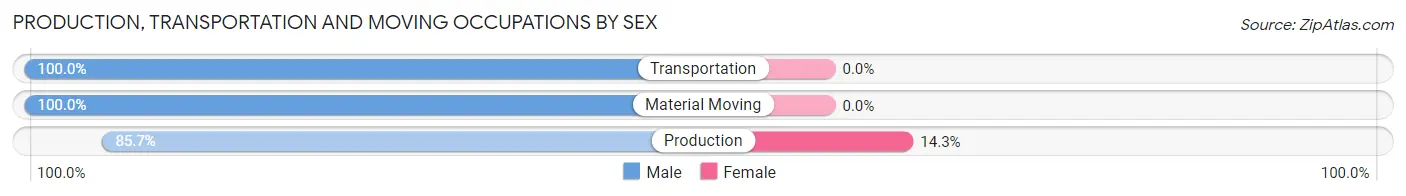
| Occupation | Male | Female |
| Production | 120 (85.7%) | 20 (14.3%) |
| Transportation | 176 (100.0%) | 0 (0.0%) |
| Material Moving | 121 (100.0%) | 0 (0.0%) |
| Total (Category) | 417 (95.4%) | 20 (4.6%) |
| Total (Overall) | 1,150 (46.8%) | 1,306 (53.2%) |
Employment Industries by Sex in Mount Hermon
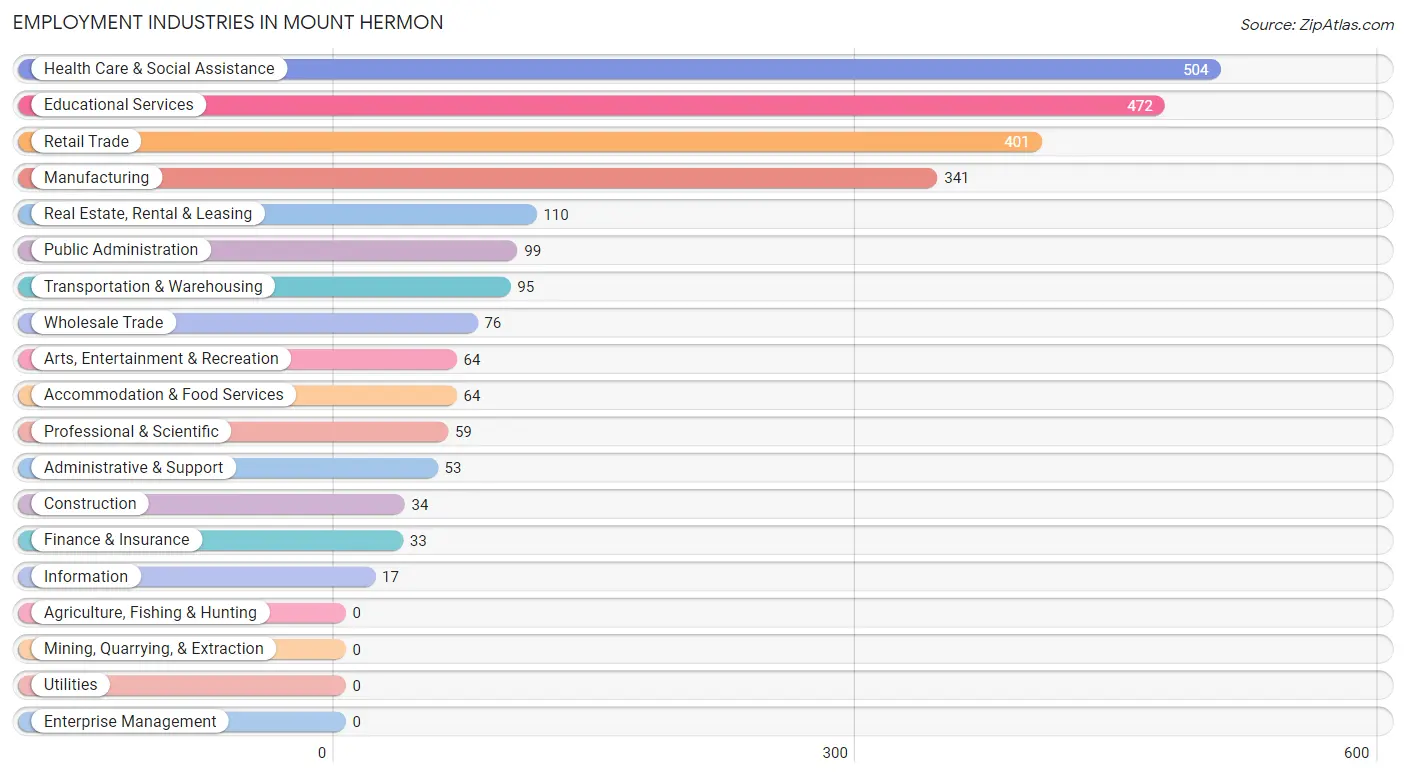
Employment Industries in Mount Hermon
The major employment industries in Mount Hermon include Health Care & Social Assistance (504 | 20.5%), Educational Services (472 | 19.2%), Retail Trade (401 | 16.3%), Manufacturing (341 | 13.9%), and Real Estate, Rental & Leasing (110 | 4.5%).
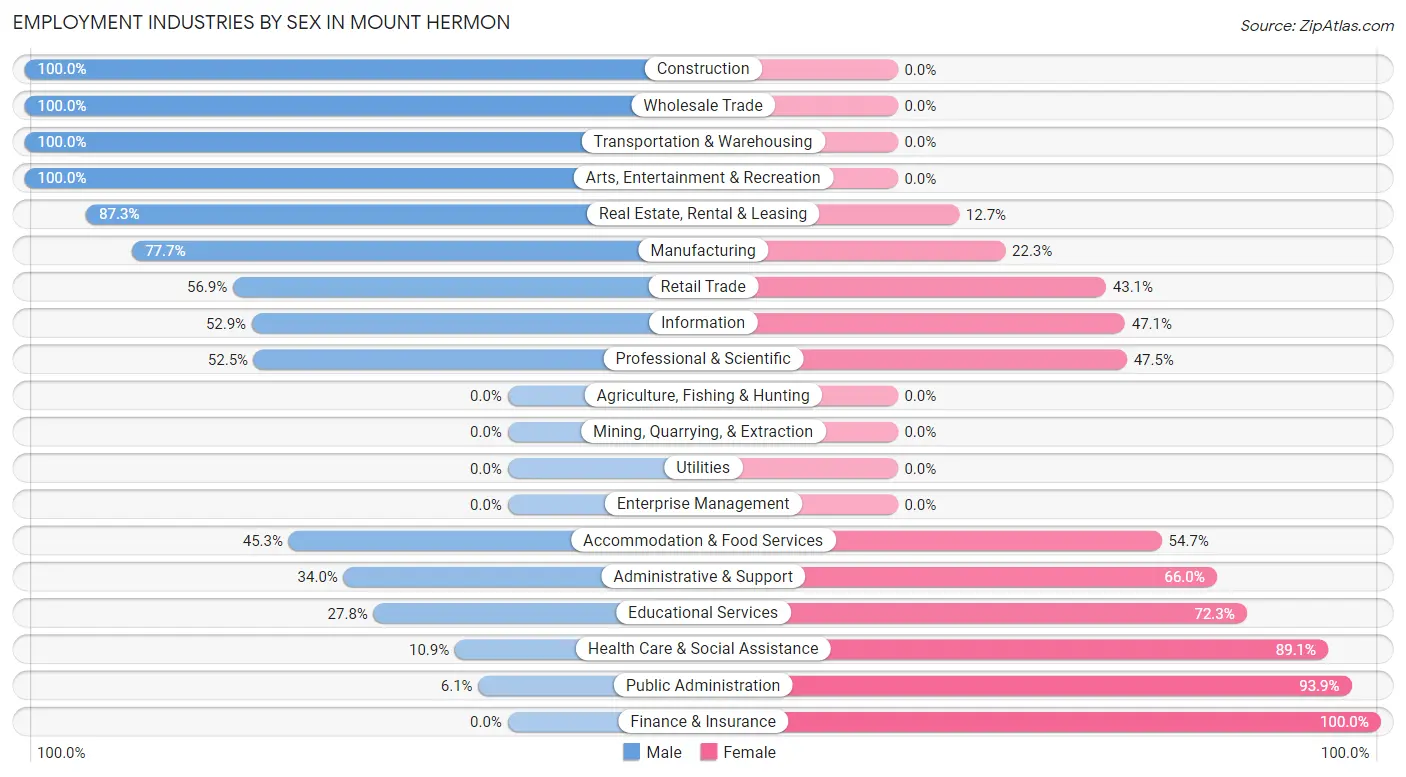
Employment Industries by Sex in Mount Hermon
The Mount Hermon industries that see more men than women are Construction (100.0%), Wholesale Trade (100.0%), and Transportation & Warehousing (100.0%), whereas the industries that tend to have a higher number of women are Finance & Insurance (100.0%), Public Administration (93.9%), and Health Care & Social Assistance (89.1%).
| Industry | Male | Female |
| Agriculture, Fishing & Hunting | 0 (0.0%) | 0 (0.0%) |
| Mining, Quarrying, & Extraction | 0 (0.0%) | 0 (0.0%) |
| Construction | 34 (100.0%) | 0 (0.0%) |
| Manufacturing | 265 (77.7%) | 76 (22.3%) |
| Wholesale Trade | 76 (100.0%) | 0 (0.0%) |
| Retail Trade | 228 (56.9%) | 173 (43.1%) |
| Transportation & Warehousing | 95 (100.0%) | 0 (0.0%) |
| Utilities | 0 (0.0%) | 0 (0.0%) |
| Information | 9 (52.9%) | 8 (47.1%) |
| Finance & Insurance | 0 (0.0%) | 33 (100.0%) |
| Real Estate, Rental & Leasing | 96 (87.3%) | 14 (12.7%) |
| Professional & Scientific | 31 (52.5%) | 28 (47.5%) |
| Enterprise Management | 0 (0.0%) | 0 (0.0%) |
| Administrative & Support | 18 (34.0%) | 35 (66.0%) |
| Educational Services | 131 (27.8%) | 341 (72.3%) |
| Health Care & Social Assistance | 55 (10.9%) | 449 (89.1%) |
| Arts, Entertainment & Recreation | 64 (100.0%) | 0 (0.0%) |
| Accommodation & Food Services | 29 (45.3%) | 35 (54.7%) |
| Public Administration | 6 (6.1%) | 93 (93.9%) |
| Total | 1,150 (46.8%) | 1,306 (53.2%) |
Education in Mount Hermon
School Enrollment in Mount Hermon
The most common levels of schooling among the 808 students in Mount Hermon are college / undergraduate (377 | 46.7%), high school (168 | 20.8%), and elementary school (93 | 11.5%).
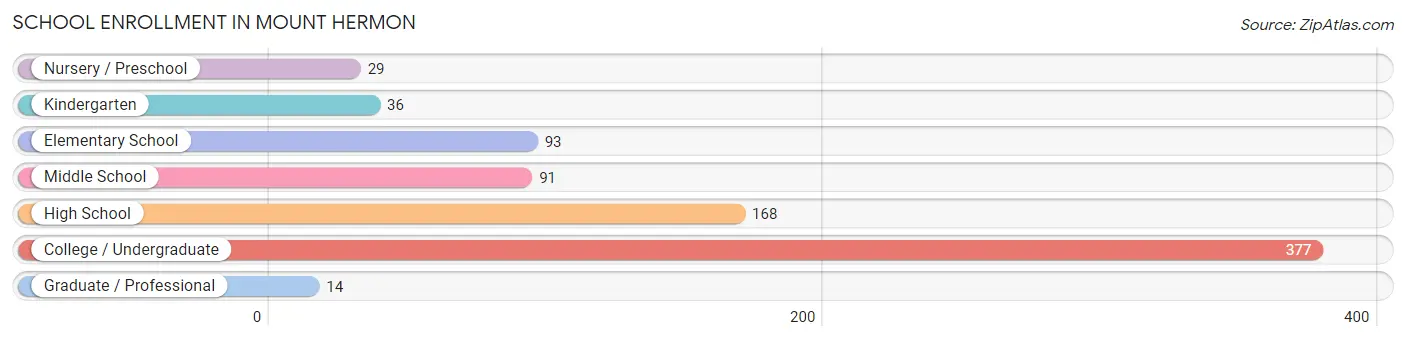
| School Level | # Students | % Students |
| Nursery / Preschool | 29 | 3.6% |
| Kindergarten | 36 | 4.5% |
| Elementary School | 93 | 11.5% |
| Middle School | 91 | 11.3% |
| High School | 168 | 20.8% |
| College / Undergraduate | 377 | 46.7% |
| Graduate / Professional | 14 | 1.7% |
| Total | 808 | 100.0% |
School Enrollment by Age by Funding Source in Mount Hermon
Out of a total of 808 students who are enrolled in schools in Mount Hermon, 71 (8.8%) attend a private institution, while the remaining 737 (91.2%) are enrolled in public schools. The age group of 35 years and over has the highest likelihood of being enrolled in private schools, with 14 (100.0% in the age bracket) enrolled. Conversely, the age group of 3 to 4 year olds has the lowest likelihood of being enrolled in a private school, with 29 (100.0% in the age bracket) attending a public institution.
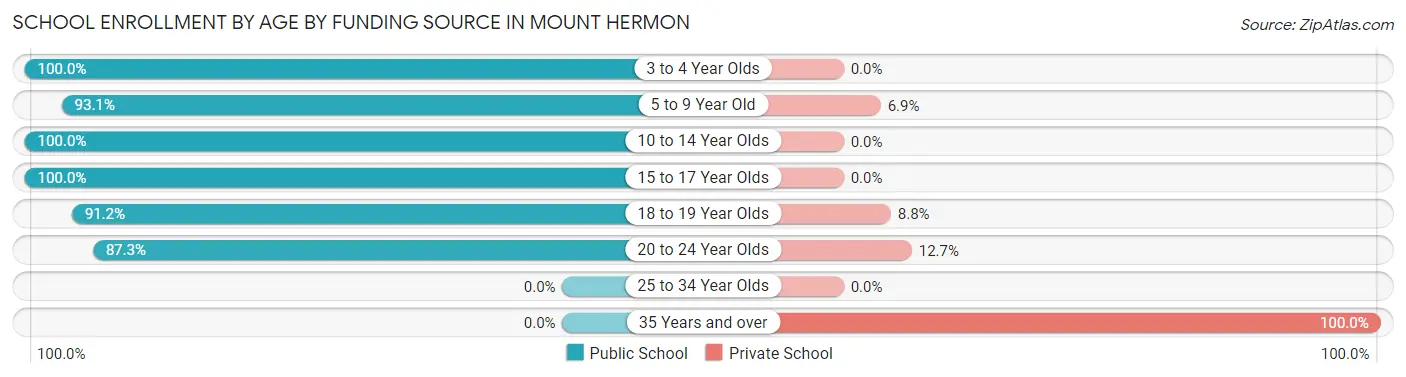
| Age Bracket | Public School | Private School |
| 3 to 4 Year Olds | 29 (100.0%) | 0 (0.0%) |
| 5 to 9 Year Old | 108 (93.1%) | 8 (6.9%) |
| 10 to 14 Year Olds | 147 (100.0%) | 0 (0.0%) |
| 15 to 17 Year Olds | 60 (100.0%) | 0 (0.0%) |
| 18 to 19 Year Olds | 166 (91.2%) | 16 (8.8%) |
| 20 to 24 Year Olds | 227 (87.3%) | 33 (12.7%) |
| 25 to 34 Year Olds | 0 (0.0%) | 0 (0.0%) |
| 35 Years and over | 0 (0.0%) | 14 (100.0%) |
| Total | 737 (91.2%) | 71 (8.8%) |
Educational Attainment by Field of Study in Mount Hermon
Education (287 | 24.6%), science & technology (282 | 24.2%), business (172 | 14.7%), psychology (157 | 13.5%), and social sciences (76 | 6.5%) are the most common fields of study among 1,167 individuals in Mount Hermon who have obtained a bachelor's degree or higher.
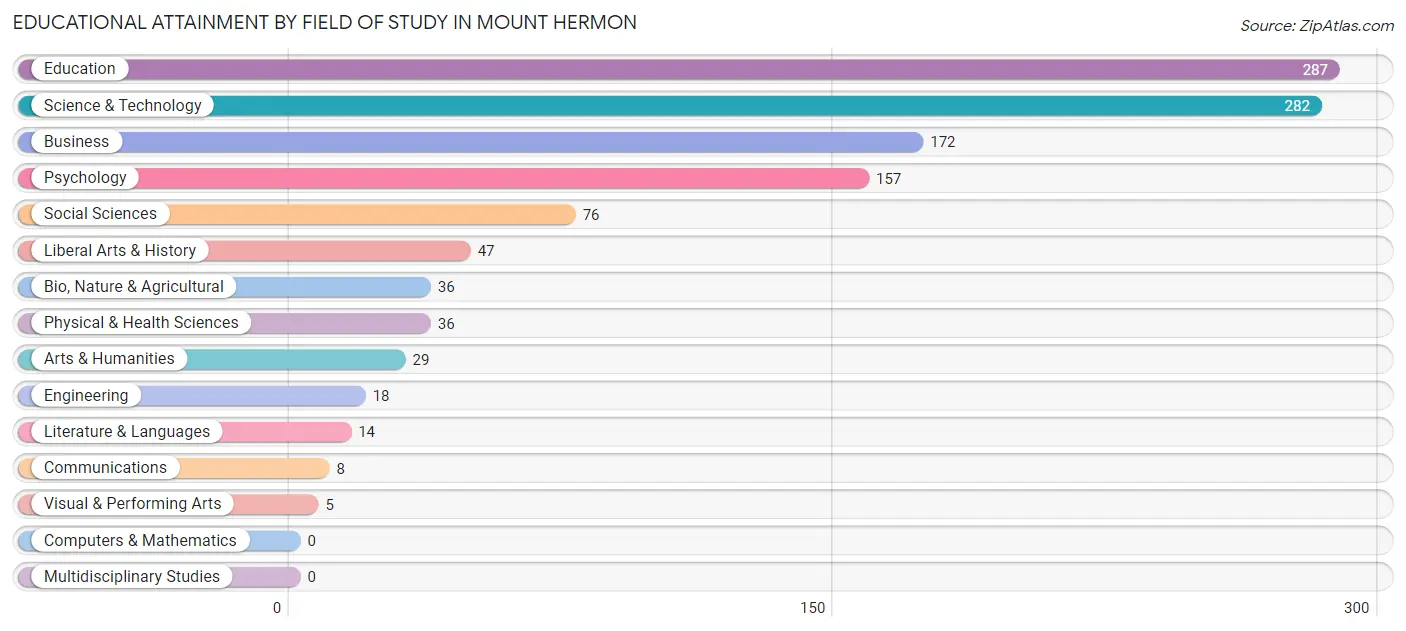
| Field of Study | # Graduates | % Graduates |
| Computers & Mathematics | 0 | 0.0% |
| Bio, Nature & Agricultural | 36 | 3.1% |
| Physical & Health Sciences | 36 | 3.1% |
| Psychology | 157 | 13.5% |
| Social Sciences | 76 | 6.5% |
| Engineering | 18 | 1.5% |
| Multidisciplinary Studies | 0 | 0.0% |
| Science & Technology | 282 | 24.2% |
| Business | 172 | 14.7% |
| Education | 287 | 24.6% |
| Literature & Languages | 14 | 1.2% |
| Liberal Arts & History | 47 | 4.0% |
| Visual & Performing Arts | 5 | 0.4% |
| Communications | 8 | 0.7% |
| Arts & Humanities | 29 | 2.5% |
| Total | 1,167 | 100.0% |
Transportation & Commute in Mount Hermon
Vehicle Availability by Sex in Mount Hermon
The most prevalent vehicle ownership categories in Mount Hermon are males with 2 vehicles (483, accounting for 42.0%) and females with 2 vehicles (521, making up 37.4%).
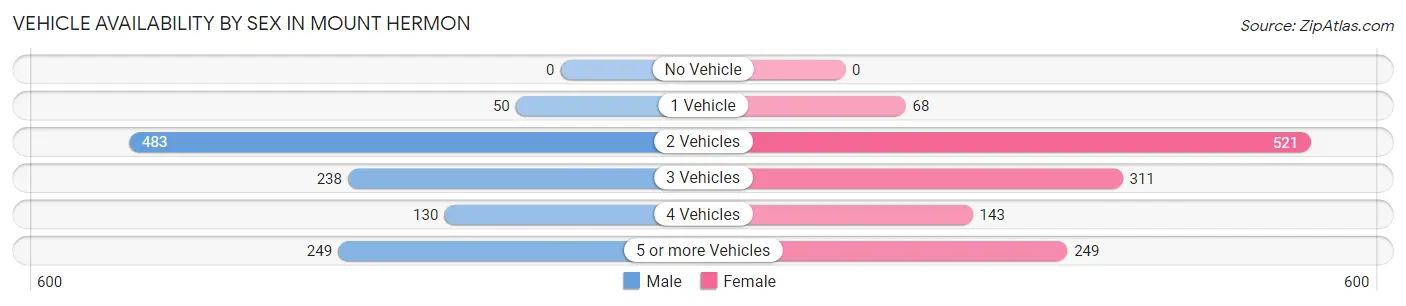
| Vehicles Available | Male | Female |
| No Vehicle | 0 (0.0%) | 0 (0.0%) |
| 1 Vehicle | 50 (4.3%) | 68 (5.3%) |
| 2 Vehicles | 483 (42.0%) | 521 (40.3%) |
| 3 Vehicles | 238 (20.7%) | 311 (24.1%) |
| 4 Vehicles | 130 (11.3%) | 143 (11.1%) |
| 5 or more Vehicles | 249 (21.6%) | 249 (19.3%) |
| Total | 1,150 (100.0%) | 1,292 (100.0%) |
Commute Time in Mount Hermon
The most frequently occuring commute durations in Mount Hermon are 15 to 19 minutes (715 commuters, 32.7%), 20 to 24 minutes (470 commuters, 21.5%), and 25 to 29 minutes (276 commuters, 12.6%).
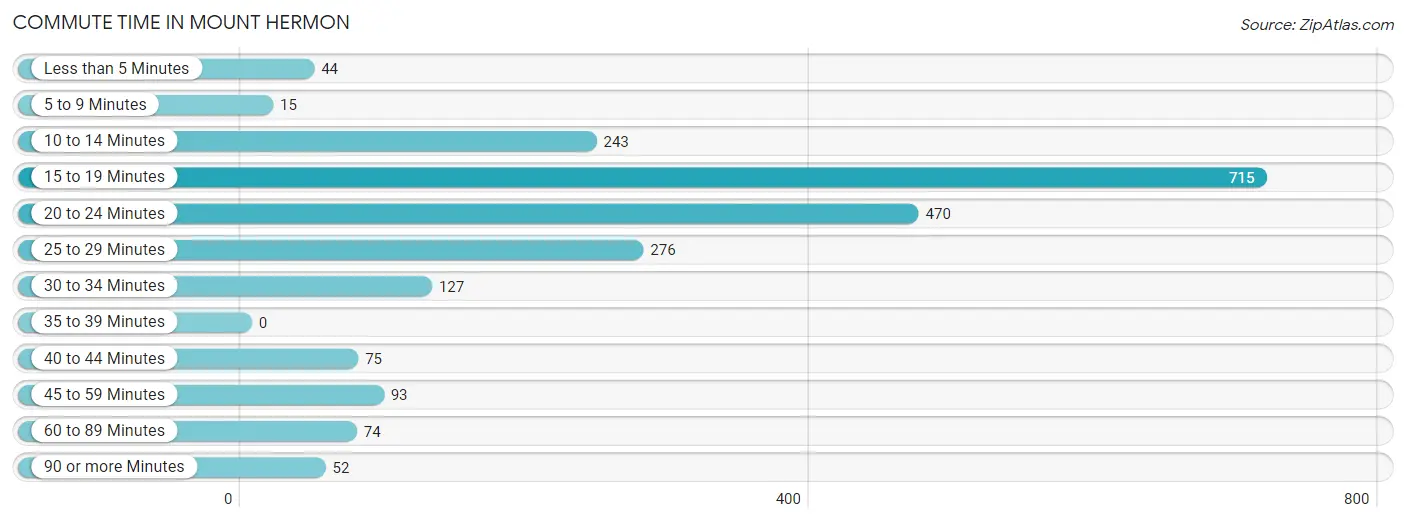
| Commute Time | # Commuters | % Commuters |
| Less than 5 Minutes | 44 | 2.0% |
| 5 to 9 Minutes | 15 | 0.7% |
| 10 to 14 Minutes | 243 | 11.1% |
| 15 to 19 Minutes | 715 | 32.7% |
| 20 to 24 Minutes | 470 | 21.5% |
| 25 to 29 Minutes | 276 | 12.6% |
| 30 to 34 Minutes | 127 | 5.8% |
| 35 to 39 Minutes | 0 | 0.0% |
| 40 to 44 Minutes | 75 | 3.4% |
| 45 to 59 Minutes | 93 | 4.3% |
| 60 to 89 Minutes | 74 | 3.4% |
| 90 or more Minutes | 52 | 2.4% |
Commute Time by Sex in Mount Hermon
The most common commute times in Mount Hermon are 15 to 19 minutes (302 commuters, 29.0%) for males and 15 to 19 minutes (413 commuters, 36.1%) for females.
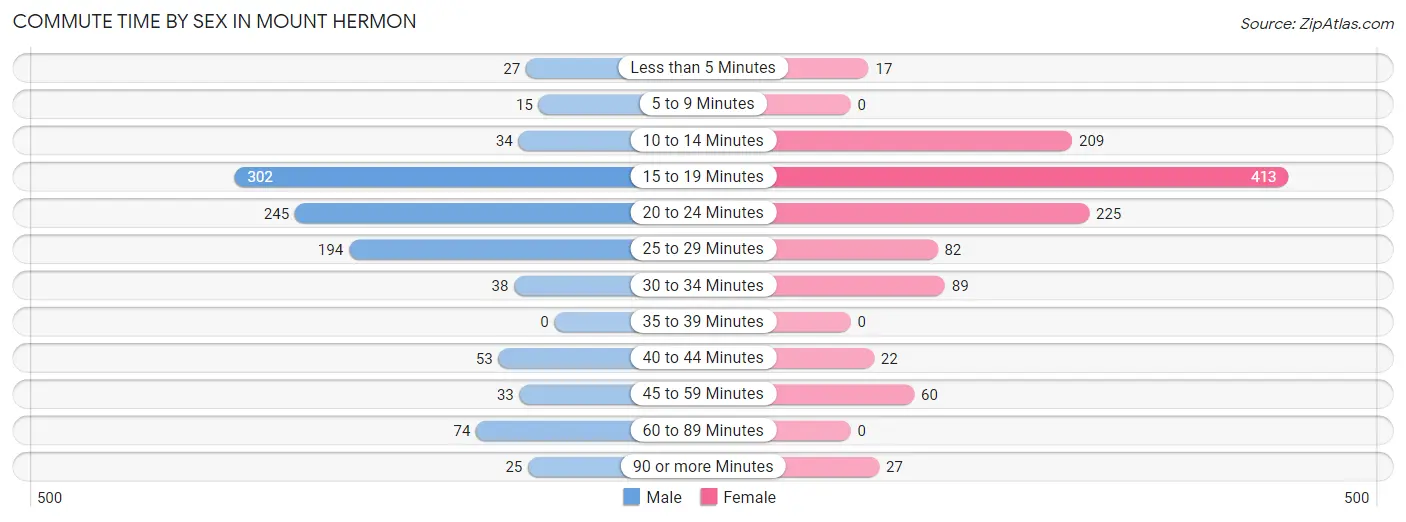
| Commute Time | Male | Female |
| Less than 5 Minutes | 27 (2.6%) | 17 (1.5%) |
| 5 to 9 Minutes | 15 (1.4%) | 0 (0.0%) |
| 10 to 14 Minutes | 34 (3.3%) | 209 (18.3%) |
| 15 to 19 Minutes | 302 (29.0%) | 413 (36.1%) |
| 20 to 24 Minutes | 245 (23.6%) | 225 (19.7%) |
| 25 to 29 Minutes | 194 (18.6%) | 82 (7.2%) |
| 30 to 34 Minutes | 38 (3.6%) | 89 (7.8%) |
| 35 to 39 Minutes | 0 (0.0%) | 0 (0.0%) |
| 40 to 44 Minutes | 53 (5.1%) | 22 (1.9%) |
| 45 to 59 Minutes | 33 (3.2%) | 60 (5.2%) |
| 60 to 89 Minutes | 74 (7.1%) | 0 (0.0%) |
| 90 or more Minutes | 25 (2.4%) | 27 (2.4%) |
Time of Departure to Work by Sex in Mount Hermon
The most frequent times of departure to work in Mount Hermon are 4:00 PM to 11:59 PM (244, 23.5%) for males and 7:30 AM to 7:59 AM (273, 23.9%) for females.
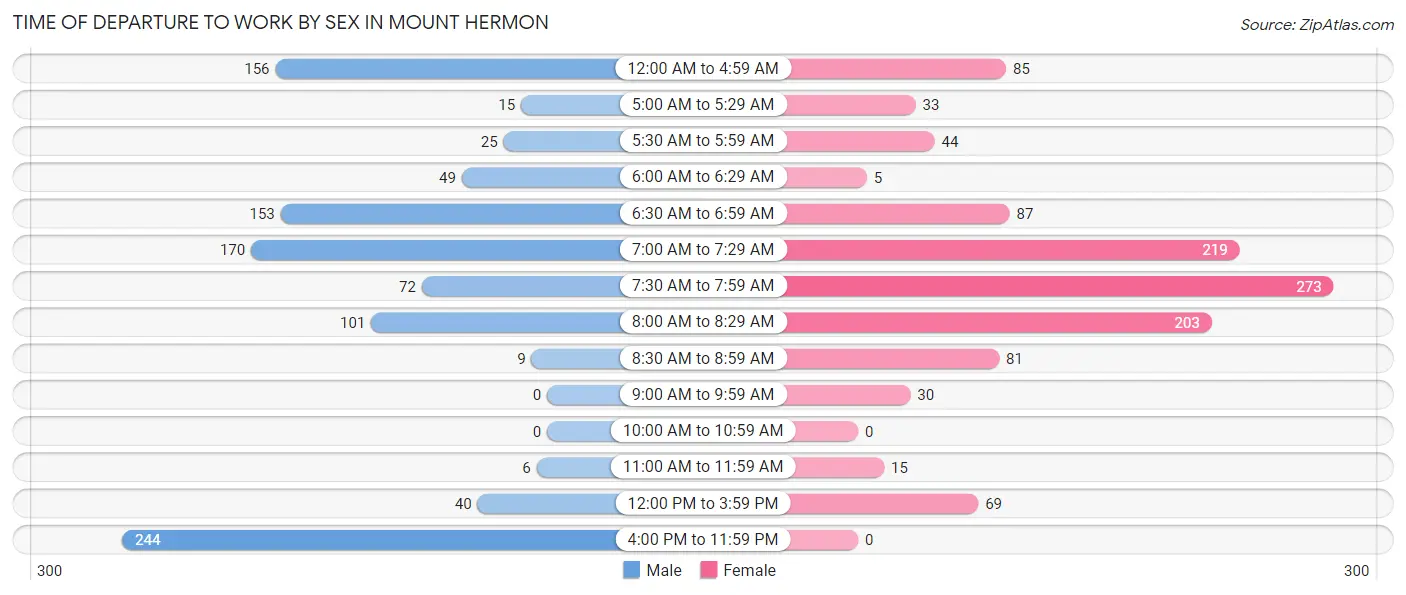
| Time of Departure | Male | Female |
| 12:00 AM to 4:59 AM | 156 (15.0%) | 85 (7.4%) |
| 5:00 AM to 5:29 AM | 15 (1.4%) | 33 (2.9%) |
| 5:30 AM to 5:59 AM | 25 (2.4%) | 44 (3.8%) |
| 6:00 AM to 6:29 AM | 49 (4.7%) | 5 (0.4%) |
| 6:30 AM to 6:59 AM | 153 (14.7%) | 87 (7.6%) |
| 7:00 AM to 7:29 AM | 170 (16.4%) | 219 (19.1%) |
| 7:30 AM to 7:59 AM | 72 (6.9%) | 273 (23.9%) |
| 8:00 AM to 8:29 AM | 101 (9.7%) | 203 (17.7%) |
| 8:30 AM to 8:59 AM | 9 (0.9%) | 81 (7.1%) |
| 9:00 AM to 9:59 AM | 0 (0.0%) | 30 (2.6%) |
| 10:00 AM to 10:59 AM | 0 (0.0%) | 0 (0.0%) |
| 11:00 AM to 11:59 AM | 6 (0.6%) | 15 (1.3%) |
| 12:00 PM to 3:59 PM | 40 (3.8%) | 69 (6.0%) |
| 4:00 PM to 11:59 PM | 244 (23.5%) | 0 (0.0%) |
| Total | 1,040 (100.0%) | 1,144 (100.0%) |
Housing Occupancy in Mount Hermon
Occupancy by Ownership in Mount Hermon
Of the total 1,758 dwellings in Mount Hermon, owner-occupied units account for 1,377 (78.3%), while renter-occupied units make up 381 (21.7%).
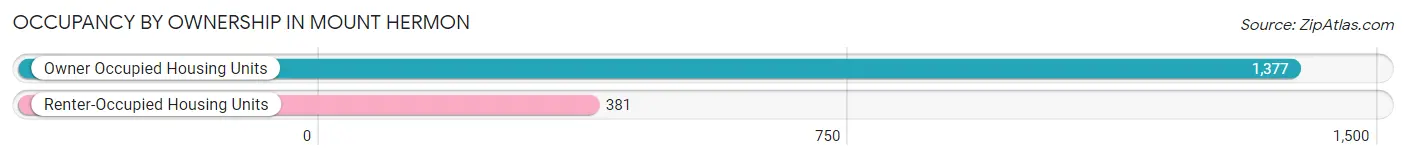
| Occupancy | # Housing Units | % Housing Units |
| Owner Occupied Housing Units | 1,377 | 78.3% |
| Renter-Occupied Housing Units | 381 | 21.7% |
| Total Occupied Housing Units | 1,758 | 100.0% |
Occupancy by Household Size in Mount Hermon
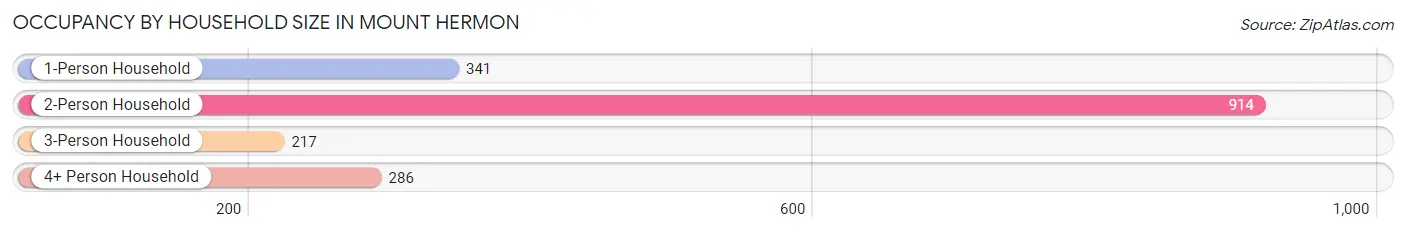
| Household Size | # Housing Units | % Housing Units |
| 1-Person Household | 341 | 19.4% |
| 2-Person Household | 914 | 52.0% |
| 3-Person Household | 217 | 12.3% |
| 4+ Person Household | 286 | 16.3% |
| Total Housing Units | 1,758 | 100.0% |
Occupancy by Ownership by Household Size in Mount Hermon
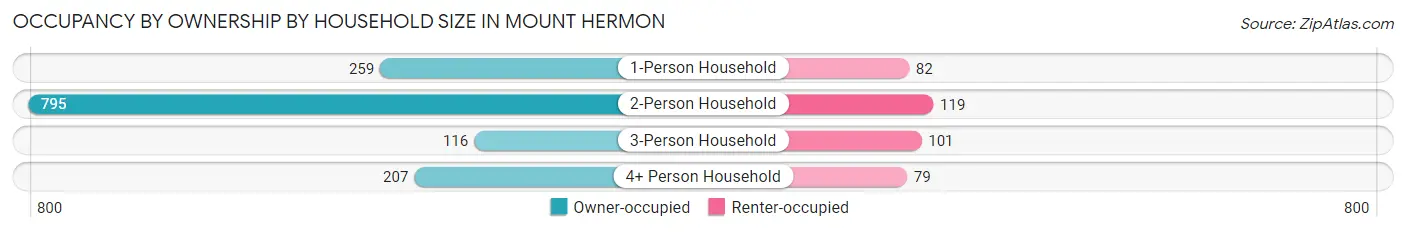
| Household Size | Owner-occupied | Renter-occupied |
| 1-Person Household | 259 (75.9%) | 82 (24.0%) |
| 2-Person Household | 795 (87.0%) | 119 (13.0%) |
| 3-Person Household | 116 (53.5%) | 101 (46.5%) |
| 4+ Person Household | 207 (72.4%) | 79 (27.6%) |
| Total Housing Units | 1,377 (78.3%) | 381 (21.7%) |
Occupancy by Educational Attainment in Mount Hermon
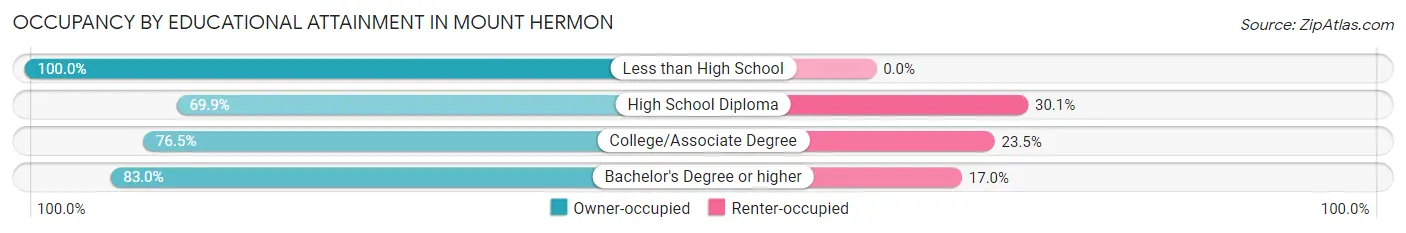
| Household Size | Owner-occupied | Renter-occupied |
| Less than High School | 71 (100.0%) | 0 (0.0%) |
| High School Diploma | 304 (69.9%) | 131 (30.1%) |
| College/Associate Degree | 440 (76.5%) | 135 (23.5%) |
| Bachelor's Degree or higher | 562 (83.0%) | 115 (17.0%) |
Occupancy by Age of Householder in Mount Hermon
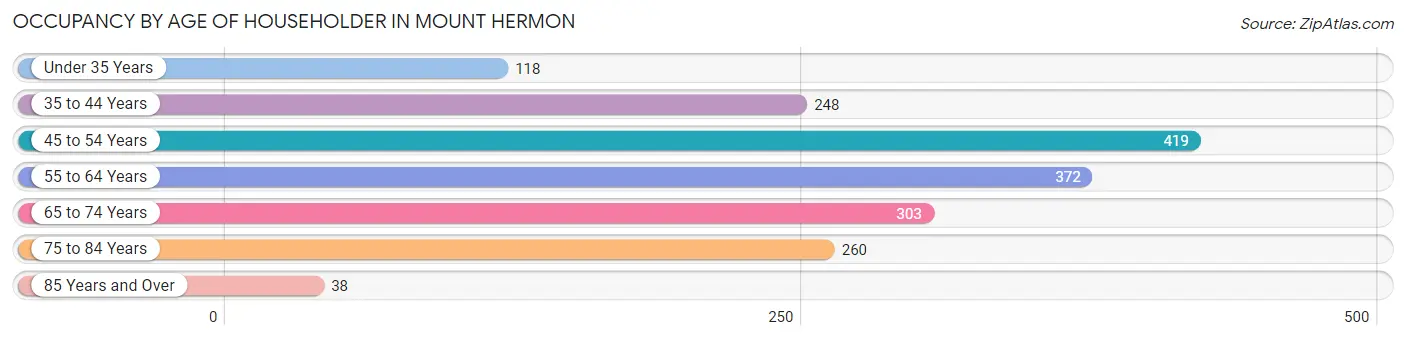
| Age Bracket | # Households | % Households |
| Under 35 Years | 118 | 6.7% |
| 35 to 44 Years | 248 | 14.1% |
| 45 to 54 Years | 419 | 23.8% |
| 55 to 64 Years | 372 | 21.2% |
| 65 to 74 Years | 303 | 17.2% |
| 75 to 84 Years | 260 | 14.8% |
| 85 Years and Over | 38 | 2.2% |
| Total | 1,758 | 100.0% |
Housing Finances in Mount Hermon
Median Income by Occupancy in Mount Hermon
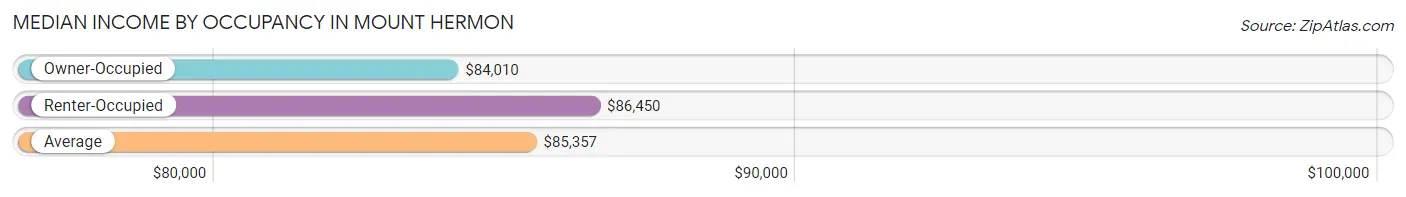
| Occupancy Type | # Households | Median Income |
| Owner-Occupied | 1,377 (78.3%) | $84,010 |
| Renter-Occupied | 381 (21.7%) | $86,450 |
| Average | 1,758 (100.0%) | $85,357 |
Occupancy by Householder Income Bracket in Mount Hermon
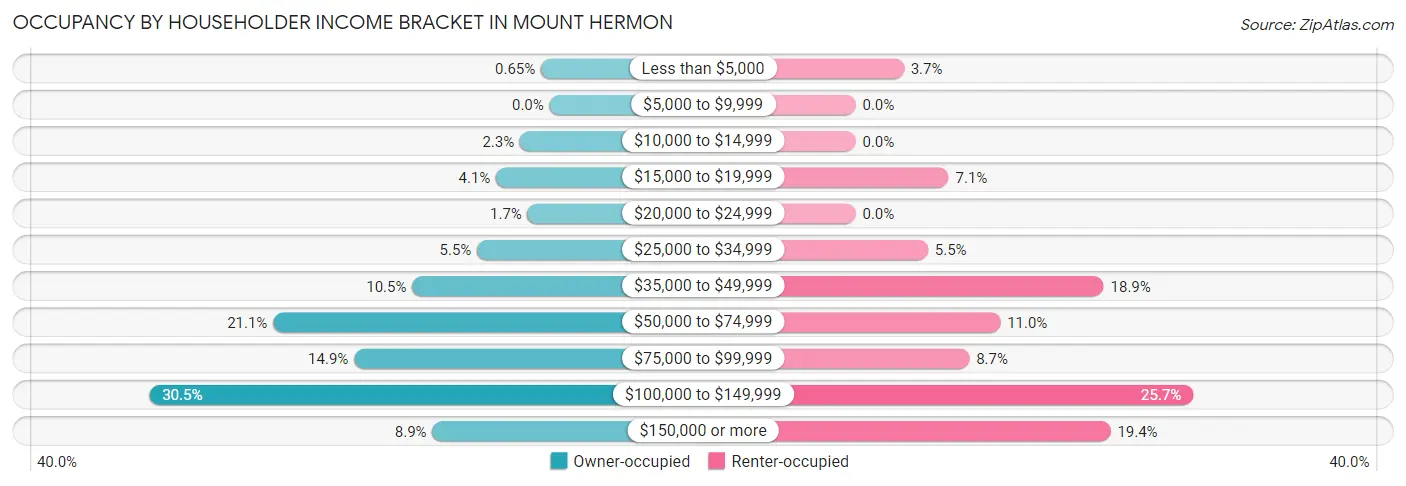
| Income Bracket | Owner-occupied | Renter-occupied |
| Less than $5,000 | 9 (0.6%) | 14 (3.7%) |
| $5,000 to $9,999 | 0 (0.0%) | 0 (0.0%) |
| $10,000 to $14,999 | 31 (2.2%) | 0 (0.0%) |
| $15,000 to $19,999 | 56 (4.1%) | 27 (7.1%) |
| $20,000 to $24,999 | 23 (1.7%) | 0 (0.0%) |
| $25,000 to $34,999 | 76 (5.5%) | 21 (5.5%) |
| $35,000 to $49,999 | 144 (10.5%) | 72 (18.9%) |
| $50,000 to $74,999 | 290 (21.1%) | 42 (11.0%) |
| $75,000 to $99,999 | 205 (14.9%) | 33 (8.7%) |
| $100,000 to $149,999 | 420 (30.5%) | 98 (25.7%) |
| $150,000 or more | 123 (8.9%) | 74 (19.4%) |
| Total | 1,377 (100.0%) | 381 (100.0%) |
Monthly Housing Cost Tiers in Mount Hermon
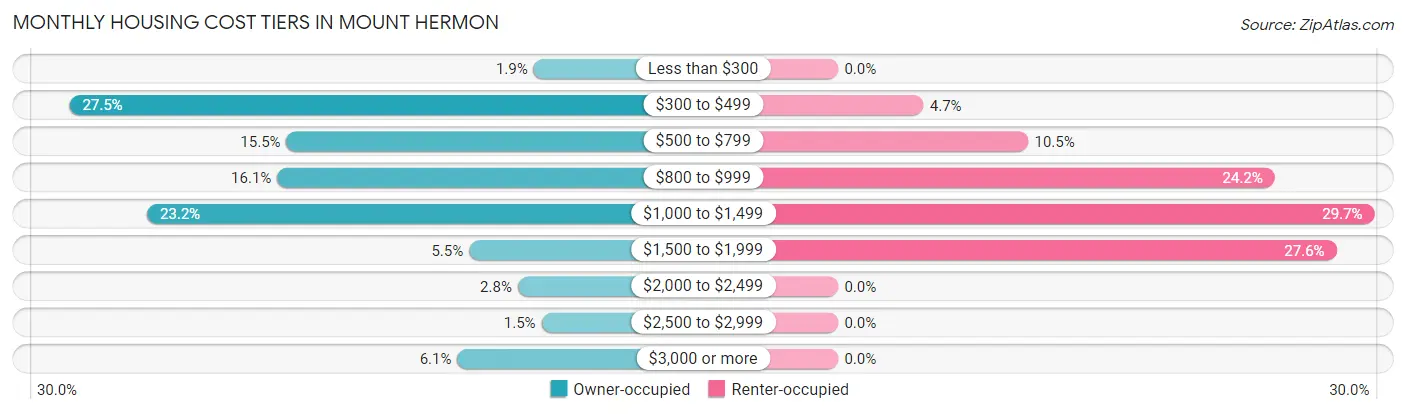
| Monthly Cost | Owner-occupied | Renter-occupied |
| Less than $300 | 26 (1.9%) | 0 (0.0%) |
| $300 to $499 | 379 (27.5%) | 18 (4.7%) |
| $500 to $799 | 214 (15.5%) | 40 (10.5%) |
| $800 to $999 | 221 (16.1%) | 92 (24.1%) |
| $1,000 to $1,499 | 320 (23.2%) | 113 (29.7%) |
| $1,500 to $1,999 | 75 (5.4%) | 105 (27.6%) |
| $2,000 to $2,499 | 38 (2.8%) | 0 (0.0%) |
| $2,500 to $2,999 | 20 (1.5%) | 0 (0.0%) |
| $3,000 or more | 84 (6.1%) | 0 (0.0%) |
| Total | 1,377 (100.0%) | 381 (100.0%) |
Physical Housing Characteristics in Mount Hermon
Housing Structures in Mount Hermon
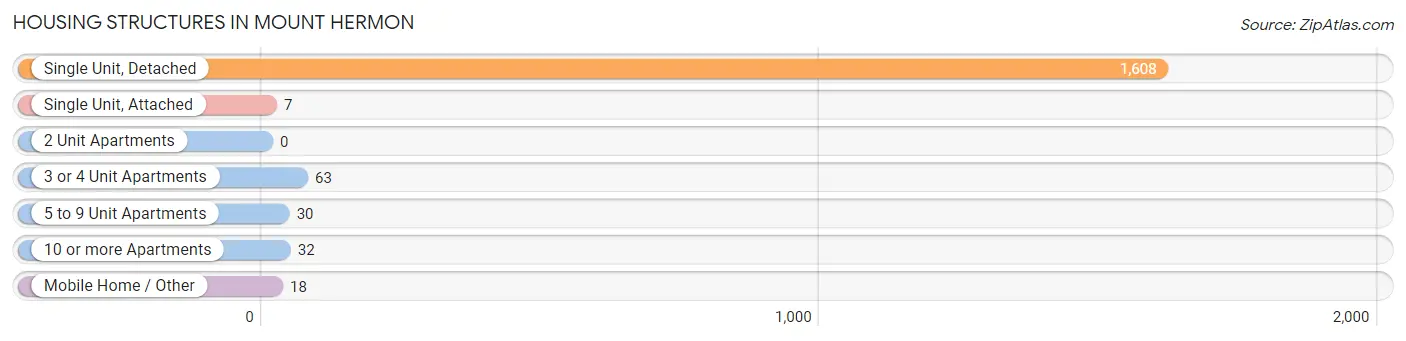
| Structure Type | # Housing Units | % Housing Units |
| Single Unit, Detached | 1,608 | 91.5% |
| Single Unit, Attached | 7 | 0.4% |
| 2 Unit Apartments | 0 | 0.0% |
| 3 or 4 Unit Apartments | 63 | 3.6% |
| 5 to 9 Unit Apartments | 30 | 1.7% |
| 10 or more Apartments | 32 | 1.8% |
| Mobile Home / Other | 18 | 1.0% |
| Total | 1,758 | 100.0% |
Housing Structures by Occupancy in Mount Hermon
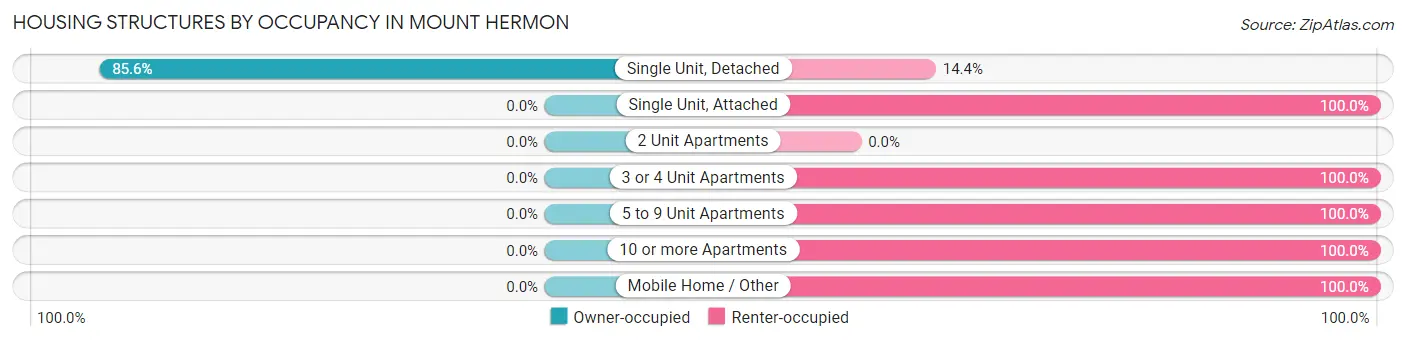
| Structure Type | Owner-occupied | Renter-occupied |
| Single Unit, Detached | 1,377 (85.6%) | 231 (14.4%) |
| Single Unit, Attached | 0 (0.0%) | 7 (100.0%) |
| 2 Unit Apartments | 0 (0.0%) | 0 (0.0%) |
| 3 or 4 Unit Apartments | 0 (0.0%) | 63 (100.0%) |
| 5 to 9 Unit Apartments | 0 (0.0%) | 30 (100.0%) |
| 10 or more Apartments | 0 (0.0%) | 32 (100.0%) |
| Mobile Home / Other | 0 (0.0%) | 18 (100.0%) |
| Total | 1,377 (78.3%) | 381 (21.7%) |
Housing Structures by Number of Rooms in Mount Hermon
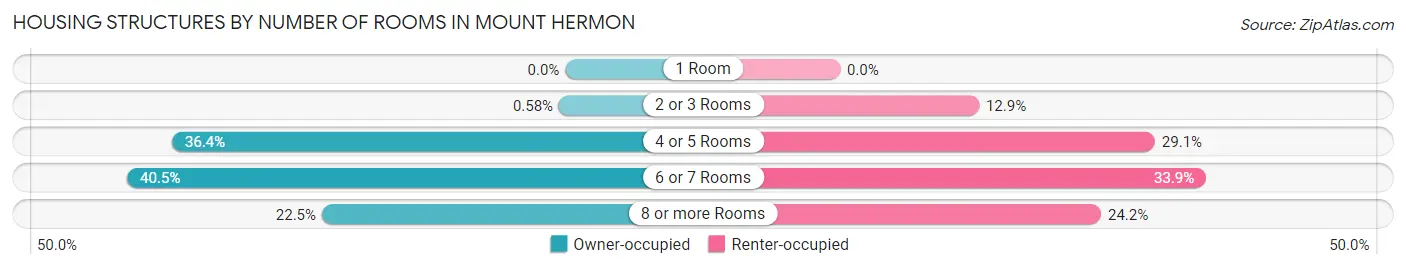
| Number of Rooms | Owner-occupied | Renter-occupied |
| 1 Room | 0 (0.0%) | 0 (0.0%) |
| 2 or 3 Rooms | 8 (0.6%) | 49 (12.9%) |
| 4 or 5 Rooms | 501 (36.4%) | 111 (29.1%) |
| 6 or 7 Rooms | 558 (40.5%) | 129 (33.9%) |
| 8 or more Rooms | 310 (22.5%) | 92 (24.1%) |
| Total | 1,377 (100.0%) | 381 (100.0%) |
Housing Structure by Heating Type in Mount Hermon
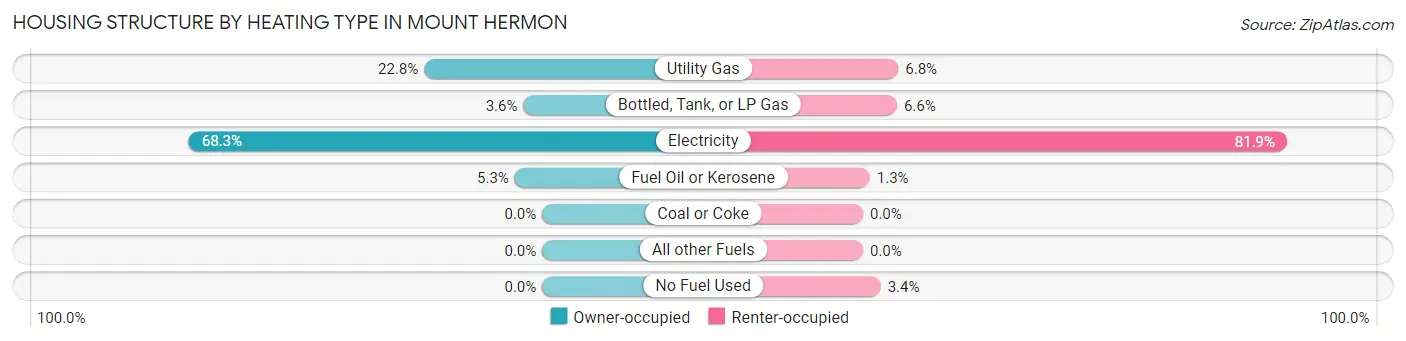
| Heating Type | Owner-occupied | Renter-occupied |
| Utility Gas | 314 (22.8%) | 26 (6.8%) |
| Bottled, Tank, or LP Gas | 50 (3.6%) | 25 (6.6%) |
| Electricity | 940 (68.3%) | 312 (81.9%) |
| Fuel Oil or Kerosene | 73 (5.3%) | 5 (1.3%) |
| Coal or Coke | 0 (0.0%) | 0 (0.0%) |
| All other Fuels | 0 (0.0%) | 0 (0.0%) |
| No Fuel Used | 0 (0.0%) | 13 (3.4%) |
| Total | 1,377 (100.0%) | 381 (100.0%) |
Household Vehicle Usage in Mount Hermon
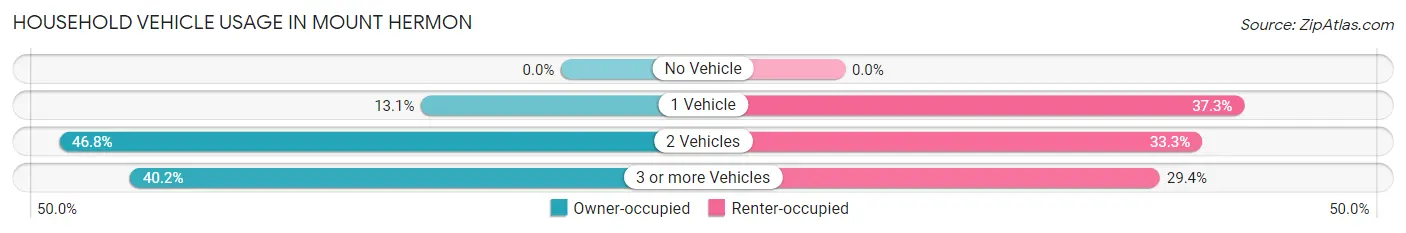
| Vehicles per Household | Owner-occupied | Renter-occupied |
| No Vehicle | 0 (0.0%) | 0 (0.0%) |
| 1 Vehicle | 180 (13.1%) | 142 (37.3%) |
| 2 Vehicles | 644 (46.8%) | 127 (33.3%) |
| 3 or more Vehicles | 553 (40.2%) | 112 (29.4%) |
| Total | 1,377 (100.0%) | 381 (100.0%) |
Real Estate & Mortgages in Mount Hermon
Real Estate and Mortgage Overview in Mount Hermon
| Characteristic | Without Mortgage | With Mortgage |
| Housing Units | 572 | 805 |
| Median Property Value | $172,400 | $168,800 |
| Median Household Income | $65,357 | $81 |
| Monthly Housing Costs | $435 | $84 |
| Real Estate Taxes | $937 | $14 |
Property Value by Mortgage Status in Mount Hermon
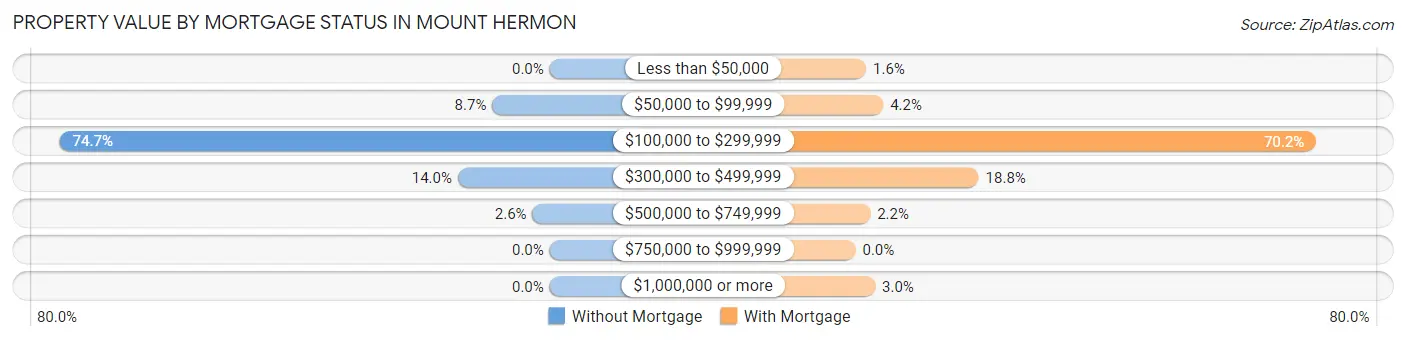
| Property Value | Without Mortgage | With Mortgage |
| Less than $50,000 | 0 (0.0%) | 13 (1.6%) |
| $50,000 to $99,999 | 50 (8.7%) | 34 (4.2%) |
| $100,000 to $299,999 | 427 (74.7%) | 565 (70.2%) |
| $300,000 to $499,999 | 80 (14.0%) | 151 (18.8%) |
| $500,000 to $749,999 | 15 (2.6%) | 18 (2.2%) |
| $750,000 to $999,999 | 0 (0.0%) | 0 (0.0%) |
| $1,000,000 or more | 0 (0.0%) | 24 (3.0%) |
| Total | 572 (100.0%) | 805 (100.0%) |
Household Income by Mortgage Status in Mount Hermon
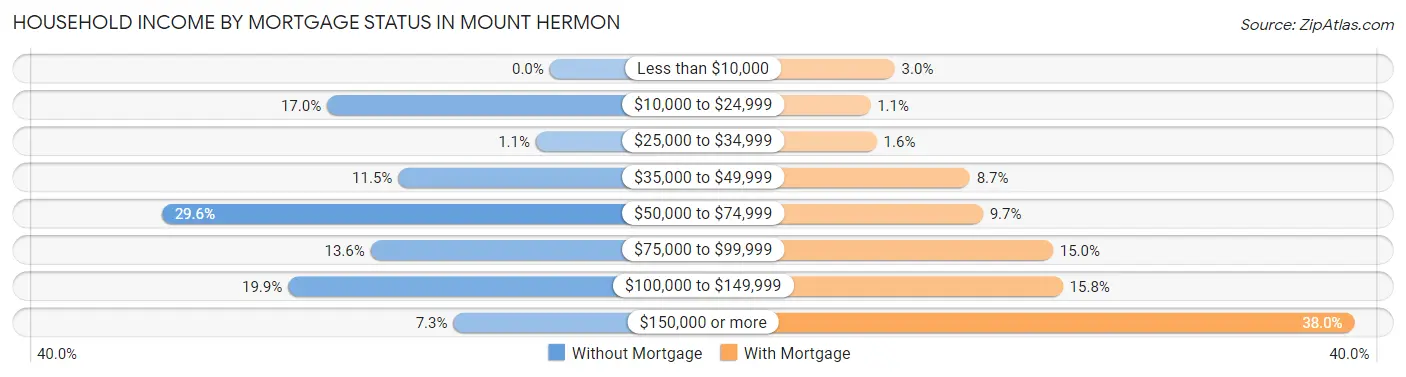
| Household Income | Without Mortgage | With Mortgage |
| Less than $10,000 | 0 (0.0%) | 24 (3.0%) |
| $10,000 to $24,999 | 97 (17.0%) | 9 (1.1%) |
| $25,000 to $34,999 | 6 (1.1%) | 13 (1.6%) |
| $35,000 to $49,999 | 66 (11.5%) | 70 (8.7%) |
| $50,000 to $74,999 | 169 (29.5%) | 78 (9.7%) |
| $75,000 to $99,999 | 78 (13.6%) | 121 (15.0%) |
| $100,000 to $149,999 | 114 (19.9%) | 127 (15.8%) |
| $150,000 or more | 42 (7.3%) | 306 (38.0%) |
| Total | 572 (100.0%) | 805 (100.0%) |
Property Value to Household Income Ratio in Mount Hermon
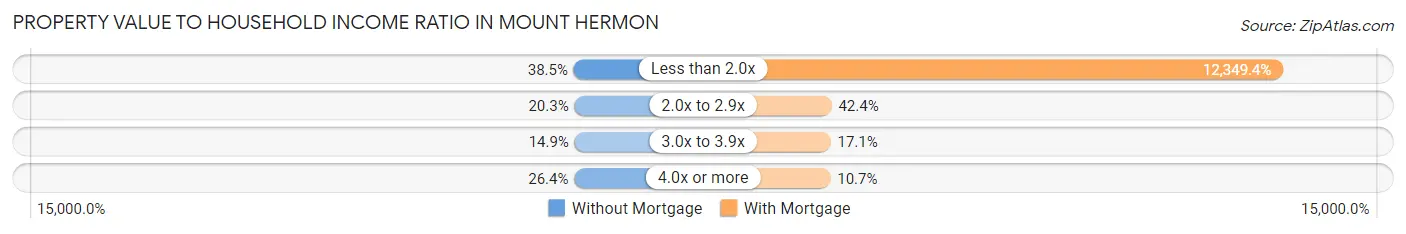
| Value-to-Income Ratio | Without Mortgage | With Mortgage |
| Less than 2.0x | 220 (38.5%) | 99,413 (12,349.4%) |
| 2.0x to 2.9x | 116 (20.3%) | 341 (42.4%) |
| 3.0x to 3.9x | 85 (14.9%) | 138 (17.1%) |
| 4.0x or more | 151 (26.4%) | 86 (10.7%) |
| Total | 572 (100.0%) | 805 (100.0%) |
Real Estate Taxes by Mortgage Status in Mount Hermon
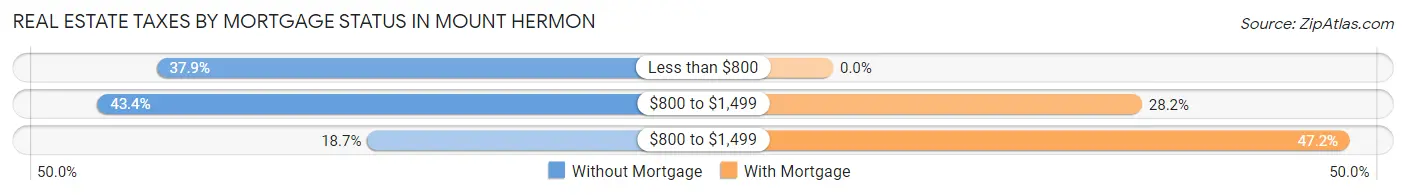
| Property Taxes | Without Mortgage | With Mortgage |
| Less than $800 | 217 (37.9%) | 0 (0.0%) |
| $800 to $1,499 | 248 (43.4%) | 227 (28.2%) |
| $800 to $1,499 | 107 (18.7%) | 380 (47.2%) |
| Total | 572 (100.0%) | 805 (100.0%) |
Health & Disability in Mount Hermon
Health Insurance Coverage by Age in Mount Hermon
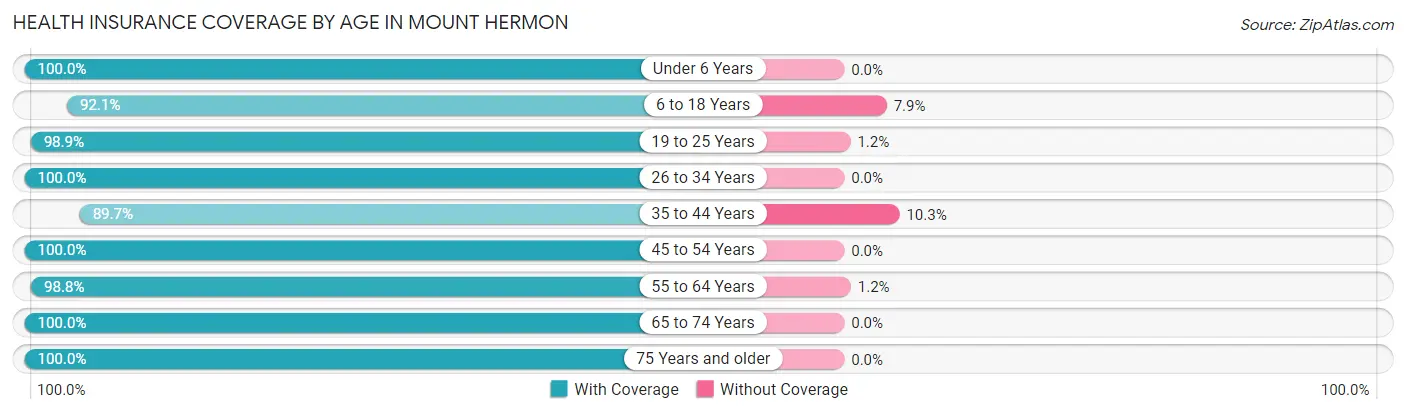
| Age Bracket | With Coverage | Without Coverage |
| Under 6 Years | 164 (100.0%) | 0 (0.0%) |
| 6 to 18 Years | 396 (92.1%) | 34 (7.9%) |
| 19 to 25 Years | 428 (98.9%) | 5 (1.1%) |
| 26 to 34 Years | 297 (100.0%) | 0 (0.0%) |
| 35 to 44 Years | 558 (89.7%) | 64 (10.3%) |
| 45 to 54 Years | 741 (100.0%) | 0 (0.0%) |
| 55 to 64 Years | 810 (98.8%) | 10 (1.2%) |
| 65 to 74 Years | 524 (100.0%) | 0 (0.0%) |
| 75 Years and older | 403 (100.0%) | 0 (0.0%) |
| Total | 4,321 (97.5%) | 113 (2.5%) |
Health Insurance Coverage by Citizenship Status in Mount Hermon
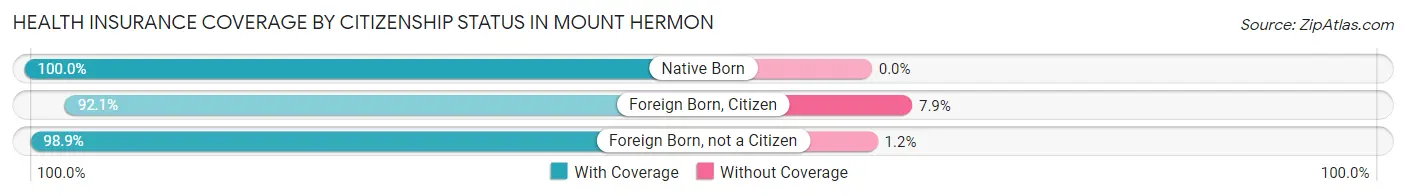
| Citizenship Status | With Coverage | Without Coverage |
| Native Born | 164 (100.0%) | 0 (0.0%) |
| Foreign Born, Citizen | 396 (92.1%) | 34 (7.9%) |
| Foreign Born, not a Citizen | 428 (98.9%) | 5 (1.1%) |
Health Insurance Coverage by Household Income in Mount Hermon
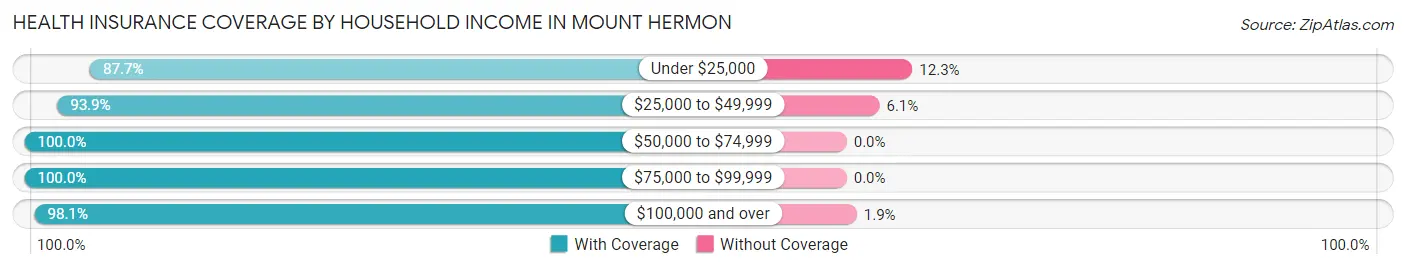
| Household Income | With Coverage | Without Coverage |
| Under $25,000 | 207 (87.7%) | 29 (12.3%) |
| $25,000 to $49,999 | 612 (93.9%) | 40 (6.1%) |
| $50,000 to $74,999 | 648 (100.0%) | 0 (0.0%) |
| $75,000 to $99,999 | 563 (100.0%) | 0 (0.0%) |
| $100,000 and over | 2,291 (98.1%) | 44 (1.9%) |
Public vs Private Health Insurance Coverage by Age in Mount Hermon
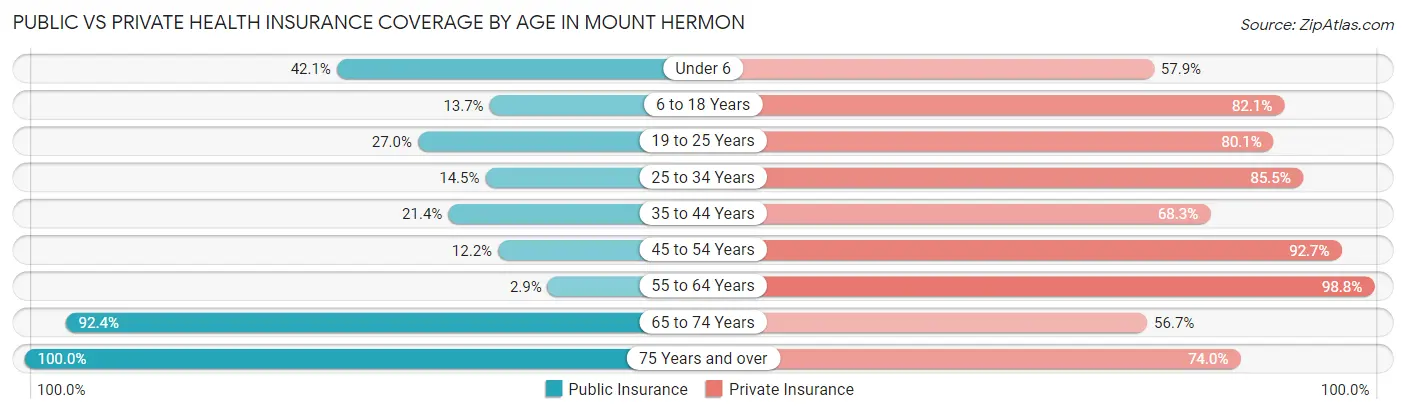
| Age Bracket | Public Insurance | Private Insurance |
| Under 6 | 69 (42.1%) | 95 (57.9%) |
| 6 to 18 Years | 59 (13.7%) | 353 (82.1%) |
| 19 to 25 Years | 117 (27.0%) | 347 (80.1%) |
| 25 to 34 Years | 43 (14.5%) | 254 (85.5%) |
| 35 to 44 Years | 133 (21.4%) | 425 (68.3%) |
| 45 to 54 Years | 90 (12.1%) | 687 (92.7%) |
| 55 to 64 Years | 24 (2.9%) | 810 (98.8%) |
| 65 to 74 Years | 484 (92.4%) | 297 (56.7%) |
| 75 Years and over | 403 (100.0%) | 298 (74.0%) |
| Total | 1,422 (32.1%) | 3,566 (80.4%) |
Disability Status by Sex by Age in Mount Hermon
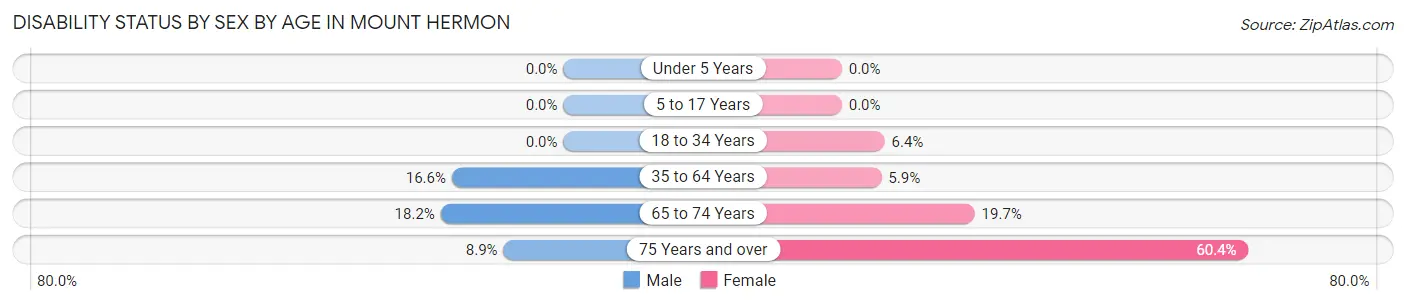
| Age Bracket | Male | Female |
| Under 5 Years | 0 (0.0%) | 0 (0.0%) |
| 5 to 17 Years | 0 (0.0%) | 0 (0.0%) |
| 18 to 34 Years | 0 (0.0%) | 28 (6.4%) |
| 35 to 64 Years | 173 (16.6%) | 67 (5.9%) |
| 65 to 74 Years | 41 (18.2%) | 59 (19.7%) |
| 75 Years and over | 17 (8.9%) | 128 (60.4%) |
Disability Class by Sex by Age in Mount Hermon
Disability Class: Hearing Difficulty
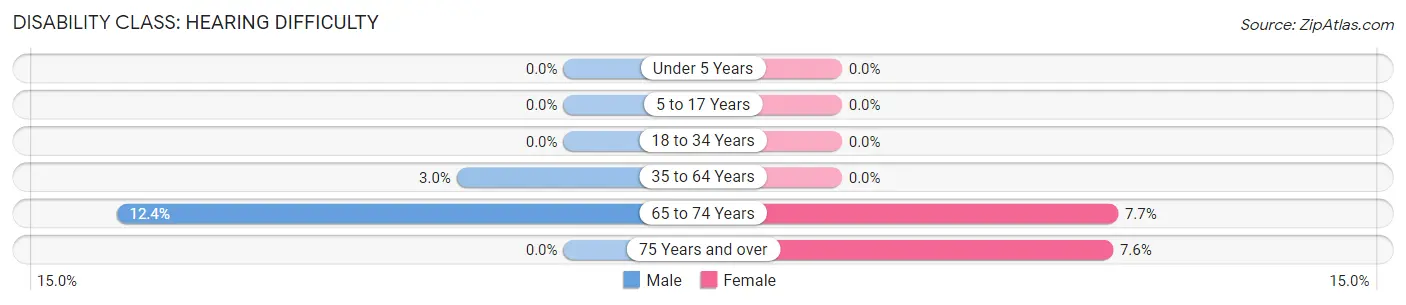
| Age Bracket | Male | Female |
| Under 5 Years | 0 (0.0%) | 0 (0.0%) |
| 5 to 17 Years | 0 (0.0%) | 0 (0.0%) |
| 18 to 34 Years | 0 (0.0%) | 0 (0.0%) |
| 35 to 64 Years | 31 (3.0%) | 0 (0.0%) |
| 65 to 74 Years | 28 (12.4%) | 23 (7.7%) |
| 75 Years and over | 0 (0.0%) | 16 (7.5%) |
Disability Class: Vision Difficulty
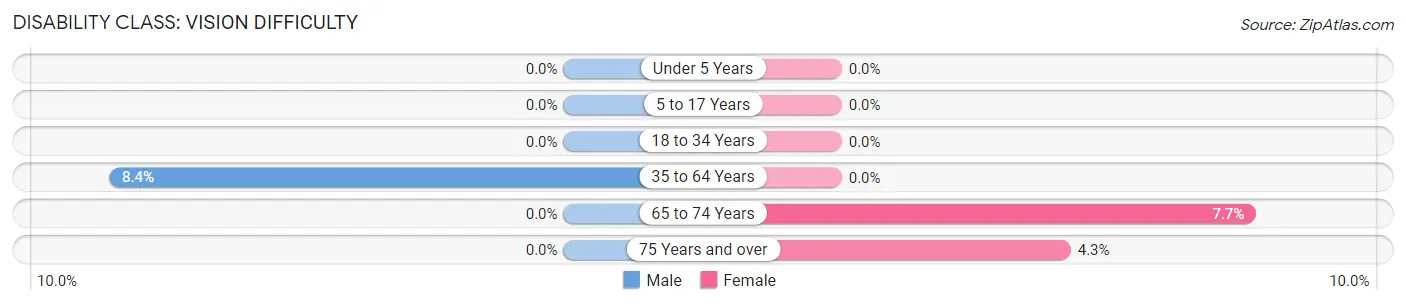
| Age Bracket | Male | Female |
| Under 5 Years | 0 (0.0%) | 0 (0.0%) |
| 5 to 17 Years | 0 (0.0%) | 0 (0.0%) |
| 18 to 34 Years | 0 (0.0%) | 0 (0.0%) |
| 35 to 64 Years | 88 (8.4%) | 0 (0.0%) |
| 65 to 74 Years | 0 (0.0%) | 23 (7.7%) |
| 75 Years and over | 0 (0.0%) | 9 (4.3%) |
Disability Class: Cognitive Difficulty
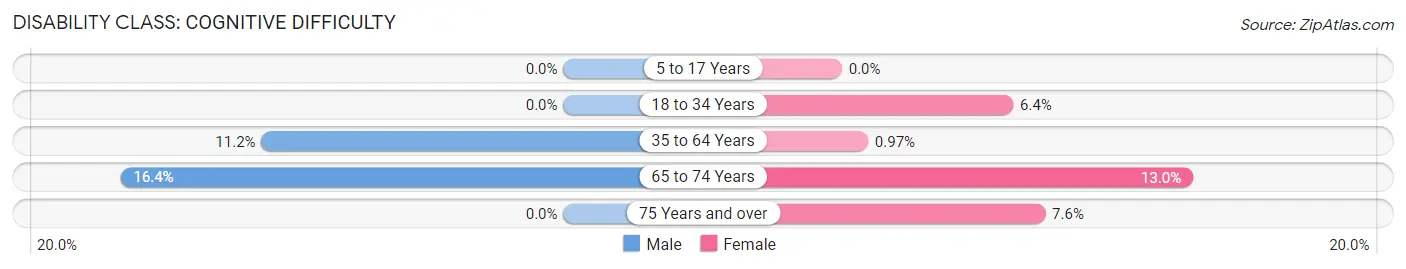
| Age Bracket | Male | Female |
| 5 to 17 Years | 0 (0.0%) | 0 (0.0%) |
| 18 to 34 Years | 0 (0.0%) | 28 (6.4%) |
| 35 to 64 Years | 117 (11.2%) | 11 (1.0%) |
| 65 to 74 Years | 37 (16.4%) | 39 (13.0%) |
| 75 Years and over | 0 (0.0%) | 16 (7.5%) |
Disability Class: Ambulatory Difficulty
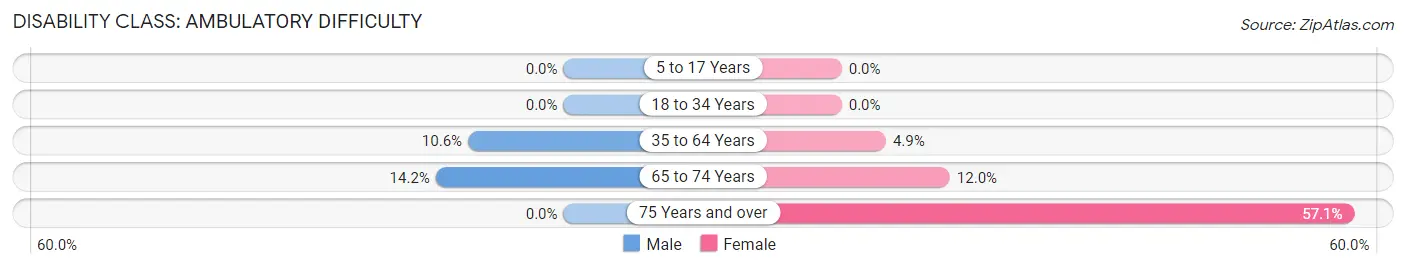
| Age Bracket | Male | Female |
| 5 to 17 Years | 0 (0.0%) | 0 (0.0%) |
| 18 to 34 Years | 0 (0.0%) | 0 (0.0%) |
| 35 to 64 Years | 111 (10.6%) | 56 (4.9%) |
| 65 to 74 Years | 32 (14.2%) | 36 (12.0%) |
| 75 Years and over | 0 (0.0%) | 121 (57.1%) |
Disability Class: Self-Care Difficulty
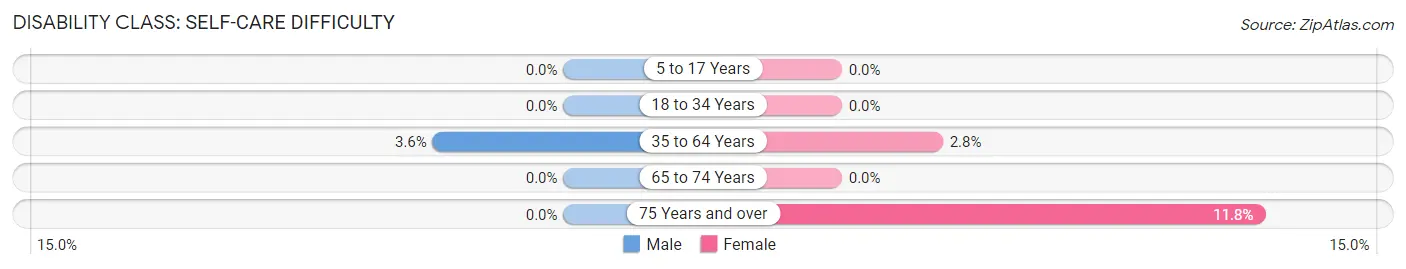
| Age Bracket | Male | Female |
| 5 to 17 Years | 0 (0.0%) | 0 (0.0%) |
| 18 to 34 Years | 0 (0.0%) | 0 (0.0%) |
| 35 to 64 Years | 38 (3.6%) | 32 (2.8%) |
| 65 to 74 Years | 0 (0.0%) | 0 (0.0%) |
| 75 Years and over | 0 (0.0%) | 25 (11.8%) |
Technology Access in Mount Hermon
Computing Device Access in Mount Hermon
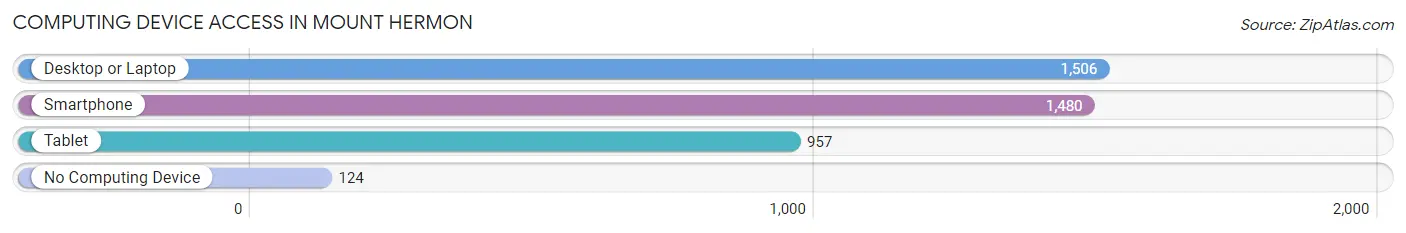
| Device Type | # Households | % Households |
| Desktop or Laptop | 1,506 | 85.7% |
| Smartphone | 1,480 | 84.2% |
| Tablet | 957 | 54.4% |
| No Computing Device | 124 | 7.0% |
| Total | 1,758 | 100.0% |
Internet Access in Mount Hermon
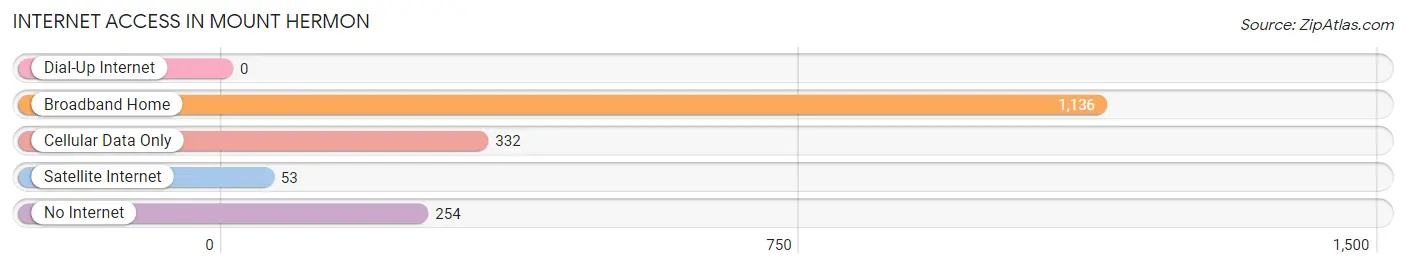
| Internet Type | # Households | % Households |
| Dial-Up Internet | 0 | 0.0% |
| Broadband Home | 1,136 | 64.6% |
| Cellular Data Only | 332 | 18.9% |
| Satellite Internet | 53 | 3.0% |
| No Internet | 254 | 14.4% |
| Total | 1,758 | 100.0% |
Mount Hermon Summary
Mount Hermon is a small unincorporated community located in Pittsylvania County, Virginia. It is situated in the foothills of the Blue Ridge Mountains, approximately 20 miles south of the city of Danville. The community is named after the nearby mountain of the same name, which is part of the Blue Ridge Mountains.
History
The area around Mount Hermon has been inhabited for thousands of years. Archaeological evidence suggests that Native Americans lived in the area as early as 8,000 BC. The first European settlers arrived in the area in the late 1700s. The community of Mount Hermon was established in the early 1800s and was named after the nearby mountain.
The area was primarily agricultural, with tobacco being the main crop. The community also had several small businesses, including a general store, a blacksmith shop, and a grist mill. The community was also home to several churches, including the Mount Hermon Baptist Church, which was established in 1845.
In the late 1800s, the area around Mount Hermon began to experience rapid growth. The railroad was extended to the area, and several new businesses were established. The community also saw an influx of new residents, many of whom were African American.
Geography
Mount Hermon is located in the foothills of the Blue Ridge Mountains in Pittsylvania County, Virginia. The community is situated at an elevation of 1,000 feet above sea level. The area is characterized by rolling hills and lush forests. The nearby mountain of the same name is part of the Blue Ridge Mountains.
The climate in the area is temperate, with hot summers and cold winters. The average annual temperature is around 60 degrees Fahrenheit. The average annual precipitation is around 40 inches.
Economy
The economy of Mount Hermon is primarily based on agriculture. The area is known for its tobacco production, and the community is home to several tobacco farms. The area is also known for its production of corn, soybeans, and other crops.
The community also has several small businesses, including a general store, a blacksmith shop, and a grist mill. The area is also home to several churches, including the Mount Hermon Baptist Church.
Demographics
As of the 2010 census, the population of Mount Hermon was 1,072. The racial makeup of the community was 97.3% White, 1.2% African American, 0.3% Native American, 0.2% Asian, and 0.9% from other races. The median household income was $37,500, and the median family income was $45,000. The per capita income was $18,000.
Conclusion
Mount Hermon is a small unincorporated community located in Pittsylvania County, Virginia. It is situated in the foothills of the Blue Ridge Mountains, approximately 20 miles south of the city of Danville. The community is named after the nearby mountain of the same name, which is part of the Blue Ridge Mountains. The economy of Mount Hermon is primarily based on agriculture, with tobacco being the main crop. The area is also home to several small businesses, including a general store, a blacksmith shop, and a grist mill. As of the 2010 census, the population of Mount Hermon was 1,072. The racial makeup of the community was 97.3% White, 1.2% African American, 0.3% Native American, 0.2% Asian, and 0.9% from other races. The median household income was $37,500, and the median family income was $45,000. The per capita income was $18,000.
Common Questions
What is Per Capita Income in Mount Hermon?
Per Capita income in Mount Hermon is $40,292.
What is the Median Family Income in Mount Hermon?
Median Family Income in Mount Hermon is $97,450.
What is the Median Household income in Mount Hermon?
Median Household Income in Mount Hermon is $85,357.
What is Income or Wage Gap in Mount Hermon?
Income or Wage Gap in Mount Hermon is 7.0%.
Women in Mount Hermon earn 93.0 cents for every dollar earned by a man.
What is Inequality or Gini Index in Mount Hermon?
Inequality or Gini Index in Mount Hermon is 0.38.
What is the Total Population of Mount Hermon?
Total Population of Mount Hermon is 4,434.
What is the Total Male Population of Mount Hermon?
Total Male Population of Mount Hermon is 2,020.
What is the Total Female Population of Mount Hermon?
Total Female Population of Mount Hermon is 2,414.
What is the Ratio of Males per 100 Females in Mount Hermon?
There are 83.68 Males per 100 Females in Mount Hermon.
What is the Ratio of Females per 100 Males in Mount Hermon?
There are 119.50 Females per 100 Males in Mount Hermon.
What is the Median Population Age in Mount Hermon?
Median Population Age in Mount Hermon is 48.8 Years.
What is the Average Family Size in Mount Hermon
Average Family Size in Mount Hermon is 2.9 People.
What is the Average Household Size in Mount Hermon
Average Household Size in Mount Hermon is 2.5 People.
How Large is the Labor Force in Mount Hermon?
There are 2,601 People in the Labor Forcein in Mount Hermon.
What is the Percentage of People in the Labor Force in Mount Hermon?
64.9% of People are in the Labor Force in Mount Hermon.
What is the Unemployment Rate in Mount Hermon?
Unemployment Rate in Mount Hermon is 5.6%.