Hollymead, VA Map & Demographics
Hollymead Map
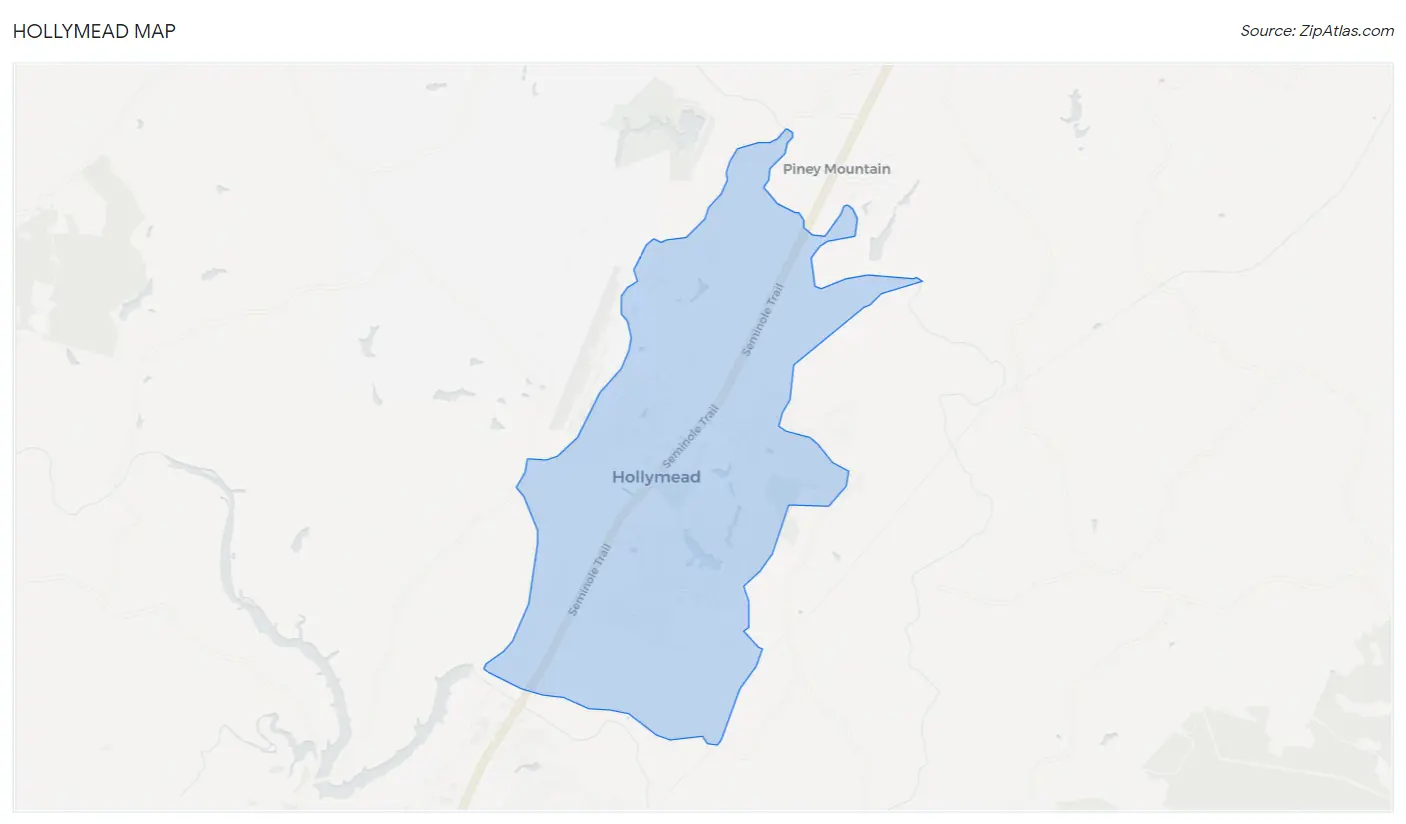
Hollymead Overview
$50,738
PER CAPITA INCOME
$148,529
AVG FAMILY INCOME
$119,079
AVG HOUSEHOLD INCOME
27.2%
WAGE / INCOME GAP [ % ]
72.8¢/ $1
WAGE / INCOME GAP [ $ ]
$20,580
FAMILY INCOME DEFICIT
0.38
INEQUALITY / GINI INDEX
8,740
TOTAL POPULATION
4,168
MALE POPULATION
4,572
FEMALE POPULATION
91.16
MALES / 100 FEMALES
109.69
FEMALES / 100 MALES
38.4
MEDIAN AGE
3.3
AVG FAMILY SIZE
2.8
AVG HOUSEHOLD SIZE
4,496
LABOR FORCE [ PEOPLE ]
67.2%
PERCENT IN LABOR FORCE
2.6%
UNEMPLOYMENT RATE
Income in Hollymead
Income Overview in Hollymead
Per Capita Income in Hollymead is $50,738, while median incomes of families and households are $148,529 and $119,079 respectively.
| Characteristic | Number | Measure |
| Per Capita Income | 8,740 | $50,738 |
| Median Family Income | 2,276 | $148,529 |
| Mean Family Income | 2,276 | $165,582 |
| Median Household Income | 3,162 | $119,079 |
| Mean Household Income | 3,162 | $136,353 |
| Income Deficit | 2,276 | $20,580 |
| Wage / Income Gap (%) | 8,740 | 27.19% |
| Wage / Income Gap ($) | 8,740 | 72.81¢ per $1 |
| Gini / Inequality Index | 8,740 | 0.38 |
Earnings by Sex in Hollymead
Average Earnings in Hollymead are $63,114, $74,604 for men and $54,321 for women, a difference of 27.2%.
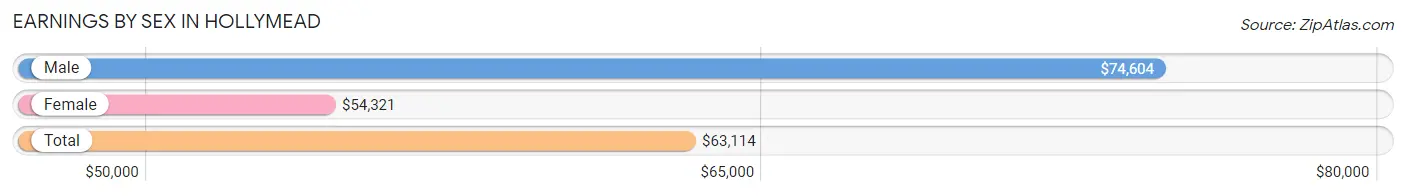
| Sex | Number | Average Earnings |
| Male | 2,290 (48.6%) | $74,604 |
| Female | 2,425 (51.4%) | $54,321 |
| Total | 4,715 (100.0%) | $63,114 |
Earnings by Sex by Income Bracket in Hollymead
The most common earnings brackets in Hollymead are $100,000+ for men (709 | 31.0%) and $100,000+ for women (476 | 19.6%).
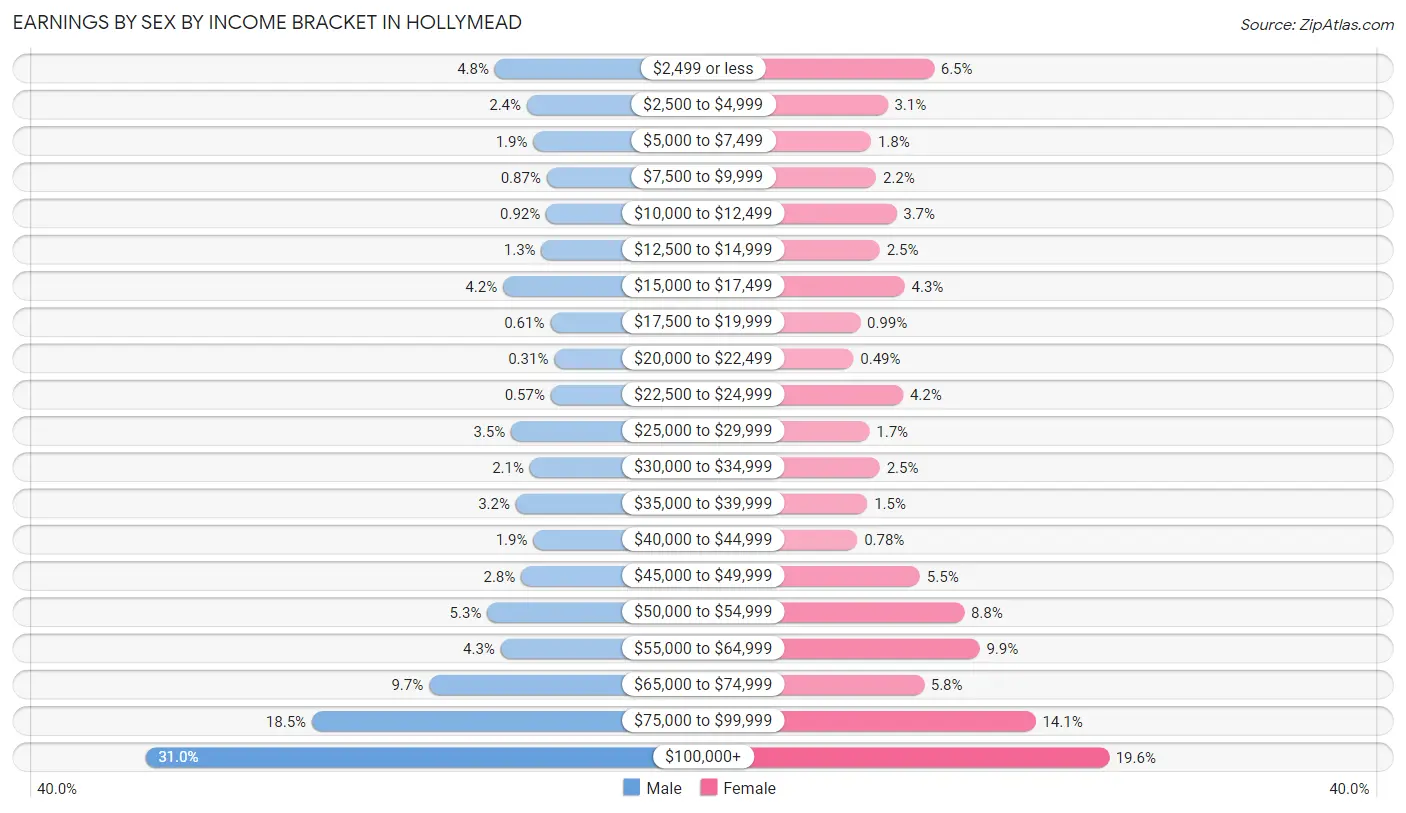
| Income | Male | Female |
| $2,499 or less | 109 (4.8%) | 158 (6.5%) |
| $2,500 to $4,999 | 54 (2.4%) | 74 (3.0%) |
| $5,000 to $7,499 | 43 (1.9%) | 44 (1.8%) |
| $7,500 to $9,999 | 20 (0.9%) | 53 (2.2%) |
| $10,000 to $12,499 | 21 (0.9%) | 90 (3.7%) |
| $12,500 to $14,999 | 29 (1.3%) | 60 (2.5%) |
| $15,000 to $17,499 | 95 (4.2%) | 105 (4.3%) |
| $17,500 to $19,999 | 14 (0.6%) | 24 (1.0%) |
| $20,000 to $22,499 | 7 (0.3%) | 12 (0.5%) |
| $22,500 to $24,999 | 13 (0.6%) | 102 (4.2%) |
| $25,000 to $29,999 | 81 (3.5%) | 41 (1.7%) |
| $30,000 to $34,999 | 49 (2.1%) | 60 (2.5%) |
| $35,000 to $39,999 | 73 (3.2%) | 37 (1.5%) |
| $40,000 to $44,999 | 43 (1.9%) | 19 (0.8%) |
| $45,000 to $49,999 | 64 (2.8%) | 133 (5.5%) |
| $50,000 to $54,999 | 122 (5.3%) | 213 (8.8%) |
| $55,000 to $64,999 | 99 (4.3%) | 241 (9.9%) |
| $65,000 to $74,999 | 222 (9.7%) | 140 (5.8%) |
| $75,000 to $99,999 | 423 (18.5%) | 343 (14.1%) |
| $100,000+ | 709 (31.0%) | 476 (19.6%) |
| Total | 2,290 (100.0%) | 2,425 (100.0%) |
Earnings by Sex by Educational Attainment in Hollymead
Average earnings in Hollymead are $81,722 for men and $56,129 for women, a difference of 31.3%. Men with an educational attainment of graduate degree enjoy the highest average annual earnings of $114,688, while those with less than high school education earn the least with $38,462. Women with an educational attainment of graduate degree earn the most with the average annual earnings of $83,313, while those with college or associate's degree education have the smallest earnings of $48,941.
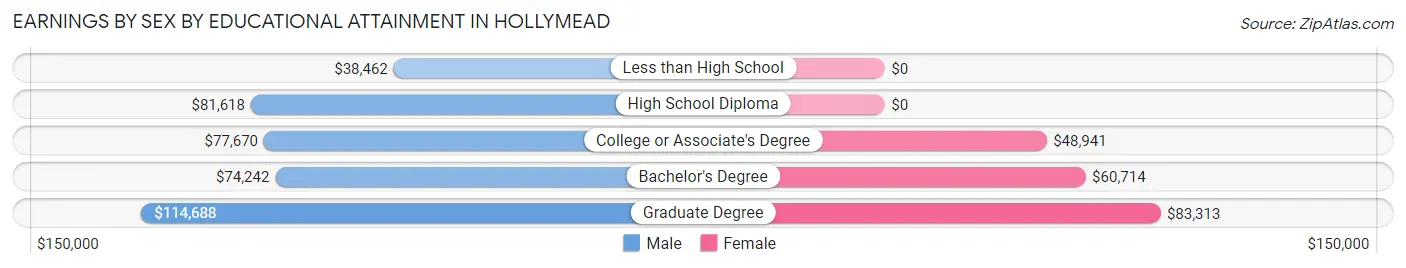
| Educational Attainment | Male Income | Female Income |
| Less than High School | $38,462 | $0 |
| High School Diploma | $81,618 | $0 |
| College or Associate's Degree | $77,670 | $48,941 |
| Bachelor's Degree | $74,242 | $60,714 |
| Graduate Degree | $114,688 | $83,313 |
| Total | $81,722 | $56,129 |
Family Income in Hollymead
Family Income Brackets in Hollymead
According to the Hollymead family income data, there are 669 families falling into the $200,000+ income range, which is the most common income bracket and makes up 29.4% of all families.
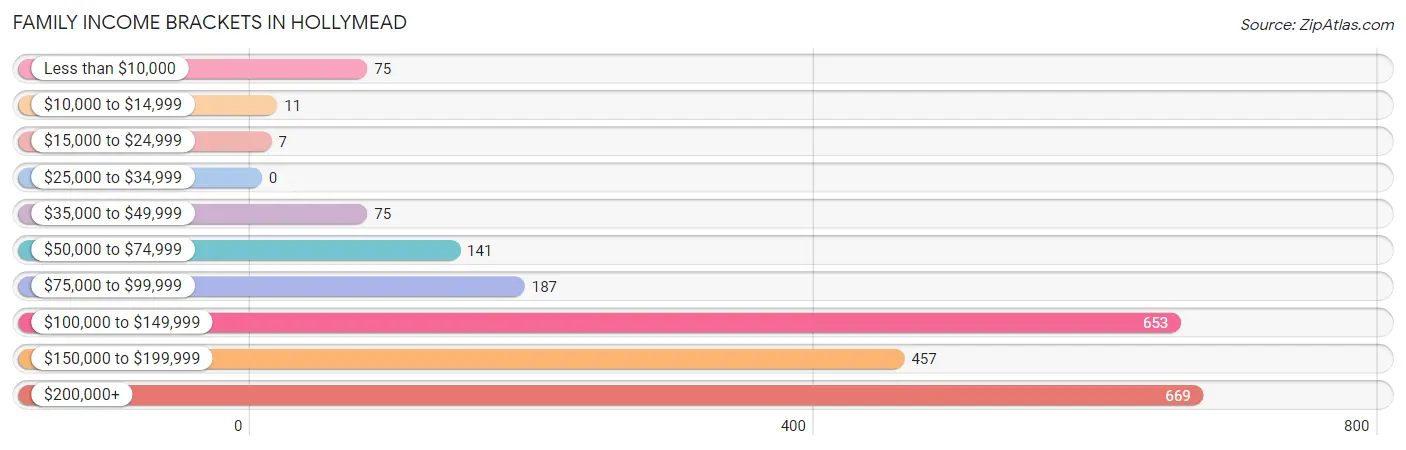
| Income Bracket | # Families | % Families |
| Less than $10,000 | 75 | 3.3% |
| $10,000 to $14,999 | 11 | 0.5% |
| $15,000 to $24,999 | 7 | 0.3% |
| $25,000 to $34,999 | 0 | 0.0% |
| $35,000 to $49,999 | 75 | 3.3% |
| $50,000 to $74,999 | 141 | 6.2% |
| $75,000 to $99,999 | 187 | 8.2% |
| $100,000 to $149,999 | 653 | 28.7% |
| $150,000 to $199,999 | 457 | 20.1% |
| $200,000+ | 669 | 29.4% |
Family Income by Famaliy Size in Hollymead
3-person families (509 | 22.4%) account for the highest median family income in Hollymead with $178,472 per family, while 3-person families (509 | 22.4%) have the highest median income of $59,491 per family member.
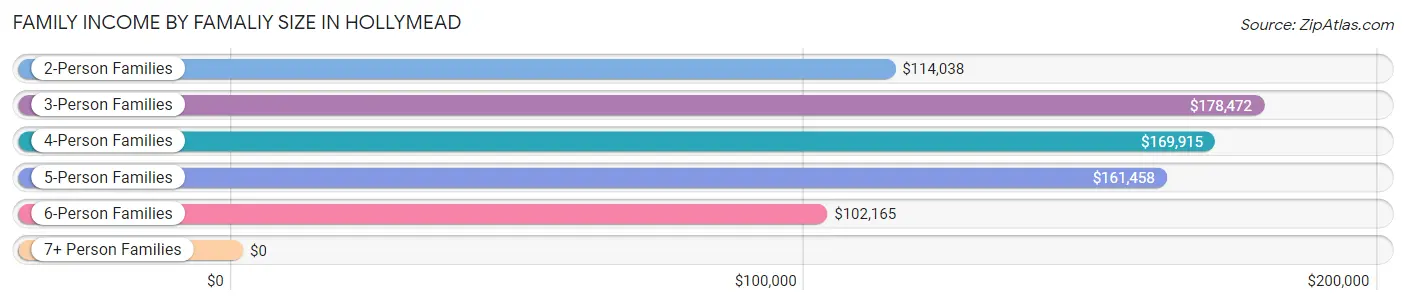
| Income Bracket | # Families | Median Income |
| 2-Person Families | 864 (38.0%) | $114,038 |
| 3-Person Families | 509 (22.4%) | $178,472 |
| 4-Person Families | 615 (27.0%) | $169,915 |
| 5-Person Families | 172 (7.6%) | $161,458 |
| 6-Person Families | 97 (4.3%) | $102,165 |
| 7+ Person Families | 19 (0.8%) | $0 |
| Total | 2,276 (100.0%) | $148,529 |
Family Income by Number of Earners in Hollymead
The median family income in Hollymead is $148,529, with families comprising 3+ earners (341) having the highest median family income of $172,038, while families with no earners (320) have the lowest median family income of $76,957, accounting for 15.0% and 14.1% of families, respectively.
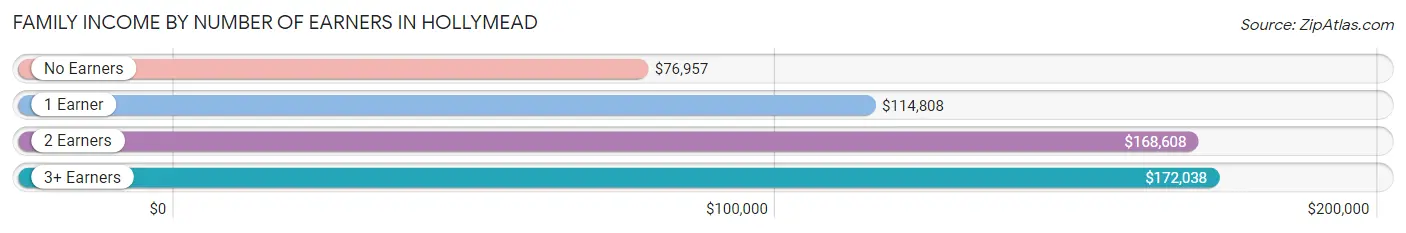
| Number of Earners | # Families | Median Income |
| No Earners | 320 (14.1%) | $76,957 |
| 1 Earner | 442 (19.4%) | $114,808 |
| 2 Earners | 1,173 (51.5%) | $168,608 |
| 3+ Earners | 341 (15.0%) | $172,038 |
| Total | 2,276 (100.0%) | $148,529 |
Household Income in Hollymead
Household Income Brackets in Hollymead
With 718 households falling in the category, the $100,000 to $149,999 income range is the most frequent in Hollymead, accounting for 22.7% of all households. In contrast, only 47 households (1.5%) fall into the $25,000 to $34,999 income bracket, making it the least populous group.
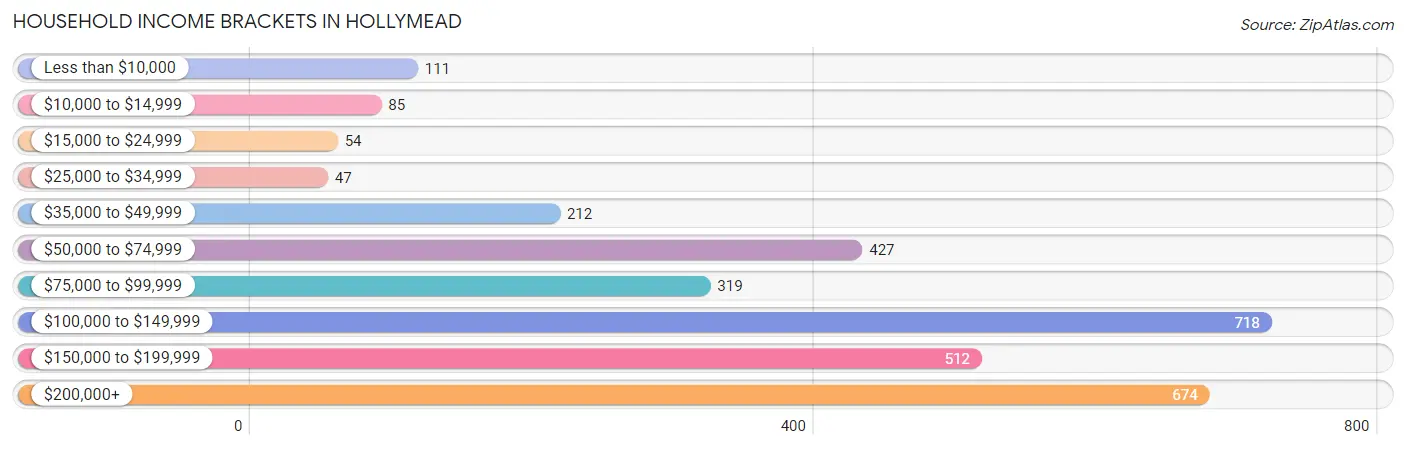
| Income Bracket | # Households | % Households |
| Less than $10,000 | 111 | 3.5% |
| $10,000 to $14,999 | 85 | 2.7% |
| $15,000 to $24,999 | 54 | 1.7% |
| $25,000 to $34,999 | 47 | 1.5% |
| $35,000 to $49,999 | 212 | 6.7% |
| $50,000 to $74,999 | 427 | 13.5% |
| $75,000 to $99,999 | 319 | 10.1% |
| $100,000 to $149,999 | 718 | 22.7% |
| $150,000 to $199,999 | 512 | 16.2% |
| $200,000+ | 674 | 21.3% |
Household Income by Householder Age in Hollymead
The median household income in Hollymead is $119,079, with the highest median household income of $160,702 found in the 25 to 44 years age bracket for the primary householder. A total of 1,003 households (31.7%) fall into this category. Meanwhile, the 15 to 24 years age bracket for the primary householder has the lowest median household income of $0, with 33 households (1.0%) in this group.
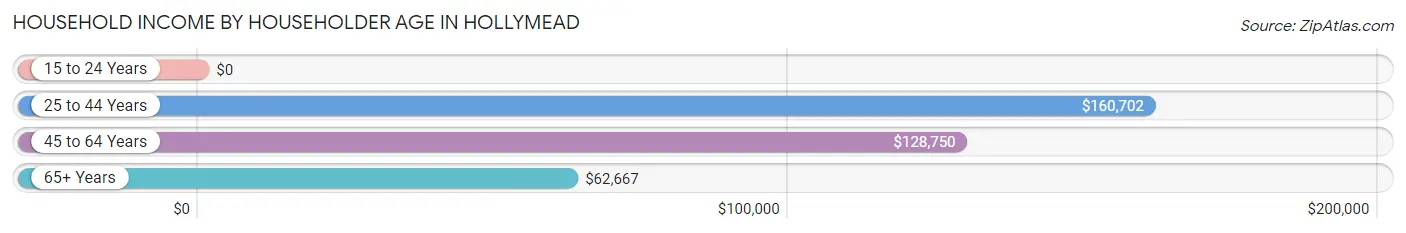
| Income Bracket | # Households | Median Income |
| 15 to 24 Years | 33 (1.0%) | $0 |
| 25 to 44 Years | 1,003 (31.7%) | $160,702 |
| 45 to 64 Years | 1,152 (36.4%) | $128,750 |
| 65+ Years | 974 (30.8%) | $62,667 |
| Total | 3,162 (100.0%) | $119,079 |
Poverty in Hollymead
Income Below Poverty by Sex and Age in Hollymead
With 3.8% poverty level for males and 9.3% for females among the residents of Hollymead, 15 year old males and under 5 year old females are the most vulnerable to poverty, with 13 males (12.6%) and 104 females (38.2%) in their respective age groups living below the poverty level.
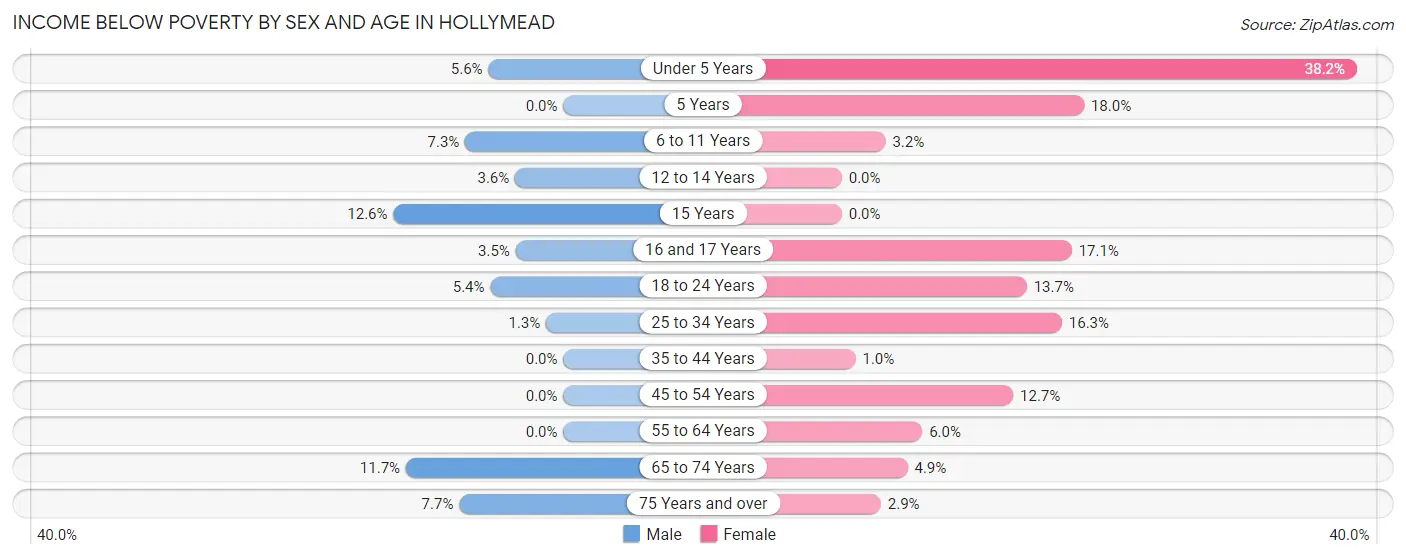
| Age Bracket | Male | Female |
| Under 5 Years | 11 (5.6%) | 104 (38.2%) |
| 5 Years | 0 (0.0%) | 16 (18.0%) |
| 6 to 11 Years | 25 (7.3%) | 13 (3.2%) |
| 12 to 14 Years | 10 (3.6%) | 0 (0.0%) |
| 15 Years | 13 (12.6%) | 0 (0.0%) |
| 16 and 17 Years | 9 (3.5%) | 14 (17.1%) |
| 18 to 24 Years | 13 (5.4%) | 28 (13.7%) |
| 25 to 34 Years | 6 (1.3%) | 93 (16.3%) |
| 35 to 44 Years | 0 (0.0%) | 7 (1.0%) |
| 45 to 54 Years | 0 (0.0%) | 85 (12.7%) |
| 55 to 64 Years | 0 (0.0%) | 29 (6.0%) |
| 65 to 74 Years | 54 (11.7%) | 20 (4.9%) |
| 75 Years and over | 17 (7.7%) | 13 (2.9%) |
| Total | 158 (3.8%) | 422 (9.3%) |
Income Above Poverty by Sex and Age in Hollymead
According to the poverty statistics in Hollymead, males aged 5 years and females aged 12 to 14 years are the age groups that are most secure financially, with 100.0% of males and 100.0% of females in these age groups living above the poverty line.
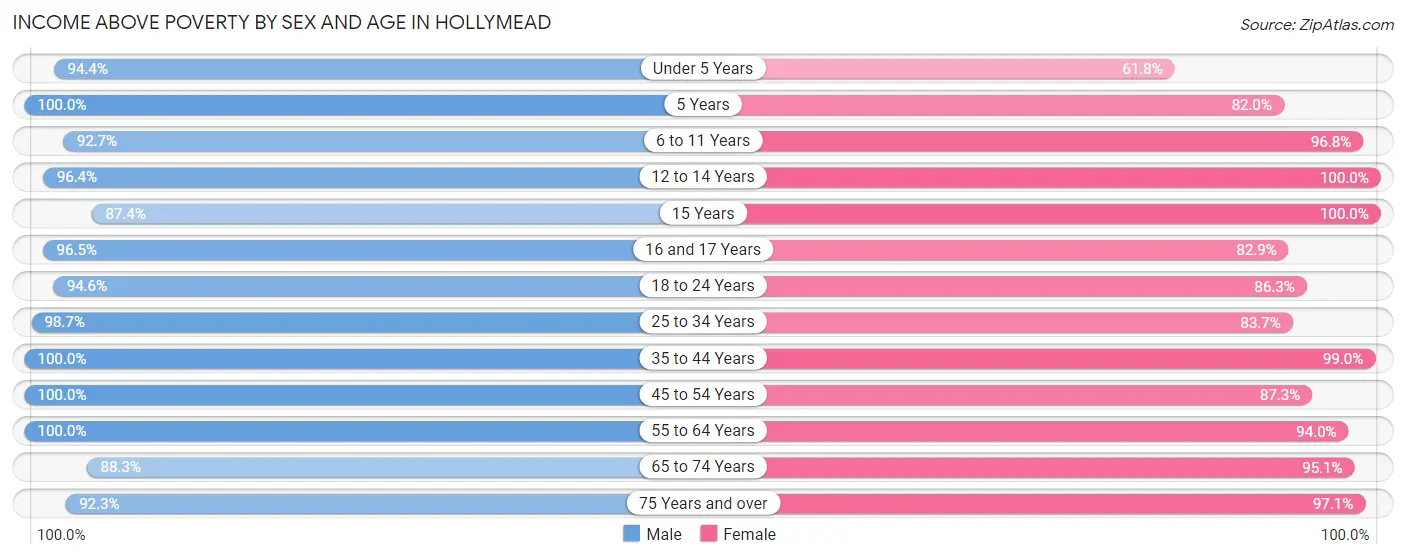
| Age Bracket | Male | Female |
| Under 5 Years | 187 (94.4%) | 168 (61.8%) |
| 5 Years | 97 (100.0%) | 73 (82.0%) |
| 6 to 11 Years | 318 (92.7%) | 388 (96.8%) |
| 12 to 14 Years | 269 (96.4%) | 220 (100.0%) |
| 15 Years | 90 (87.4%) | 19 (100.0%) |
| 16 and 17 Years | 245 (96.5%) | 68 (82.9%) |
| 18 to 24 Years | 227 (94.6%) | 176 (86.3%) |
| 25 to 34 Years | 463 (98.7%) | 476 (83.7%) |
| 35 to 44 Years | 676 (100.0%) | 680 (99.0%) |
| 45 to 54 Years | 543 (100.0%) | 583 (87.3%) |
| 55 to 64 Years | 256 (100.0%) | 457 (94.0%) |
| 65 to 74 Years | 408 (88.3%) | 390 (95.1%) |
| 75 Years and over | 203 (92.3%) | 435 (97.1%) |
| Total | 3,982 (96.2%) | 4,133 (90.7%) |
Income Below Poverty Among Married-Couple Families in Hollymead
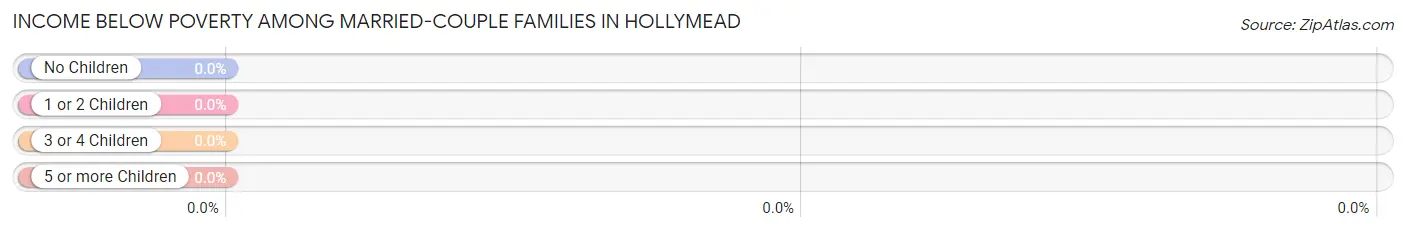
| Children | Above Poverty | Below Poverty |
| No Children | 791 (100.0%) | 0 (0.0%) |
| 1 or 2 Children | 944 (100.0%) | 0 (0.0%) |
| 3 or 4 Children | 77 (100.0%) | 0 (0.0%) |
| 5 or more Children | 0 (0.0%) | 0 (0.0%) |
| Total | 1,812 (100.0%) | 0 (0.0%) |
Income Below Poverty Among Single-Parent Households in Hollymead
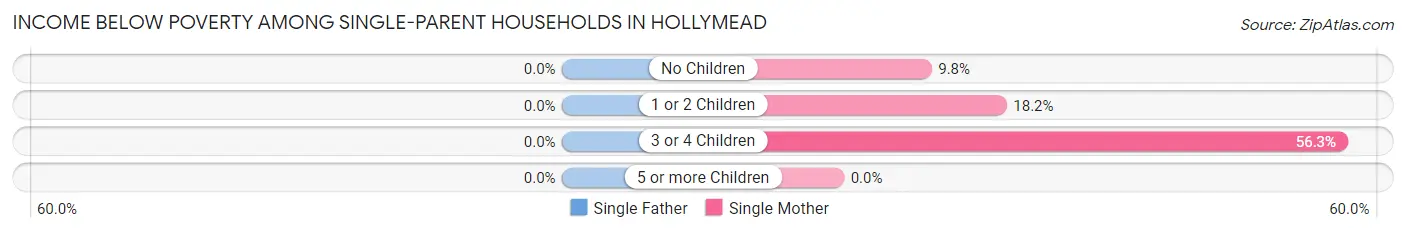
| Children | Single Father | Single Mother |
| No Children | 0 (0.0%) | 14 (9.8%) |
| 1 or 2 Children | 0 (0.0%) | 38 (18.2%) |
| 3 or 4 Children | 0 (0.0%) | 40 (56.3%) |
| 5 or more Children | 0 (0.0%) | 0 (0.0%) |
| Total | 0 (0.0%) | 92 (21.7%) |
Income Below Poverty Among Married-Couple vs Single-Parent Households in Hollymead
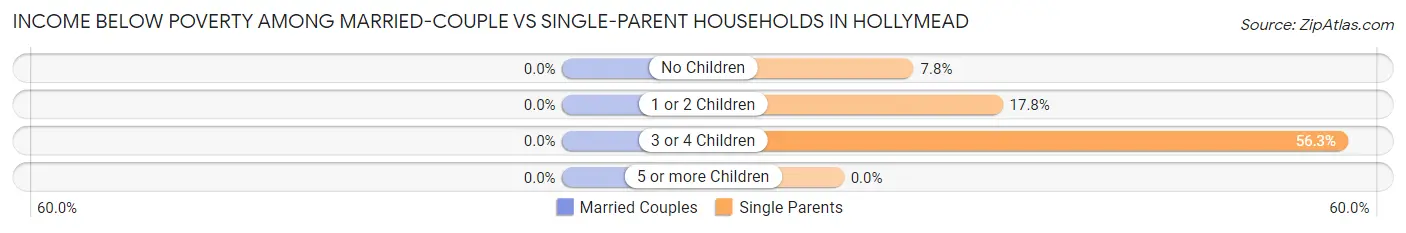
| Children | Married-Couple Families | Single-Parent Households |
| No Children | 0 (0.0%) | 14 (7.8%) |
| 1 or 2 Children | 0 (0.0%) | 38 (17.8%) |
| 3 or 4 Children | 0 (0.0%) | 40 (56.3%) |
| 5 or more Children | 0 (0.0%) | 0 (0.0%) |
| Total | 0 (0.0%) | 92 (19.8%) |
Race in Hollymead
The most populous races in Hollymead are White / Caucasian (6,828 | 78.1%), Two or more Races (789 | 9.0%), and Asian (563 | 6.4%).
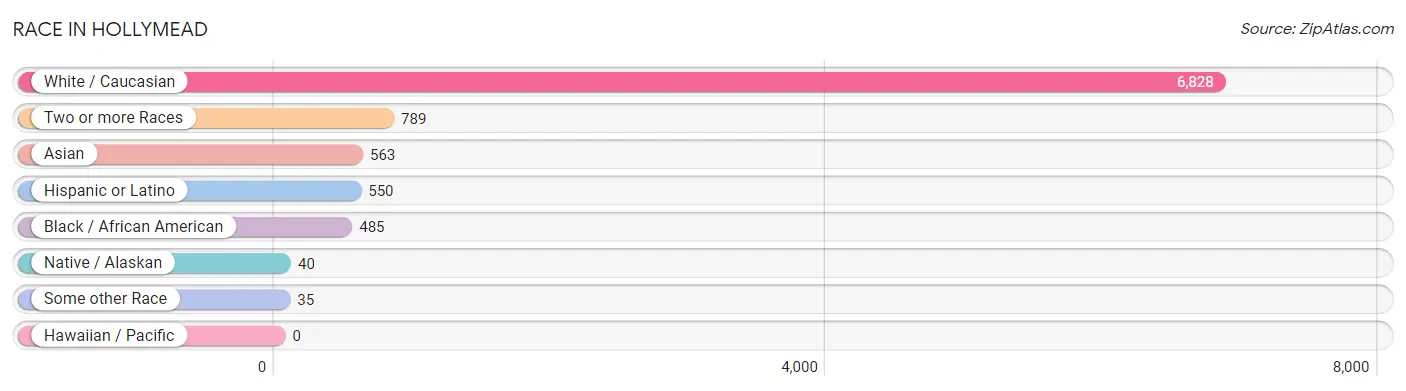
| Race | # Population | % Population |
| Asian | 563 | 6.4% |
| Black / African American | 485 | 5.6% |
| Hawaiian / Pacific | 0 | 0.0% |
| Hispanic or Latino | 550 | 6.3% |
| Native / Alaskan | 40 | 0.5% |
| White / Caucasian | 6,828 | 78.1% |
| Two or more Races | 789 | 9.0% |
| Some other Race | 35 | 0.4% |
| Total | 8,740 | 100.0% |
Ancestry in Hollymead
The most populous ancestries reported in Hollymead are English (1,263 | 14.4%), German (1,060 | 12.1%), Irish (891 | 10.2%), Italian (497 | 5.7%), and American (437 | 5.0%), together accounting for 47.5% of all Hollymead residents.
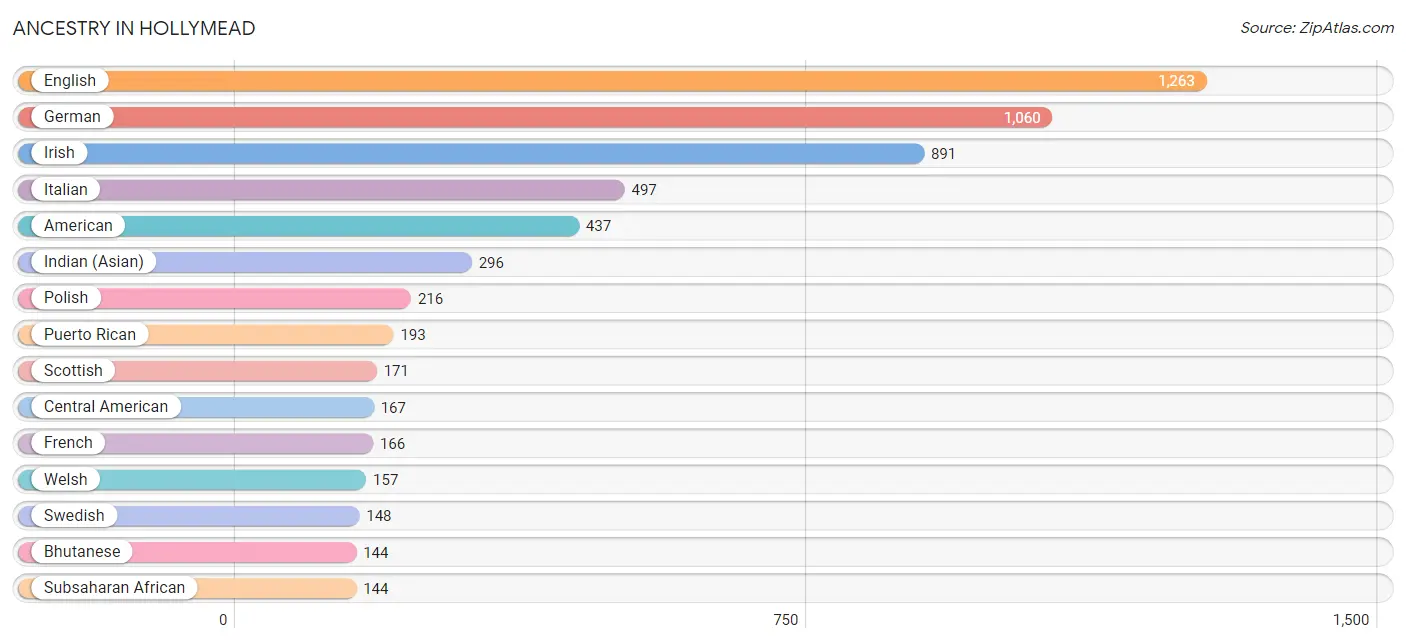
| Ancestry | # Population | % Population |
| American | 437 | 5.0% |
| Argentinean | 3 | 0.0% |
| Austrian | 64 | 0.7% |
| Belgian | 11 | 0.1% |
| Bhutanese | 144 | 1.7% |
| Brazilian | 29 | 0.3% |
| British | 41 | 0.5% |
| Burmese | 6 | 0.1% |
| Central American | 167 | 1.9% |
| Central American Indian | 40 | 0.5% |
| Croatian | 93 | 1.1% |
| Czech | 27 | 0.3% |
| Czechoslovakian | 24 | 0.3% |
| Danish | 7 | 0.1% |
| Dutch | 38 | 0.4% |
| Eastern European | 16 | 0.2% |
| English | 1,263 | 14.4% |
| European | 136 | 1.6% |
| French | 166 | 1.9% |
| German | 1,060 | 12.1% |
| Greek | 17 | 0.2% |
| Guatemalan | 42 | 0.5% |
| Hungarian | 46 | 0.5% |
| Indian (Asian) | 296 | 3.4% |
| Irish | 891 | 10.2% |
| Italian | 497 | 5.7% |
| Japanese | 20 | 0.2% |
| Kenyan | 21 | 0.2% |
| Korean | 69 | 0.8% |
| Mexican | 101 | 1.2% |
| Native Hawaiian | 56 | 0.6% |
| Nigerian | 92 | 1.1% |
| Norwegian | 59 | 0.7% |
| Panamanian | 31 | 0.4% |
| Polish | 216 | 2.5% |
| Portuguese | 26 | 0.3% |
| Puerto Rican | 193 | 2.2% |
| Russian | 131 | 1.5% |
| Salvadoran | 78 | 0.9% |
| Scandinavian | 57 | 0.6% |
| Scotch-Irish | 112 | 1.3% |
| Scottish | 171 | 2.0% |
| Serbian | 15 | 0.2% |
| Slovak | 23 | 0.3% |
| South American | 32 | 0.4% |
| Spaniard | 43 | 0.5% |
| Sri Lankan | 76 | 0.9% |
| Subsaharan African | 144 | 1.7% |
| Sudanese | 31 | 0.4% |
| Swedish | 148 | 1.7% |
| Swiss | 5 | 0.1% |
| Thai | 79 | 0.9% |
| Welsh | 157 | 1.8% | View All 53 Rows |
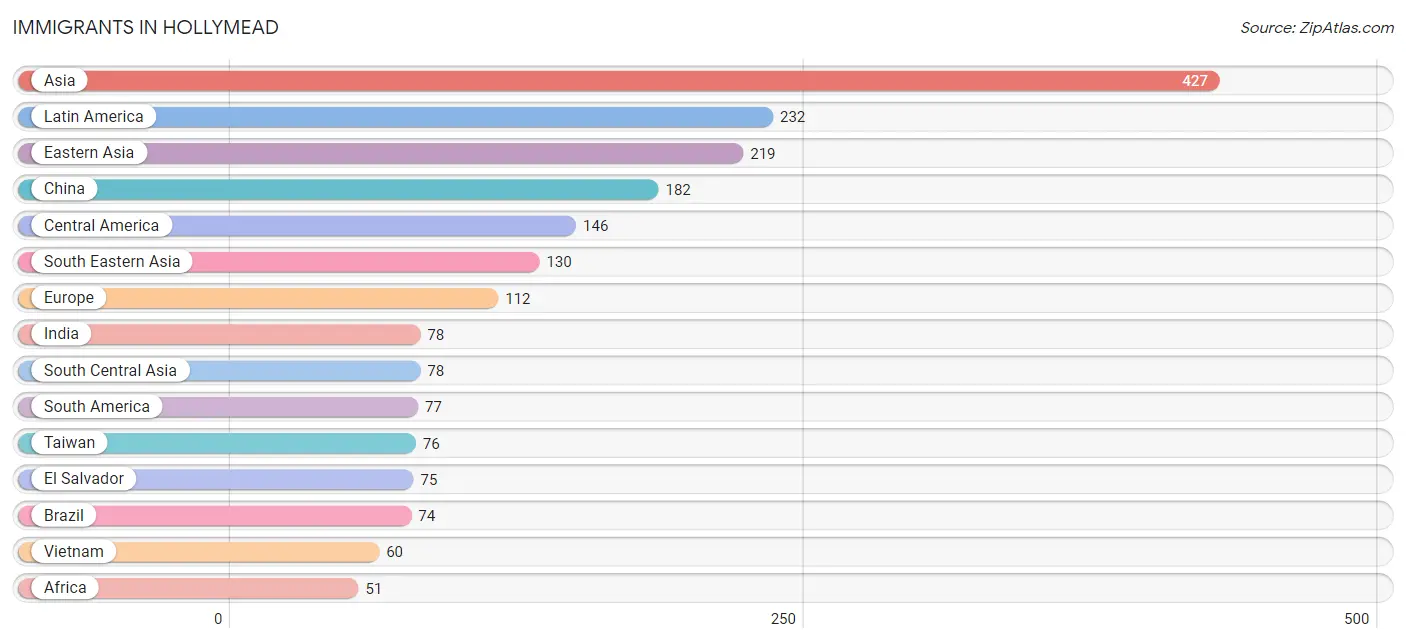
Immigrants in Hollymead
The most numerous immigrant groups reported in Hollymead came from Asia (427 | 4.9%), Latin America (232 | 2.6%), Eastern Asia (219 | 2.5%), China (182 | 2.1%), and Central America (146 | 1.7%), together accounting for 13.8% of all Hollymead residents.
| Immigration Origin | # Population | % Population |
| Africa | 51 | 0.6% |
| Argentina | 3 | 0.0% |
| Asia | 427 | 4.9% |
| Brazil | 74 | 0.9% |
| Cambodia | 14 | 0.2% |
| Canada | 45 | 0.5% |
| Caribbean | 9 | 0.1% |
| Central America | 146 | 1.7% |
| China | 182 | 2.1% |
| Eastern Asia | 219 | 2.5% |
| Eastern Europe | 48 | 0.5% |
| El Salvador | 75 | 0.9% |
| Europe | 112 | 1.3% |
| France | 3 | 0.0% |
| Germany | 13 | 0.2% |
| Guatemala | 40 | 0.5% |
| Haiti | 9 | 0.1% |
| Hong Kong | 19 | 0.2% |
| India | 78 | 0.9% |
| Indonesia | 10 | 0.1% |
| Japan | 9 | 0.1% |
| Korea | 28 | 0.3% |
| Latin America | 232 | 2.6% |
| Malaysia | 12 | 0.1% |
| Netherlands | 12 | 0.1% |
| Nigeria | 32 | 0.4% |
| Northern Africa | 19 | 0.2% |
| Northern Europe | 36 | 0.4% |
| Panama | 31 | 0.4% |
| Philippines | 7 | 0.1% |
| Russia | 33 | 0.4% |
| Singapore | 27 | 0.3% |
| South America | 77 | 0.9% |
| South Central Asia | 78 | 0.9% |
| South Eastern Asia | 130 | 1.5% |
| Sudan | 19 | 0.2% |
| Taiwan | 76 | 0.9% |
| Vietnam | 60 | 0.7% |
| Western Africa | 32 | 0.4% |
| Western Europe | 28 | 0.3% | View All 40 Rows |
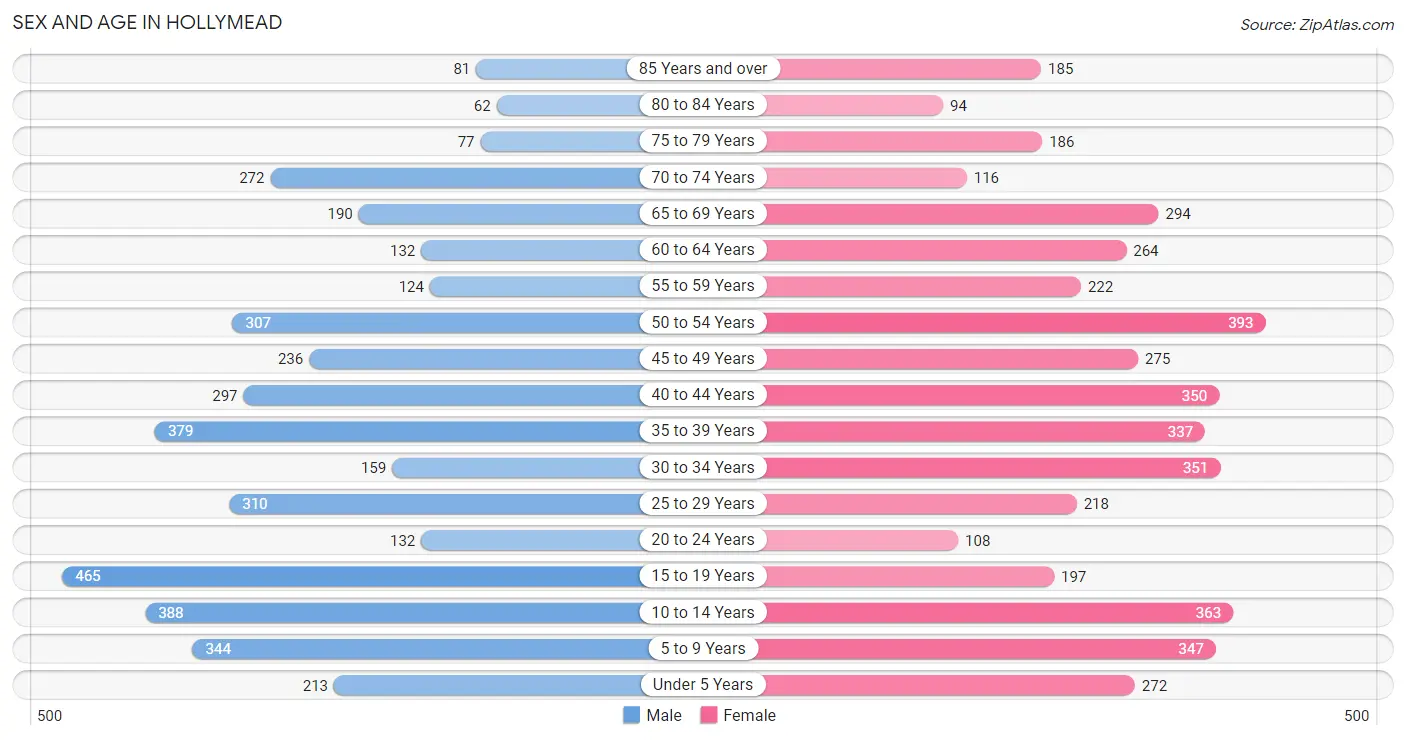
Sex and Age in Hollymead
Sex and Age in Hollymead
The most populous age groups in Hollymead are 15 to 19 Years (465 | 11.2%) for men and 50 to 54 Years (393 | 8.6%) for women.
| Age Bracket | Male | Female |
| Under 5 Years | 213 (5.1%) | 272 (5.9%) |
| 5 to 9 Years | 344 (8.3%) | 347 (7.6%) |
| 10 to 14 Years | 388 (9.3%) | 363 (7.9%) |
| 15 to 19 Years | 465 (11.2%) | 197 (4.3%) |
| 20 to 24 Years | 132 (3.2%) | 108 (2.4%) |
| 25 to 29 Years | 310 (7.4%) | 218 (4.8%) |
| 30 to 34 Years | 159 (3.8%) | 351 (7.7%) |
| 35 to 39 Years | 379 (9.1%) | 337 (7.4%) |
| 40 to 44 Years | 297 (7.1%) | 350 (7.7%) |
| 45 to 49 Years | 236 (5.7%) | 275 (6.0%) |
| 50 to 54 Years | 307 (7.4%) | 393 (8.6%) |
| 55 to 59 Years | 124 (3.0%) | 222 (4.9%) |
| 60 to 64 Years | 132 (3.2%) | 264 (5.8%) |
| 65 to 69 Years | 190 (4.6%) | 294 (6.4%) |
| 70 to 74 Years | 272 (6.5%) | 116 (2.5%) |
| 75 to 79 Years | 77 (1.8%) | 186 (4.1%) |
| 80 to 84 Years | 62 (1.5%) | 94 (2.1%) |
| 85 Years and over | 81 (1.9%) | 185 (4.1%) |
| Total | 4,168 (100.0%) | 4,572 (100.0%) |
Families and Households in Hollymead
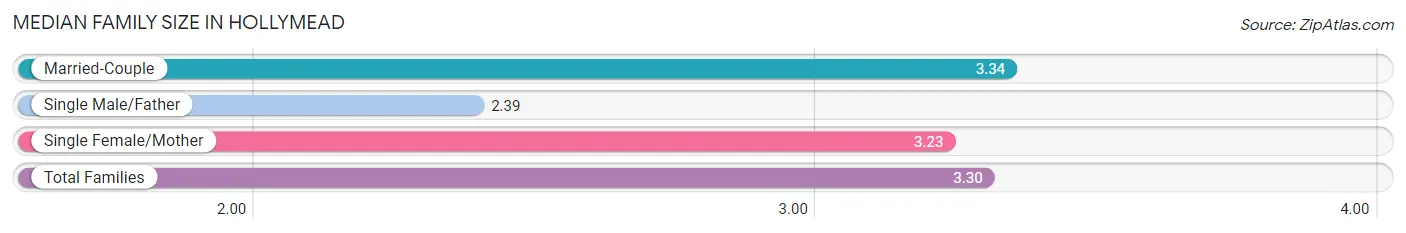
Median Family Size in Hollymead
The median family size in Hollymead is 3.30 persons per family, with married-couple families (1,812 | 79.6%) accounting for the largest median family size of 3.34 persons per family. On the other hand, single male/father families (41 | 1.8%) represent the smallest median family size with 2.39 persons per family.
| Family Type | # Families | Family Size |
| Married-Couple | 1,812 (79.6%) | 3.34 |
| Single Male/Father | 41 (1.8%) | 2.39 |
| Single Female/Mother | 423 (18.6%) | 3.23 |
| Total Families | 2,276 (100.0%) | 3.30 |
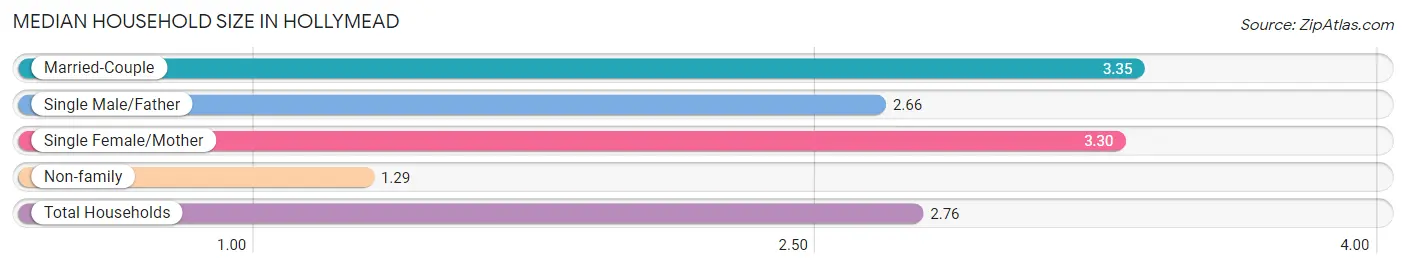
Median Household Size in Hollymead
The median household size in Hollymead is 2.76 persons per household, with married-couple households (1,812 | 57.3%) accounting for the largest median household size of 3.35 persons per household. non-family households (886 | 28.0%) represent the smallest median household size with 1.29 persons per household.
| Household Type | # Households | Household Size |
| Married-Couple | 1,812 (57.3%) | 3.35 |
| Single Male/Father | 41 (1.3%) | 2.66 |
| Single Female/Mother | 423 (13.4%) | 3.30 |
| Non-family | 886 (28.0%) | 1.29 |
| Total Households | 3,162 (100.0%) | 2.76 |
Household Size by Marriage Status in Hollymead
Out of a total of 3,162 households in Hollymead, 2,276 (72.0%) are family households, while 886 (28.0%) are nonfamily households. The most numerous type of family households are 2-person households, comprising 851, and the most common type of nonfamily households are 1-person households, comprising 738.
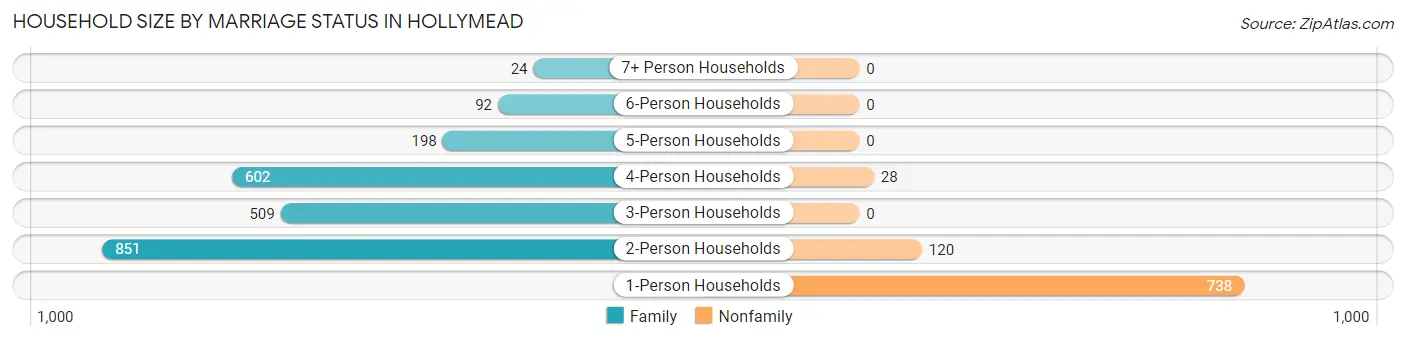
| Household Size | Family Households | Nonfamily Households |
| 1-Person Households | - | 738 (23.3%) |
| 2-Person Households | 851 (26.9%) | 120 (3.8%) |
| 3-Person Households | 509 (16.1%) | 0 (0.0%) |
| 4-Person Households | 602 (19.0%) | 28 (0.9%) |
| 5-Person Households | 198 (6.3%) | 0 (0.0%) |
| 6-Person Households | 92 (2.9%) | 0 (0.0%) |
| 7+ Person Households | 24 (0.8%) | 0 (0.0%) |
| Total | 2,276 (72.0%) | 886 (28.0%) |
Female Fertility in Hollymead
Fertility by Age in Hollymead
Average fertility rate in Hollymead is 49.0 births per 1,000 women. Women in the age bracket of 20 to 34 years have the highest fertility rate with 129.0 births per 1,000 women. Women in the age bracket of 20 to 34 years acount for 88.8% of all women with births.
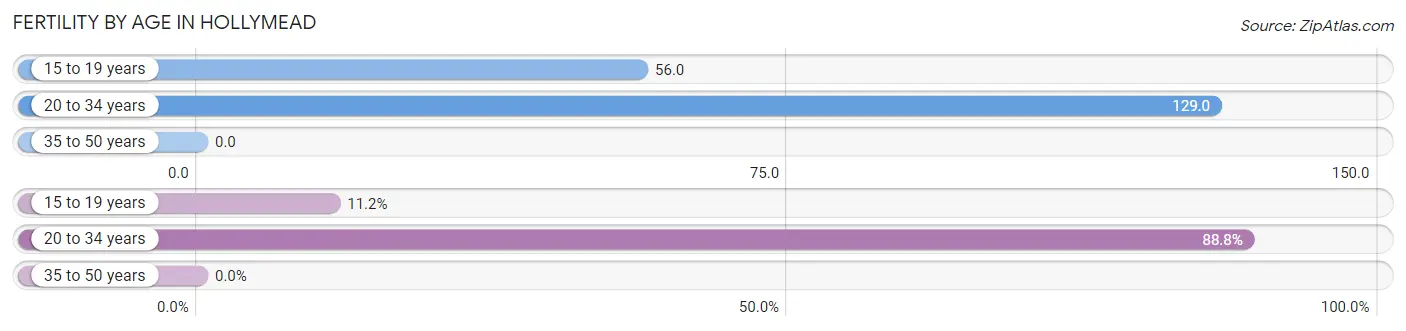
| Age Bracket | Women with Births | Births / 1,000 Women |
| 15 to 19 years | 11 (11.2%) | 56.0 |
| 20 to 34 years | 87 (88.8%) | 129.0 |
| 35 to 50 years | 0 (0.0%) | 0.0 |
| Total | 98 (100.0%) | 49.0 |
Fertility by Age by Marriage Status in Hollymead
28.6% of women with births (98) in Hollymead are married. The highest percentage of unmarried women with births falls into 15 to 19 years age bracket with 100.0% of them unmarried at the time of birth, while the lowest percentage of unmarried women with births belong to 20 to 34 years age bracket with 67.8% of them unmarried.
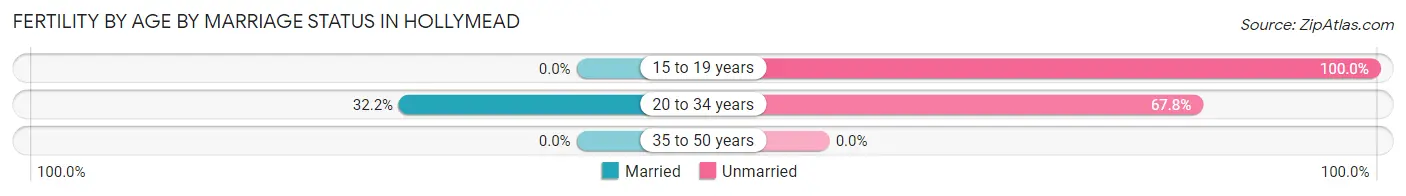
| Age Bracket | Married | Unmarried |
| 15 to 19 years | 0 (0.0%) | 11 (100.0%) |
| 20 to 34 years | 28 (32.2%) | 59 (67.8%) |
| 35 to 50 years | 0 (0.0%) | 0 (0.0%) |
| Total | 28 (28.6%) | 70 (71.4%) |
Fertility by Education in Hollymead
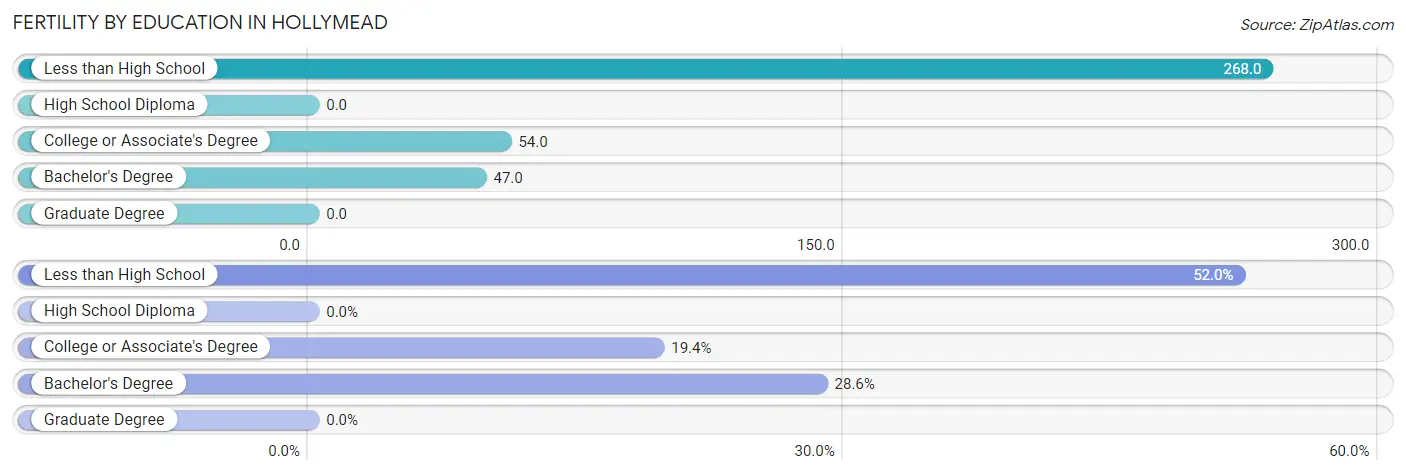
| Educational Attainment | Women with Births | Births / 1,000 Women |
| Less than High School | 51 (52.0%) | 268.0 |
| High School Diploma | 0 (0.0%) | 0.0 |
| College or Associate's Degree | 19 (19.4%) | 54.0 |
| Bachelor's Degree | 28 (28.6%) | 47.0 |
| Graduate Degree | 0 (0.0%) | 0.0 |
| Total | 98 (100.0%) | 49.0 |
Fertility by Education by Marriage Status in Hollymead
71.4% of women with births in Hollymead are unmarried. Women with the educational attainment of bachelor's degree are most likely to be married with 100.0% of them married at childbirth, while women with the educational attainment of less than high school are least likely to be married with 100.0% of them unmarried at childbirth.
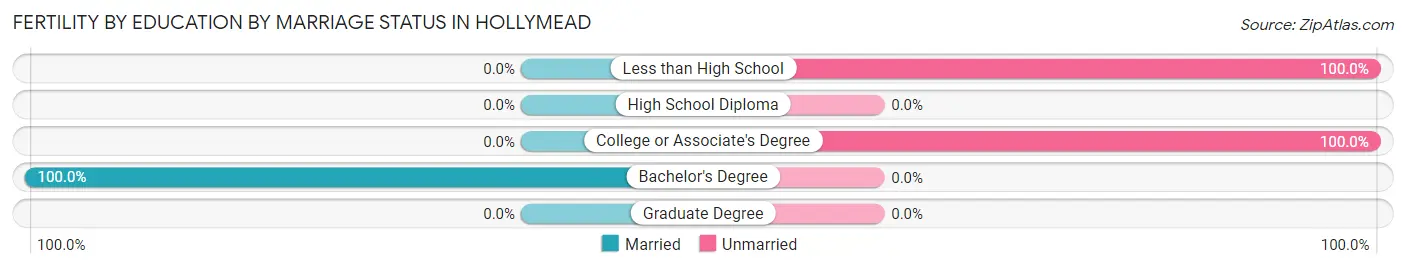
| Educational Attainment | Married | Unmarried |
| Less than High School | 0 (0.0%) | 51 (100.0%) |
| High School Diploma | 0 (0.0%) | 0 (0.0%) |
| College or Associate's Degree | 0 (0.0%) | 19 (100.0%) |
| Bachelor's Degree | 28 (100.0%) | 0 (0.0%) |
| Graduate Degree | 0 (0.0%) | 0 (0.0%) |
| Total | 28 (28.6%) | 70 (71.4%) |
Employment Characteristics in Hollymead
Employment by Class of Employer in Hollymead
Among the 4,343 employed individuals in Hollymead, private company employees (2,021 | 46.5%), local government employees (697 | 16.1%), and not-for-profit organizations (440 | 10.1%) make up the most common classes of employment.
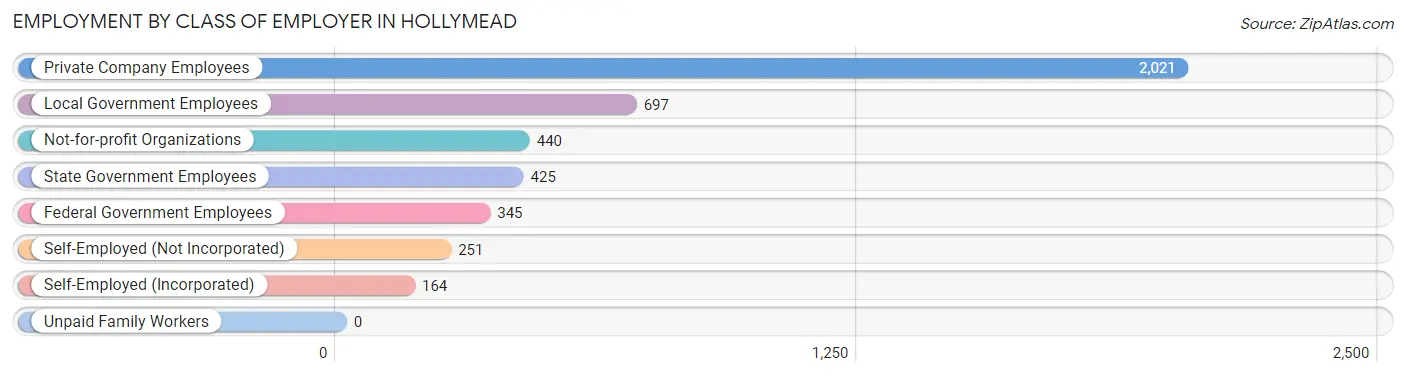
| Employer Class | # Employees | % Employees |
| Private Company Employees | 2,021 | 46.5% |
| Self-Employed (Incorporated) | 164 | 3.8% |
| Self-Employed (Not Incorporated) | 251 | 5.8% |
| Not-for-profit Organizations | 440 | 10.1% |
| Local Government Employees | 697 | 16.1% |
| State Government Employees | 425 | 9.8% |
| Federal Government Employees | 345 | 7.9% |
| Unpaid Family Workers | 0 | 0.0% |
| Total | 4,343 | 100.0% |
Employment Status by Age in Hollymead
According to the labor force statistics for Hollymead, out of the total population over 16 years of age (6,691), 67.2% or 4,496 individuals are in the labor force, with 2.6% or 117 of them unemployed. The age group with the highest labor force participation rate is 35 to 44 years, with 95.4% or 1,300 individuals in the labor force. Within the labor force, the 20 to 24 years age range has the highest percentage of unemployed individuals, with 6.6% or 10 of them being unemployed.
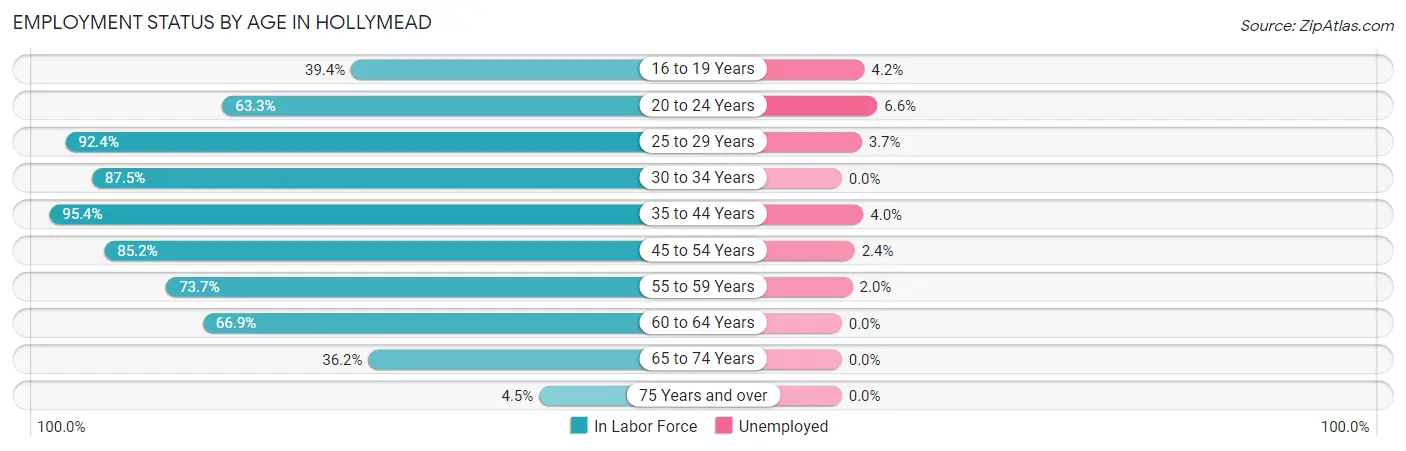
| Age Bracket | In Labor Force | Unemployed |
| 16 to 19 Years | 213 (39.4%) | 9 (4.2%) |
| 20 to 24 Years | 152 (63.3%) | 10 (6.6%) |
| 25 to 29 Years | 488 (92.4%) | 18 (3.7%) |
| 30 to 34 Years | 446 (87.5%) | 0 (0.0%) |
| 35 to 44 Years | 1,300 (95.4%) | 52 (4.0%) |
| 45 to 54 Years | 1,032 (85.2%) | 25 (2.4%) |
| 55 to 59 Years | 255 (73.7%) | 5 (2.0%) |
| 60 to 64 Years | 265 (66.9%) | 0 (0.0%) |
| 65 to 74 Years | 316 (36.2%) | 0 (0.0%) |
| 75 Years and over | 31 (4.5%) | 0 (0.0%) |
| Total | 4,496 (67.2%) | 117 (2.6%) |
Employment Status by Educational Attainment in Hollymead
According to labor force statistics for Hollymead, 87.0% of individuals (3,788) out of the total population between 25 and 64 years of age (4,354) are in the labor force, with 2.6% or 98 of them being unemployed. The group with the highest labor force participation rate are those with the educational attainment of bachelor's degree or higher, with 90.8% or 2,596 individuals in the labor force. Within the labor force, individuals with high school diploma education have the highest percentage of unemployment, with 8.0% or 52 of them being unemployed.
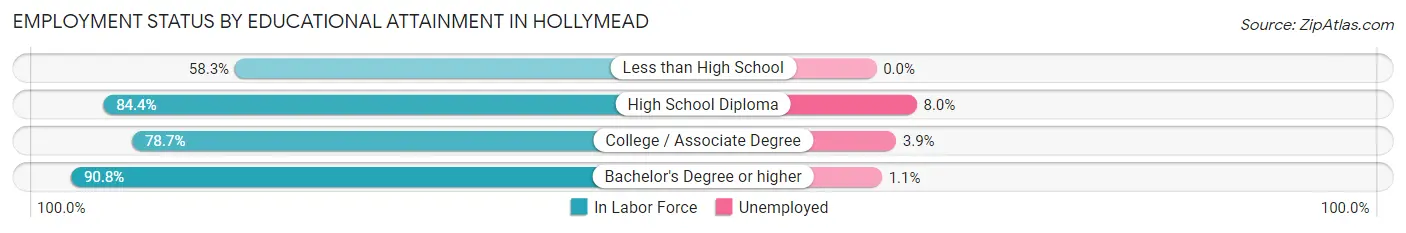
| Educational Attainment | In Labor Force | Unemployed |
| Less than High School | 84 (58.3%) | 0 (0.0%) |
| High School Diploma | 650 (84.4%) | 62 (8.0%) |
| College / Associate Degree | 457 (78.7%) | 23 (3.9%) |
| Bachelor's Degree or higher | 2,596 (90.8%) | 31 (1.1%) |
| Total | 3,788 (87.0%) | 113 (2.6%) |
Employment Occupations by Sex in Hollymead
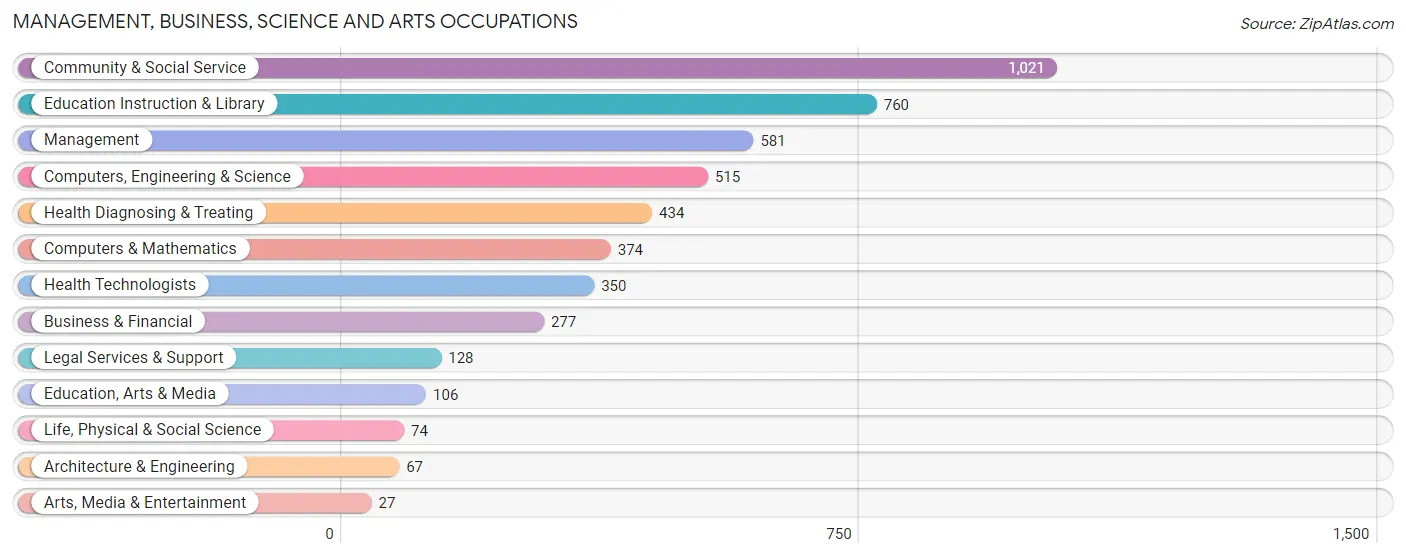
Management, Business, Science and Arts Occupations
The most common Management, Business, Science and Arts occupations in Hollymead are Community & Social Service (1,021 | 23.5%), Education Instruction & Library (760 | 17.5%), Management (581 | 13.4%), Computers, Engineering & Science (515 | 11.9%), and Health Diagnosing & Treating (434 | 10.0%).
Management, Business, Science and Arts Occupations by Sex
Within the Management, Business, Science and Arts occupations in Hollymead, the most male-oriented occupations are Life, Physical & Social Science (100.0%), Architecture & Engineering (92.5%), and Computers, Engineering & Science (71.5%), while the most female-oriented occupations are Arts, Media & Entertainment (88.9%), Health Diagnosing & Treating (82.7%), and Health Technologists (79.4%).
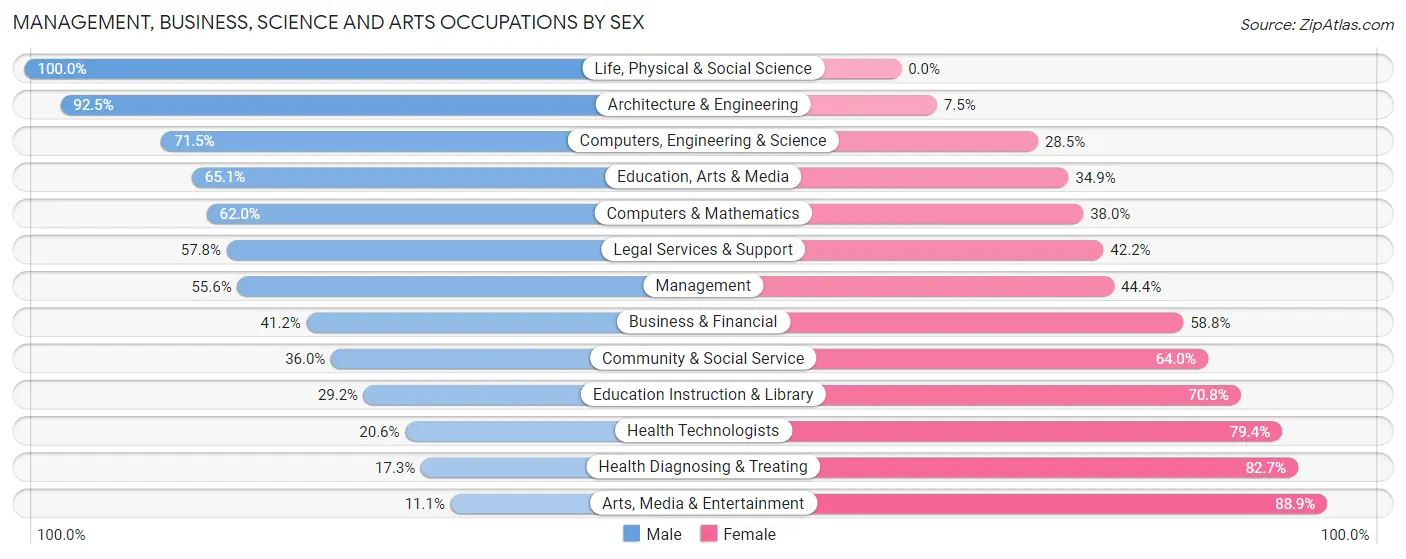
| Occupation | Male | Female |
| Management | 323 (55.6%) | 258 (44.4%) |
| Business & Financial | 114 (41.2%) | 163 (58.8%) |
| Computers, Engineering & Science | 368 (71.5%) | 147 (28.5%) |
| Computers & Mathematics | 232 (62.0%) | 142 (38.0%) |
| Architecture & Engineering | 62 (92.5%) | 5 (7.5%) |
| Life, Physical & Social Science | 74 (100.0%) | 0 (0.0%) |
| Community & Social Service | 368 (36.0%) | 653 (64.0%) |
| Education, Arts & Media | 69 (65.1%) | 37 (34.9%) |
| Legal Services & Support | 74 (57.8%) | 54 (42.2%) |
| Education Instruction & Library | 222 (29.2%) | 538 (70.8%) |
| Arts, Media & Entertainment | 3 (11.1%) | 24 (88.9%) |
| Health Diagnosing & Treating | 75 (17.3%) | 359 (82.7%) |
| Health Technologists | 72 (20.6%) | 278 (79.4%) |
| Total (Category) | 1,248 (44.1%) | 1,580 (55.9%) |
| Total (Overall) | 2,125 (48.9%) | 2,219 (51.1%) |
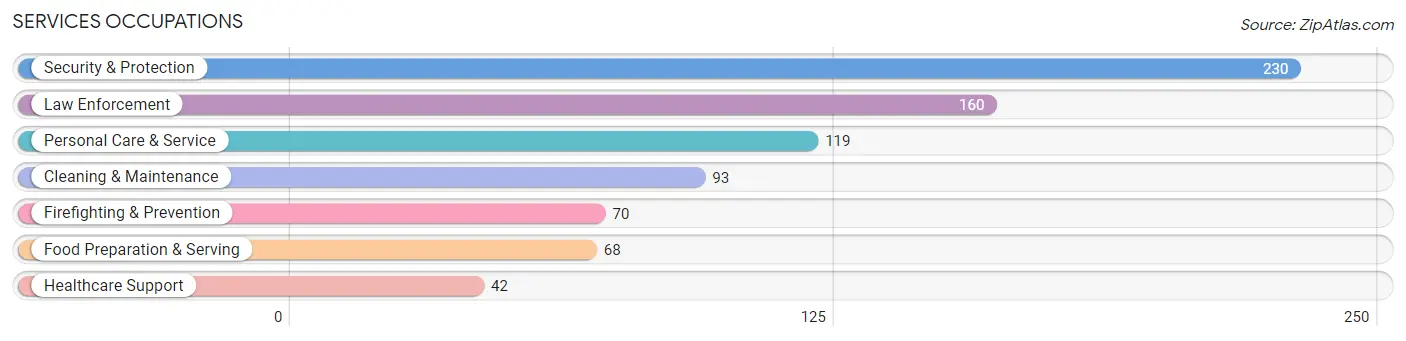
Services Occupations
The most common Services occupations in Hollymead are Security & Protection (230 | 5.3%), Law Enforcement (160 | 3.7%), Personal Care & Service (119 | 2.7%), Cleaning & Maintenance (93 | 2.1%), and Firefighting & Prevention (70 | 1.6%).
Services Occupations by Sex
Within the Services occupations in Hollymead, the most male-oriented occupations are Law Enforcement (80.6%), Security & Protection (80.4%), and Firefighting & Prevention (80.0%), while the most female-oriented occupations are Healthcare Support (71.4%), Personal Care & Service (43.7%), and Cleaning & Maintenance (35.5%).
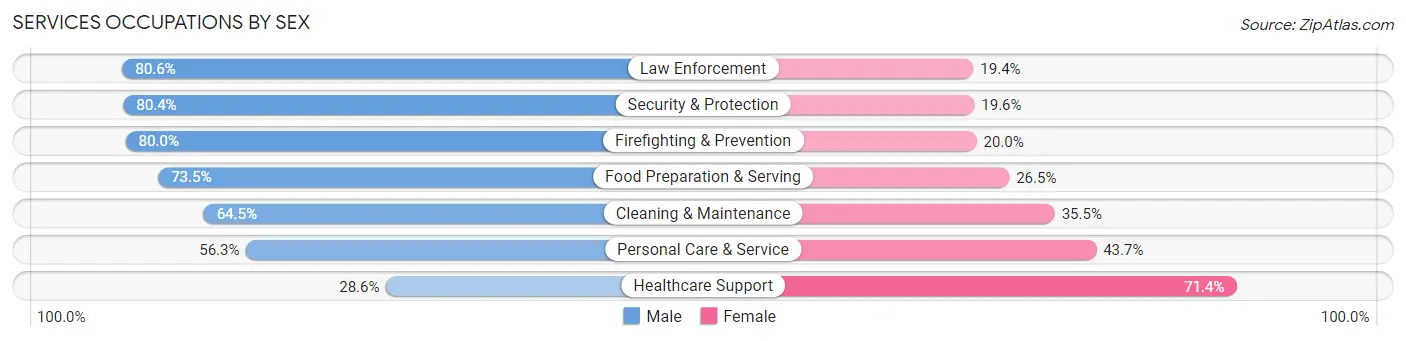
| Occupation | Male | Female |
| Healthcare Support | 12 (28.6%) | 30 (71.4%) |
| Security & Protection | 185 (80.4%) | 45 (19.6%) |
| Firefighting & Prevention | 56 (80.0%) | 14 (20.0%) |
| Law Enforcement | 129 (80.6%) | 31 (19.4%) |
| Food Preparation & Serving | 50 (73.5%) | 18 (26.5%) |
| Cleaning & Maintenance | 60 (64.5%) | 33 (35.5%) |
| Personal Care & Service | 67 (56.3%) | 52 (43.7%) |
| Total (Category) | 374 (67.7%) | 178 (32.3%) |
| Total (Overall) | 2,125 (48.9%) | 2,219 (51.1%) |
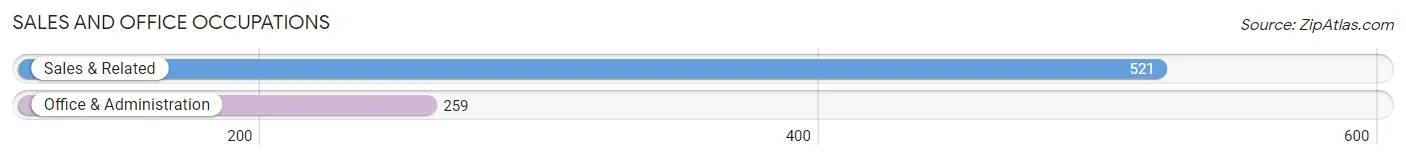
Sales and Office Occupations
The most common Sales and Office occupations in Hollymead are Sales & Related (521 | 12.0%), and Office & Administration (259 | 6.0%).
Sales and Office Occupations by Sex
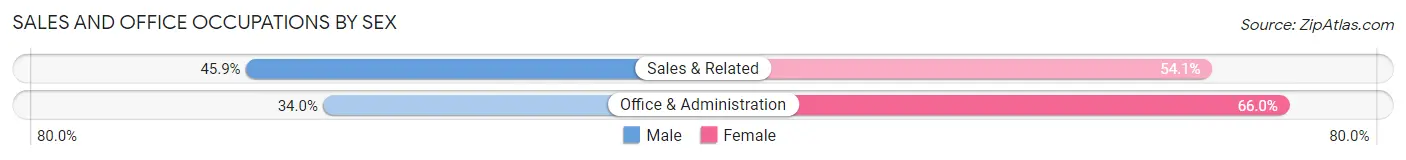
| Occupation | Male | Female |
| Sales & Related | 239 (45.9%) | 282 (54.1%) |
| Office & Administration | 88 (34.0%) | 171 (66.0%) |
| Total (Category) | 327 (41.9%) | 453 (58.1%) |
| Total (Overall) | 2,125 (48.9%) | 2,219 (51.1%) |
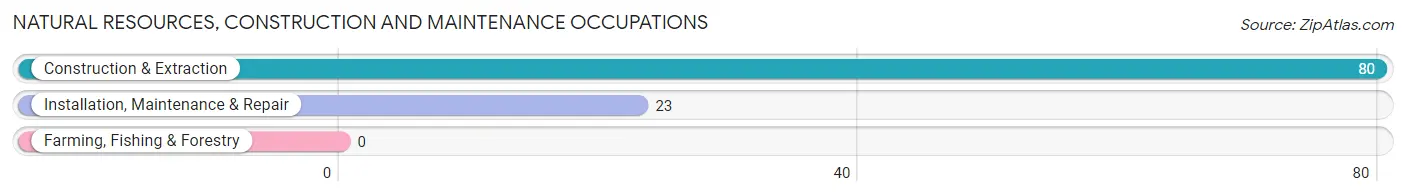
Natural Resources, Construction and Maintenance Occupations
The most common Natural Resources, Construction and Maintenance occupations in Hollymead are Construction & Extraction (80 | 1.8%), and Installation, Maintenance & Repair (23 | 0.5%).
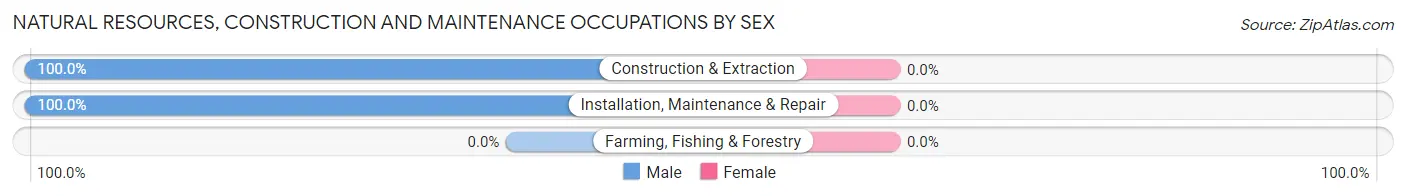
Natural Resources, Construction and Maintenance Occupations by Sex
| Occupation | Male | Female |
| Farming, Fishing & Forestry | 0 (0.0%) | 0 (0.0%) |
| Construction & Extraction | 80 (100.0%) | 0 (0.0%) |
| Installation, Maintenance & Repair | 23 (100.0%) | 0 (0.0%) |
| Total (Category) | 103 (100.0%) | 0 (0.0%) |
| Total (Overall) | 2,125 (48.9%) | 2,219 (51.1%) |
Production, Transportation and Moving Occupations
The most common Production, Transportation and Moving occupations in Hollymead are Production (41 | 0.9%), Transportation (26 | 0.6%), and Material Moving (14 | 0.3%).
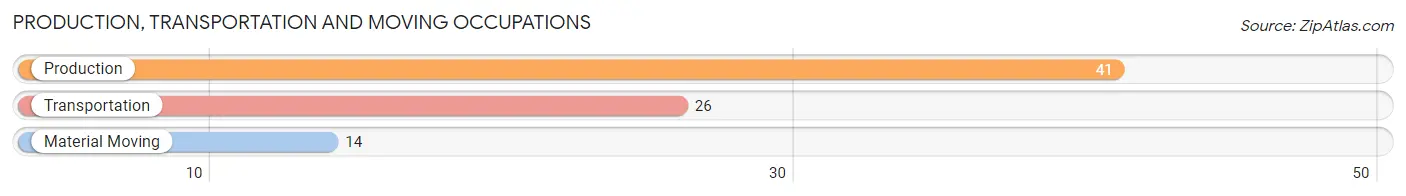
Production, Transportation and Moving Occupations by Sex
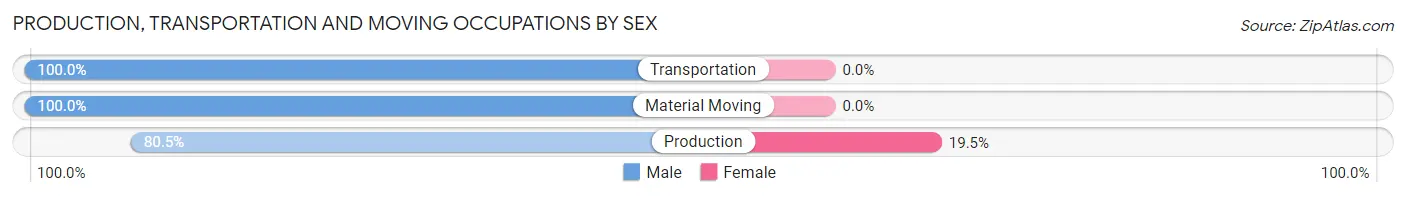
| Occupation | Male | Female |
| Production | 33 (80.5%) | 8 (19.5%) |
| Transportation | 26 (100.0%) | 0 (0.0%) |
| Material Moving | 14 (100.0%) | 0 (0.0%) |
| Total (Category) | 73 (90.1%) | 8 (9.9%) |
| Total (Overall) | 2,125 (48.9%) | 2,219 (51.1%) |
Employment Industries by Sex in Hollymead
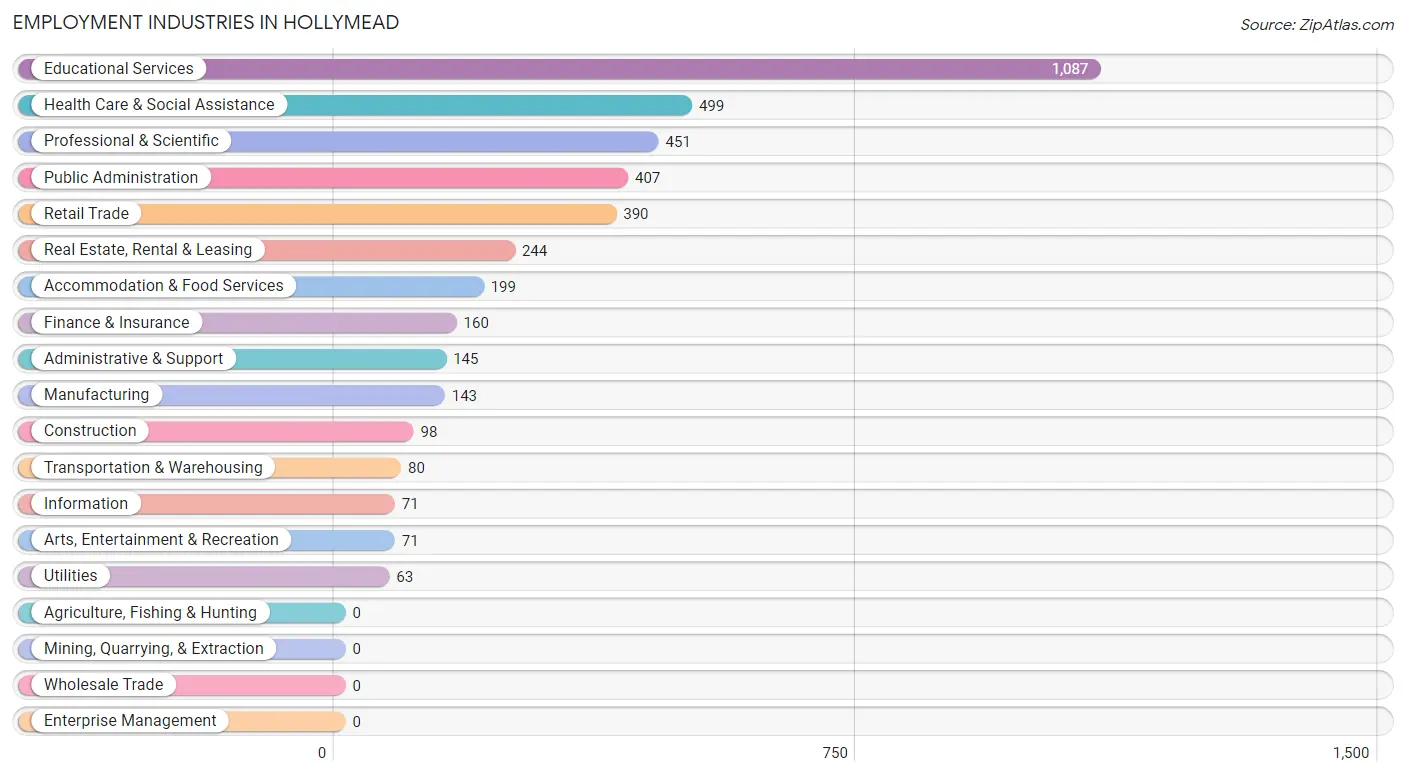
Employment Industries in Hollymead
The major employment industries in Hollymead include Educational Services (1,087 | 25.0%), Health Care & Social Assistance (499 | 11.5%), Professional & Scientific (451 | 10.4%), Public Administration (407 | 9.4%), and Retail Trade (390 | 9.0%).
Employment Industries by Sex in Hollymead
The Hollymead industries that see more men than women are Construction (100.0%), Utilities (100.0%), and Transportation & Warehousing (90.0%), whereas the industries that tend to have a higher number of women are Finance & Insurance (81.2%), Health Care & Social Assistance (76.7%), and Educational Services (66.0%).
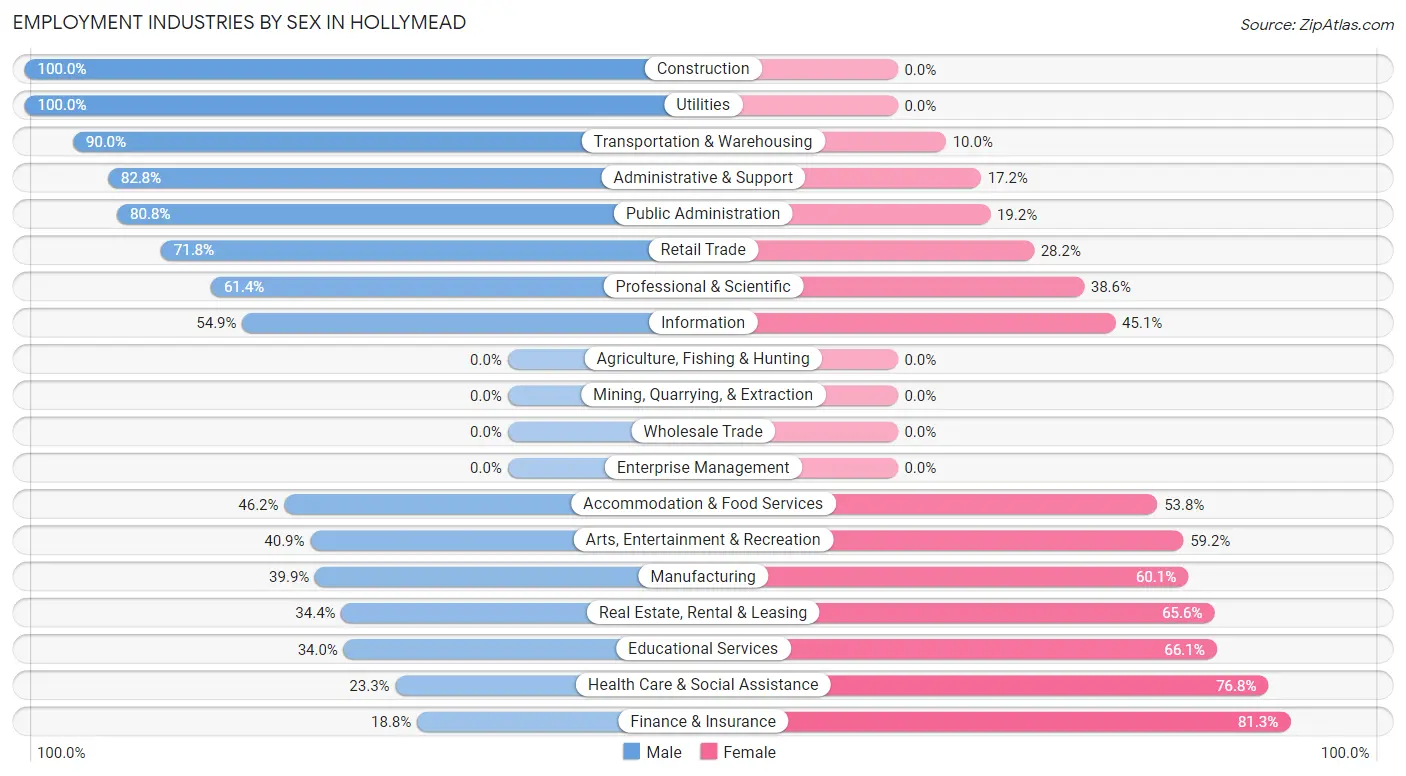
| Industry | Male | Female |
| Agriculture, Fishing & Hunting | 0 (0.0%) | 0 (0.0%) |
| Mining, Quarrying, & Extraction | 0 (0.0%) | 0 (0.0%) |
| Construction | 98 (100.0%) | 0 (0.0%) |
| Manufacturing | 57 (39.9%) | 86 (60.1%) |
| Wholesale Trade | 0 (0.0%) | 0 (0.0%) |
| Retail Trade | 280 (71.8%) | 110 (28.2%) |
| Transportation & Warehousing | 72 (90.0%) | 8 (10.0%) |
| Utilities | 63 (100.0%) | 0 (0.0%) |
| Information | 39 (54.9%) | 32 (45.1%) |
| Finance & Insurance | 30 (18.8%) | 130 (81.2%) |
| Real Estate, Rental & Leasing | 84 (34.4%) | 160 (65.6%) |
| Professional & Scientific | 277 (61.4%) | 174 (38.6%) |
| Enterprise Management | 0 (0.0%) | 0 (0.0%) |
| Administrative & Support | 120 (82.8%) | 25 (17.2%) |
| Educational Services | 369 (34.0%) | 718 (66.0%) |
| Health Care & Social Assistance | 116 (23.3%) | 383 (76.7%) |
| Arts, Entertainment & Recreation | 29 (40.8%) | 42 (59.2%) |
| Accommodation & Food Services | 92 (46.2%) | 107 (53.8%) |
| Public Administration | 329 (80.8%) | 78 (19.2%) |
| Total | 2,125 (48.9%) | 2,219 (51.1%) |
Education in Hollymead
School Enrollment in Hollymead
The most common levels of schooling among the 2,390 students in Hollymead are middle school (611 | 25.6%), high school (578 | 24.2%), and elementary school (408 | 17.1%).
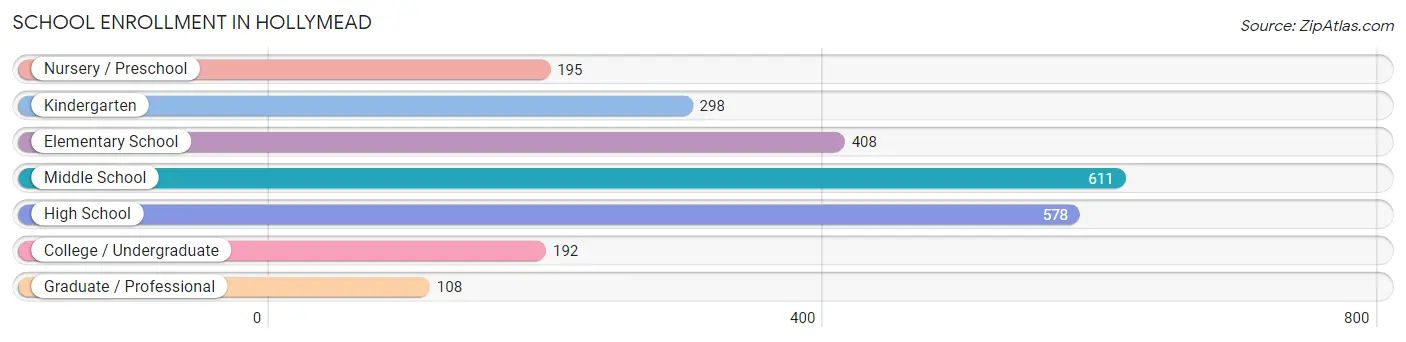
| School Level | # Students | % Students |
| Nursery / Preschool | 195 | 8.2% |
| Kindergarten | 298 | 12.5% |
| Elementary School | 408 | 17.1% |
| Middle School | 611 | 25.6% |
| High School | 578 | 24.2% |
| College / Undergraduate | 192 | 8.0% |
| Graduate / Professional | 108 | 4.5% |
| Total | 2,390 | 100.0% |
School Enrollment by Age by Funding Source in Hollymead
Out of a total of 2,390 students who are enrolled in schools in Hollymead, 215 (9.0%) attend a private institution, while the remaining 2,175 (91.0%) are enrolled in public schools. The age group of 3 to 4 year olds has the highest likelihood of being enrolled in private schools, with 63 (40.1% in the age bracket) enrolled. Conversely, the age group of 18 to 19 year olds has the lowest likelihood of being enrolled in a private school, with 114 (100.0% in the age bracket) attending a public institution.
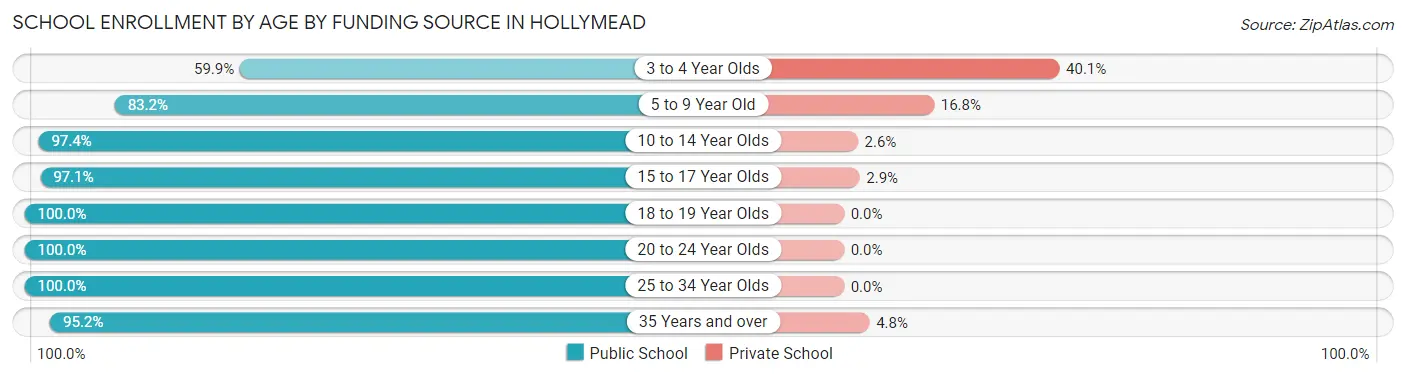
| Age Bracket | Public School | Private School |
| 3 to 4 Year Olds | 94 (59.9%) | 63 (40.1%) |
| 5 to 9 Year Old | 575 (83.2%) | 116 (16.8%) |
| 10 to 14 Year Olds | 715 (97.4%) | 19 (2.6%) |
| 15 to 17 Year Olds | 432 (97.1%) | 13 (2.9%) |
| 18 to 19 Year Olds | 114 (100.0%) | 0 (0.0%) |
| 20 to 24 Year Olds | 84 (100.0%) | 0 (0.0%) |
| 25 to 34 Year Olds | 60 (100.0%) | 0 (0.0%) |
| 35 Years and over | 100 (95.2%) | 5 (4.8%) |
| Total | 2,175 (91.0%) | 215 (9.0%) |
Educational Attainment by Field of Study in Hollymead
Science & technology (474 | 12.6%), education (432 | 11.5%), business (363 | 9.6%), social sciences (351 | 9.3%), and engineering (303 | 8.0%) are the most common fields of study among 3,768 individuals in Hollymead who have obtained a bachelor's degree or higher.
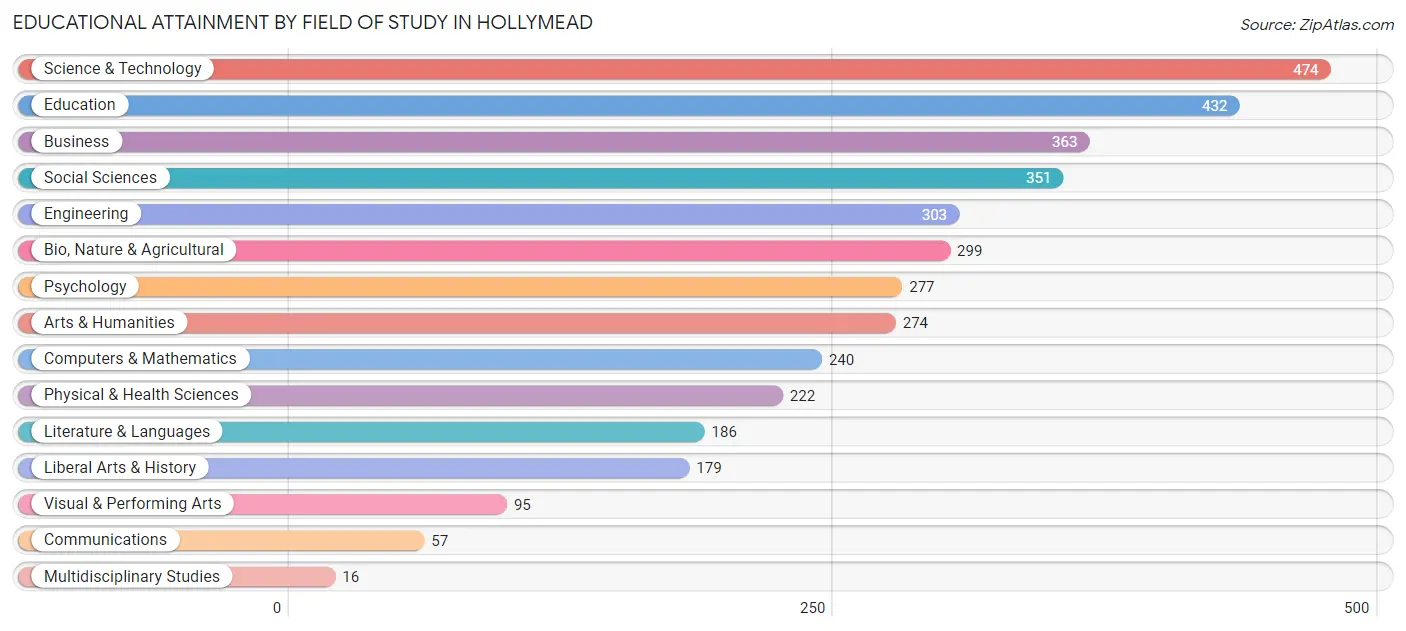
| Field of Study | # Graduates | % Graduates |
| Computers & Mathematics | 240 | 6.4% |
| Bio, Nature & Agricultural | 299 | 7.9% |
| Physical & Health Sciences | 222 | 5.9% |
| Psychology | 277 | 7.3% |
| Social Sciences | 351 | 9.3% |
| Engineering | 303 | 8.0% |
| Multidisciplinary Studies | 16 | 0.4% |
| Science & Technology | 474 | 12.6% |
| Business | 363 | 9.6% |
| Education | 432 | 11.5% |
| Literature & Languages | 186 | 4.9% |
| Liberal Arts & History | 179 | 4.8% |
| Visual & Performing Arts | 95 | 2.5% |
| Communications | 57 | 1.5% |
| Arts & Humanities | 274 | 7.3% |
| Total | 3,768 | 100.0% |
Transportation & Commute in Hollymead
Vehicle Availability by Sex in Hollymead
The most prevalent vehicle ownership categories in Hollymead are males with 2 vehicles (1,258, accounting for 58.7%) and females with 2 vehicles (1,090, making up 57.2%).
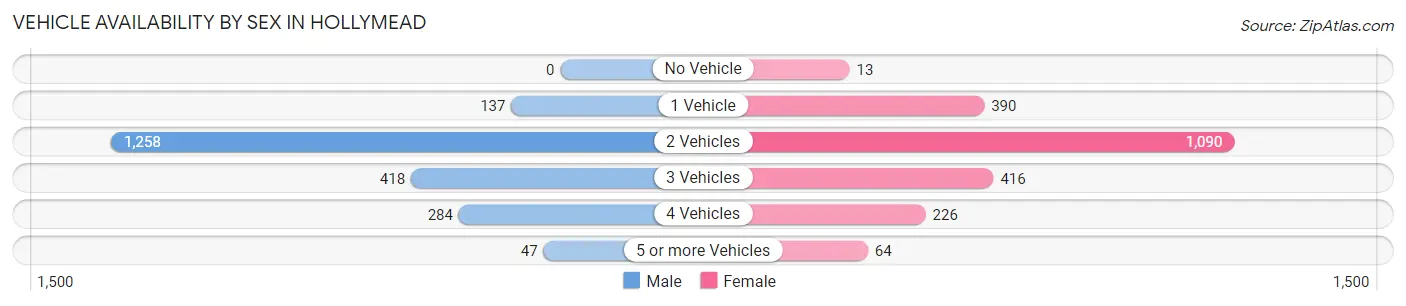
| Vehicles Available | Male | Female |
| No Vehicle | 0 (0.0%) | 13 (0.6%) |
| 1 Vehicle | 137 (6.4%) | 390 (17.7%) |
| 2 Vehicles | 1,258 (58.7%) | 1,090 (49.6%) |
| 3 Vehicles | 418 (19.5%) | 416 (18.9%) |
| 4 Vehicles | 284 (13.3%) | 226 (10.3%) |
| 5 or more Vehicles | 47 (2.2%) | 64 (2.9%) |
| Total | 2,144 (100.0%) | 2,199 (100.0%) |
Commute Time in Hollymead
The most frequently occuring commute durations in Hollymead are 20 to 24 minutes (945 commuters, 26.1%), 10 to 14 minutes (523 commuters, 14.5%), and 15 to 19 minutes (457 commuters, 12.6%).
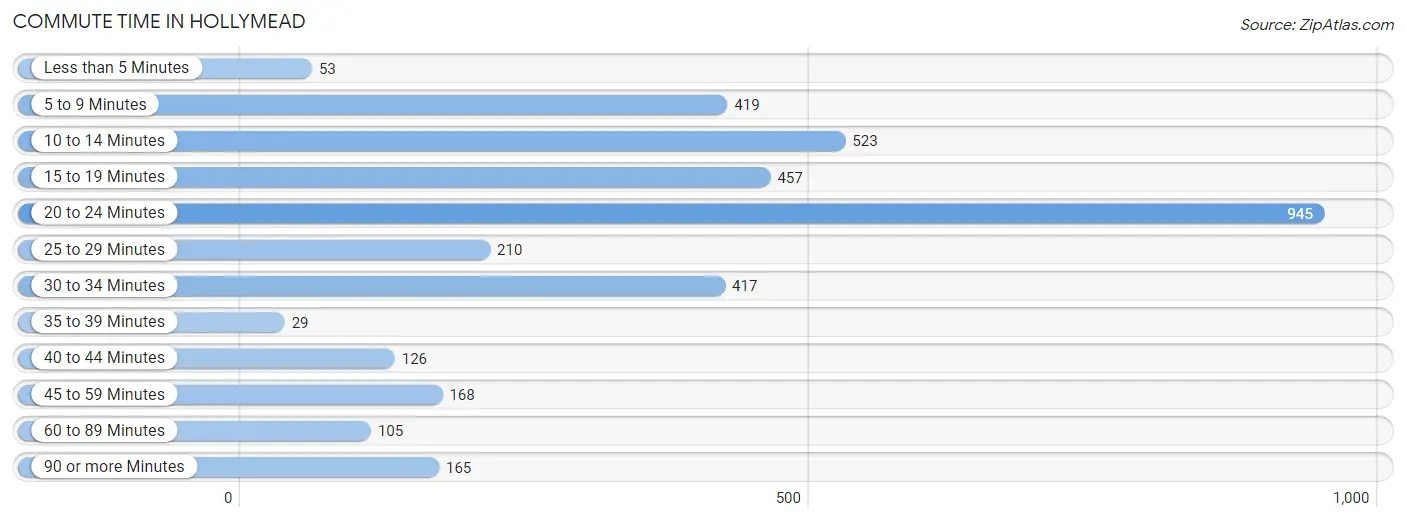
| Commute Time | # Commuters | % Commuters |
| Less than 5 Minutes | 53 | 1.5% |
| 5 to 9 Minutes | 419 | 11.6% |
| 10 to 14 Minutes | 523 | 14.5% |
| 15 to 19 Minutes | 457 | 12.6% |
| 20 to 24 Minutes | 945 | 26.1% |
| 25 to 29 Minutes | 210 | 5.8% |
| 30 to 34 Minutes | 417 | 11.5% |
| 35 to 39 Minutes | 29 | 0.8% |
| 40 to 44 Minutes | 126 | 3.5% |
| 45 to 59 Minutes | 168 | 4.6% |
| 60 to 89 Minutes | 105 | 2.9% |
| 90 or more Minutes | 165 | 4.6% |
Commute Time by Sex in Hollymead
The most common commute times in Hollymead are 20 to 24 minutes (394 commuters, 21.7%) for males and 20 to 24 minutes (551 commuters, 30.6%) for females.
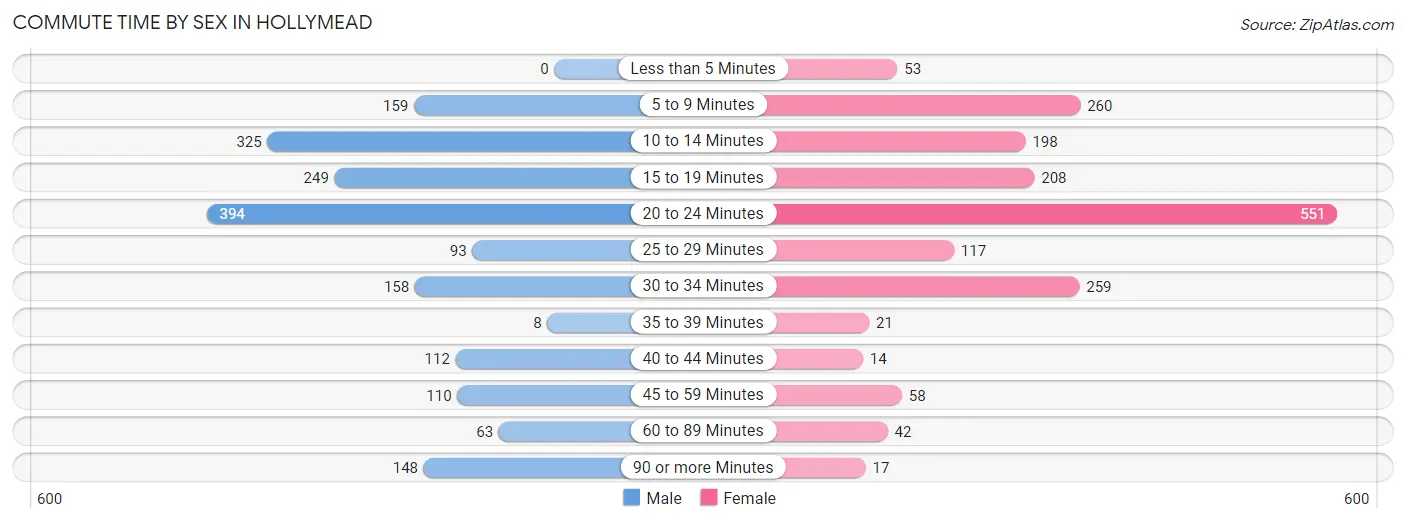
| Commute Time | Male | Female |
| Less than 5 Minutes | 0 (0.0%) | 53 (2.9%) |
| 5 to 9 Minutes | 159 (8.7%) | 260 (14.5%) |
| 10 to 14 Minutes | 325 (17.9%) | 198 (11.0%) |
| 15 to 19 Minutes | 249 (13.7%) | 208 (11.6%) |
| 20 to 24 Minutes | 394 (21.7%) | 551 (30.6%) |
| 25 to 29 Minutes | 93 (5.1%) | 117 (6.5%) |
| 30 to 34 Minutes | 158 (8.7%) | 259 (14.4%) |
| 35 to 39 Minutes | 8 (0.4%) | 21 (1.2%) |
| 40 to 44 Minutes | 112 (6.2%) | 14 (0.8%) |
| 45 to 59 Minutes | 110 (6.0%) | 58 (3.2%) |
| 60 to 89 Minutes | 63 (3.5%) | 42 (2.3%) |
| 90 or more Minutes | 148 (8.1%) | 17 (0.9%) |
Time of Departure to Work by Sex in Hollymead
The most frequent times of departure to work in Hollymead are 7:00 AM to 7:29 AM (390, 21.4%) for males and 7:30 AM to 7:59 AM (390, 21.7%) for females.
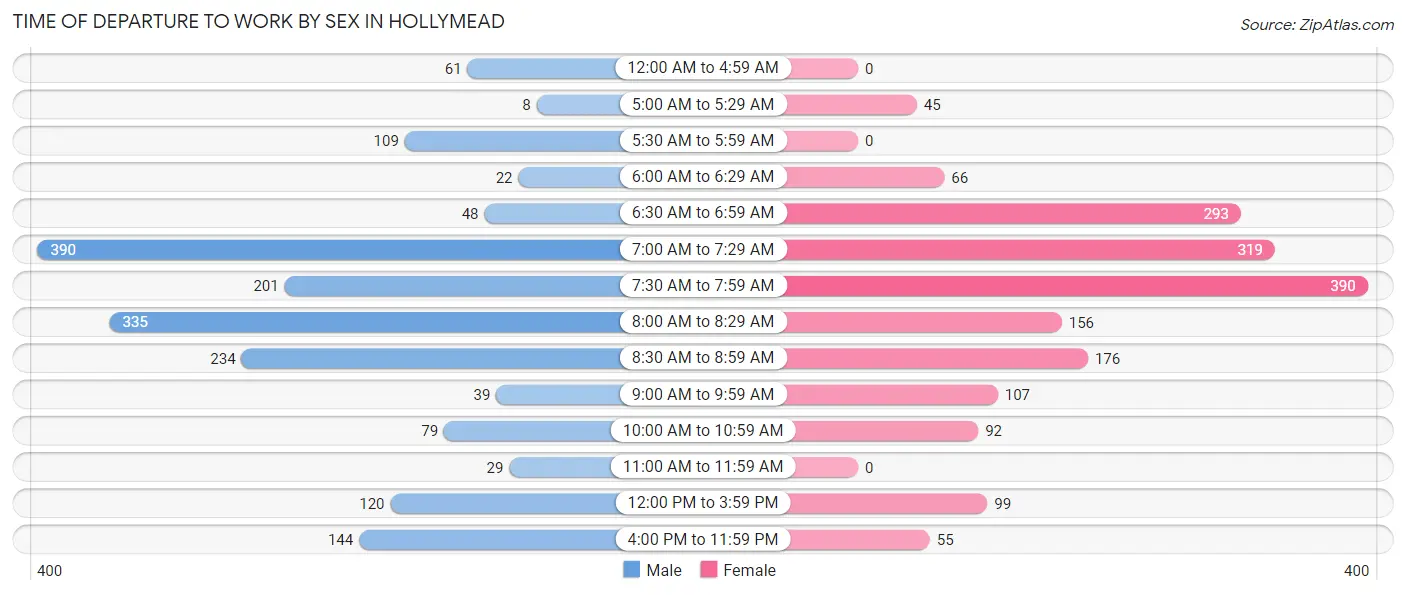
| Time of Departure | Male | Female |
| 12:00 AM to 4:59 AM | 61 (3.4%) | 0 (0.0%) |
| 5:00 AM to 5:29 AM | 8 (0.4%) | 45 (2.5%) |
| 5:30 AM to 5:59 AM | 109 (6.0%) | 0 (0.0%) |
| 6:00 AM to 6:29 AM | 22 (1.2%) | 66 (3.7%) |
| 6:30 AM to 6:59 AM | 48 (2.6%) | 293 (16.3%) |
| 7:00 AM to 7:29 AM | 390 (21.4%) | 319 (17.7%) |
| 7:30 AM to 7:59 AM | 201 (11.1%) | 390 (21.7%) |
| 8:00 AM to 8:29 AM | 335 (18.4%) | 156 (8.7%) |
| 8:30 AM to 8:59 AM | 234 (12.9%) | 176 (9.8%) |
| 9:00 AM to 9:59 AM | 39 (2.1%) | 107 (5.9%) |
| 10:00 AM to 10:59 AM | 79 (4.3%) | 92 (5.1%) |
| 11:00 AM to 11:59 AM | 29 (1.6%) | 0 (0.0%) |
| 12:00 PM to 3:59 PM | 120 (6.6%) | 99 (5.5%) |
| 4:00 PM to 11:59 PM | 144 (7.9%) | 55 (3.1%) |
| Total | 1,819 (100.0%) | 1,798 (100.0%) |
Housing Occupancy in Hollymead
Occupancy by Ownership in Hollymead
Of the total 3,162 dwellings in Hollymead, owner-occupied units account for 2,576 (81.5%), while renter-occupied units make up 586 (18.5%).
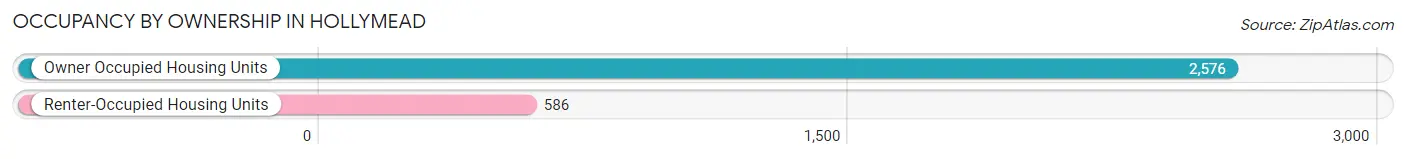
| Occupancy | # Housing Units | % Housing Units |
| Owner Occupied Housing Units | 2,576 | 81.5% |
| Renter-Occupied Housing Units | 586 | 18.5% |
| Total Occupied Housing Units | 3,162 | 100.0% |
Occupancy by Household Size in Hollymead
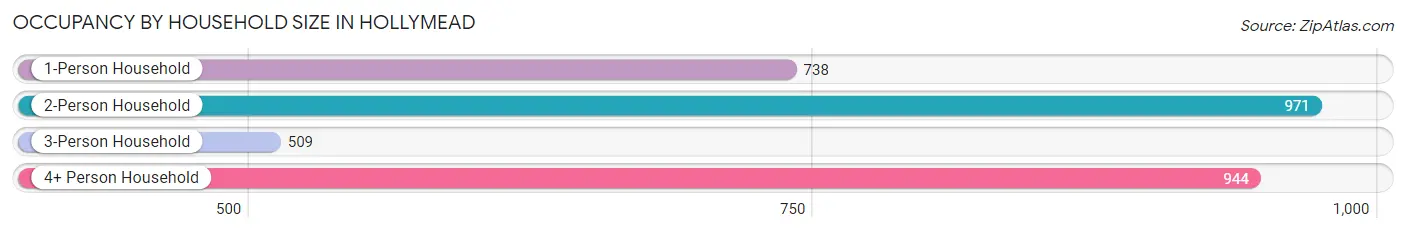
| Household Size | # Housing Units | % Housing Units |
| 1-Person Household | 738 | 23.3% |
| 2-Person Household | 971 | 30.7% |
| 3-Person Household | 509 | 16.1% |
| 4+ Person Household | 944 | 29.8% |
| Total Housing Units | 3,162 | 100.0% |
Occupancy by Ownership by Household Size in Hollymead
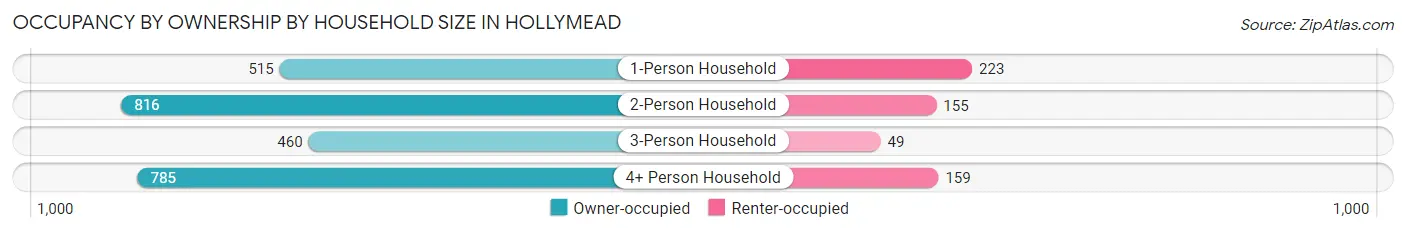
| Household Size | Owner-occupied | Renter-occupied |
| 1-Person Household | 515 (69.8%) | 223 (30.2%) |
| 2-Person Household | 816 (84.0%) | 155 (16.0%) |
| 3-Person Household | 460 (90.4%) | 49 (9.6%) |
| 4+ Person Household | 785 (83.2%) | 159 (16.8%) |
| Total Housing Units | 2,576 (81.5%) | 586 (18.5%) |
Occupancy by Educational Attainment in Hollymead
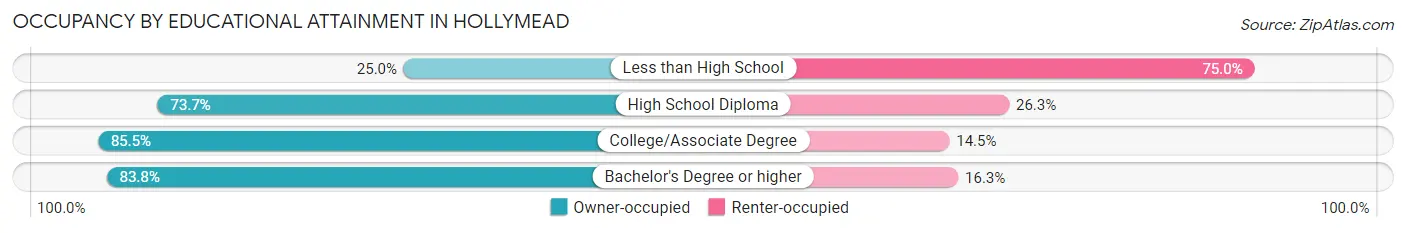
| Household Size | Owner-occupied | Renter-occupied |
| Less than High School | 16 (25.0%) | 48 (75.0%) |
| High School Diploma | 344 (73.7%) | 123 (26.3%) |
| College/Associate Degree | 613 (85.5%) | 104 (14.5%) |
| Bachelor's Degree or higher | 1,603 (83.8%) | 311 (16.3%) |
Occupancy by Age of Householder in Hollymead
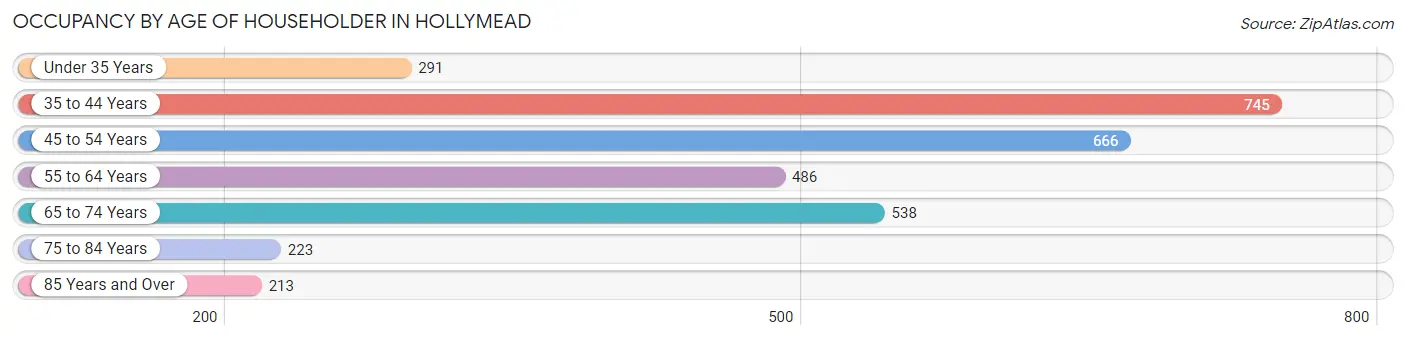
| Age Bracket | # Households | % Households |
| Under 35 Years | 291 | 9.2% |
| 35 to 44 Years | 745 | 23.6% |
| 45 to 54 Years | 666 | 21.1% |
| 55 to 64 Years | 486 | 15.4% |
| 65 to 74 Years | 538 | 17.0% |
| 75 to 84 Years | 223 | 7.0% |
| 85 Years and Over | 213 | 6.7% |
| Total | 3,162 | 100.0% |
Housing Finances in Hollymead
Median Income by Occupancy in Hollymead
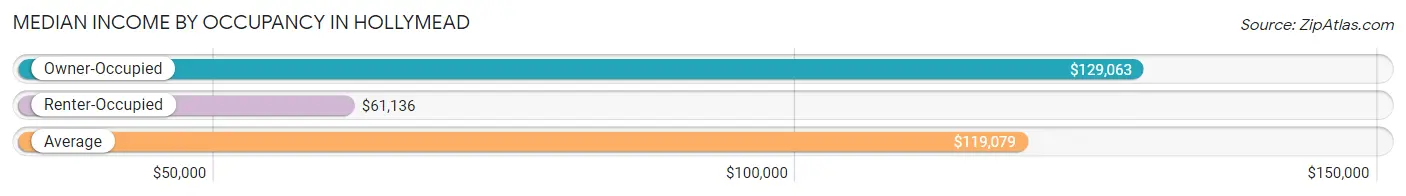
| Occupancy Type | # Households | Median Income |
| Owner-Occupied | 2,576 (81.5%) | $129,063 |
| Renter-Occupied | 586 (18.5%) | $61,136 |
| Average | 3,162 (100.0%) | $119,079 |
Occupancy by Householder Income Bracket in Hollymead
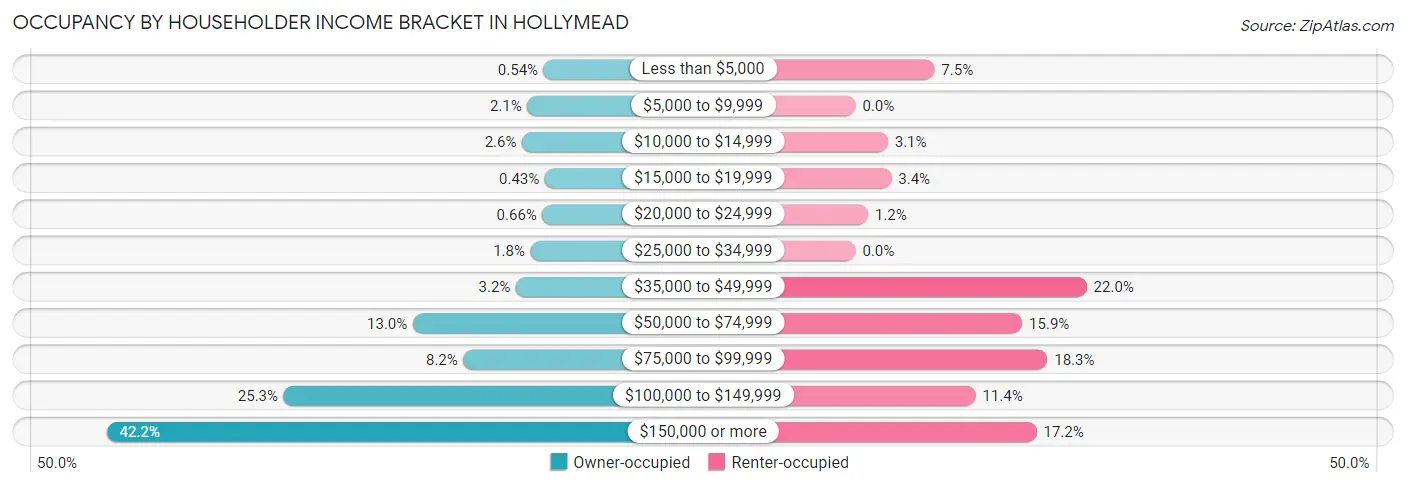
| Income Bracket | Owner-occupied | Renter-occupied |
| Less than $5,000 | 14 (0.5%) | 44 (7.5%) |
| $5,000 to $9,999 | 54 (2.1%) | 0 (0.0%) |
| $10,000 to $14,999 | 67 (2.6%) | 18 (3.1%) |
| $15,000 to $19,999 | 11 (0.4%) | 20 (3.4%) |
| $20,000 to $24,999 | 17 (0.7%) | 7 (1.2%) |
| $25,000 to $34,999 | 46 (1.8%) | 0 (0.0%) |
| $35,000 to $49,999 | 82 (3.2%) | 129 (22.0%) |
| $50,000 to $74,999 | 335 (13.0%) | 93 (15.9%) |
| $75,000 to $99,999 | 211 (8.2%) | 107 (18.3%) |
| $100,000 to $149,999 | 652 (25.3%) | 67 (11.4%) |
| $150,000 or more | 1,087 (42.2%) | 101 (17.2%) |
| Total | 2,576 (100.0%) | 586 (100.0%) |
Monthly Housing Cost Tiers in Hollymead
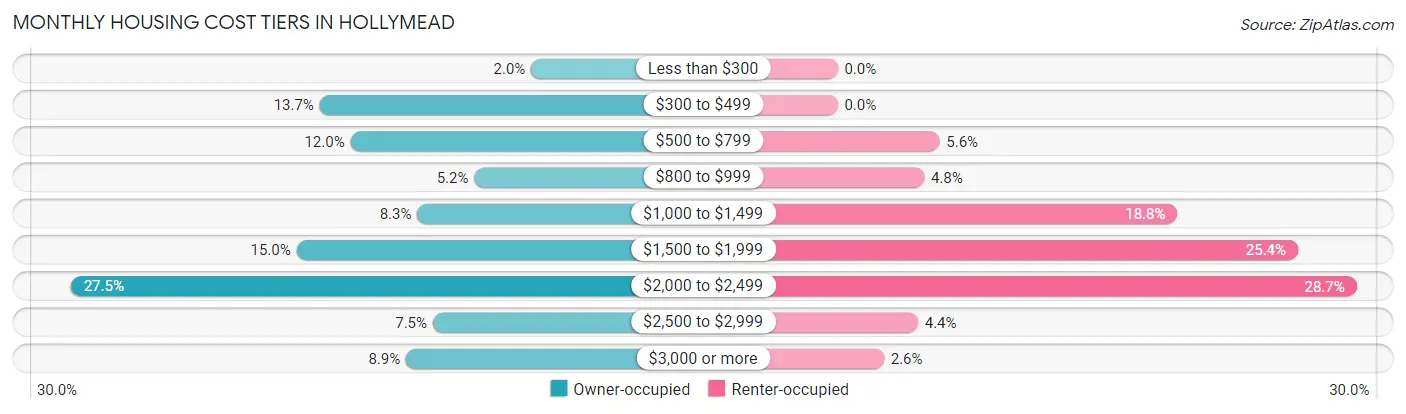
| Monthly Cost | Owner-occupied | Renter-occupied |
| Less than $300 | 52 (2.0%) | 0 (0.0%) |
| $300 to $499 | 353 (13.7%) | 0 (0.0%) |
| $500 to $799 | 309 (12.0%) | 33 (5.6%) |
| $800 to $999 | 133 (5.2%) | 28 (4.8%) |
| $1,000 to $1,499 | 214 (8.3%) | 110 (18.8%) |
| $1,500 to $1,999 | 386 (15.0%) | 149 (25.4%) |
| $2,000 to $2,499 | 707 (27.5%) | 168 (28.7%) |
| $2,500 to $2,999 | 192 (7.4%) | 26 (4.4%) |
| $3,000 or more | 230 (8.9%) | 15 (2.6%) |
| Total | 2,576 (100.0%) | 586 (100.0%) |
Physical Housing Characteristics in Hollymead
Housing Structures in Hollymead
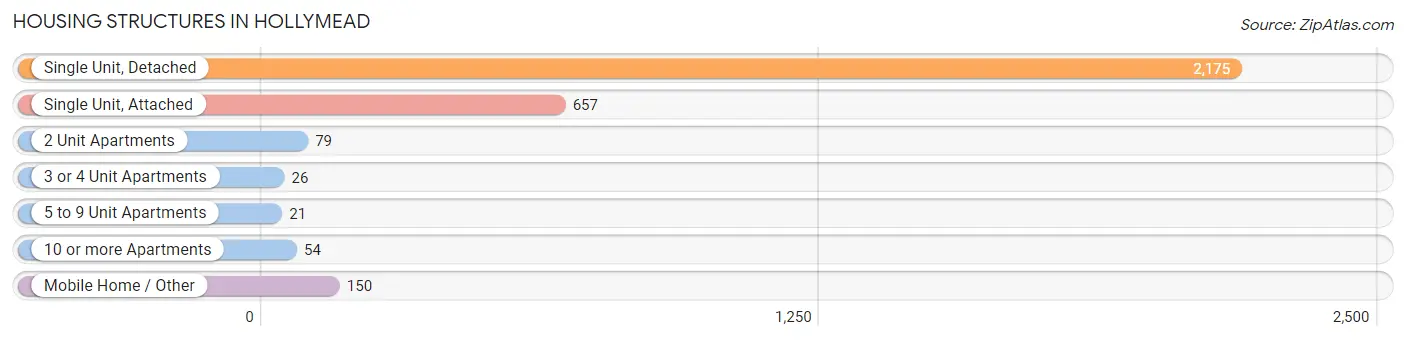
| Structure Type | # Housing Units | % Housing Units |
| Single Unit, Detached | 2,175 | 68.8% |
| Single Unit, Attached | 657 | 20.8% |
| 2 Unit Apartments | 79 | 2.5% |
| 3 or 4 Unit Apartments | 26 | 0.8% |
| 5 to 9 Unit Apartments | 21 | 0.7% |
| 10 or more Apartments | 54 | 1.7% |
| Mobile Home / Other | 150 | 4.7% |
| Total | 3,162 | 100.0% |
Housing Structures by Occupancy in Hollymead
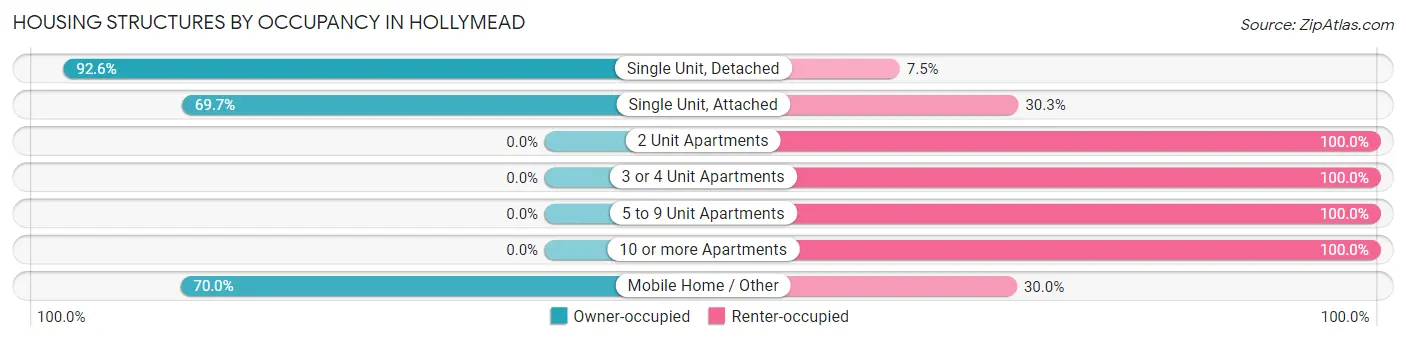
| Structure Type | Owner-occupied | Renter-occupied |
| Single Unit, Detached | 2,013 (92.5%) | 162 (7.4%) |
| Single Unit, Attached | 458 (69.7%) | 199 (30.3%) |
| 2 Unit Apartments | 0 (0.0%) | 79 (100.0%) |
| 3 or 4 Unit Apartments | 0 (0.0%) | 26 (100.0%) |
| 5 to 9 Unit Apartments | 0 (0.0%) | 21 (100.0%) |
| 10 or more Apartments | 0 (0.0%) | 54 (100.0%) |
| Mobile Home / Other | 105 (70.0%) | 45 (30.0%) |
| Total | 2,576 (81.5%) | 586 (18.5%) |
Housing Structures by Number of Rooms in Hollymead
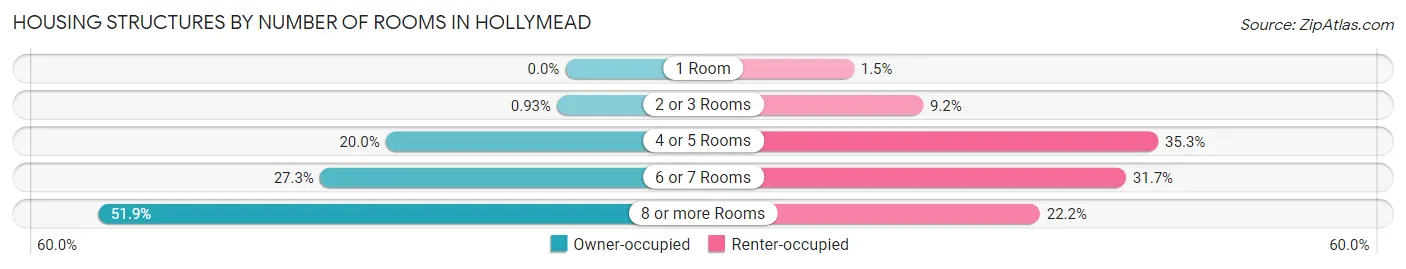
| Number of Rooms | Owner-occupied | Renter-occupied |
| 1 Room | 0 (0.0%) | 9 (1.5%) |
| 2 or 3 Rooms | 24 (0.9%) | 54 (9.2%) |
| 4 or 5 Rooms | 514 (20.0%) | 207 (35.3%) |
| 6 or 7 Rooms | 702 (27.3%) | 186 (31.7%) |
| 8 or more Rooms | 1,336 (51.9%) | 130 (22.2%) |
| Total | 2,576 (100.0%) | 586 (100.0%) |
Housing Structure by Heating Type in Hollymead
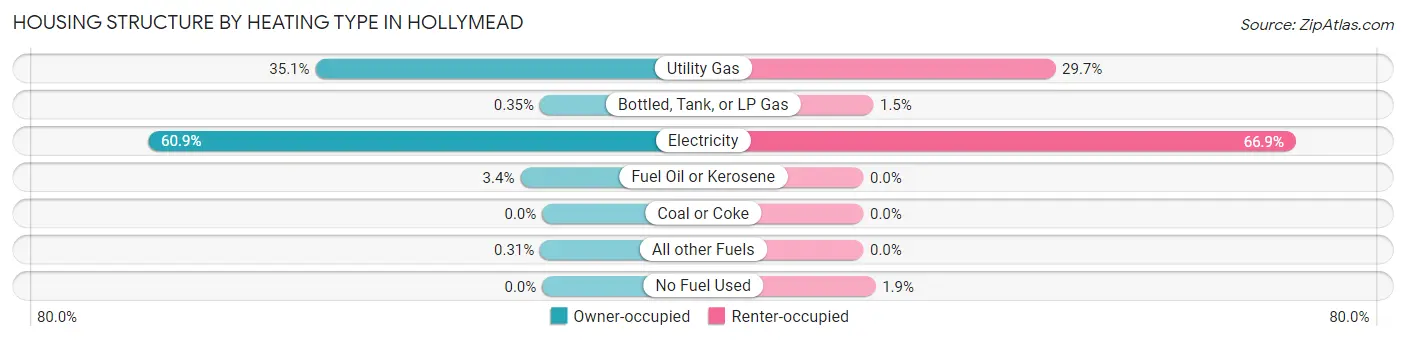
| Heating Type | Owner-occupied | Renter-occupied |
| Utility Gas | 903 (35.0%) | 174 (29.7%) |
| Bottled, Tank, or LP Gas | 9 (0.4%) | 9 (1.5%) |
| Electricity | 1,569 (60.9%) | 392 (66.9%) |
| Fuel Oil or Kerosene | 87 (3.4%) | 0 (0.0%) |
| Coal or Coke | 0 (0.0%) | 0 (0.0%) |
| All other Fuels | 8 (0.3%) | 0 (0.0%) |
| No Fuel Used | 0 (0.0%) | 11 (1.9%) |
| Total | 2,576 (100.0%) | 586 (100.0%) |
Household Vehicle Usage in Hollymead
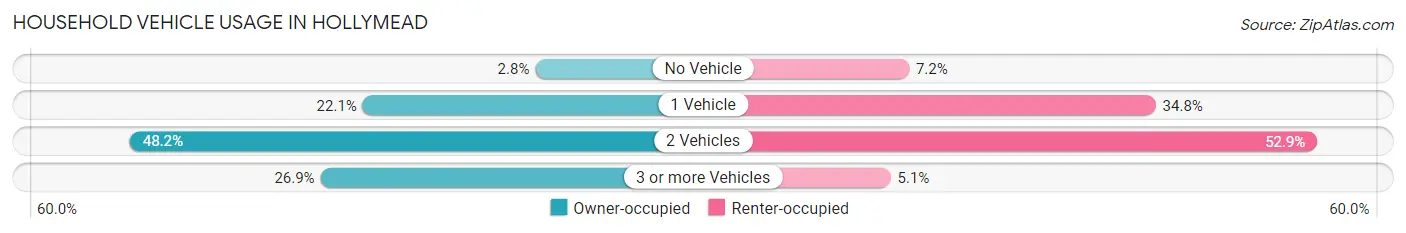
| Vehicles per Household | Owner-occupied | Renter-occupied |
| No Vehicle | 72 (2.8%) | 42 (7.2%) |
| 1 Vehicle | 570 (22.1%) | 204 (34.8%) |
| 2 Vehicles | 1,242 (48.2%) | 310 (52.9%) |
| 3 or more Vehicles | 692 (26.9%) | 30 (5.1%) |
| Total | 2,576 (100.0%) | 586 (100.0%) |
Real Estate & Mortgages in Hollymead
Real Estate and Mortgage Overview in Hollymead
| Characteristic | Without Mortgage | With Mortgage |
| Housing Units | 839 | 1,737 |
| Median Property Value | $401,300 | $397,100 |
| Median Household Income | $98,090 | $904 |
| Monthly Housing Costs | $538 | $214 |
| Real Estate Taxes | $3,116 | $23 |
Property Value by Mortgage Status in Hollymead
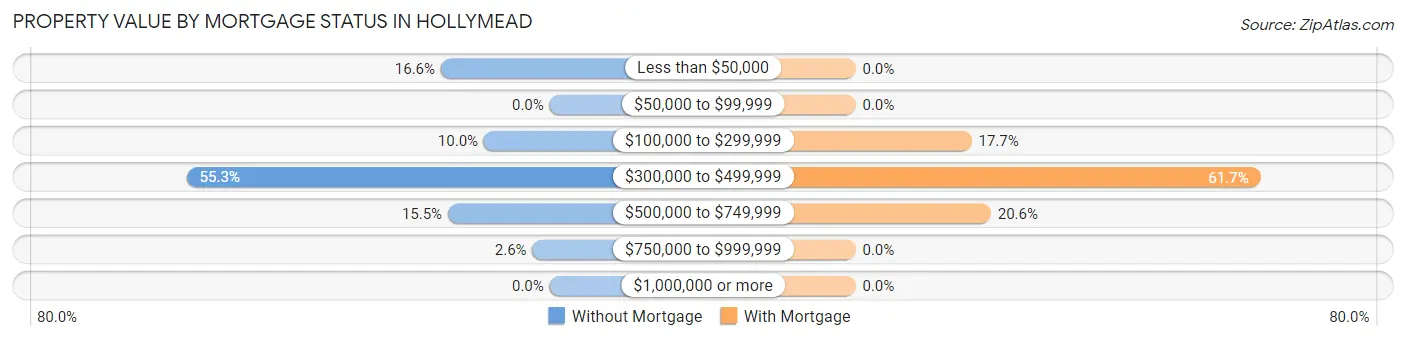
| Property Value | Without Mortgage | With Mortgage |
| Less than $50,000 | 139 (16.6%) | 0 (0.0%) |
| $50,000 to $99,999 | 0 (0.0%) | 0 (0.0%) |
| $100,000 to $299,999 | 84 (10.0%) | 307 (17.7%) |
| $300,000 to $499,999 | 464 (55.3%) | 1,072 (61.7%) |
| $500,000 to $749,999 | 130 (15.5%) | 358 (20.6%) |
| $750,000 to $999,999 | 22 (2.6%) | 0 (0.0%) |
| $1,000,000 or more | 0 (0.0%) | 0 (0.0%) |
| Total | 839 (100.0%) | 1,737 (100.0%) |
Household Income by Mortgage Status in Hollymead
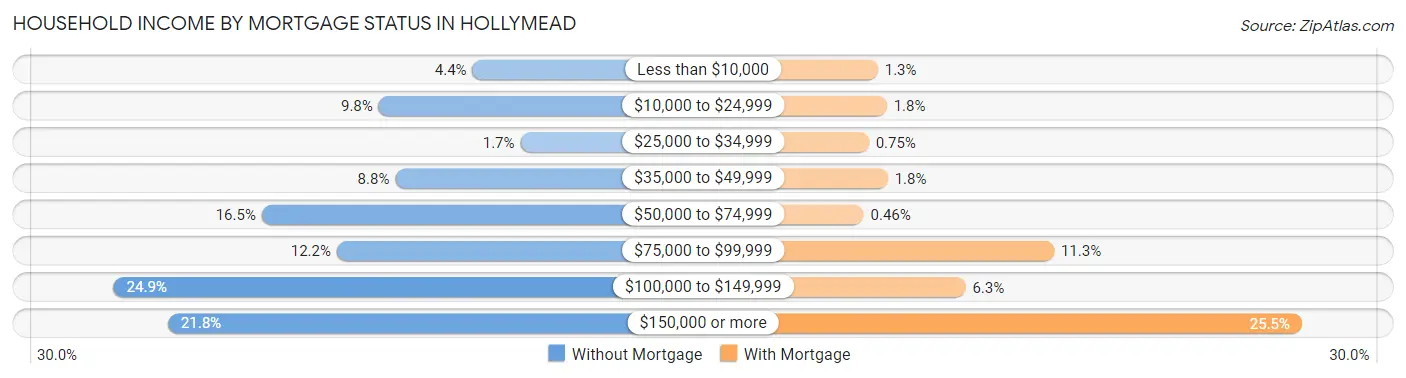
| Household Income | Without Mortgage | With Mortgage |
| Less than $10,000 | 37 (4.4%) | 22 (1.3%) |
| $10,000 to $24,999 | 82 (9.8%) | 31 (1.8%) |
| $25,000 to $34,999 | 14 (1.7%) | 13 (0.7%) |
| $35,000 to $49,999 | 74 (8.8%) | 32 (1.8%) |
| $50,000 to $74,999 | 138 (16.5%) | 8 (0.5%) |
| $75,000 to $99,999 | 102 (12.2%) | 197 (11.3%) |
| $100,000 to $149,999 | 209 (24.9%) | 109 (6.3%) |
| $150,000 or more | 183 (21.8%) | 443 (25.5%) |
| Total | 839 (100.0%) | 1,737 (100.0%) |
Property Value to Household Income Ratio in Hollymead
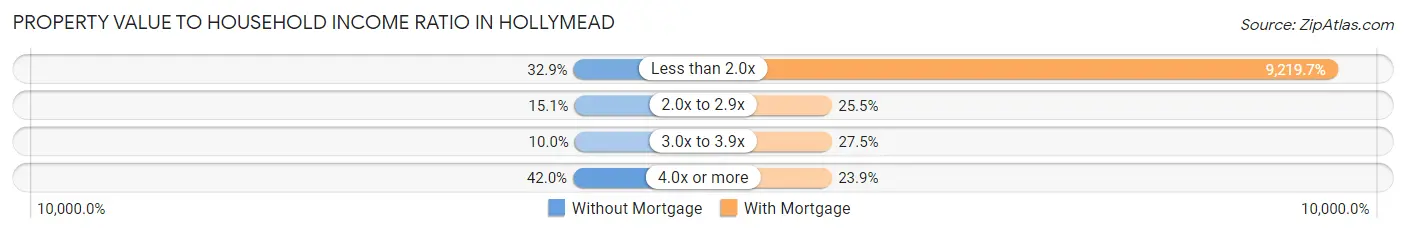
| Value-to-Income Ratio | Without Mortgage | With Mortgage |
| Less than 2.0x | 276 (32.9%) | 160,146 (9,219.7%) |
| 2.0x to 2.9x | 127 (15.1%) | 443 (25.5%) |
| 3.0x to 3.9x | 84 (10.0%) | 478 (27.5%) |
| 4.0x or more | 352 (41.9%) | 415 (23.9%) |
| Total | 839 (100.0%) | 1,737 (100.0%) |
Real Estate Taxes by Mortgage Status in Hollymead
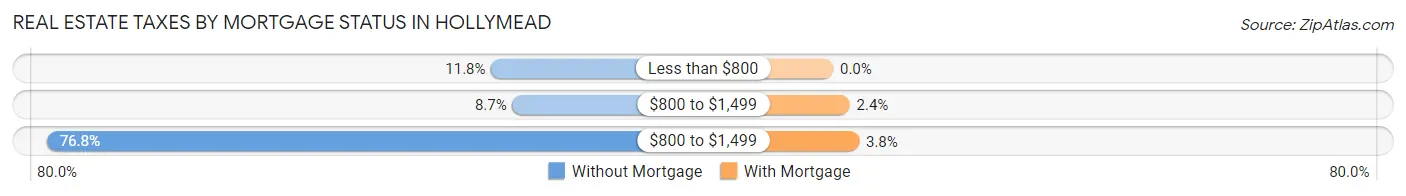
| Property Taxes | Without Mortgage | With Mortgage |
| Less than $800 | 99 (11.8%) | 0 (0.0%) |
| $800 to $1,499 | 73 (8.7%) | 42 (2.4%) |
| $800 to $1,499 | 644 (76.8%) | 66 (3.8%) |
| Total | 839 (100.0%) | 1,737 (100.0%) |
Health & Disability in Hollymead
Health Insurance Coverage by Age in Hollymead
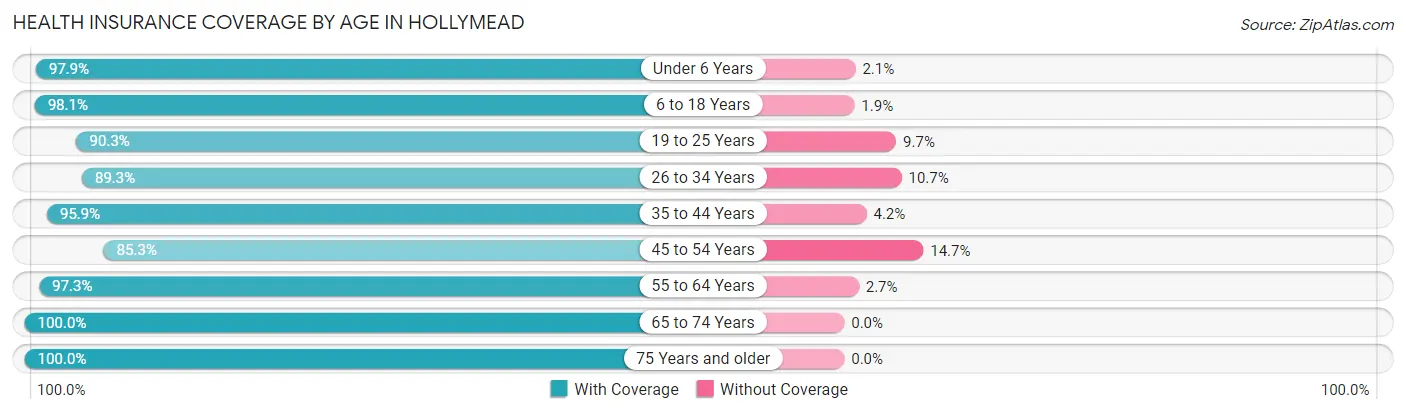
| Age Bracket | With Coverage | Without Coverage |
| Under 6 Years | 657 (97.9%) | 14 (2.1%) |
| 6 to 18 Years | 1,761 (98.1%) | 34 (1.9%) |
| 19 to 25 Years | 495 (90.3%) | 53 (9.7%) |
| 26 to 34 Years | 762 (89.3%) | 91 (10.7%) |
| 35 to 44 Years | 1,294 (95.9%) | 56 (4.2%) |
| 45 to 54 Years | 1,013 (85.3%) | 175 (14.7%) |
| 55 to 64 Years | 722 (97.3%) | 20 (2.7%) |
| 65 to 74 Years | 872 (100.0%) | 0 (0.0%) |
| 75 Years and older | 668 (100.0%) | 0 (0.0%) |
| Total | 8,244 (94.9%) | 443 (5.1%) |
Health Insurance Coverage by Citizenship Status in Hollymead
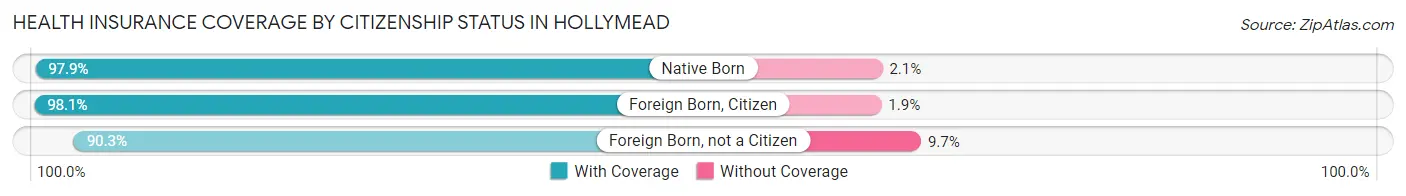
| Citizenship Status | With Coverage | Without Coverage |
| Native Born | 657 (97.9%) | 14 (2.1%) |
| Foreign Born, Citizen | 1,761 (98.1%) | 34 (1.9%) |
| Foreign Born, not a Citizen | 495 (90.3%) | 53 (9.7%) |
Health Insurance Coverage by Household Income in Hollymead
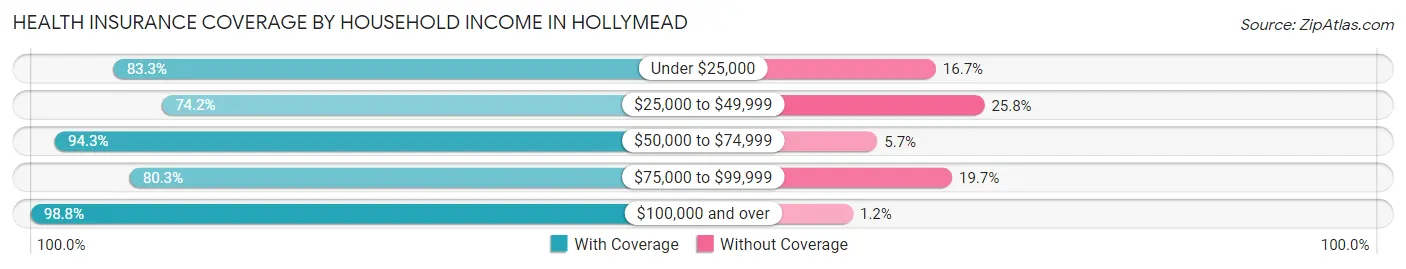
| Household Income | With Coverage | Without Coverage |
| Under $25,000 | 384 (83.3%) | 77 (16.7%) |
| $25,000 to $49,999 | 351 (74.2%) | 122 (25.8%) |
| $50,000 to $74,999 | 674 (94.3%) | 41 (5.7%) |
| $75,000 to $99,999 | 521 (80.3%) | 128 (19.7%) |
| $100,000 and over | 6,314 (98.8%) | 75 (1.2%) |
Public vs Private Health Insurance Coverage by Age in Hollymead
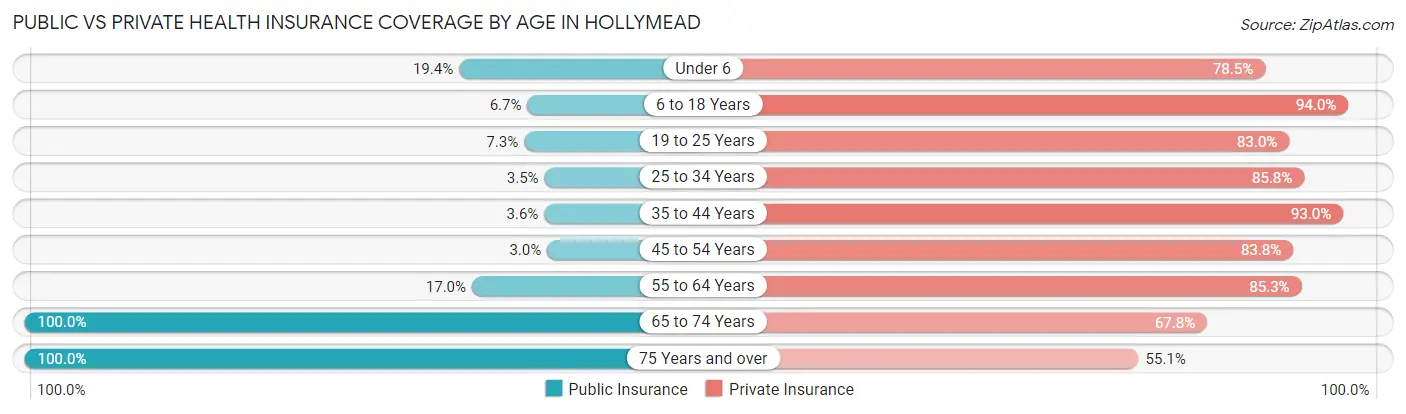
| Age Bracket | Public Insurance | Private Insurance |
| Under 6 | 130 (19.4%) | 527 (78.5%) |
| 6 to 18 Years | 120 (6.7%) | 1,687 (94.0%) |
| 19 to 25 Years | 40 (7.3%) | 455 (83.0%) |
| 25 to 34 Years | 30 (3.5%) | 732 (85.8%) |
| 35 to 44 Years | 48 (3.6%) | 1,256 (93.0%) |
| 45 to 54 Years | 36 (3.0%) | 995 (83.8%) |
| 55 to 64 Years | 126 (17.0%) | 633 (85.3%) |
| 65 to 74 Years | 872 (100.0%) | 591 (67.8%) |
| 75 Years and over | 668 (100.0%) | 368 (55.1%) |
| Total | 2,070 (23.8%) | 7,244 (83.4%) |
Disability Status by Sex by Age in Hollymead
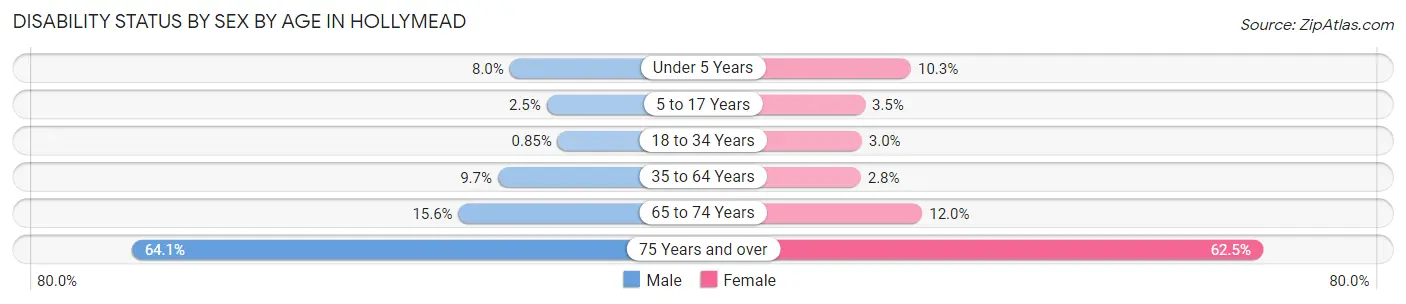
| Age Bracket | Male | Female |
| Under 5 Years | 17 (8.0%) | 28 (10.3%) |
| 5 to 17 Years | 27 (2.5%) | 28 (3.5%) |
| 18 to 34 Years | 6 (0.9%) | 23 (3.0%) |
| 35 to 64 Years | 140 (9.7%) | 52 (2.8%) |
| 65 to 74 Years | 72 (15.6%) | 49 (11.9%) |
| 75 Years and over | 141 (64.1%) | 280 (62.5%) |
Disability Class by Sex by Age in Hollymead
Disability Class: Hearing Difficulty
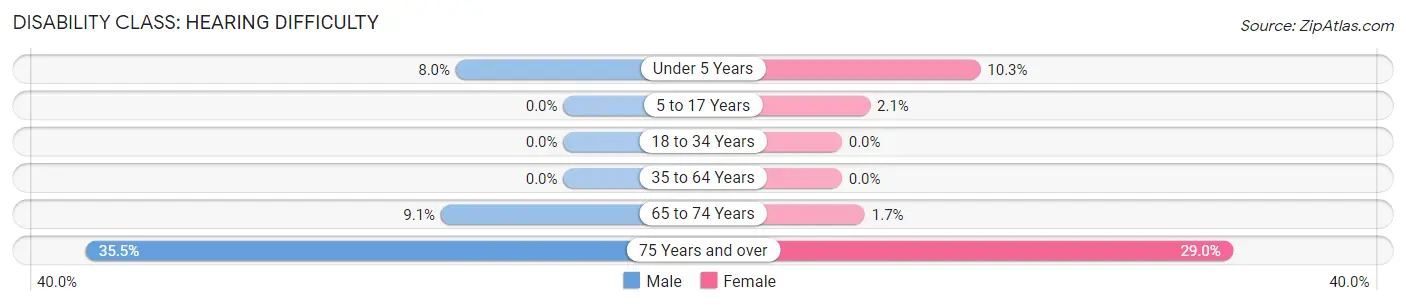
| Age Bracket | Male | Female |
| Under 5 Years | 17 (8.0%) | 28 (10.3%) |
| 5 to 17 Years | 0 (0.0%) | 17 (2.1%) |
| 18 to 34 Years | 0 (0.0%) | 0 (0.0%) |
| 35 to 64 Years | 0 (0.0%) | 0 (0.0%) |
| 65 to 74 Years | 42 (9.1%) | 7 (1.7%) |
| 75 Years and over | 78 (35.4%) | 130 (29.0%) |
Disability Class: Vision Difficulty
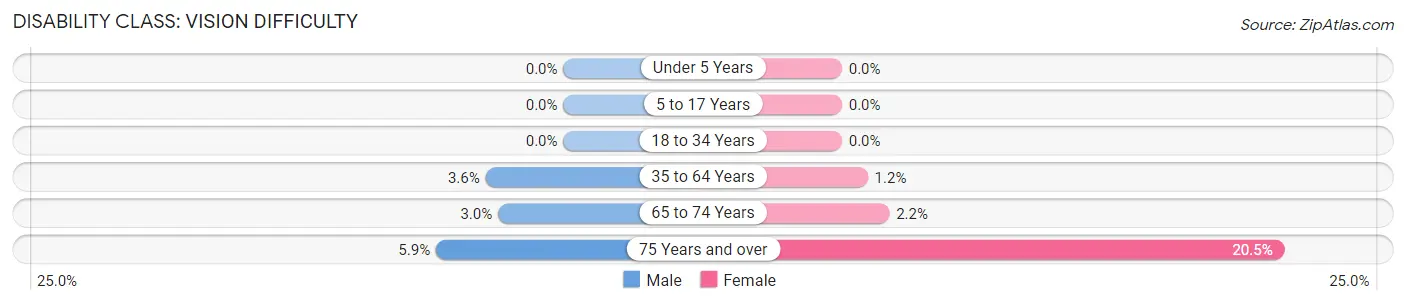
| Age Bracket | Male | Female |
| Under 5 Years | 0 (0.0%) | 0 (0.0%) |
| 5 to 17 Years | 0 (0.0%) | 0 (0.0%) |
| 18 to 34 Years | 0 (0.0%) | 0 (0.0%) |
| 35 to 64 Years | 52 (3.6%) | 22 (1.2%) |
| 65 to 74 Years | 14 (3.0%) | 9 (2.2%) |
| 75 Years and over | 13 (5.9%) | 92 (20.5%) |
Disability Class: Cognitive Difficulty
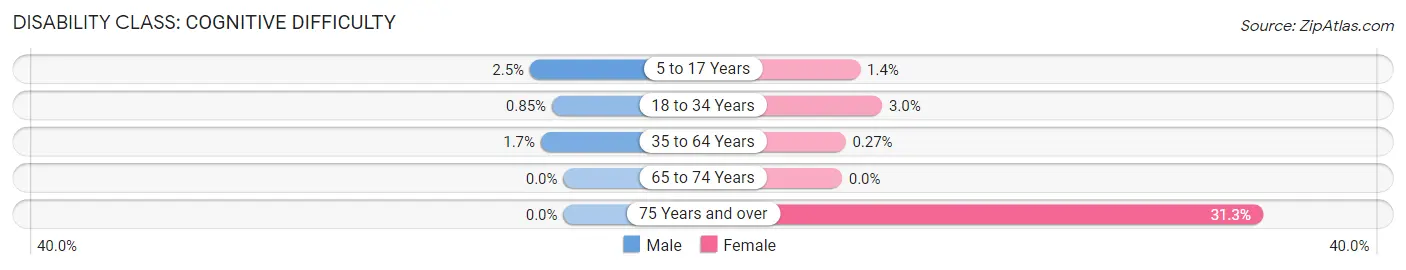
| Age Bracket | Male | Female |
| 5 to 17 Years | 27 (2.5%) | 11 (1.4%) |
| 18 to 34 Years | 6 (0.9%) | 23 (3.0%) |
| 35 to 64 Years | 24 (1.7%) | 5 (0.3%) |
| 65 to 74 Years | 0 (0.0%) | 0 (0.0%) |
| 75 Years and over | 0 (0.0%) | 140 (31.2%) |
Disability Class: Ambulatory Difficulty
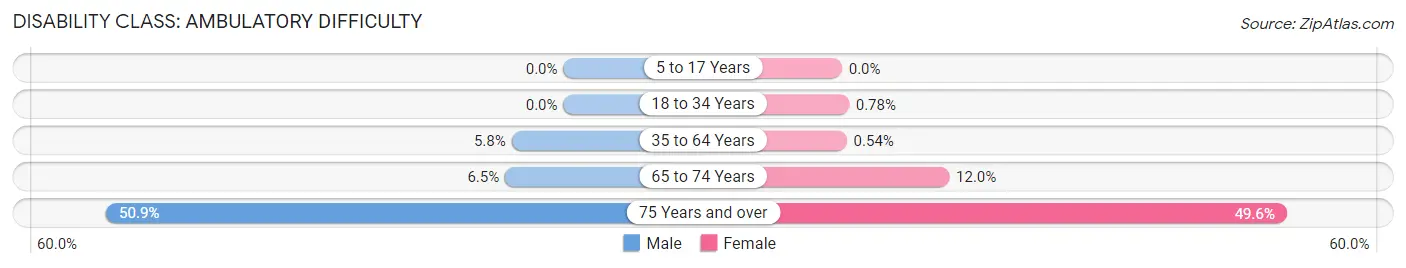
| Age Bracket | Male | Female |
| 5 to 17 Years | 0 (0.0%) | 0 (0.0%) |
| 18 to 34 Years | 0 (0.0%) | 6 (0.8%) |
| 35 to 64 Years | 83 (5.8%) | 10 (0.5%) |
| 65 to 74 Years | 30 (6.5%) | 49 (11.9%) |
| 75 Years and over | 112 (50.9%) | 222 (49.5%) |
Disability Class: Self-Care Difficulty
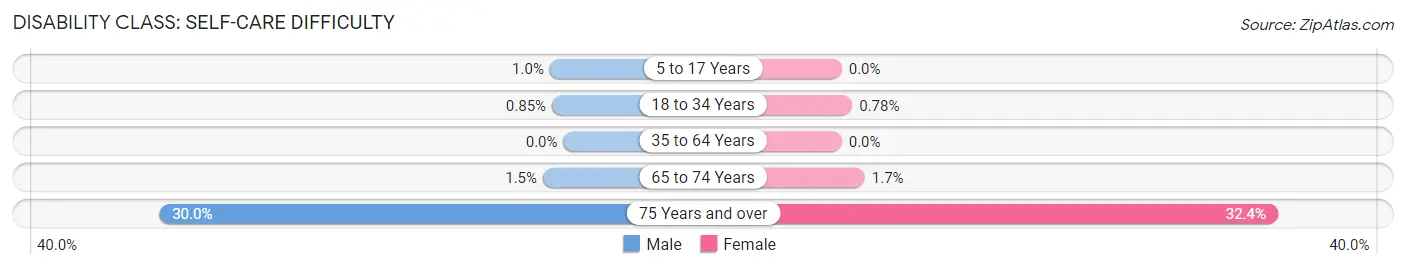
| Age Bracket | Male | Female |
| 5 to 17 Years | 11 (1.0%) | 0 (0.0%) |
| 18 to 34 Years | 6 (0.9%) | 6 (0.8%) |
| 35 to 64 Years | 0 (0.0%) | 0 (0.0%) |
| 65 to 74 Years | 7 (1.5%) | 7 (1.7%) |
| 75 Years and over | 66 (30.0%) | 145 (32.4%) |
Technology Access in Hollymead
Computing Device Access in Hollymead
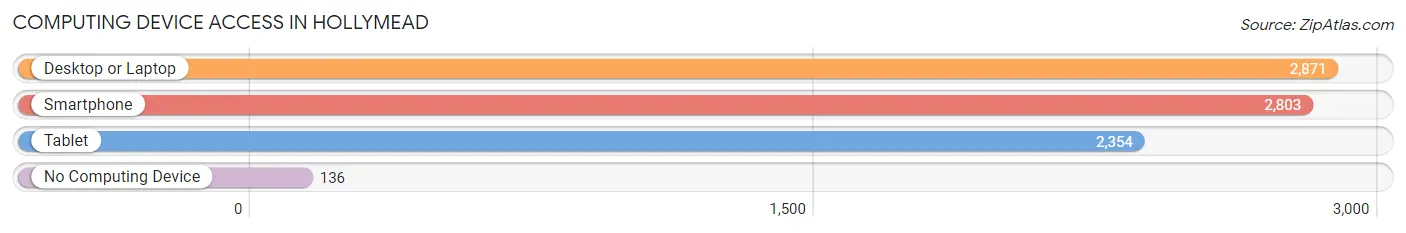
| Device Type | # Households | % Households |
| Desktop or Laptop | 2,871 | 90.8% |
| Smartphone | 2,803 | 88.6% |
| Tablet | 2,354 | 74.5% |
| No Computing Device | 136 | 4.3% |
| Total | 3,162 | 100.0% |
Internet Access in Hollymead
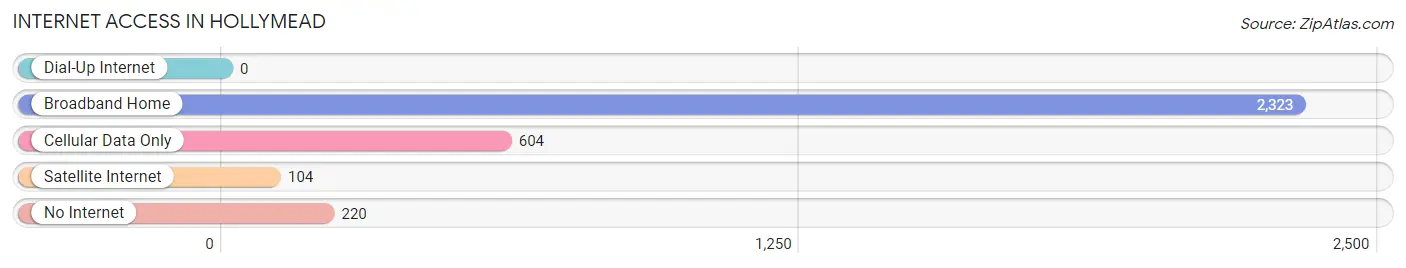
| Internet Type | # Households | % Households |
| Dial-Up Internet | 0 | 0.0% |
| Broadband Home | 2,323 | 73.5% |
| Cellular Data Only | 604 | 19.1% |
| Satellite Internet | 104 | 3.3% |
| No Internet | 220 | 7.0% |
| Total | 3,162 | 100.0% |
Hollymead Summary
Hollymead is an unincorporated community located in Albemarle County, Virginia. It is situated in the foothills of the Blue Ridge Mountains, approximately 10 miles north of Charlottesville. The community is bordered by the Rivanna River to the east and the South Fork of the Rivanna River to the west.
History
Hollymead was first settled in the late 1700s by the family of William and Mary Holly. The Holly family owned a large tract of land in the area, which they used for farming and timber production. The community was named after the Holly family, and the name was officially adopted in 1883.
In the early 1900s, the area began to develop as a residential community. The first homes were built in the 1920s, and the community continued to grow throughout the 20th century. By the late 1990s, Hollymead had become a popular residential area for families and retirees.
Geography
Hollymead is located in the foothills of the Blue Ridge Mountains in Albemarle County, Virginia. The community is bordered by the Rivanna River to the east and the South Fork of the Rivanna River to the west. The area is characterized by rolling hills and lush forests.
The climate in Hollymead is temperate, with hot summers and mild winters. The average annual temperature is around 60 degrees Fahrenheit. The average annual precipitation is around 40 inches.
Economy
Hollymead is primarily a residential community, with most of its residents employed in the nearby cities of Charlottesville and Albemarle County. The area is also home to several small businesses, including a grocery store, a hardware store, and a few restaurants.
Demographics
As of the 2010 census, the population of Hollymead was 2,845. The racial makeup of the community was 87.3% White, 8.2% African American, 0.7% Asian, 0.3% Native American, and 3.5% from other races. The median household income was $63,750, and the median home value was $310,000.
Hollymead is a diverse community, with a variety of religious and cultural backgrounds represented. The majority of residents are Christian, with a small percentage of other faiths represented. The community is served by several churches, including Hollymead United Methodist Church, Hollymead Baptist Church, and St. John's Episcopal Church.
Conclusion
Hollymead is a small, unincorporated community located in Albemarle County, Virginia. It is situated in the foothills of the Blue Ridge Mountains, approximately 10 miles north of Charlottesville. The community is bordered by the Rivanna River to the east and the South Fork of the Rivanna River to the west. Hollymead is primarily a residential community, with most of its residents employed in the nearby cities of Charlottesville and Albemarle County. The population of Hollymead was 2,845 as of the 2010 census, and the median household income was $63,750. The community is diverse, with a variety of religious and cultural backgrounds represented.
Common Questions
What is Per Capita Income in Hollymead?
Per Capita income in Hollymead is $50,738.
What is the Median Family Income in Hollymead?
Median Family Income in Hollymead is $148,529.
What is the Median Household income in Hollymead?
Median Household Income in Hollymead is $119,079.
What is Income or Wage Gap in Hollymead?
Income or Wage Gap in Hollymead is 27.2%.
Women in Hollymead earn 72.8 cents for every dollar earned by a man.
What is Family Income Deficit in Hollymead?
Family Income Deficit in Hollymead is $20,580.
Families that are below poverty line in Hollymead earn $20,580 less on average than the poverty threshold level.
What is Inequality or Gini Index in Hollymead?
Inequality or Gini Index in Hollymead is 0.38.
What is the Total Population of Hollymead?
Total Population of Hollymead is 8,740.
What is the Total Male Population of Hollymead?
Total Male Population of Hollymead is 4,168.
What is the Total Female Population of Hollymead?
Total Female Population of Hollymead is 4,572.
What is the Ratio of Males per 100 Females in Hollymead?
There are 91.16 Males per 100 Females in Hollymead.
What is the Ratio of Females per 100 Males in Hollymead?
There are 109.69 Females per 100 Males in Hollymead.
What is the Median Population Age in Hollymead?
Median Population Age in Hollymead is 38.4 Years.
What is the Average Family Size in Hollymead
Average Family Size in Hollymead is 3.3 People.
What is the Average Household Size in Hollymead
Average Household Size in Hollymead is 2.8 People.
How Large is the Labor Force in Hollymead?
There are 4,496 People in the Labor Forcein in Hollymead.
What is the Percentage of People in the Labor Force in Hollymead?
67.2% of People are in the Labor Force in Hollymead.
What is the Unemployment Rate in Hollymead?
Unemployment Rate in Hollymead is 2.6%.