Pembroke, VA Map & Demographics
Pembroke Map
Pembroke Overview
$33,142
PER CAPITA INCOME
$90,313
AVG FAMILY INCOME
$56,667
AVG HOUSEHOLD INCOME
17.3%
WAGE / INCOME GAP [ % ]
82.7¢/ $1
WAGE / INCOME GAP [ $ ]
0.37
INEQUALITY / GINI INDEX
1,005
TOTAL POPULATION
580
MALE POPULATION
425
FEMALE POPULATION
136.47
MALES / 100 FEMALES
73.28
FEMALES / 100 MALES
45.7
MEDIAN AGE
3.1
AVG FAMILY SIZE
2.2
AVG HOUSEHOLD SIZE
560
LABOR FORCE [ PEOPLE ]
63.8%
PERCENT IN LABOR FORCE
0.7%
UNEMPLOYMENT RATE
Pembroke Zip Codes
Pembroke Area Codes
Income in Pembroke
Income Overview in Pembroke
Per Capita Income in Pembroke is $33,142, while median incomes of families and households are $90,313 and $56,667 respectively.
| Characteristic | Number | Measure |
| Per Capita Income | 1,005 | $33,142 |
| Median Family Income | 205 | $90,313 |
| Mean Family Income | 205 | $83,766 |
| Median Household Income | 466 | $56,667 |
| Mean Household Income | 466 | $65,678 |
| Income Deficit | 205 | $0 |
| Wage / Income Gap (%) | 1,005 | 17.29% |
| Wage / Income Gap ($) | 1,005 | 82.71¢ per $1 |
| Gini / Inequality Index | 1,005 | 0.37 |
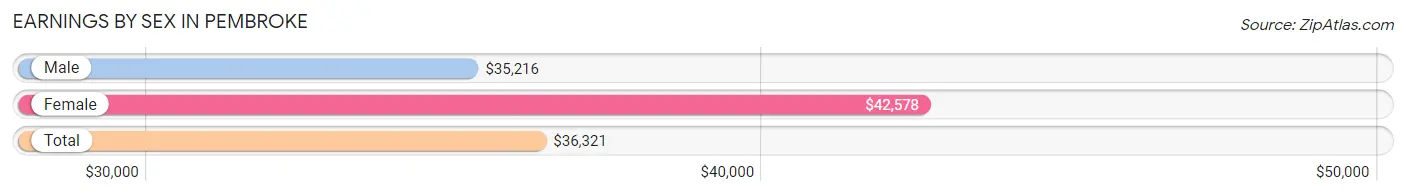
Earnings by Sex in Pembroke
Average Earnings in Pembroke are $36,321, $35,216 for men and $42,578 for women, a difference of 17.3%.
| Sex | Number | Average Earnings |
| Male | 391 (66.8%) | $35,216 |
| Female | 194 (33.2%) | $42,578 |
| Total | 585 (100.0%) | $36,321 |
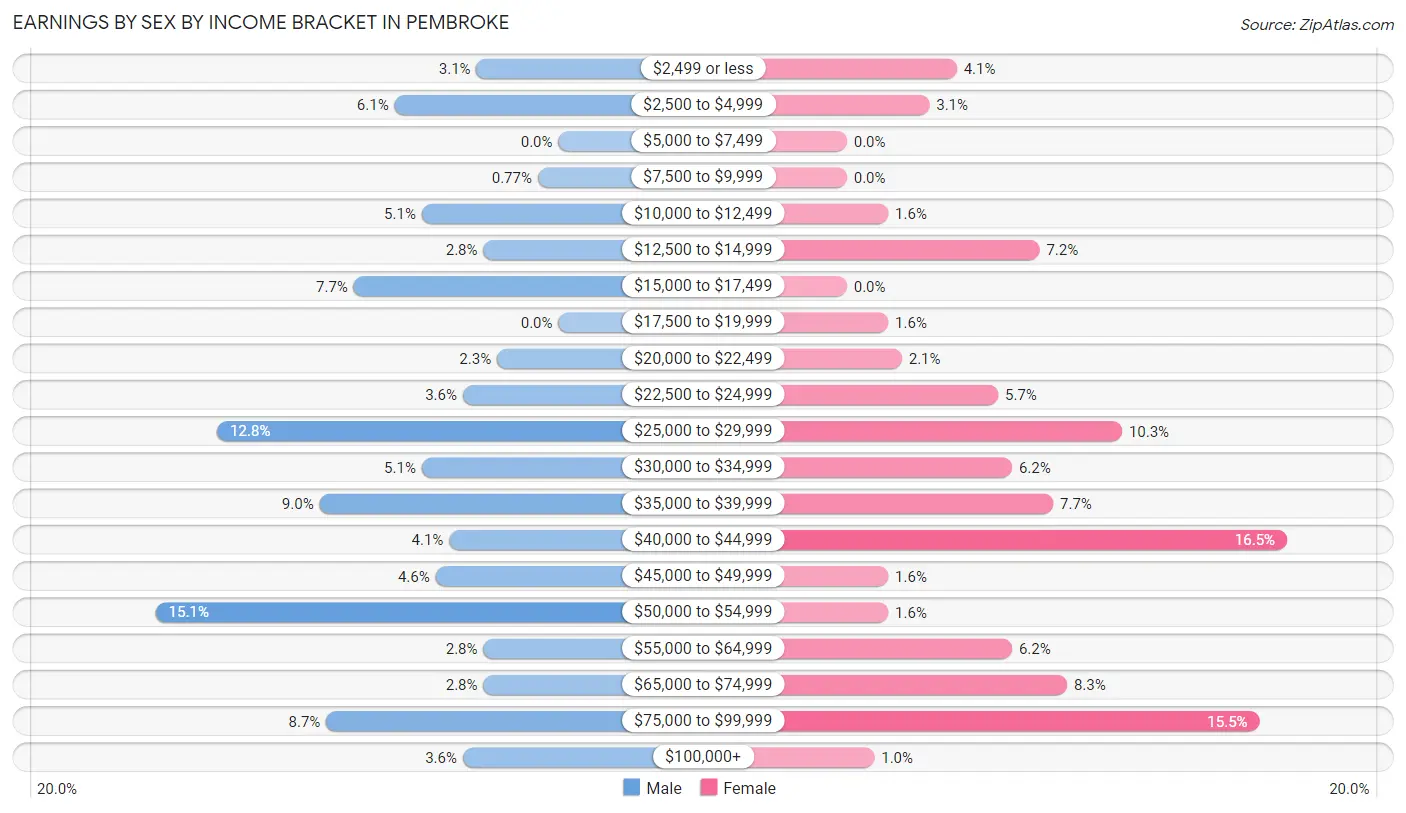
Earnings by Sex by Income Bracket in Pembroke
The most common earnings brackets in Pembroke are $50,000 to $54,999 for men (59 | 15.1%) and $40,000 to $44,999 for women (32 | 16.5%).
| Income | Male | Female |
| $2,499 or less | 12 (3.1%) | 8 (4.1%) |
| $2,500 to $4,999 | 24 (6.1%) | 6 (3.1%) |
| $5,000 to $7,499 | 0 (0.0%) | 0 (0.0%) |
| $7,500 to $9,999 | 3 (0.8%) | 0 (0.0%) |
| $10,000 to $12,499 | 20 (5.1%) | 3 (1.5%) |
| $12,500 to $14,999 | 11 (2.8%) | 14 (7.2%) |
| $15,000 to $17,499 | 30 (7.7%) | 0 (0.0%) |
| $17,500 to $19,999 | 0 (0.0%) | 3 (1.5%) |
| $20,000 to $22,499 | 9 (2.3%) | 4 (2.1%) |
| $22,500 to $24,999 | 14 (3.6%) | 11 (5.7%) |
| $25,000 to $29,999 | 50 (12.8%) | 20 (10.3%) |
| $30,000 to $34,999 | 20 (5.1%) | 12 (6.2%) |
| $35,000 to $39,999 | 35 (8.9%) | 15 (7.7%) |
| $40,000 to $44,999 | 16 (4.1%) | 32 (16.5%) |
| $45,000 to $49,999 | 18 (4.6%) | 3 (1.5%) |
| $50,000 to $54,999 | 59 (15.1%) | 3 (1.5%) |
| $55,000 to $64,999 | 11 (2.8%) | 12 (6.2%) |
| $65,000 to $74,999 | 11 (2.8%) | 16 (8.3%) |
| $75,000 to $99,999 | 34 (8.7%) | 30 (15.5%) |
| $100,000+ | 14 (3.6%) | 2 (1.0%) |
| Total | 391 (100.0%) | 194 (100.0%) |
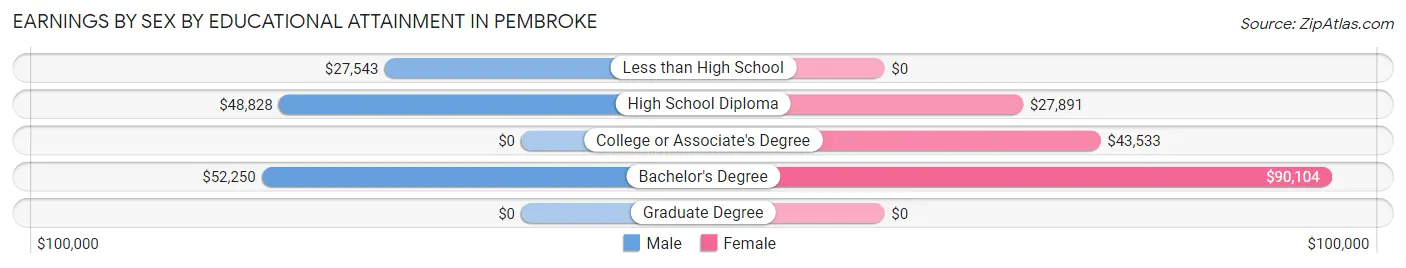
Earnings by Sex by Educational Attainment in Pembroke
Average earnings in Pembroke are $41,000 for men and $42,578 for women, a difference of 3.7%. Men with an educational attainment of bachelor's degree enjoy the highest average annual earnings of $52,250, while those with less than high school education earn the least with $27,543. Women with an educational attainment of bachelor's degree earn the most with the average annual earnings of $90,104, while those with high school diploma education have the smallest earnings of $27,891.
| Educational Attainment | Male Income | Female Income |
| Less than High School | $27,543 | $0 |
| High School Diploma | $48,828 | $27,891 |
| College or Associate's Degree | - | - |
| Bachelor's Degree | $52,250 | $90,104 |
| Graduate Degree | - | - |
| Total | $41,000 | $42,578 |
Family Income in Pembroke
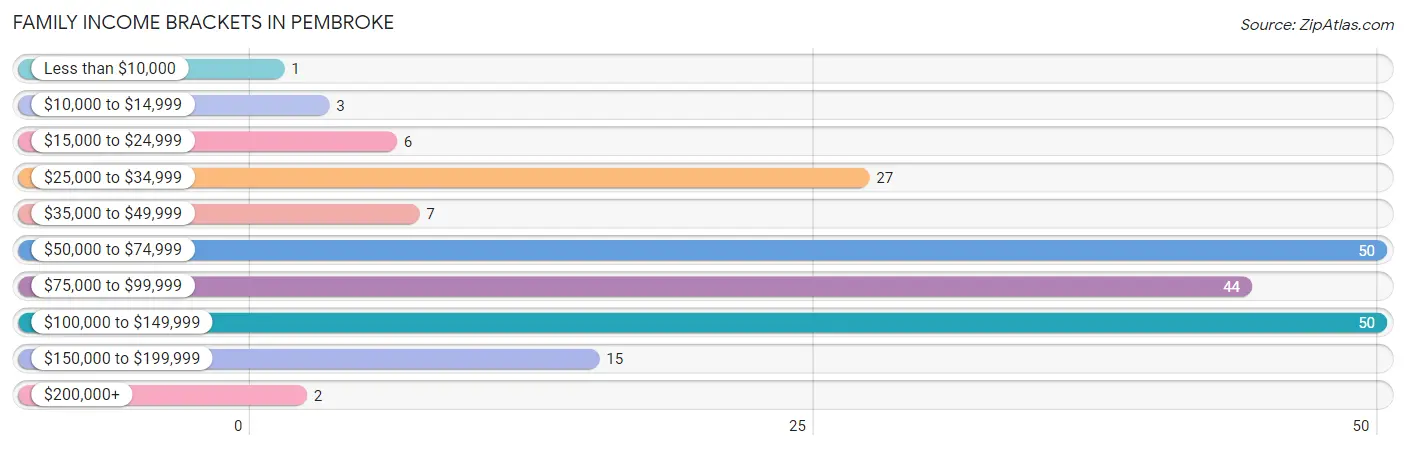
Family Income Brackets in Pembroke
According to the Pembroke family income data, there are 50 families falling into the $50,000 to $74,999 income range, which is the most common income bracket and makes up 24.4% of all families. Conversely, the less than $10,000 income bracket is the least frequent group with only 1 families (0.5%) belonging to this category.
| Income Bracket | # Families | % Families |
| Less than $10,000 | 1 | 0.5% |
| $10,000 to $14,999 | 3 | 1.5% |
| $15,000 to $24,999 | 6 | 2.9% |
| $25,000 to $34,999 | 27 | 13.2% |
| $35,000 to $49,999 | 7 | 3.4% |
| $50,000 to $74,999 | 50 | 24.4% |
| $75,000 to $99,999 | 44 | 21.5% |
| $100,000 to $149,999 | 50 | 24.4% |
| $150,000 to $199,999 | 15 | 7.3% |
| $200,000+ | 2 | 1.0% |
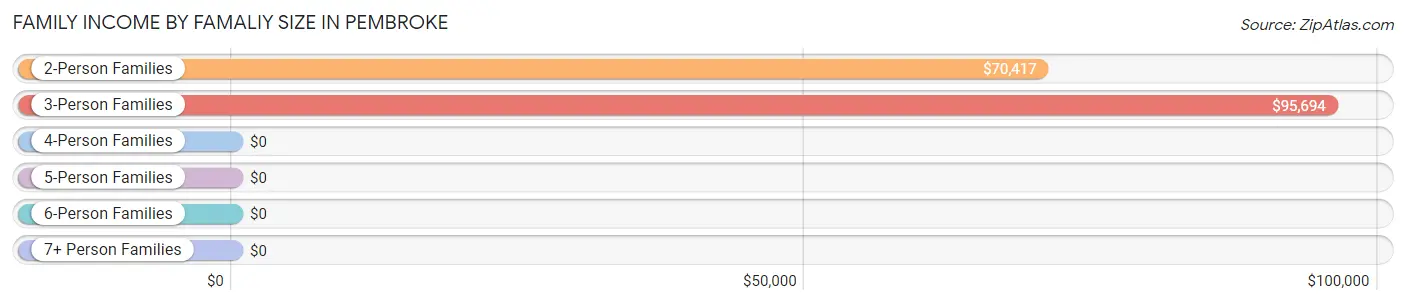
Family Income by Famaliy Size in Pembroke
3-person families (51 | 24.9%) account for the highest median family income in Pembroke with $95,694 per family, while 2-person families (125 | 61.0%) have the highest median income of $35,208 per family member.
| Income Bracket | # Families | Median Income |
| 2-Person Families | 125 (61.0%) | $70,417 |
| 3-Person Families | 51 (24.9%) | $95,694 |
| 4-Person Families | 17 (8.3%) | $0 |
| 5-Person Families | 11 (5.4%) | $0 |
| 6-Person Families | 1 (0.5%) | $0 |
| 7+ Person Families | 0 (0.0%) | $0 |
| Total | 205 (100.0%) | $90,313 |
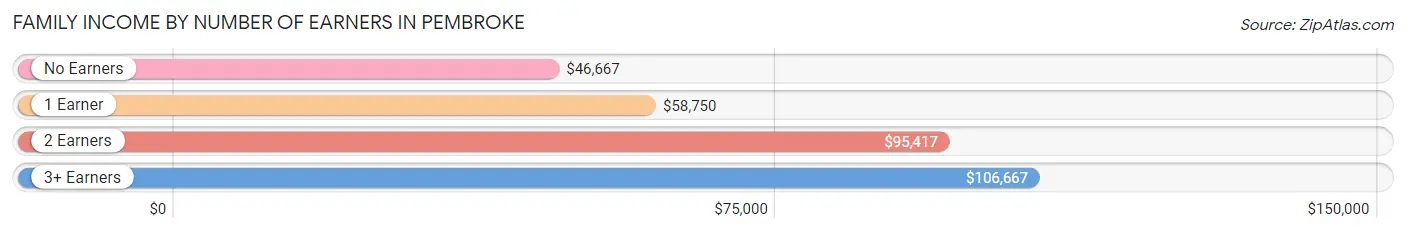
Family Income by Number of Earners in Pembroke
The median family income in Pembroke is $90,313, with families comprising 3+ earners (10) having the highest median family income of $106,667, while families with no earners (44) have the lowest median family income of $46,667, accounting for 4.9% and 21.5% of families, respectively.
| Number of Earners | # Families | Median Income |
| No Earners | 44 (21.5%) | $46,667 |
| 1 Earner | 30 (14.6%) | $58,750 |
| 2 Earners | 121 (59.0%) | $95,417 |
| 3+ Earners | 10 (4.9%) | $106,667 |
| Total | 205 (100.0%) | $90,313 |
Household Income in Pembroke
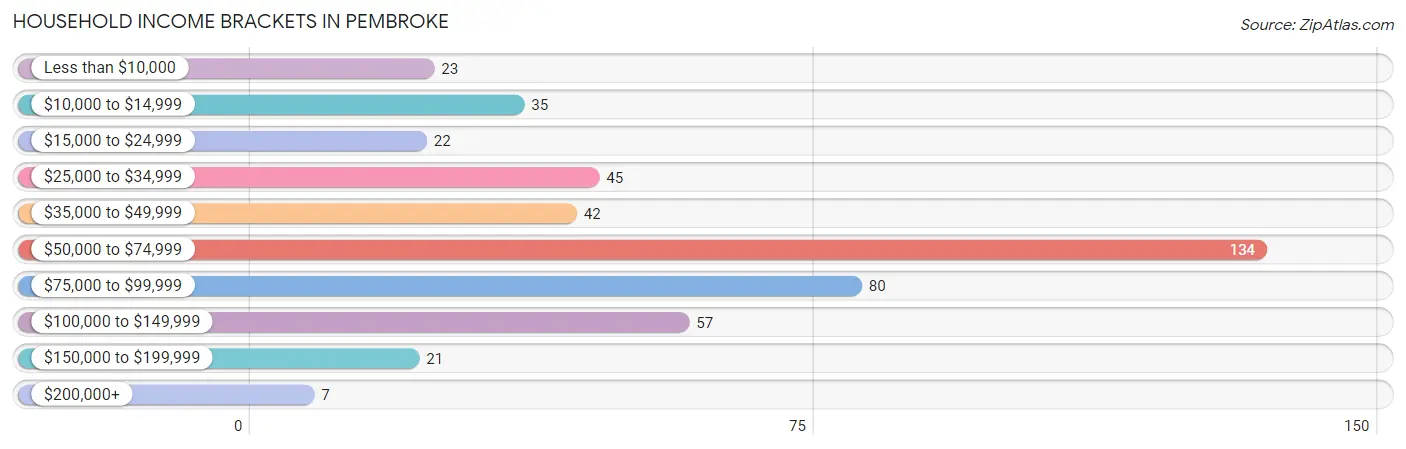
Household Income Brackets in Pembroke
With 134 households falling in the category, the $50,000 to $74,999 income range is the most frequent in Pembroke, accounting for 28.8% of all households. In contrast, only 7 households (1.5%) fall into the $200,000+ income bracket, making it the least populous group.
| Income Bracket | # Households | % Households |
| Less than $10,000 | 23 | 4.9% |
| $10,000 to $14,999 | 35 | 7.5% |
| $15,000 to $24,999 | 22 | 4.7% |
| $25,000 to $34,999 | 45 | 9.7% |
| $35,000 to $49,999 | 42 | 9.0% |
| $50,000 to $74,999 | 134 | 28.8% |
| $75,000 to $99,999 | 80 | 17.2% |
| $100,000 to $149,999 | 57 | 12.2% |
| $150,000 to $199,999 | 21 | 4.5% |
| $200,000+ | 7 | 1.5% |
Household Income by Householder Age in Pembroke
The median household income in Pembroke is $56,667, with the highest median household income of $92,875 found in the 25 to 44 years age bracket for the primary householder. A total of 103 households (22.1%) fall into this category. Meanwhile, the 15 to 24 years age bracket for the primary householder has the lowest median household income of $0, with 5 households (1.1%) in this group.
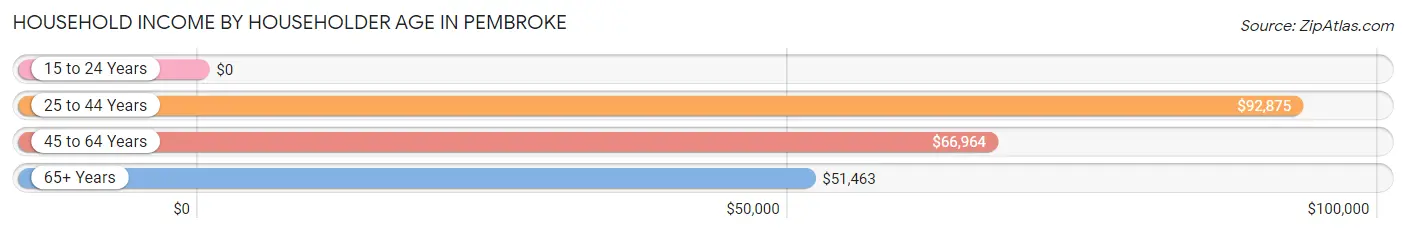
| Income Bracket | # Households | Median Income |
| 15 to 24 Years | 5 (1.1%) | $0 |
| 25 to 44 Years | 103 (22.1%) | $92,875 |
| 45 to 64 Years | 148 (31.8%) | $66,964 |
| 65+ Years | 210 (45.1%) | $51,463 |
| Total | 466 (100.0%) | $56,667 |
Poverty in Pembroke
Income Below Poverty by Sex and Age in Pembroke
With 12.1% poverty level for males and 13.4% for females among the residents of Pembroke, 12 to 14 year old males and 12 to 14 year old females are the most vulnerable to poverty, with 3 males (60.0%) and 4 females (100.0%) in their respective age groups living below the poverty level.
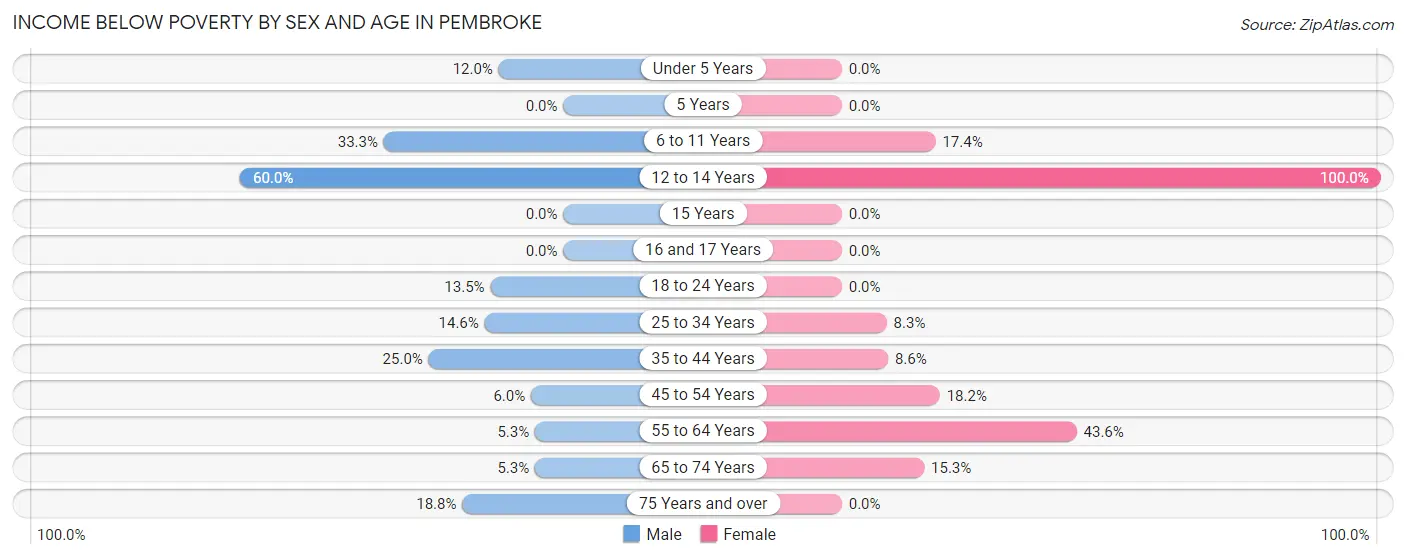
| Age Bracket | Male | Female |
| Under 5 Years | 3 (12.0%) | 0 (0.0%) |
| 5 Years | 0 (0.0%) | 0 (0.0%) |
| 6 to 11 Years | 6 (33.3%) | 4 (17.4%) |
| 12 to 14 Years | 3 (60.0%) | 4 (100.0%) |
| 15 Years | 0 (0.0%) | 0 (0.0%) |
| 16 and 17 Years | 0 (0.0%) | 0 (0.0%) |
| 18 to 24 Years | 13 (13.5%) | 0 (0.0%) |
| 25 to 34 Years | 13 (14.6%) | 6 (8.3%) |
| 35 to 44 Years | 15 (25.0%) | 3 (8.6%) |
| 45 to 54 Years | 3 (6.0%) | 12 (18.2%) |
| 55 to 64 Years | 5 (5.3%) | 17 (43.6%) |
| 65 to 74 Years | 6 (5.3%) | 11 (15.3%) |
| 75 Years and over | 3 (18.8%) | 0 (0.0%) |
| Total | 70 (12.1%) | 57 (13.4%) |
Income Above Poverty by Sex and Age in Pembroke
According to the poverty statistics in Pembroke, males aged 15 years and females aged under 5 years are the age groups that are most secure financially, with 100.0% of males and 100.0% of females in these age groups living above the poverty line.
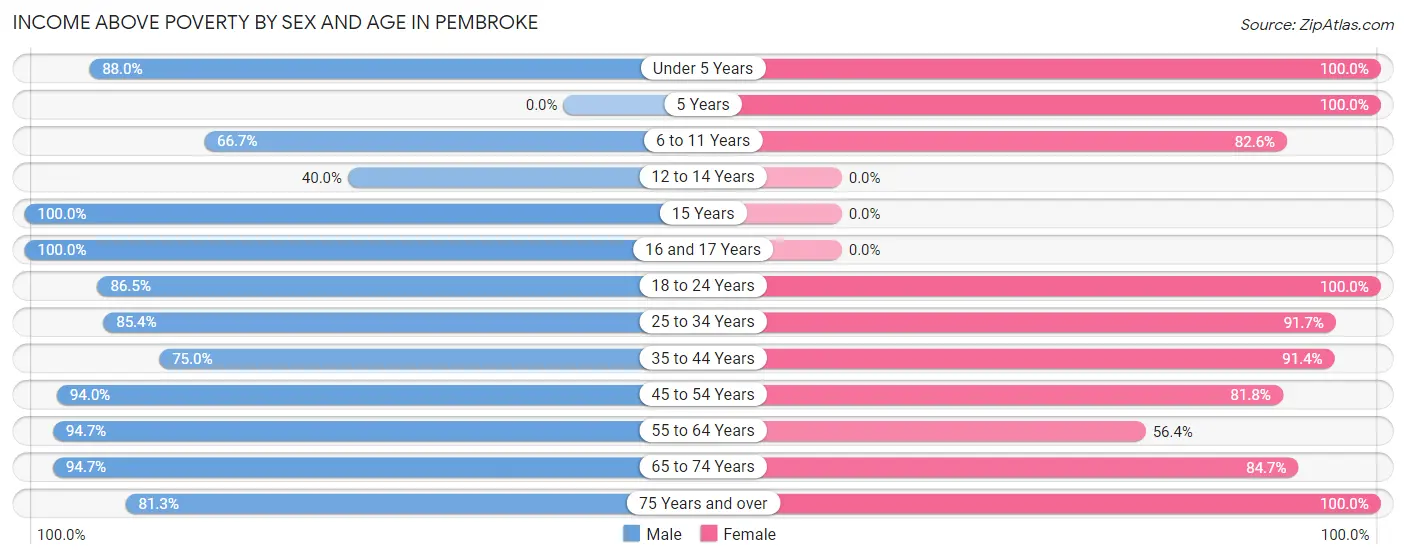
| Age Bracket | Male | Female |
| Under 5 Years | 22 (88.0%) | 45 (100.0%) |
| 5 Years | 0 (0.0%) | 1 (100.0%) |
| 6 to 11 Years | 12 (66.7%) | 19 (82.6%) |
| 12 to 14 Years | 2 (40.0%) | 0 (0.0%) |
| 15 Years | 6 (100.0%) | 0 (0.0%) |
| 16 and 17 Years | 6 (100.0%) | 0 (0.0%) |
| 18 to 24 Years | 83 (86.5%) | 4 (100.0%) |
| 25 to 34 Years | 76 (85.4%) | 66 (91.7%) |
| 35 to 44 Years | 45 (75.0%) | 32 (91.4%) |
| 45 to 54 Years | 47 (94.0%) | 54 (81.8%) |
| 55 to 64 Years | 90 (94.7%) | 22 (56.4%) |
| 65 to 74 Years | 108 (94.7%) | 61 (84.7%) |
| 75 Years and over | 13 (81.2%) | 64 (100.0%) |
| Total | 510 (87.9%) | 368 (86.6%) |
Income Below Poverty Among Married-Couple Families in Pembroke
The poverty statistics for married-couple families in Pembroke show that 5.8% or 9 of the total 154 families live below the poverty line. Families with 3 or 4 children have the highest poverty rate of 100.0%, comprising of 3 families. On the other hand, families with no children have the lowest poverty rate of 0.0%, which includes 0 families.
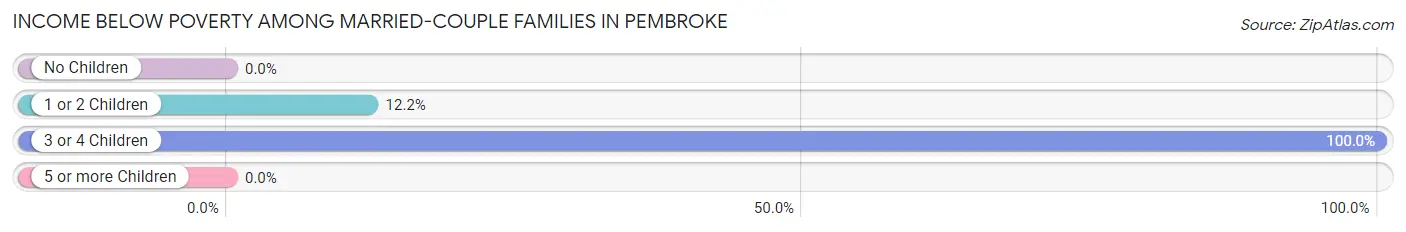
| Children | Above Poverty | Below Poverty |
| No Children | 102 (100.0%) | 0 (0.0%) |
| 1 or 2 Children | 43 (87.8%) | 6 (12.2%) |
| 3 or 4 Children | 0 (0.0%) | 3 (100.0%) |
| 5 or more Children | 0 (0.0%) | 0 (0.0%) |
| Total | 145 (94.2%) | 9 (5.8%) |
Income Below Poverty Among Single-Parent Households in Pembroke
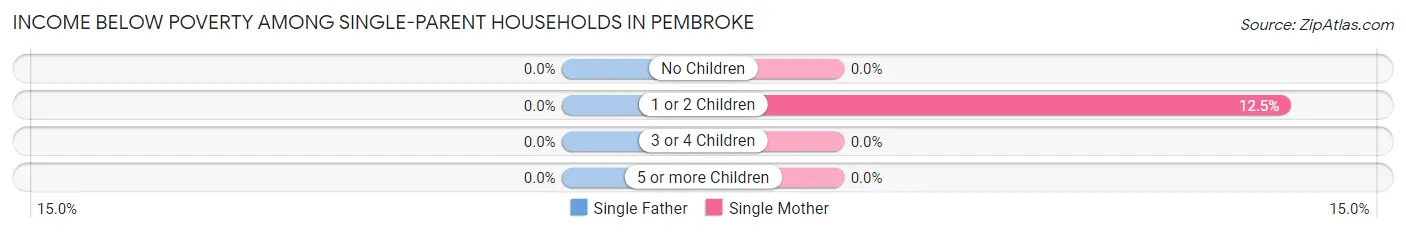
| Children | Single Father | Single Mother |
| No Children | 0 (0.0%) | 0 (0.0%) |
| 1 or 2 Children | 0 (0.0%) | 1 (12.5%) |
| 3 or 4 Children | 0 (0.0%) | 0 (0.0%) |
| 5 or more Children | 0 (0.0%) | 0 (0.0%) |
| Total | 0 (0.0%) | 1 (3.3%) |
Income Below Poverty Among Married-Couple vs Single-Parent Households in Pembroke
The poverty data for Pembroke shows that 9 of the married-couple family households (5.8%) and 1 of the single-parent households (2.0%) are living below the poverty level. Within the married-couple family households, those with 3 or 4 children have the highest poverty rate, with 3 households (100.0%) falling below the poverty line. Among the single-parent households, those with 1 or 2 children have the highest poverty rate, with 1 household (6.7%) living below poverty.
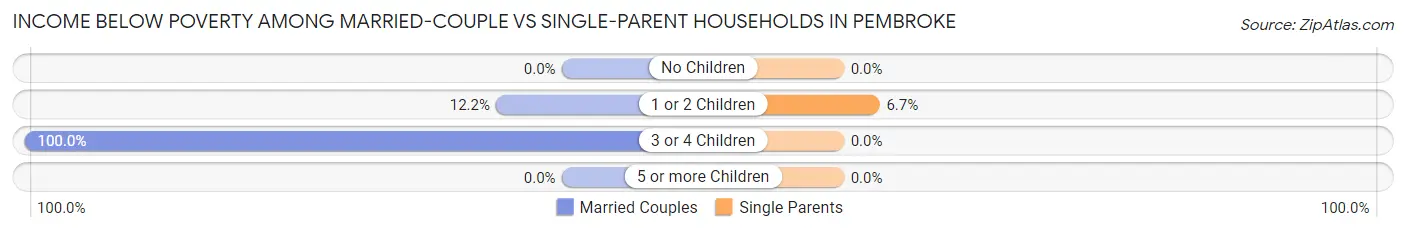
| Children | Married-Couple Families | Single-Parent Households |
| No Children | 0 (0.0%) | 0 (0.0%) |
| 1 or 2 Children | 6 (12.2%) | 1 (6.7%) |
| 3 or 4 Children | 3 (100.0%) | 0 (0.0%) |
| 5 or more Children | 0 (0.0%) | 0 (0.0%) |
| Total | 9 (5.8%) | 1 (2.0%) |
Race in Pembroke
The most populous races in Pembroke are White / Caucasian (919 | 91.4%), Two or more Races (75 | 7.5%), and Hispanic or Latino (50 | 5.0%).
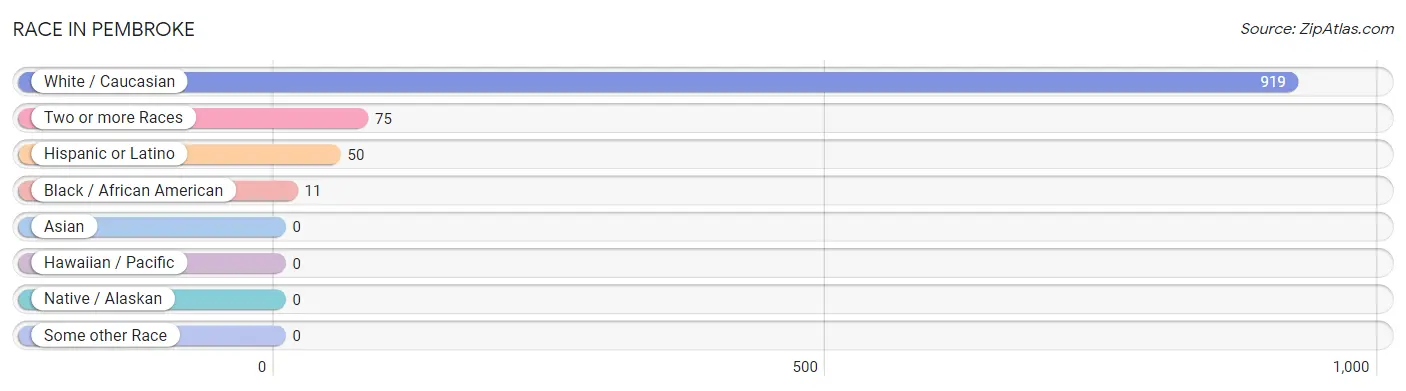
| Race | # Population | % Population |
| Asian | 0 | 0.0% |
| Black / African American | 11 | 1.1% |
| Hawaiian / Pacific | 0 | 0.0% |
| Hispanic or Latino | 50 | 5.0% |
| Native / Alaskan | 0 | 0.0% |
| White / Caucasian | 919 | 91.4% |
| Two or more Races | 75 | 7.5% |
| Some other Race | 0 | 0.0% |
| Total | 1,005 | 100.0% |
Ancestry in Pembroke
The most populous ancestries reported in Pembroke are Irish (127 | 12.6%), American (86 | 8.6%), German (74 | 7.4%), Scottish (56 | 5.6%), and English (40 | 4.0%), together accounting for 38.1% of all Pembroke residents.
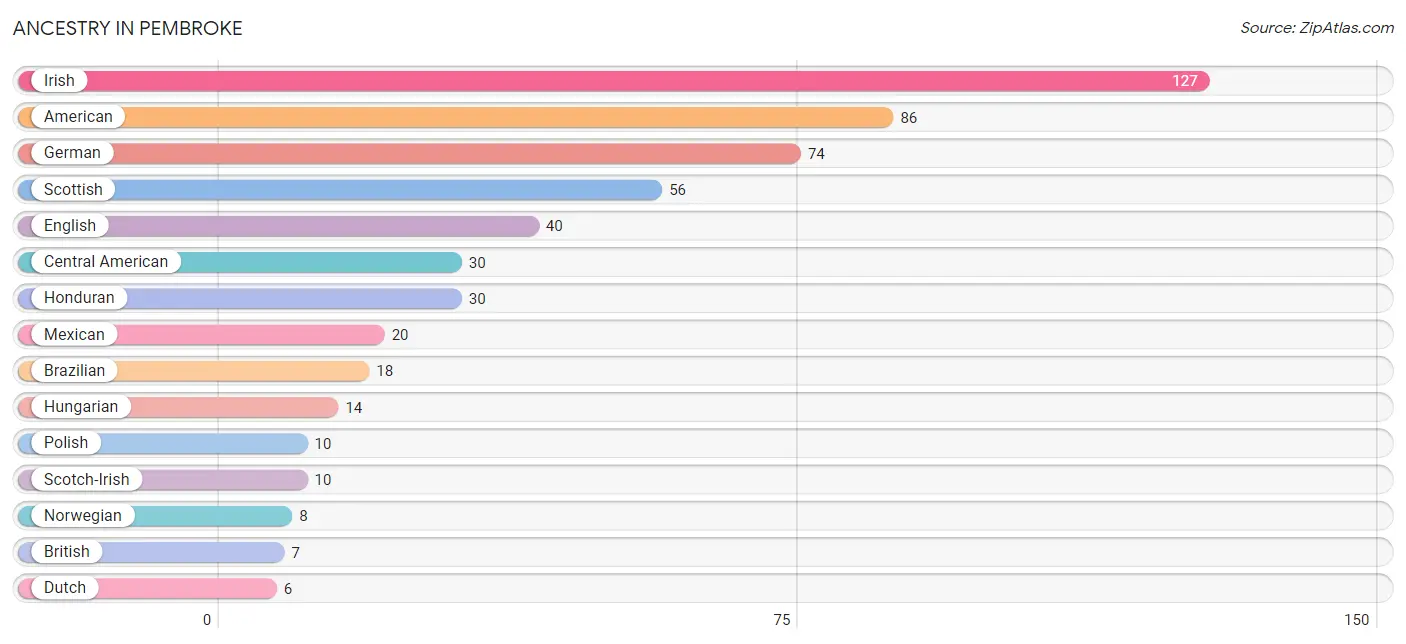
| Ancestry | # Population | % Population |
| American | 86 | 8.6% |
| Brazilian | 18 | 1.8% |
| British | 7 | 0.7% |
| Central American | 30 | 3.0% |
| Dutch | 6 | 0.6% |
| English | 40 | 4.0% |
| European | 4 | 0.4% |
| French | 6 | 0.6% |
| German | 74 | 7.4% |
| Honduran | 30 | 3.0% |
| Hungarian | 14 | 1.4% |
| Irish | 127 | 12.6% |
| Italian | 4 | 0.4% |
| Mexican | 20 | 2.0% |
| Norwegian | 8 | 0.8% |
| Polish | 10 | 1.0% |
| Scandinavian | 3 | 0.3% |
| Scotch-Irish | 10 | 1.0% |
| Scottish | 56 | 5.6% |
| Swedish | 2 | 0.2% |
| Thai | 2 | 0.2% |
| Welsh | 5 | 0.5% | View All 22 Rows |
Immigrants in Pembroke
The most numerous immigrant groups reported in Pembroke came from Latin America (68 | 6.8%), Central America (50 | 5.0%), Honduras (30 | 3.0%), Brazil (18 | 1.8%), and South America (18 | 1.8%), together accounting for 18.3% of all Pembroke residents.
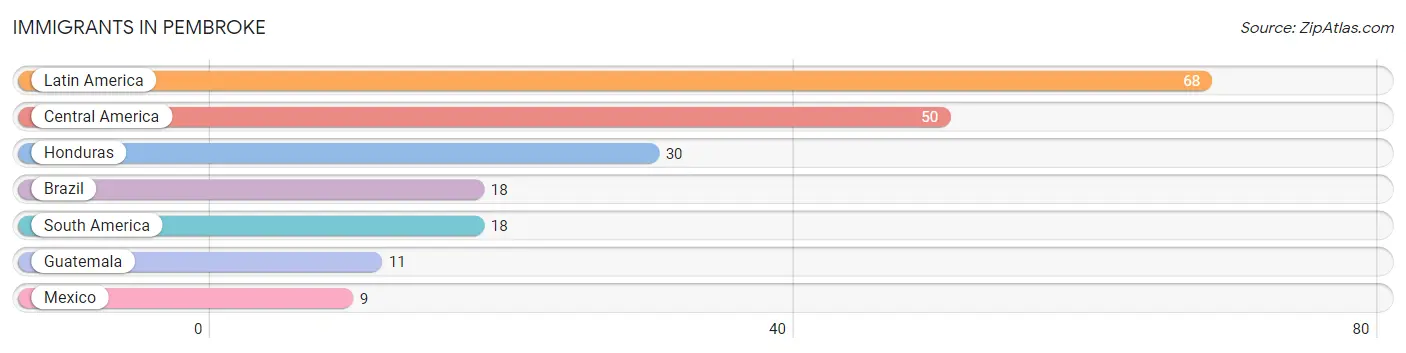
| Immigration Origin | # Population | % Population |
| Brazil | 18 | 1.8% |
| Central America | 50 | 5.0% |
| Guatemala | 11 | 1.1% |
| Honduras | 30 | 3.0% |
| Latin America | 68 | 6.8% |
| Mexico | 9 | 0.9% |
| South America | 18 | 1.8% | View All 7 Rows |
Sex and Age in Pembroke
Sex and Age in Pembroke
The most populous age groups in Pembroke are 65 to 69 Years (80 | 13.8%) for men and 25 to 29 Years (51 | 12.0%) for women.
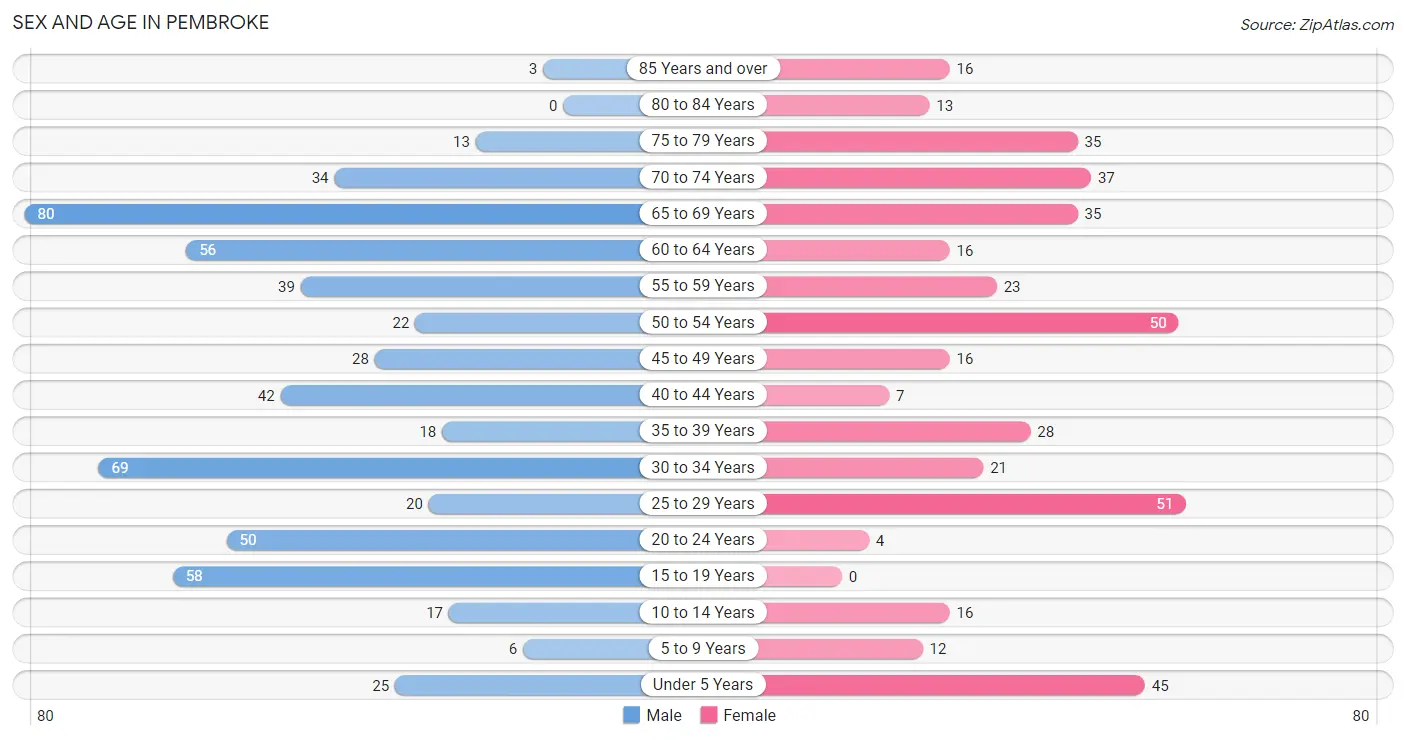
| Age Bracket | Male | Female |
| Under 5 Years | 25 (4.3%) | 45 (10.6%) |
| 5 to 9 Years | 6 (1.0%) | 12 (2.8%) |
| 10 to 14 Years | 17 (2.9%) | 16 (3.8%) |
| 15 to 19 Years | 58 (10.0%) | 0 (0.0%) |
| 20 to 24 Years | 50 (8.6%) | 4 (0.9%) |
| 25 to 29 Years | 20 (3.5%) | 51 (12.0%) |
| 30 to 34 Years | 69 (11.9%) | 21 (4.9%) |
| 35 to 39 Years | 18 (3.1%) | 28 (6.6%) |
| 40 to 44 Years | 42 (7.2%) | 7 (1.7%) |
| 45 to 49 Years | 28 (4.8%) | 16 (3.8%) |
| 50 to 54 Years | 22 (3.8%) | 50 (11.8%) |
| 55 to 59 Years | 39 (6.7%) | 23 (5.4%) |
| 60 to 64 Years | 56 (9.7%) | 16 (3.8%) |
| 65 to 69 Years | 80 (13.8%) | 35 (8.2%) |
| 70 to 74 Years | 34 (5.9%) | 37 (8.7%) |
| 75 to 79 Years | 13 (2.2%) | 35 (8.2%) |
| 80 to 84 Years | 0 (0.0%) | 13 (3.1%) |
| 85 Years and over | 3 (0.5%) | 16 (3.8%) |
| Total | 580 (100.0%) | 425 (100.0%) |
Families and Households in Pembroke
Median Family Size in Pembroke
The median family size in Pembroke is 3.15 persons per family, with single male/father families (21 | 10.2%) accounting for the largest median family size of 3.24 persons per family. On the other hand, married-couple families (154 | 75.1%) represent the smallest median family size with 3.14 persons per family.
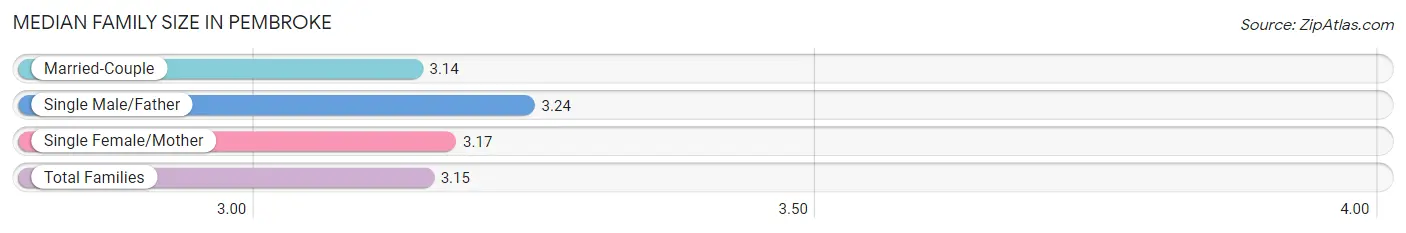
| Family Type | # Families | Family Size |
| Married-Couple | 154 (75.1%) | 3.14 |
| Single Male/Father | 21 (10.2%) | 3.24 |
| Single Female/Mother | 30 (14.6%) | 3.17 |
| Total Families | 205 (100.0%) | 3.15 |
Median Household Size in Pembroke
The median household size in Pembroke is 2.16 persons per household, with single female/mother households (30 | 6.4%) accounting for the largest median household size of 3.27 persons per household. non-family households (261 | 56.0%) represent the smallest median household size with 1.36 persons per household.
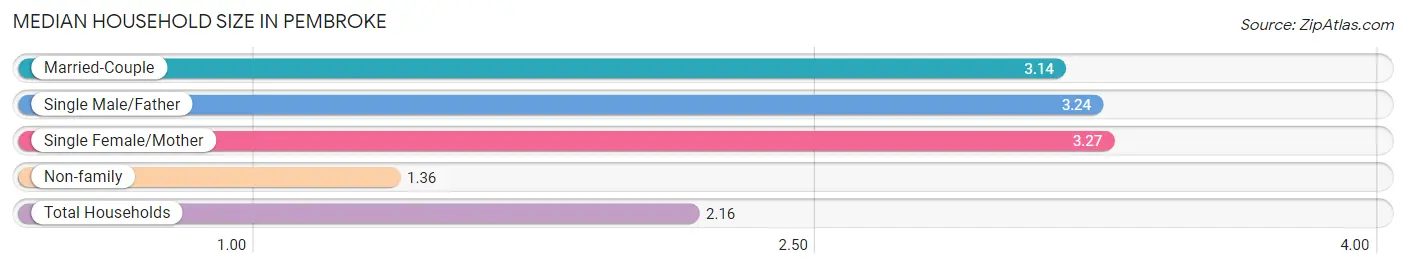
| Household Type | # Households | Household Size |
| Married-Couple | 154 (33.1%) | 3.14 |
| Single Male/Father | 21 (4.5%) | 3.24 |
| Single Female/Mother | 30 (6.4%) | 3.27 |
| Non-family | 261 (56.0%) | 1.36 |
| Total Households | 466 (100.0%) | 2.16 |
Household Size by Marriage Status in Pembroke
Out of a total of 466 households in Pembroke, 205 (44.0%) are family households, while 261 (56.0%) are nonfamily households. The most numerous type of family households are 2-person households, comprising 125, and the most common type of nonfamily households are 1-person households, comprising 219.
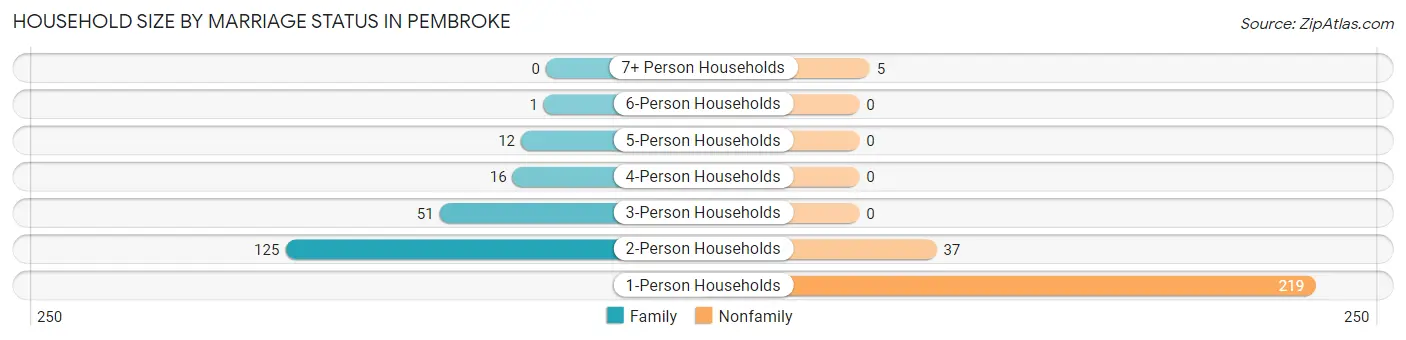
| Household Size | Family Households | Nonfamily Households |
| 1-Person Households | - | 219 (47.0%) |
| 2-Person Households | 125 (26.8%) | 37 (7.9%) |
| 3-Person Households | 51 (10.9%) | 0 (0.0%) |
| 4-Person Households | 16 (3.4%) | 0 (0.0%) |
| 5-Person Households | 12 (2.6%) | 0 (0.0%) |
| 6-Person Households | 1 (0.2%) | 0 (0.0%) |
| 7+ Person Households | 0 (0.0%) | 5 (1.1%) |
| Total | 205 (44.0%) | 261 (56.0%) |
Female Fertility in Pembroke
Fertility by Age in Pembroke
Average fertility rate in Pembroke is 202.0 births per 1,000 women. Women in the age bracket of 20 to 34 years have the highest fertility rate with 342.0 births per 1,000 women. Women in the age bracket of 20 to 34 years acount for 100.0% of all women with births.
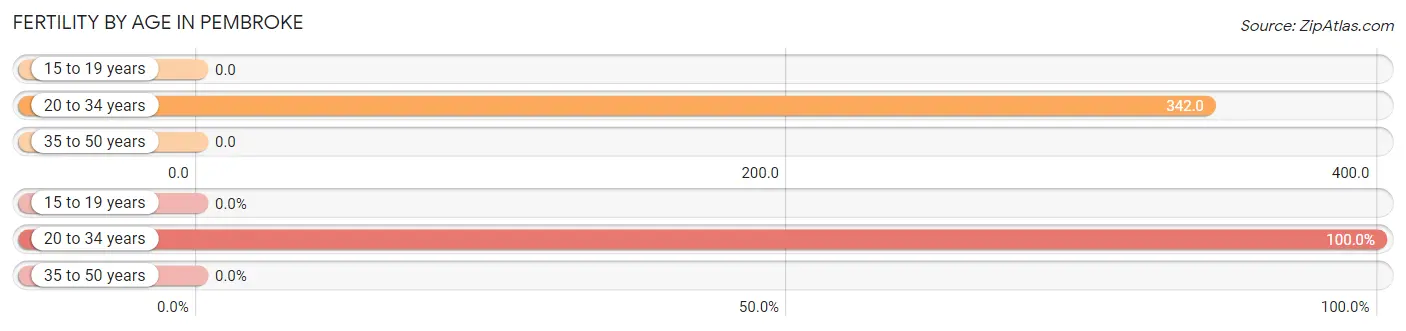
| Age Bracket | Women with Births | Births / 1,000 Women |
| 15 to 19 years | 0 (0.0%) | 0.0 |
| 20 to 34 years | 26 (100.0%) | 342.0 |
| 35 to 50 years | 0 (0.0%) | 0.0 |
| Total | 26 (100.0%) | 202.0 |
Fertility by Age by Marriage Status in Pembroke
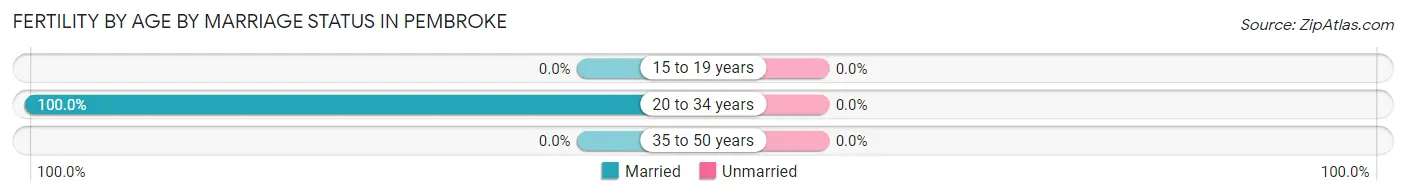
| Age Bracket | Married | Unmarried |
| 15 to 19 years | 0 (0.0%) | 0 (0.0%) |
| 20 to 34 years | 26 (100.0%) | 0 (0.0%) |
| 35 to 50 years | 0 (0.0%) | 0 (0.0%) |
| Total | 26 (100.0%) | 0 (0.0%) |
Fertility by Education in Pembroke
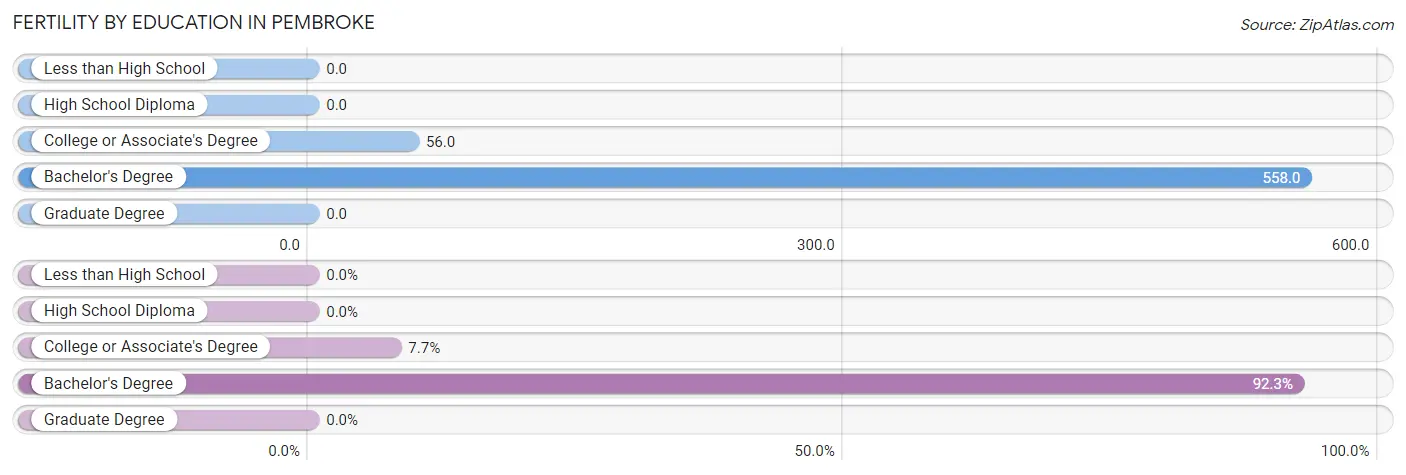
| Educational Attainment | Women with Births | Births / 1,000 Women |
| Less than High School | 0 (0.0%) | 0.0 |
| High School Diploma | 0 (0.0%) | 0.0 |
| College or Associate's Degree | 2 (7.7%) | 56.0 |
| Bachelor's Degree | 24 (92.3%) | 558.0 |
| Graduate Degree | 0 (0.0%) | 0.0 |
| Total | 26 (100.0%) | 202.0 |
Fertility by Education by Marriage Status in Pembroke
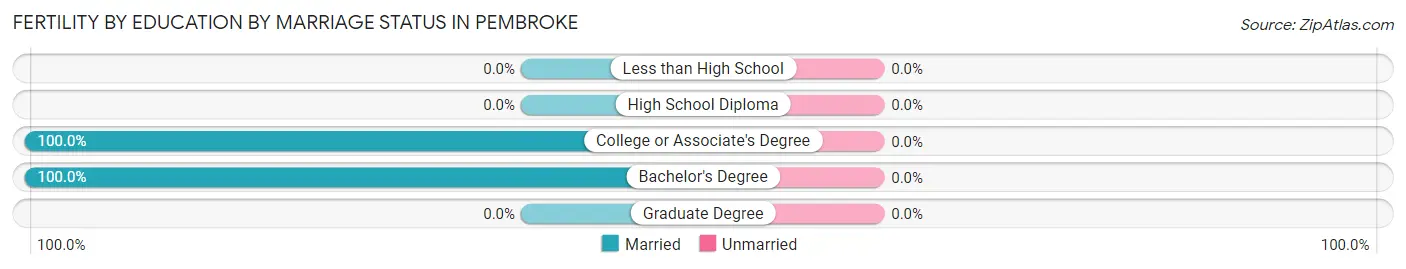
| Educational Attainment | Married | Unmarried |
| Less than High School | 0 (0.0%) | 0 (0.0%) |
| High School Diploma | 0 (0.0%) | 0 (0.0%) |
| College or Associate's Degree | 2 (100.0%) | 0 (0.0%) |
| Bachelor's Degree | 24 (100.0%) | 0 (0.0%) |
| Graduate Degree | 0 (0.0%) | 0 (0.0%) |
| Total | 26 (100.0%) | 0 (0.0%) |
Employment Characteristics in Pembroke
Employment by Class of Employer in Pembroke
Among the 544 employed individuals in Pembroke, private company employees (378 | 69.5%), state government employees (72 | 13.2%), and federal government employees (37 | 6.8%) make up the most common classes of employment.
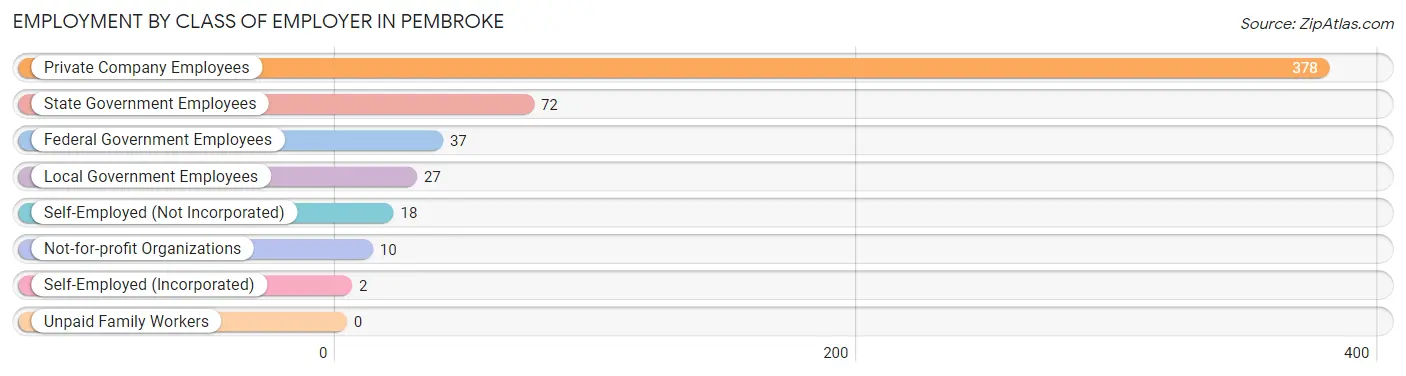
| Employer Class | # Employees | % Employees |
| Private Company Employees | 378 | 69.5% |
| Self-Employed (Incorporated) | 2 | 0.4% |
| Self-Employed (Not Incorporated) | 18 | 3.3% |
| Not-for-profit Organizations | 10 | 1.8% |
| Local Government Employees | 27 | 5.0% |
| State Government Employees | 72 | 13.2% |
| Federal Government Employees | 37 | 6.8% |
| Unpaid Family Workers | 0 | 0.0% |
| Total | 544 | 100.0% |
Employment Status by Age in Pembroke
According to the labor force statistics for Pembroke, out of the total population over 16 years of age (878), 63.8% or 560 individuals are in the labor force, with 0.7% or 4 of them unemployed. The age group with the highest labor force participation rate is 25 to 29 years, with 100.0% or 71 individuals in the labor force. Within the labor force, the 20 to 24 years age range has the highest percentage of unemployed individuals, with 7.8% or 4 of them being unemployed.
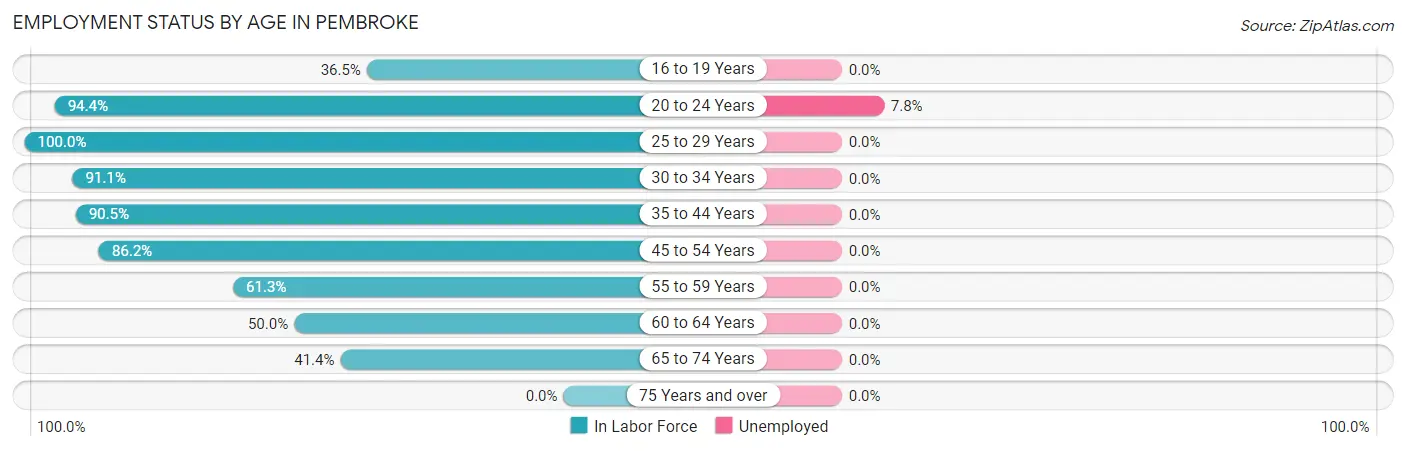
| Age Bracket | In Labor Force | Unemployed |
| 16 to 19 Years | 19 (36.5%) | 0 (0.0%) |
| 20 to 24 Years | 51 (94.4%) | 4 (7.8%) |
| 25 to 29 Years | 71 (100.0%) | 0 (0.0%) |
| 30 to 34 Years | 82 (91.1%) | 0 (0.0%) |
| 35 to 44 Years | 86 (90.5%) | 0 (0.0%) |
| 45 to 54 Years | 100 (86.2%) | 0 (0.0%) |
| 55 to 59 Years | 38 (61.3%) | 0 (0.0%) |
| 60 to 64 Years | 36 (50.0%) | 0 (0.0%) |
| 65 to 74 Years | 77 (41.4%) | 0 (0.0%) |
| 75 Years and over | 0 (0.0%) | 0 (0.0%) |
| Total | 560 (63.8%) | 4 (0.7%) |
Employment Status by Educational Attainment in Pembroke
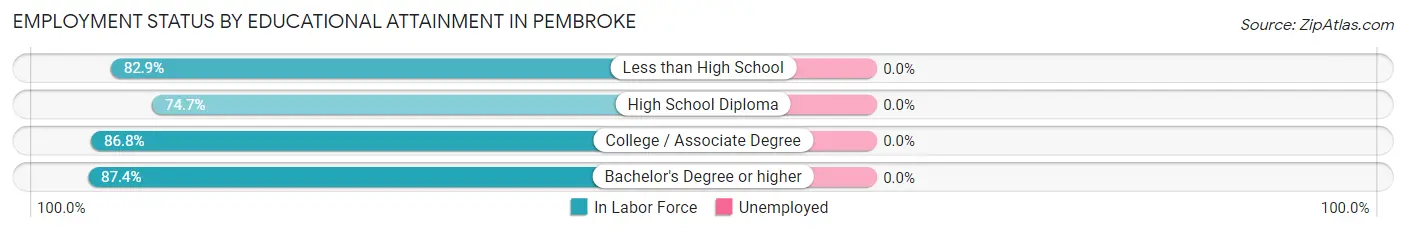
| Educational Attainment | In Labor Force | Unemployed |
| Less than High School | 63 (82.9%) | 0 (0.0%) |
| High School Diploma | 148 (74.7%) | 0 (0.0%) |
| College / Associate Degree | 105 (86.8%) | 0 (0.0%) |
| Bachelor's Degree or higher | 97 (87.4%) | 0 (0.0%) |
| Total | 413 (81.6%) | 0 (0.0%) |
Employment Occupations by Sex in Pembroke
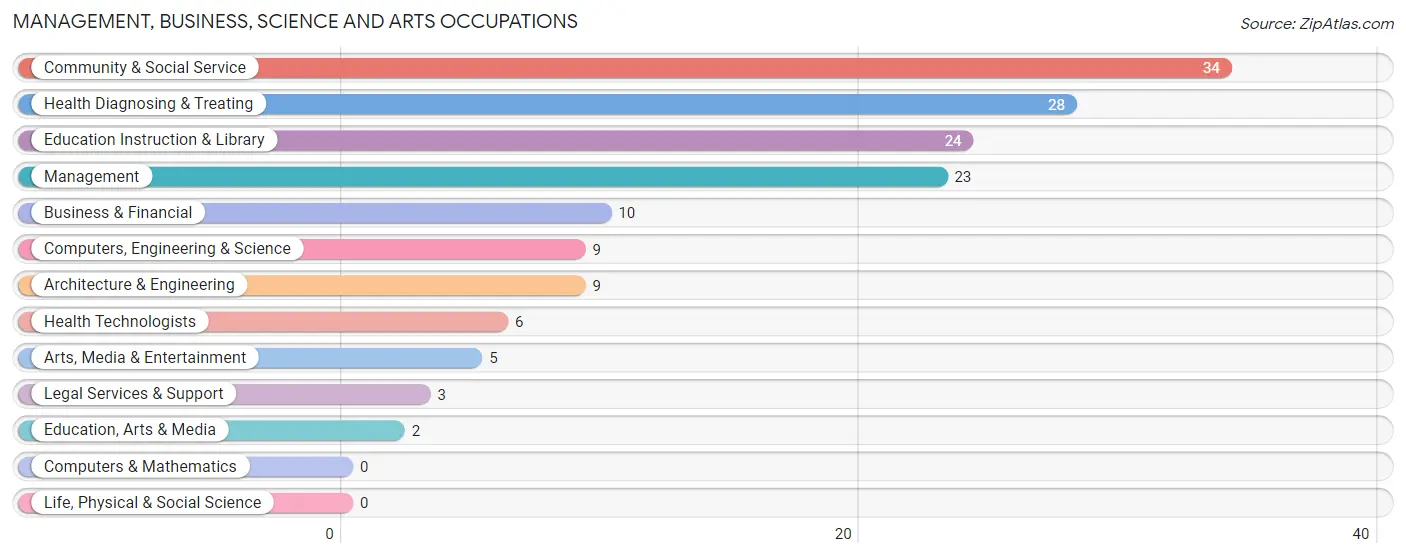
Management, Business, Science and Arts Occupations
The most common Management, Business, Science and Arts occupations in Pembroke are Community & Social Service (34 | 6.1%), Health Diagnosing & Treating (28 | 5.0%), Education Instruction & Library (24 | 4.3%), Management (23 | 4.1%), and Business & Financial (10 | 1.8%).
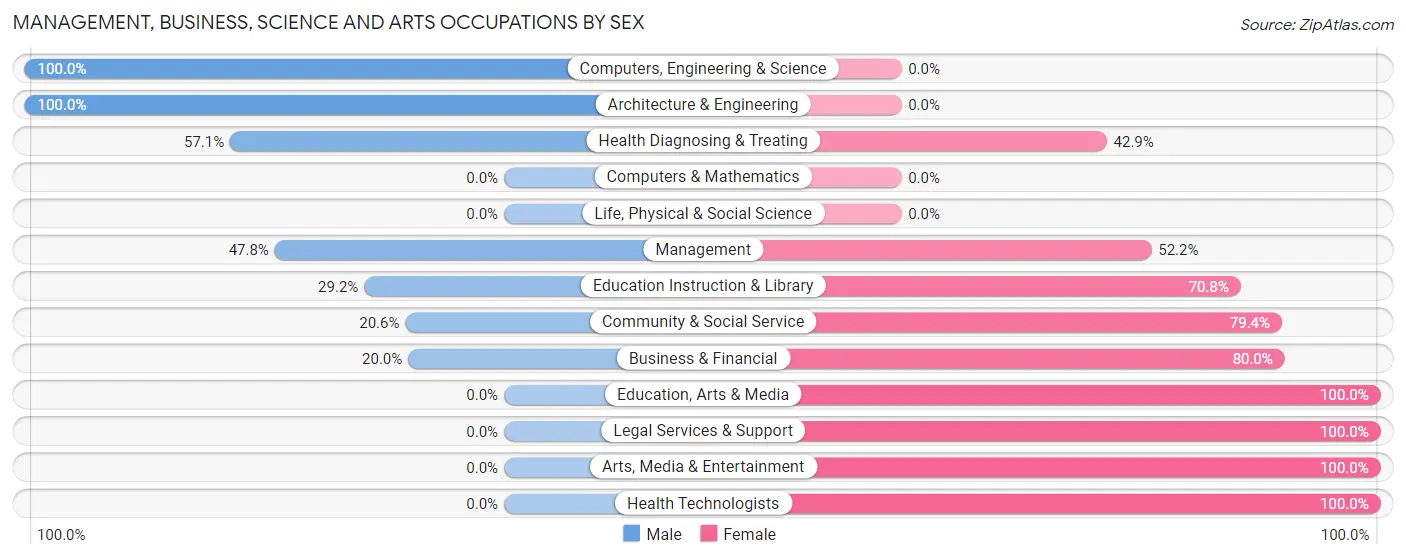
Management, Business, Science and Arts Occupations by Sex
Within the Management, Business, Science and Arts occupations in Pembroke, the most male-oriented occupations are Computers, Engineering & Science (100.0%), Architecture & Engineering (100.0%), and Health Diagnosing & Treating (57.1%), while the most female-oriented occupations are Education, Arts & Media (100.0%), Legal Services & Support (100.0%), and Arts, Media & Entertainment (100.0%).
| Occupation | Male | Female |
| Management | 11 (47.8%) | 12 (52.2%) |
| Business & Financial | 2 (20.0%) | 8 (80.0%) |
| Computers, Engineering & Science | 9 (100.0%) | 0 (0.0%) |
| Computers & Mathematics | 0 (0.0%) | 0 (0.0%) |
| Architecture & Engineering | 9 (100.0%) | 0 (0.0%) |
| Life, Physical & Social Science | 0 (0.0%) | 0 (0.0%) |
| Community & Social Service | 7 (20.6%) | 27 (79.4%) |
| Education, Arts & Media | 0 (0.0%) | 2 (100.0%) |
| Legal Services & Support | 0 (0.0%) | 3 (100.0%) |
| Education Instruction & Library | 7 (29.2%) | 17 (70.8%) |
| Arts, Media & Entertainment | 0 (0.0%) | 5 (100.0%) |
| Health Diagnosing & Treating | 16 (57.1%) | 12 (42.9%) |
| Health Technologists | 0 (0.0%) | 6 (100.0%) |
| Total (Category) | 45 (43.3%) | 59 (56.7%) |
| Total (Overall) | 372 (66.9%) | 184 (33.1%) |
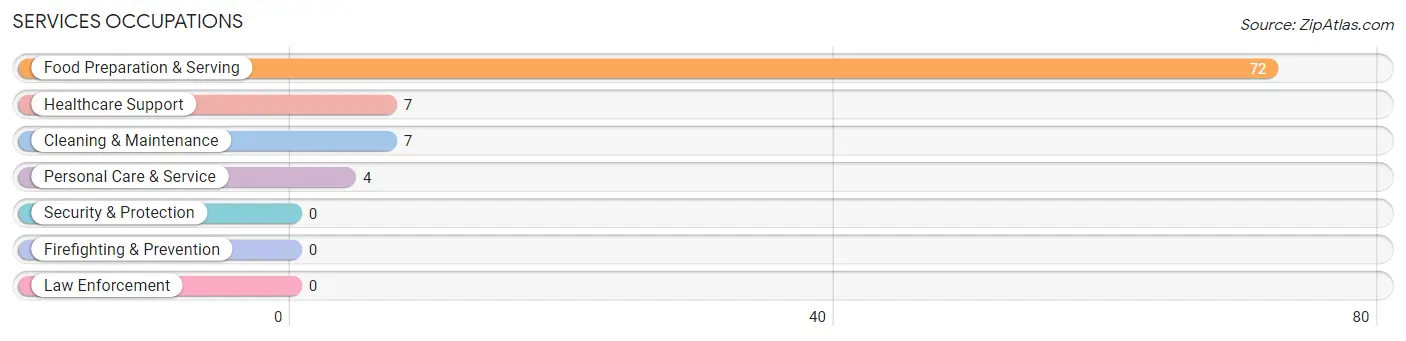
Services Occupations
The most common Services occupations in Pembroke are Food Preparation & Serving (72 | 13.0%), Healthcare Support (7 | 1.3%), Cleaning & Maintenance (7 | 1.3%), and Personal Care & Service (4 | 0.7%).
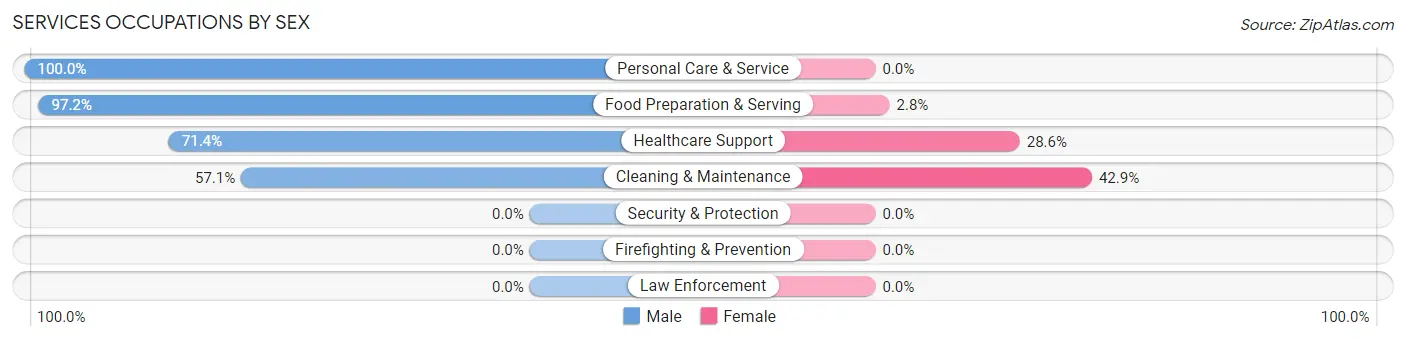
Services Occupations by Sex
Within the Services occupations in Pembroke, the most male-oriented occupations are Personal Care & Service (100.0%), Food Preparation & Serving (97.2%), and Healthcare Support (71.4%), while the most female-oriented occupations are Cleaning & Maintenance (42.9%), Healthcare Support (28.6%), and Food Preparation & Serving (2.8%).
| Occupation | Male | Female |
| Healthcare Support | 5 (71.4%) | 2 (28.6%) |
| Security & Protection | 0 (0.0%) | 0 (0.0%) |
| Firefighting & Prevention | 0 (0.0%) | 0 (0.0%) |
| Law Enforcement | 0 (0.0%) | 0 (0.0%) |
| Food Preparation & Serving | 70 (97.2%) | 2 (2.8%) |
| Cleaning & Maintenance | 4 (57.1%) | 3 (42.9%) |
| Personal Care & Service | 4 (100.0%) | 0 (0.0%) |
| Total (Category) | 83 (92.2%) | 7 (7.8%) |
| Total (Overall) | 372 (66.9%) | 184 (33.1%) |
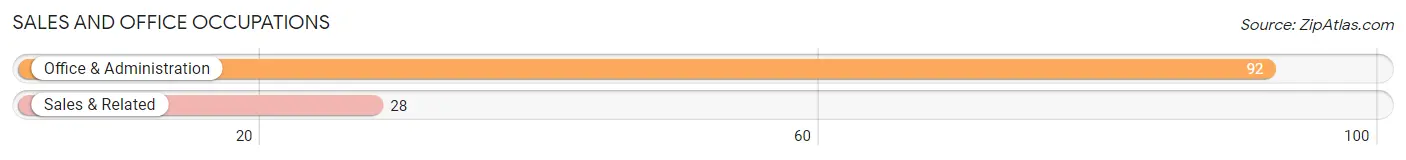
Sales and Office Occupations
The most common Sales and Office occupations in Pembroke are Office & Administration (92 | 16.6%), and Sales & Related (28 | 5.0%).
Sales and Office Occupations by Sex
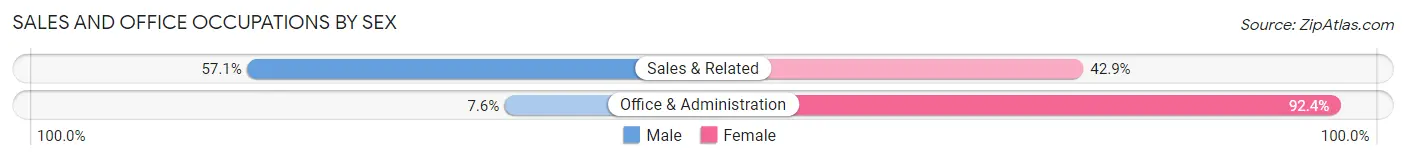
| Occupation | Male | Female |
| Sales & Related | 16 (57.1%) | 12 (42.9%) |
| Office & Administration | 7 (7.6%) | 85 (92.4%) |
| Total (Category) | 23 (19.2%) | 97 (80.8%) |
| Total (Overall) | 372 (66.9%) | 184 (33.1%) |
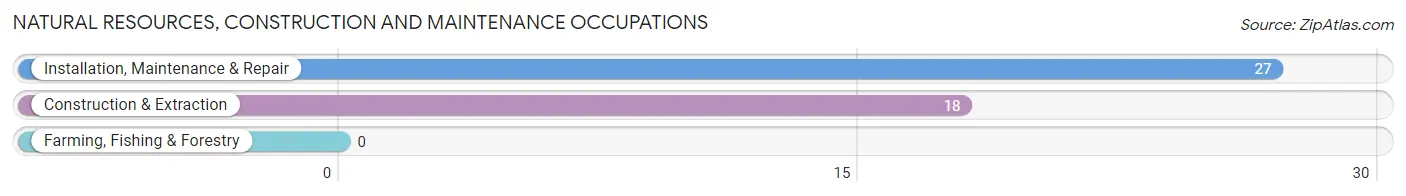
Natural Resources, Construction and Maintenance Occupations
The most common Natural Resources, Construction and Maintenance occupations in Pembroke are Installation, Maintenance & Repair (27 | 4.9%), and Construction & Extraction (18 | 3.2%).
Natural Resources, Construction and Maintenance Occupations by Sex
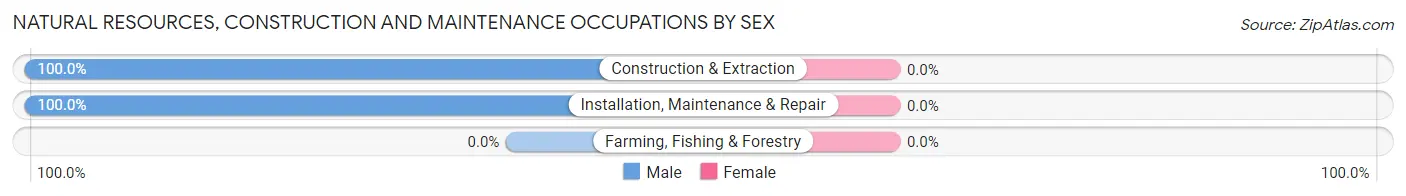
| Occupation | Male | Female |
| Farming, Fishing & Forestry | 0 (0.0%) | 0 (0.0%) |
| Construction & Extraction | 18 (100.0%) | 0 (0.0%) |
| Installation, Maintenance & Repair | 27 (100.0%) | 0 (0.0%) |
| Total (Category) | 45 (100.0%) | 0 (0.0%) |
| Total (Overall) | 372 (66.9%) | 184 (33.1%) |
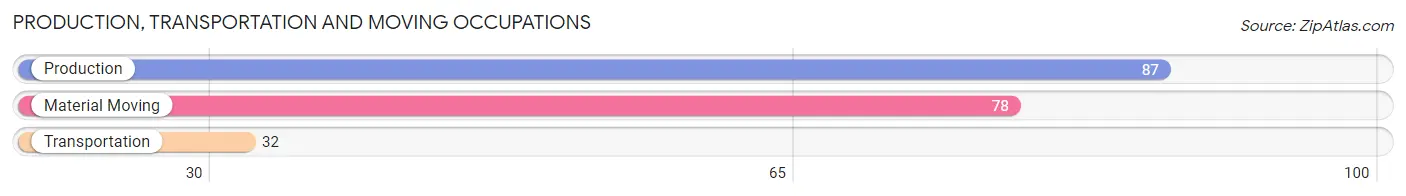
Production, Transportation and Moving Occupations
The most common Production, Transportation and Moving occupations in Pembroke are Production (87 | 15.7%), Material Moving (78 | 14.0%), and Transportation (32 | 5.8%).
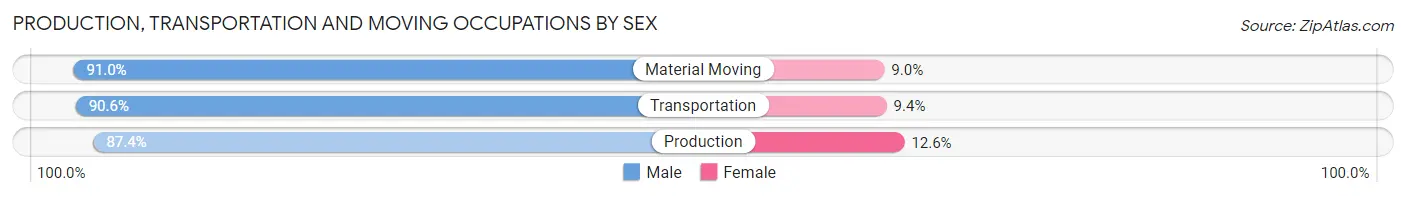
Production, Transportation and Moving Occupations by Sex
| Occupation | Male | Female |
| Production | 76 (87.4%) | 11 (12.6%) |
| Transportation | 29 (90.6%) | 3 (9.4%) |
| Material Moving | 71 (91.0%) | 7 (9.0%) |
| Total (Category) | 176 (89.3%) | 21 (10.7%) |
| Total (Overall) | 372 (66.9%) | 184 (33.1%) |
Employment Industries by Sex in Pembroke
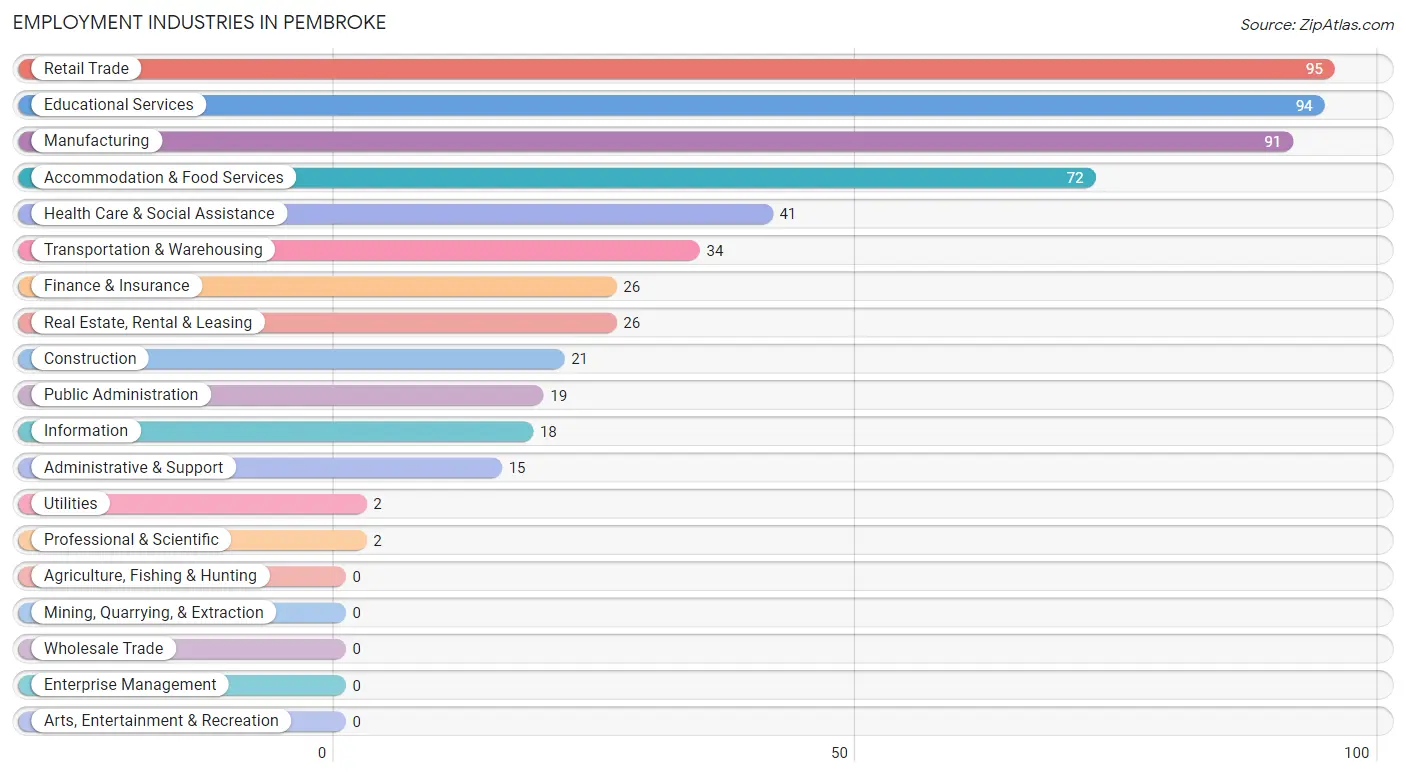
Employment Industries in Pembroke
The major employment industries in Pembroke include Retail Trade (95 | 17.1%), Educational Services (94 | 16.9%), Manufacturing (91 | 16.4%), Accommodation & Food Services (72 | 13.0%), and Health Care & Social Assistance (41 | 7.4%).
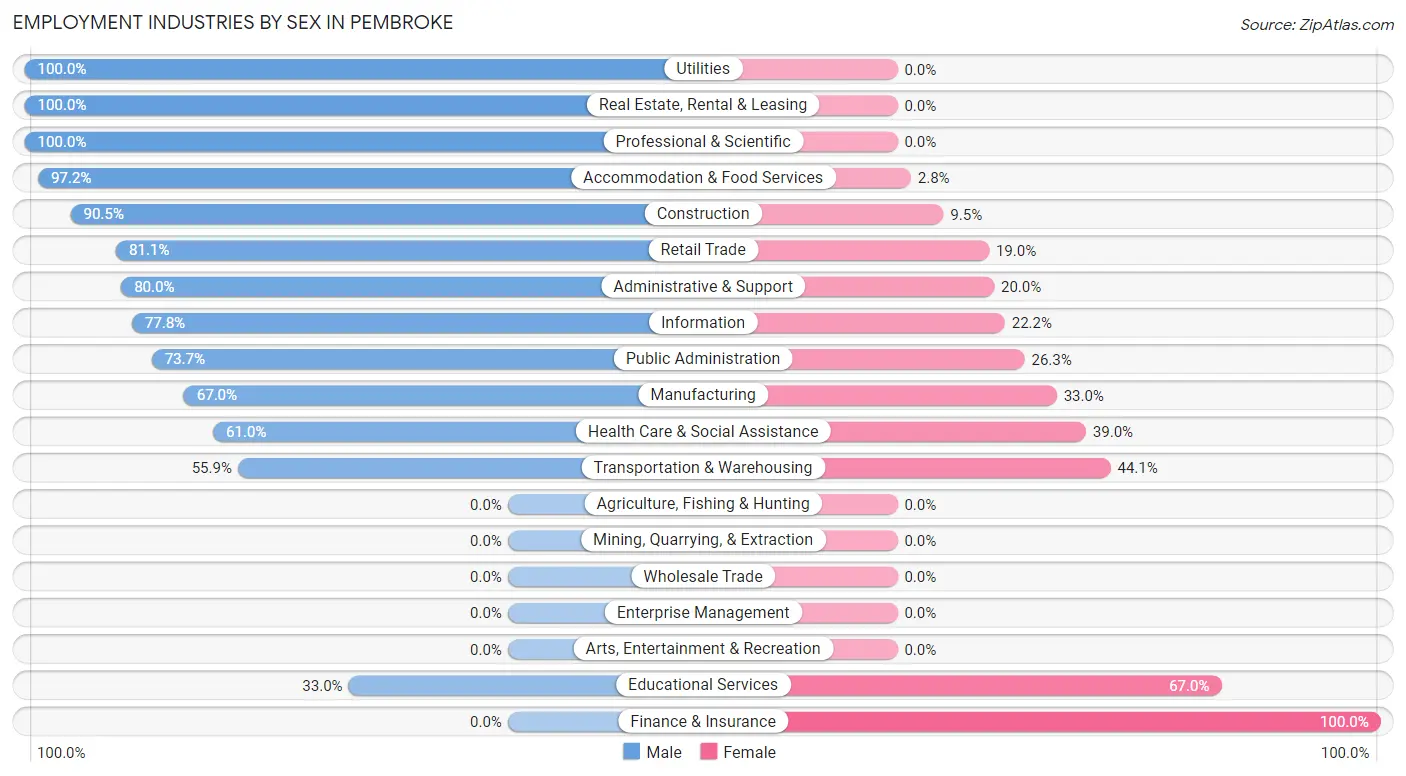
Employment Industries by Sex in Pembroke
The Pembroke industries that see more men than women are Utilities (100.0%), Real Estate, Rental & Leasing (100.0%), and Professional & Scientific (100.0%), whereas the industries that tend to have a higher number of women are Finance & Insurance (100.0%), Educational Services (67.0%), and Transportation & Warehousing (44.1%).
| Industry | Male | Female |
| Agriculture, Fishing & Hunting | 0 (0.0%) | 0 (0.0%) |
| Mining, Quarrying, & Extraction | 0 (0.0%) | 0 (0.0%) |
| Construction | 19 (90.5%) | 2 (9.5%) |
| Manufacturing | 61 (67.0%) | 30 (33.0%) |
| Wholesale Trade | 0 (0.0%) | 0 (0.0%) |
| Retail Trade | 77 (81.0%) | 18 (19.0%) |
| Transportation & Warehousing | 19 (55.9%) | 15 (44.1%) |
| Utilities | 2 (100.0%) | 0 (0.0%) |
| Information | 14 (77.8%) | 4 (22.2%) |
| Finance & Insurance | 0 (0.0%) | 26 (100.0%) |
| Real Estate, Rental & Leasing | 26 (100.0%) | 0 (0.0%) |
| Professional & Scientific | 2 (100.0%) | 0 (0.0%) |
| Enterprise Management | 0 (0.0%) | 0 (0.0%) |
| Administrative & Support | 12 (80.0%) | 3 (20.0%) |
| Educational Services | 31 (33.0%) | 63 (67.0%) |
| Health Care & Social Assistance | 25 (61.0%) | 16 (39.0%) |
| Arts, Entertainment & Recreation | 0 (0.0%) | 0 (0.0%) |
| Accommodation & Food Services | 70 (97.2%) | 2 (2.8%) |
| Public Administration | 14 (73.7%) | 5 (26.3%) |
| Total | 372 (66.9%) | 184 (33.1%) |
Education in Pembroke
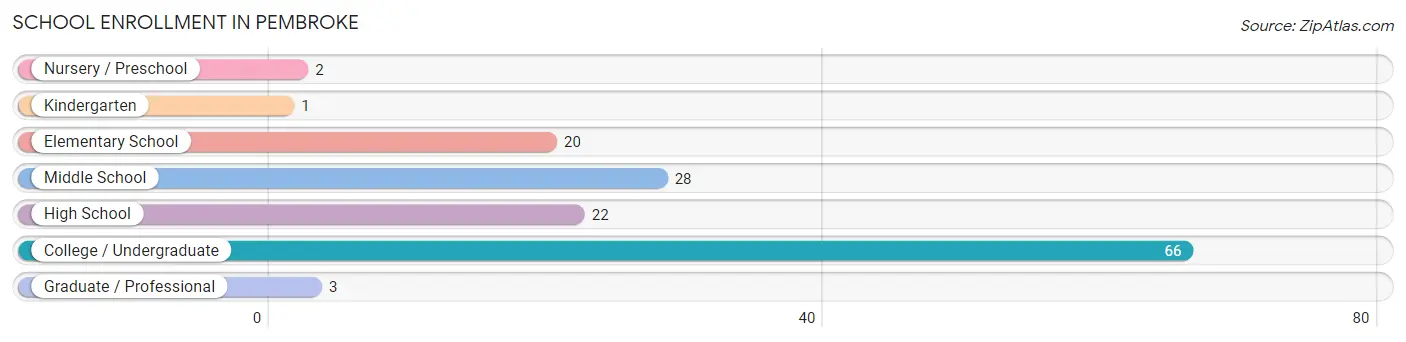
School Enrollment in Pembroke
The most common levels of schooling among the 142 students in Pembroke are college / undergraduate (66 | 46.5%), middle school (28 | 19.7%), and high school (22 | 15.5%).
| School Level | # Students | % Students |
| Nursery / Preschool | 2 | 1.4% |
| Kindergarten | 1 | 0.7% |
| Elementary School | 20 | 14.1% |
| Middle School | 28 | 19.7% |
| High School | 22 | 15.5% |
| College / Undergraduate | 66 | 46.5% |
| Graduate / Professional | 3 | 2.1% |
| Total | 142 | 100.0% |
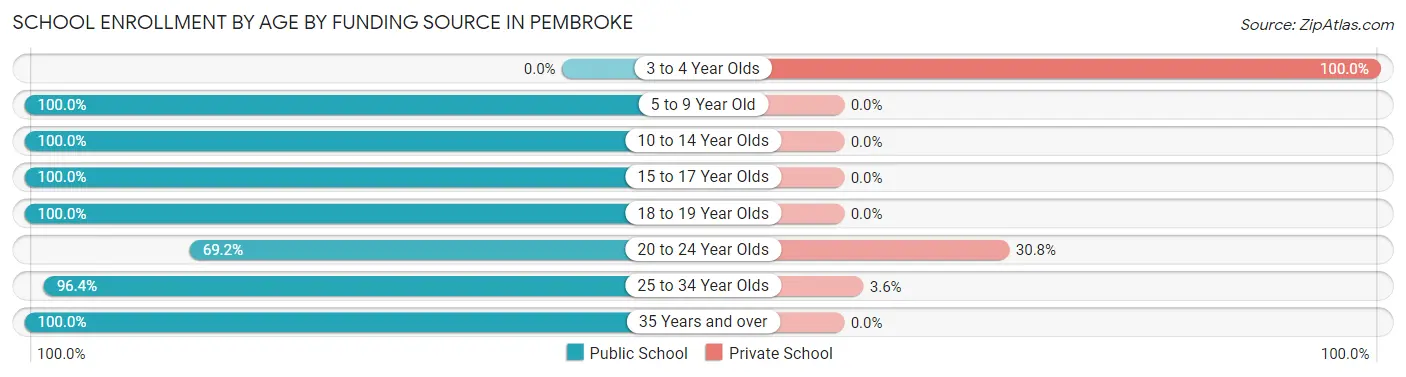
School Enrollment by Age by Funding Source in Pembroke
Out of a total of 142 students who are enrolled in schools in Pembroke, 7 (4.9%) attend a private institution, while the remaining 135 (95.1%) are enrolled in public schools. The age group of 3 to 4 year olds has the highest likelihood of being enrolled in private schools, with 2 (100.0% in the age bracket) enrolled. Conversely, the age group of 5 to 9 year old has the lowest likelihood of being enrolled in a private school, with 18 (100.0% in the age bracket) attending a public institution.
| Age Bracket | Public School | Private School |
| 3 to 4 Year Olds | 0 (0.0%) | 2 (100.0%) |
| 5 to 9 Year Old | 18 (100.0%) | 0 (0.0%) |
| 10 to 14 Year Olds | 33 (100.0%) | 0 (0.0%) |
| 15 to 17 Year Olds | 12 (100.0%) | 0 (0.0%) |
| 18 to 19 Year Olds | 20 (100.0%) | 0 (0.0%) |
| 20 to 24 Year Olds | 9 (69.2%) | 4 (30.8%) |
| 25 to 34 Year Olds | 27 (96.4%) | 1 (3.6%) |
| 35 Years and over | 16 (100.0%) | 0 (0.0%) |
| Total | 135 (95.1%) | 7 (4.9%) |
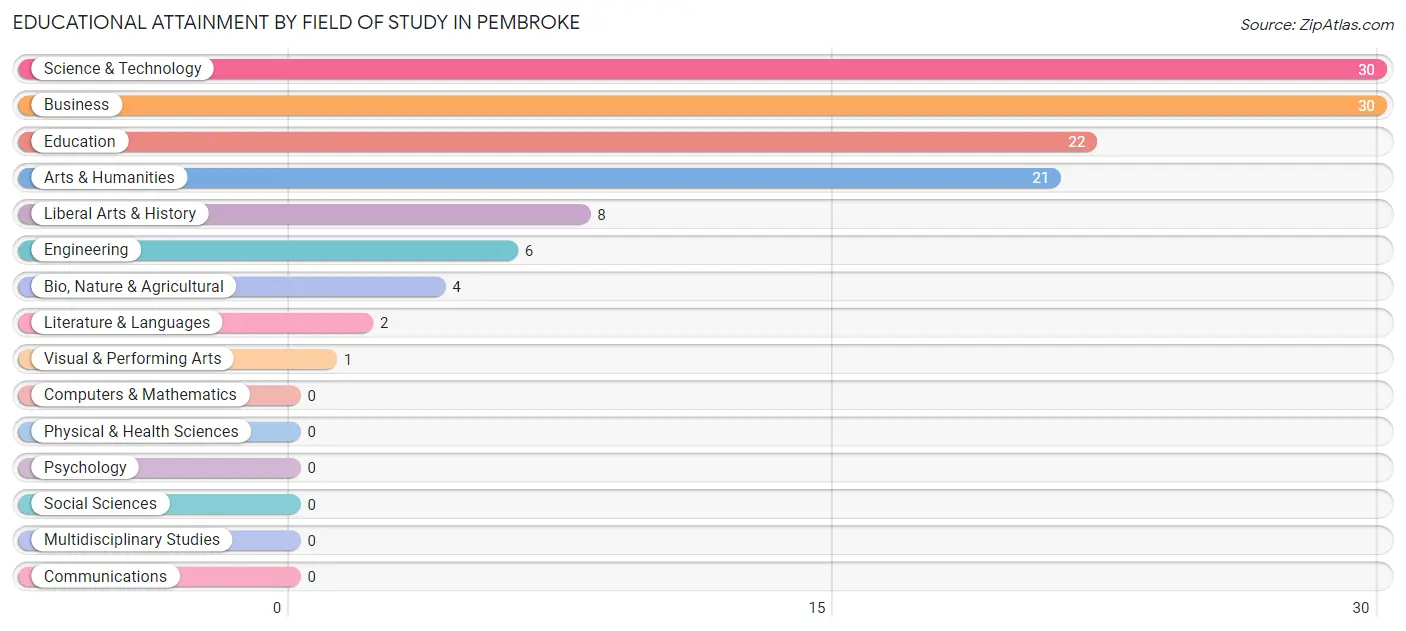
Educational Attainment by Field of Study in Pembroke
Science & technology (30 | 24.2%), business (30 | 24.2%), education (22 | 17.7%), arts & humanities (21 | 16.9%), and liberal arts & history (8 | 6.5%) are the most common fields of study among 124 individuals in Pembroke who have obtained a bachelor's degree or higher.
| Field of Study | # Graduates | % Graduates |
| Computers & Mathematics | 0 | 0.0% |
| Bio, Nature & Agricultural | 4 | 3.2% |
| Physical & Health Sciences | 0 | 0.0% |
| Psychology | 0 | 0.0% |
| Social Sciences | 0 | 0.0% |
| Engineering | 6 | 4.8% |
| Multidisciplinary Studies | 0 | 0.0% |
| Science & Technology | 30 | 24.2% |
| Business | 30 | 24.2% |
| Education | 22 | 17.7% |
| Literature & Languages | 2 | 1.6% |
| Liberal Arts & History | 8 | 6.5% |
| Visual & Performing Arts | 1 | 0.8% |
| Communications | 0 | 0.0% |
| Arts & Humanities | 21 | 16.9% |
| Total | 124 | 100.0% |
Transportation & Commute in Pembroke
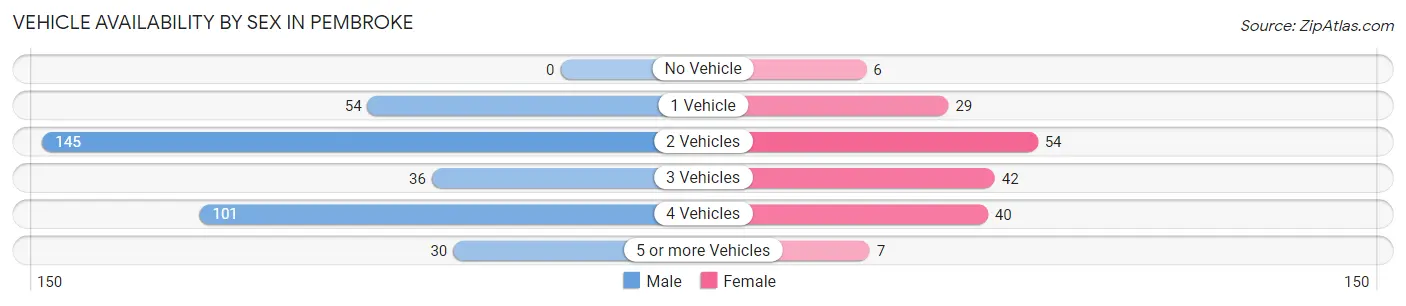
Vehicle Availability by Sex in Pembroke
The most prevalent vehicle ownership categories in Pembroke are males with 2 vehicles (145, accounting for 39.6%) and females with 2 vehicles (54, making up 81.5%).
| Vehicles Available | Male | Female |
| No Vehicle | 0 (0.0%) | 6 (3.4%) |
| 1 Vehicle | 54 (14.7%) | 29 (16.3%) |
| 2 Vehicles | 145 (39.6%) | 54 (30.3%) |
| 3 Vehicles | 36 (9.8%) | 42 (23.6%) |
| 4 Vehicles | 101 (27.6%) | 40 (22.5%) |
| 5 or more Vehicles | 30 (8.2%) | 7 (3.9%) |
| Total | 366 (100.0%) | 178 (100.0%) |
Commute Time in Pembroke
The most frequently occuring commute durations in Pembroke are 10 to 14 minutes (106 commuters, 19.9%), 5 to 9 minutes (98 commuters, 18.3%), and 30 to 34 minutes (72 commuters, 13.5%).
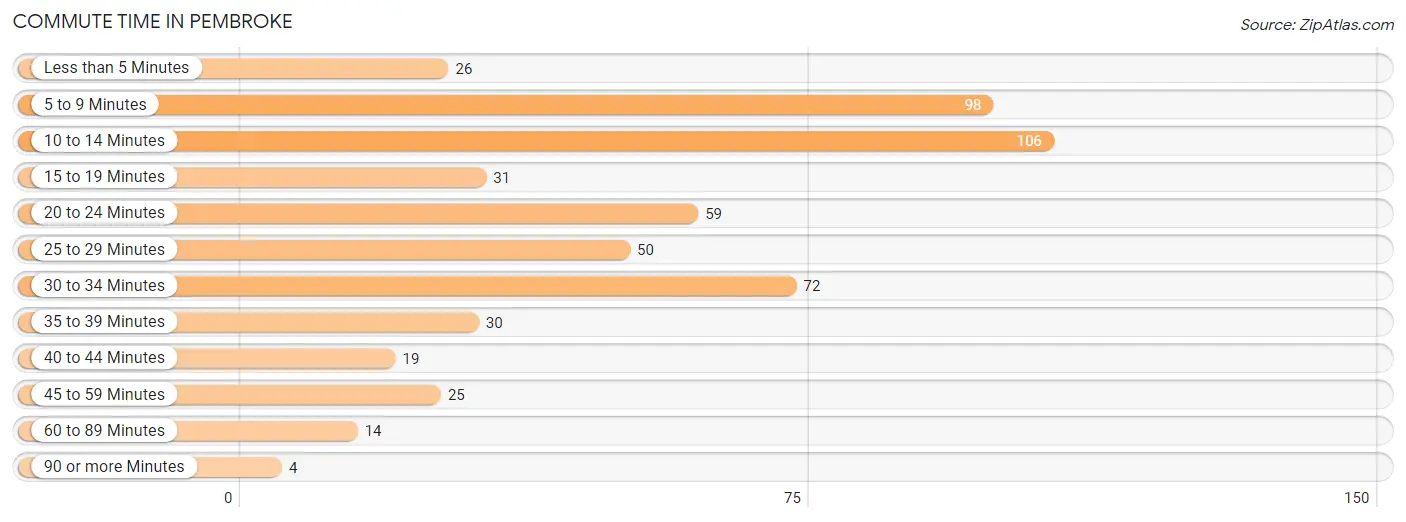
| Commute Time | # Commuters | % Commuters |
| Less than 5 Minutes | 26 | 4.9% |
| 5 to 9 Minutes | 98 | 18.3% |
| 10 to 14 Minutes | 106 | 19.9% |
| 15 to 19 Minutes | 31 | 5.8% |
| 20 to 24 Minutes | 59 | 11.1% |
| 25 to 29 Minutes | 50 | 9.4% |
| 30 to 34 Minutes | 72 | 13.5% |
| 35 to 39 Minutes | 30 | 5.6% |
| 40 to 44 Minutes | 19 | 3.6% |
| 45 to 59 Minutes | 25 | 4.7% |
| 60 to 89 Minutes | 14 | 2.6% |
| 90 or more Minutes | 4 | 0.7% |
Commute Time by Sex in Pembroke
The most common commute times in Pembroke are 5 to 9 minutes (70 commuters, 19.1%) for males and 10 to 14 minutes (43 commuters, 25.6%) for females.
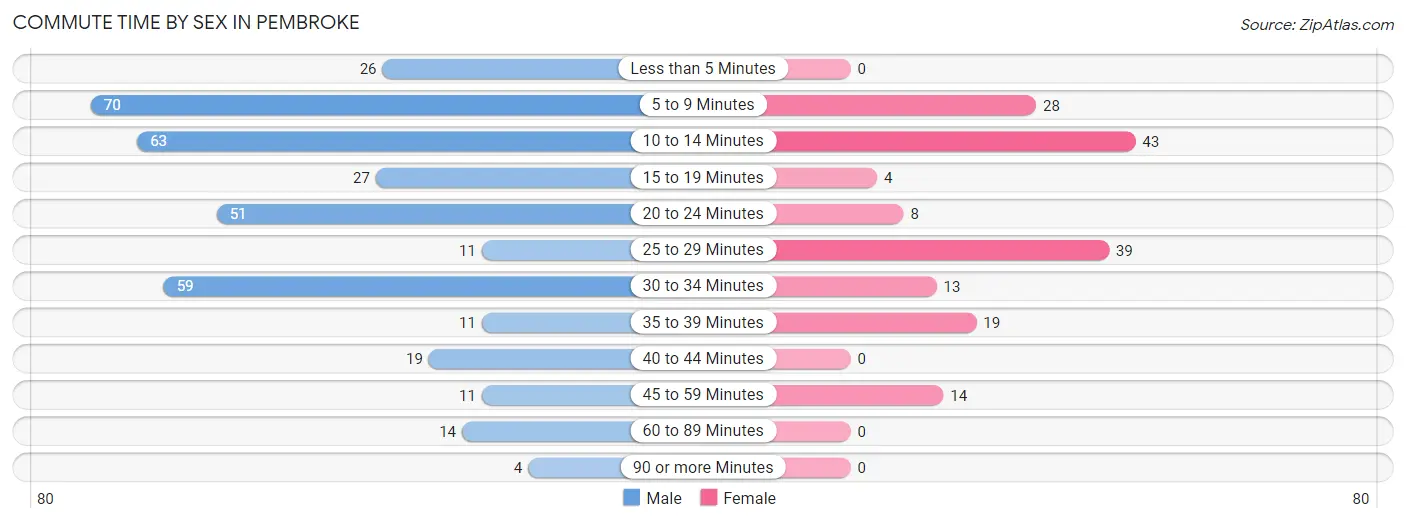
| Commute Time | Male | Female |
| Less than 5 Minutes | 26 (7.1%) | 0 (0.0%) |
| 5 to 9 Minutes | 70 (19.1%) | 28 (16.7%) |
| 10 to 14 Minutes | 63 (17.2%) | 43 (25.6%) |
| 15 to 19 Minutes | 27 (7.4%) | 4 (2.4%) |
| 20 to 24 Minutes | 51 (13.9%) | 8 (4.8%) |
| 25 to 29 Minutes | 11 (3.0%) | 39 (23.2%) |
| 30 to 34 Minutes | 59 (16.1%) | 13 (7.7%) |
| 35 to 39 Minutes | 11 (3.0%) | 19 (11.3%) |
| 40 to 44 Minutes | 19 (5.2%) | 0 (0.0%) |
| 45 to 59 Minutes | 11 (3.0%) | 14 (8.3%) |
| 60 to 89 Minutes | 14 (3.8%) | 0 (0.0%) |
| 90 or more Minutes | 4 (1.1%) | 0 (0.0%) |
Time of Departure to Work by Sex in Pembroke
The most frequent times of departure to work in Pembroke are 9:00 AM to 9:59 AM (90, 24.6%) for males and 8:00 AM to 8:29 AM (47, 28.0%) for females.
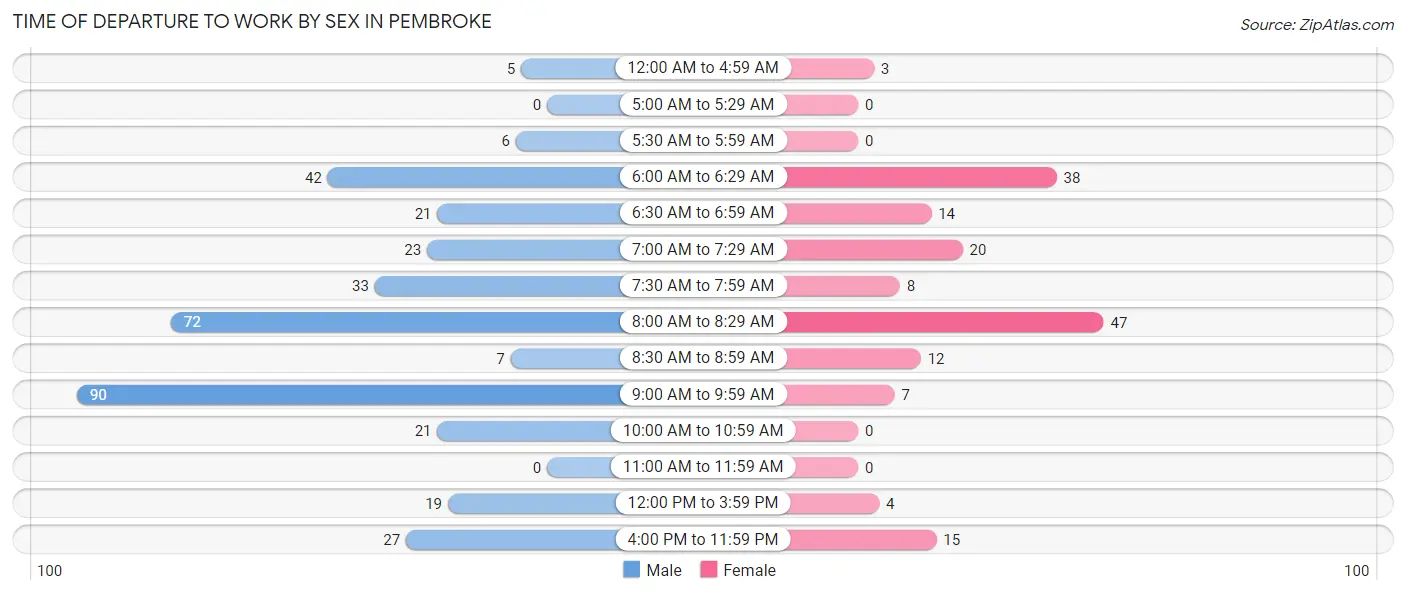
| Time of Departure | Male | Female |
| 12:00 AM to 4:59 AM | 5 (1.4%) | 3 (1.8%) |
| 5:00 AM to 5:29 AM | 0 (0.0%) | 0 (0.0%) |
| 5:30 AM to 5:59 AM | 6 (1.6%) | 0 (0.0%) |
| 6:00 AM to 6:29 AM | 42 (11.5%) | 38 (22.6%) |
| 6:30 AM to 6:59 AM | 21 (5.7%) | 14 (8.3%) |
| 7:00 AM to 7:29 AM | 23 (6.3%) | 20 (11.9%) |
| 7:30 AM to 7:59 AM | 33 (9.0%) | 8 (4.8%) |
| 8:00 AM to 8:29 AM | 72 (19.7%) | 47 (28.0%) |
| 8:30 AM to 8:59 AM | 7 (1.9%) | 12 (7.1%) |
| 9:00 AM to 9:59 AM | 90 (24.6%) | 7 (4.2%) |
| 10:00 AM to 10:59 AM | 21 (5.7%) | 0 (0.0%) |
| 11:00 AM to 11:59 AM | 0 (0.0%) | 0 (0.0%) |
| 12:00 PM to 3:59 PM | 19 (5.2%) | 4 (2.4%) |
| 4:00 PM to 11:59 PM | 27 (7.4%) | 15 (8.9%) |
| Total | 366 (100.0%) | 168 (100.0%) |
Housing Occupancy in Pembroke
Occupancy by Ownership in Pembroke
Of the total 466 dwellings in Pembroke, owner-occupied units account for 296 (63.5%), while renter-occupied units make up 170 (36.5%).
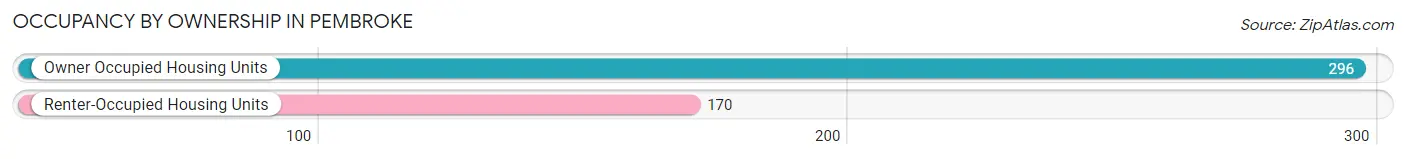
| Occupancy | # Housing Units | % Housing Units |
| Owner Occupied Housing Units | 296 | 63.5% |
| Renter-Occupied Housing Units | 170 | 36.5% |
| Total Occupied Housing Units | 466 | 100.0% |
Occupancy by Household Size in Pembroke
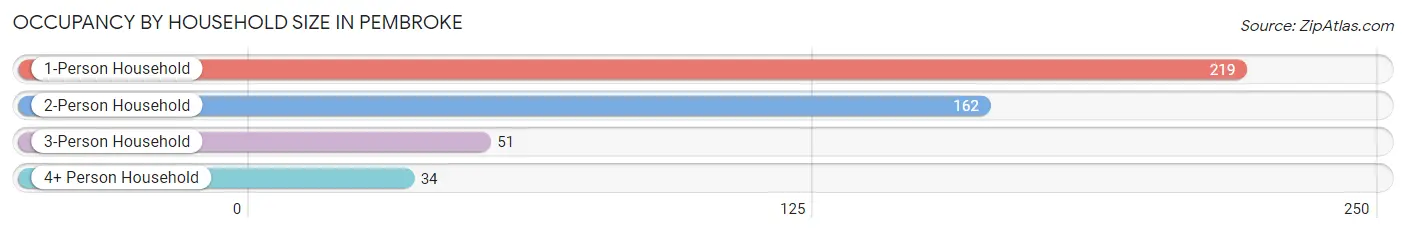
| Household Size | # Housing Units | % Housing Units |
| 1-Person Household | 219 | 47.0% |
| 2-Person Household | 162 | 34.8% |
| 3-Person Household | 51 | 10.9% |
| 4+ Person Household | 34 | 7.3% |
| Total Housing Units | 466 | 100.0% |
Occupancy by Ownership by Household Size in Pembroke
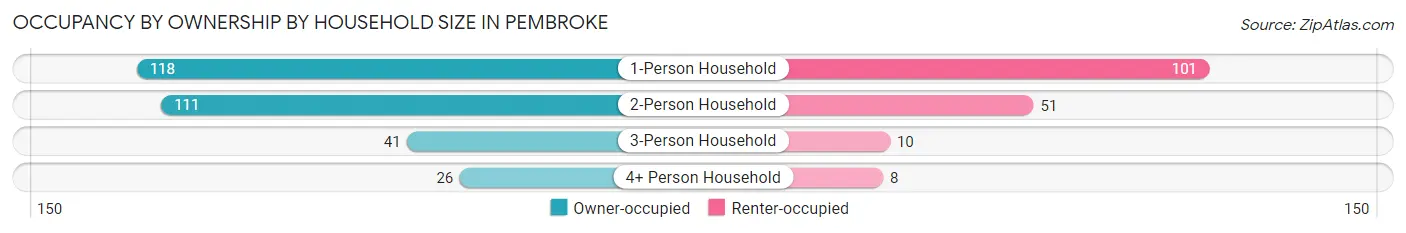
| Household Size | Owner-occupied | Renter-occupied |
| 1-Person Household | 118 (53.9%) | 101 (46.1%) |
| 2-Person Household | 111 (68.5%) | 51 (31.5%) |
| 3-Person Household | 41 (80.4%) | 10 (19.6%) |
| 4+ Person Household | 26 (76.5%) | 8 (23.5%) |
| Total Housing Units | 296 (63.5%) | 170 (36.5%) |
Occupancy by Educational Attainment in Pembroke
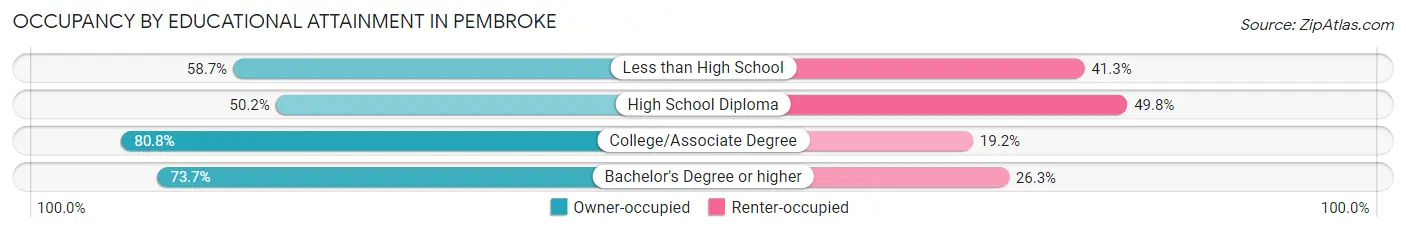
| Household Size | Owner-occupied | Renter-occupied |
| Less than High School | 27 (58.7%) | 19 (41.3%) |
| High School Diploma | 109 (50.2%) | 108 (49.8%) |
| College/Associate Degree | 118 (80.8%) | 28 (19.2%) |
| Bachelor's Degree or higher | 42 (73.7%) | 15 (26.3%) |
Occupancy by Age of Householder in Pembroke
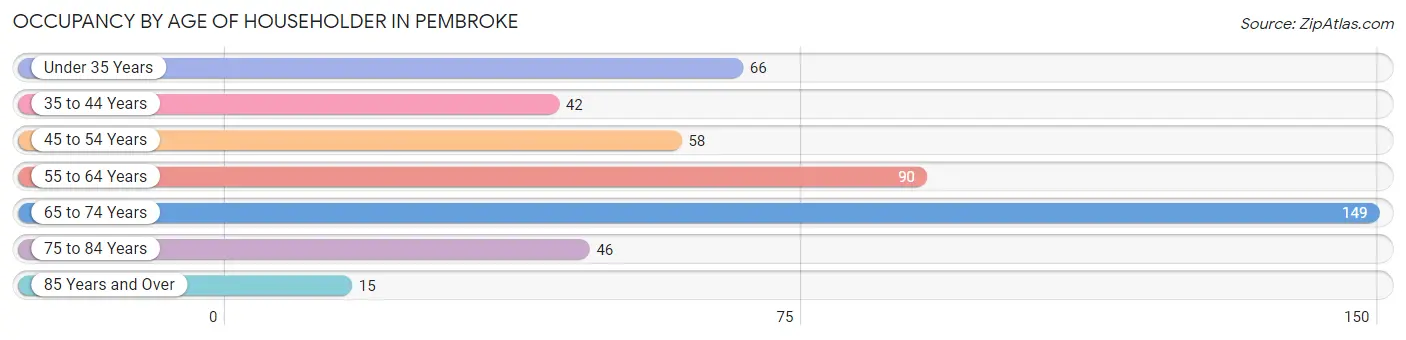
| Age Bracket | # Households | % Households |
| Under 35 Years | 66 | 14.2% |
| 35 to 44 Years | 42 | 9.0% |
| 45 to 54 Years | 58 | 12.4% |
| 55 to 64 Years | 90 | 19.3% |
| 65 to 74 Years | 149 | 32.0% |
| 75 to 84 Years | 46 | 9.9% |
| 85 Years and Over | 15 | 3.2% |
| Total | 466 | 100.0% |
Housing Finances in Pembroke
Median Income by Occupancy in Pembroke
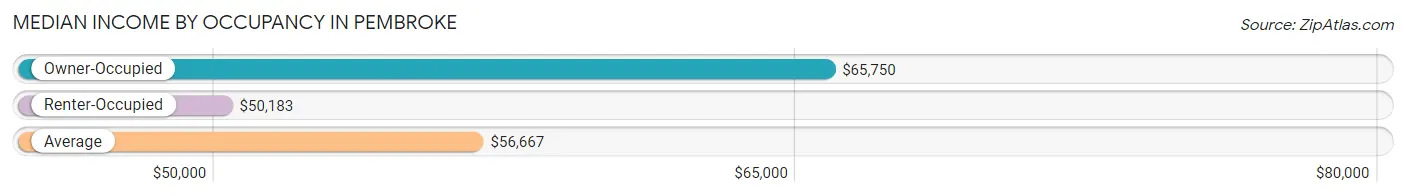
| Occupancy Type | # Households | Median Income |
| Owner-Occupied | 296 (63.5%) | $65,750 |
| Renter-Occupied | 170 (36.5%) | $50,183 |
| Average | 466 (100.0%) | $56,667 |
Occupancy by Householder Income Bracket in Pembroke
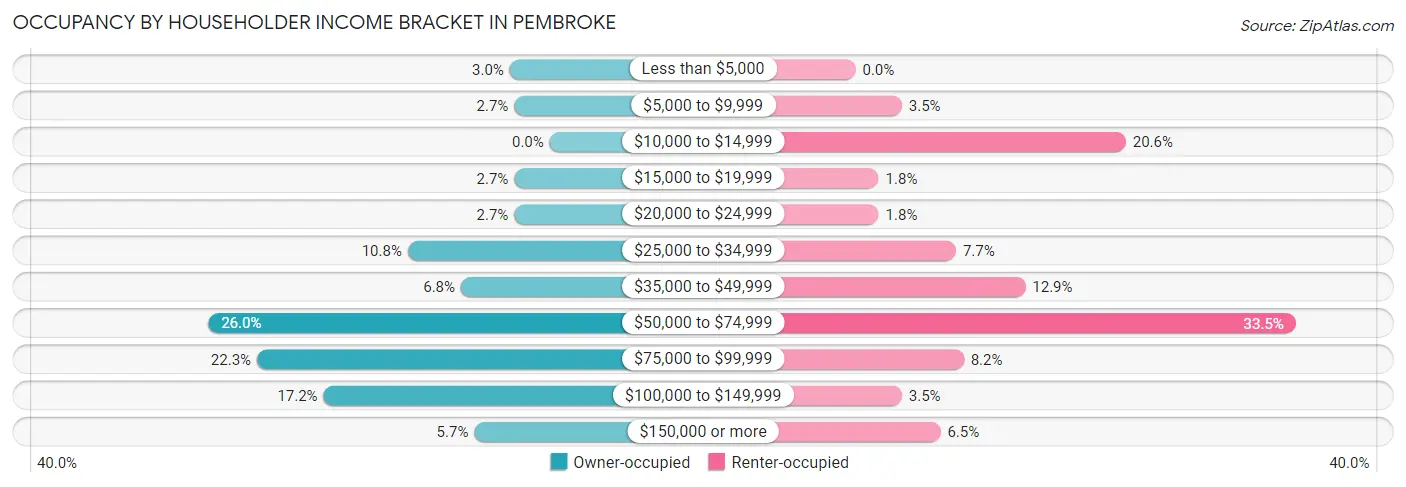
| Income Bracket | Owner-occupied | Renter-occupied |
| Less than $5,000 | 9 (3.0%) | 0 (0.0%) |
| $5,000 to $9,999 | 8 (2.7%) | 6 (3.5%) |
| $10,000 to $14,999 | 0 (0.0%) | 35 (20.6%) |
| $15,000 to $19,999 | 8 (2.7%) | 3 (1.8%) |
| $20,000 to $24,999 | 8 (2.7%) | 3 (1.8%) |
| $25,000 to $34,999 | 32 (10.8%) | 13 (7.6%) |
| $35,000 to $49,999 | 20 (6.8%) | 22 (12.9%) |
| $50,000 to $74,999 | 77 (26.0%) | 57 (33.5%) |
| $75,000 to $99,999 | 66 (22.3%) | 14 (8.2%) |
| $100,000 to $149,999 | 51 (17.2%) | 6 (3.5%) |
| $150,000 or more | 17 (5.7%) | 11 (6.5%) |
| Total | 296 (100.0%) | 170 (100.0%) |
Monthly Housing Cost Tiers in Pembroke
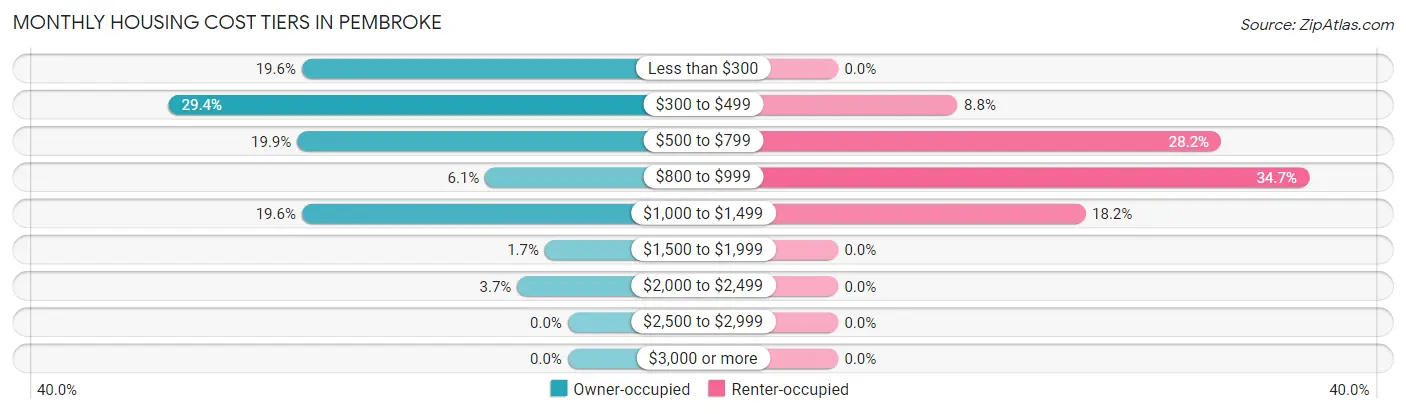
| Monthly Cost | Owner-occupied | Renter-occupied |
| Less than $300 | 58 (19.6%) | 0 (0.0%) |
| $300 to $499 | 87 (29.4%) | 15 (8.8%) |
| $500 to $799 | 59 (19.9%) | 48 (28.2%) |
| $800 to $999 | 18 (6.1%) | 59 (34.7%) |
| $1,000 to $1,499 | 58 (19.6%) | 31 (18.2%) |
| $1,500 to $1,999 | 5 (1.7%) | 0 (0.0%) |
| $2,000 to $2,499 | 11 (3.7%) | 0 (0.0%) |
| $2,500 to $2,999 | 0 (0.0%) | 0 (0.0%) |
| $3,000 or more | 0 (0.0%) | 0 (0.0%) |
| Total | 296 (100.0%) | 170 (100.0%) |
Physical Housing Characteristics in Pembroke
Housing Structures in Pembroke
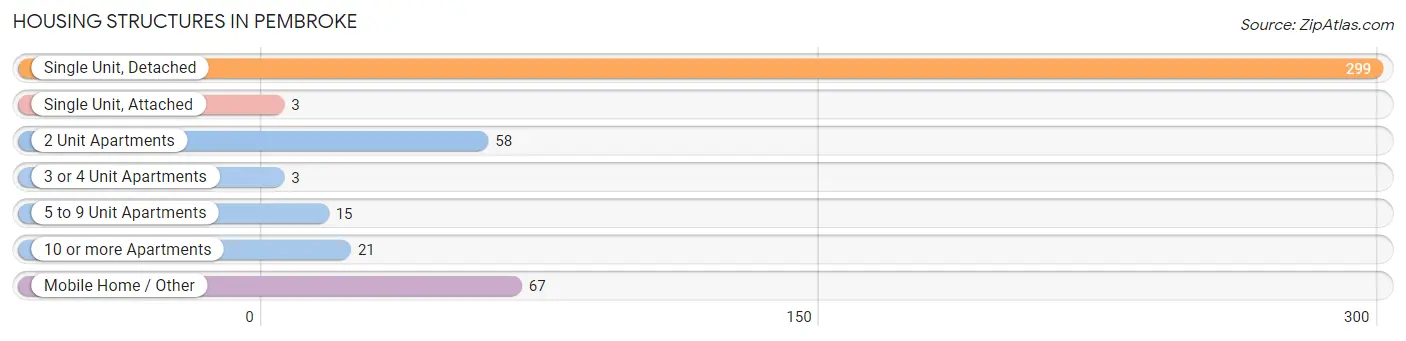
| Structure Type | # Housing Units | % Housing Units |
| Single Unit, Detached | 299 | 64.2% |
| Single Unit, Attached | 3 | 0.6% |
| 2 Unit Apartments | 58 | 12.4% |
| 3 or 4 Unit Apartments | 3 | 0.6% |
| 5 to 9 Unit Apartments | 15 | 3.2% |
| 10 or more Apartments | 21 | 4.5% |
| Mobile Home / Other | 67 | 14.4% |
| Total | 466 | 100.0% |
Housing Structures by Occupancy in Pembroke
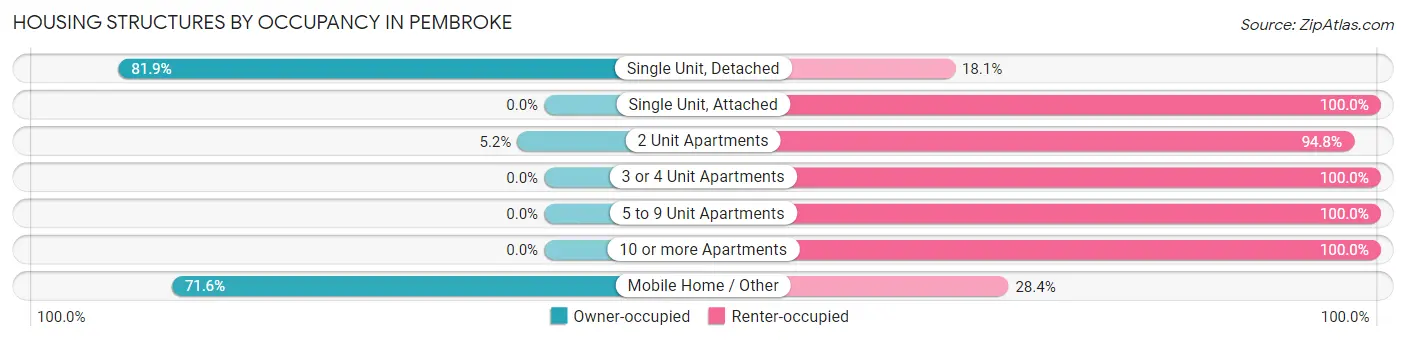
| Structure Type | Owner-occupied | Renter-occupied |
| Single Unit, Detached | 245 (81.9%) | 54 (18.1%) |
| Single Unit, Attached | 0 (0.0%) | 3 (100.0%) |
| 2 Unit Apartments | 3 (5.2%) | 55 (94.8%) |
| 3 or 4 Unit Apartments | 0 (0.0%) | 3 (100.0%) |
| 5 to 9 Unit Apartments | 0 (0.0%) | 15 (100.0%) |
| 10 or more Apartments | 0 (0.0%) | 21 (100.0%) |
| Mobile Home / Other | 48 (71.6%) | 19 (28.4%) |
| Total | 296 (63.5%) | 170 (36.5%) |
Housing Structures by Number of Rooms in Pembroke
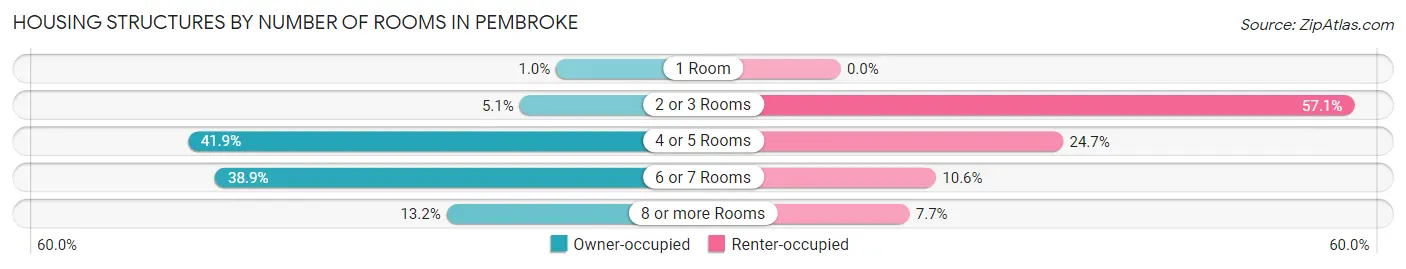
| Number of Rooms | Owner-occupied | Renter-occupied |
| 1 Room | 3 (1.0%) | 0 (0.0%) |
| 2 or 3 Rooms | 15 (5.1%) | 97 (57.1%) |
| 4 or 5 Rooms | 124 (41.9%) | 42 (24.7%) |
| 6 or 7 Rooms | 115 (38.9%) | 18 (10.6%) |
| 8 or more Rooms | 39 (13.2%) | 13 (7.6%) |
| Total | 296 (100.0%) | 170 (100.0%) |
Housing Structure by Heating Type in Pembroke
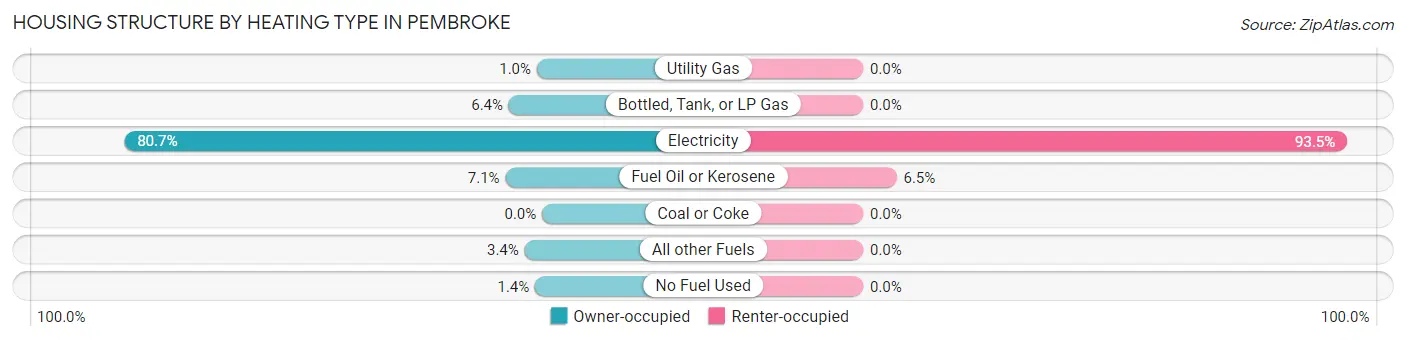
| Heating Type | Owner-occupied | Renter-occupied |
| Utility Gas | 3 (1.0%) | 0 (0.0%) |
| Bottled, Tank, or LP Gas | 19 (6.4%) | 0 (0.0%) |
| Electricity | 239 (80.7%) | 159 (93.5%) |
| Fuel Oil or Kerosene | 21 (7.1%) | 11 (6.5%) |
| Coal or Coke | 0 (0.0%) | 0 (0.0%) |
| All other Fuels | 10 (3.4%) | 0 (0.0%) |
| No Fuel Used | 4 (1.3%) | 0 (0.0%) |
| Total | 296 (100.0%) | 170 (100.0%) |
Household Vehicle Usage in Pembroke
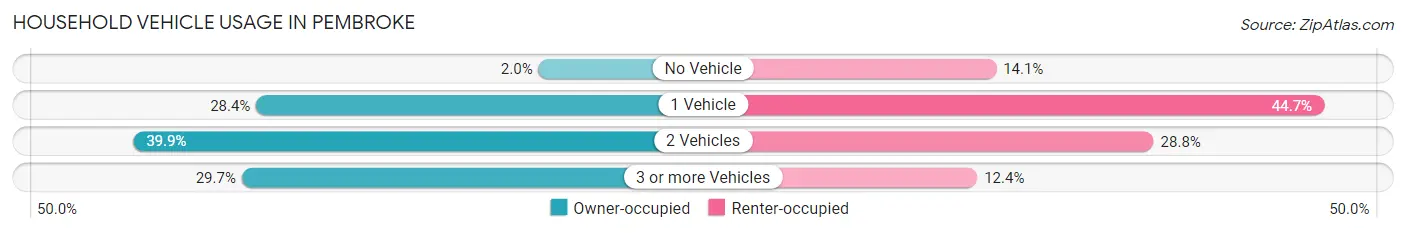
| Vehicles per Household | Owner-occupied | Renter-occupied |
| No Vehicle | 6 (2.0%) | 24 (14.1%) |
| 1 Vehicle | 84 (28.4%) | 76 (44.7%) |
| 2 Vehicles | 118 (39.9%) | 49 (28.8%) |
| 3 or more Vehicles | 88 (29.7%) | 21 (12.3%) |
| Total | 296 (100.0%) | 170 (100.0%) |
Real Estate & Mortgages in Pembroke
Real Estate and Mortgage Overview in Pembroke
| Characteristic | Without Mortgage | With Mortgage |
| Housing Units | 176 | 120 |
| Median Property Value | $113,200 | $136,000 |
| Median Household Income | $65,250 | $15 |
| Monthly Housing Costs | $385 | $0 |
| Real Estate Taxes | $913 | $0 |
Property Value by Mortgage Status in Pembroke
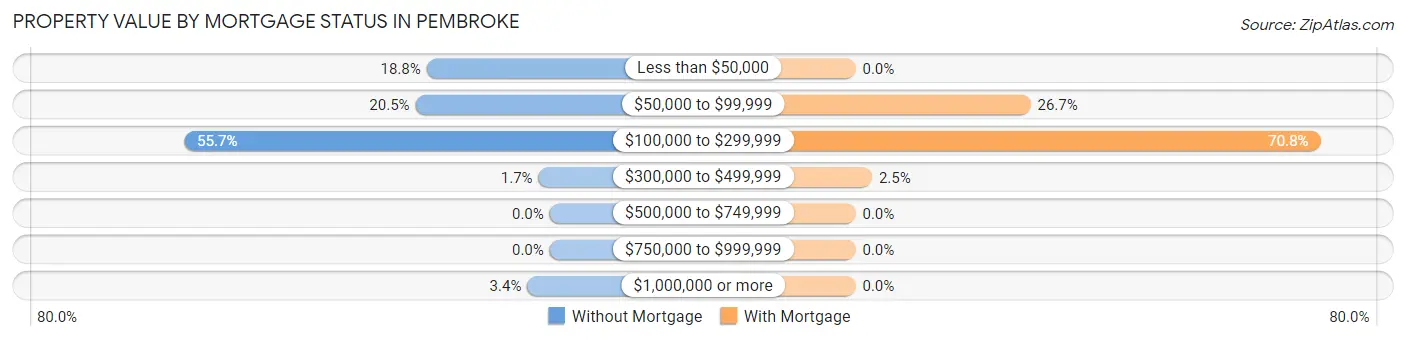
| Property Value | Without Mortgage | With Mortgage |
| Less than $50,000 | 33 (18.8%) | 0 (0.0%) |
| $50,000 to $99,999 | 36 (20.4%) | 32 (26.7%) |
| $100,000 to $299,999 | 98 (55.7%) | 85 (70.8%) |
| $300,000 to $499,999 | 3 (1.7%) | 3 (2.5%) |
| $500,000 to $749,999 | 0 (0.0%) | 0 (0.0%) |
| $750,000 to $999,999 | 0 (0.0%) | 0 (0.0%) |
| $1,000,000 or more | 6 (3.4%) | 0 (0.0%) |
| Total | 176 (100.0%) | 120 (100.0%) |
Household Income by Mortgage Status in Pembroke
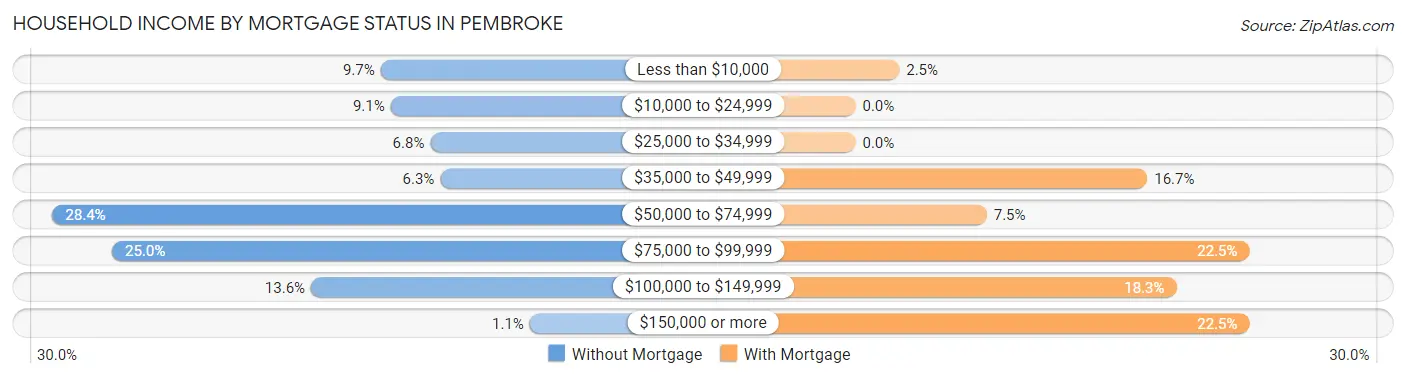
| Household Income | Without Mortgage | With Mortgage |
| Less than $10,000 | 17 (9.7%) | 3 (2.5%) |
| $10,000 to $24,999 | 16 (9.1%) | 0 (0.0%) |
| $25,000 to $34,999 | 12 (6.8%) | 0 (0.0%) |
| $35,000 to $49,999 | 11 (6.2%) | 20 (16.7%) |
| $50,000 to $74,999 | 50 (28.4%) | 9 (7.5%) |
| $75,000 to $99,999 | 44 (25.0%) | 27 (22.5%) |
| $100,000 to $149,999 | 24 (13.6%) | 22 (18.3%) |
| $150,000 or more | 2 (1.1%) | 27 (22.5%) |
| Total | 176 (100.0%) | 120 (100.0%) |
Property Value to Household Income Ratio in Pembroke
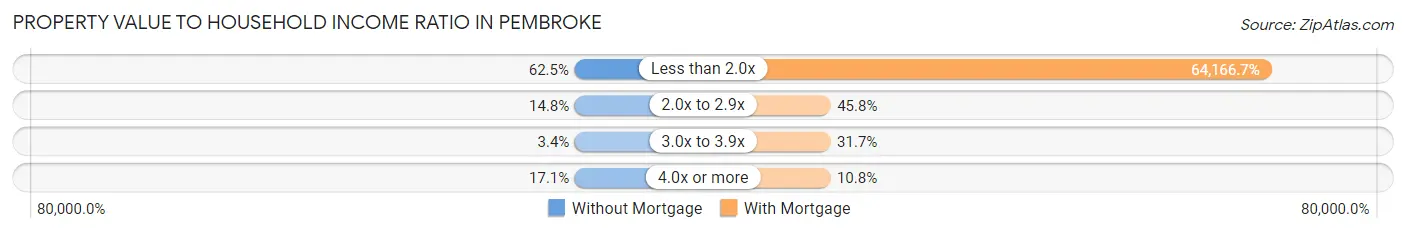
| Value-to-Income Ratio | Without Mortgage | With Mortgage |
| Less than 2.0x | 110 (62.5%) | 77,000 (64,166.7%) |
| 2.0x to 2.9x | 26 (14.8%) | 55 (45.8%) |
| 3.0x to 3.9x | 6 (3.4%) | 38 (31.7%) |
| 4.0x or more | 30 (17.1%) | 13 (10.8%) |
| Total | 176 (100.0%) | 120 (100.0%) |
Real Estate Taxes by Mortgage Status in Pembroke
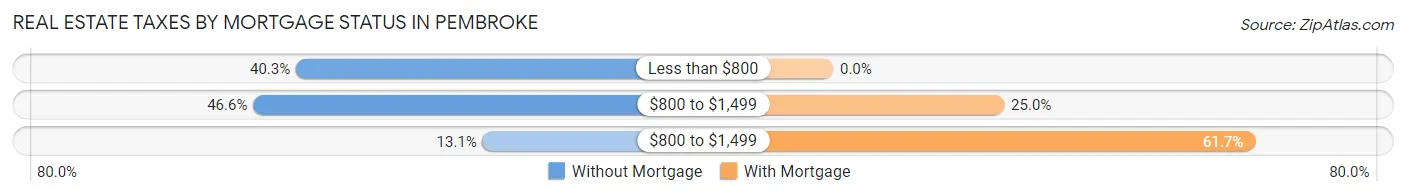
| Property Taxes | Without Mortgage | With Mortgage |
| Less than $800 | 71 (40.3%) | 0 (0.0%) |
| $800 to $1,499 | 82 (46.6%) | 30 (25.0%) |
| $800 to $1,499 | 23 (13.1%) | 74 (61.7%) |
| Total | 176 (100.0%) | 120 (100.0%) |
Health & Disability in Pembroke
Health Insurance Coverage by Age in Pembroke
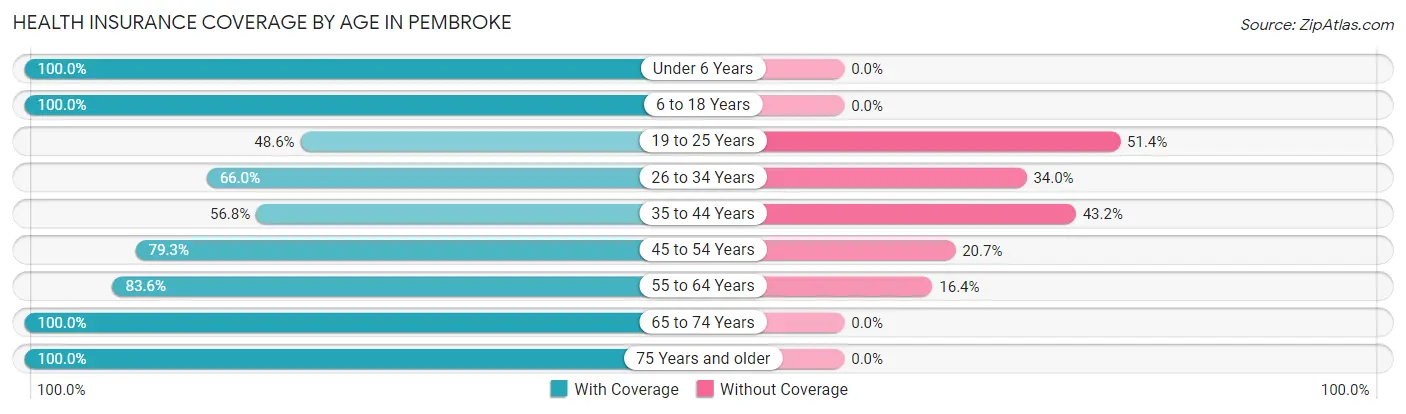
| Age Bracket | With Coverage | Without Coverage |
| Under 6 Years | 71 (100.0%) | 0 (0.0%) |
| 6 to 18 Years | 97 (100.0%) | 0 (0.0%) |
| 19 to 25 Years | 34 (48.6%) | 36 (51.4%) |
| 26 to 34 Years | 103 (66.0%) | 53 (34.0%) |
| 35 to 44 Years | 54 (56.8%) | 41 (43.2%) |
| 45 to 54 Years | 92 (79.3%) | 24 (20.7%) |
| 55 to 64 Years | 112 (83.6%) | 22 (16.4%) |
| 65 to 74 Years | 186 (100.0%) | 0 (0.0%) |
| 75 Years and older | 80 (100.0%) | 0 (0.0%) |
| Total | 829 (82.5%) | 176 (17.5%) |
Health Insurance Coverage by Citizenship Status in Pembroke
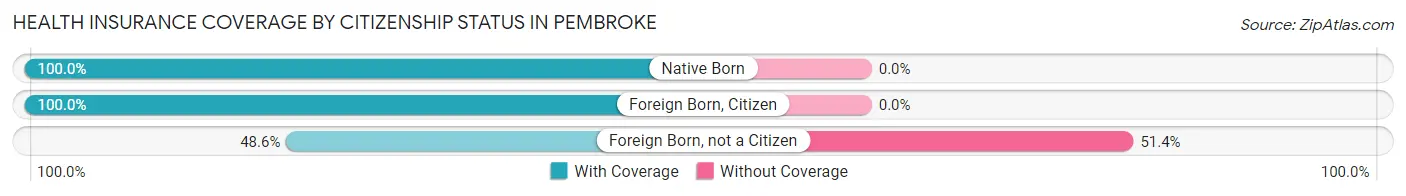
| Citizenship Status | With Coverage | Without Coverage |
| Native Born | 71 (100.0%) | 0 (0.0%) |
| Foreign Born, Citizen | 97 (100.0%) | 0 (0.0%) |
| Foreign Born, not a Citizen | 34 (48.6%) | 36 (51.4%) |
Health Insurance Coverage by Household Income in Pembroke
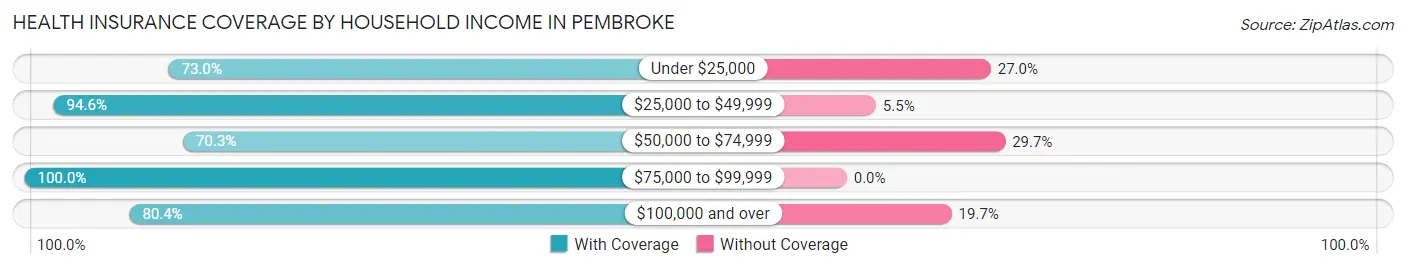
| Household Income | With Coverage | Without Coverage |
| Under $25,000 | 92 (73.0%) | 34 (27.0%) |
| $25,000 to $49,999 | 156 (94.6%) | 9 (5.4%) |
| $50,000 to $74,999 | 154 (70.3%) | 65 (29.7%) |
| $75,000 to $99,999 | 149 (100.0%) | 0 (0.0%) |
| $100,000 and over | 278 (80.3%) | 68 (19.7%) |
Public vs Private Health Insurance Coverage by Age in Pembroke
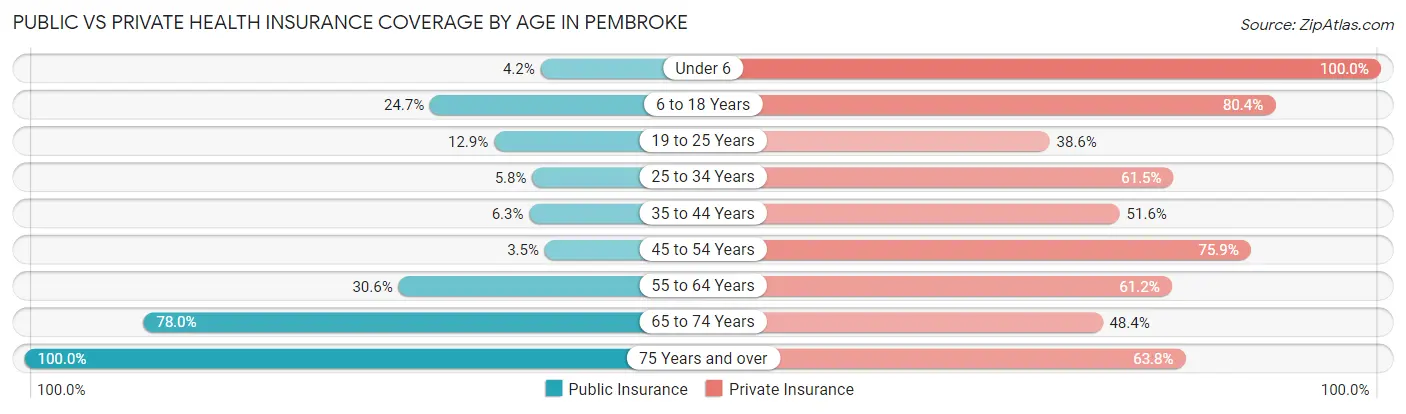
| Age Bracket | Public Insurance | Private Insurance |
| Under 6 | 3 (4.2%) | 71 (100.0%) |
| 6 to 18 Years | 24 (24.7%) | 78 (80.4%) |
| 19 to 25 Years | 9 (12.9%) | 27 (38.6%) |
| 25 to 34 Years | 9 (5.8%) | 96 (61.5%) |
| 35 to 44 Years | 6 (6.3%) | 49 (51.6%) |
| 45 to 54 Years | 4 (3.5%) | 88 (75.9%) |
| 55 to 64 Years | 41 (30.6%) | 82 (61.2%) |
| 65 to 74 Years | 145 (78.0%) | 90 (48.4%) |
| 75 Years and over | 80 (100.0%) | 51 (63.7%) |
| Total | 321 (31.9%) | 632 (62.9%) |
Disability Status by Sex by Age in Pembroke
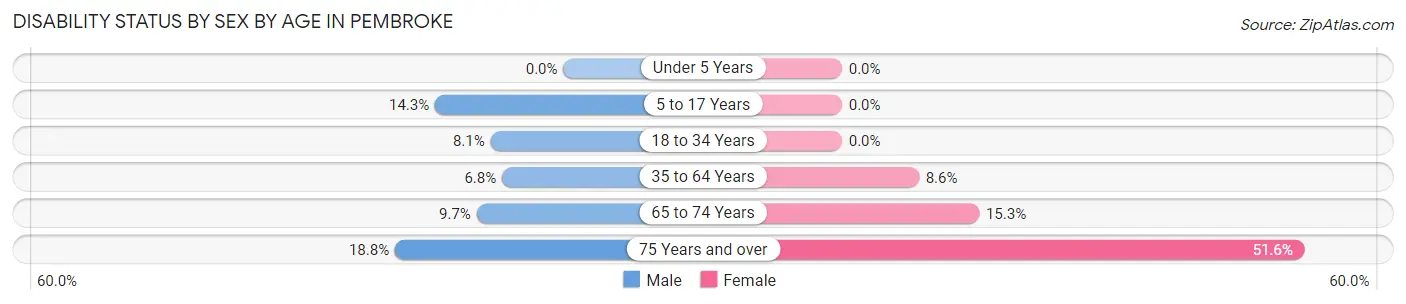
| Age Bracket | Male | Female |
| Under 5 Years | 0 (0.0%) | 0 (0.0%) |
| 5 to 17 Years | 5 (14.3%) | 0 (0.0%) |
| 18 to 34 Years | 15 (8.1%) | 0 (0.0%) |
| 35 to 64 Years | 14 (6.8%) | 12 (8.6%) |
| 65 to 74 Years | 11 (9.7%) | 11 (15.3%) |
| 75 Years and over | 3 (18.8%) | 33 (51.6%) |
Disability Class by Sex by Age in Pembroke
Disability Class: Hearing Difficulty
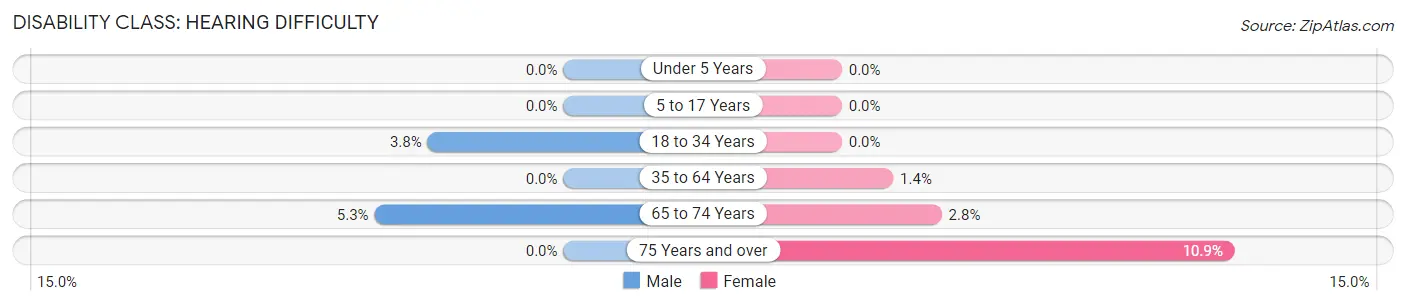
| Age Bracket | Male | Female |
| Under 5 Years | 0 (0.0%) | 0 (0.0%) |
| 5 to 17 Years | 0 (0.0%) | 0 (0.0%) |
| 18 to 34 Years | 7 (3.8%) | 0 (0.0%) |
| 35 to 64 Years | 0 (0.0%) | 2 (1.4%) |
| 65 to 74 Years | 6 (5.3%) | 2 (2.8%) |
| 75 Years and over | 0 (0.0%) | 7 (10.9%) |
Disability Class: Vision Difficulty
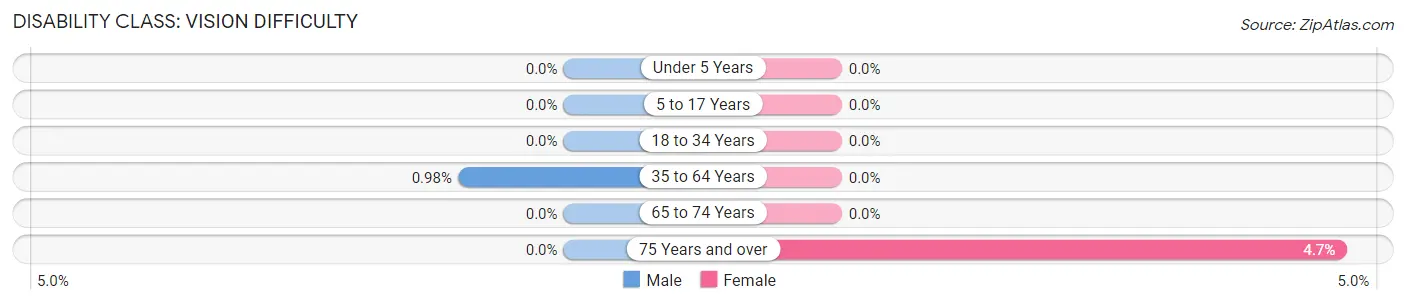
| Age Bracket | Male | Female |
| Under 5 Years | 0 (0.0%) | 0 (0.0%) |
| 5 to 17 Years | 0 (0.0%) | 0 (0.0%) |
| 18 to 34 Years | 0 (0.0%) | 0 (0.0%) |
| 35 to 64 Years | 2 (1.0%) | 0 (0.0%) |
| 65 to 74 Years | 0 (0.0%) | 0 (0.0%) |
| 75 Years and over | 0 (0.0%) | 3 (4.7%) |
Disability Class: Cognitive Difficulty
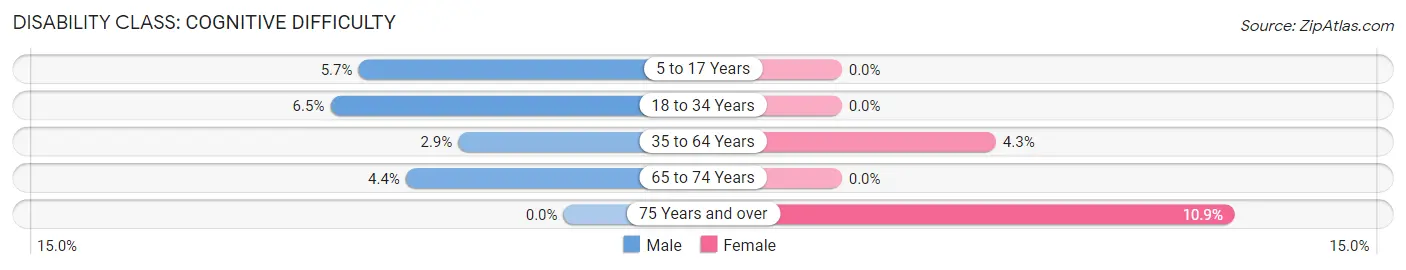
| Age Bracket | Male | Female |
| 5 to 17 Years | 2 (5.7%) | 0 (0.0%) |
| 18 to 34 Years | 12 (6.5%) | 0 (0.0%) |
| 35 to 64 Years | 6 (2.9%) | 6 (4.3%) |
| 65 to 74 Years | 5 (4.4%) | 0 (0.0%) |
| 75 Years and over | 0 (0.0%) | 7 (10.9%) |
Disability Class: Ambulatory Difficulty
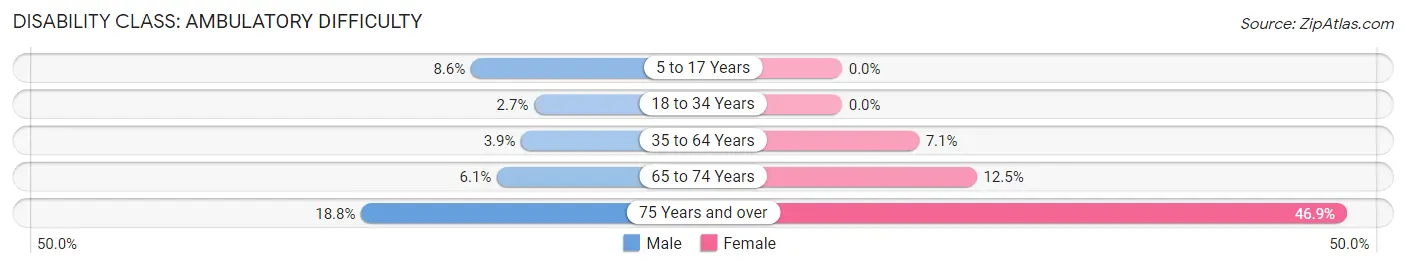
| Age Bracket | Male | Female |
| 5 to 17 Years | 3 (8.6%) | 0 (0.0%) |
| 18 to 34 Years | 5 (2.7%) | 0 (0.0%) |
| 35 to 64 Years | 8 (3.9%) | 10 (7.1%) |
| 65 to 74 Years | 7 (6.1%) | 9 (12.5%) |
| 75 Years and over | 3 (18.8%) | 30 (46.9%) |
Disability Class: Self-Care Difficulty
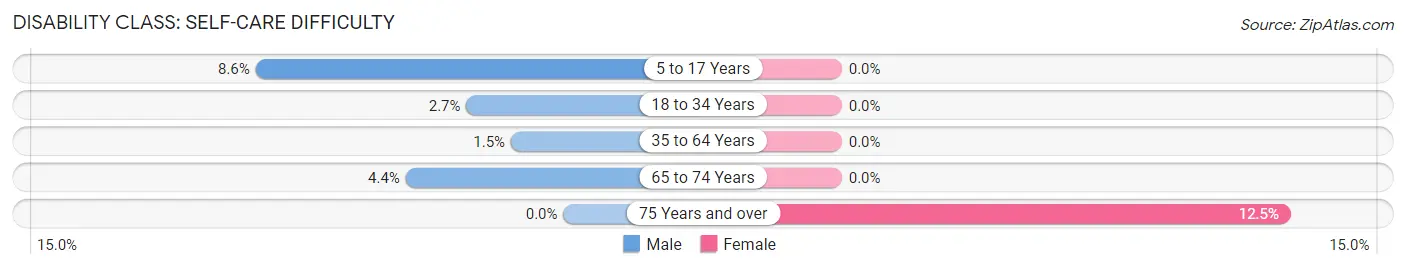
| Age Bracket | Male | Female |
| 5 to 17 Years | 3 (8.6%) | 0 (0.0%) |
| 18 to 34 Years | 5 (2.7%) | 0 (0.0%) |
| 35 to 64 Years | 3 (1.5%) | 0 (0.0%) |
| 65 to 74 Years | 5 (4.4%) | 0 (0.0%) |
| 75 Years and over | 0 (0.0%) | 8 (12.5%) |
Technology Access in Pembroke
Computing Device Access in Pembroke
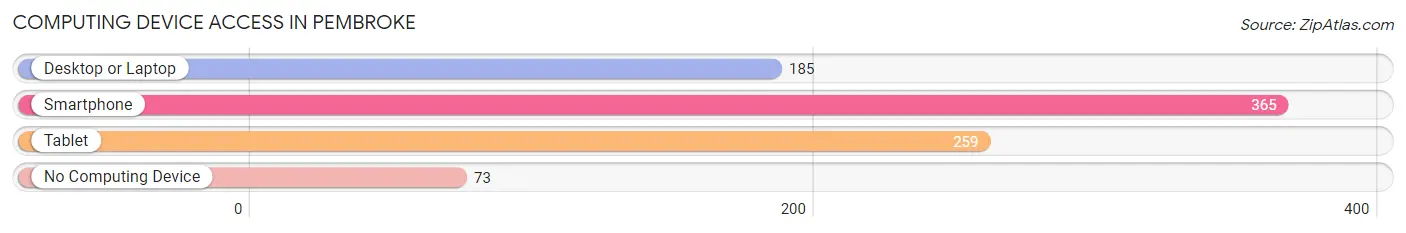
| Device Type | # Households | % Households |
| Desktop or Laptop | 185 | 39.7% |
| Smartphone | 365 | 78.3% |
| Tablet | 259 | 55.6% |
| No Computing Device | 73 | 15.7% |
| Total | 466 | 100.0% |
Internet Access in Pembroke
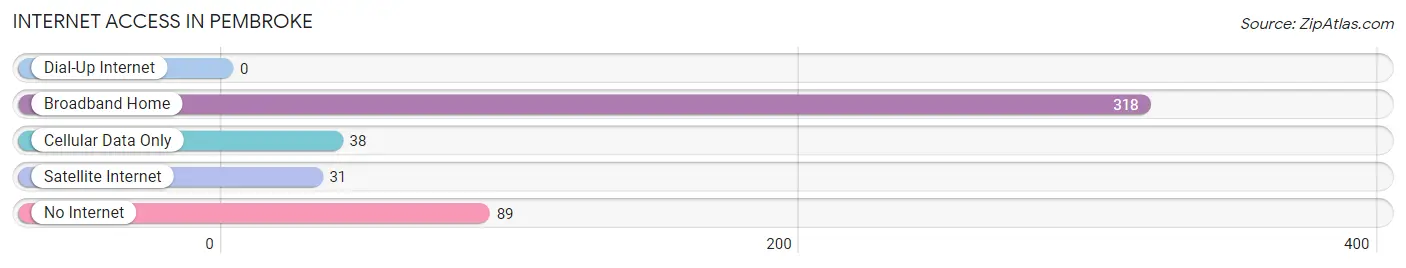
| Internet Type | # Households | % Households |
| Dial-Up Internet | 0 | 0.0% |
| Broadband Home | 318 | 68.2% |
| Cellular Data Only | 38 | 8.2% |
| Satellite Internet | 31 | 6.7% |
| No Internet | 89 | 19.1% |
| Total | 466 | 100.0% |
Pembroke Summary
Pembroke is a small town located in Giles County, Virginia, United States. It is situated in the Appalachian Mountains, and is part of the Blacksburg-Christiansburg-Radford Metropolitan Statistical Area. The town has a population of approximately 1,000 people, and is known for its rural charm and small-town atmosphere.
History
Pembroke was first settled in the late 1700s by a group of settlers from North Carolina. The town was originally known as “Pembroke Station”, and was named after the nearby Pembroke Creek. The town was officially incorporated in 1891, and was named after the creek.
The town was an important stop on the Virginia and Tennessee Railroad, which ran from Bristol, Virginia to Chattanooga, Tennessee. The railroad was an important factor in the growth of the town, and it was also the site of a major Civil War battle in 1864.
Geography
Pembroke is located in the Appalachian Mountains, and is situated in the New River Valley. The town is located at an elevation of 1,890 feet, and is surrounded by the Jefferson National Forest. The town is located near the New River, which is a major tributary of the Kanawha River.
The town is located approximately 25 miles from the city of Blacksburg, and is also close to the cities of Radford and Christiansburg. The town is also located near the Blue Ridge Parkway, which is a scenic highway that runs through the Appalachian Mountains.
Economy
The economy of Pembroke is largely based on agriculture and tourism. The town is home to several farms, and the surrounding area is known for its production of apples, peaches, and other fruits and vegetables. The town is also home to several small businesses, including restaurants, shops, and other services.
The town is also a popular tourist destination, and is known for its rural charm and small-town atmosphere. The town is home to several historic sites, including the Pembroke Historic District, which is listed on the National Register of Historic Places.
Demographics
As of the 2010 census, the population of Pembroke was 1,000 people. The racial makeup of the town was 95.2% White, 1.7% African American, 0.2% Native American, 0.2% Asian, 0.1% Pacific Islander, and 2.8% from other races. The median household income was $37,500, and the median family income was $41,250.
The town is served by the Giles County Public Schools system, and is home to several churches, including the Pembroke United Methodist Church, the Pembroke Baptist Church, and the Pembroke Presbyterian Church. The town is also home to several parks, including the Pembroke Town Park and the Pembroke Community Park.
Conclusion
Pembroke is a small town located in Giles County, Virginia, United States. It is situated in the Appalachian Mountains, and is part of the Blacksburg-Christiansburg-Radford Metropolitan Statistical Area. The town has a population of approximately 1,000 people, and is known for its rural charm and small-town atmosphere. The economy of Pembroke is largely based on agriculture and tourism, and the town is home to several farms, businesses, and historic sites. The racial makeup of the town is 95.2% White, 1.7% African American, 0.2% Native American, 0.2% Asian, 0.1% Pacific Islander, and 2.8% from other races. The median household income was $37,500, and the median family income was $41,250. Pembroke is served by the Giles County Public Schools system, and is home to several churches and parks.
Common Questions
What is Per Capita Income in Pembroke?
Per Capita income in Pembroke is $33,142.
What is the Median Family Income in Pembroke?
Median Family Income in Pembroke is $90,313.
What is the Median Household income in Pembroke?
Median Household Income in Pembroke is $56,667.
What is Income or Wage Gap in Pembroke?
Income or Wage Gap in Pembroke is 17.3%.
Women in Pembroke earn 82.7 cents for every dollar earned by a man.
What is Inequality or Gini Index in Pembroke?
Inequality or Gini Index in Pembroke is 0.37.
What is the Total Population of Pembroke?
Total Population of Pembroke is 1,005.
What is the Total Male Population of Pembroke?
Total Male Population of Pembroke is 580.
What is the Total Female Population of Pembroke?
Total Female Population of Pembroke is 425.
What is the Ratio of Males per 100 Females in Pembroke?
There are 136.47 Males per 100 Females in Pembroke.
What is the Ratio of Females per 100 Males in Pembroke?
There are 73.28 Females per 100 Males in Pembroke.
What is the Median Population Age in Pembroke?
Median Population Age in Pembroke is 45.7 Years.
What is the Average Family Size in Pembroke
Average Family Size in Pembroke is 3.1 People.
What is the Average Household Size in Pembroke
Average Household Size in Pembroke is 2.2 People.
How Large is the Labor Force in Pembroke?
There are 560 People in the Labor Forcein in Pembroke.
What is the Percentage of People in the Labor Force in Pembroke?
63.8% of People are in the Labor Force in Pembroke.
What is the Unemployment Rate in Pembroke?
Unemployment Rate in Pembroke is 0.7%.