Abingdon, VA Map & Demographics
Abingdon Map
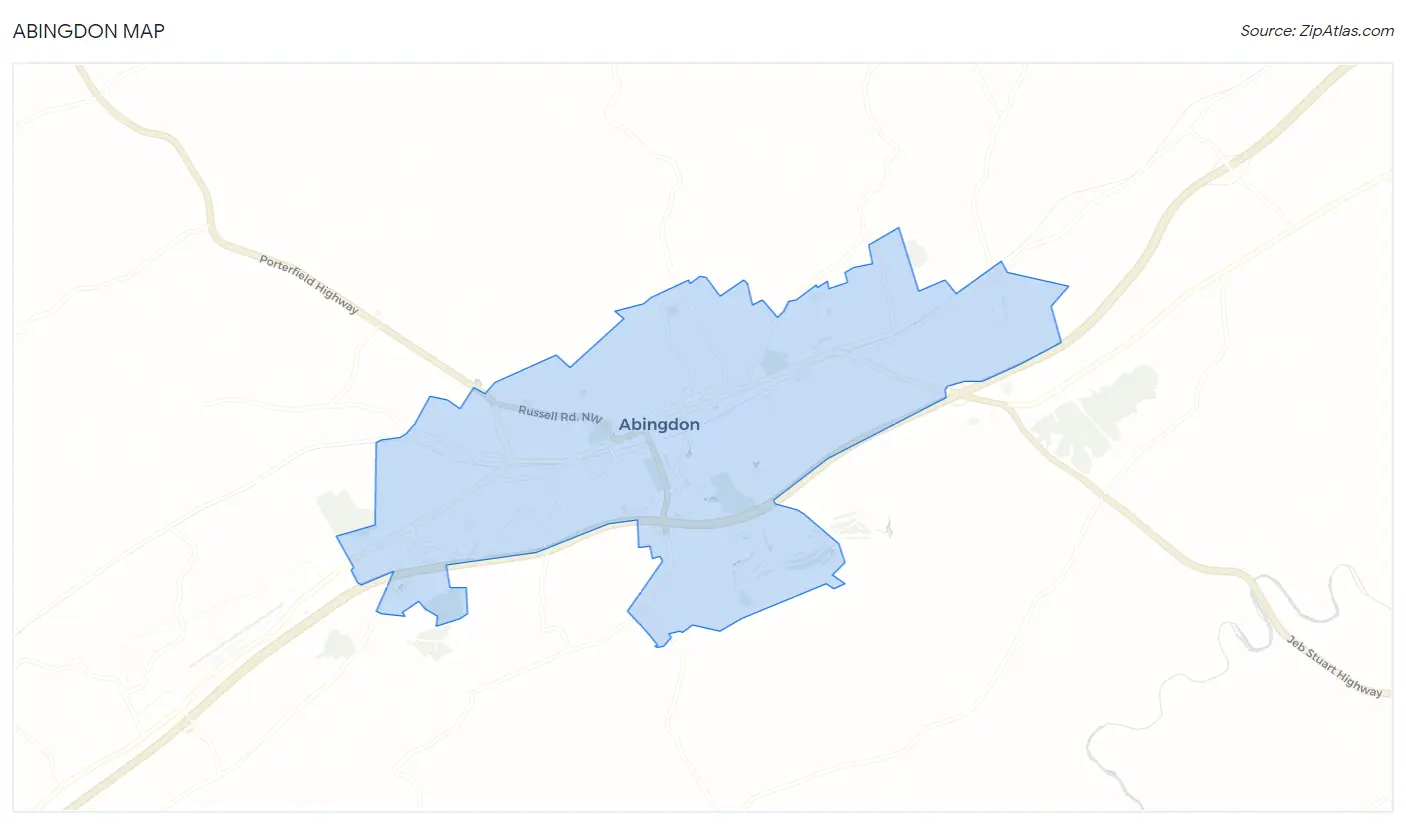
Abingdon Overview
$46,106
PER CAPITA INCOME
$87,992
AVG FAMILY INCOME
$56,164
AVG HOUSEHOLD INCOME
33.6%
WAGE / INCOME GAP [ % ]
66.4¢/ $1
WAGE / INCOME GAP [ $ ]
$9,871
FAMILY INCOME DEFICIT
0.57
INEQUALITY / GINI INDEX
8,346
TOTAL POPULATION
4,140
MALE POPULATION
4,206
FEMALE POPULATION
98.43
MALES / 100 FEMALES
101.59
FEMALES / 100 MALES
46.4
MEDIAN AGE
2.6
AVG FAMILY SIZE
2.0
AVG HOUSEHOLD SIZE
4,305
LABOR FORCE [ PEOPLE ]
58.3%
PERCENT IN LABOR FORCE
4.0%
UNEMPLOYMENT RATE
Abingdon Area Codes
Income in Abingdon
Income Overview in Abingdon
Per Capita Income in Abingdon is $46,106, while median incomes of families and households are $87,992 and $56,164 respectively.
| Characteristic | Number | Measure |
| Per Capita Income | 8,346 | $46,106 |
| Median Family Income | 2,094 | $87,992 |
| Mean Family Income | 2,094 | $141,074 |
| Median Household Income | 4,122 | $56,164 |
| Mean Household Income | 4,122 | $92,551 |
| Income Deficit | 2,094 | $9,871 |
| Wage / Income Gap (%) | 8,346 | 33.56% |
| Wage / Income Gap ($) | 8,346 | 66.44¢ per $1 |
| Gini / Inequality Index | 8,346 | 0.57 |
Earnings by Sex in Abingdon
Average Earnings in Abingdon are $38,002, $47,861 for men and $31,798 for women, a difference of 33.6%.
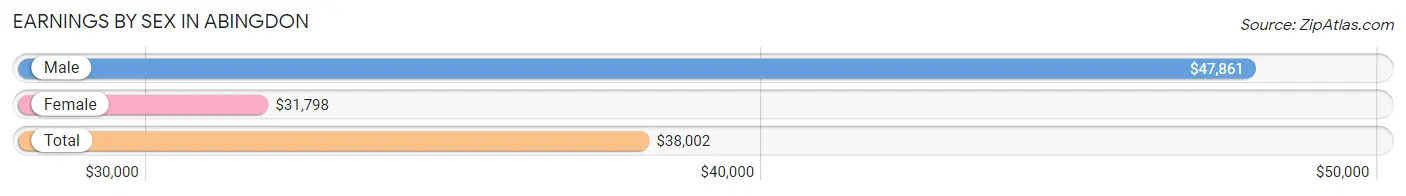
| Sex | Number | Average Earnings |
| Male | 2,151 (48.4%) | $47,861 |
| Female | 2,291 (51.6%) | $31,798 |
| Total | 4,442 (100.0%) | $38,002 |
Earnings by Sex by Income Bracket in Abingdon
The most common earnings brackets in Abingdon are $100,000+ for men (362 | 16.8%) and $30,000 to $34,999 for women (391 | 17.1%).
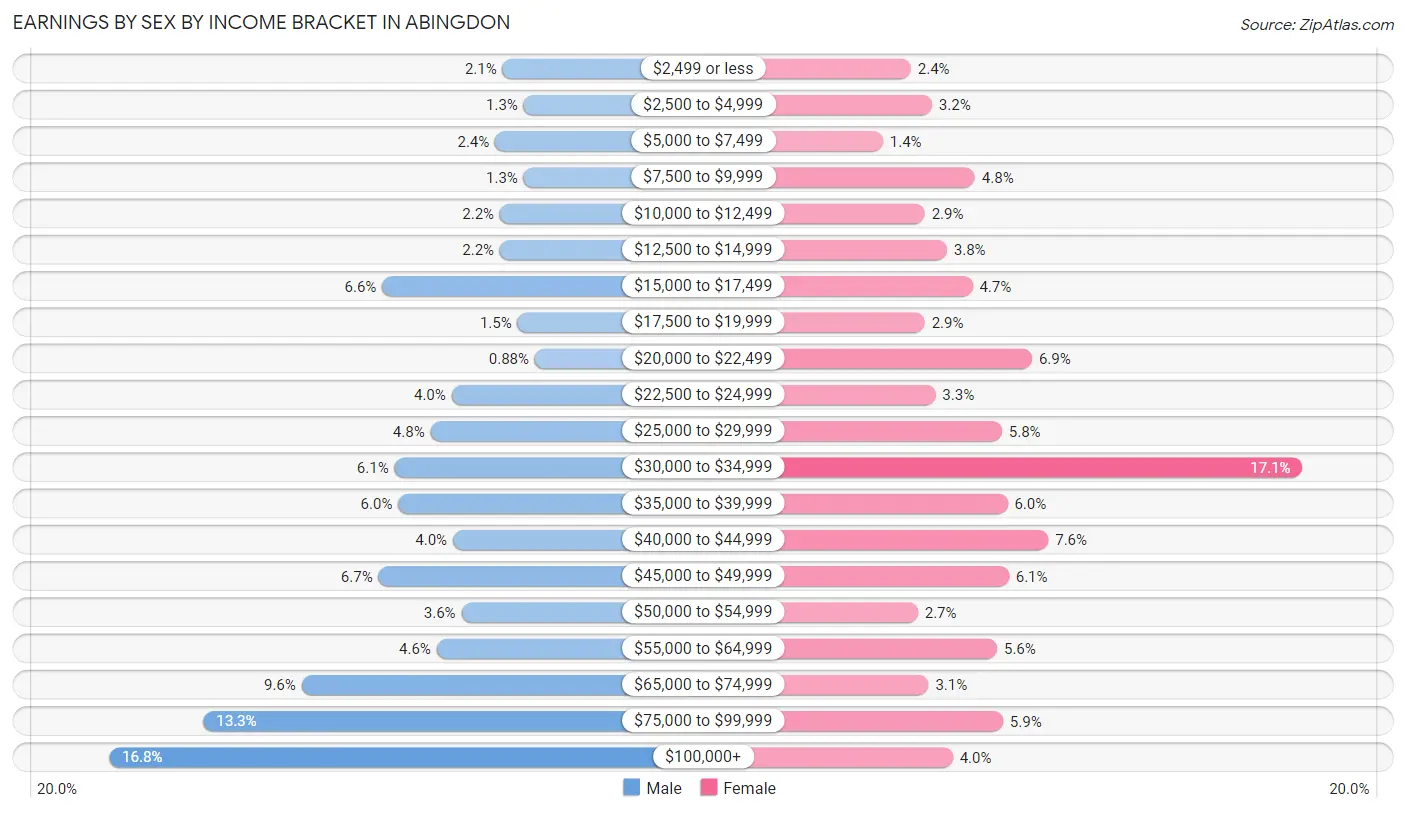
| Income | Male | Female |
| $2,499 or less | 45 (2.1%) | 55 (2.4%) |
| $2,500 to $4,999 | 28 (1.3%) | 73 (3.2%) |
| $5,000 to $7,499 | 51 (2.4%) | 31 (1.3%) |
| $7,500 to $9,999 | 28 (1.3%) | 110 (4.8%) |
| $10,000 to $12,499 | 47 (2.2%) | 67 (2.9%) |
| $12,500 to $14,999 | 47 (2.2%) | 86 (3.7%) |
| $15,000 to $17,499 | 142 (6.6%) | 108 (4.7%) |
| $17,500 to $19,999 | 33 (1.5%) | 67 (2.9%) |
| $20,000 to $22,499 | 19 (0.9%) | 159 (6.9%) |
| $22,500 to $24,999 | 86 (4.0%) | 76 (3.3%) |
| $25,000 to $29,999 | 103 (4.8%) | 133 (5.8%) |
| $30,000 to $34,999 | 132 (6.1%) | 391 (17.1%) |
| $35,000 to $39,999 | 129 (6.0%) | 138 (6.0%) |
| $40,000 to $44,999 | 85 (4.0%) | 173 (7.5%) |
| $45,000 to $49,999 | 145 (6.7%) | 139 (6.1%) |
| $50,000 to $54,999 | 78 (3.6%) | 61 (2.7%) |
| $55,000 to $64,999 | 98 (4.6%) | 129 (5.6%) |
| $65,000 to $74,999 | 207 (9.6%) | 70 (3.1%) |
| $75,000 to $99,999 | 286 (13.3%) | 134 (5.9%) |
| $100,000+ | 362 (16.8%) | 91 (4.0%) |
| Total | 2,151 (100.0%) | 2,291 (100.0%) |
Earnings by Sex by Educational Attainment in Abingdon
Average earnings in Abingdon are $50,804 for men and $33,357 for women, a difference of 34.3%. Men with an educational attainment of bachelor's degree enjoy the highest average annual earnings of $86,694, while those with high school diploma education earn the least with $34,795. Women with an educational attainment of bachelor's degree earn the most with the average annual earnings of $46,058, while those with high school diploma education have the smallest earnings of $28,350.
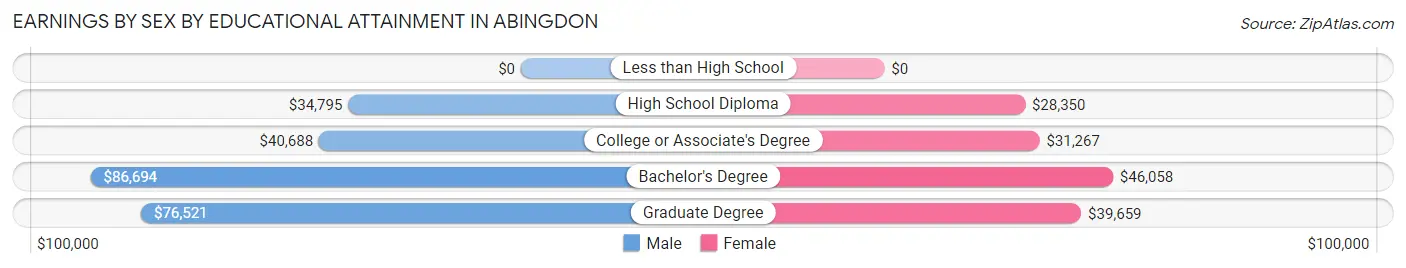
| Educational Attainment | Male Income | Female Income |
| Less than High School | - | - |
| High School Diploma | $34,795 | $28,350 |
| College or Associate's Degree | $40,688 | $31,267 |
| Bachelor's Degree | $86,694 | $46,058 |
| Graduate Degree | $76,521 | $39,659 |
| Total | $50,804 | $33,357 |
Family Income in Abingdon
Family Income Brackets in Abingdon
According to the Abingdon family income data, there are 536 families falling into the $100,000 to $149,999 income range, which is the most common income bracket and makes up 25.6% of all families. Conversely, the less than $10,000 income bracket is the least frequent group with only 46 families (2.2%) belonging to this category.
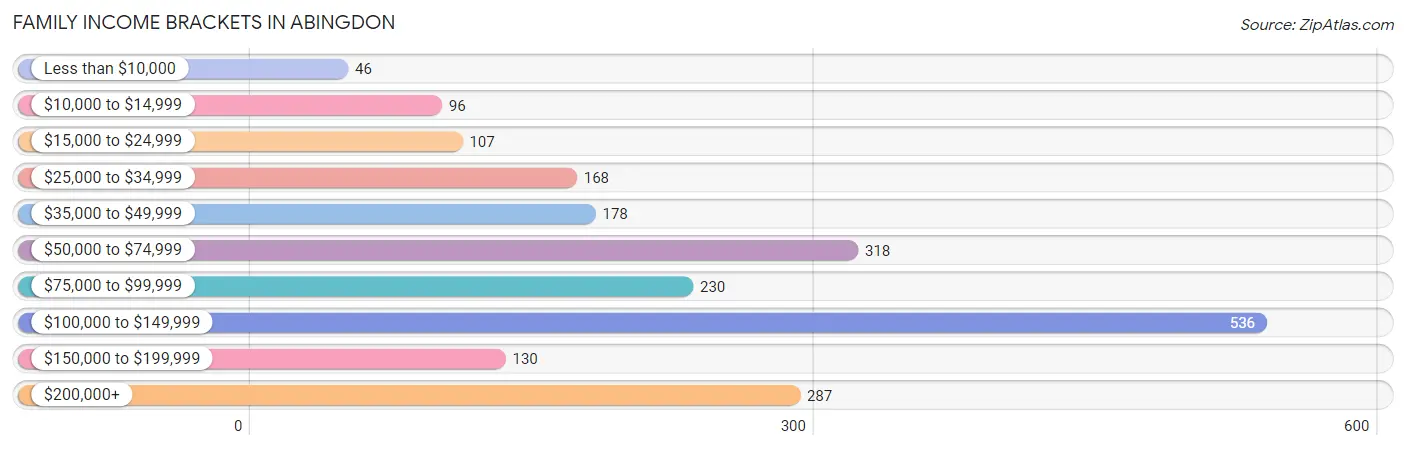
| Income Bracket | # Families | % Families |
| Less than $10,000 | 46 | 2.2% |
| $10,000 to $14,999 | 96 | 4.6% |
| $15,000 to $24,999 | 107 | 5.1% |
| $25,000 to $34,999 | 168 | 8.0% |
| $35,000 to $49,999 | 178 | 8.5% |
| $50,000 to $74,999 | 318 | 15.2% |
| $75,000 to $99,999 | 230 | 11.0% |
| $100,000 to $149,999 | 536 | 25.6% |
| $150,000 to $199,999 | 130 | 6.2% |
| $200,000+ | 287 | 13.7% |
Family Income by Famaliy Size in Abingdon
5-person families (95 | 4.5%) account for the highest median family income in Abingdon with $145,771 per family, while 3-person families (389 | 18.6%) have the highest median income of $41,854 per family member.
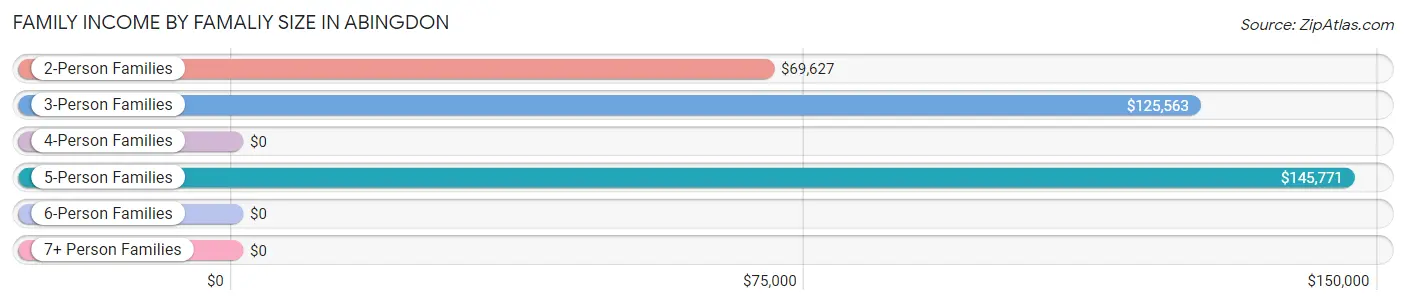
| Income Bracket | # Families | Median Income |
| 2-Person Families | 1,237 (59.1%) | $69,627 |
| 3-Person Families | 389 (18.6%) | $125,563 |
| 4-Person Families | 355 (17.0%) | $0 |
| 5-Person Families | 95 (4.5%) | $145,771 |
| 6-Person Families | 18 (0.9%) | $0 |
| 7+ Person Families | 0 (0.0%) | $0 |
| Total | 2,094 (100.0%) | $87,992 |
Family Income by Number of Earners in Abingdon
The median family income in Abingdon is $87,992, with families comprising 3+ earners (124) having the highest median family income of $250,001, while families with no earners (373) have the lowest median family income of $43,594, accounting for 5.9% and 17.8% of families, respectively.
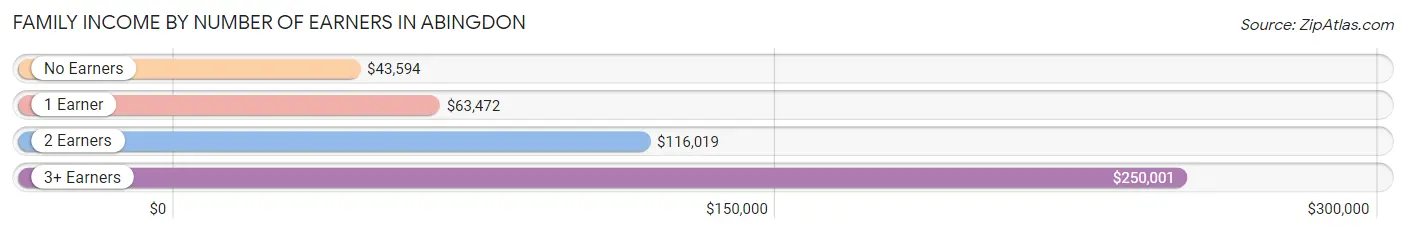
| Number of Earners | # Families | Median Income |
| No Earners | 373 (17.8%) | $43,594 |
| 1 Earner | 691 (33.0%) | $63,472 |
| 2 Earners | 906 (43.3%) | $116,019 |
| 3+ Earners | 124 (5.9%) | $250,001 |
| Total | 2,094 (100.0%) | $87,992 |
Household Income in Abingdon
Household Income Brackets in Abingdon
With 639 households falling in the category, the $50,000 to $74,999 income range is the most frequent in Abingdon, accounting for 15.5% of all households. In contrast, only 132 households (3.2%) fall into the $150,000 to $199,999 income bracket, making it the least populous group.
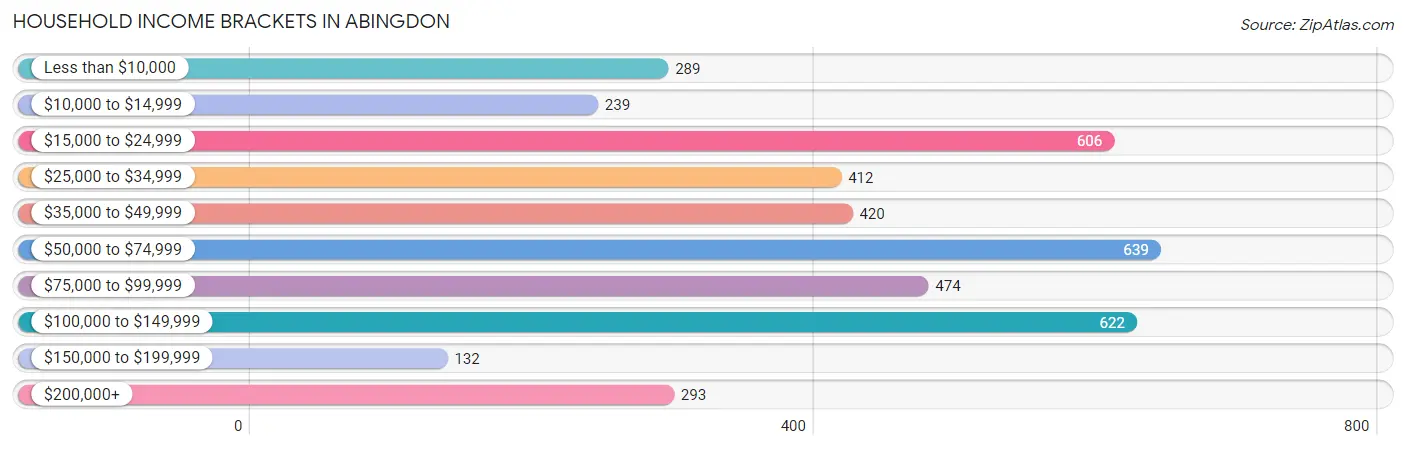
| Income Bracket | # Households | % Households |
| Less than $10,000 | 289 | 7.0% |
| $10,000 to $14,999 | 239 | 5.8% |
| $15,000 to $24,999 | 606 | 14.7% |
| $25,000 to $34,999 | 412 | 10.0% |
| $35,000 to $49,999 | 420 | 10.2% |
| $50,000 to $74,999 | 639 | 15.5% |
| $75,000 to $99,999 | 474 | 11.5% |
| $100,000 to $149,999 | 622 | 15.1% |
| $150,000 to $199,999 | 132 | 3.2% |
| $200,000+ | 293 | 7.1% |
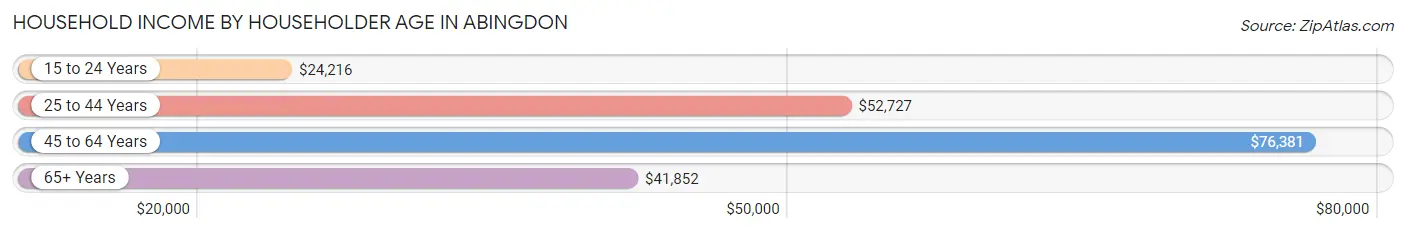
Household Income by Householder Age in Abingdon
The median household income in Abingdon is $56,164, with the highest median household income of $76,381 found in the 45 to 64 years age bracket for the primary householder. A total of 1,378 households (33.4%) fall into this category. Meanwhile, the 15 to 24 years age bracket for the primary householder has the lowest median household income of $24,216, with 242 households (5.9%) in this group.
| Income Bracket | # Households | Median Income |
| 15 to 24 Years | 242 (5.9%) | $24,216 |
| 25 to 44 Years | 1,188 (28.8%) | $52,727 |
| 45 to 64 Years | 1,378 (33.4%) | $76,381 |
| 65+ Years | 1,314 (31.9%) | $41,852 |
| Total | 4,122 (100.0%) | $56,164 |
Poverty in Abingdon
Income Below Poverty by Sex and Age in Abingdon
With 14.6% poverty level for males and 16.7% for females among the residents of Abingdon, 6 to 11 year old males and 5 year old females are the most vulnerable to poverty, with 68 males (34.7%) and 10 females (50.0%) in their respective age groups living below the poverty level.
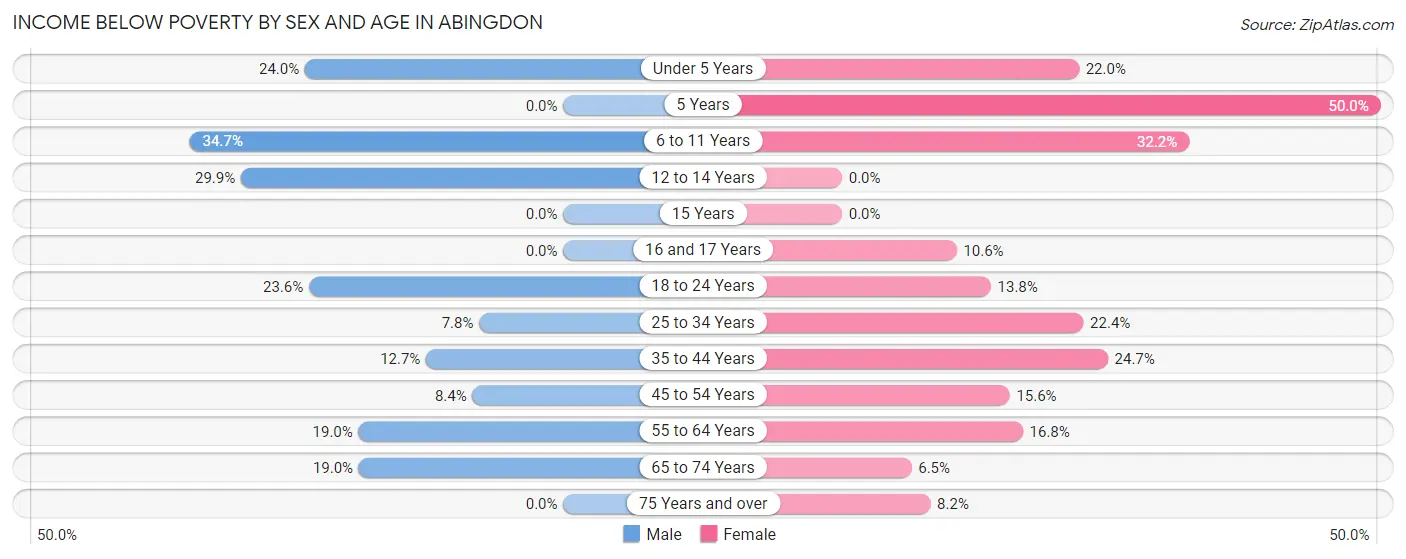
| Age Bracket | Male | Female |
| Under 5 Years | 35 (24.0%) | 31 (22.0%) |
| 5 Years | 0 (0.0%) | 10 (50.0%) |
| 6 to 11 Years | 68 (34.7%) | 68 (32.2%) |
| 12 to 14 Years | 32 (29.9%) | 0 (0.0%) |
| 15 Years | 0 (0.0%) | 0 (0.0%) |
| 16 and 17 Years | 0 (0.0%) | 10 (10.6%) |
| 18 to 24 Years | 80 (23.6%) | 46 (13.8%) |
| 25 to 34 Years | 51 (7.8%) | 151 (22.4%) |
| 35 to 44 Years | 55 (12.7%) | 112 (24.7%) |
| 45 to 54 Years | 43 (8.4%) | 94 (15.6%) |
| 55 to 64 Years | 110 (19.0%) | 97 (16.8%) |
| 65 to 74 Years | 125 (19.0%) | 32 (6.5%) |
| 75 Years and over | 0 (0.0%) | 41 (8.2%) |
| Total | 599 (14.6%) | 692 (16.7%) |
Income Above Poverty by Sex and Age in Abingdon
According to the poverty statistics in Abingdon, males aged 5 years and females aged 12 to 14 years are the age groups that are most secure financially, with 100.0% of males and 100.0% of females in these age groups living above the poverty line.
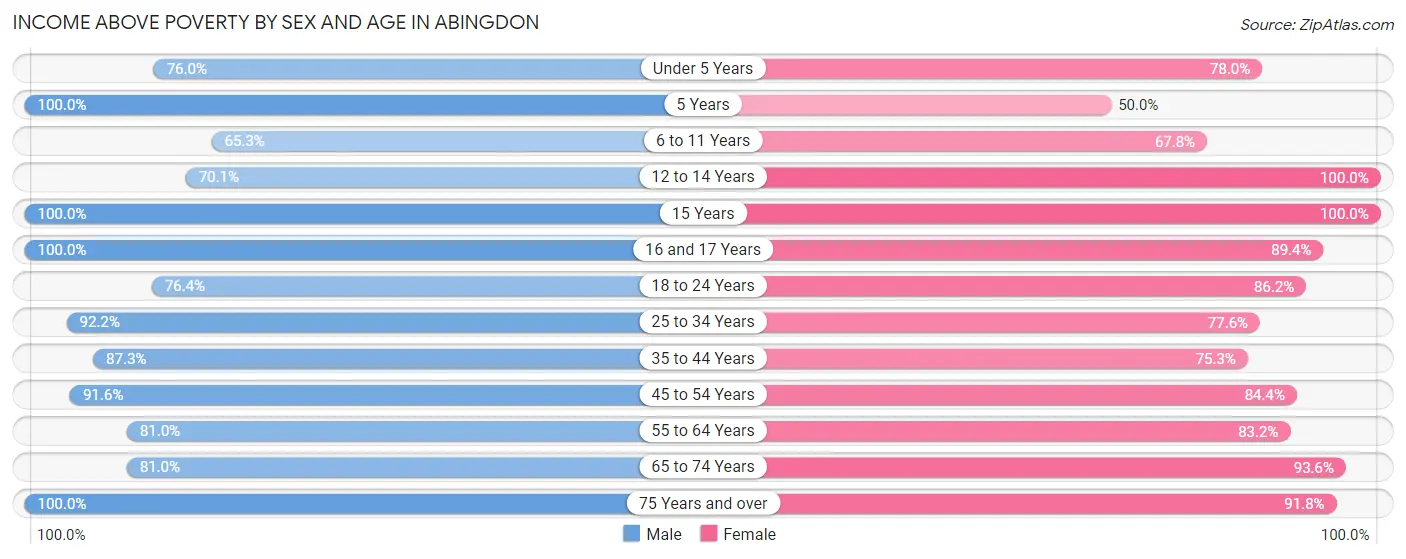
| Age Bracket | Male | Female |
| Under 5 Years | 111 (76.0%) | 110 (78.0%) |
| 5 Years | 76 (100.0%) | 10 (50.0%) |
| 6 to 11 Years | 128 (65.3%) | 143 (67.8%) |
| 12 to 14 Years | 75 (70.1%) | 26 (100.0%) |
| 15 Years | 23 (100.0%) | 16 (100.0%) |
| 16 and 17 Years | 93 (100.0%) | 84 (89.4%) |
| 18 to 24 Years | 259 (76.4%) | 287 (86.2%) |
| 25 to 34 Years | 603 (92.2%) | 523 (77.6%) |
| 35 to 44 Years | 377 (87.3%) | 342 (75.3%) |
| 45 to 54 Years | 467 (91.6%) | 510 (84.4%) |
| 55 to 64 Years | 469 (81.0%) | 481 (83.2%) |
| 65 to 74 Years | 534 (81.0%) | 464 (93.5%) |
| 75 Years and over | 274 (100.0%) | 459 (91.8%) |
| Total | 3,489 (85.4%) | 3,455 (83.3%) |
Income Below Poverty Among Married-Couple Families in Abingdon
The poverty statistics for married-couple families in Abingdon show that 6.6% or 104 of the total 1,579 families live below the poverty line. Families with 3 or 4 children have the highest poverty rate of 47.8%, comprising of 11 families. On the other hand, families with no children have the lowest poverty rate of 5.6%, which includes 60 families.
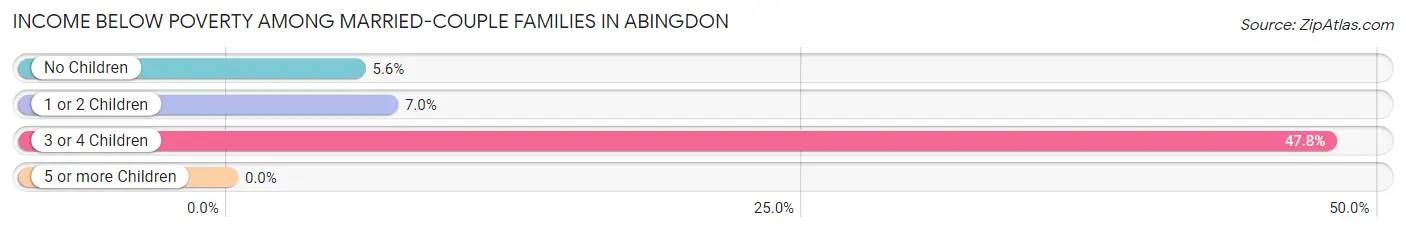
| Children | Above Poverty | Below Poverty |
| No Children | 1,022 (94.5%) | 60 (5.6%) |
| 1 or 2 Children | 441 (93.0%) | 33 (7.0%) |
| 3 or 4 Children | 12 (52.2%) | 11 (47.8%) |
| 5 or more Children | 0 (0.0%) | 0 (0.0%) |
| Total | 1,475 (93.4%) | 104 (6.6%) |
Income Below Poverty Among Single-Parent Households in Abingdon
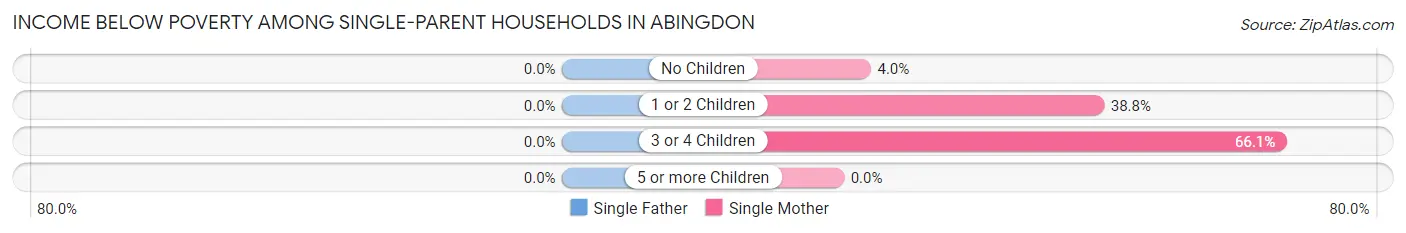
| Children | Single Father | Single Mother |
| No Children | 0 (0.0%) | 7 (4.0%) |
| 1 or 2 Children | 0 (0.0%) | 69 (38.8%) |
| 3 or 4 Children | 0 (0.0%) | 37 (66.1%) |
| 5 or more Children | 0 (0.0%) | 0 (0.0%) |
| Total | 0 (0.0%) | 113 (27.6%) |
Income Below Poverty Among Married-Couple vs Single-Parent Households in Abingdon
The poverty data for Abingdon shows that 104 of the married-couple family households (6.6%) and 113 of the single-parent households (21.9%) are living below the poverty level. Within the married-couple family households, those with 3 or 4 children have the highest poverty rate, with 11 households (47.8%) falling below the poverty line. Among the single-parent households, those with 3 or 4 children have the highest poverty rate, with 37 household (66.1%) living below poverty.
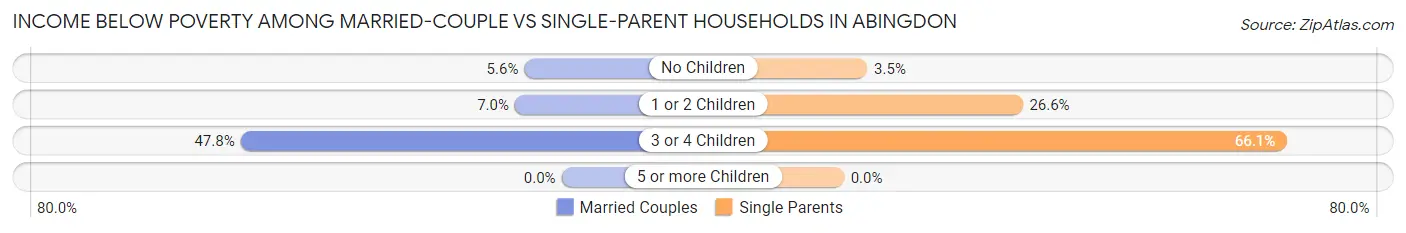
| Children | Married-Couple Families | Single-Parent Households |
| No Children | 60 (5.6%) | 7 (3.5%) |
| 1 or 2 Children | 33 (7.0%) | 69 (26.6%) |
| 3 or 4 Children | 11 (47.8%) | 37 (66.1%) |
| 5 or more Children | 0 (0.0%) | 0 (0.0%) |
| Total | 104 (6.6%) | 113 (21.9%) |
Race in Abingdon
The most populous races in Abingdon are White / Caucasian (7,688 | 92.1%), Black / African American (260 | 3.1%), and Two or more Races (202 | 2.4%).
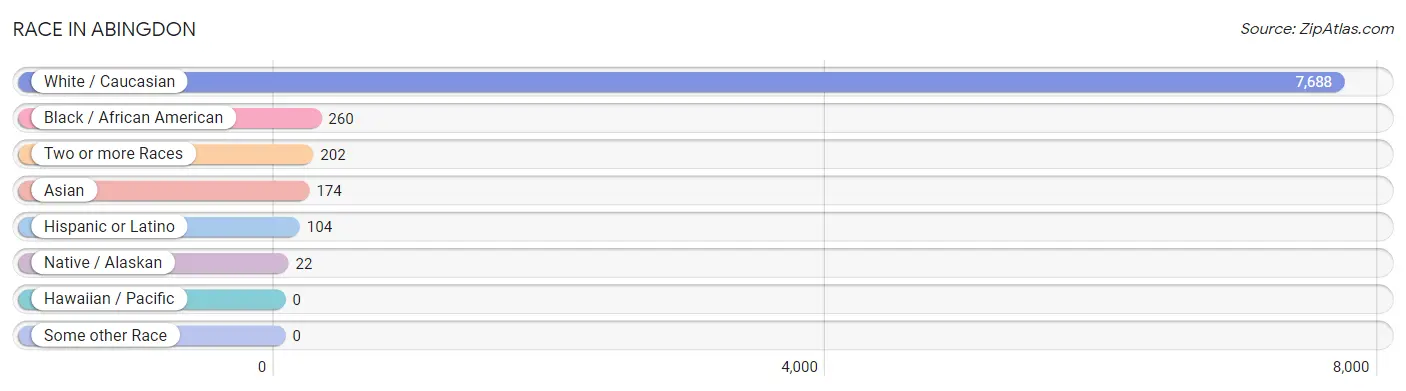
| Race | # Population | % Population |
| Asian | 174 | 2.1% |
| Black / African American | 260 | 3.1% |
| Hawaiian / Pacific | 0 | 0.0% |
| Hispanic or Latino | 104 | 1.3% |
| Native / Alaskan | 22 | 0.3% |
| White / Caucasian | 7,688 | 92.1% |
| Two or more Races | 202 | 2.4% |
| Some other Race | 0 | 0.0% |
| Total | 8,346 | 100.0% |
Ancestry in Abingdon
The most populous ancestries reported in Abingdon are American (1,832 | 22.0%), English (1,251 | 15.0%), German (898 | 10.8%), Irish (766 | 9.2%), and Scottish (226 | 2.7%), together accounting for 59.6% of all Abingdon residents.
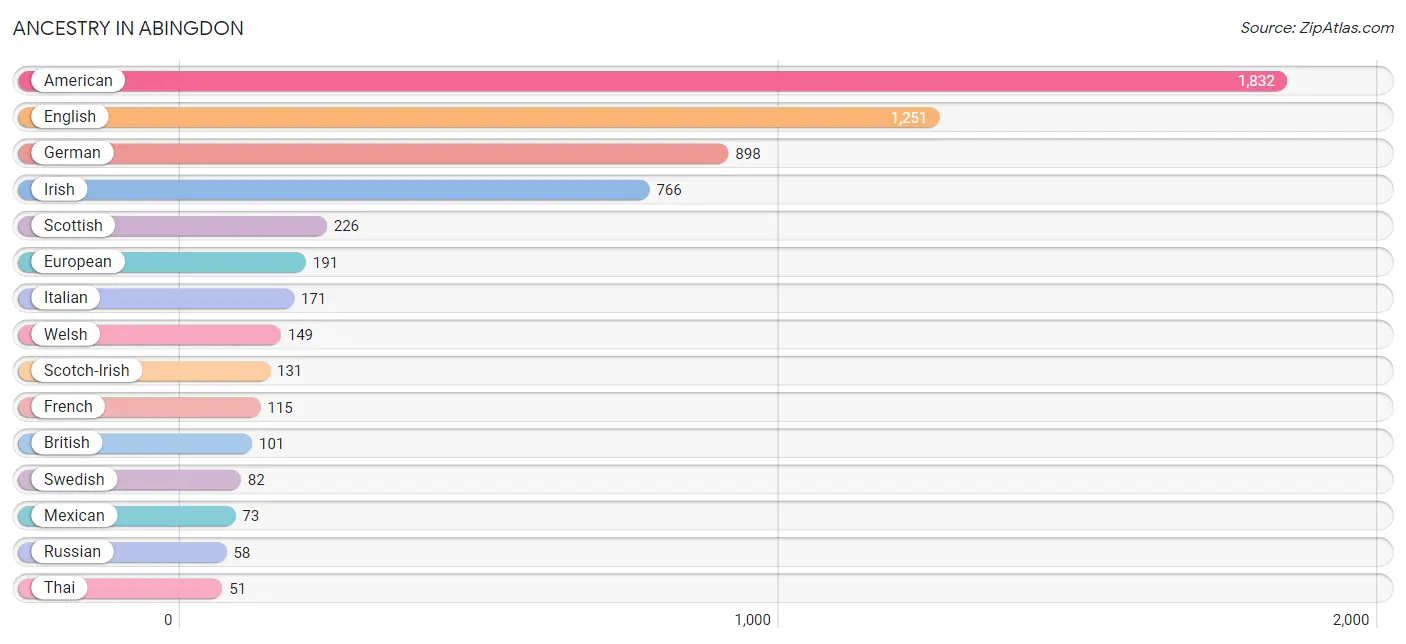
| Ancestry | # Population | % Population |
| American | 1,832 | 22.0% |
| Arab | 6 | 0.1% |
| Austrian | 6 | 0.1% |
| Bhutanese | 9 | 0.1% |
| British | 101 | 1.2% |
| Cherokee | 33 | 0.4% |
| Czech | 17 | 0.2% |
| Dutch | 44 | 0.5% |
| English | 1,251 | 15.0% |
| European | 191 | 2.3% |
| French | 115 | 1.4% |
| French Canadian | 8 | 0.1% |
| German | 898 | 10.8% |
| Hungarian | 6 | 0.1% |
| Indian (Asian) | 17 | 0.2% |
| Irish | 766 | 9.2% |
| Italian | 171 | 2.1% |
| Japanese | 13 | 0.2% |
| Korean | 11 | 0.1% |
| Lebanese | 6 | 0.1% |
| Mexican | 73 | 0.9% |
| Nigerian | 20 | 0.2% |
| Northern European | 5 | 0.1% |
| Norwegian | 24 | 0.3% |
| Polish | 46 | 0.5% |
| Russian | 58 | 0.7% |
| Scandinavian | 7 | 0.1% |
| Scotch-Irish | 131 | 1.6% |
| Scottish | 226 | 2.7% |
| Slavic | 10 | 0.1% |
| Subsaharan African | 20 | 0.2% |
| Swedish | 82 | 1.0% |
| Swiss | 40 | 0.5% |
| Thai | 51 | 0.6% |
| Ukrainian | 25 | 0.3% |
| Welsh | 149 | 1.8% |
| Yugoslavian | 3 | 0.0% | View All 37 Rows |
Immigrants in Abingdon
The most numerous immigrant groups reported in Abingdon came from Asia (122 | 1.5%), Europe (86 | 1.0%), Eastern Europe (76 | 0.9%), Eastern Asia (58 | 0.7%), and Russia (58 | 0.7%), together accounting for 4.8% of all Abingdon residents.
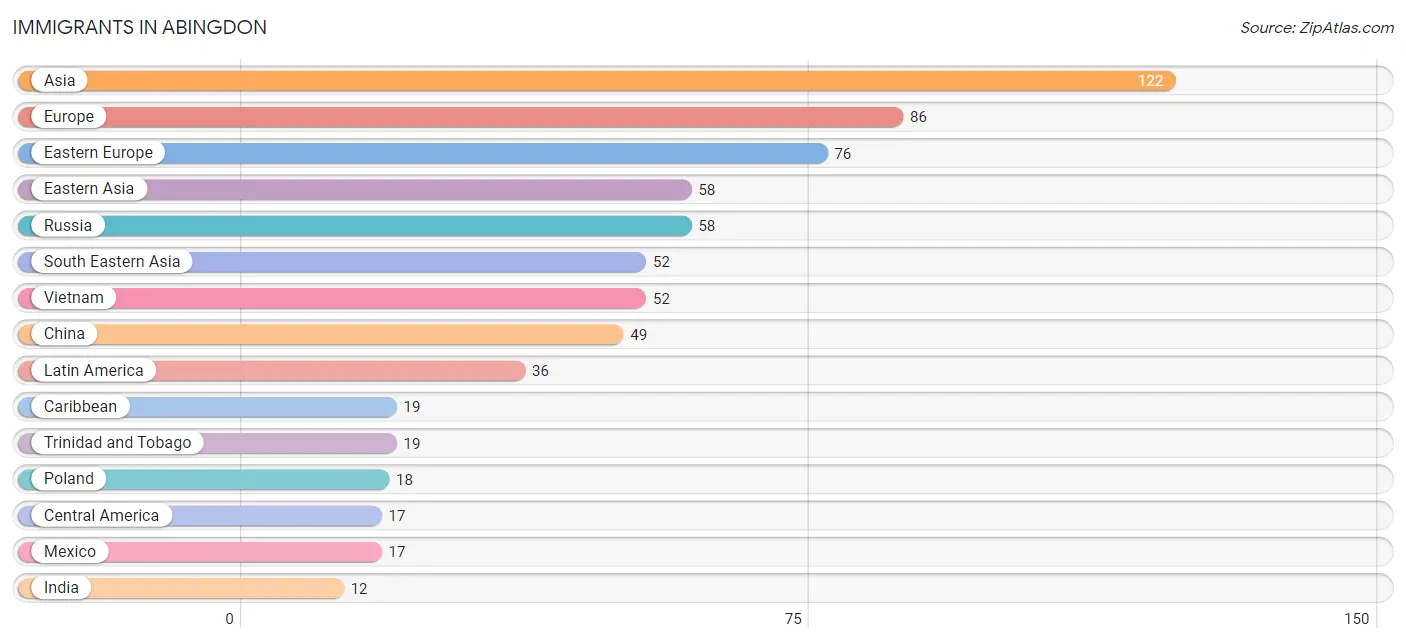
| Immigration Origin | # Population | % Population |
| Asia | 122 | 1.5% |
| Caribbean | 19 | 0.2% |
| Central America | 17 | 0.2% |
| China | 49 | 0.6% |
| Eastern Asia | 58 | 0.7% |
| Eastern Europe | 76 | 0.9% |
| Europe | 86 | 1.0% |
| India | 12 | 0.1% |
| Japan | 9 | 0.1% |
| Latin America | 36 | 0.4% |
| Mexico | 17 | 0.2% |
| Northern Europe | 10 | 0.1% |
| Poland | 18 | 0.2% |
| Russia | 58 | 0.7% |
| South Central Asia | 12 | 0.1% |
| South Eastern Asia | 52 | 0.6% |
| Taiwan | 12 | 0.1% |
| Trinidad and Tobago | 19 | 0.2% |
| Vietnam | 52 | 0.6% | View All 19 Rows |
Sex and Age in Abingdon
Sex and Age in Abingdon
The most populous age groups in Abingdon are 65 to 69 Years (426 | 10.3%) for men and 25 to 29 Years (380 | 9.0%) for women.
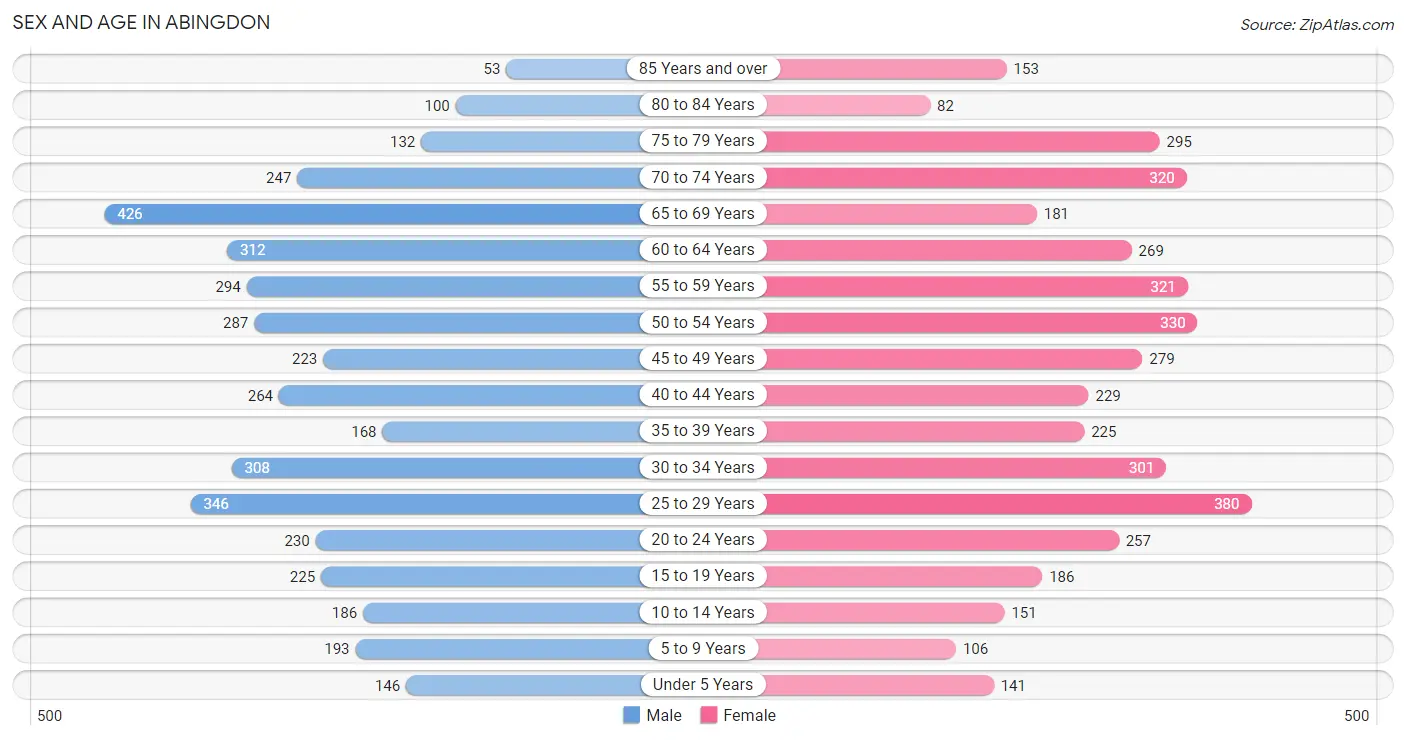
| Age Bracket | Male | Female |
| Under 5 Years | 146 (3.5%) | 141 (3.4%) |
| 5 to 9 Years | 193 (4.7%) | 106 (2.5%) |
| 10 to 14 Years | 186 (4.5%) | 151 (3.6%) |
| 15 to 19 Years | 225 (5.4%) | 186 (4.4%) |
| 20 to 24 Years | 230 (5.6%) | 257 (6.1%) |
| 25 to 29 Years | 346 (8.4%) | 380 (9.0%) |
| 30 to 34 Years | 308 (7.4%) | 301 (7.2%) |
| 35 to 39 Years | 168 (4.1%) | 225 (5.3%) |
| 40 to 44 Years | 264 (6.4%) | 229 (5.4%) |
| 45 to 49 Years | 223 (5.4%) | 279 (6.6%) |
| 50 to 54 Years | 287 (6.9%) | 330 (7.9%) |
| 55 to 59 Years | 294 (7.1%) | 321 (7.6%) |
| 60 to 64 Years | 312 (7.5%) | 269 (6.4%) |
| 65 to 69 Years | 426 (10.3%) | 181 (4.3%) |
| 70 to 74 Years | 247 (6.0%) | 320 (7.6%) |
| 75 to 79 Years | 132 (3.2%) | 295 (7.0%) |
| 80 to 84 Years | 100 (2.4%) | 82 (1.9%) |
| 85 Years and over | 53 (1.3%) | 153 (3.6%) |
| Total | 4,140 (100.0%) | 4,206 (100.0%) |
Families and Households in Abingdon
Median Family Size in Abingdon
The median family size in Abingdon is 2.65 persons per family, with married-couple families (1,579 | 75.4%) accounting for the largest median family size of 2.68 persons per family. On the other hand, single male/father families (106 | 5.1%) represent the smallest median family size with 2.22 persons per family.
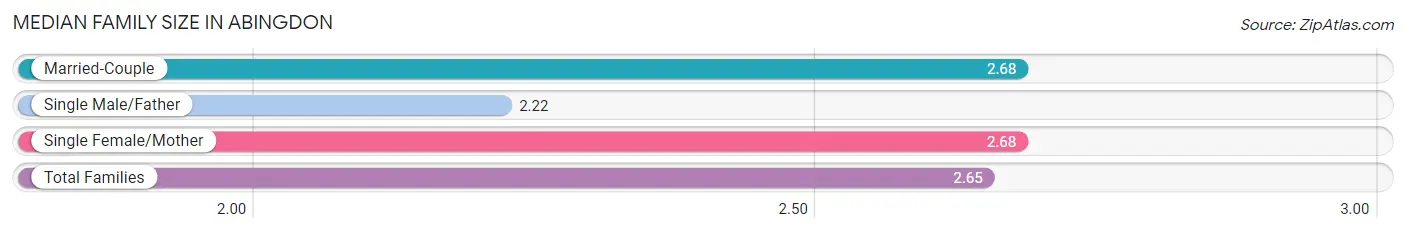
| Family Type | # Families | Family Size |
| Married-Couple | 1,579 (75.4%) | 2.68 |
| Single Male/Father | 106 (5.1%) | 2.22 |
| Single Female/Mother | 409 (19.5%) | 2.68 |
| Total Families | 2,094 (100.0%) | 2.65 |
Median Household Size in Abingdon
The median household size in Abingdon is 1.97 persons per household, with single male/father households (106 | 2.6%) accounting for the largest median household size of 3.61 persons per household. non-family households (2,028 | 49.2%) represent the smallest median household size with 1.18 persons per household.
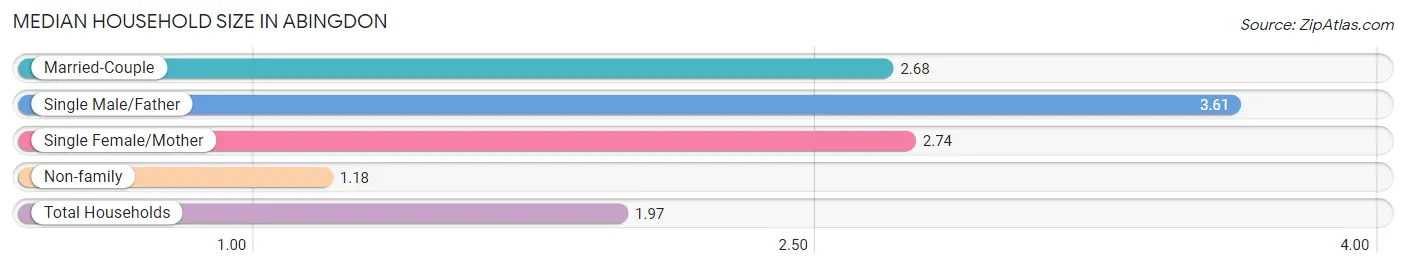
| Household Type | # Households | Household Size |
| Married-Couple | 1,579 (38.3%) | 2.68 |
| Single Male/Father | 106 (2.6%) | 3.61 |
| Single Female/Mother | 409 (9.9%) | 2.74 |
| Non-family | 2,028 (49.2%) | 1.18 |
| Total Households | 4,122 (100.0%) | 1.97 |
Household Size by Marriage Status in Abingdon
Out of a total of 4,122 households in Abingdon, 2,094 (50.8%) are family households, while 2,028 (49.2%) are nonfamily households. The most numerous type of family households are 2-person households, comprising 1,183, and the most common type of nonfamily households are 1-person households, comprising 1,672.
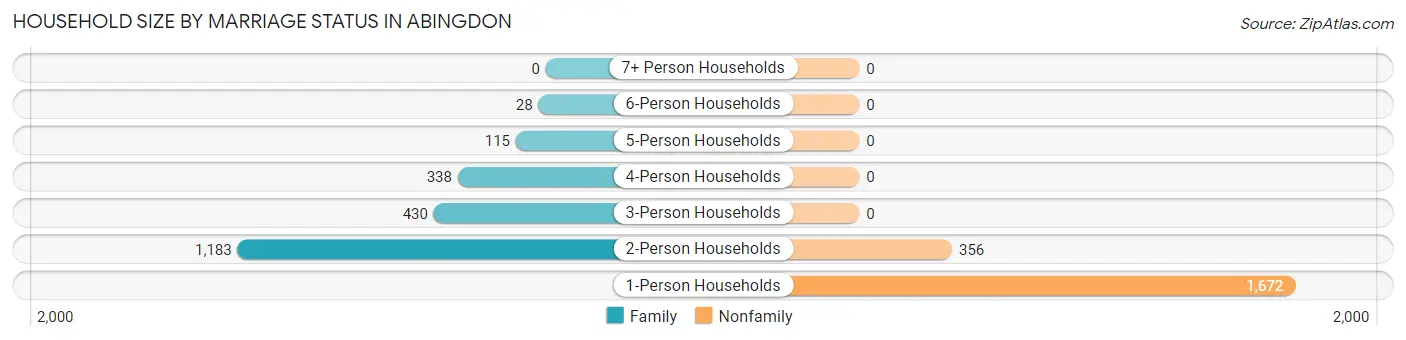
| Household Size | Family Households | Nonfamily Households |
| 1-Person Households | - | 1,672 (40.6%) |
| 2-Person Households | 1,183 (28.7%) | 356 (8.6%) |
| 3-Person Households | 430 (10.4%) | 0 (0.0%) |
| 4-Person Households | 338 (8.2%) | 0 (0.0%) |
| 5-Person Households | 115 (2.8%) | 0 (0.0%) |
| 6-Person Households | 28 (0.7%) | 0 (0.0%) |
| 7+ Person Households | 0 (0.0%) | 0 (0.0%) |
| Total | 2,094 (50.8%) | 2,028 (49.2%) |
Female Fertility in Abingdon
Fertility by Age in Abingdon
Average fertility rate in Abingdon is 32.0 births per 1,000 women. Women in the age bracket of 20 to 34 years have the highest fertility rate with 52.0 births per 1,000 women. Women in the age bracket of 20 to 34 years acount for 80.3% of all women with births.
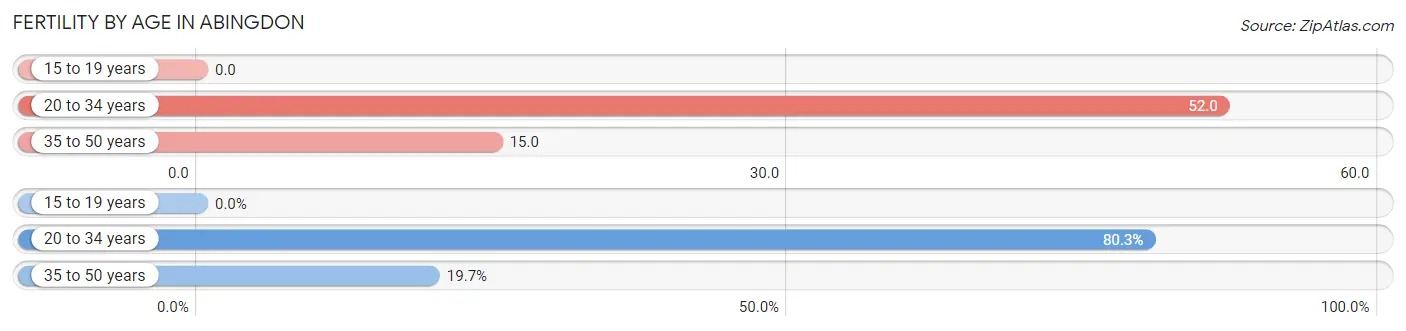
| Age Bracket | Women with Births | Births / 1,000 Women |
| 15 to 19 years | 0 (0.0%) | 0.0 |
| 20 to 34 years | 49 (80.3%) | 52.0 |
| 35 to 50 years | 12 (19.7%) | 15.0 |
| Total | 61 (100.0%) | 32.0 |
Fertility by Age by Marriage Status in Abingdon
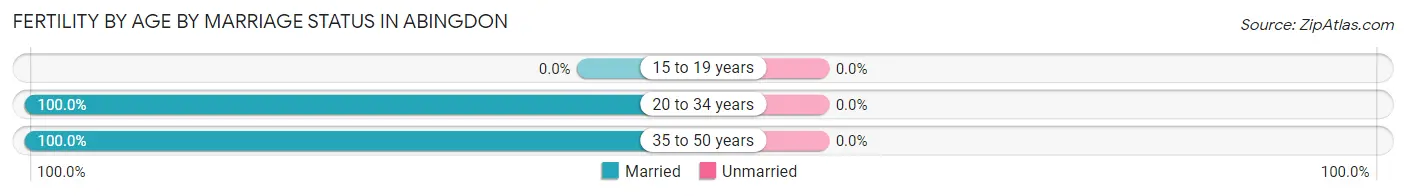
| Age Bracket | Married | Unmarried |
| 15 to 19 years | 0 (0.0%) | 0 (0.0%) |
| 20 to 34 years | 49 (100.0%) | 0 (0.0%) |
| 35 to 50 years | 12 (100.0%) | 0 (0.0%) |
| Total | 61 (100.0%) | 0 (0.0%) |
Fertility by Education in Abingdon
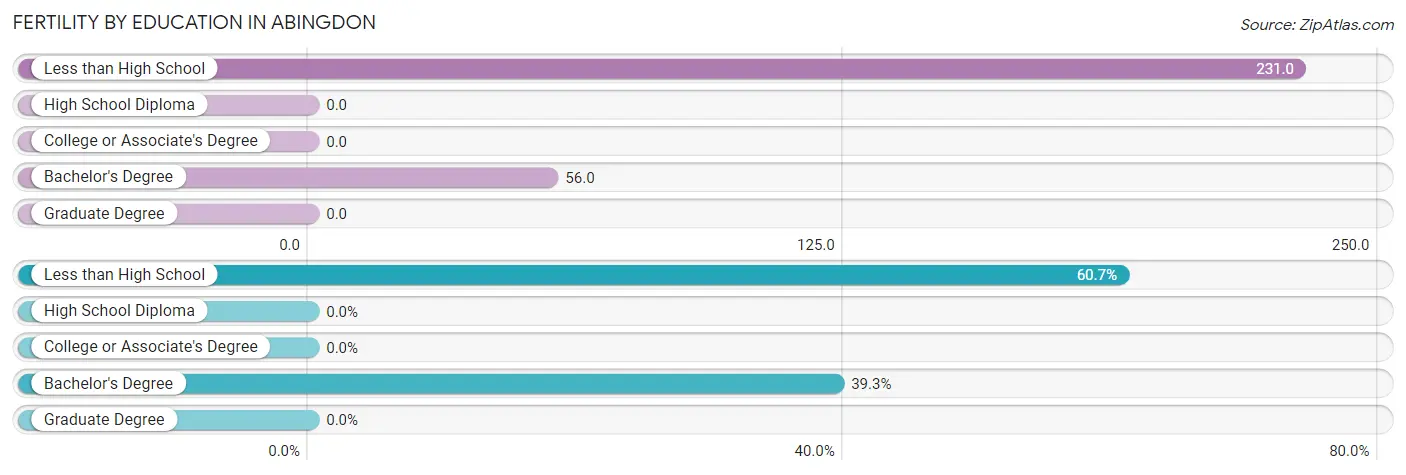
| Educational Attainment | Women with Births | Births / 1,000 Women |
| Less than High School | 37 (60.7%) | 231.0 |
| High School Diploma | 0 (0.0%) | 0.0 |
| College or Associate's Degree | 0 (0.0%) | 0.0 |
| Bachelor's Degree | 24 (39.3%) | 56.0 |
| Graduate Degree | 0 (0.0%) | 0.0 |
| Total | 61 (100.0%) | 32.0 |
Fertility by Education by Marriage Status in Abingdon
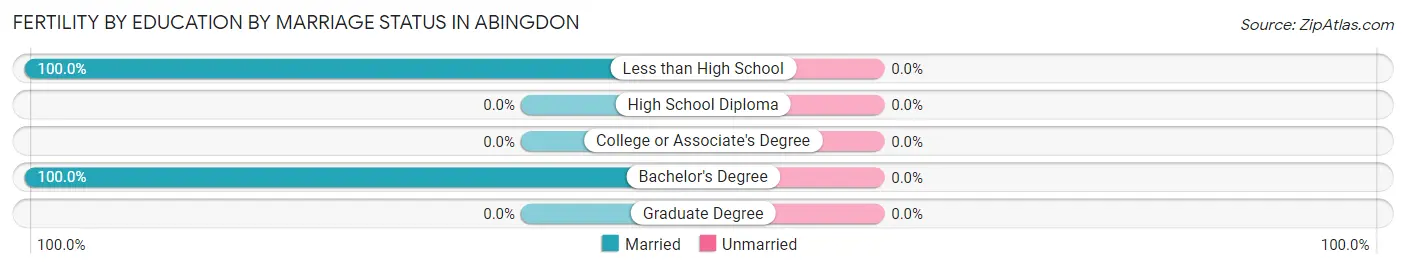
| Educational Attainment | Married | Unmarried |
| Less than High School | 37 (100.0%) | 0 (0.0%) |
| High School Diploma | 0 (0.0%) | 0 (0.0%) |
| College or Associate's Degree | 0 (0.0%) | 0 (0.0%) |
| Bachelor's Degree | 24 (100.0%) | 0 (0.0%) |
| Graduate Degree | 0 (0.0%) | 0 (0.0%) |
| Total | 61 (100.0%) | 0 (0.0%) |
Employment Characteristics in Abingdon
Employment by Class of Employer in Abingdon
Among the 4,119 employed individuals in Abingdon, private company employees (2,585 | 62.8%), not-for-profit organizations (491 | 11.9%), and local government employees (349 | 8.5%) make up the most common classes of employment.
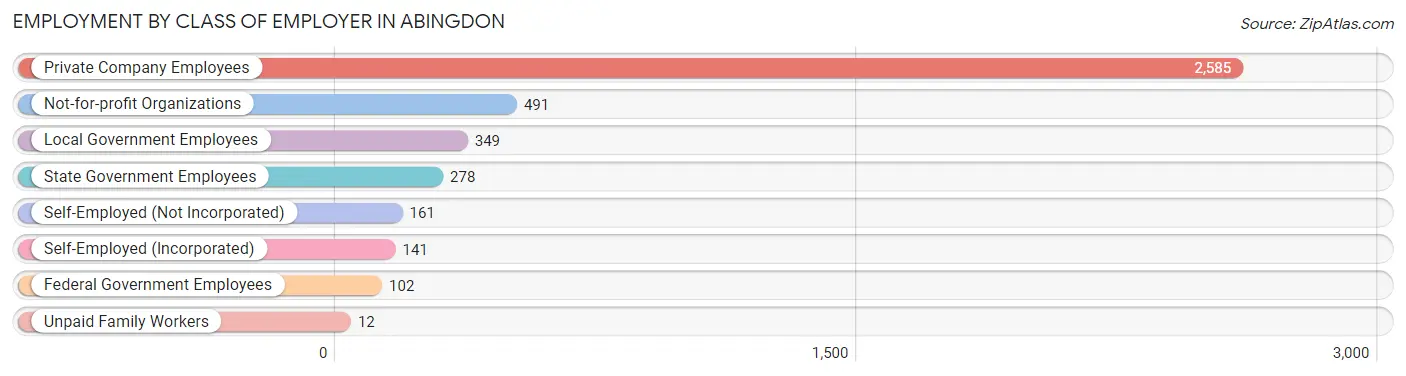
| Employer Class | # Employees | % Employees |
| Private Company Employees | 2,585 | 62.8% |
| Self-Employed (Incorporated) | 141 | 3.4% |
| Self-Employed (Not Incorporated) | 161 | 3.9% |
| Not-for-profit Organizations | 491 | 11.9% |
| Local Government Employees | 349 | 8.5% |
| State Government Employees | 278 | 6.8% |
| Federal Government Employees | 102 | 2.5% |
| Unpaid Family Workers | 12 | 0.3% |
| Total | 4,119 | 100.0% |
Employment Status by Age in Abingdon
According to the labor force statistics for Abingdon, out of the total population over 16 years of age (7,384), 58.3% or 4,305 individuals are in the labor force, with 4.0% or 172 of them unemployed. The age group with the highest labor force participation rate is 25 to 29 years, with 87.6% or 636 individuals in the labor force. Within the labor force, the 60 to 64 years age range has the highest percentage of unemployed individuals, with 18.2% or 37 of them being unemployed.
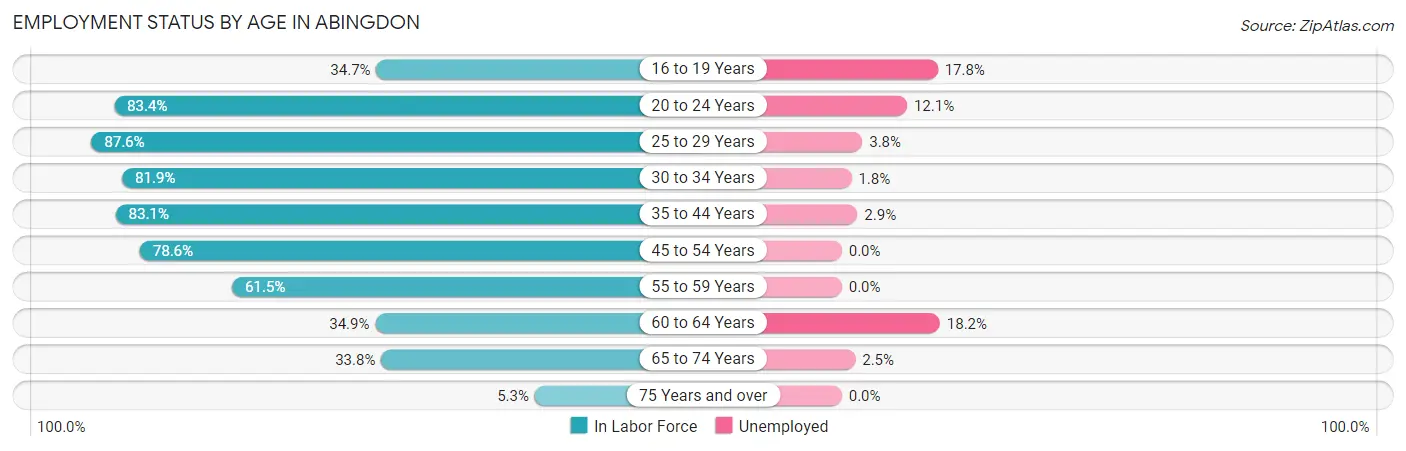
| Age Bracket | In Labor Force | Unemployed |
| 16 to 19 Years | 129 (34.7%) | 23 (17.8%) |
| 20 to 24 Years | 406 (83.4%) | 49 (12.1%) |
| 25 to 29 Years | 636 (87.6%) | 24 (3.8%) |
| 30 to 34 Years | 499 (81.9%) | 9 (1.8%) |
| 35 to 44 Years | 736 (83.1%) | 21 (2.9%) |
| 45 to 54 Years | 880 (78.6%) | 0 (0.0%) |
| 55 to 59 Years | 378 (61.5%) | 0 (0.0%) |
| 60 to 64 Years | 203 (34.9%) | 37 (18.2%) |
| 65 to 74 Years | 397 (33.8%) | 10 (2.5%) |
| 75 Years and over | 43 (5.3%) | 0 (0.0%) |
| Total | 4,305 (58.3%) | 172 (4.0%) |
Employment Status by Educational Attainment in Abingdon
According to labor force statistics for Abingdon, 73.4% of individuals (3,329) out of the total population between 25 and 64 years of age (4,536) are in the labor force, with 2.7% or 90 of them being unemployed. The group with the highest labor force participation rate are those with the educational attainment of bachelor's degree or higher, with 88.1% or 1,502 individuals in the labor force. Within the labor force, individuals with high school diploma education have the highest percentage of unemployment, with 4.5% or 33 of them being unemployed.
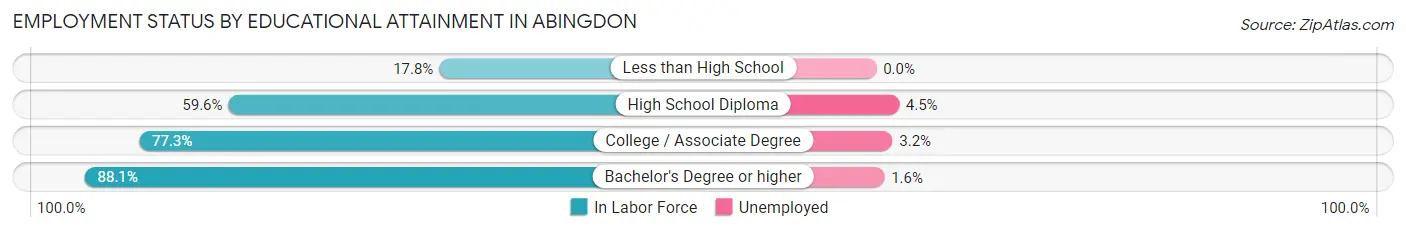
| Educational Attainment | In Labor Force | Unemployed |
| Less than High School | 43 (17.8%) | 0 (0.0%) |
| High School Diploma | 728 (59.6%) | 55 (4.5%) |
| College / Associate Degree | 1,057 (77.3%) | 44 (3.2%) |
| Bachelor's Degree or higher | 1,502 (88.1%) | 27 (1.6%) |
| Total | 3,329 (73.4%) | 122 (2.7%) |
Employment Occupations by Sex in Abingdon
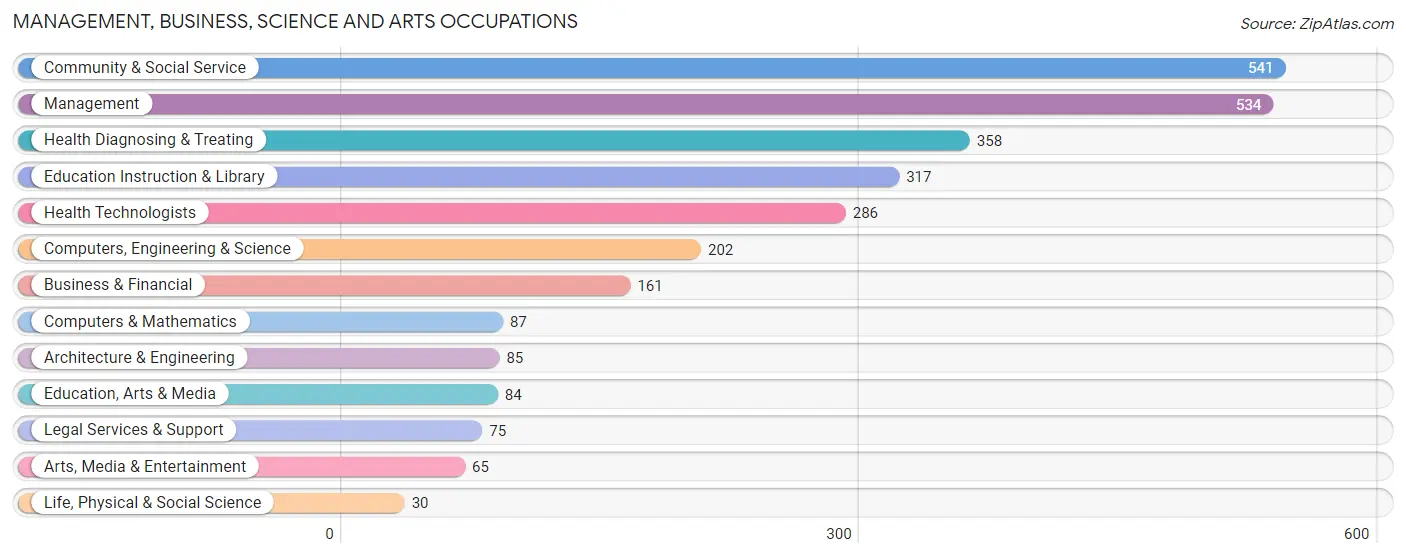
Management, Business, Science and Arts Occupations
The most common Management, Business, Science and Arts occupations in Abingdon are Community & Social Service (541 | 13.1%), Management (534 | 12.9%), Health Diagnosing & Treating (358 | 8.7%), Education Instruction & Library (317 | 7.7%), and Health Technologists (286 | 6.9%).
Management, Business, Science and Arts Occupations by Sex
Within the Management, Business, Science and Arts occupations in Abingdon, the most male-oriented occupations are Architecture & Engineering (100.0%), Management (78.1%), and Computers, Engineering & Science (69.8%), while the most female-oriented occupations are Life, Physical & Social Science (100.0%), Education Instruction & Library (83.0%), and Health Technologists (77.3%).
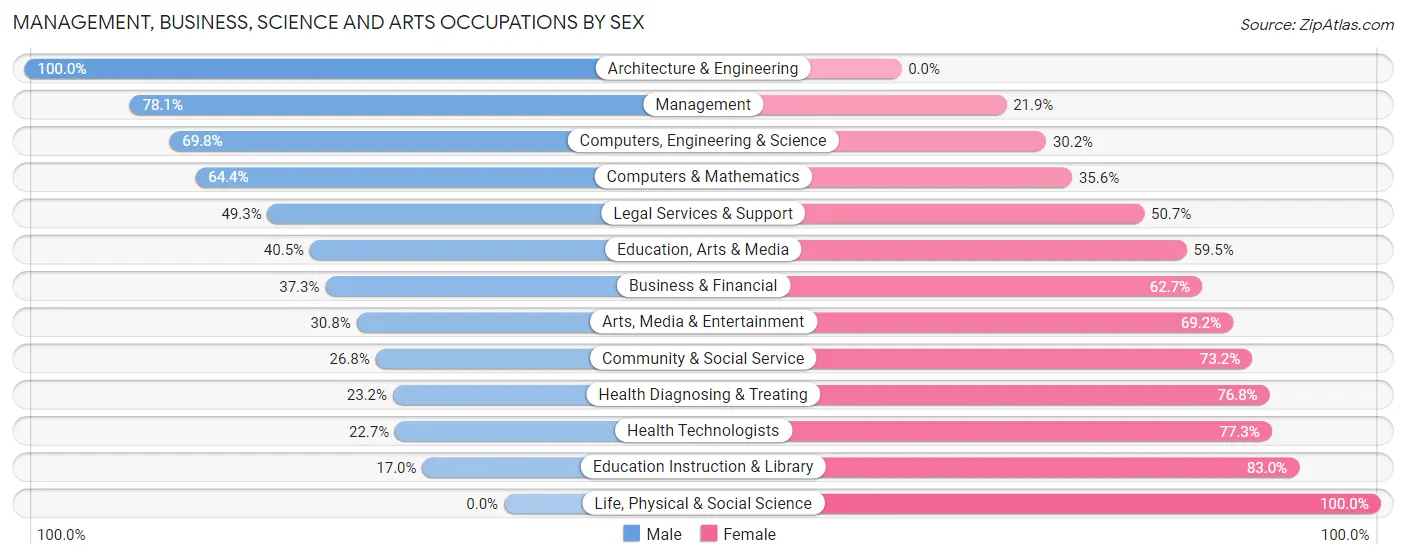
| Occupation | Male | Female |
| Management | 417 (78.1%) | 117 (21.9%) |
| Business & Financial | 60 (37.3%) | 101 (62.7%) |
| Computers, Engineering & Science | 141 (69.8%) | 61 (30.2%) |
| Computers & Mathematics | 56 (64.4%) | 31 (35.6%) |
| Architecture & Engineering | 85 (100.0%) | 0 (0.0%) |
| Life, Physical & Social Science | 0 (0.0%) | 30 (100.0%) |
| Community & Social Service | 145 (26.8%) | 396 (73.2%) |
| Education, Arts & Media | 34 (40.5%) | 50 (59.5%) |
| Legal Services & Support | 37 (49.3%) | 38 (50.7%) |
| Education Instruction & Library | 54 (17.0%) | 263 (83.0%) |
| Arts, Media & Entertainment | 20 (30.8%) | 45 (69.2%) |
| Health Diagnosing & Treating | 83 (23.2%) | 275 (76.8%) |
| Health Technologists | 65 (22.7%) | 221 (77.3%) |
| Total (Category) | 846 (47.1%) | 950 (52.9%) |
| Total (Overall) | 2,018 (48.8%) | 2,115 (51.2%) |
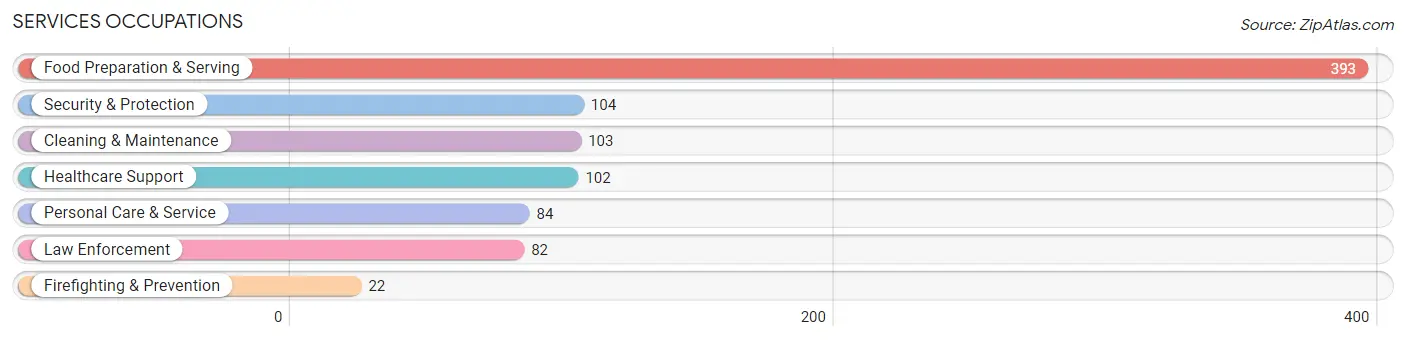
Services Occupations
The most common Services occupations in Abingdon are Food Preparation & Serving (393 | 9.5%), Security & Protection (104 | 2.5%), Cleaning & Maintenance (103 | 2.5%), Healthcare Support (102 | 2.5%), and Personal Care & Service (84 | 2.0%).
Services Occupations by Sex
Within the Services occupations in Abingdon, the most male-oriented occupations are Law Enforcement (79.3%), Security & Protection (70.2%), and Personal Care & Service (42.9%), while the most female-oriented occupations are Healthcare Support (100.0%), Cleaning & Maintenance (72.8%), and Firefighting & Prevention (63.6%).
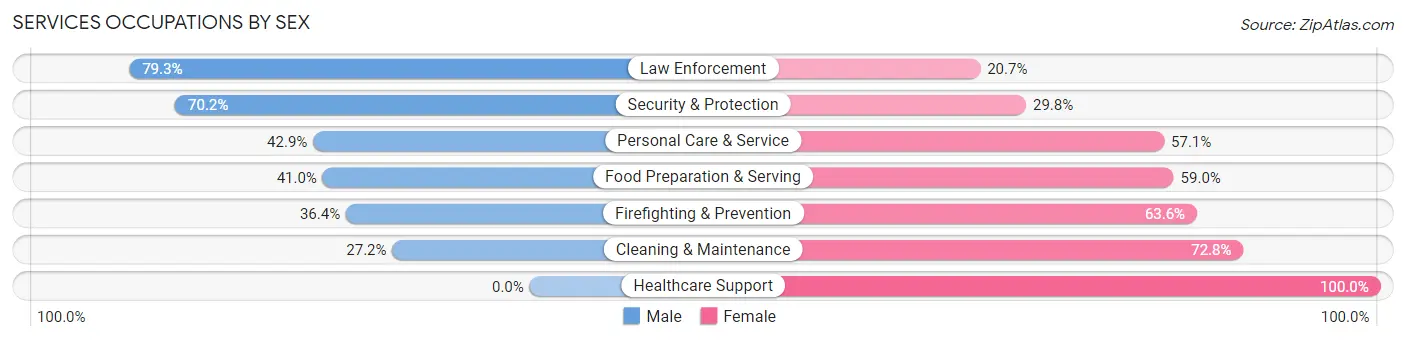
| Occupation | Male | Female |
| Healthcare Support | 0 (0.0%) | 102 (100.0%) |
| Security & Protection | 73 (70.2%) | 31 (29.8%) |
| Firefighting & Prevention | 8 (36.4%) | 14 (63.6%) |
| Law Enforcement | 65 (79.3%) | 17 (20.7%) |
| Food Preparation & Serving | 161 (41.0%) | 232 (59.0%) |
| Cleaning & Maintenance | 28 (27.2%) | 75 (72.8%) |
| Personal Care & Service | 36 (42.9%) | 48 (57.1%) |
| Total (Category) | 298 (37.9%) | 488 (62.1%) |
| Total (Overall) | 2,018 (48.8%) | 2,115 (51.2%) |
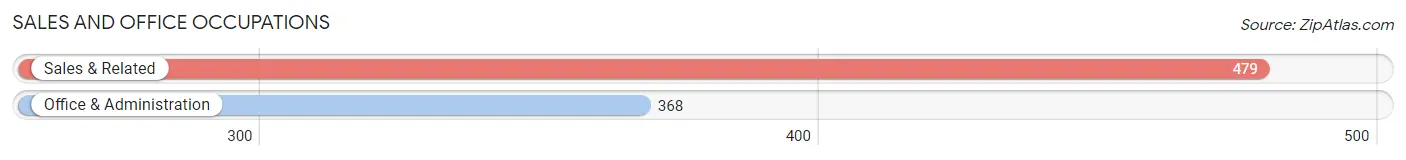
Sales and Office Occupations
The most common Sales and Office occupations in Abingdon are Sales & Related (479 | 11.6%), and Office & Administration (368 | 8.9%).
Sales and Office Occupations by Sex
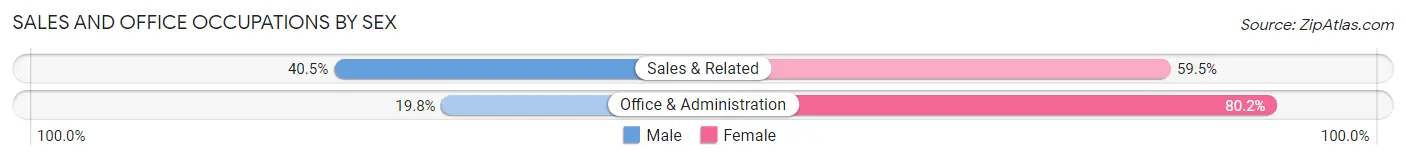
| Occupation | Male | Female |
| Sales & Related | 194 (40.5%) | 285 (59.5%) |
| Office & Administration | 73 (19.8%) | 295 (80.2%) |
| Total (Category) | 267 (31.5%) | 580 (68.5%) |
| Total (Overall) | 2,018 (48.8%) | 2,115 (51.2%) |
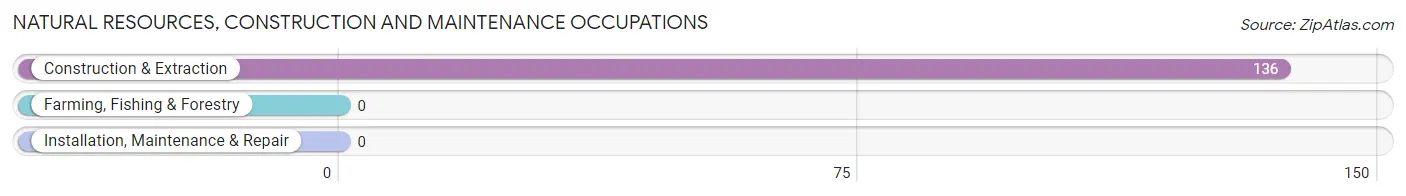
Natural Resources, Construction and Maintenance Occupations
The most common Natural Resources, Construction and Maintenance occupations in Abingdon are , and Construction & Extraction (136 | 3.3%).
Natural Resources, Construction and Maintenance Occupations by Sex
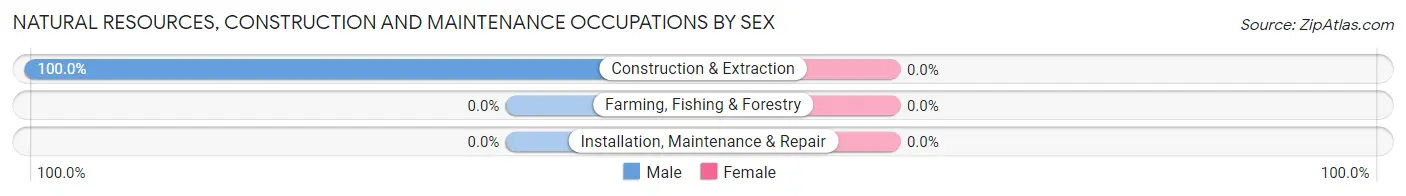
| Occupation | Male | Female |
| Farming, Fishing & Forestry | 0 (0.0%) | 0 (0.0%) |
| Construction & Extraction | 136 (100.0%) | 0 (0.0%) |
| Installation, Maintenance & Repair | 0 (0.0%) | 0 (0.0%) |
| Total (Category) | 136 (100.0%) | 0 (0.0%) |
| Total (Overall) | 2,018 (48.8%) | 2,115 (51.2%) |
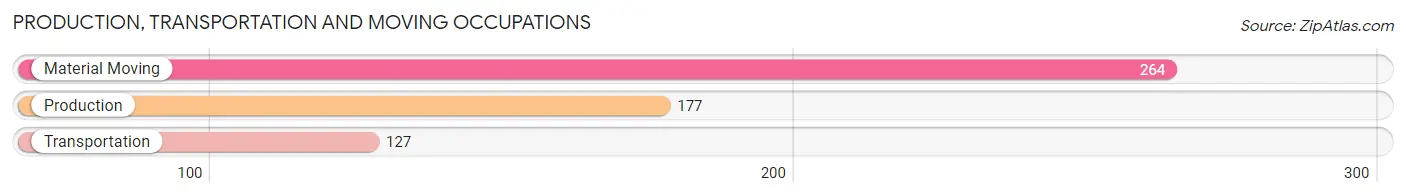
Production, Transportation and Moving Occupations
The most common Production, Transportation and Moving occupations in Abingdon are Material Moving (264 | 6.4%), Production (177 | 4.3%), and Transportation (127 | 3.1%).
Production, Transportation and Moving Occupations by Sex
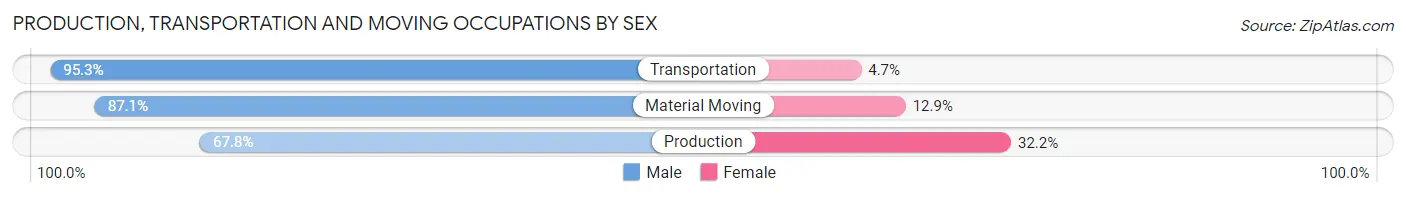
| Occupation | Male | Female |
| Production | 120 (67.8%) | 57 (32.2%) |
| Transportation | 121 (95.3%) | 6 (4.7%) |
| Material Moving | 230 (87.1%) | 34 (12.9%) |
| Total (Category) | 471 (82.9%) | 97 (17.1%) |
| Total (Overall) | 2,018 (48.8%) | 2,115 (51.2%) |
Employment Industries by Sex in Abingdon
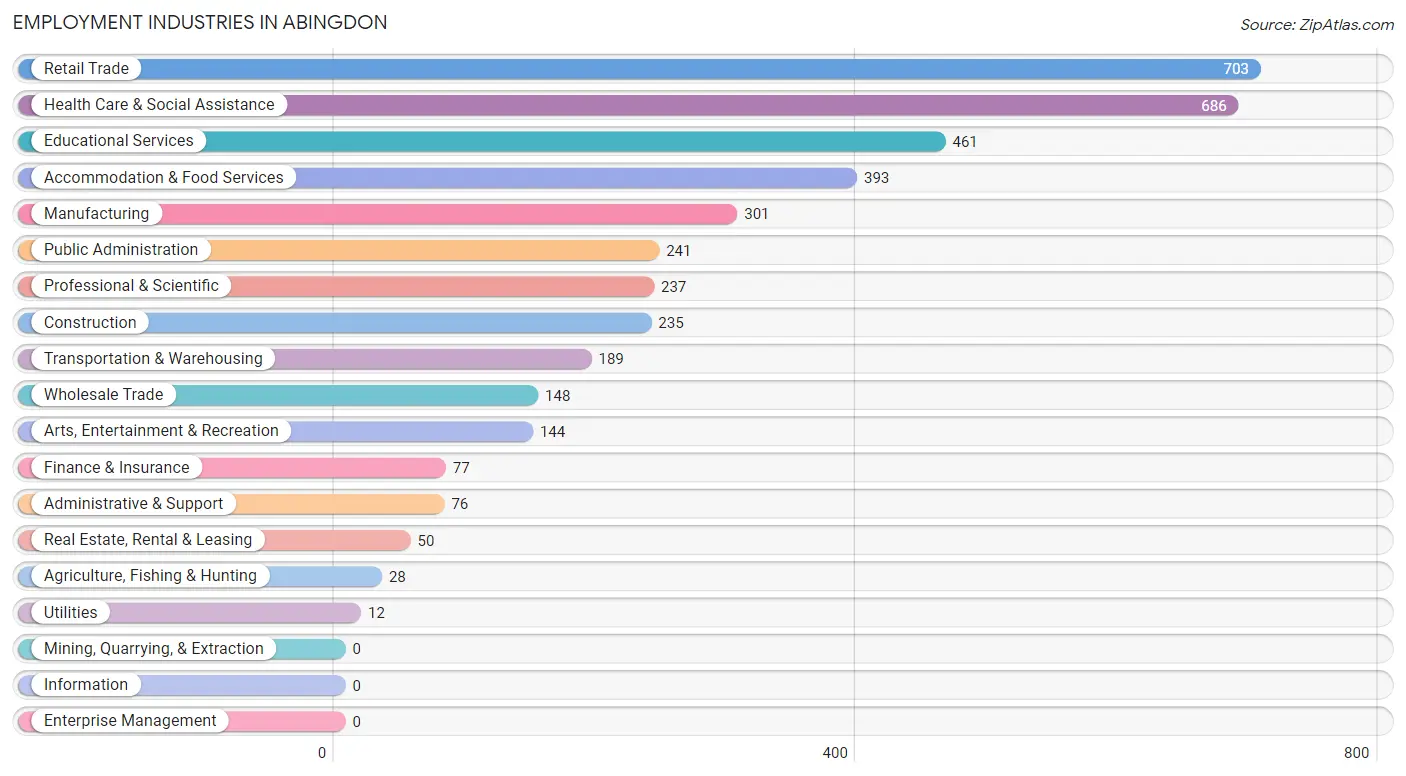
Employment Industries in Abingdon
The major employment industries in Abingdon include Retail Trade (703 | 17.0%), Health Care & Social Assistance (686 | 16.6%), Educational Services (461 | 11.2%), Accommodation & Food Services (393 | 9.5%), and Manufacturing (301 | 7.3%).
Employment Industries by Sex in Abingdon
The Abingdon industries that see more men than women are Agriculture, Fishing & Hunting (100.0%), Construction (100.0%), and Utilities (100.0%), whereas the industries that tend to have a higher number of women are Health Care & Social Assistance (80.3%), Educational Services (72.7%), and Administrative & Support (72.4%).
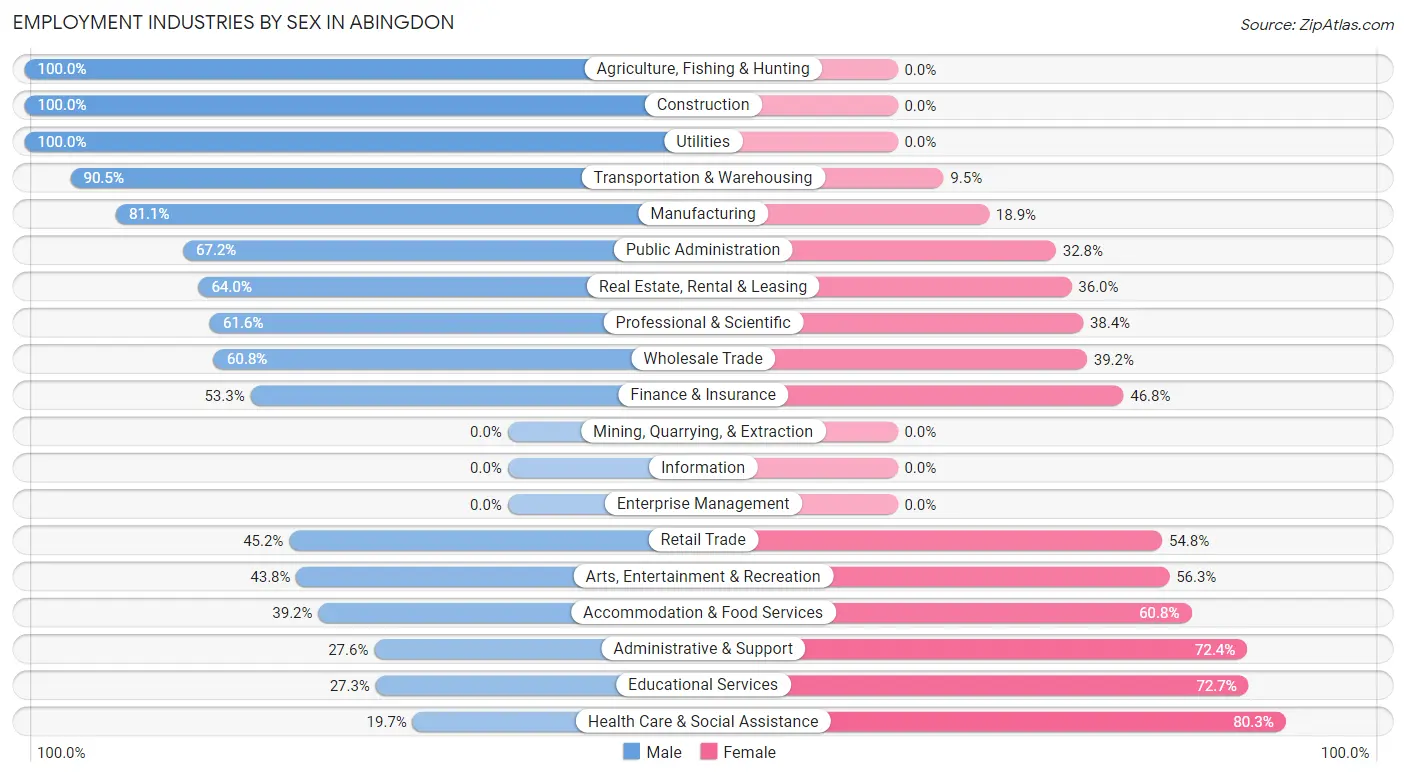
| Industry | Male | Female |
| Agriculture, Fishing & Hunting | 28 (100.0%) | 0 (0.0%) |
| Mining, Quarrying, & Extraction | 0 (0.0%) | 0 (0.0%) |
| Construction | 235 (100.0%) | 0 (0.0%) |
| Manufacturing | 244 (81.1%) | 57 (18.9%) |
| Wholesale Trade | 90 (60.8%) | 58 (39.2%) |
| Retail Trade | 318 (45.2%) | 385 (54.8%) |
| Transportation & Warehousing | 171 (90.5%) | 18 (9.5%) |
| Utilities | 12 (100.0%) | 0 (0.0%) |
| Information | 0 (0.0%) | 0 (0.0%) |
| Finance & Insurance | 41 (53.2%) | 36 (46.8%) |
| Real Estate, Rental & Leasing | 32 (64.0%) | 18 (36.0%) |
| Professional & Scientific | 146 (61.6%) | 91 (38.4%) |
| Enterprise Management | 0 (0.0%) | 0 (0.0%) |
| Administrative & Support | 21 (27.6%) | 55 (72.4%) |
| Educational Services | 126 (27.3%) | 335 (72.7%) |
| Health Care & Social Assistance | 135 (19.7%) | 551 (80.3%) |
| Arts, Entertainment & Recreation | 63 (43.8%) | 81 (56.2%) |
| Accommodation & Food Services | 154 (39.2%) | 239 (60.8%) |
| Public Administration | 162 (67.2%) | 79 (32.8%) |
| Total | 2,018 (48.8%) | 2,115 (51.2%) |
Education in Abingdon
School Enrollment in Abingdon
The most common levels of schooling among the 1,262 students in Abingdon are college / undergraduate (358 | 28.4%), middle school (284 | 22.5%), and high school (259 | 20.5%).
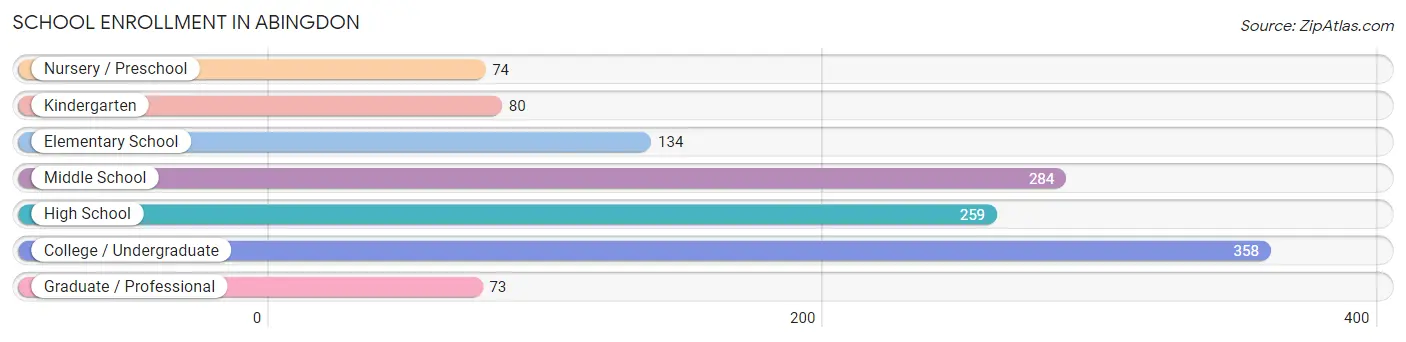
| School Level | # Students | % Students |
| Nursery / Preschool | 74 | 5.9% |
| Kindergarten | 80 | 6.3% |
| Elementary School | 134 | 10.6% |
| Middle School | 284 | 22.5% |
| High School | 259 | 20.5% |
| College / Undergraduate | 358 | 28.4% |
| Graduate / Professional | 73 | 5.8% |
| Total | 1,262 | 100.0% |
School Enrollment by Age by Funding Source in Abingdon
Out of a total of 1,262 students who are enrolled in schools in Abingdon, 259 (20.5%) attend a private institution, while the remaining 1,003 (79.5%) are enrolled in public schools. The age group of 3 to 4 year olds has the highest likelihood of being enrolled in private schools, with 33 (44.6% in the age bracket) enrolled. Conversely, the age group of 10 to 14 year olds has the lowest likelihood of being enrolled in a private school, with 305 (90.5% in the age bracket) attending a public institution.
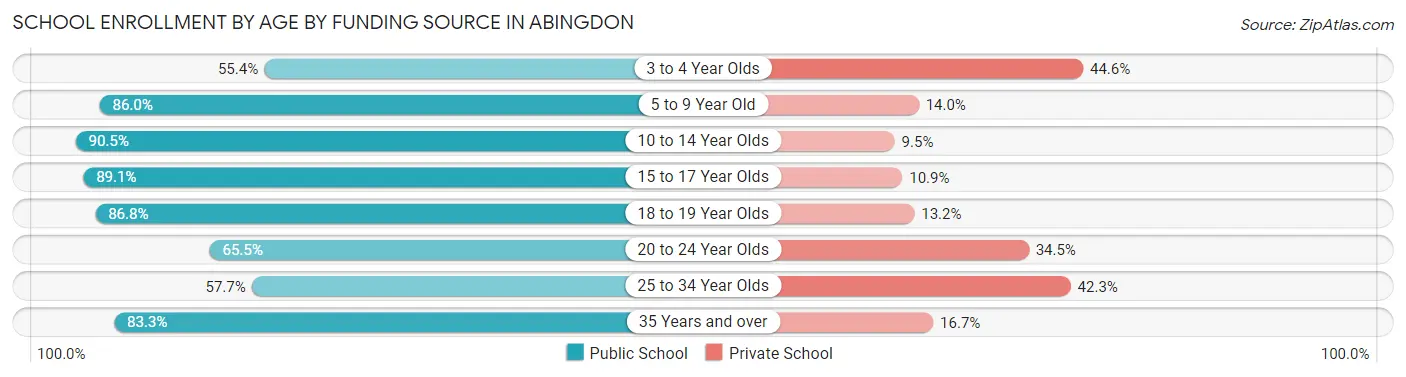
| Age Bracket | Public School | Private School |
| 3 to 4 Year Olds | 41 (55.4%) | 33 (44.6%) |
| 5 to 9 Year Old | 154 (86.0%) | 25 (14.0%) |
| 10 to 14 Year Olds | 305 (90.5%) | 32 (9.5%) |
| 15 to 17 Year Olds | 155 (89.1%) | 19 (10.9%) |
| 18 to 19 Year Olds | 66 (86.8%) | 10 (13.2%) |
| 20 to 24 Year Olds | 116 (65.5%) | 61 (34.5%) |
| 25 to 34 Year Olds | 86 (57.7%) | 63 (42.3%) |
| 35 Years and over | 80 (83.3%) | 16 (16.7%) |
| Total | 1,003 (79.5%) | 259 (20.5%) |
Educational Attainment by Field of Study in Abingdon
Business (553 | 20.0%), science & technology (362 | 13.1%), education (335 | 12.1%), literature & languages (241 | 8.7%), and psychology (196 | 7.1%) are the most common fields of study among 2,772 individuals in Abingdon who have obtained a bachelor's degree or higher.
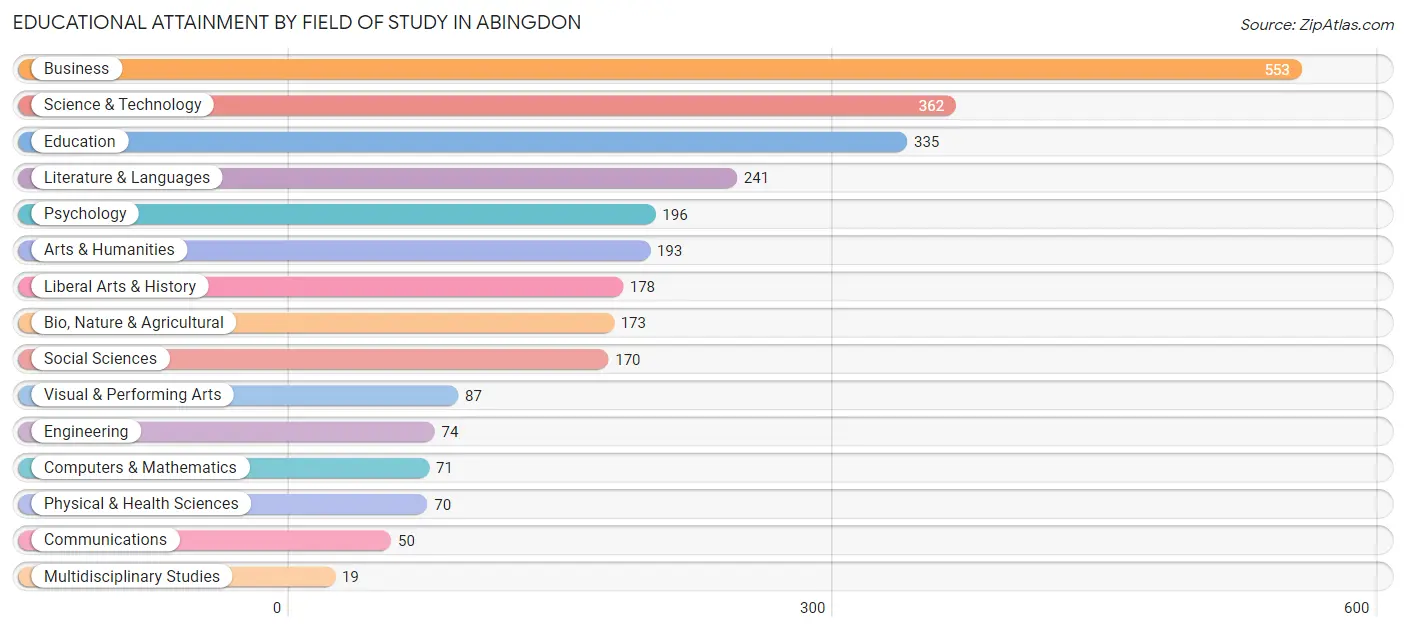
| Field of Study | # Graduates | % Graduates |
| Computers & Mathematics | 71 | 2.6% |
| Bio, Nature & Agricultural | 173 | 6.2% |
| Physical & Health Sciences | 70 | 2.5% |
| Psychology | 196 | 7.1% |
| Social Sciences | 170 | 6.1% |
| Engineering | 74 | 2.7% |
| Multidisciplinary Studies | 19 | 0.7% |
| Science & Technology | 362 | 13.1% |
| Business | 553 | 20.0% |
| Education | 335 | 12.1% |
| Literature & Languages | 241 | 8.7% |
| Liberal Arts & History | 178 | 6.4% |
| Visual & Performing Arts | 87 | 3.1% |
| Communications | 50 | 1.8% |
| Arts & Humanities | 193 | 7.0% |
| Total | 2,772 | 100.0% |
Transportation & Commute in Abingdon
Vehicle Availability by Sex in Abingdon
The most prevalent vehicle ownership categories in Abingdon are males with 2 vehicles (1,056, accounting for 53.1%) and females with 2 vehicles (865, making up 49.9%).
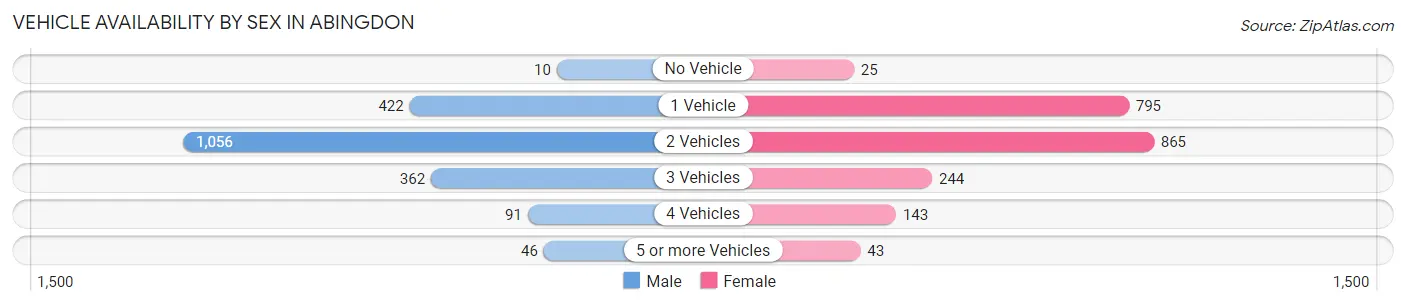
| Vehicles Available | Male | Female |
| No Vehicle | 10 (0.5%) | 25 (1.2%) |
| 1 Vehicle | 422 (21.2%) | 795 (37.6%) |
| 2 Vehicles | 1,056 (53.1%) | 865 (40.9%) |
| 3 Vehicles | 362 (18.2%) | 244 (11.5%) |
| 4 Vehicles | 91 (4.6%) | 143 (6.8%) |
| 5 or more Vehicles | 46 (2.3%) | 43 (2.0%) |
| Total | 1,987 (100.0%) | 2,115 (100.0%) |
Commute Time in Abingdon
The most frequently occuring commute durations in Abingdon are 5 to 9 minutes (986 commuters, 25.7%), 10 to 14 minutes (745 commuters, 19.5%), and 15 to 19 minutes (594 commuters, 15.5%).
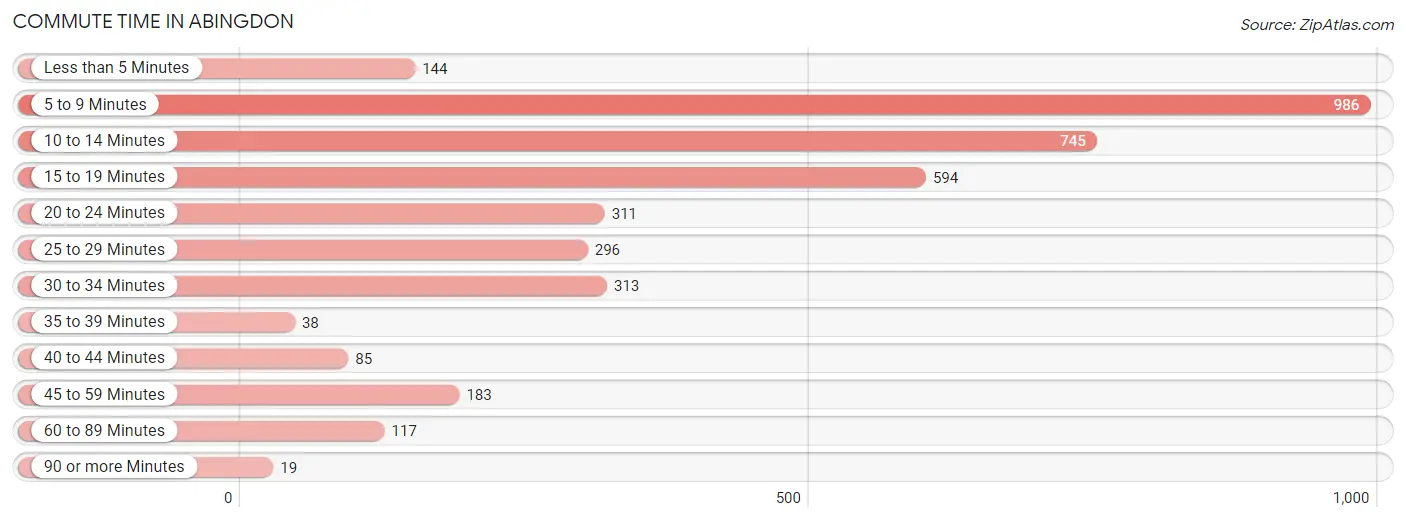
| Commute Time | # Commuters | % Commuters |
| Less than 5 Minutes | 144 | 3.8% |
| 5 to 9 Minutes | 986 | 25.7% |
| 10 to 14 Minutes | 745 | 19.5% |
| 15 to 19 Minutes | 594 | 15.5% |
| 20 to 24 Minutes | 311 | 8.1% |
| 25 to 29 Minutes | 296 | 7.7% |
| 30 to 34 Minutes | 313 | 8.2% |
| 35 to 39 Minutes | 38 | 1.0% |
| 40 to 44 Minutes | 85 | 2.2% |
| 45 to 59 Minutes | 183 | 4.8% |
| 60 to 89 Minutes | 117 | 3.0% |
| 90 or more Minutes | 19 | 0.5% |
Commute Time by Sex in Abingdon
The most common commute times in Abingdon are 5 to 9 minutes (615 commuters, 32.6%) for males and 5 to 9 minutes (371 commuters, 19.1%) for females.
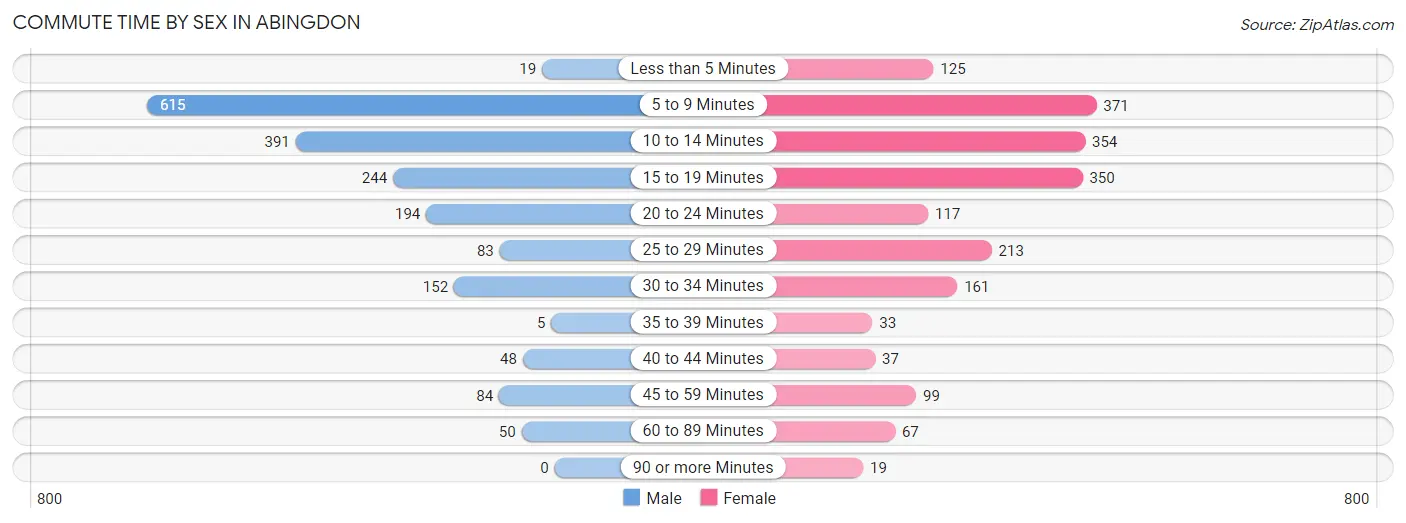
| Commute Time | Male | Female |
| Less than 5 Minutes | 19 (1.0%) | 125 (6.4%) |
| 5 to 9 Minutes | 615 (32.6%) | 371 (19.1%) |
| 10 to 14 Minutes | 391 (20.7%) | 354 (18.2%) |
| 15 to 19 Minutes | 244 (12.9%) | 350 (18.0%) |
| 20 to 24 Minutes | 194 (10.3%) | 117 (6.0%) |
| 25 to 29 Minutes | 83 (4.4%) | 213 (11.0%) |
| 30 to 34 Minutes | 152 (8.1%) | 161 (8.3%) |
| 35 to 39 Minutes | 5 (0.3%) | 33 (1.7%) |
| 40 to 44 Minutes | 48 (2.5%) | 37 (1.9%) |
| 45 to 59 Minutes | 84 (4.5%) | 99 (5.1%) |
| 60 to 89 Minutes | 50 (2.6%) | 67 (3.4%) |
| 90 or more Minutes | 0 (0.0%) | 19 (1.0%) |
Time of Departure to Work by Sex in Abingdon
The most frequent times of departure to work in Abingdon are 4:00 PM to 11:59 PM (249, 13.2%) for males and 7:30 AM to 7:59 AM (407, 20.9%) for females.
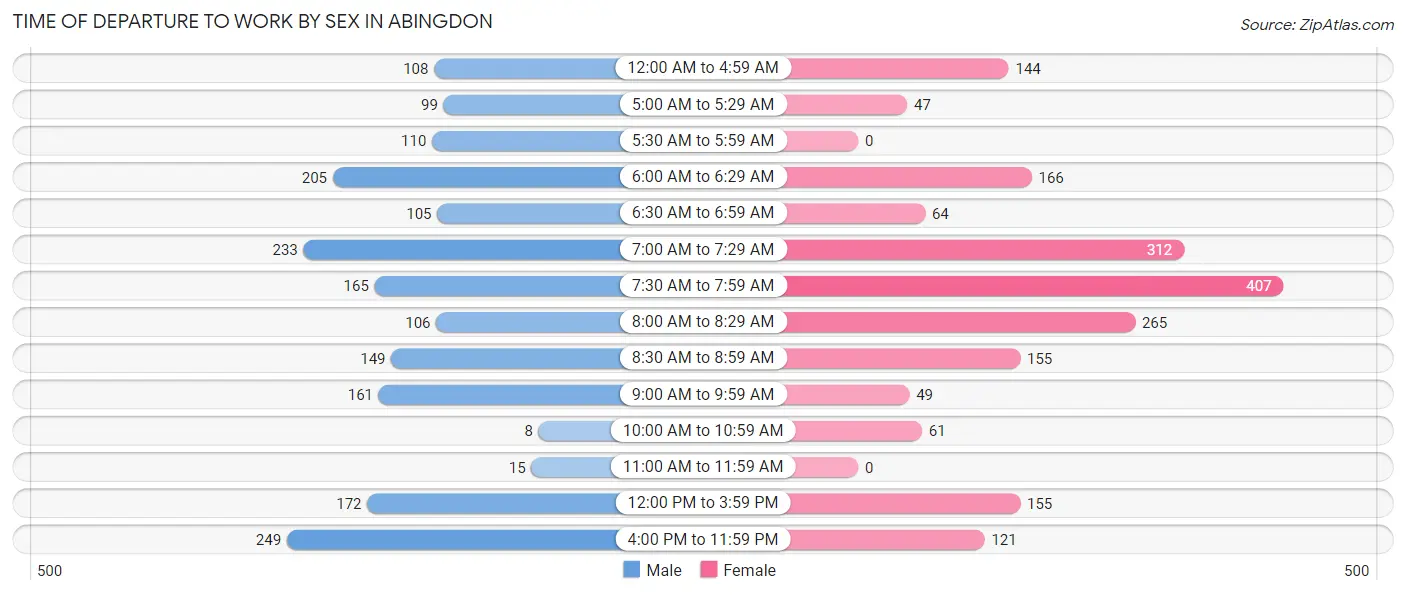
| Time of Departure | Male | Female |
| 12:00 AM to 4:59 AM | 108 (5.7%) | 144 (7.4%) |
| 5:00 AM to 5:29 AM | 99 (5.2%) | 47 (2.4%) |
| 5:30 AM to 5:59 AM | 110 (5.8%) | 0 (0.0%) |
| 6:00 AM to 6:29 AM | 205 (10.9%) | 166 (8.5%) |
| 6:30 AM to 6:59 AM | 105 (5.6%) | 64 (3.3%) |
| 7:00 AM to 7:29 AM | 233 (12.4%) | 312 (16.0%) |
| 7:30 AM to 7:59 AM | 165 (8.7%) | 407 (20.9%) |
| 8:00 AM to 8:29 AM | 106 (5.6%) | 265 (13.6%) |
| 8:30 AM to 8:59 AM | 149 (7.9%) | 155 (8.0%) |
| 9:00 AM to 9:59 AM | 161 (8.5%) | 49 (2.5%) |
| 10:00 AM to 10:59 AM | 8 (0.4%) | 61 (3.1%) |
| 11:00 AM to 11:59 AM | 15 (0.8%) | 0 (0.0%) |
| 12:00 PM to 3:59 PM | 172 (9.1%) | 155 (8.0%) |
| 4:00 PM to 11:59 PM | 249 (13.2%) | 121 (6.2%) |
| Total | 1,885 (100.0%) | 1,946 (100.0%) |
Housing Occupancy in Abingdon
Occupancy by Ownership in Abingdon
Of the total 4,122 dwellings in Abingdon, owner-occupied units account for 2,252 (54.6%), while renter-occupied units make up 1,870 (45.4%).
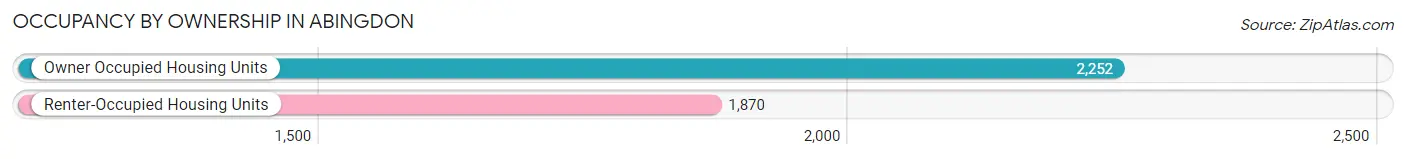
| Occupancy | # Housing Units | % Housing Units |
| Owner Occupied Housing Units | 2,252 | 54.6% |
| Renter-Occupied Housing Units | 1,870 | 45.4% |
| Total Occupied Housing Units | 4,122 | 100.0% |
Occupancy by Household Size in Abingdon
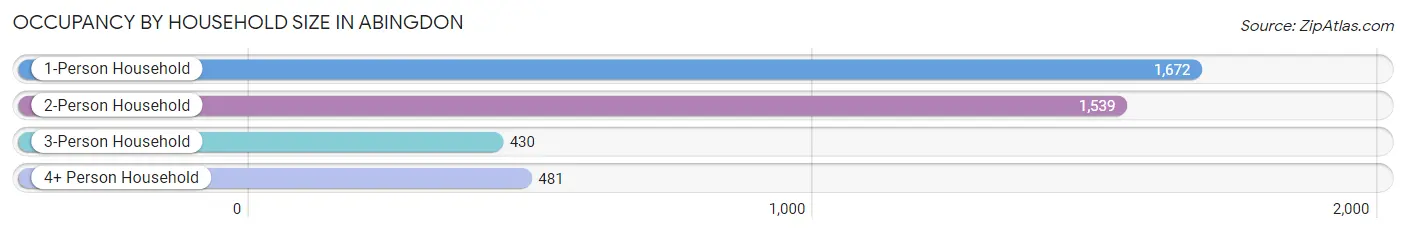
| Household Size | # Housing Units | % Housing Units |
| 1-Person Household | 1,672 | 40.6% |
| 2-Person Household | 1,539 | 37.3% |
| 3-Person Household | 430 | 10.4% |
| 4+ Person Household | 481 | 11.7% |
| Total Housing Units | 4,122 | 100.0% |
Occupancy by Ownership by Household Size in Abingdon
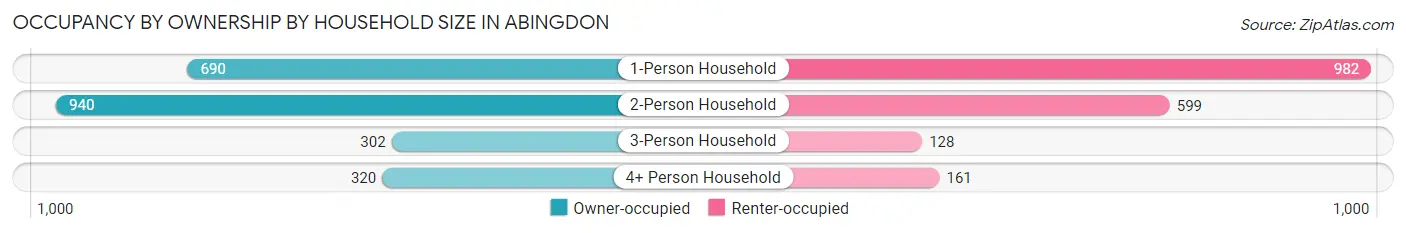
| Household Size | Owner-occupied | Renter-occupied |
| 1-Person Household | 690 (41.3%) | 982 (58.7%) |
| 2-Person Household | 940 (61.1%) | 599 (38.9%) |
| 3-Person Household | 302 (70.2%) | 128 (29.8%) |
| 4+ Person Household | 320 (66.5%) | 161 (33.5%) |
| Total Housing Units | 2,252 (54.6%) | 1,870 (45.4%) |
Occupancy by Educational Attainment in Abingdon
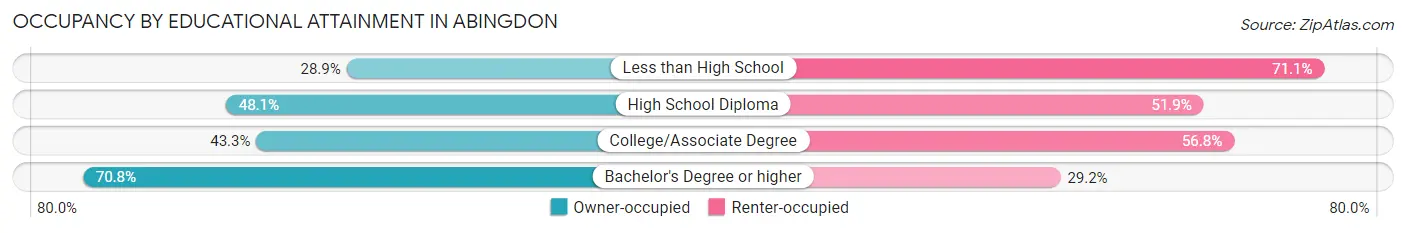
| Household Size | Owner-occupied | Renter-occupied |
| Less than High School | 81 (28.9%) | 199 (71.1%) |
| High School Diploma | 401 (48.1%) | 433 (51.9%) |
| College/Associate Degree | 564 (43.2%) | 740 (56.8%) |
| Bachelor's Degree or higher | 1,206 (70.8%) | 498 (29.2%) |
Occupancy by Age of Householder in Abingdon
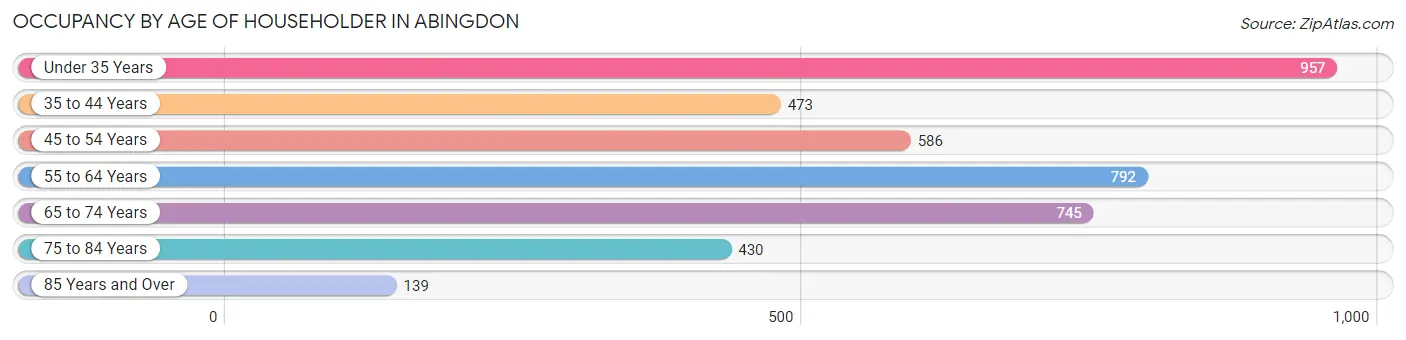
| Age Bracket | # Households | % Households |
| Under 35 Years | 957 | 23.2% |
| 35 to 44 Years | 473 | 11.5% |
| 45 to 54 Years | 586 | 14.2% |
| 55 to 64 Years | 792 | 19.2% |
| 65 to 74 Years | 745 | 18.1% |
| 75 to 84 Years | 430 | 10.4% |
| 85 Years and Over | 139 | 3.4% |
| Total | 4,122 | 100.0% |
Housing Finances in Abingdon
Median Income by Occupancy in Abingdon
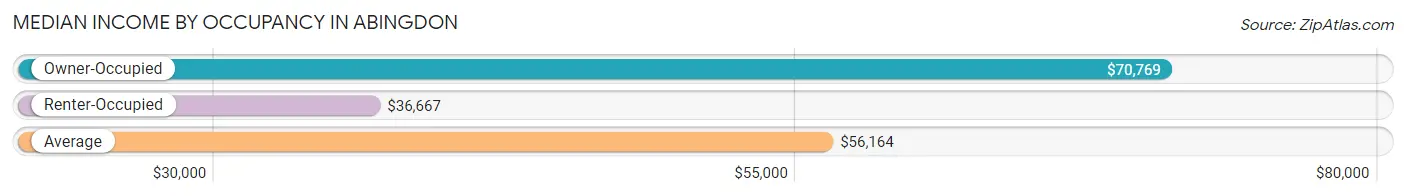
| Occupancy Type | # Households | Median Income |
| Owner-Occupied | 2,252 (54.6%) | $70,769 |
| Renter-Occupied | 1,870 (45.4%) | $36,667 |
| Average | 4,122 (100.0%) | $56,164 |
Occupancy by Householder Income Bracket in Abingdon
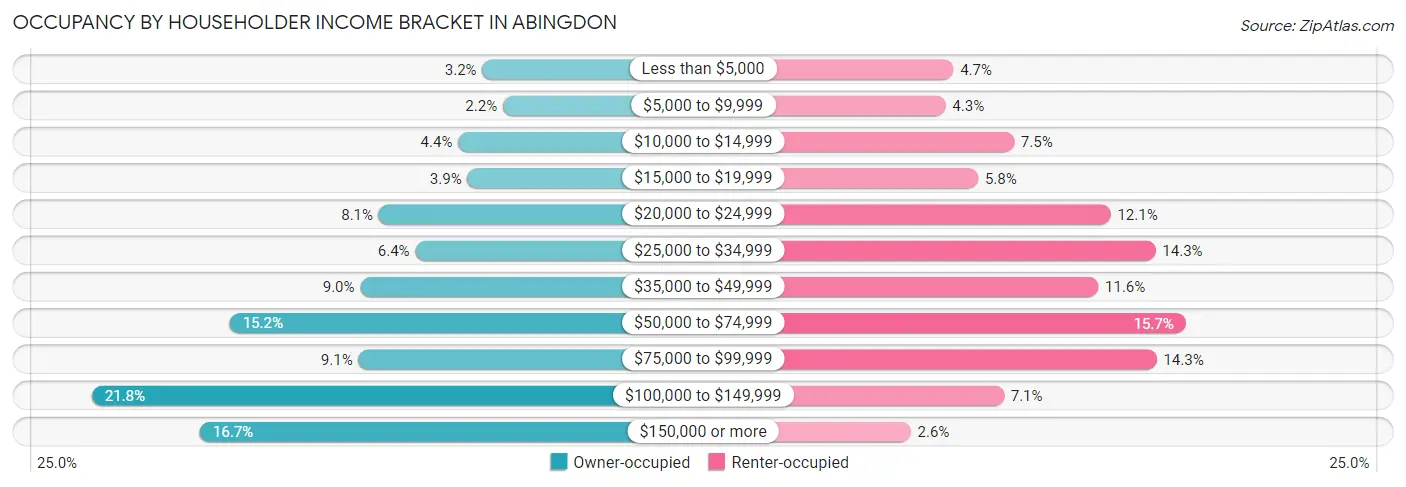
| Income Bracket | Owner-occupied | Renter-occupied |
| Less than $5,000 | 72 (3.2%) | 87 (4.6%) |
| $5,000 to $9,999 | 50 (2.2%) | 80 (4.3%) |
| $10,000 to $14,999 | 98 (4.3%) | 141 (7.5%) |
| $15,000 to $19,999 | 88 (3.9%) | 109 (5.8%) |
| $20,000 to $24,999 | 183 (8.1%) | 227 (12.1%) |
| $25,000 to $34,999 | 144 (6.4%) | 267 (14.3%) |
| $35,000 to $49,999 | 203 (9.0%) | 216 (11.6%) |
| $50,000 to $74,999 | 343 (15.2%) | 294 (15.7%) |
| $75,000 to $99,999 | 205 (9.1%) | 268 (14.3%) |
| $100,000 to $149,999 | 491 (21.8%) | 132 (7.1%) |
| $150,000 or more | 375 (16.7%) | 49 (2.6%) |
| Total | 2,252 (100.0%) | 1,870 (100.0%) |
Monthly Housing Cost Tiers in Abingdon
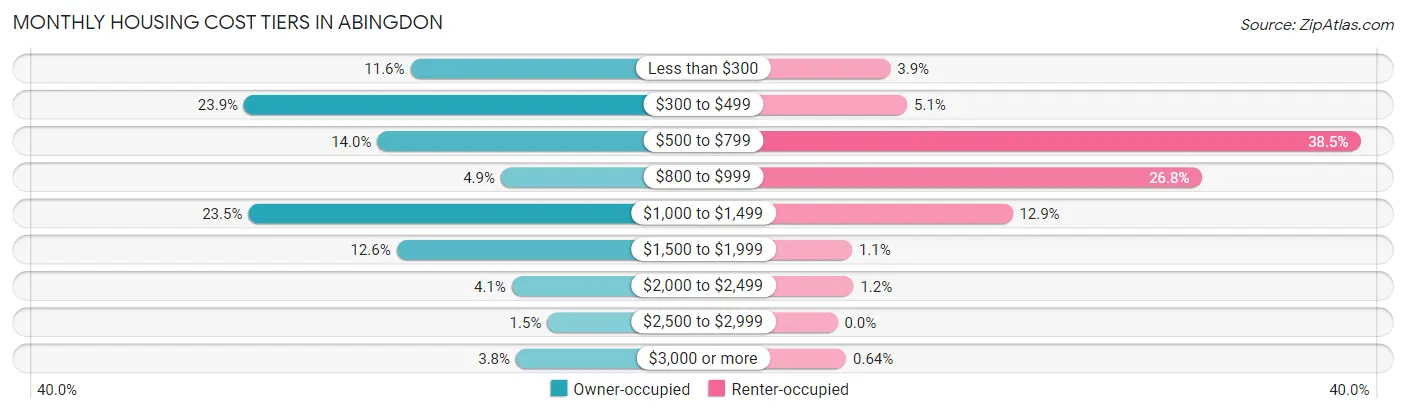
| Monthly Cost | Owner-occupied | Renter-occupied |
| Less than $300 | 261 (11.6%) | 73 (3.9%) |
| $300 to $499 | 537 (23.8%) | 96 (5.1%) |
| $500 to $799 | 316 (14.0%) | 720 (38.5%) |
| $800 to $999 | 111 (4.9%) | 501 (26.8%) |
| $1,000 to $1,499 | 530 (23.5%) | 241 (12.9%) |
| $1,500 to $1,999 | 284 (12.6%) | 20 (1.1%) |
| $2,000 to $2,499 | 93 (4.1%) | 22 (1.2%) |
| $2,500 to $2,999 | 34 (1.5%) | 0 (0.0%) |
| $3,000 or more | 86 (3.8%) | 12 (0.6%) |
| Total | 2,252 (100.0%) | 1,870 (100.0%) |
Physical Housing Characteristics in Abingdon
Housing Structures in Abingdon
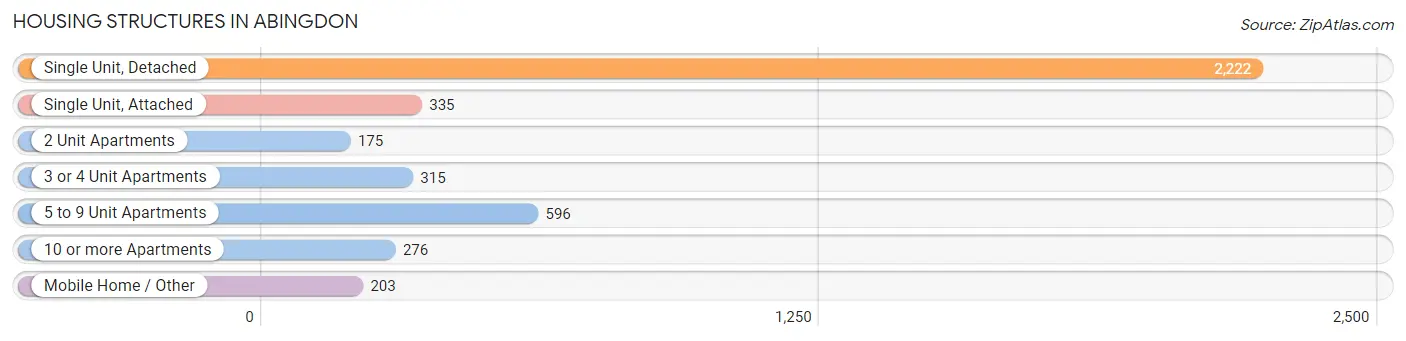
| Structure Type | # Housing Units | % Housing Units |
| Single Unit, Detached | 2,222 | 53.9% |
| Single Unit, Attached | 335 | 8.1% |
| 2 Unit Apartments | 175 | 4.3% |
| 3 or 4 Unit Apartments | 315 | 7.6% |
| 5 to 9 Unit Apartments | 596 | 14.5% |
| 10 or more Apartments | 276 | 6.7% |
| Mobile Home / Other | 203 | 4.9% |
| Total | 4,122 | 100.0% |
Housing Structures by Occupancy in Abingdon
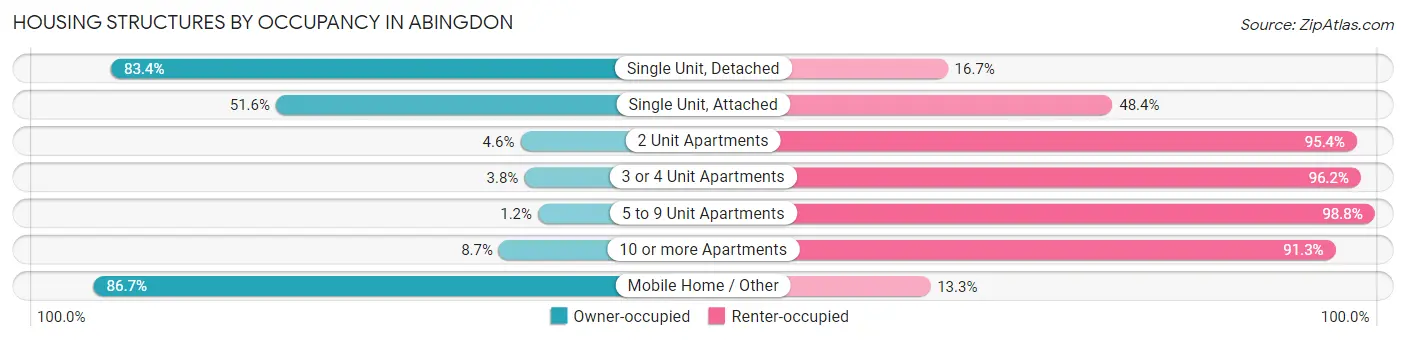
| Structure Type | Owner-occupied | Renter-occupied |
| Single Unit, Detached | 1,852 (83.4%) | 370 (16.7%) |
| Single Unit, Attached | 173 (51.6%) | 162 (48.4%) |
| 2 Unit Apartments | 8 (4.6%) | 167 (95.4%) |
| 3 or 4 Unit Apartments | 12 (3.8%) | 303 (96.2%) |
| 5 to 9 Unit Apartments | 7 (1.2%) | 589 (98.8%) |
| 10 or more Apartments | 24 (8.7%) | 252 (91.3%) |
| Mobile Home / Other | 176 (86.7%) | 27 (13.3%) |
| Total | 2,252 (54.6%) | 1,870 (45.4%) |
Housing Structures by Number of Rooms in Abingdon
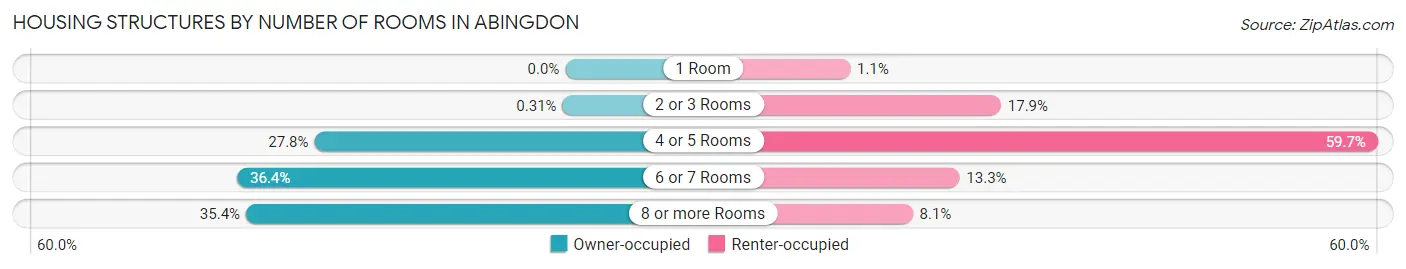
| Number of Rooms | Owner-occupied | Renter-occupied |
| 1 Room | 0 (0.0%) | 21 (1.1%) |
| 2 or 3 Rooms | 7 (0.3%) | 334 (17.9%) |
| 4 or 5 Rooms | 627 (27.8%) | 1,116 (59.7%) |
| 6 or 7 Rooms | 820 (36.4%) | 248 (13.3%) |
| 8 or more Rooms | 798 (35.4%) | 151 (8.1%) |
| Total | 2,252 (100.0%) | 1,870 (100.0%) |
Housing Structure by Heating Type in Abingdon
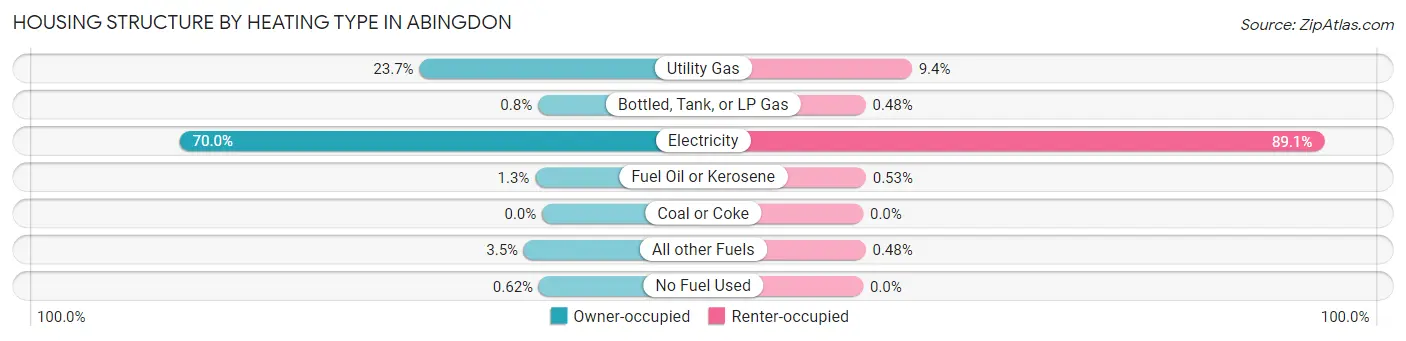
| Heating Type | Owner-occupied | Renter-occupied |
| Utility Gas | 534 (23.7%) | 176 (9.4%) |
| Bottled, Tank, or LP Gas | 18 (0.8%) | 9 (0.5%) |
| Electricity | 1,577 (70.0%) | 1,666 (89.1%) |
| Fuel Oil or Kerosene | 30 (1.3%) | 10 (0.5%) |
| Coal or Coke | 0 (0.0%) | 0 (0.0%) |
| All other Fuels | 79 (3.5%) | 9 (0.5%) |
| No Fuel Used | 14 (0.6%) | 0 (0.0%) |
| Total | 2,252 (100.0%) | 1,870 (100.0%) |
Household Vehicle Usage in Abingdon
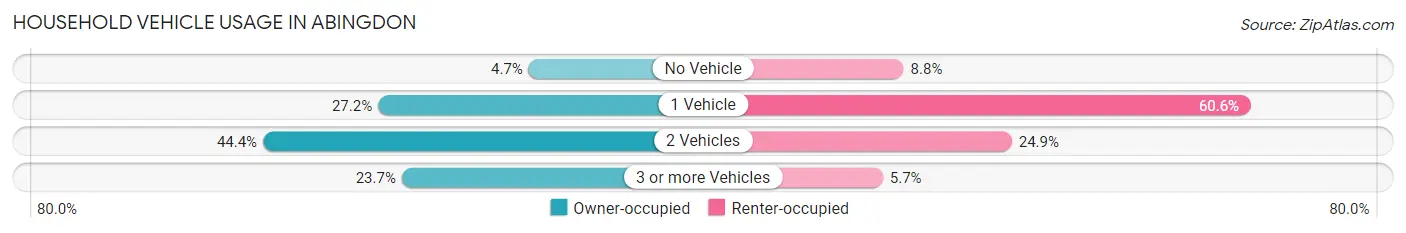
| Vehicles per Household | Owner-occupied | Renter-occupied |
| No Vehicle | 106 (4.7%) | 164 (8.8%) |
| 1 Vehicle | 613 (27.2%) | 1,134 (60.6%) |
| 2 Vehicles | 1,000 (44.4%) | 466 (24.9%) |
| 3 or more Vehicles | 533 (23.7%) | 106 (5.7%) |
| Total | 2,252 (100.0%) | 1,870 (100.0%) |
Real Estate & Mortgages in Abingdon
Real Estate and Mortgage Overview in Abingdon
| Characteristic | Without Mortgage | With Mortgage |
| Housing Units | 1,095 | 1,157 |
| Median Property Value | $183,000 | $234,100 |
| Median Household Income | $55,433 | $247 |
| Monthly Housing Costs | $420 | $86 |
| Real Estate Taxes | $1,414 | $10 |
Property Value by Mortgage Status in Abingdon
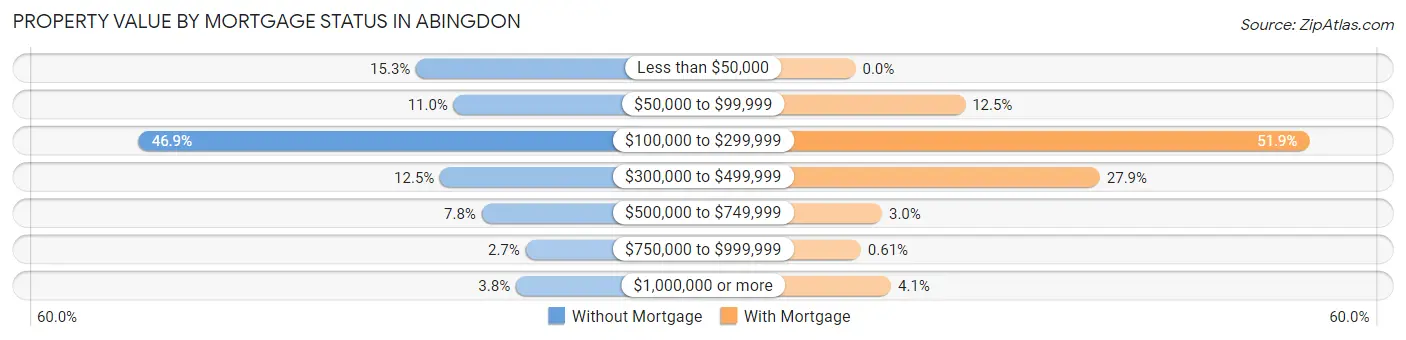
| Property Value | Without Mortgage | With Mortgage |
| Less than $50,000 | 167 (15.2%) | 0 (0.0%) |
| $50,000 to $99,999 | 120 (11.0%) | 145 (12.5%) |
| $100,000 to $299,999 | 514 (46.9%) | 600 (51.9%) |
| $300,000 to $499,999 | 137 (12.5%) | 323 (27.9%) |
| $500,000 to $749,999 | 85 (7.8%) | 35 (3.0%) |
| $750,000 to $999,999 | 30 (2.7%) | 7 (0.6%) |
| $1,000,000 or more | 42 (3.8%) | 47 (4.1%) |
| Total | 1,095 (100.0%) | 1,157 (100.0%) |
Household Income by Mortgage Status in Abingdon
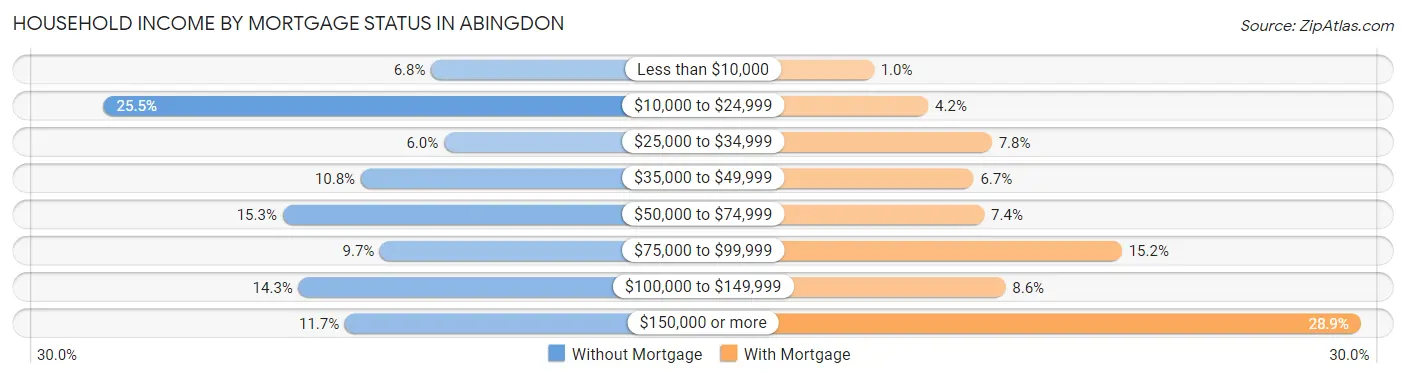
| Household Income | Without Mortgage | With Mortgage |
| Less than $10,000 | 74 (6.8%) | 12 (1.0%) |
| $10,000 to $24,999 | 279 (25.5%) | 48 (4.2%) |
| $25,000 to $34,999 | 66 (6.0%) | 90 (7.8%) |
| $35,000 to $49,999 | 118 (10.8%) | 78 (6.7%) |
| $50,000 to $74,999 | 167 (15.2%) | 85 (7.3%) |
| $75,000 to $99,999 | 106 (9.7%) | 176 (15.2%) |
| $100,000 to $149,999 | 157 (14.3%) | 99 (8.6%) |
| $150,000 or more | 128 (11.7%) | 334 (28.9%) |
| Total | 1,095 (100.0%) | 1,157 (100.0%) |
Property Value to Household Income Ratio in Abingdon
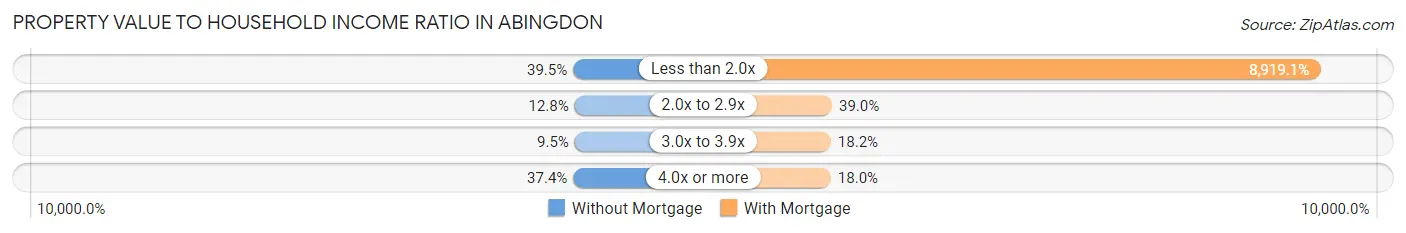
| Value-to-Income Ratio | Without Mortgage | With Mortgage |
| Less than 2.0x | 432 (39.5%) | 103,194 (8,919.1%) |
| 2.0x to 2.9x | 140 (12.8%) | 451 (39.0%) |
| 3.0x to 3.9x | 104 (9.5%) | 210 (18.1%) |
| 4.0x or more | 409 (37.3%) | 208 (18.0%) |
| Total | 1,095 (100.0%) | 1,157 (100.0%) |
Real Estate Taxes by Mortgage Status in Abingdon
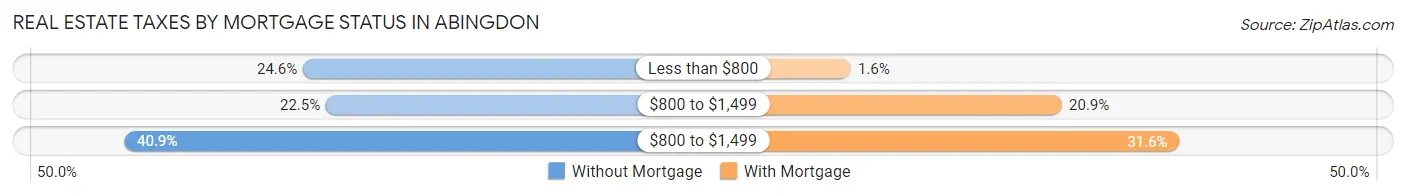
| Property Taxes | Without Mortgage | With Mortgage |
| Less than $800 | 269 (24.6%) | 19 (1.6%) |
| $800 to $1,499 | 246 (22.5%) | 242 (20.9%) |
| $800 to $1,499 | 448 (40.9%) | 366 (31.6%) |
| Total | 1,095 (100.0%) | 1,157 (100.0%) |
Health & Disability in Abingdon
Health Insurance Coverage by Age in Abingdon
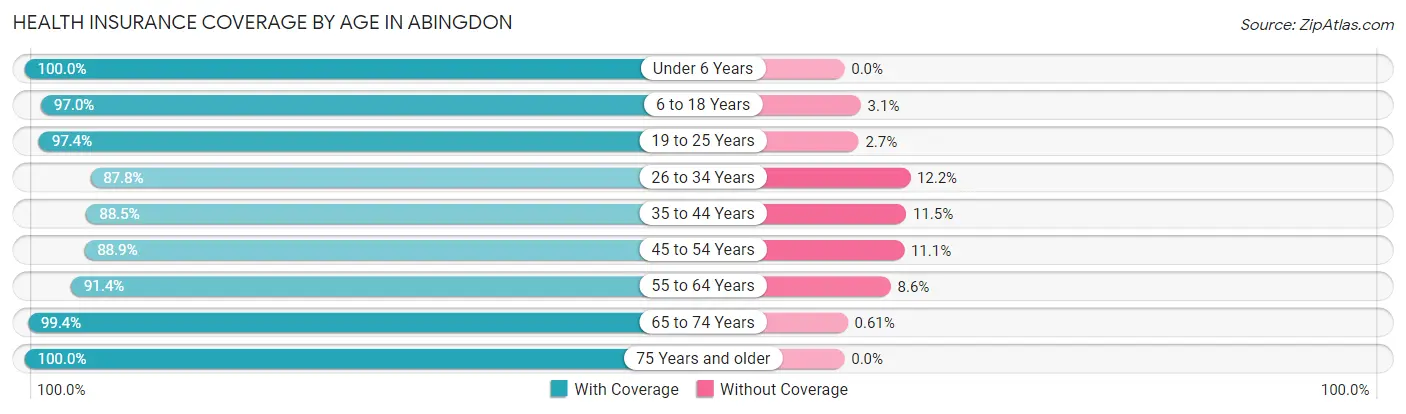
| Age Bracket | With Coverage | Without Coverage |
| Under 6 Years | 383 (100.0%) | 0 (0.0%) |
| 6 to 18 Years | 859 (97.0%) | 27 (3.0%) |
| 19 to 25 Years | 661 (97.4%) | 18 (2.6%) |
| 26 to 34 Years | 1,054 (87.8%) | 147 (12.2%) |
| 35 to 44 Years | 784 (88.5%) | 102 (11.5%) |
| 45 to 54 Years | 990 (88.9%) | 124 (11.1%) |
| 55 to 64 Years | 1,057 (91.4%) | 100 (8.6%) |
| 65 to 74 Years | 1,148 (99.4%) | 7 (0.6%) |
| 75 Years and older | 774 (100.0%) | 0 (0.0%) |
| Total | 7,710 (93.6%) | 525 (6.4%) |
Health Insurance Coverage by Citizenship Status in Abingdon
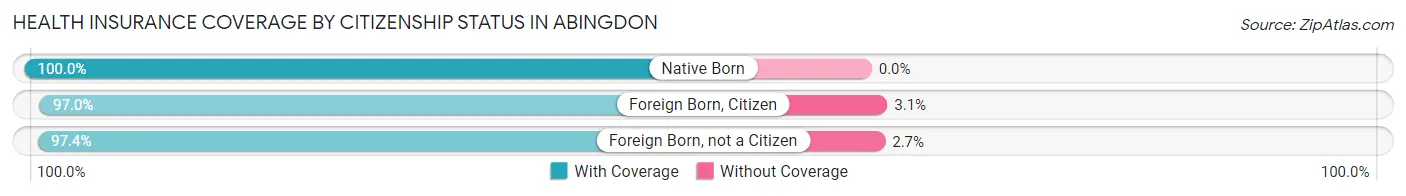
| Citizenship Status | With Coverage | Without Coverage |
| Native Born | 383 (100.0%) | 0 (0.0%) |
| Foreign Born, Citizen | 859 (97.0%) | 27 (3.0%) |
| Foreign Born, not a Citizen | 661 (97.4%) | 18 (2.6%) |
Health Insurance Coverage by Household Income in Abingdon
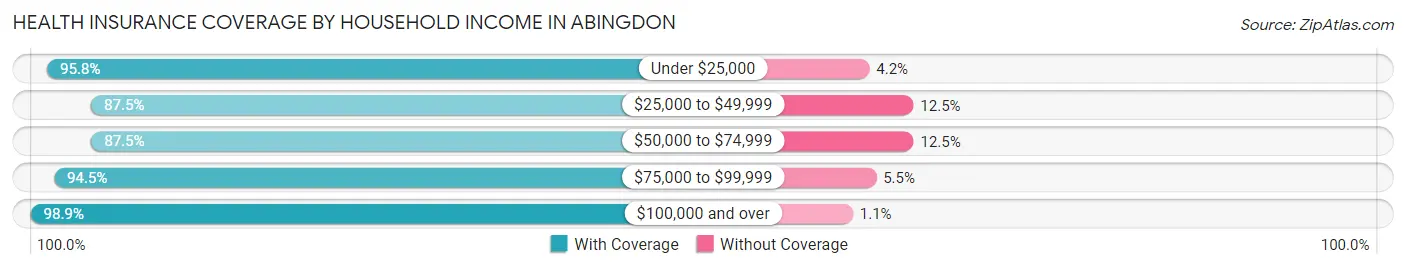
| Household Income | With Coverage | Without Coverage |
| Under $25,000 | 1,517 (95.8%) | 67 (4.2%) |
| $25,000 to $49,999 | 1,248 (87.5%) | 178 (12.5%) |
| $50,000 to $74,999 | 1,225 (87.5%) | 175 (12.5%) |
| $75,000 to $99,999 | 841 (94.5%) | 49 (5.5%) |
| $100,000 and over | 2,805 (98.9%) | 32 (1.1%) |
Public vs Private Health Insurance Coverage by Age in Abingdon
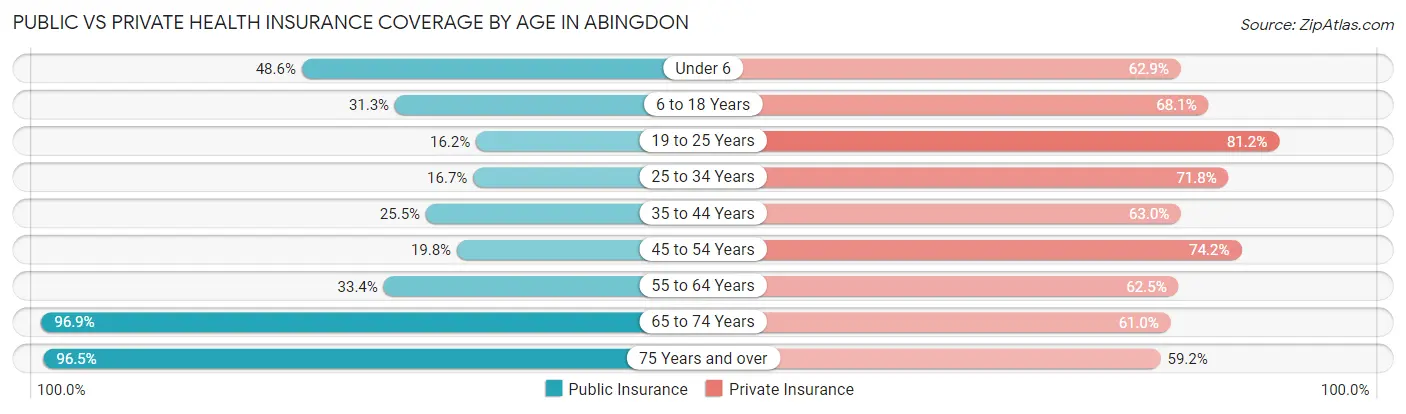
| Age Bracket | Public Insurance | Private Insurance |
| Under 6 | 186 (48.6%) | 241 (62.9%) |
| 6 to 18 Years | 277 (31.3%) | 603 (68.1%) |
| 19 to 25 Years | 110 (16.2%) | 551 (81.1%) |
| 25 to 34 Years | 201 (16.7%) | 862 (71.8%) |
| 35 to 44 Years | 226 (25.5%) | 558 (63.0%) |
| 45 to 54 Years | 220 (19.8%) | 826 (74.2%) |
| 55 to 64 Years | 386 (33.4%) | 723 (62.5%) |
| 65 to 74 Years | 1,119 (96.9%) | 705 (61.0%) |
| 75 Years and over | 747 (96.5%) | 458 (59.2%) |
| Total | 3,472 (42.2%) | 5,527 (67.1%) |
Disability Status by Sex by Age in Abingdon
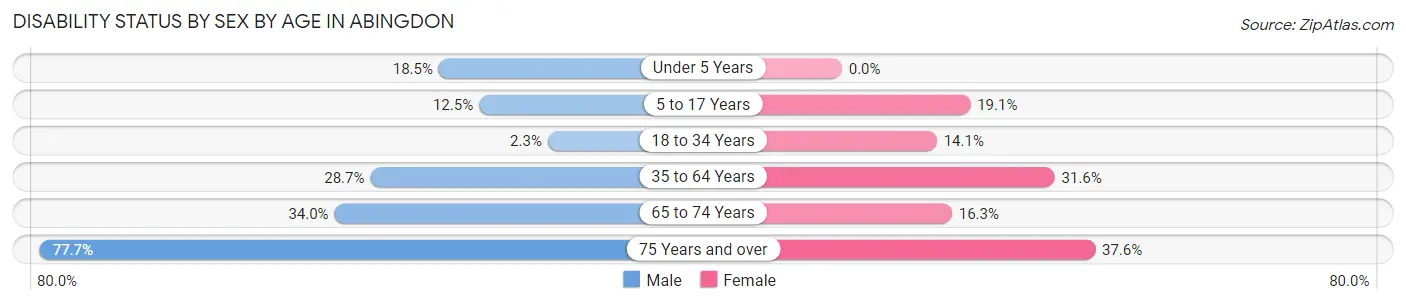
| Age Bracket | Male | Female |
| Under 5 Years | 27 (18.5%) | 0 (0.0%) |
| 5 to 17 Years | 62 (12.5%) | 70 (19.1%) |
| 18 to 34 Years | 23 (2.3%) | 142 (14.1%) |
| 35 to 64 Years | 436 (28.7%) | 517 (31.6%) |
| 65 to 74 Years | 224 (34.0%) | 81 (16.3%) |
| 75 Years and over | 213 (77.7%) | 188 (37.6%) |
Disability Class by Sex by Age in Abingdon
Disability Class: Hearing Difficulty
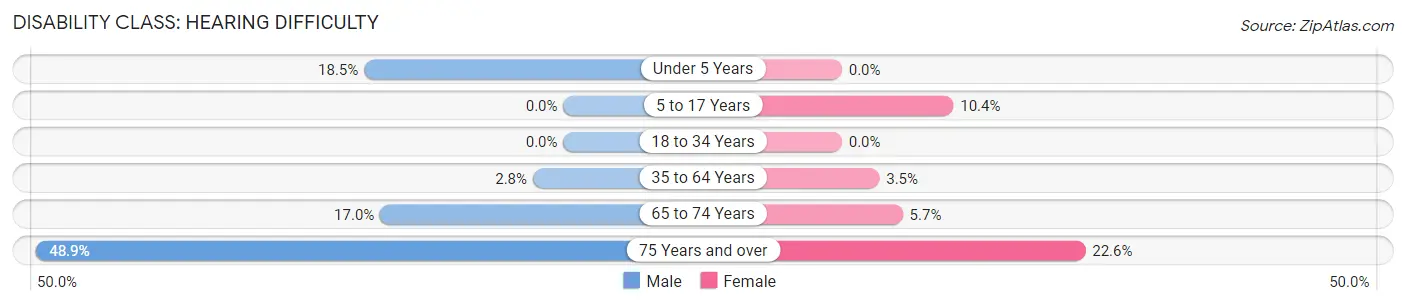
| Age Bracket | Male | Female |
| Under 5 Years | 27 (18.5%) | 0 (0.0%) |
| 5 to 17 Years | 0 (0.0%) | 38 (10.3%) |
| 18 to 34 Years | 0 (0.0%) | 0 (0.0%) |
| 35 to 64 Years | 43 (2.8%) | 57 (3.5%) |
| 65 to 74 Years | 112 (17.0%) | 28 (5.7%) |
| 75 Years and over | 134 (48.9%) | 113 (22.6%) |
Disability Class: Vision Difficulty
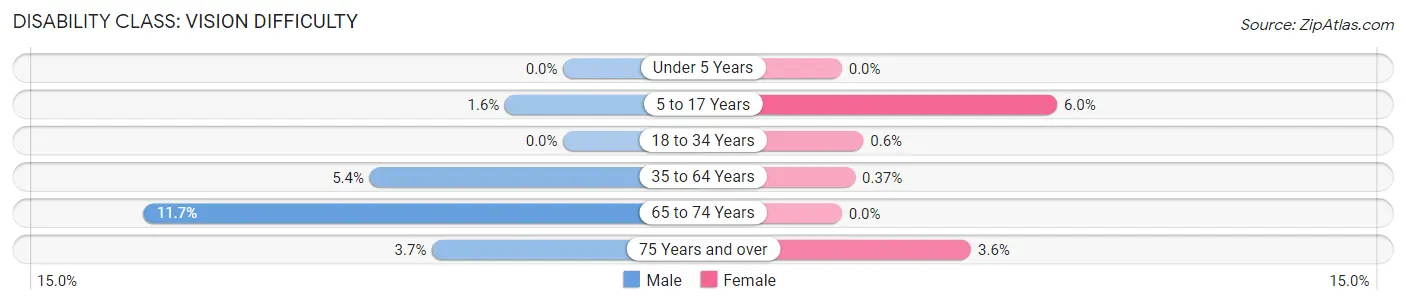
| Age Bracket | Male | Female |
| Under 5 Years | 0 (0.0%) | 0 (0.0%) |
| 5 to 17 Years | 8 (1.6%) | 22 (6.0%) |
| 18 to 34 Years | 0 (0.0%) | 6 (0.6%) |
| 35 to 64 Years | 82 (5.4%) | 6 (0.4%) |
| 65 to 74 Years | 77 (11.7%) | 0 (0.0%) |
| 75 Years and over | 10 (3.6%) | 18 (3.6%) |
Disability Class: Cognitive Difficulty
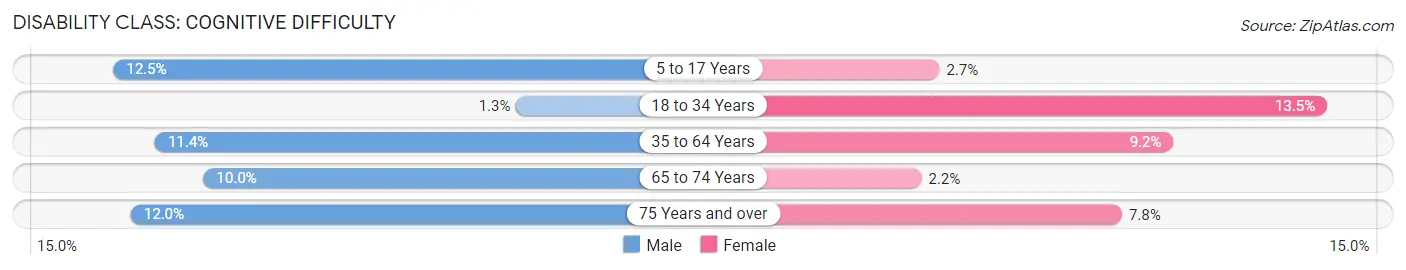
| Age Bracket | Male | Female |
| 5 to 17 Years | 62 (12.5%) | 10 (2.7%) |
| 18 to 34 Years | 13 (1.3%) | 136 (13.5%) |
| 35 to 64 Years | 173 (11.4%) | 151 (9.2%) |
| 65 to 74 Years | 66 (10.0%) | 11 (2.2%) |
| 75 Years and over | 33 (12.0%) | 39 (7.8%) |
Disability Class: Ambulatory Difficulty
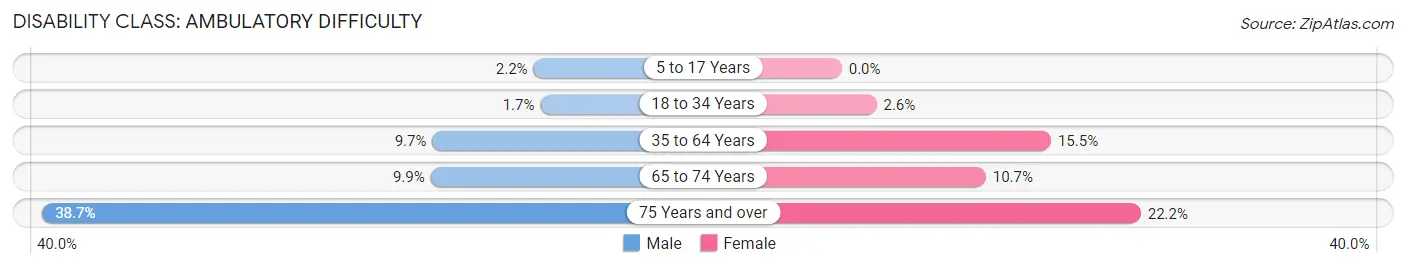
| Age Bracket | Male | Female |
| 5 to 17 Years | 11 (2.2%) | 0 (0.0%) |
| 18 to 34 Years | 17 (1.7%) | 26 (2.6%) |
| 35 to 64 Years | 148 (9.7%) | 254 (15.5%) |
| 65 to 74 Years | 65 (9.9%) | 53 (10.7%) |
| 75 Years and over | 106 (38.7%) | 111 (22.2%) |
Disability Class: Self-Care Difficulty
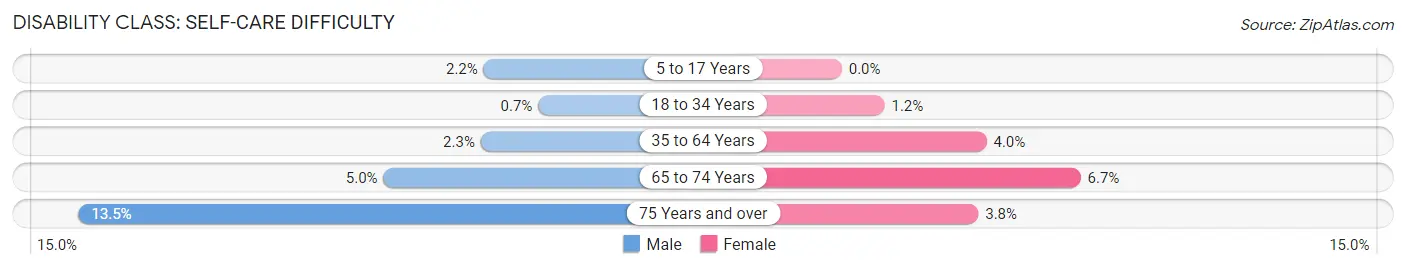
| Age Bracket | Male | Female |
| 5 to 17 Years | 11 (2.2%) | 0 (0.0%) |
| 18 to 34 Years | 7 (0.7%) | 12 (1.2%) |
| 35 to 64 Years | 35 (2.3%) | 66 (4.0%) |
| 65 to 74 Years | 33 (5.0%) | 33 (6.7%) |
| 75 Years and over | 37 (13.5%) | 19 (3.8%) |
Technology Access in Abingdon
Computing Device Access in Abingdon
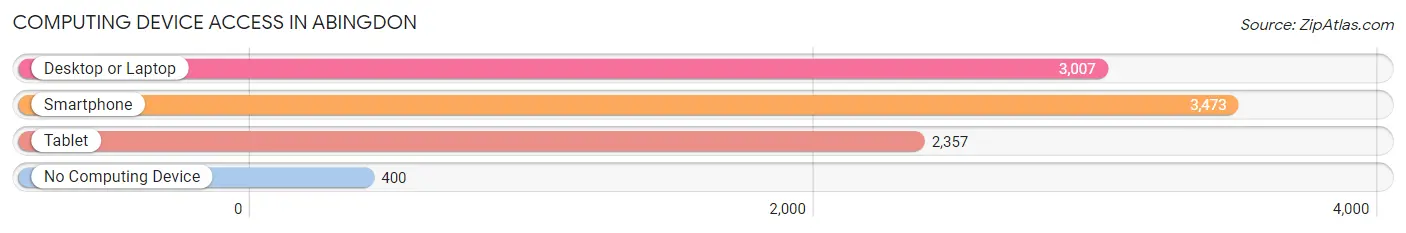
| Device Type | # Households | % Households |
| Desktop or Laptop | 3,007 | 73.0% |
| Smartphone | 3,473 | 84.3% |
| Tablet | 2,357 | 57.2% |
| No Computing Device | 400 | 9.7% |
| Total | 4,122 | 100.0% |
Internet Access in Abingdon
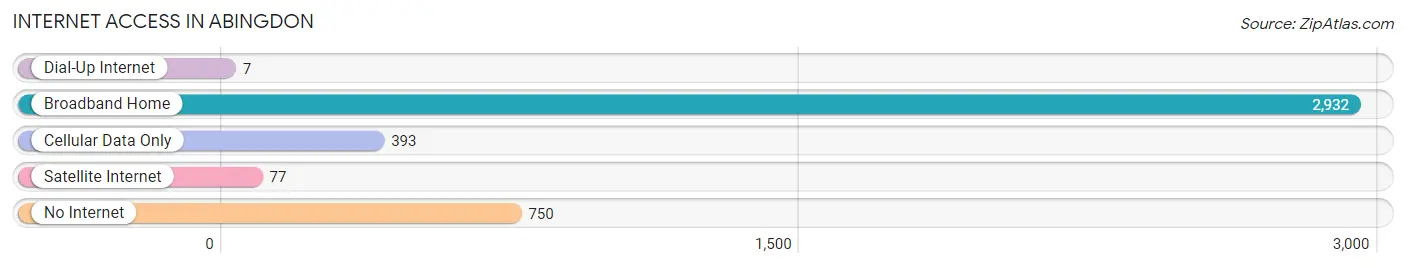
| Internet Type | # Households | % Households |
| Dial-Up Internet | 7 | 0.2% |
| Broadband Home | 2,932 | 71.1% |
| Cellular Data Only | 393 | 9.5% |
| Satellite Internet | 77 | 1.9% |
| No Internet | 750 | 18.2% |
| Total | 4,122 | 100.0% |
Abingdon Summary
Abingdon is a town located in Washington County, Virginia, United States. It is the county seat of Washington County and is part of the Kingsport–Bristol–Bristol, TN-VA Metropolitan Statistical Area, which is a component of the Johnson City–Kingsport–Bristol, TN-VA Combined Statistical Area – commonly known as the "Tri-Cities" region. The population was 8,191 at the 2010 census. It is the county seat of Washington County and is a designated Virginia Historic Landmark.
History
The town of Abingdon was established in 1778 by an act of the Virginia General Assembly. It was named for the ancestral home of Martha Washington's family in Oxfordshire, England. The town was originally part of Fincastle County, Virginia, which was divided in 1776. The town was the site of the first courthouse in the newly formed Washington County, Virginia. The town was also the site of the first post office in the county, established in 1792.
The town was the site of the first public school in the county, established in 1803. The town was also the site of the first newspaper in the county, the Washington County Gazette, which was established in 1808.
The town was the site of the first bank in the county, the Bank of Abingdon, which was established in 1814. The town was also the site of the first telegraph office in the county, established in 1851.
The town was the site of the first railroad in the county, the Abingdon Branch of the Norfolk and Western Railway, which was established in 1856.
Geography
Abingdon is located at 36°41'N 81°48'W (36.6833, -81.8000). According to the United States Census Bureau, the town has a total area of 5.2 square miles (13.4 km2), of which 5.1 square miles (13.2 km2) is land and 0.1 square miles (0.2 km2) (1.54%) is water.
The town is located in the Appalachian Mountains, and is surrounded by the Appalachian Trail. The town is located at the confluence of the North Fork of the Holston River and the South Fork of the Holston River.
Economy
Abingdon is the home of the Barter Theatre, the oldest professional theatre in the United States. The theatre was founded in 1933 by Robert Porterfield, and has been in continuous operation since then. The theatre is located in the historic Abingdon Train Depot, which was built in 1858.
The town is also home to the Virginia Creeper Trail, a 34-mile (55 km) rail trail that runs from Abingdon to Whitetop, Virginia. The trail is popular with hikers, bikers, and horseback riders.
The town is also home to the Abingdon Vineyard and Winery, which produces a variety of wines. The winery is located in the historic Abingdon Milling Company building, which was built in 1835.
Demographics
As of the census of 2010, there were 8,191 people, 3,521 households, and 2,092 families residing in the town. The population density was 1,611.2 people per square mile (621.7/km2). There were 3,945 housing units at an average density of 776.3 per square mile (300.2/km2). The racial makeup of the town was 92.2% White, 4.3% African American, 0.3% Native American, 0.9% Asian, 0.1% Pacific Islander, 0.7% from other races, and 1.5% from two or more races. Hispanic or Latino of any race were 2.2% of the population.
There were 3,521 households, out of which 24.2% had children under the age of 18 living with them, 43.2% were married couples living together, 13.7% had a female householder with no husband present, and 38.7% were non-families. 33.2% of all households were made up of individuals, and 14.7% had someone living alone who was 65 years of age or older. The average household size was 2.22 and the average family size was 2.81.
In the town, the population was spread out, with 20.7% under the age of 18, 8.2% from 18 to 24, 25.7% from 25 to 44, 25.2% from 45 to 64, and 20.2% who were 65 years of age or older. The median age was 41 years. For every 100 females, there were 87.2 males. For every 100 females age 18 and over, there were 82.3 males.
The median income for a household in the town was $30,917, and the median income for a family was $41,818. Males had a median income of $30,844 versus $22,813 for females. The per capita income for the town was $19,945. About 11.7% of families and 15.2% of the population were below the poverty line, including 22.2% of those under age 18 and 11.2% of those age 65 or over.
Common Questions
What is Per Capita Income in Abingdon?
Per Capita income in Abingdon is $46,106.
What is the Median Family Income in Abingdon?
Median Family Income in Abingdon is $87,992.
What is the Median Household income in Abingdon?
Median Household Income in Abingdon is $56,164.
What is Income or Wage Gap in Abingdon?
Income or Wage Gap in Abingdon is 33.6%.
Women in Abingdon earn 66.4 cents for every dollar earned by a man.
What is Family Income Deficit in Abingdon?
Family Income Deficit in Abingdon is $9,871.
Families that are below poverty line in Abingdon earn $9,871 less on average than the poverty threshold level.
What is Inequality or Gini Index in Abingdon?
Inequality or Gini Index in Abingdon is 0.57.
What is the Total Population of Abingdon?
Total Population of Abingdon is 8,346.
What is the Total Male Population of Abingdon?
Total Male Population of Abingdon is 4,140.
What is the Total Female Population of Abingdon?
Total Female Population of Abingdon is 4,206.
What is the Ratio of Males per 100 Females in Abingdon?
There are 98.43 Males per 100 Females in Abingdon.
What is the Ratio of Females per 100 Males in Abingdon?
There are 101.59 Females per 100 Males in Abingdon.
What is the Median Population Age in Abingdon?
Median Population Age in Abingdon is 46.4 Years.
What is the Average Family Size in Abingdon
Average Family Size in Abingdon is 2.6 People.
What is the Average Household Size in Abingdon
Average Household Size in Abingdon is 2.0 People.
How Large is the Labor Force in Abingdon?
There are 4,305 People in the Labor Forcein in Abingdon.
What is the Percentage of People in the Labor Force in Abingdon?
58.3% of People are in the Labor Force in Abingdon.
What is the Unemployment Rate in Abingdon?
Unemployment Rate in Abingdon is 4.0%.