Lincolnia, VA Map & Demographics
Lincolnia Map
Lincolnia Overview
$58,952
PER CAPITA INCOME
$119,596
AVG FAMILY INCOME
$116,122
AVG HOUSEHOLD INCOME
16.6%
WAGE / INCOME GAP [ % ]
83.4¢/ $1
WAGE / INCOME GAP [ $ ]
$11,119
FAMILY INCOME DEFICIT
0.41
INEQUALITY / GINI INDEX
19,812
TOTAL POPULATION
10,250
MALE POPULATION
9,562
FEMALE POPULATION
107.20
MALES / 100 FEMALES
93.29
FEMALES / 100 MALES
38.8
MEDIAN AGE
3.1
AVG FAMILY SIZE
2.6
AVG HOUSEHOLD SIZE
12,648
LABOR FORCE [ PEOPLE ]
76.6%
PERCENT IN LABOR FORCE
4.5%
UNEMPLOYMENT RATE
Lincolnia Area Codes
Income in Lincolnia
Income Overview in Lincolnia
Per Capita Income in Lincolnia is $58,952, while median incomes of families and households are $119,596 and $116,122 respectively.
| Characteristic | Number | Measure |
| Per Capita Income | 19,812 | $58,952 |
| Median Family Income | 4,806 | $119,596 |
| Mean Family Income | 4,806 | $166,396 |
| Median Household Income | 7,617 | $116,122 |
| Mean Household Income | 7,617 | $150,156 |
| Income Deficit | 4,806 | $11,119 |
| Wage / Income Gap (%) | 19,812 | 16.57% |
| Wage / Income Gap ($) | 19,812 | 83.43¢ per $1 |
| Gini / Inequality Index | 19,812 | 0.41 |
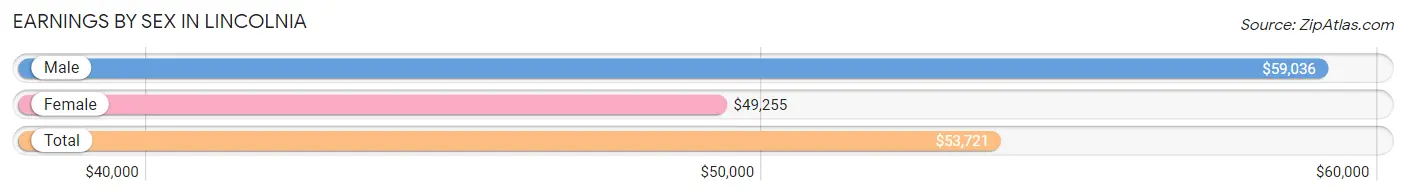
Earnings by Sex in Lincolnia
Average Earnings in Lincolnia are $53,721, $59,036 for men and $49,255 for women, a difference of 16.6%.
| Sex | Number | Average Earnings |
| Male | 6,908 (54.0%) | $59,036 |
| Female | 5,892 (46.0%) | $49,255 |
| Total | 12,800 (100.0%) | $53,721 |
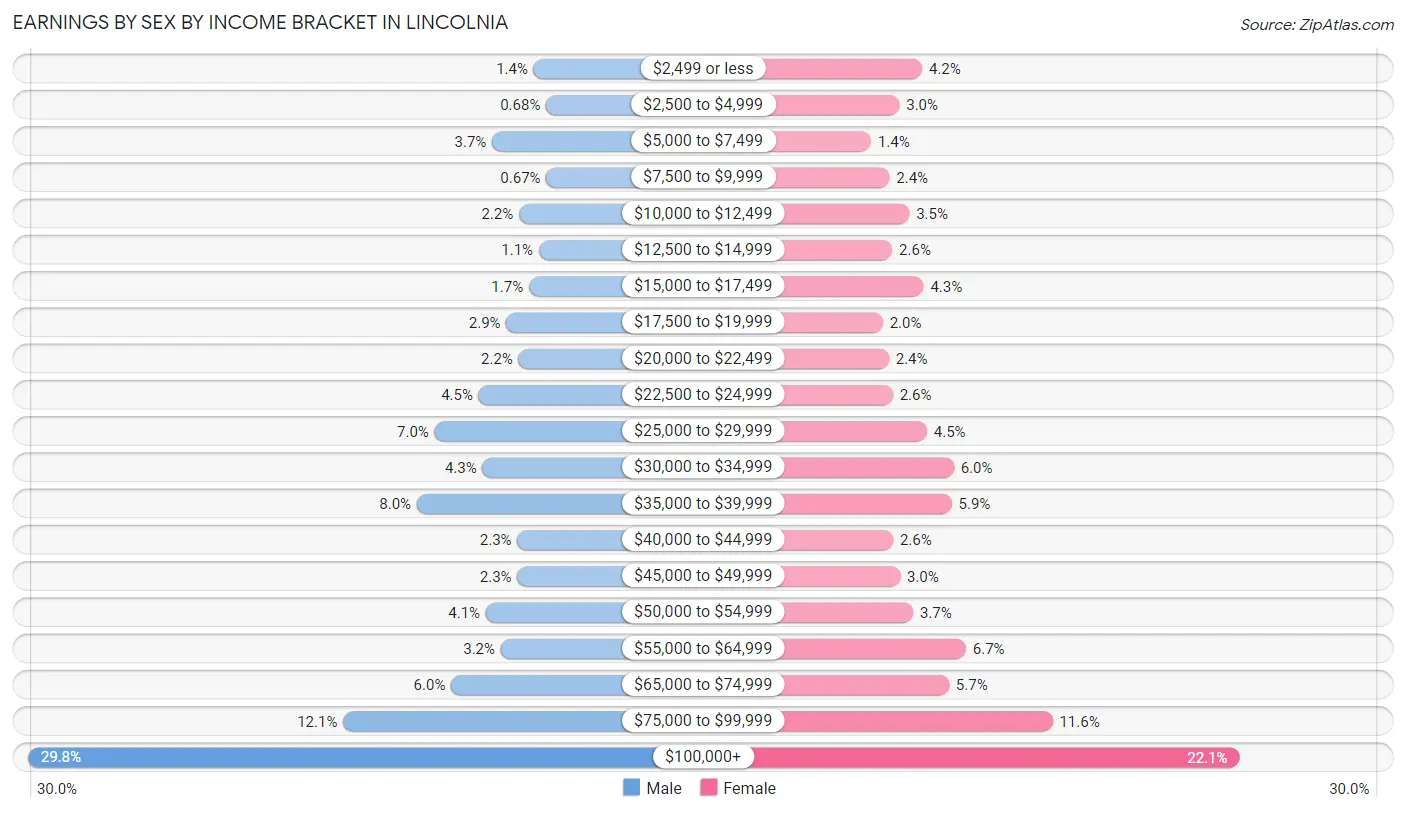
Earnings by Sex by Income Bracket in Lincolnia
The most common earnings brackets in Lincolnia are $100,000+ for men (2,060 | 29.8%) and $100,000+ for women (1,300 | 22.1%).
| Income | Male | Female |
| $2,499 or less | 95 (1.4%) | 249 (4.2%) |
| $2,500 to $4,999 | 47 (0.7%) | 174 (2.9%) |
| $5,000 to $7,499 | 257 (3.7%) | 80 (1.4%) |
| $7,500 to $9,999 | 46 (0.7%) | 141 (2.4%) |
| $10,000 to $12,499 | 153 (2.2%) | 207 (3.5%) |
| $12,500 to $14,999 | 75 (1.1%) | 150 (2.5%) |
| $15,000 to $17,499 | 114 (1.7%) | 254 (4.3%) |
| $17,500 to $19,999 | 202 (2.9%) | 119 (2.0%) |
| $20,000 to $22,499 | 154 (2.2%) | 139 (2.4%) |
| $22,500 to $24,999 | 309 (4.5%) | 152 (2.6%) |
| $25,000 to $29,999 | 480 (7.0%) | 265 (4.5%) |
| $30,000 to $34,999 | 294 (4.3%) | 354 (6.0%) |
| $35,000 to $39,999 | 549 (8.0%) | 347 (5.9%) |
| $40,000 to $44,999 | 159 (2.3%) | 153 (2.6%) |
| $45,000 to $49,999 | 159 (2.3%) | 176 (3.0%) |
| $50,000 to $54,999 | 281 (4.1%) | 219 (3.7%) |
| $55,000 to $64,999 | 223 (3.2%) | 394 (6.7%) |
| $65,000 to $74,999 | 416 (6.0%) | 338 (5.7%) |
| $75,000 to $99,999 | 835 (12.1%) | 681 (11.6%) |
| $100,000+ | 2,060 (29.8%) | 1,300 (22.1%) |
| Total | 6,908 (100.0%) | 5,892 (100.0%) |
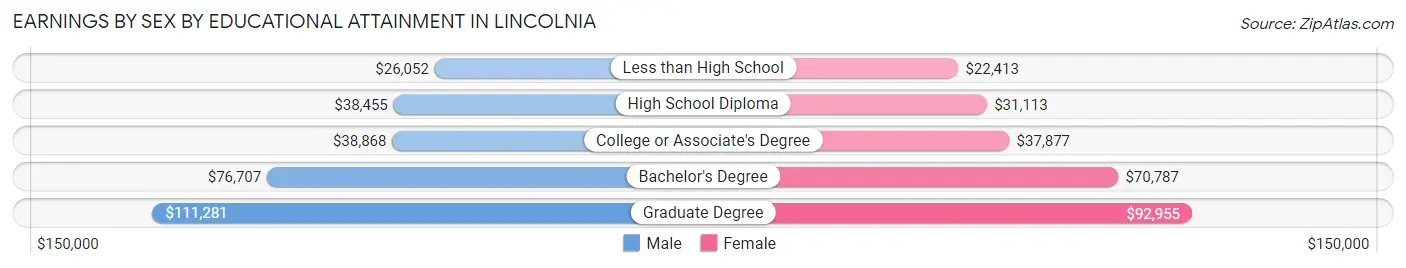
Earnings by Sex by Educational Attainment in Lincolnia
Average earnings in Lincolnia are $67,909 for men and $55,513 for women, a difference of 18.2%. Men with an educational attainment of graduate degree enjoy the highest average annual earnings of $111,281, while those with less than high school education earn the least with $26,052. Women with an educational attainment of graduate degree earn the most with the average annual earnings of $92,955, while those with less than high school education have the smallest earnings of $22,413.
| Educational Attainment | Male Income | Female Income |
| Less than High School | $26,052 | $22,413 |
| High School Diploma | $38,455 | $31,113 |
| College or Associate's Degree | $38,868 | $37,877 |
| Bachelor's Degree | $76,707 | $70,787 |
| Graduate Degree | $111,281 | $92,955 |
| Total | $67,909 | $55,513 |
Family Income in Lincolnia
Family Income Brackets in Lincolnia
According to the Lincolnia family income data, there are 1,264 families falling into the $200,000+ income range, which is the most common income bracket and makes up 26.3% of all families.
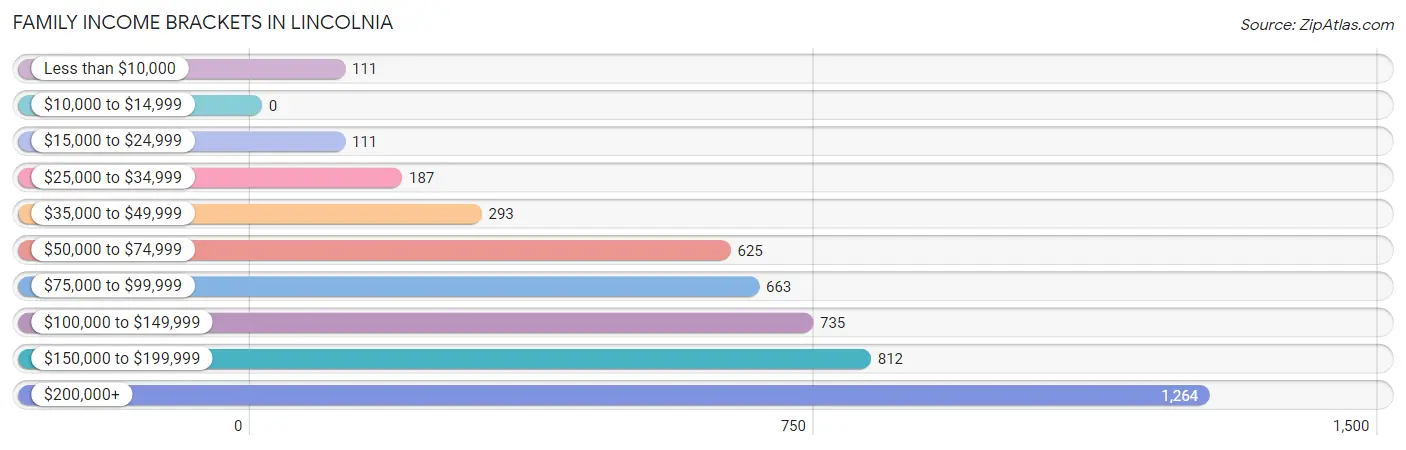
| Income Bracket | # Families | % Families |
| Less than $10,000 | 111 | 2.3% |
| $10,000 to $14,999 | 0 | 0.0% |
| $15,000 to $24,999 | 111 | 2.3% |
| $25,000 to $34,999 | 187 | 3.9% |
| $35,000 to $49,999 | 293 | 6.1% |
| $50,000 to $74,999 | 625 | 13.0% |
| $75,000 to $99,999 | 663 | 13.8% |
| $100,000 to $149,999 | 735 | 15.3% |
| $150,000 to $199,999 | 812 | 16.9% |
| $200,000+ | 1,264 | 26.3% |
Family Income by Famaliy Size in Lincolnia
7+ person families (46 | 1.0%) account for the highest median family income in Lincolnia with $250,001 per family, while 2-person families (2,316 | 48.2%) have the highest median income of $64,286 per family member.
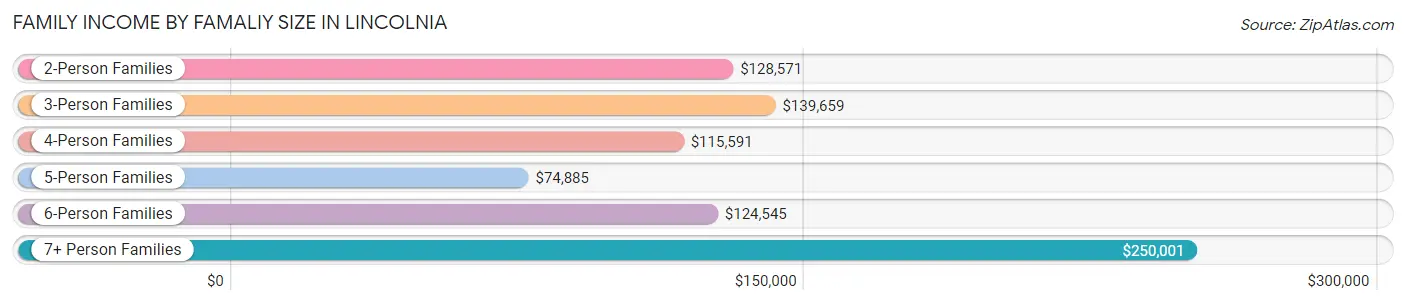
| Income Bracket | # Families | Median Income |
| 2-Person Families | 2,316 (48.2%) | $128,571 |
| 3-Person Families | 964 (20.1%) | $139,659 |
| 4-Person Families | 937 (19.5%) | $115,591 |
| 5-Person Families | 415 (8.6%) | $74,885 |
| 6-Person Families | 128 (2.7%) | $124,545 |
| 7+ Person Families | 46 (1.0%) | $250,001 |
| Total | 4,806 (100.0%) | $119,596 |
Family Income by Number of Earners in Lincolnia
The median family income in Lincolnia is $119,596, with families comprising 2 earners (2,556) having the highest median family income of $163,466, while families with 1 earner (1,207) have the lowest median family income of $79,159, accounting for 53.2% and 25.1% of families, respectively.
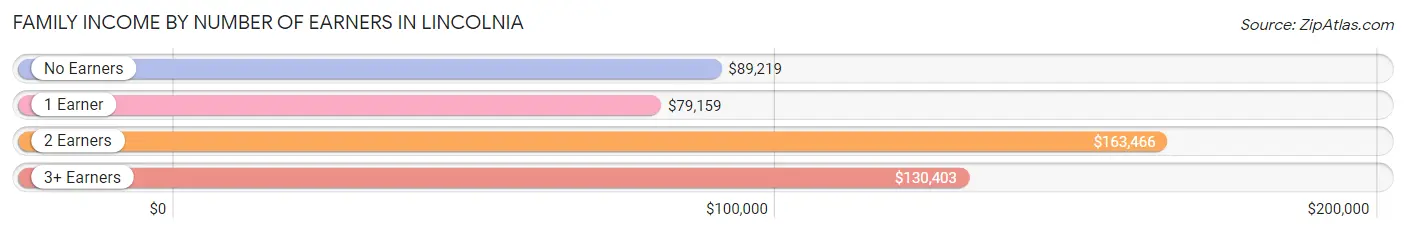
| Number of Earners | # Families | Median Income |
| No Earners | 381 (7.9%) | $89,219 |
| 1 Earner | 1,207 (25.1%) | $79,159 |
| 2 Earners | 2,556 (53.2%) | $163,466 |
| 3+ Earners | 662 (13.8%) | $130,403 |
| Total | 4,806 (100.0%) | $119,596 |
Household Income in Lincolnia
Household Income Brackets in Lincolnia
With 1,607 households falling in the category, the $200,000+ income range is the most frequent in Lincolnia, accounting for 21.1% of all households. In contrast, only 8 households (0.1%) fall into the $10,000 to $14,999 income bracket, making it the least populous group.
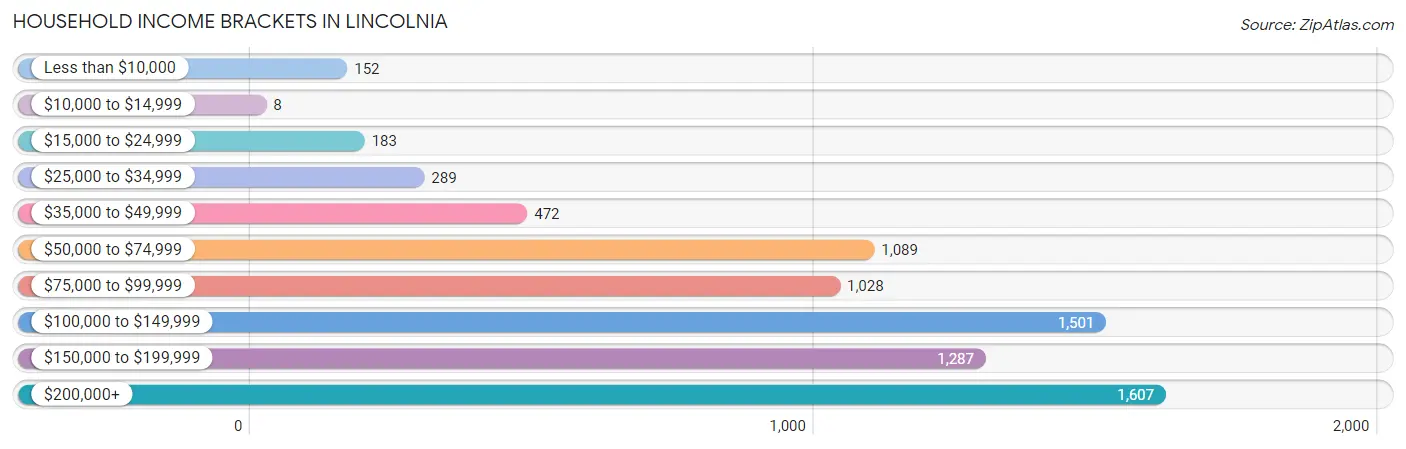
| Income Bracket | # Households | % Households |
| Less than $10,000 | 152 | 2.0% |
| $10,000 to $14,999 | 8 | 0.1% |
| $15,000 to $24,999 | 183 | 2.4% |
| $25,000 to $34,999 | 289 | 3.8% |
| $35,000 to $49,999 | 472 | 6.2% |
| $50,000 to $74,999 | 1,089 | 14.3% |
| $75,000 to $99,999 | 1,028 | 13.5% |
| $100,000 to $149,999 | 1,501 | 19.7% |
| $150,000 to $199,999 | 1,287 | 16.9% |
| $200,000+ | 1,607 | 21.1% |
Household Income by Householder Age in Lincolnia
The median household income in Lincolnia is $116,122, with the highest median household income of $130,729 found in the 45 to 64 years age bracket for the primary householder. A total of 2,871 households (37.7%) fall into this category. Meanwhile, the 15 to 24 years age bracket for the primary householder has the lowest median household income of $74,777, with 191 households (2.5%) in this group.
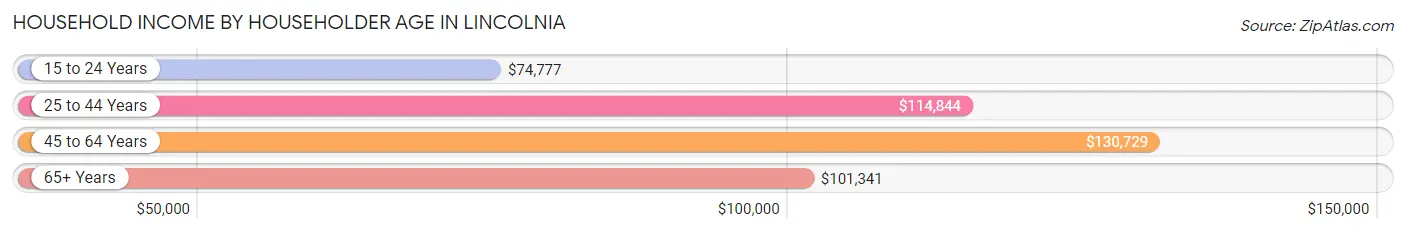
| Income Bracket | # Households | Median Income |
| 15 to 24 Years | 191 (2.5%) | $74,777 |
| 25 to 44 Years | 3,140 (41.2%) | $114,844 |
| 45 to 64 Years | 2,871 (37.7%) | $130,729 |
| 65+ Years | 1,415 (18.6%) | $101,341 |
| Total | 7,617 (100.0%) | $116,122 |
Poverty in Lincolnia
Income Below Poverty by Sex and Age in Lincolnia
With 6.8% poverty level for males and 7.4% for females among the residents of Lincolnia, 12 to 14 year old males and 5 year old females are the most vulnerable to poverty, with 70 males (19.9%) and 40 females (43.5%) in their respective age groups living below the poverty level.
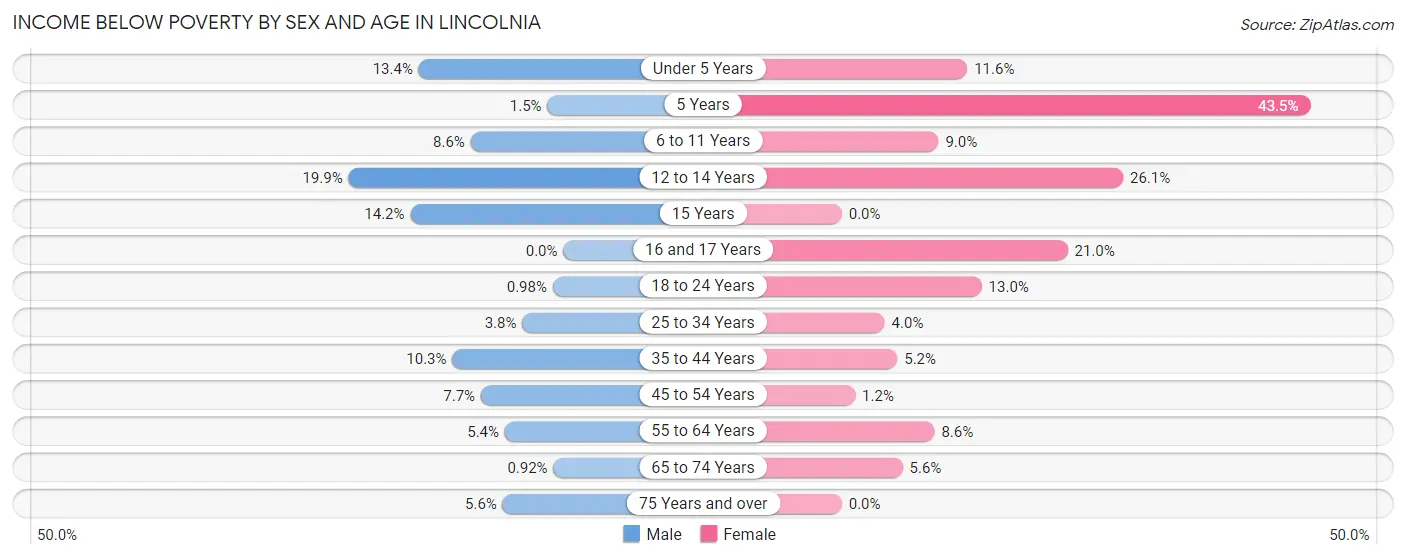
| Age Bracket | Male | Female |
| Under 5 Years | 73 (13.4%) | 51 (11.6%) |
| 5 Years | 2 (1.5%) | 40 (43.5%) |
| 6 to 11 Years | 62 (8.6%) | 33 (9.0%) |
| 12 to 14 Years | 70 (19.9%) | 101 (26.1%) |
| 15 Years | 23 (14.2%) | 0 (0.0%) |
| 16 and 17 Years | 0 (0.0%) | 31 (20.9%) |
| 18 to 24 Years | 7 (1.0%) | 102 (13.0%) |
| 25 to 34 Years | 66 (3.8%) | 67 (4.0%) |
| 35 to 44 Years | 183 (10.3%) | 91 (5.1%) |
| 45 to 54 Years | 103 (7.6%) | 13 (1.2%) |
| 55 to 64 Years | 80 (5.4%) | 131 (8.6%) |
| 65 to 74 Years | 8 (0.9%) | 45 (5.6%) |
| 75 Years and over | 17 (5.6%) | 0 (0.0%) |
| Total | 694 (6.8%) | 705 (7.4%) |
Income Above Poverty by Sex and Age in Lincolnia
According to the poverty statistics in Lincolnia, males aged 16 and 17 years and females aged 15 years are the age groups that are most secure financially, with 100.0% of males and 100.0% of females in these age groups living above the poverty line.
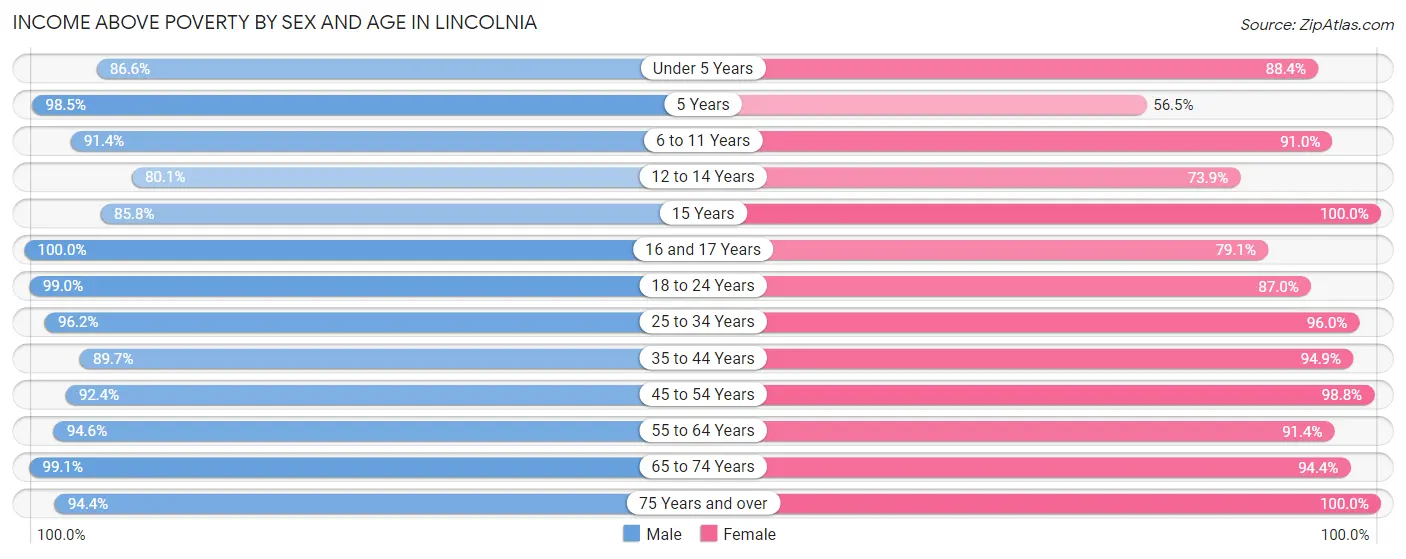
| Age Bracket | Male | Female |
| Under 5 Years | 471 (86.6%) | 387 (88.4%) |
| 5 Years | 133 (98.5%) | 52 (56.5%) |
| 6 to 11 Years | 659 (91.4%) | 335 (91.0%) |
| 12 to 14 Years | 281 (80.1%) | 286 (73.9%) |
| 15 Years | 139 (85.8%) | 102 (100.0%) |
| 16 and 17 Years | 122 (100.0%) | 117 (79.0%) |
| 18 to 24 Years | 708 (99.0%) | 684 (87.0%) |
| 25 to 34 Years | 1,665 (96.2%) | 1,617 (96.0%) |
| 35 to 44 Years | 1,594 (89.7%) | 1,676 (94.9%) |
| 45 to 54 Years | 1,243 (92.3%) | 1,032 (98.8%) |
| 55 to 64 Years | 1,392 (94.6%) | 1,393 (91.4%) |
| 65 to 74 Years | 864 (99.1%) | 753 (94.4%) |
| 75 Years and over | 285 (94.4%) | 415 (100.0%) |
| Total | 9,556 (93.2%) | 8,849 (92.6%) |
Income Below Poverty Among Married-Couple Families in Lincolnia
The poverty statistics for married-couple families in Lincolnia show that 2.1% or 73 of the total 3,477 families live below the poverty line. Families with 3 or 4 children have the highest poverty rate of 15.8%, comprising of 34 families. On the other hand, families with 5 or more children have the lowest poverty rate of 0.0%, which includes 0 families.
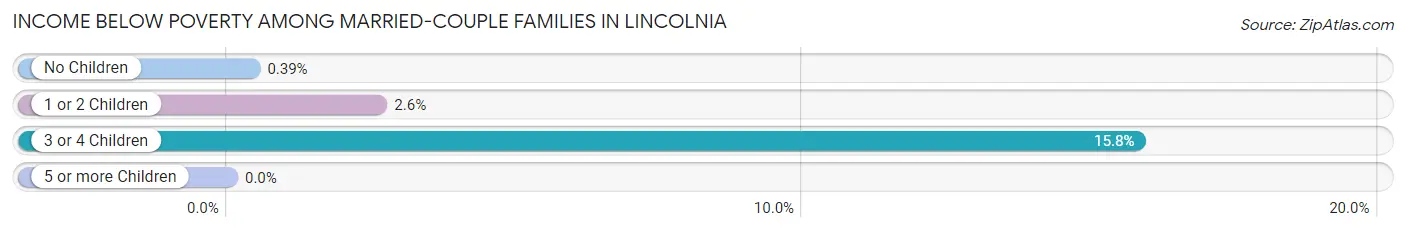
| Children | Above Poverty | Below Poverty |
| No Children | 2,055 (99.6%) | 8 (0.4%) |
| 1 or 2 Children | 1,162 (97.4%) | 31 (2.6%) |
| 3 or 4 Children | 181 (84.2%) | 34 (15.8%) |
| 5 or more Children | 6 (100.0%) | 0 (0.0%) |
| Total | 3,404 (97.9%) | 73 (2.1%) |
Income Below Poverty Among Single-Parent Households in Lincolnia
According to the poverty data in Lincolnia, 11.2% or 47 single-father households and 10.8% or 98 single-mother households are living below the poverty line. Among single-father households, those with 3 or 4 children have the highest poverty rate, with 31 households (100.0%) experiencing poverty. Likewise, among single-mother households, those with 3 or 4 children have the highest poverty rate, with 17 households (100.0%) falling below the poverty line.
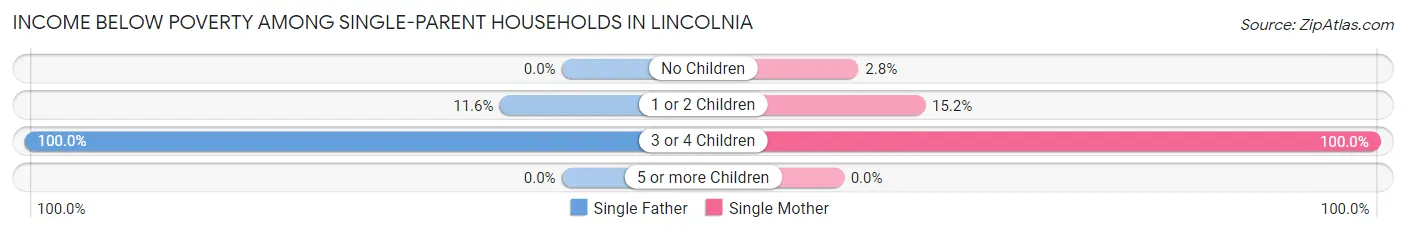
| Children | Single Father | Single Mother |
| No Children | 0 (0.0%) | 12 (2.8%) |
| 1 or 2 Children | 16 (11.6%) | 69 (15.2%) |
| 3 or 4 Children | 31 (100.0%) | 17 (100.0%) |
| 5 or more Children | 0 (0.0%) | 0 (0.0%) |
| Total | 47 (11.2%) | 98 (10.8%) |
Income Below Poverty Among Married-Couple vs Single-Parent Households in Lincolnia
The poverty data for Lincolnia shows that 73 of the married-couple family households (2.1%) and 145 of the single-parent households (10.9%) are living below the poverty level. Within the married-couple family households, those with 3 or 4 children have the highest poverty rate, with 34 households (15.8%) falling below the poverty line. Among the single-parent households, those with 3 or 4 children have the highest poverty rate, with 48 household (100.0%) living below poverty.
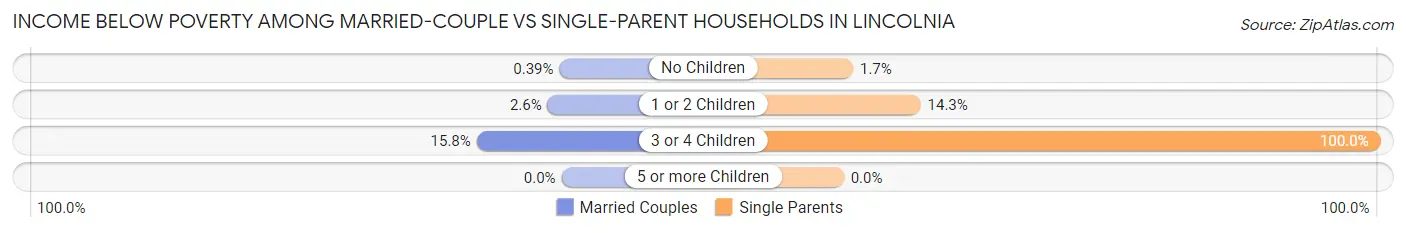
| Children | Married-Couple Families | Single-Parent Households |
| No Children | 8 (0.4%) | 12 (1.7%) |
| 1 or 2 Children | 31 (2.6%) | 85 (14.3%) |
| 3 or 4 Children | 34 (15.8%) | 48 (100.0%) |
| 5 or more Children | 0 (0.0%) | 0 (0.0%) |
| Total | 73 (2.1%) | 145 (10.9%) |
Race in Lincolnia
The most populous races in Lincolnia are White / Caucasian (8,499 | 42.9%), Black / African American (5,310 | 26.8%), and Hispanic or Latino (4,196 | 21.2%).
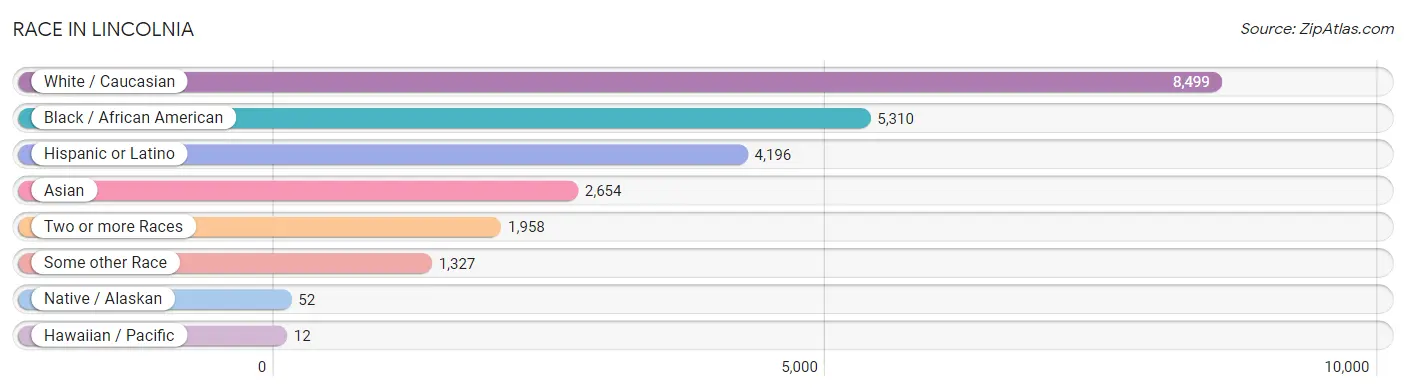
| Race | # Population | % Population |
| Asian | 2,654 | 13.4% |
| Black / African American | 5,310 | 26.8% |
| Hawaiian / Pacific | 12 | 0.1% |
| Hispanic or Latino | 4,196 | 21.2% |
| Native / Alaskan | 52 | 0.3% |
| White / Caucasian | 8,499 | 42.9% |
| Two or more Races | 1,958 | 9.9% |
| Some other Race | 1,327 | 6.7% |
| Total | 19,812 | 100.0% |
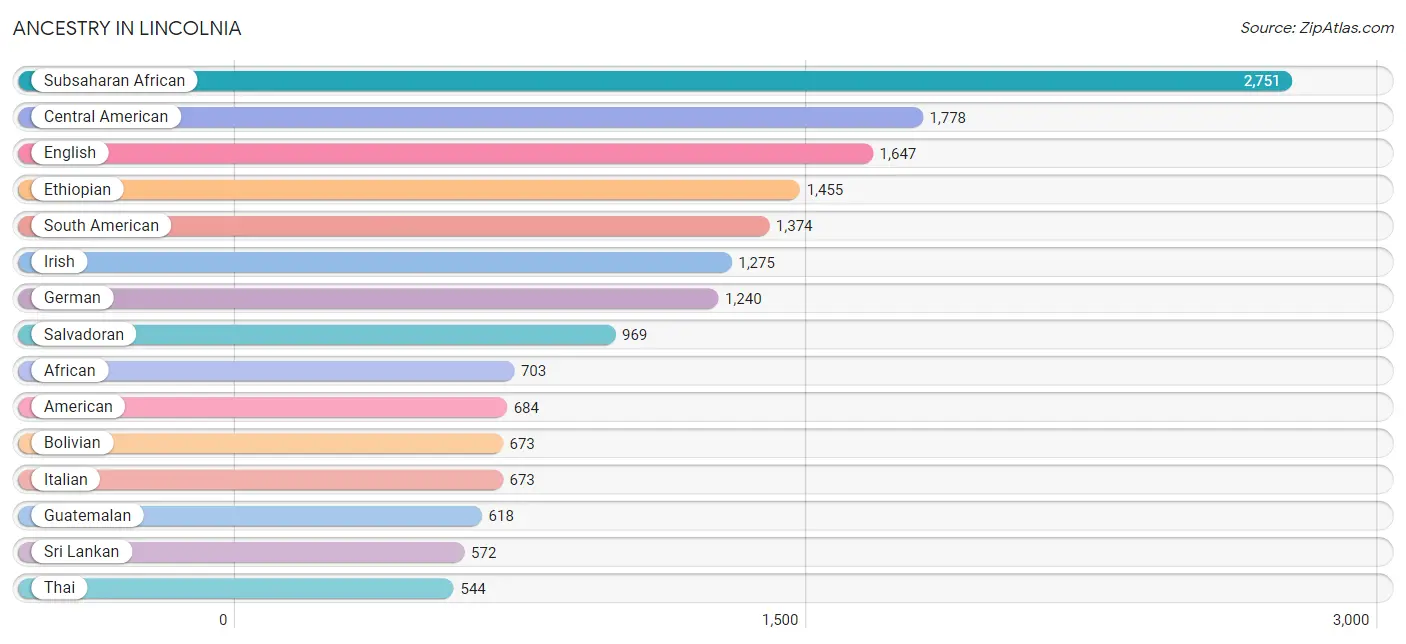
Ancestry in Lincolnia
The most populous ancestries reported in Lincolnia are Subsaharan African (2,751 | 13.9%), Central American (1,778 | 9.0%), English (1,647 | 8.3%), Ethiopian (1,455 | 7.3%), and South American (1,374 | 6.9%), together accounting for 45.5% of all Lincolnia residents.
| Ancestry | # Population | % Population |
| Afghan | 87 | 0.4% |
| African | 703 | 3.5% |
| American | 684 | 3.5% |
| Arab | 381 | 1.9% |
| Argentinean | 86 | 0.4% |
| Armenian | 15 | 0.1% |
| Austrian | 9 | 0.1% |
| Barbadian | 13 | 0.1% |
| Belgian | 28 | 0.1% |
| Bhutanese | 108 | 0.5% |
| Bolivian | 673 | 3.4% |
| Brazilian | 38 | 0.2% |
| British | 132 | 0.7% |
| Bulgarian | 9 | 0.1% |
| Burmese | 451 | 2.3% |
| Canadian | 21 | 0.1% |
| Central American | 1,778 | 9.0% |
| Central American Indian | 14 | 0.1% |
| Cherokee | 52 | 0.3% |
| Chilean | 15 | 0.1% |
| Colombian | 117 | 0.6% |
| Cuban | 142 | 0.7% |
| Czech | 45 | 0.2% |
| Danish | 74 | 0.4% |
| Dominican | 22 | 0.1% |
| Dutch | 159 | 0.8% |
| Eastern European | 69 | 0.4% |
| Ecuadorian | 155 | 0.8% |
| Egyptian | 41 | 0.2% |
| English | 1,647 | 8.3% |
| Ethiopian | 1,455 | 7.3% |
| European | 512 | 2.6% |
| Finnish | 33 | 0.2% |
| French | 80 | 0.4% |
| French Canadian | 21 | 0.1% |
| German | 1,240 | 6.3% |
| Ghanaian | 119 | 0.6% |
| Greek | 103 | 0.5% |
| Guamanian / Chamorro | 49 | 0.3% |
| Guatemalan | 618 | 3.1% |
| Haitian | 24 | 0.1% |
| Honduran | 141 | 0.7% |
| Hungarian | 229 | 1.2% |
| Indian (Asian) | 543 | 2.7% |
| Iranian | 102 | 0.5% |
| Irish | 1,275 | 6.4% |
| Italian | 673 | 3.4% |
| Jamaican | 32 | 0.2% |
| Japanese | 8 | 0.0% |
| Korean | 297 | 1.5% |
| Laotian | 17 | 0.1% |
| Latvian | 5 | 0.0% |
| Lebanese | 104 | 0.5% |
| Lithuanian | 10 | 0.1% |
| Mexican | 492 | 2.5% |
| Mexican American Indian | 41 | 0.2% |
| Mongolian | 34 | 0.2% |
| Moroccan | 15 | 0.1% |
| New Zealander | 11 | 0.1% |
| Nicaraguan | 50 | 0.3% |
| Nigerian | 138 | 0.7% |
| Northern European | 30 | 0.2% |
| Norwegian | 112 | 0.6% |
| Okinawan | 25 | 0.1% |
| Pakistani | 49 | 0.3% |
| Palestinian | 88 | 0.4% |
| Paraguayan | 5 | 0.0% |
| Peruvian | 323 | 1.6% |
| Polish | 235 | 1.2% |
| Portuguese | 27 | 0.1% |
| Puerto Rican | 132 | 0.7% |
| Romanian | 48 | 0.2% |
| Russian | 32 | 0.2% |
| Salvadoran | 969 | 4.9% |
| Scandinavian | 63 | 0.3% |
| Scotch-Irish | 198 | 1.0% |
| Scottish | 171 | 0.9% |
| Sierra Leonean | 77 | 0.4% |
| Slavic | 17 | 0.1% |
| Somali | 131 | 0.7% |
| South American | 1,374 | 6.9% |
| South American Indian | 9 | 0.1% |
| Spaniard | 34 | 0.2% |
| Spanish | 46 | 0.2% |
| Sri Lankan | 572 | 2.9% |
| Subsaharan African | 2,751 | 13.9% |
| Sudanese | 5 | 0.0% |
| Swedish | 172 | 0.9% |
| Swiss | 18 | 0.1% |
| Syrian | 4 | 0.0% |
| Thai | 544 | 2.8% |
| Turkish | 76 | 0.4% |
| Ugandan | 120 | 0.6% |
| Ukrainian | 86 | 0.4% |
| Vietnamese | 126 | 0.6% |
| Welsh | 127 | 0.6% |
| West Indian | 17 | 0.1% |
| Yaqui | 29 | 0.2% | View All 98 Rows |
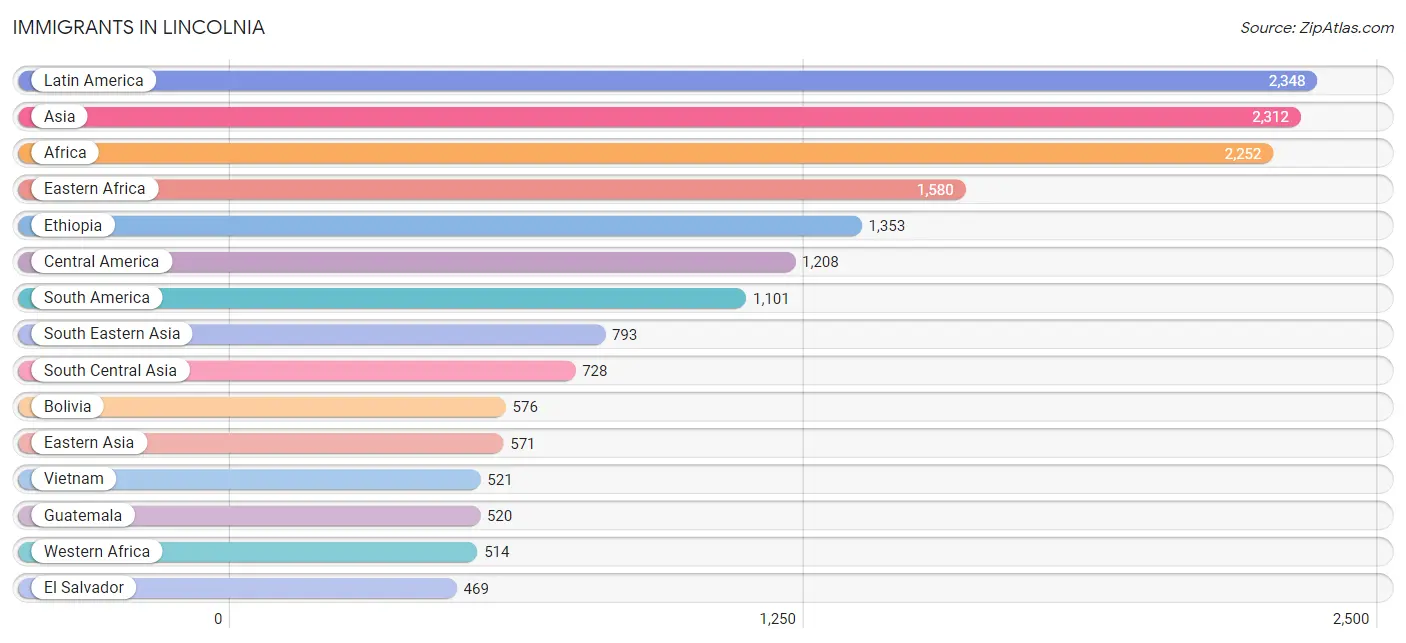
Immigrants in Lincolnia
The most numerous immigrant groups reported in Lincolnia came from Latin America (2,348 | 11.8%), Asia (2,312 | 11.7%), Africa (2,252 | 11.4%), Eastern Africa (1,580 | 8.0%), and Ethiopia (1,353 | 6.8%), together accounting for 49.7% of all Lincolnia residents.
| Immigration Origin | # Population | % Population |
| Afghanistan | 121 | 0.6% |
| Africa | 2,252 | 11.4% |
| Argentina | 111 | 0.6% |
| Armenia | 11 | 0.1% |
| Asia | 2,312 | 11.7% |
| Austria | 9 | 0.1% |
| Bangladesh | 66 | 0.3% |
| Bolivia | 576 | 2.9% |
| Brazil | 73 | 0.4% |
| Bulgaria | 9 | 0.1% |
| Cambodia | 8 | 0.0% |
| Cameroon | 25 | 0.1% |
| Canada | 57 | 0.3% |
| Caribbean | 39 | 0.2% |
| Central America | 1,208 | 6.1% |
| Chile | 15 | 0.1% |
| China | 285 | 1.4% |
| Colombia | 18 | 0.1% |
| Cuba | 11 | 0.1% |
| Eastern Africa | 1,580 | 8.0% |
| Eastern Asia | 571 | 2.9% |
| Eastern Europe | 48 | 0.2% |
| Ecuador | 10 | 0.1% |
| Egypt | 8 | 0.0% |
| El Salvador | 469 | 2.4% |
| Eritrea | 104 | 0.5% |
| Ethiopia | 1,353 | 6.8% |
| Europe | 254 | 1.3% |
| France | 8 | 0.0% |
| Germany | 71 | 0.4% |
| Ghana | 62 | 0.3% |
| Greece | 6 | 0.0% |
| Guatemala | 520 | 2.6% |
| Haiti | 11 | 0.1% |
| Honduras | 76 | 0.4% |
| Hong Kong | 36 | 0.2% |
| India | 202 | 1.0% |
| Indonesia | 11 | 0.1% |
| Iran | 102 | 0.5% |
| Italy | 10 | 0.1% |
| Japan | 31 | 0.2% |
| Jordan | 3 | 0.0% |
| Korea | 255 | 1.3% |
| Latin America | 2,348 | 11.8% |
| Lebanon | 53 | 0.3% |
| Liberia | 24 | 0.1% |
| Malaysia | 34 | 0.2% |
| Mexico | 49 | 0.3% |
| Middle Africa | 50 | 0.3% |
| Moldova | 8 | 0.0% |
| Morocco | 15 | 0.1% |
| Nicaragua | 94 | 0.5% |
| Nigeria | 78 | 0.4% |
| Northern Africa | 51 | 0.3% |
| Northern Europe | 27 | 0.1% |
| Pakistan | 220 | 1.1% |
| Peru | 293 | 1.5% |
| Philippines | 172 | 0.9% |
| Portugal | 19 | 0.1% |
| Romania | 6 | 0.0% |
| Russia | 9 | 0.1% |
| Saudi Arabia | 99 | 0.5% |
| Sierra Leone | 316 | 1.6% |
| Singapore | 25 | 0.1% |
| Somalia | 48 | 0.2% |
| South Africa | 11 | 0.1% |
| South America | 1,101 | 5.6% |
| South Central Asia | 728 | 3.7% |
| South Eastern Asia | 793 | 4.0% |
| Southern Europe | 91 | 0.5% |
| Spain | 56 | 0.3% |
| Sri Lanka | 17 | 0.1% |
| Sudan | 5 | 0.0% |
| Taiwan | 44 | 0.2% |
| Thailand | 22 | 0.1% |
| Turkey | 16 | 0.1% |
| Uganda | 31 | 0.2% |
| Ukraine | 7 | 0.0% |
| Vietnam | 521 | 2.6% |
| Western Africa | 514 | 2.6% |
| Western Asia | 182 | 0.9% |
| Western Europe | 88 | 0.4% |
| Zaire | 25 | 0.1% | View All 83 Rows |
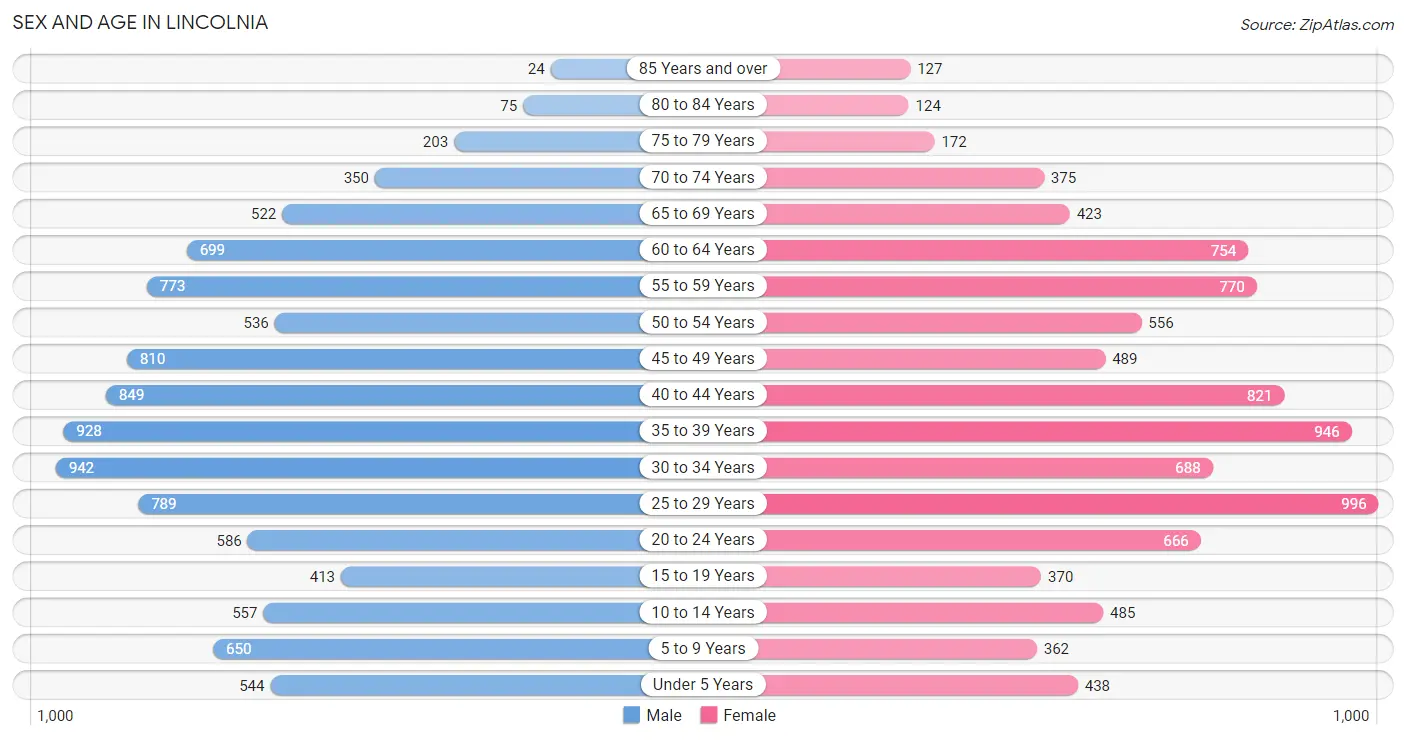
Sex and Age in Lincolnia
Sex and Age in Lincolnia
The most populous age groups in Lincolnia are 30 to 34 Years (942 | 9.2%) for men and 25 to 29 Years (996 | 10.4%) for women.
| Age Bracket | Male | Female |
| Under 5 Years | 544 (5.3%) | 438 (4.6%) |
| 5 to 9 Years | 650 (6.3%) | 362 (3.8%) |
| 10 to 14 Years | 557 (5.4%) | 485 (5.1%) |
| 15 to 19 Years | 413 (4.0%) | 370 (3.9%) |
| 20 to 24 Years | 586 (5.7%) | 666 (7.0%) |
| 25 to 29 Years | 789 (7.7%) | 996 (10.4%) |
| 30 to 34 Years | 942 (9.2%) | 688 (7.2%) |
| 35 to 39 Years | 928 (9.0%) | 946 (9.9%) |
| 40 to 44 Years | 849 (8.3%) | 821 (8.6%) |
| 45 to 49 Years | 810 (7.9%) | 489 (5.1%) |
| 50 to 54 Years | 536 (5.2%) | 556 (5.8%) |
| 55 to 59 Years | 773 (7.5%) | 770 (8.1%) |
| 60 to 64 Years | 699 (6.8%) | 754 (7.9%) |
| 65 to 69 Years | 522 (5.1%) | 423 (4.4%) |
| 70 to 74 Years | 350 (3.4%) | 375 (3.9%) |
| 75 to 79 Years | 203 (2.0%) | 172 (1.8%) |
| 80 to 84 Years | 75 (0.7%) | 124 (1.3%) |
| 85 Years and over | 24 (0.2%) | 127 (1.3%) |
| Total | 10,250 (100.0%) | 9,562 (100.0%) |
Families and Households in Lincolnia
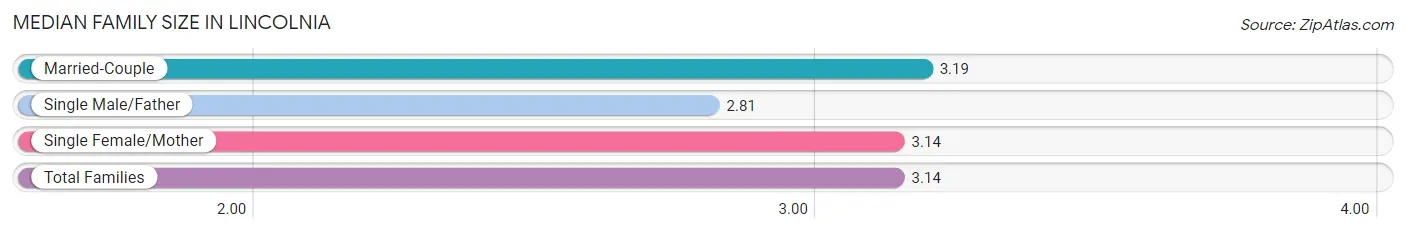
Median Family Size in Lincolnia
The median family size in Lincolnia is 3.14 persons per family, with married-couple families (3,477 | 72.4%) accounting for the largest median family size of 3.19 persons per family. On the other hand, single male/father families (420 | 8.7%) represent the smallest median family size with 2.81 persons per family.
| Family Type | # Families | Family Size |
| Married-Couple | 3,477 (72.4%) | 3.19 |
| Single Male/Father | 420 (8.7%) | 2.81 |
| Single Female/Mother | 909 (18.9%) | 3.14 |
| Total Families | 4,806 (100.0%) | 3.14 |
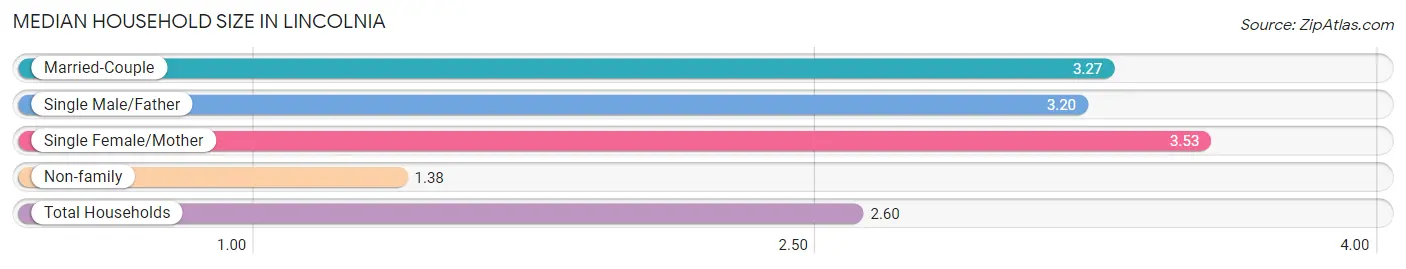
Median Household Size in Lincolnia
The median household size in Lincolnia is 2.60 persons per household, with single female/mother households (909 | 11.9%) accounting for the largest median household size of 3.53 persons per household. non-family households (2,811 | 36.9%) represent the smallest median household size with 1.38 persons per household.
| Household Type | # Households | Household Size |
| Married-Couple | 3,477 (45.7%) | 3.27 |
| Single Male/Father | 420 (5.5%) | 3.20 |
| Single Female/Mother | 909 (11.9%) | 3.53 |
| Non-family | 2,811 (36.9%) | 1.38 |
| Total Households | 7,617 (100.0%) | 2.60 |
Household Size by Marriage Status in Lincolnia
Out of a total of 7,617 households in Lincolnia, 4,806 (63.1%) are family households, while 2,811 (36.9%) are nonfamily households. The most numerous type of family households are 2-person households, comprising 2,069, and the most common type of nonfamily households are 1-person households, comprising 2,051.
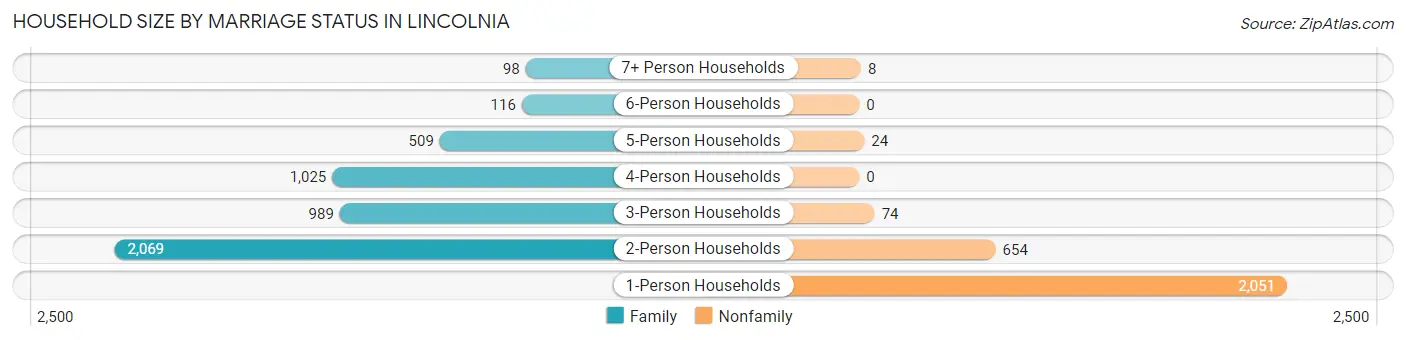
| Household Size | Family Households | Nonfamily Households |
| 1-Person Households | - | 2,051 (26.9%) |
| 2-Person Households | 2,069 (27.2%) | 654 (8.6%) |
| 3-Person Households | 989 (13.0%) | 74 (1.0%) |
| 4-Person Households | 1,025 (13.5%) | 0 (0.0%) |
| 5-Person Households | 509 (6.7%) | 24 (0.3%) |
| 6-Person Households | 116 (1.5%) | 0 (0.0%) |
| 7+ Person Households | 98 (1.3%) | 8 (0.1%) |
| Total | 4,806 (63.1%) | 2,811 (36.9%) |
Female Fertility in Lincolnia
Fertility by Age in Lincolnia
Average fertility rate in Lincolnia is 53.0 births per 1,000 women. Women in the age bracket of 20 to 34 years have the highest fertility rate with 63.0 births per 1,000 women. Women in the age bracket of 20 to 34 years acount for 54.4% of all women with births.
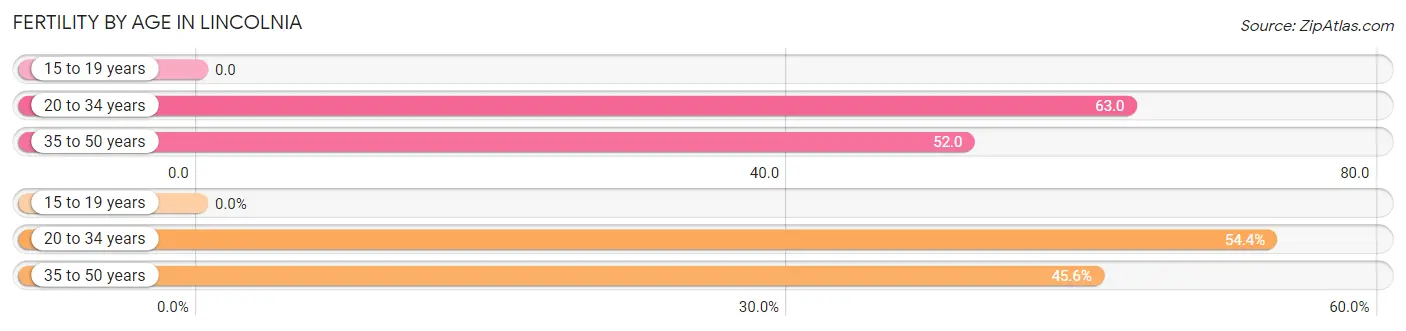
| Age Bracket | Women with Births | Births / 1,000 Women |
| 15 to 19 years | 0 (0.0%) | 0.0 |
| 20 to 34 years | 148 (54.4%) | 63.0 |
| 35 to 50 years | 124 (45.6%) | 52.0 |
| Total | 272 (100.0%) | 53.0 |
Fertility by Age by Marriage Status in Lincolnia
89.3% of women with births (272) in Lincolnia are married. The highest percentage of unmarried women with births falls into 20 to 34 years age bracket with 19.6% of them unmarried at the time of birth, while the lowest percentage of unmarried women with births belong to 35 to 50 years age bracket with 0.0% of them unmarried.
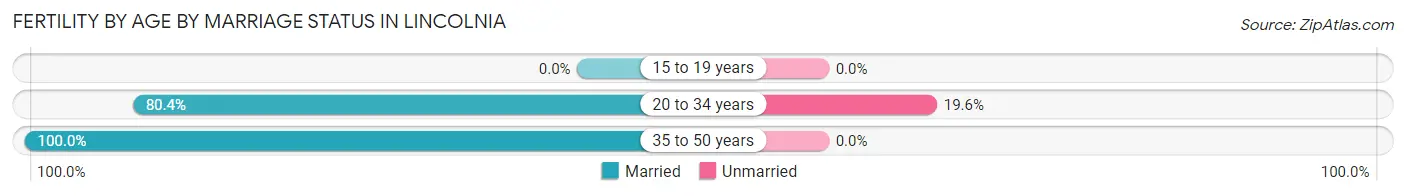
| Age Bracket | Married | Unmarried |
| 15 to 19 years | 0 (0.0%) | 0 (0.0%) |
| 20 to 34 years | 119 (80.4%) | 29 (19.6%) |
| 35 to 50 years | 124 (100.0%) | 0 (0.0%) |
| Total | 243 (89.3%) | 29 (10.7%) |
Fertility by Education in Lincolnia
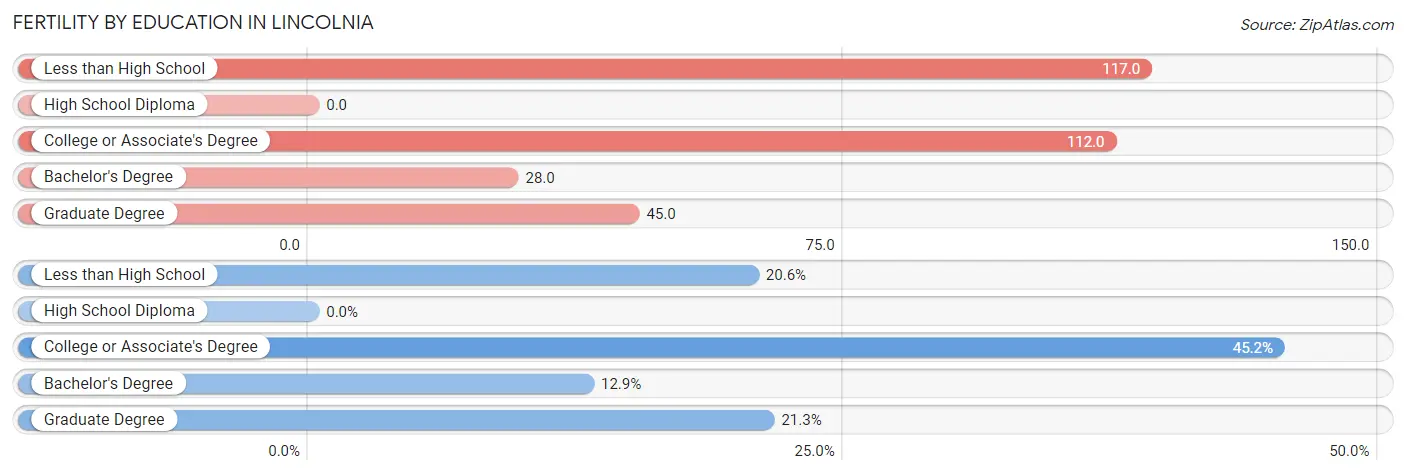
| Educational Attainment | Women with Births | Births / 1,000 Women |
| Less than High School | 56 (20.6%) | 117.0 |
| High School Diploma | 0 (0.0%) | 0.0 |
| College or Associate's Degree | 123 (45.2%) | 112.0 |
| Bachelor's Degree | 35 (12.9%) | 28.0 |
| Graduate Degree | 58 (21.3%) | 45.0 |
| Total | 272 (100.0%) | 53.0 |
Fertility by Education by Marriage Status in Lincolnia
10.7% of women with births in Lincolnia are unmarried. Women with the educational attainment of less than high school are most likely to be married with 100.0% of them married at childbirth, while women with the educational attainment of college or associate's degree are least likely to be married with 23.6% of them unmarried at childbirth.
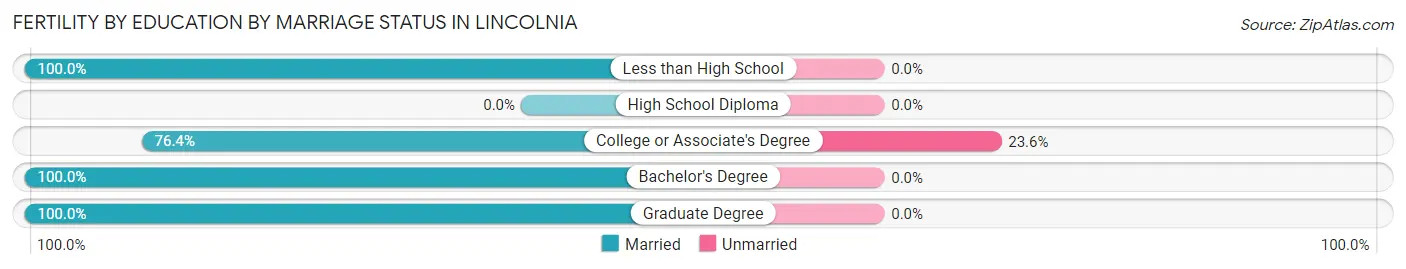
| Educational Attainment | Married | Unmarried |
| Less than High School | 56 (100.0%) | 0 (0.0%) |
| High School Diploma | 0 (0.0%) | 0 (0.0%) |
| College or Associate's Degree | 94 (76.4%) | 29 (23.6%) |
| Bachelor's Degree | 35 (100.0%) | 0 (0.0%) |
| Graduate Degree | 58 (100.0%) | 0 (0.0%) |
| Total | 243 (89.3%) | 29 (10.7%) |
Employment Characteristics in Lincolnia
Employment by Class of Employer in Lincolnia
Among the 11,876 employed individuals in Lincolnia, private company employees (7,002 | 59.0%), not-for-profit organizations (1,482 | 12.5%), and federal government employees (1,445 | 12.2%) make up the most common classes of employment.
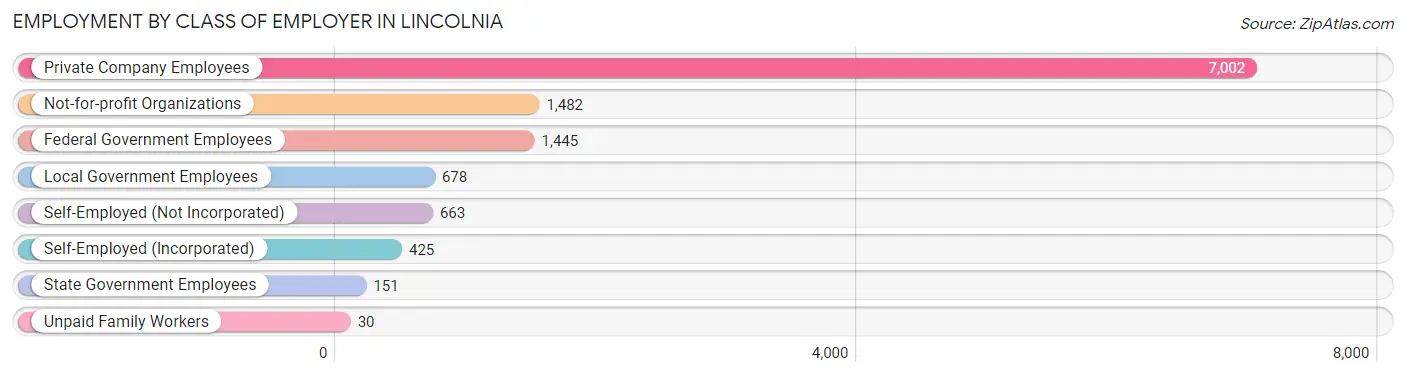
| Employer Class | # Employees | % Employees |
| Private Company Employees | 7,002 | 59.0% |
| Self-Employed (Incorporated) | 425 | 3.6% |
| Self-Employed (Not Incorporated) | 663 | 5.6% |
| Not-for-profit Organizations | 1,482 | 12.5% |
| Local Government Employees | 678 | 5.7% |
| State Government Employees | 151 | 1.3% |
| Federal Government Employees | 1,445 | 12.2% |
| Unpaid Family Workers | 30 | 0.3% |
| Total | 11,876 | 100.0% |
Employment Status by Age in Lincolnia
According to the labor force statistics for Lincolnia, out of the total population over 16 years of age (16,512), 76.6% or 12,648 individuals are in the labor force, with 4.5% or 569 of them unemployed. The age group with the highest labor force participation rate is 25 to 29 years, with 93.3% or 1,665 individuals in the labor force. Within the labor force, the 16 to 19 years age range has the highest percentage of unemployed individuals, with 43.2% or 80 of them being unemployed.
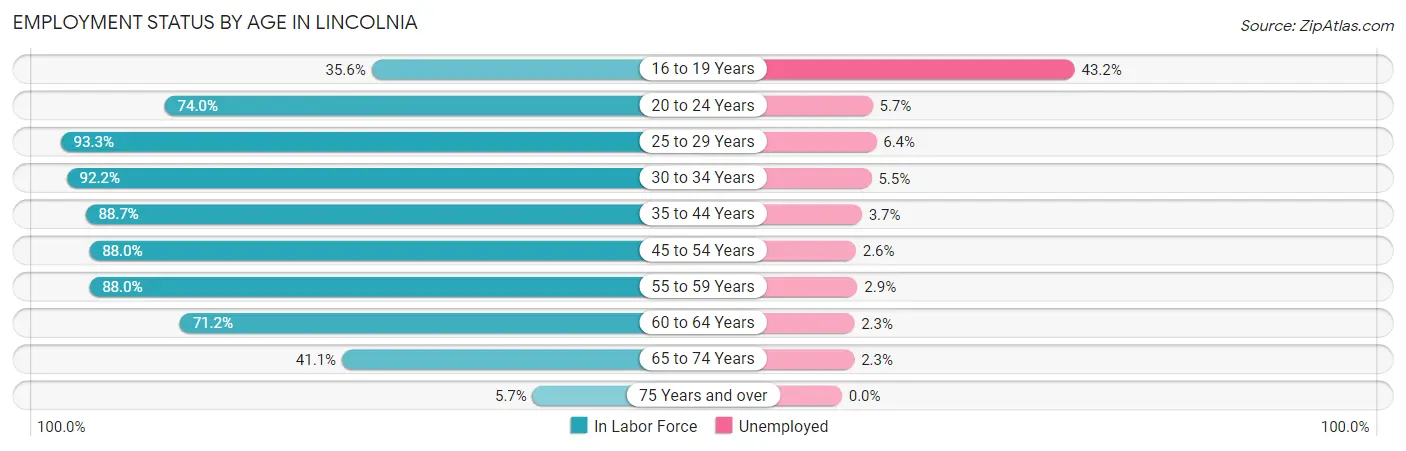
| Age Bracket | In Labor Force | Unemployed |
| 16 to 19 Years | 185 (35.6%) | 80 (43.2%) |
| 20 to 24 Years | 926 (74.0%) | 53 (5.7%) |
| 25 to 29 Years | 1,665 (93.3%) | 107 (6.4%) |
| 30 to 34 Years | 1,503 (92.2%) | 83 (5.5%) |
| 35 to 44 Years | 3,144 (88.7%) | 116 (3.7%) |
| 45 to 54 Years | 2,104 (88.0%) | 55 (2.6%) |
| 55 to 59 Years | 1,358 (88.0%) | 39 (2.9%) |
| 60 to 64 Years | 1,035 (71.2%) | 24 (2.3%) |
| 65 to 74 Years | 686 (41.1%) | 16 (2.3%) |
| 75 Years and over | 41 (5.7%) | 0 (0.0%) |
| Total | 12,648 (76.6%) | 569 (4.5%) |
Employment Status by Educational Attainment in Lincolnia
According to labor force statistics for Lincolnia, 87.5% of individuals (10,803) out of the total population between 25 and 64 years of age (12,346) are in the labor force, with 3.9% or 421 of them being unemployed. The group with the highest labor force participation rate are those with the educational attainment of bachelor's degree or higher, with 93.3% or 6,174 individuals in the labor force. Within the labor force, individuals with less than high school education have the highest percentage of unemployment, with 13.9% or 104 of them being unemployed.
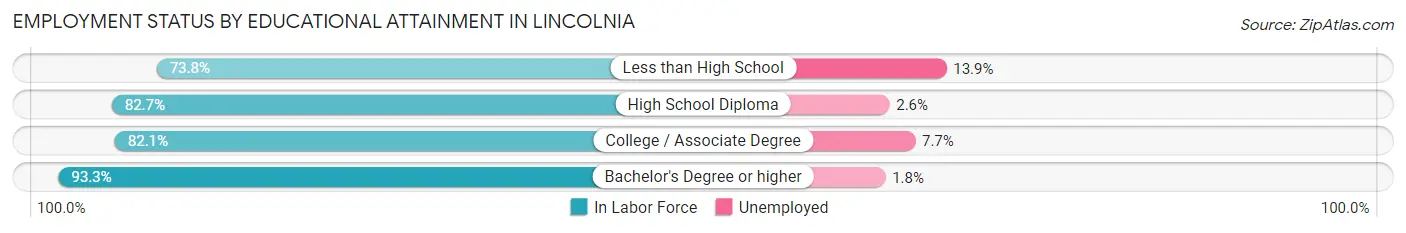
| Educational Attainment | In Labor Force | Unemployed |
| Less than High School | 750 (73.8%) | 141 (13.9%) |
| High School Diploma | 1,885 (82.7%) | 59 (2.6%) |
| College / Associate Degree | 1,998 (82.1%) | 187 (7.7%) |
| Bachelor's Degree or higher | 6,174 (93.3%) | 119 (1.8%) |
| Total | 10,803 (87.5%) | 481 (3.9%) |
Employment Occupations by Sex in Lincolnia
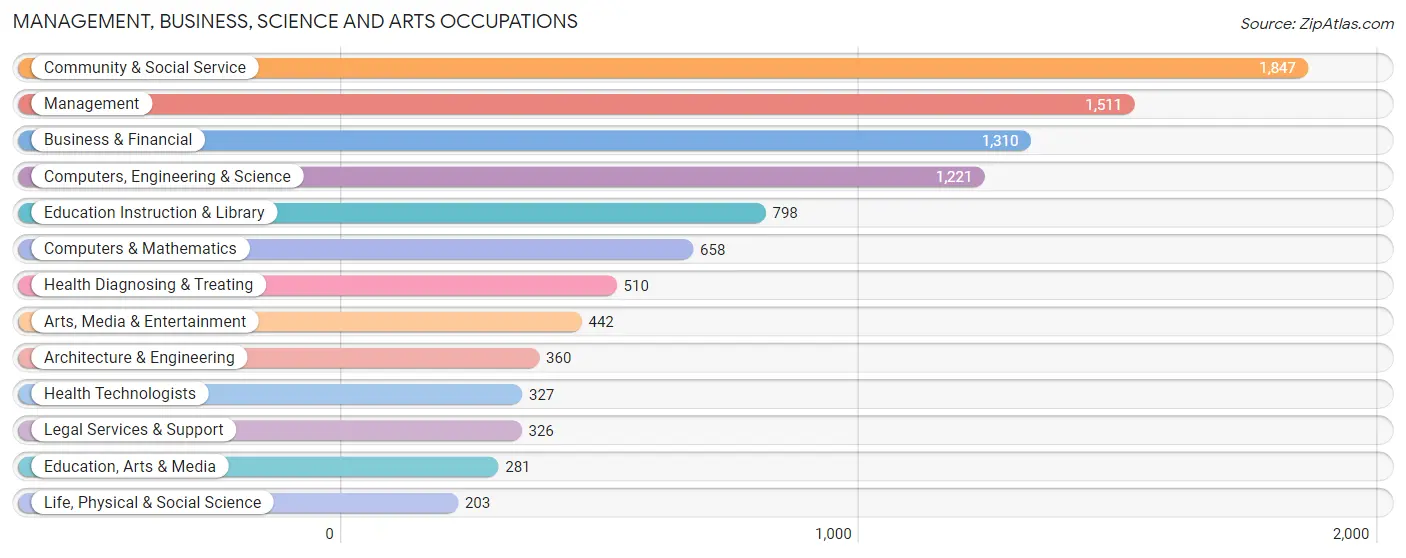
Management, Business, Science and Arts Occupations
The most common Management, Business, Science and Arts occupations in Lincolnia are Community & Social Service (1,847 | 15.7%), Management (1,511 | 12.8%), Business & Financial (1,310 | 11.1%), Computers, Engineering & Science (1,221 | 10.4%), and Education Instruction & Library (798 | 6.8%).
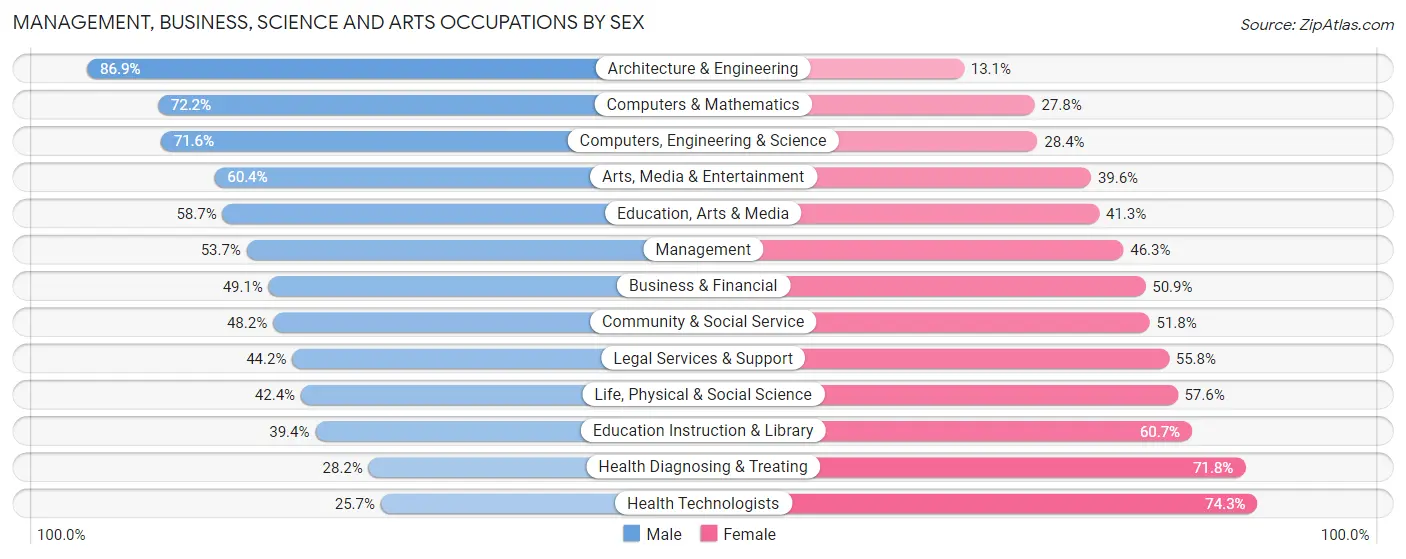
Management, Business, Science and Arts Occupations by Sex
Within the Management, Business, Science and Arts occupations in Lincolnia, the most male-oriented occupations are Architecture & Engineering (86.9%), Computers & Mathematics (72.2%), and Computers, Engineering & Science (71.6%), while the most female-oriented occupations are Health Technologists (74.3%), Health Diagnosing & Treating (71.8%), and Education Instruction & Library (60.7%).
| Occupation | Male | Female |
| Management | 811 (53.7%) | 700 (46.3%) |
| Business & Financial | 643 (49.1%) | 667 (50.9%) |
| Computers, Engineering & Science | 874 (71.6%) | 347 (28.4%) |
| Computers & Mathematics | 475 (72.2%) | 183 (27.8%) |
| Architecture & Engineering | 313 (86.9%) | 47 (13.1%) |
| Life, Physical & Social Science | 86 (42.4%) | 117 (57.6%) |
| Community & Social Service | 890 (48.2%) | 957 (51.8%) |
| Education, Arts & Media | 165 (58.7%) | 116 (41.3%) |
| Legal Services & Support | 144 (44.2%) | 182 (55.8%) |
| Education Instruction & Library | 314 (39.4%) | 484 (60.7%) |
| Arts, Media & Entertainment | 267 (60.4%) | 175 (39.6%) |
| Health Diagnosing & Treating | 144 (28.2%) | 366 (71.8%) |
| Health Technologists | 84 (25.7%) | 243 (74.3%) |
| Total (Category) | 3,362 (52.5%) | 3,037 (47.5%) |
| Total (Overall) | 6,330 (53.7%) | 5,457 (46.3%) |
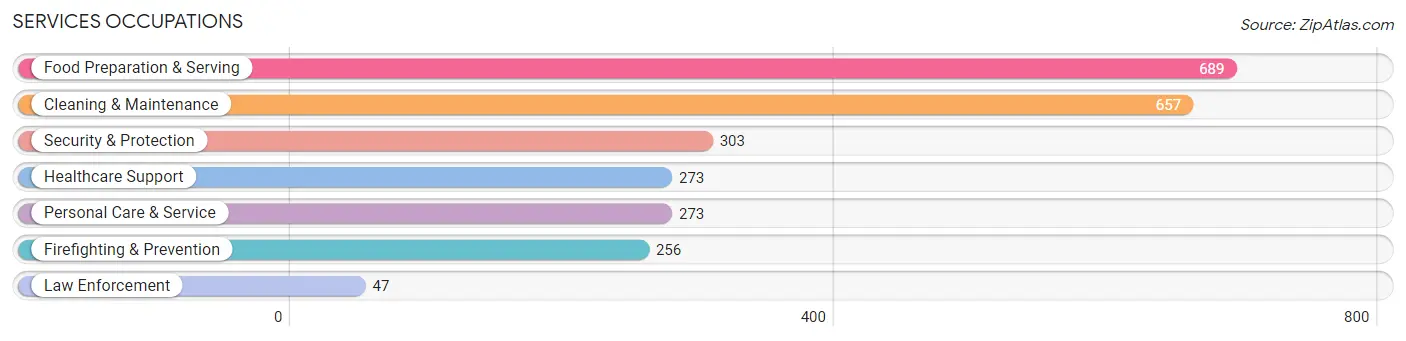
Services Occupations
The most common Services occupations in Lincolnia are Food Preparation & Serving (689 | 5.9%), Cleaning & Maintenance (657 | 5.6%), Security & Protection (303 | 2.6%), Healthcare Support (273 | 2.3%), and Personal Care & Service (273 | 2.3%).
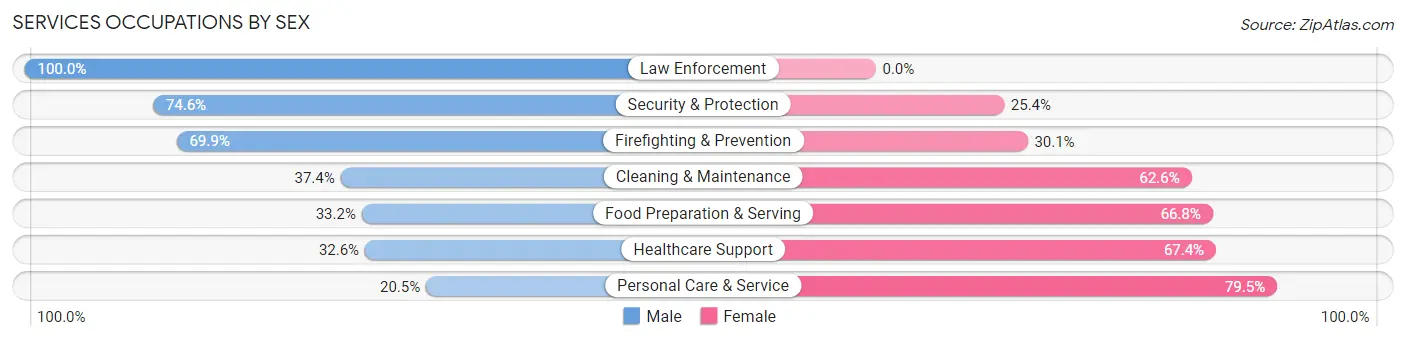
Services Occupations by Sex
Within the Services occupations in Lincolnia, the most male-oriented occupations are Law Enforcement (100.0%), Security & Protection (74.6%), and Firefighting & Prevention (69.9%), while the most female-oriented occupations are Personal Care & Service (79.5%), Healthcare Support (67.4%), and Food Preparation & Serving (66.8%).
| Occupation | Male | Female |
| Healthcare Support | 89 (32.6%) | 184 (67.4%) |
| Security & Protection | 226 (74.6%) | 77 (25.4%) |
| Firefighting & Prevention | 179 (69.9%) | 77 (30.1%) |
| Law Enforcement | 47 (100.0%) | 0 (0.0%) |
| Food Preparation & Serving | 229 (33.2%) | 460 (66.8%) |
| Cleaning & Maintenance | 246 (37.4%) | 411 (62.6%) |
| Personal Care & Service | 56 (20.5%) | 217 (79.5%) |
| Total (Category) | 846 (38.5%) | 1,349 (61.5%) |
| Total (Overall) | 6,330 (53.7%) | 5,457 (46.3%) |
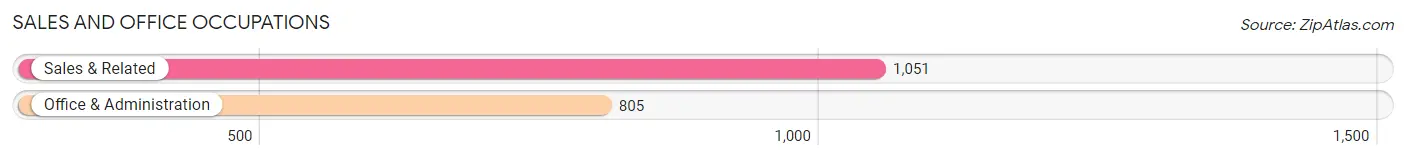
Sales and Office Occupations
The most common Sales and Office occupations in Lincolnia are Sales & Related (1,051 | 8.9%), and Office & Administration (805 | 6.8%).
Sales and Office Occupations by Sex
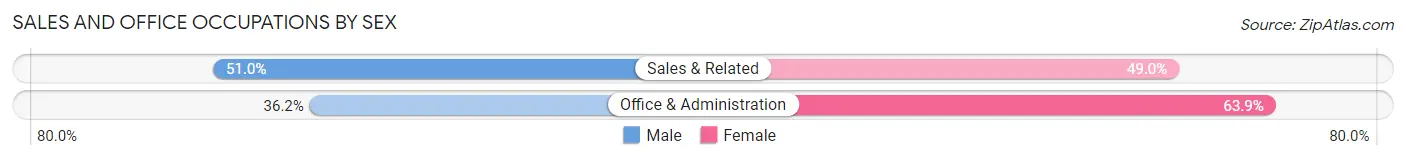
| Occupation | Male | Female |
| Sales & Related | 536 (51.0%) | 515 (49.0%) |
| Office & Administration | 291 (36.1%) | 514 (63.8%) |
| Total (Category) | 827 (44.6%) | 1,029 (55.4%) |
| Total (Overall) | 6,330 (53.7%) | 5,457 (46.3%) |
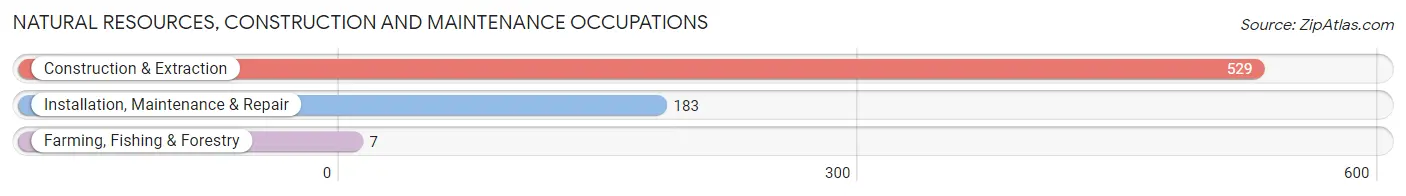
Natural Resources, Construction and Maintenance Occupations
The most common Natural Resources, Construction and Maintenance occupations in Lincolnia are Construction & Extraction (529 | 4.5%), Installation, Maintenance & Repair (183 | 1.5%), and Farming, Fishing & Forestry (7 | 0.1%).
Natural Resources, Construction and Maintenance Occupations by Sex
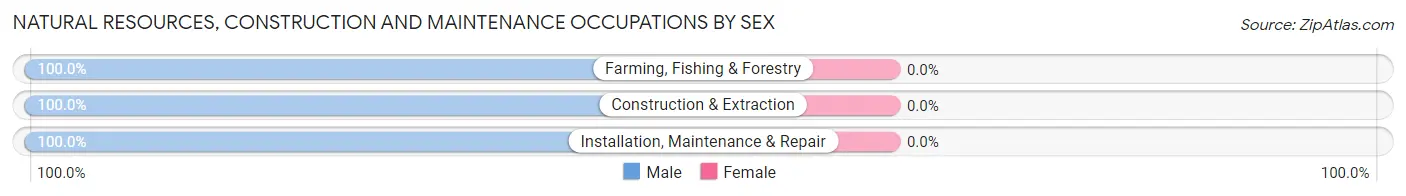
| Occupation | Male | Female |
| Farming, Fishing & Forestry | 7 (100.0%) | 0 (0.0%) |
| Construction & Extraction | 529 (100.0%) | 0 (0.0%) |
| Installation, Maintenance & Repair | 183 (100.0%) | 0 (0.0%) |
| Total (Category) | 719 (100.0%) | 0 (0.0%) |
| Total (Overall) | 6,330 (53.7%) | 5,457 (46.3%) |
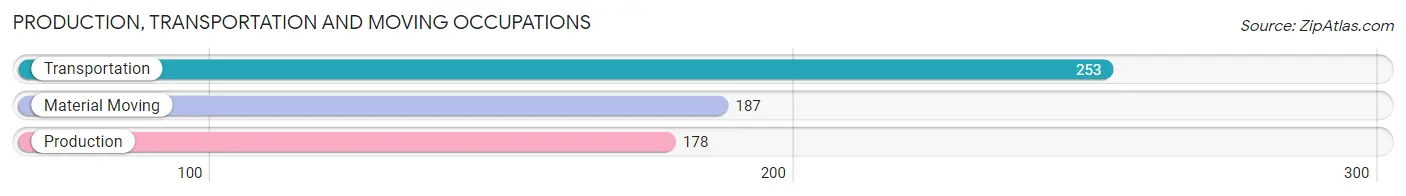
Production, Transportation and Moving Occupations
The most common Production, Transportation and Moving occupations in Lincolnia are Transportation (253 | 2.1%), Material Moving (187 | 1.6%), and Production (178 | 1.5%).
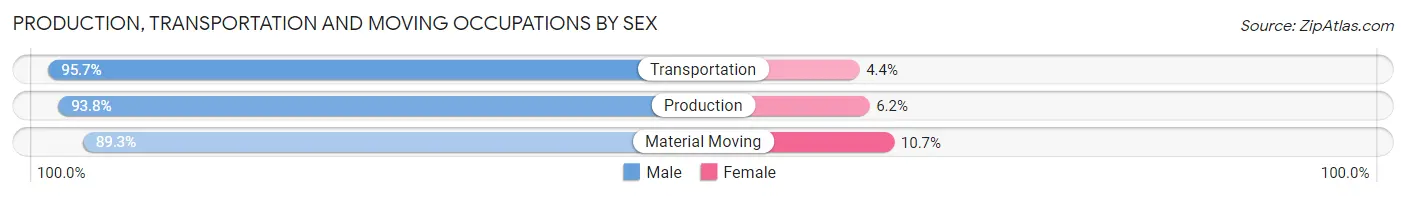
Production, Transportation and Moving Occupations by Sex
| Occupation | Male | Female |
| Production | 167 (93.8%) | 11 (6.2%) |
| Transportation | 242 (95.7%) | 11 (4.3%) |
| Material Moving | 167 (89.3%) | 20 (10.7%) |
| Total (Category) | 576 (93.2%) | 42 (6.8%) |
| Total (Overall) | 6,330 (53.7%) | 5,457 (46.3%) |
Employment Industries by Sex in Lincolnia
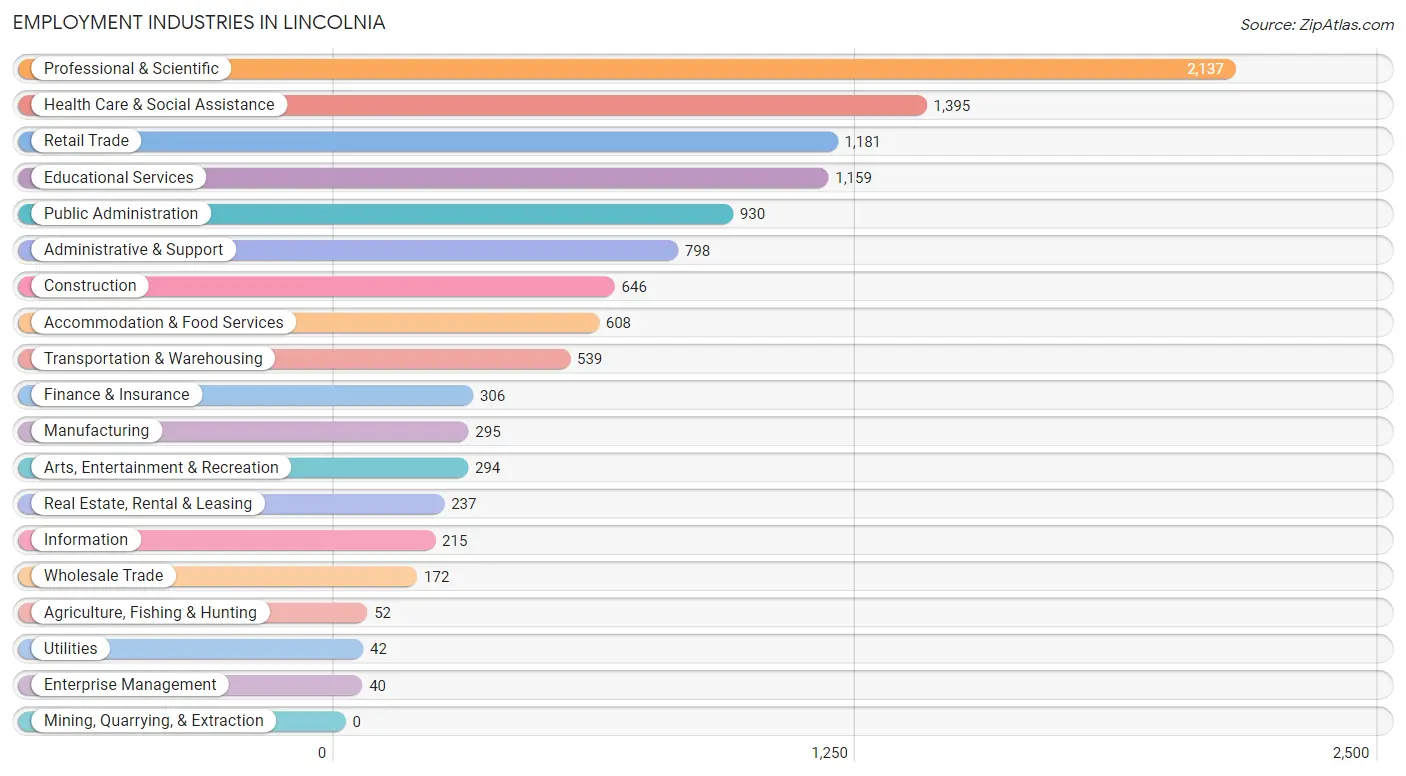
Employment Industries in Lincolnia
The major employment industries in Lincolnia include Professional & Scientific (2,137 | 18.1%), Health Care & Social Assistance (1,395 | 11.8%), Retail Trade (1,181 | 10.0%), Educational Services (1,159 | 9.8%), and Public Administration (930 | 7.9%).
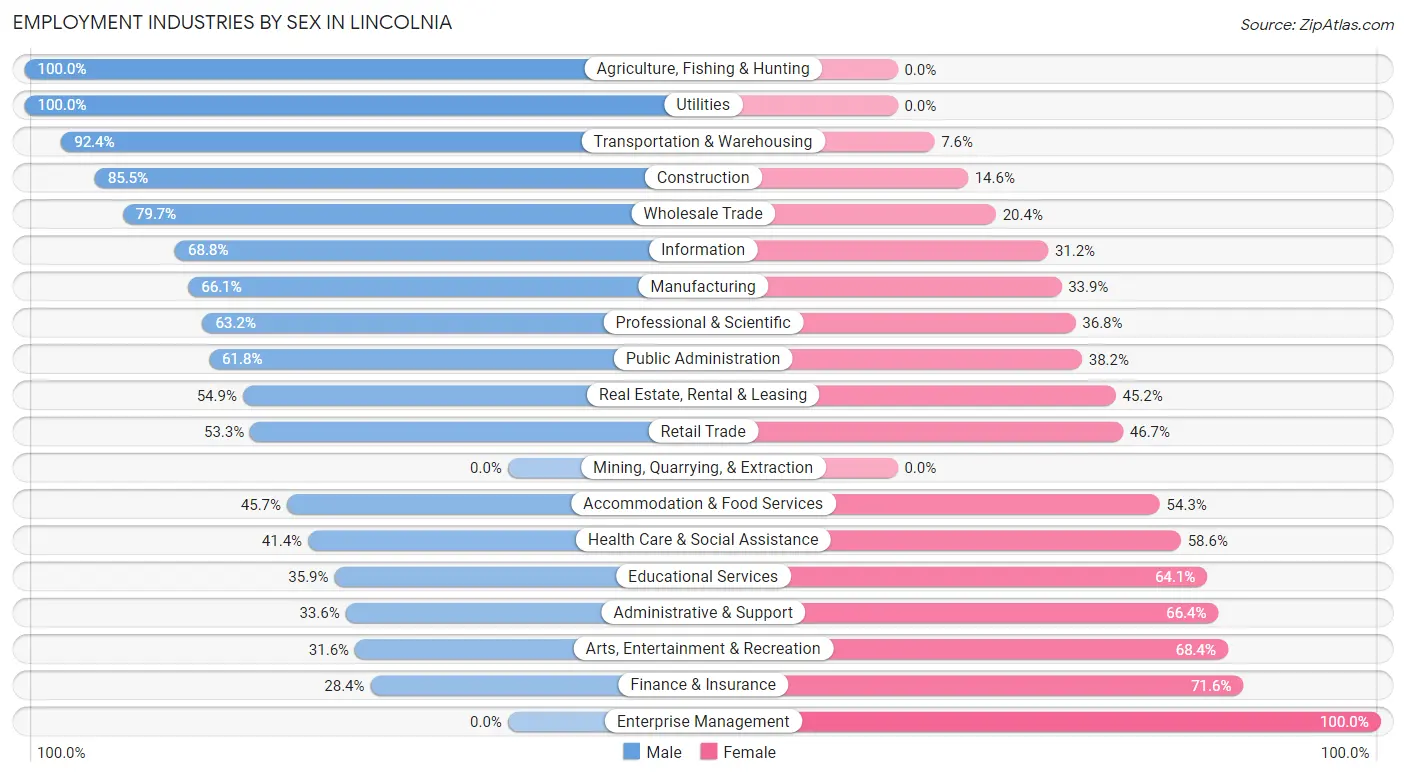
Employment Industries by Sex in Lincolnia
The Lincolnia industries that see more men than women are Agriculture, Fishing & Hunting (100.0%), Utilities (100.0%), and Transportation & Warehousing (92.4%), whereas the industries that tend to have a higher number of women are Enterprise Management (100.0%), Finance & Insurance (71.6%), and Arts, Entertainment & Recreation (68.4%).
| Industry | Male | Female |
| Agriculture, Fishing & Hunting | 52 (100.0%) | 0 (0.0%) |
| Mining, Quarrying, & Extraction | 0 (0.0%) | 0 (0.0%) |
| Construction | 552 (85.5%) | 94 (14.5%) |
| Manufacturing | 195 (66.1%) | 100 (33.9%) |
| Wholesale Trade | 137 (79.6%) | 35 (20.3%) |
| Retail Trade | 630 (53.3%) | 551 (46.7%) |
| Transportation & Warehousing | 498 (92.4%) | 41 (7.6%) |
| Utilities | 42 (100.0%) | 0 (0.0%) |
| Information | 148 (68.8%) | 67 (31.2%) |
| Finance & Insurance | 87 (28.4%) | 219 (71.6%) |
| Real Estate, Rental & Leasing | 130 (54.8%) | 107 (45.2%) |
| Professional & Scientific | 1,350 (63.2%) | 787 (36.8%) |
| Enterprise Management | 0 (0.0%) | 40 (100.0%) |
| Administrative & Support | 268 (33.6%) | 530 (66.4%) |
| Educational Services | 416 (35.9%) | 743 (64.1%) |
| Health Care & Social Assistance | 577 (41.4%) | 818 (58.6%) |
| Arts, Entertainment & Recreation | 93 (31.6%) | 201 (68.4%) |
| Accommodation & Food Services | 278 (45.7%) | 330 (54.3%) |
| Public Administration | 575 (61.8%) | 355 (38.2%) |
| Total | 6,330 (53.7%) | 5,457 (46.3%) |
Education in Lincolnia
School Enrollment in Lincolnia
The most common levels of schooling among the 4,651 students in Lincolnia are college / undergraduate (1,365 | 29.3%), high school (798 | 17.2%), and middle school (787 | 16.9%).
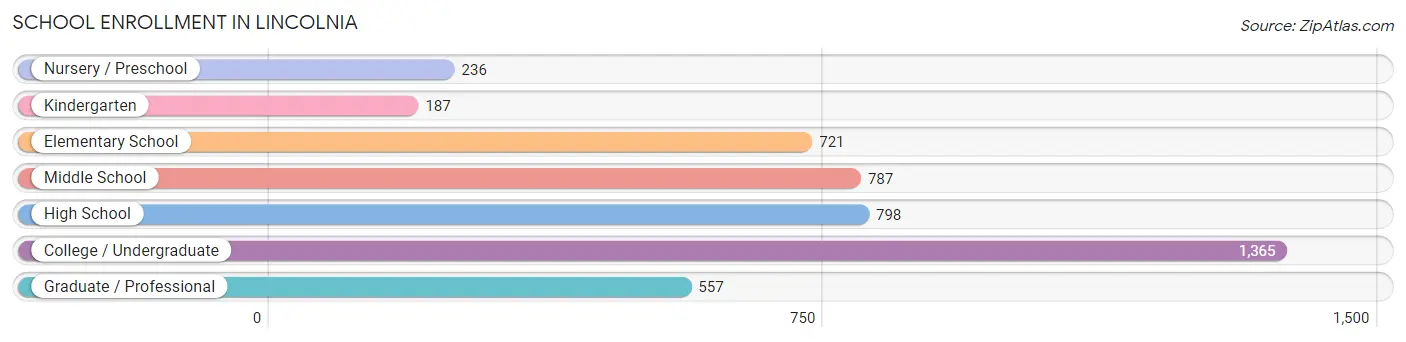
| School Level | # Students | % Students |
| Nursery / Preschool | 236 | 5.1% |
| Kindergarten | 187 | 4.0% |
| Elementary School | 721 | 15.5% |
| Middle School | 787 | 16.9% |
| High School | 798 | 17.2% |
| College / Undergraduate | 1,365 | 29.3% |
| Graduate / Professional | 557 | 12.0% |
| Total | 4,651 | 100.0% |
School Enrollment by Age by Funding Source in Lincolnia
Out of a total of 4,651 students who are enrolled in schools in Lincolnia, 967 (20.8%) attend a private institution, while the remaining 3,684 (79.2%) are enrolled in public schools. The age group of 3 to 4 year olds has the highest likelihood of being enrolled in private schools, with 140 (72.2% in the age bracket) enrolled. Conversely, the age group of 18 to 19 year olds has the lowest likelihood of being enrolled in a private school, with 183 (100.0% in the age bracket) attending a public institution.
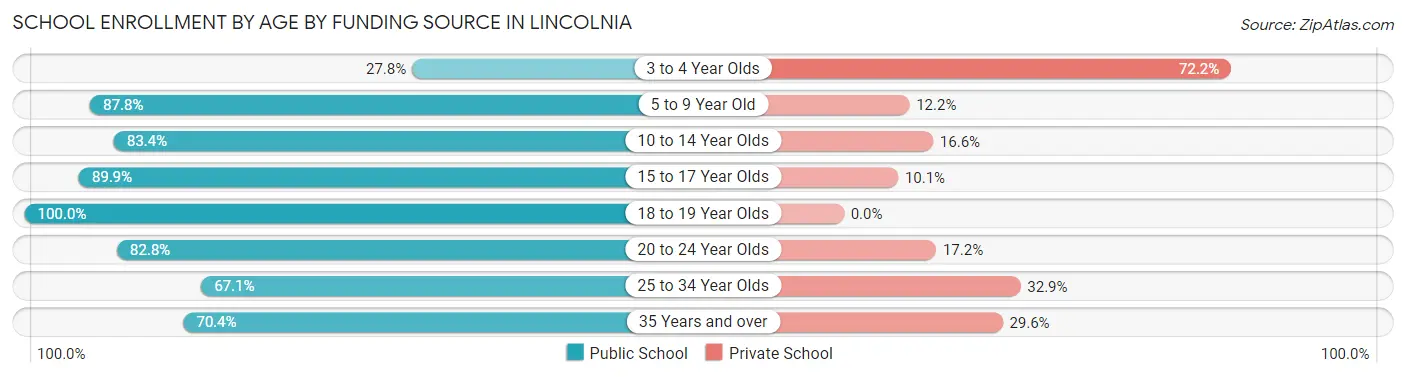
| Age Bracket | Public School | Private School |
| 3 to 4 Year Olds | 54 (27.8%) | 140 (72.2%) |
| 5 to 9 Year Old | 820 (87.8%) | 114 (12.2%) |
| 10 to 14 Year Olds | 848 (83.4%) | 169 (16.6%) |
| 15 to 17 Year Olds | 480 (89.9%) | 54 (10.1%) |
| 18 to 19 Year Olds | 183 (100.0%) | 0 (0.0%) |
| 20 to 24 Year Olds | 438 (82.8%) | 91 (17.2%) |
| 25 to 34 Year Olds | 530 (67.1%) | 260 (32.9%) |
| 35 Years and over | 331 (70.4%) | 139 (29.6%) |
| Total | 3,684 (79.2%) | 967 (20.8%) |
Educational Attainment by Field of Study in Lincolnia
Business (1,309 | 15.5%), social sciences (1,133 | 13.4%), science & technology (735 | 8.7%), engineering (678 | 8.0%), and computers & mathematics (668 | 7.9%) are the most common fields of study among 8,459 individuals in Lincolnia who have obtained a bachelor's degree or higher.
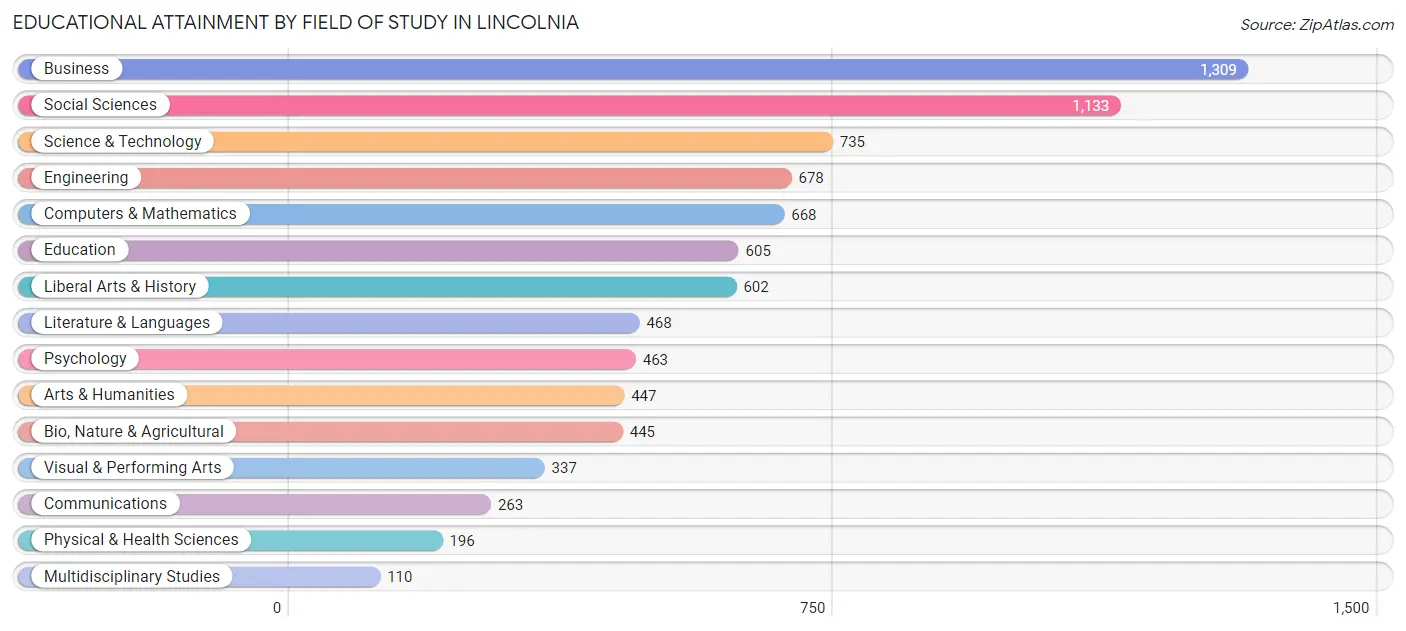
| Field of Study | # Graduates | % Graduates |
| Computers & Mathematics | 668 | 7.9% |
| Bio, Nature & Agricultural | 445 | 5.3% |
| Physical & Health Sciences | 196 | 2.3% |
| Psychology | 463 | 5.5% |
| Social Sciences | 1,133 | 13.4% |
| Engineering | 678 | 8.0% |
| Multidisciplinary Studies | 110 | 1.3% |
| Science & Technology | 735 | 8.7% |
| Business | 1,309 | 15.5% |
| Education | 605 | 7.1% |
| Literature & Languages | 468 | 5.5% |
| Liberal Arts & History | 602 | 7.1% |
| Visual & Performing Arts | 337 | 4.0% |
| Communications | 263 | 3.1% |
| Arts & Humanities | 447 | 5.3% |
| Total | 8,459 | 100.0% |
Transportation & Commute in Lincolnia
Vehicle Availability by Sex in Lincolnia
The most prevalent vehicle ownership categories in Lincolnia are males with 2 vehicles (2,953, accounting for 45.9%) and females with 2 vehicles (2,298, making up 54.3%).
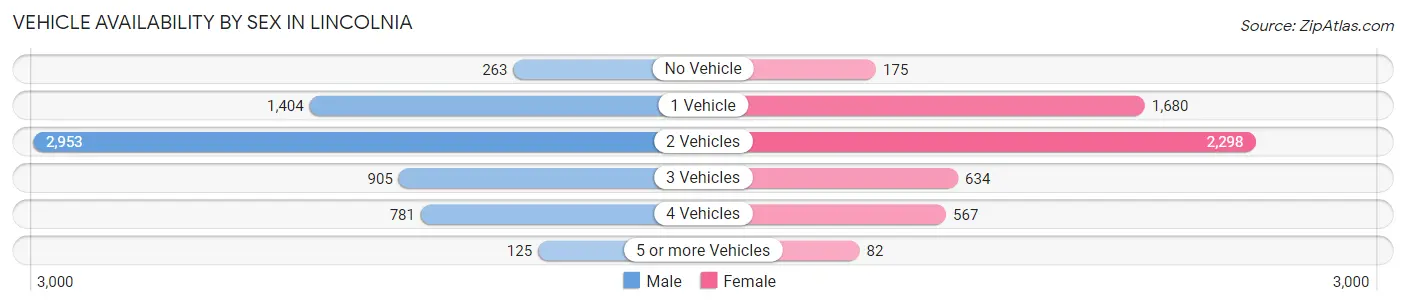
| Vehicles Available | Male | Female |
| No Vehicle | 263 (4.1%) | 175 (3.2%) |
| 1 Vehicle | 1,404 (21.8%) | 1,680 (30.9%) |
| 2 Vehicles | 2,953 (45.9%) | 2,298 (42.3%) |
| 3 Vehicles | 905 (14.1%) | 634 (11.7%) |
| 4 Vehicles | 781 (12.1%) | 567 (10.4%) |
| 5 or more Vehicles | 125 (1.9%) | 82 (1.5%) |
| Total | 6,431 (100.0%) | 5,436 (100.0%) |
Commute Time in Lincolnia
The most frequently occuring commute durations in Lincolnia are 30 to 34 minutes (1,760 commuters, 17.9%), 20 to 24 minutes (1,715 commuters, 17.4%), and 15 to 19 minutes (1,387 commuters, 14.1%).
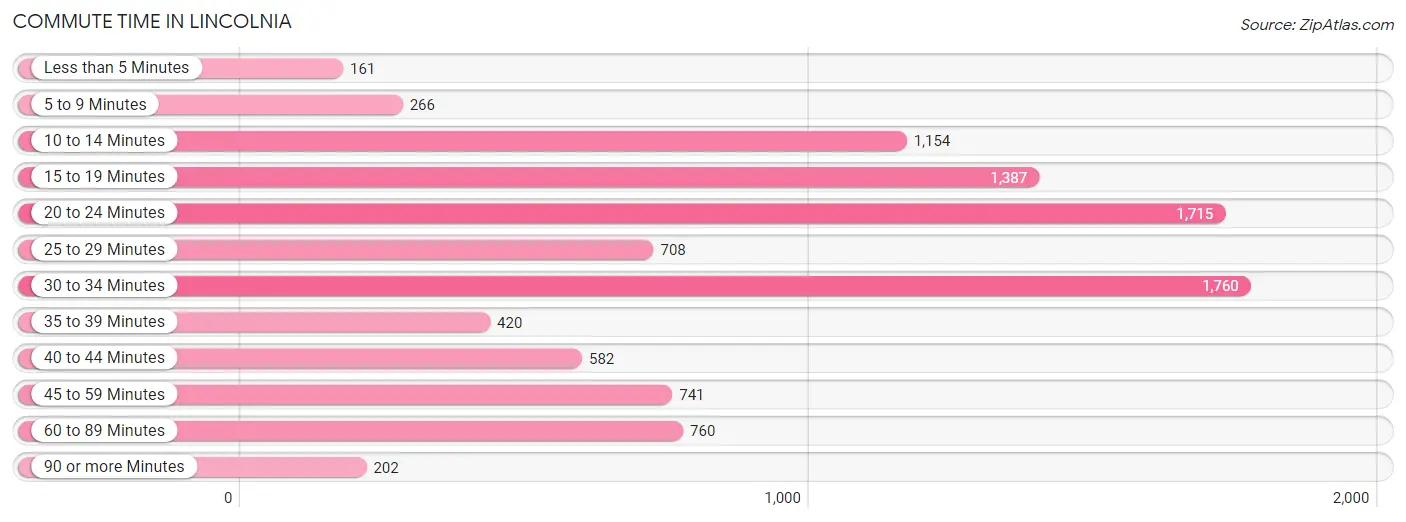
| Commute Time | # Commuters | % Commuters |
| Less than 5 Minutes | 161 | 1.6% |
| 5 to 9 Minutes | 266 | 2.7% |
| 10 to 14 Minutes | 1,154 | 11.7% |
| 15 to 19 Minutes | 1,387 | 14.1% |
| 20 to 24 Minutes | 1,715 | 17.4% |
| 25 to 29 Minutes | 708 | 7.2% |
| 30 to 34 Minutes | 1,760 | 17.9% |
| 35 to 39 Minutes | 420 | 4.3% |
| 40 to 44 Minutes | 582 | 5.9% |
| 45 to 59 Minutes | 741 | 7.5% |
| 60 to 89 Minutes | 760 | 7.7% |
| 90 or more Minutes | 202 | 2.1% |
Commute Time by Sex in Lincolnia
The most common commute times in Lincolnia are 30 to 34 minutes (959 commuters, 18.2%) for males and 20 to 24 minutes (888 commuters, 19.4%) for females.
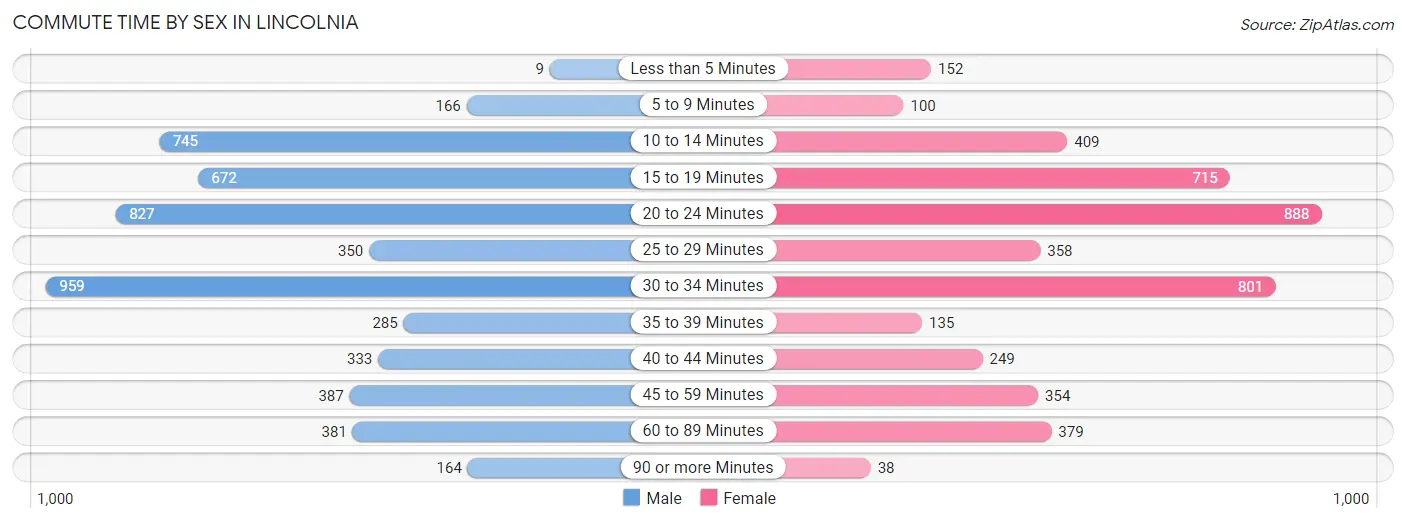
| Commute Time | Male | Female |
| Less than 5 Minutes | 9 (0.2%) | 152 (3.3%) |
| 5 to 9 Minutes | 166 (3.2%) | 100 (2.2%) |
| 10 to 14 Minutes | 745 (14.1%) | 409 (8.9%) |
| 15 to 19 Minutes | 672 (12.7%) | 715 (15.6%) |
| 20 to 24 Minutes | 827 (15.7%) | 888 (19.4%) |
| 25 to 29 Minutes | 350 (6.6%) | 358 (7.8%) |
| 30 to 34 Minutes | 959 (18.2%) | 801 (17.5%) |
| 35 to 39 Minutes | 285 (5.4%) | 135 (2.9%) |
| 40 to 44 Minutes | 333 (6.3%) | 249 (5.4%) |
| 45 to 59 Minutes | 387 (7.3%) | 354 (7.7%) |
| 60 to 89 Minutes | 381 (7.2%) | 379 (8.3%) |
| 90 or more Minutes | 164 (3.1%) | 38 (0.8%) |
Time of Departure to Work by Sex in Lincolnia
The most frequent times of departure to work in Lincolnia are 7:00 AM to 7:29 AM (901, 17.1%) for males and 8:00 AM to 8:29 AM (789, 17.2%) for females.
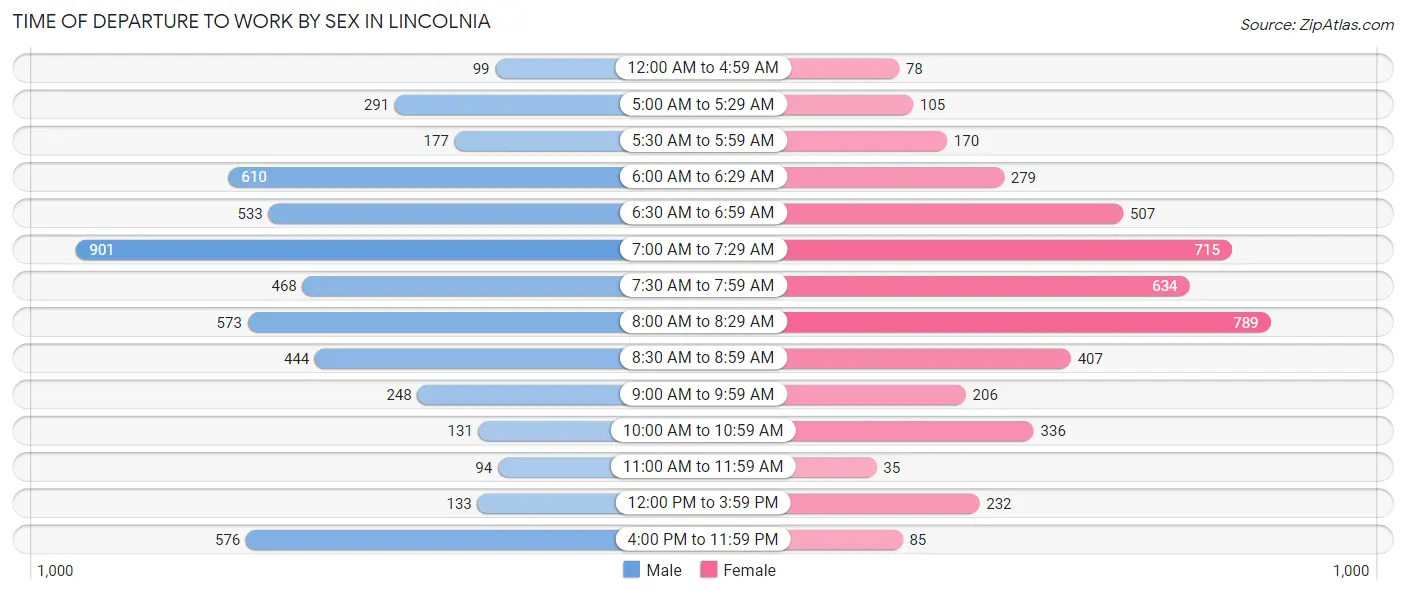
| Time of Departure | Male | Female |
| 12:00 AM to 4:59 AM | 99 (1.9%) | 78 (1.7%) |
| 5:00 AM to 5:29 AM | 291 (5.5%) | 105 (2.3%) |
| 5:30 AM to 5:59 AM | 177 (3.4%) | 170 (3.7%) |
| 6:00 AM to 6:29 AM | 610 (11.6%) | 279 (6.1%) |
| 6:30 AM to 6:59 AM | 533 (10.1%) | 507 (11.1%) |
| 7:00 AM to 7:29 AM | 901 (17.1%) | 715 (15.6%) |
| 7:30 AM to 7:59 AM | 468 (8.9%) | 634 (13.9%) |
| 8:00 AM to 8:29 AM | 573 (10.9%) | 789 (17.2%) |
| 8:30 AM to 8:59 AM | 444 (8.4%) | 407 (8.9%) |
| 9:00 AM to 9:59 AM | 248 (4.7%) | 206 (4.5%) |
| 10:00 AM to 10:59 AM | 131 (2.5%) | 336 (7.3%) |
| 11:00 AM to 11:59 AM | 94 (1.8%) | 35 (0.8%) |
| 12:00 PM to 3:59 PM | 133 (2.5%) | 232 (5.1%) |
| 4:00 PM to 11:59 PM | 576 (10.9%) | 85 (1.9%) |
| Total | 5,278 (100.0%) | 4,578 (100.0%) |
Housing Occupancy in Lincolnia
Occupancy by Ownership in Lincolnia
Of the total 7,617 dwellings in Lincolnia, owner-occupied units account for 4,283 (56.2%), while renter-occupied units make up 3,334 (43.8%).
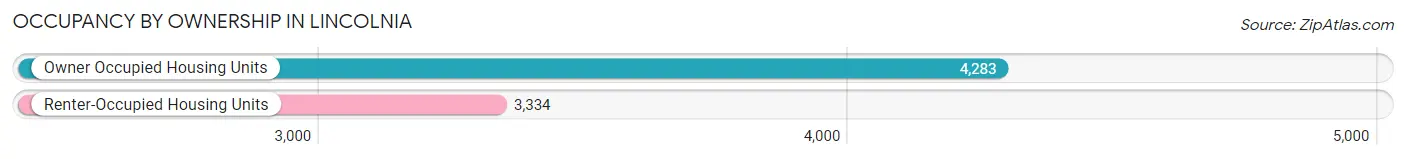
| Occupancy | # Housing Units | % Housing Units |
| Owner Occupied Housing Units | 4,283 | 56.2% |
| Renter-Occupied Housing Units | 3,334 | 43.8% |
| Total Occupied Housing Units | 7,617 | 100.0% |
Occupancy by Household Size in Lincolnia
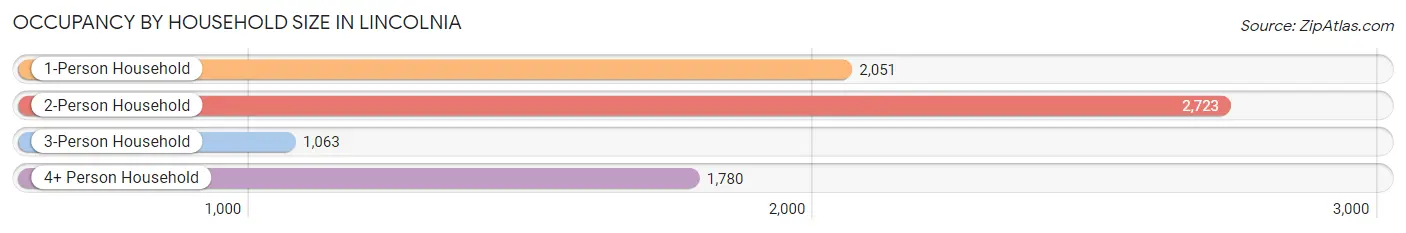
| Household Size | # Housing Units | % Housing Units |
| 1-Person Household | 2,051 | 26.9% |
| 2-Person Household | 2,723 | 35.7% |
| 3-Person Household | 1,063 | 14.0% |
| 4+ Person Household | 1,780 | 23.4% |
| Total Housing Units | 7,617 | 100.0% |
Occupancy by Ownership by Household Size in Lincolnia

| Household Size | Owner-occupied | Renter-occupied |
| 1-Person Household | 1,181 (57.6%) | 870 (42.4%) |
| 2-Person Household | 1,591 (58.4%) | 1,132 (41.6%) |
| 3-Person Household | 680 (64.0%) | 383 (36.0%) |
| 4+ Person Household | 831 (46.7%) | 949 (53.3%) |
| Total Housing Units | 4,283 (56.2%) | 3,334 (43.8%) |
Occupancy by Educational Attainment in Lincolnia
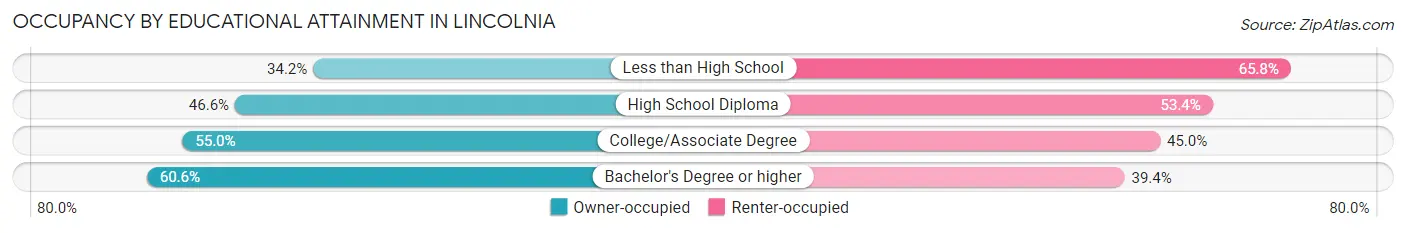
| Household Size | Owner-occupied | Renter-occupied |
| Less than High School | 151 (34.2%) | 290 (65.8%) |
| High School Diploma | 486 (46.6%) | 556 (53.4%) |
| College/Associate Degree | 702 (55.0%) | 575 (45.0%) |
| Bachelor's Degree or higher | 2,944 (60.6%) | 1,913 (39.4%) |
Occupancy by Age of Householder in Lincolnia
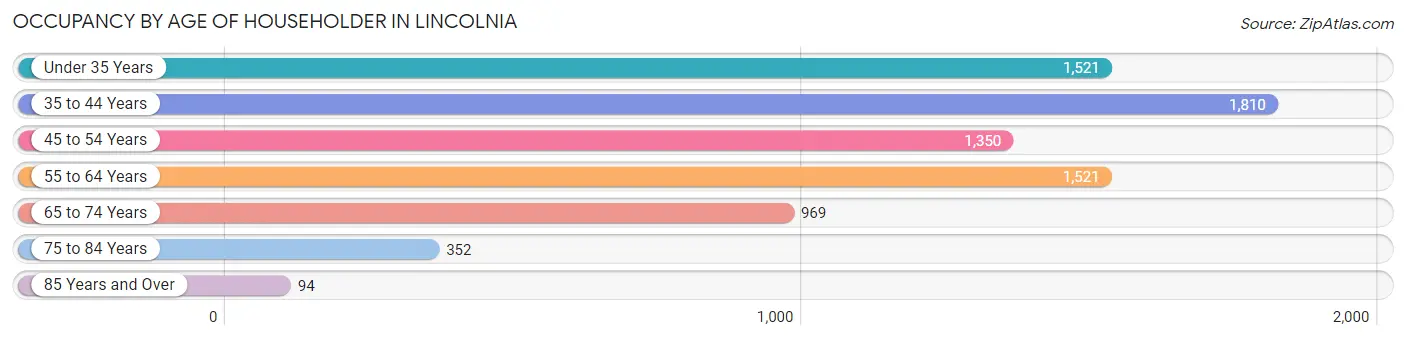
| Age Bracket | # Households | % Households |
| Under 35 Years | 1,521 | 20.0% |
| 35 to 44 Years | 1,810 | 23.8% |
| 45 to 54 Years | 1,350 | 17.7% |
| 55 to 64 Years | 1,521 | 20.0% |
| 65 to 74 Years | 969 | 12.7% |
| 75 to 84 Years | 352 | 4.6% |
| 85 Years and Over | 94 | 1.2% |
| Total | 7,617 | 100.0% |
Housing Finances in Lincolnia
Median Income by Occupancy in Lincolnia
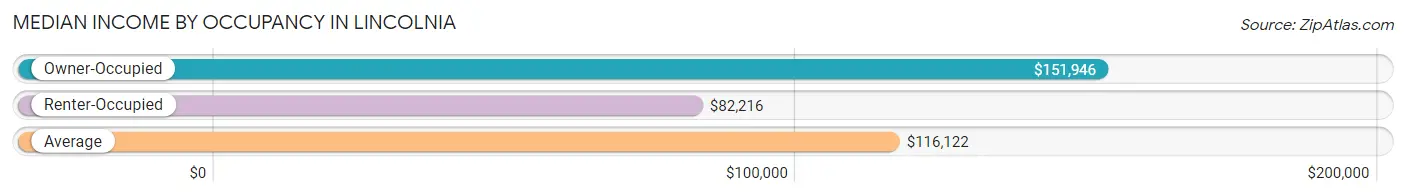
| Occupancy Type | # Households | Median Income |
| Owner-Occupied | 4,283 (56.2%) | $151,946 |
| Renter-Occupied | 3,334 (43.8%) | $82,216 |
| Average | 7,617 (100.0%) | $116,122 |
Occupancy by Householder Income Bracket in Lincolnia
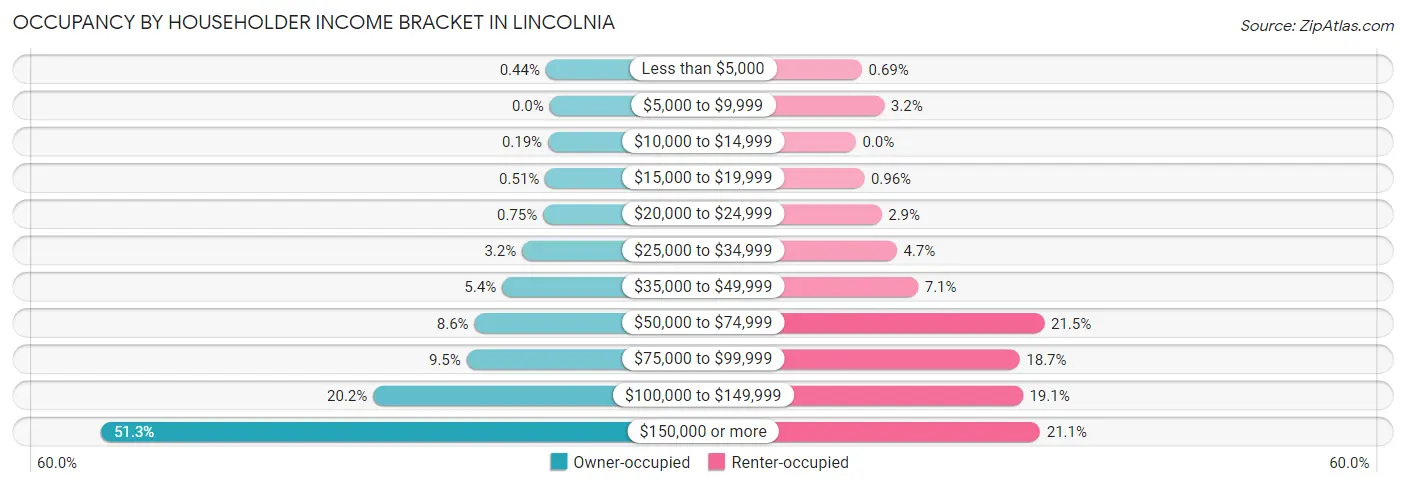
| Income Bracket | Owner-occupied | Renter-occupied |
| Less than $5,000 | 19 (0.4%) | 23 (0.7%) |
| $5,000 to $9,999 | 0 (0.0%) | 108 (3.2%) |
| $10,000 to $14,999 | 8 (0.2%) | 0 (0.0%) |
| $15,000 to $19,999 | 22 (0.5%) | 32 (1.0%) |
| $20,000 to $24,999 | 32 (0.7%) | 98 (2.9%) |
| $25,000 to $34,999 | 135 (3.2%) | 156 (4.7%) |
| $35,000 to $49,999 | 233 (5.4%) | 237 (7.1%) |
| $50,000 to $74,999 | 368 (8.6%) | 718 (21.5%) |
| $75,000 to $99,999 | 406 (9.5%) | 624 (18.7%) |
| $100,000 to $149,999 | 864 (20.2%) | 636 (19.1%) |
| $150,000 or more | 2,196 (51.3%) | 702 (21.1%) |
| Total | 4,283 (100.0%) | 3,334 (100.0%) |
Monthly Housing Cost Tiers in Lincolnia
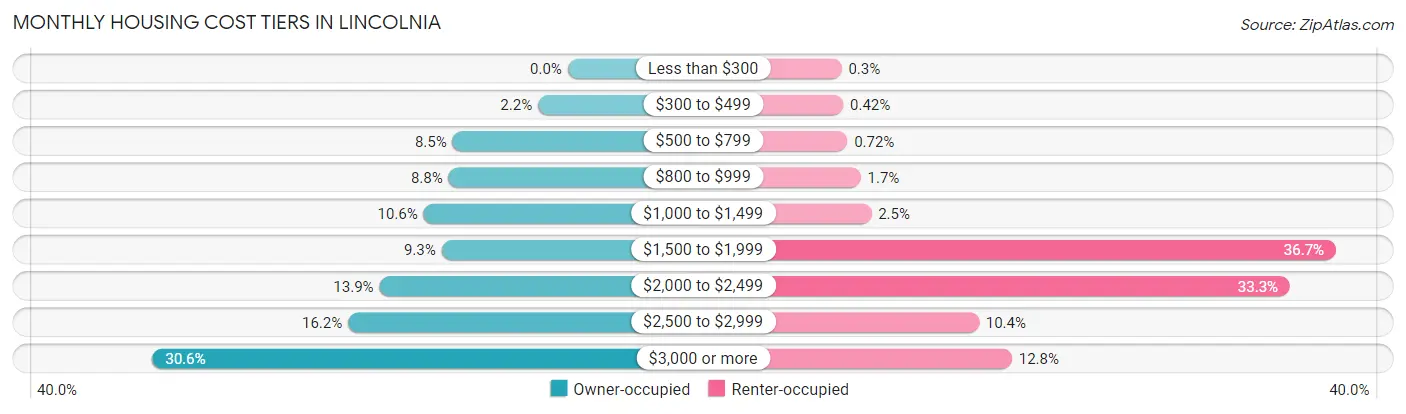
| Monthly Cost | Owner-occupied | Renter-occupied |
| Less than $300 | 0 (0.0%) | 10 (0.3%) |
| $300 to $499 | 94 (2.2%) | 14 (0.4%) |
| $500 to $799 | 363 (8.5%) | 24 (0.7%) |
| $800 to $999 | 376 (8.8%) | 57 (1.7%) |
| $1,000 to $1,499 | 455 (10.6%) | 83 (2.5%) |
| $1,500 to $1,999 | 398 (9.3%) | 1,224 (36.7%) |
| $2,000 to $2,499 | 594 (13.9%) | 1,111 (33.3%) |
| $2,500 to $2,999 | 693 (16.2%) | 347 (10.4%) |
| $3,000 or more | 1,310 (30.6%) | 428 (12.8%) |
| Total | 4,283 (100.0%) | 3,334 (100.0%) |
Physical Housing Characteristics in Lincolnia
Housing Structures in Lincolnia
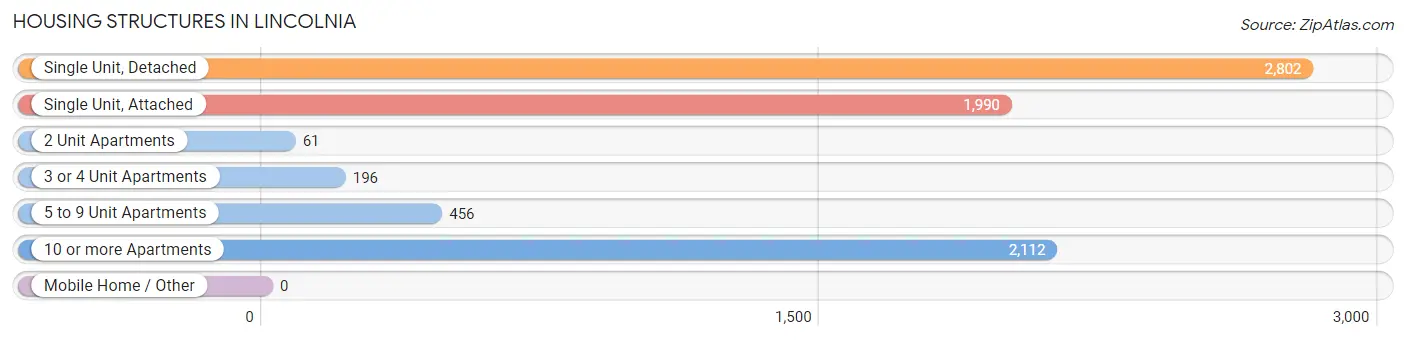
| Structure Type | # Housing Units | % Housing Units |
| Single Unit, Detached | 2,802 | 36.8% |
| Single Unit, Attached | 1,990 | 26.1% |
| 2 Unit Apartments | 61 | 0.8% |
| 3 or 4 Unit Apartments | 196 | 2.6% |
| 5 to 9 Unit Apartments | 456 | 6.0% |
| 10 or more Apartments | 2,112 | 27.7% |
| Mobile Home / Other | 0 | 0.0% |
| Total | 7,617 | 100.0% |
Housing Structures by Occupancy in Lincolnia
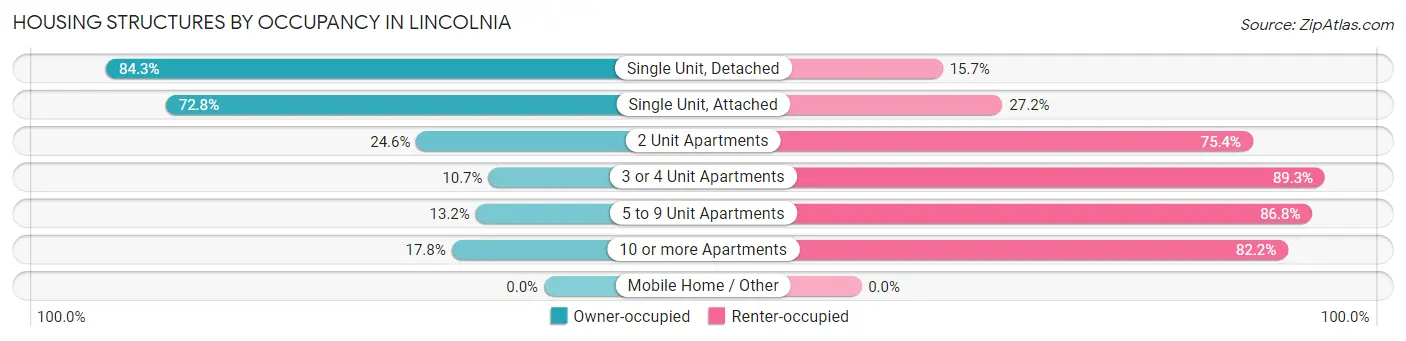
| Structure Type | Owner-occupied | Renter-occupied |
| Single Unit, Detached | 2,362 (84.3%) | 440 (15.7%) |
| Single Unit, Attached | 1,449 (72.8%) | 541 (27.2%) |
| 2 Unit Apartments | 15 (24.6%) | 46 (75.4%) |
| 3 or 4 Unit Apartments | 21 (10.7%) | 175 (89.3%) |
| 5 to 9 Unit Apartments | 60 (13.2%) | 396 (86.8%) |
| 10 or more Apartments | 376 (17.8%) | 1,736 (82.2%) |
| Mobile Home / Other | 0 (0.0%) | 0 (0.0%) |
| Total | 4,283 (56.2%) | 3,334 (43.8%) |
Housing Structures by Number of Rooms in Lincolnia
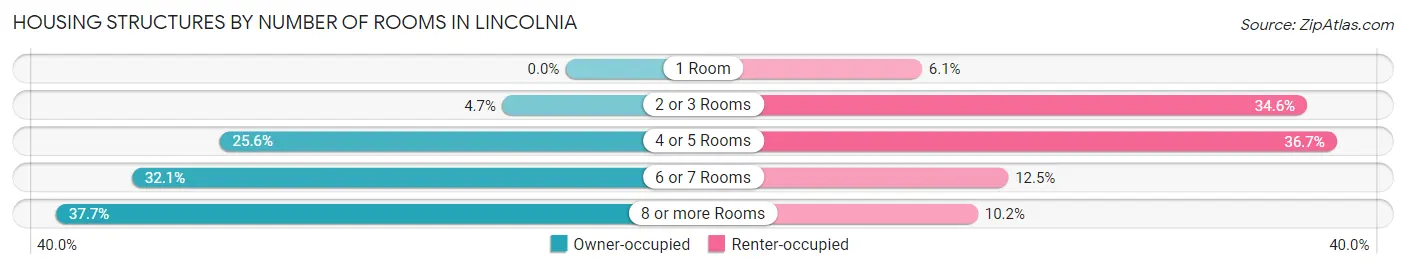
| Number of Rooms | Owner-occupied | Renter-occupied |
| 1 Room | 0 (0.0%) | 202 (6.1%) |
| 2 or 3 Rooms | 201 (4.7%) | 1,152 (34.5%) |
| 4 or 5 Rooms | 1,095 (25.6%) | 1,225 (36.7%) |
| 6 or 7 Rooms | 1,373 (32.1%) | 415 (12.4%) |
| 8 or more Rooms | 1,614 (37.7%) | 340 (10.2%) |
| Total | 4,283 (100.0%) | 3,334 (100.0%) |
Housing Structure by Heating Type in Lincolnia
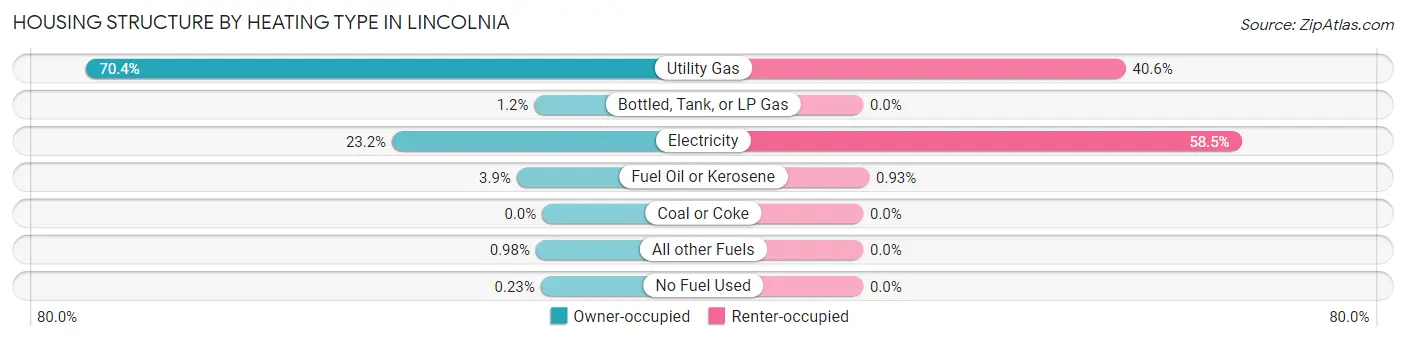
| Heating Type | Owner-occupied | Renter-occupied |
| Utility Gas | 3,017 (70.4%) | 1,353 (40.6%) |
| Bottled, Tank, or LP Gas | 52 (1.2%) | 0 (0.0%) |
| Electricity | 994 (23.2%) | 1,950 (58.5%) |
| Fuel Oil or Kerosene | 168 (3.9%) | 31 (0.9%) |
| Coal or Coke | 0 (0.0%) | 0 (0.0%) |
| All other Fuels | 42 (1.0%) | 0 (0.0%) |
| No Fuel Used | 10 (0.2%) | 0 (0.0%) |
| Total | 4,283 (100.0%) | 3,334 (100.0%) |
Household Vehicle Usage in Lincolnia
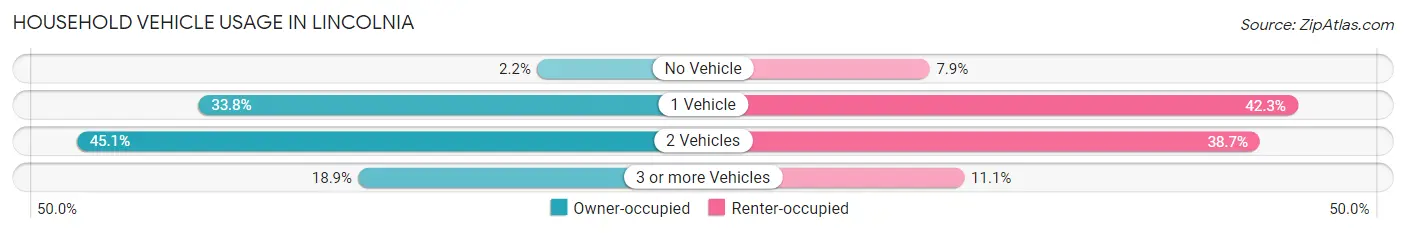
| Vehicles per Household | Owner-occupied | Renter-occupied |
| No Vehicle | 94 (2.2%) | 263 (7.9%) |
| 1 Vehicle | 1,447 (33.8%) | 1,409 (42.3%) |
| 2 Vehicles | 1,933 (45.1%) | 1,291 (38.7%) |
| 3 or more Vehicles | 809 (18.9%) | 371 (11.1%) |
| Total | 4,283 (100.0%) | 3,334 (100.0%) |
Real Estate & Mortgages in Lincolnia
Real Estate and Mortgage Overview in Lincolnia
| Characteristic | Without Mortgage | With Mortgage |
| Housing Units | 1,281 | 3,002 |
| Median Property Value | $566,900 | $589,400 |
| Median Household Income | $143,207 | $1,597 |
| Monthly Housing Costs | $902 | $1,310 |
| Real Estate Taxes | $6,235 | $87 |
Property Value by Mortgage Status in Lincolnia
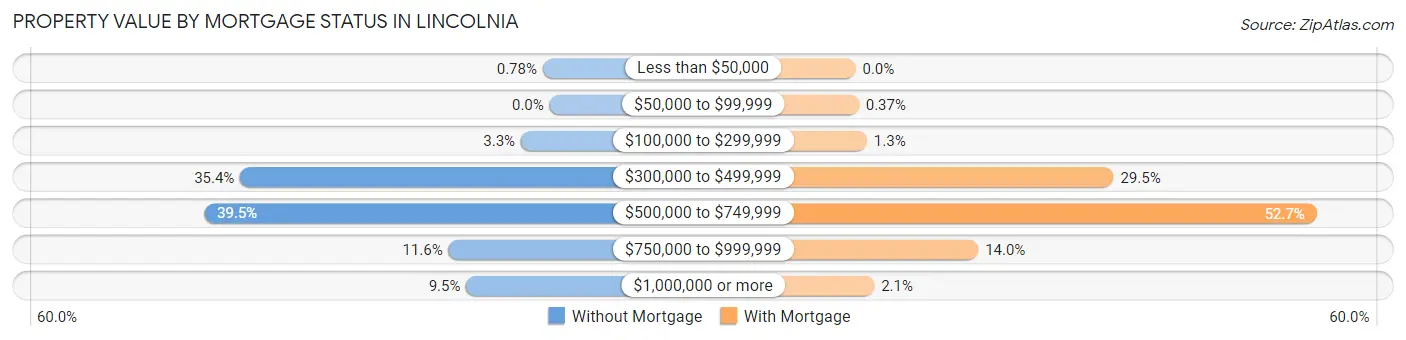
| Property Value | Without Mortgage | With Mortgage |
| Less than $50,000 | 10 (0.8%) | 0 (0.0%) |
| $50,000 to $99,999 | 0 (0.0%) | 11 (0.4%) |
| $100,000 to $299,999 | 42 (3.3%) | 39 (1.3%) |
| $300,000 to $499,999 | 453 (35.4%) | 885 (29.5%) |
| $500,000 to $749,999 | 506 (39.5%) | 1,582 (52.7%) |
| $750,000 to $999,999 | 148 (11.6%) | 421 (14.0%) |
| $1,000,000 or more | 122 (9.5%) | 64 (2.1%) |
| Total | 1,281 (100.0%) | 3,002 (100.0%) |
Household Income by Mortgage Status in Lincolnia
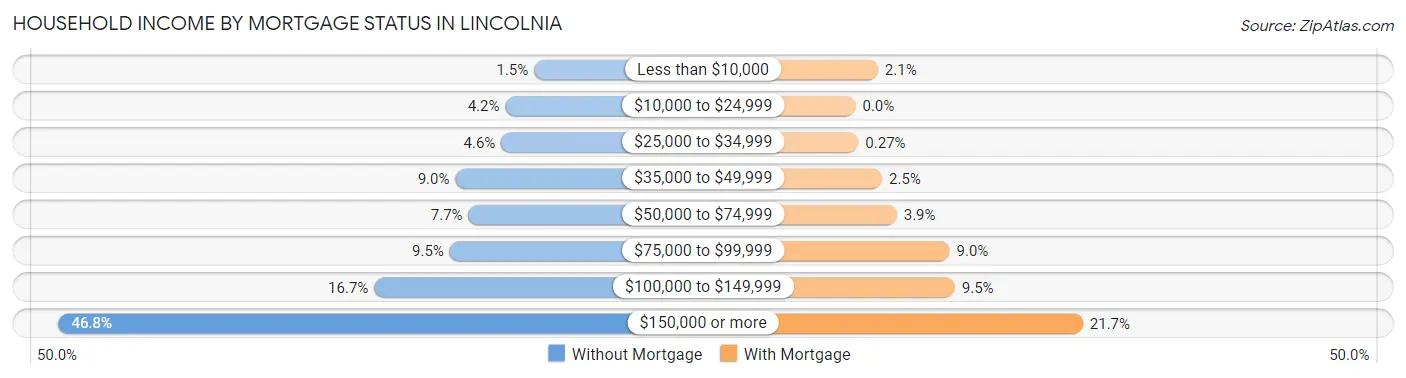
| Household Income | Without Mortgage | With Mortgage |
| Less than $10,000 | 19 (1.5%) | 64 (2.1%) |
| $10,000 to $24,999 | 54 (4.2%) | 0 (0.0%) |
| $25,000 to $34,999 | 59 (4.6%) | 8 (0.3%) |
| $35,000 to $49,999 | 115 (9.0%) | 76 (2.5%) |
| $50,000 to $74,999 | 99 (7.7%) | 118 (3.9%) |
| $75,000 to $99,999 | 122 (9.5%) | 269 (9.0%) |
| $100,000 to $149,999 | 214 (16.7%) | 284 (9.5%) |
| $150,000 or more | 599 (46.8%) | 650 (21.6%) |
| Total | 1,281 (100.0%) | 3,002 (100.0%) |
Property Value to Household Income Ratio in Lincolnia
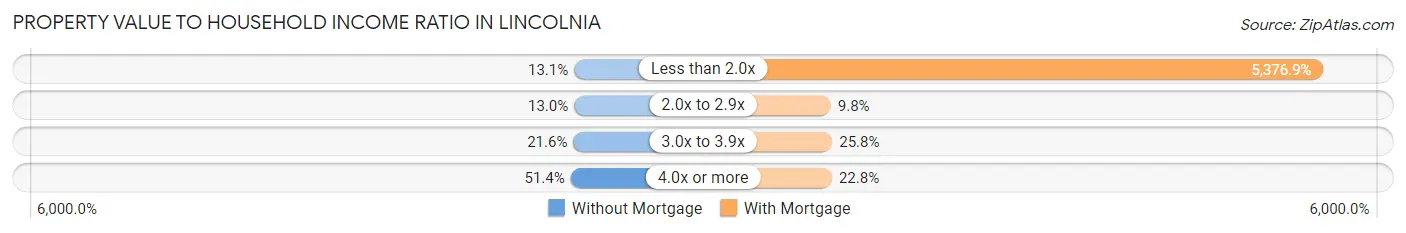
| Value-to-Income Ratio | Without Mortgage | With Mortgage |
| Less than 2.0x | 168 (13.1%) | 161,413 (5,376.9%) |
| 2.0x to 2.9x | 167 (13.0%) | 295 (9.8%) |
| 3.0x to 3.9x | 277 (21.6%) | 773 (25.8%) |
| 4.0x or more | 659 (51.4%) | 683 (22.8%) |
| Total | 1,281 (100.0%) | 3,002 (100.0%) |
Real Estate Taxes by Mortgage Status in Lincolnia
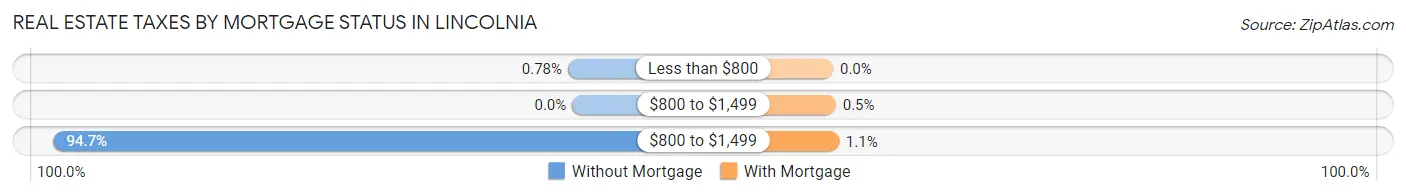
| Property Taxes | Without Mortgage | With Mortgage |
| Less than $800 | 10 (0.8%) | 0 (0.0%) |
| $800 to $1,499 | 0 (0.0%) | 15 (0.5%) |
| $800 to $1,499 | 1,213 (94.7%) | 32 (1.1%) |
| Total | 1,281 (100.0%) | 3,002 (100.0%) |
Health & Disability in Lincolnia
Health Insurance Coverage by Age in Lincolnia
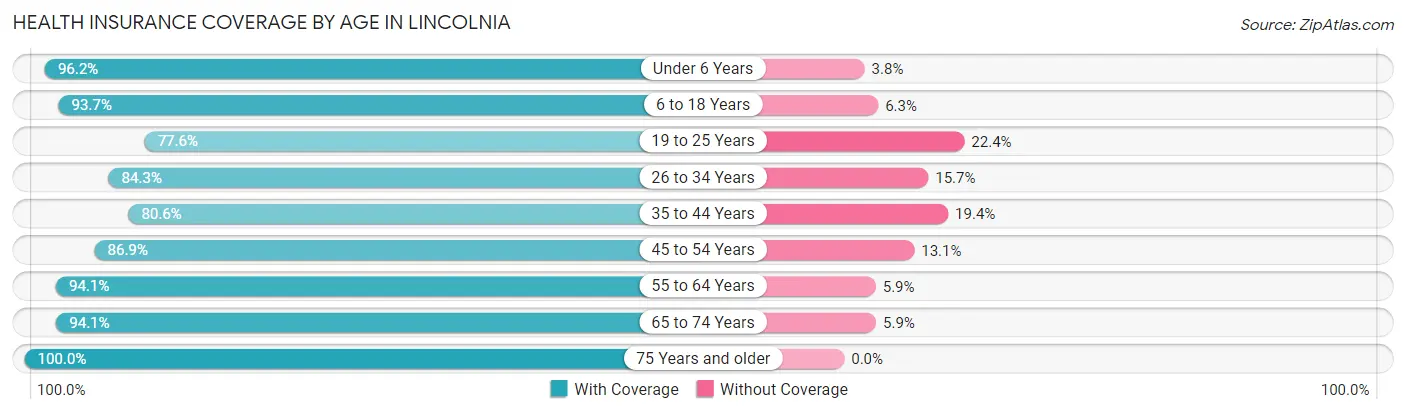
| Age Bracket | With Coverage | Without Coverage |
| Under 6 Years | 1,163 (96.2%) | 46 (3.8%) |
| 6 to 18 Years | 2,368 (93.7%) | 160 (6.3%) |
| 19 to 25 Years | 1,382 (77.6%) | 399 (22.4%) |
| 26 to 34 Years | 2,423 (84.3%) | 450 (15.7%) |
| 35 to 44 Years | 2,739 (80.6%) | 658 (19.4%) |
| 45 to 54 Years | 2,030 (86.9%) | 305 (13.1%) |
| 55 to 64 Years | 2,820 (94.1%) | 176 (5.9%) |
| 65 to 74 Years | 1,571 (94.1%) | 99 (5.9%) |
| 75 Years and older | 717 (100.0%) | 0 (0.0%) |
| Total | 17,213 (88.2%) | 2,293 (11.8%) |
Health Insurance Coverage by Citizenship Status in Lincolnia
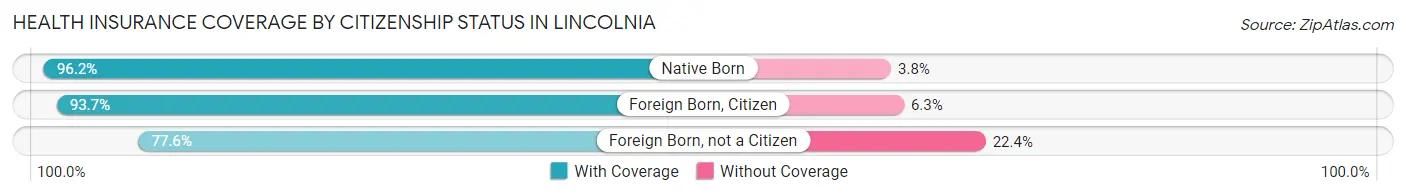
| Citizenship Status | With Coverage | Without Coverage |
| Native Born | 1,163 (96.2%) | 46 (3.8%) |
| Foreign Born, Citizen | 2,368 (93.7%) | 160 (6.3%) |
| Foreign Born, not a Citizen | 1,382 (77.6%) | 399 (22.4%) |
Health Insurance Coverage by Household Income in Lincolnia
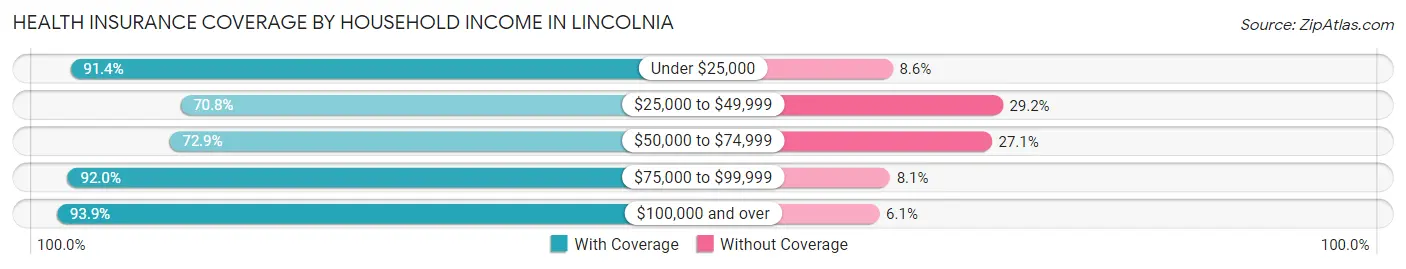
| Household Income | With Coverage | Without Coverage |
| Under $25,000 | 652 (91.4%) | 61 (8.6%) |
| $25,000 to $49,999 | 1,472 (70.8%) | 606 (29.2%) |
| $50,000 to $74,999 | 1,921 (72.9%) | 715 (27.1%) |
| $75,000 to $99,999 | 2,318 (91.9%) | 203 (8.1%) |
| $100,000 and over | 10,840 (93.9%) | 699 (6.1%) |
Public vs Private Health Insurance Coverage by Age in Lincolnia
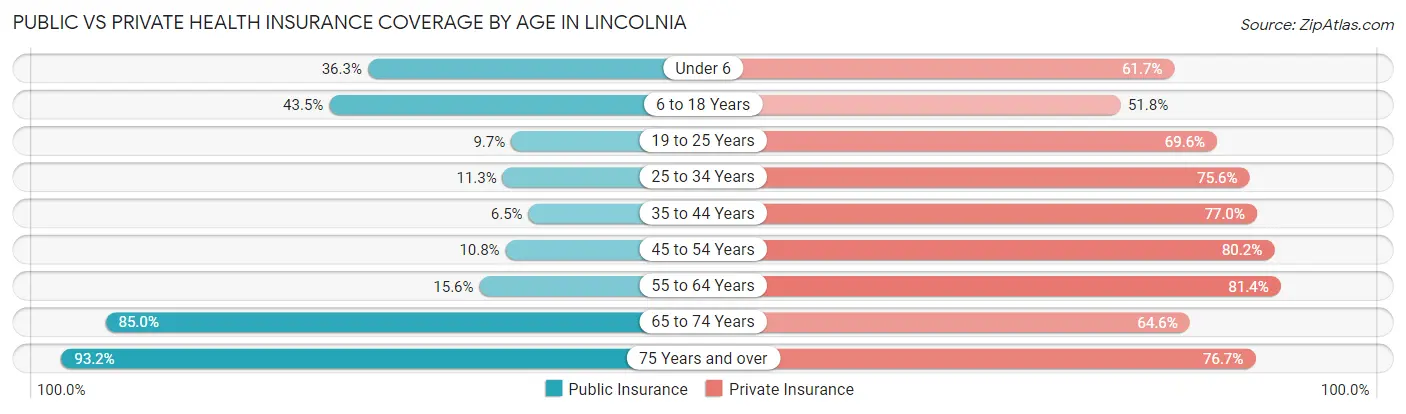
| Age Bracket | Public Insurance | Private Insurance |
| Under 6 | 439 (36.3%) | 746 (61.7%) |
| 6 to 18 Years | 1,099 (43.5%) | 1,310 (51.8%) |
| 19 to 25 Years | 173 (9.7%) | 1,240 (69.6%) |
| 25 to 34 Years | 324 (11.3%) | 2,173 (75.6%) |
| 35 to 44 Years | 220 (6.5%) | 2,616 (77.0%) |
| 45 to 54 Years | 251 (10.7%) | 1,873 (80.2%) |
| 55 to 64 Years | 467 (15.6%) | 2,440 (81.4%) |
| 65 to 74 Years | 1,419 (85.0%) | 1,078 (64.5%) |
| 75 Years and over | 668 (93.2%) | 550 (76.7%) |
| Total | 5,060 (25.9%) | 14,026 (71.9%) |
Disability Status by Sex by Age in Lincolnia
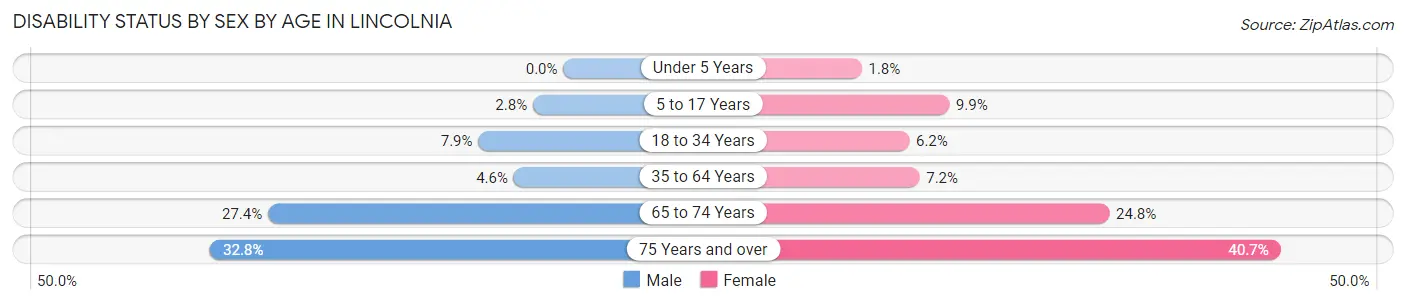
| Age Bracket | Male | Female |
| Under 5 Years | 0 (0.0%) | 8 (1.8%) |
| 5 to 17 Years | 42 (2.8%) | 109 (9.9%) |
| 18 to 34 Years | 192 (7.9%) | 149 (6.2%) |
| 35 to 64 Years | 203 (4.6%) | 310 (7.2%) |
| 65 to 74 Years | 239 (27.4%) | 198 (24.8%) |
| 75 Years and over | 99 (32.8%) | 169 (40.7%) |
Disability Class by Sex by Age in Lincolnia
Disability Class: Hearing Difficulty
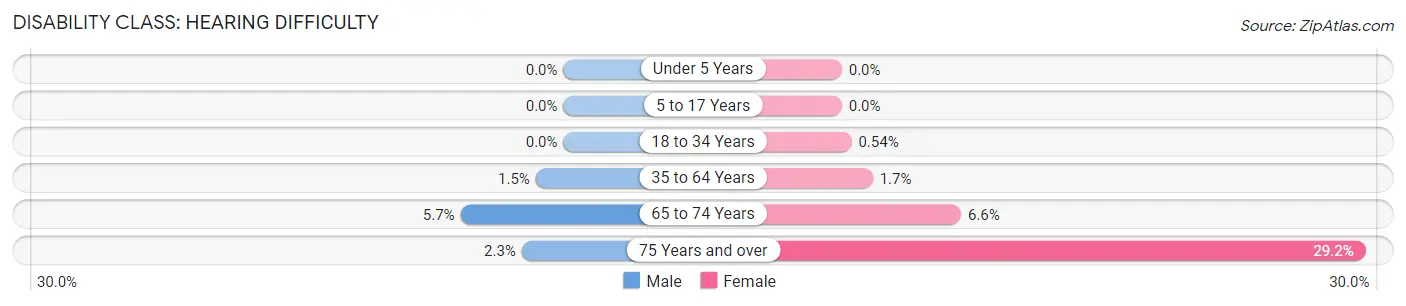
| Age Bracket | Male | Female |
| Under 5 Years | 0 (0.0%) | 0 (0.0%) |
| 5 to 17 Years | 0 (0.0%) | 0 (0.0%) |
| 18 to 34 Years | 0 (0.0%) | 13 (0.5%) |
| 35 to 64 Years | 68 (1.5%) | 74 (1.7%) |
| 65 to 74 Years | 50 (5.7%) | 53 (6.6%) |
| 75 Years and over | 7 (2.3%) | 121 (29.2%) |
Disability Class: Vision Difficulty
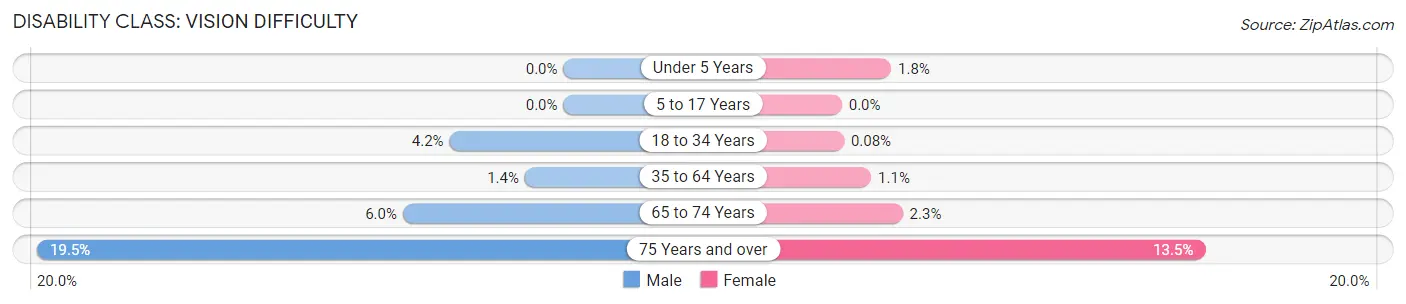
| Age Bracket | Male | Female |
| Under 5 Years | 0 (0.0%) | 8 (1.8%) |
| 5 to 17 Years | 0 (0.0%) | 0 (0.0%) |
| 18 to 34 Years | 103 (4.2%) | 2 (0.1%) |
| 35 to 64 Years | 63 (1.4%) | 47 (1.1%) |
| 65 to 74 Years | 52 (6.0%) | 18 (2.3%) |
| 75 Years and over | 59 (19.5%) | 56 (13.5%) |
Disability Class: Cognitive Difficulty
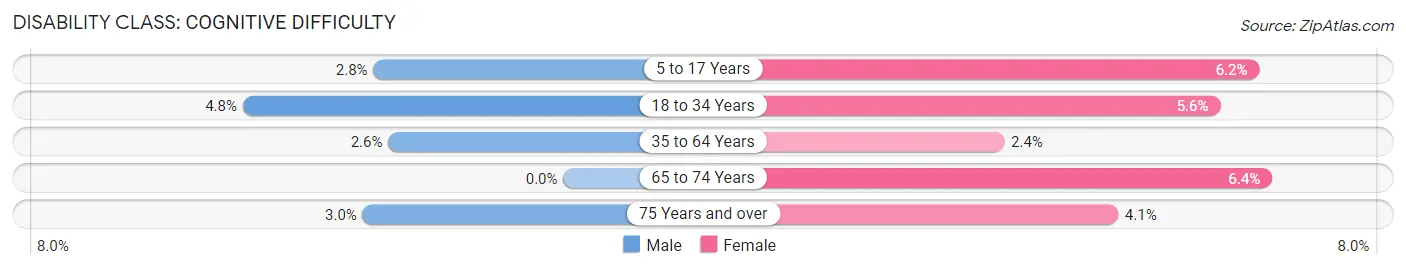
| Age Bracket | Male | Female |
| 5 to 17 Years | 42 (2.8%) | 68 (6.2%) |
| 18 to 34 Years | 116 (4.8%) | 134 (5.6%) |
| 35 to 64 Years | 115 (2.6%) | 104 (2.4%) |
| 65 to 74 Years | 0 (0.0%) | 51 (6.4%) |
| 75 Years and over | 9 (3.0%) | 17 (4.1%) |
Disability Class: Ambulatory Difficulty
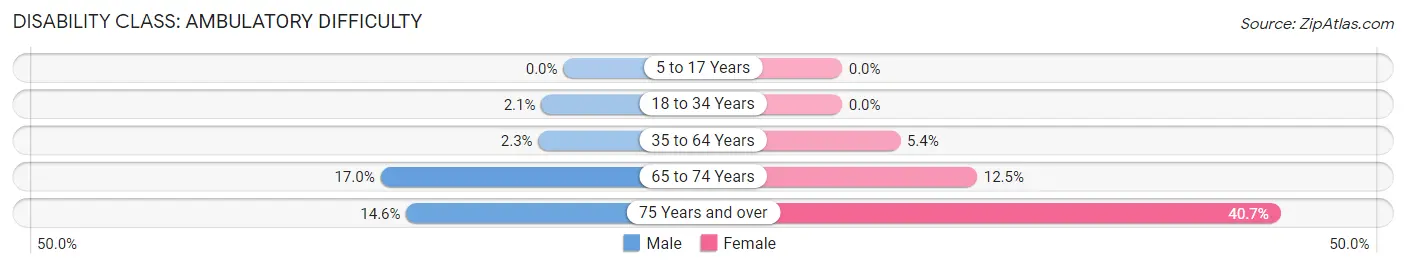
| Age Bracket | Male | Female |
| 5 to 17 Years | 0 (0.0%) | 0 (0.0%) |
| 18 to 34 Years | 50 (2.1%) | 0 (0.0%) |
| 35 to 64 Years | 102 (2.3%) | 233 (5.4%) |
| 65 to 74 Years | 148 (17.0%) | 100 (12.5%) |
| 75 Years and over | 44 (14.6%) | 169 (40.7%) |
Disability Class: Self-Care Difficulty
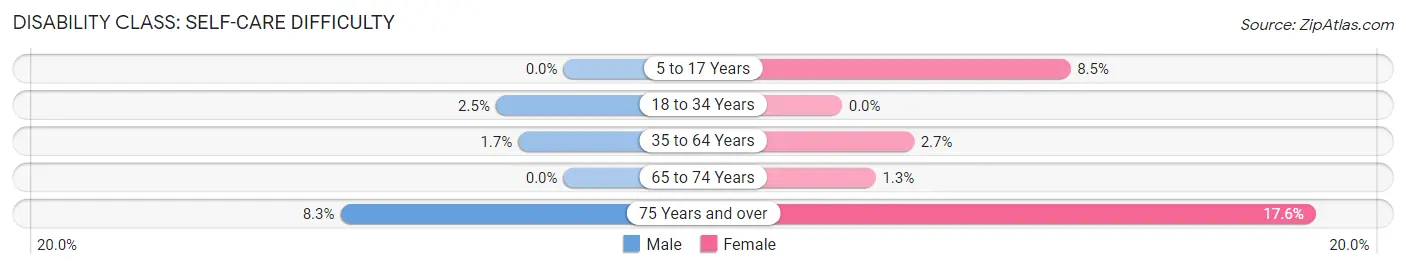
| Age Bracket | Male | Female |
| 5 to 17 Years | 0 (0.0%) | 93 (8.5%) |
| 18 to 34 Years | 61 (2.5%) | 0 (0.0%) |
| 35 to 64 Years | 74 (1.7%) | 115 (2.7%) |
| 65 to 74 Years | 0 (0.0%) | 10 (1.3%) |
| 75 Years and over | 25 (8.3%) | 73 (17.6%) |
Technology Access in Lincolnia
Computing Device Access in Lincolnia
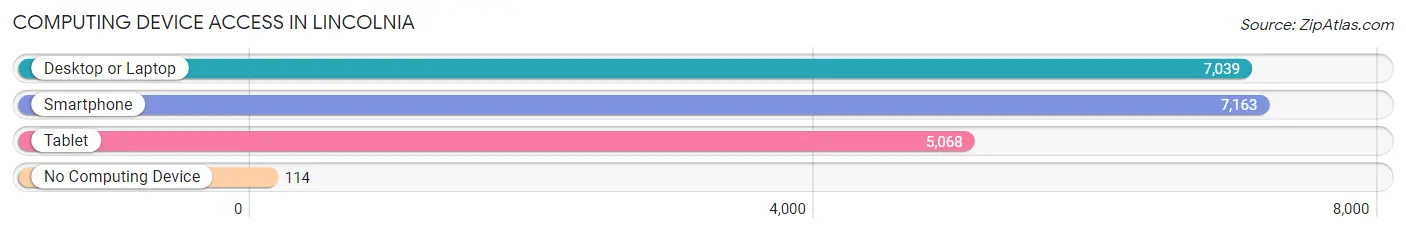
| Device Type | # Households | % Households |
| Desktop or Laptop | 7,039 | 92.4% |
| Smartphone | 7,163 | 94.0% |
| Tablet | 5,068 | 66.5% |
| No Computing Device | 114 | 1.5% |
| Total | 7,617 | 100.0% |
Internet Access in Lincolnia
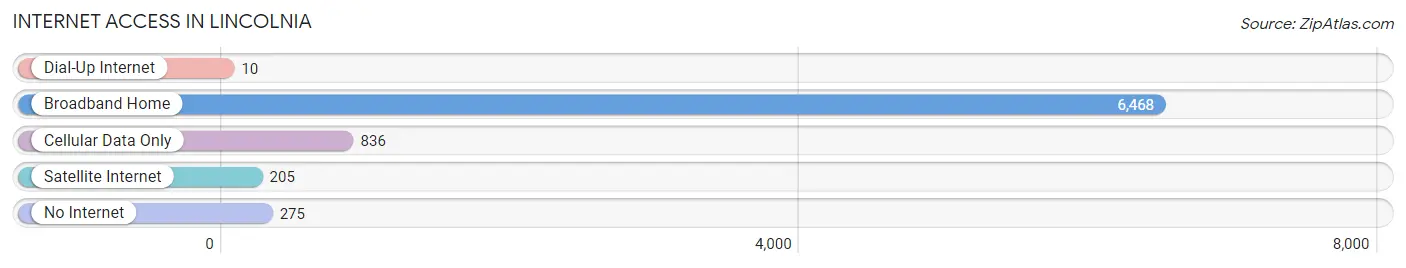
| Internet Type | # Households | % Households |
| Dial-Up Internet | 10 | 0.1% |
| Broadband Home | 6,468 | 84.9% |
| Cellular Data Only | 836 | 11.0% |
| Satellite Internet | 205 | 2.7% |
| No Internet | 275 | 3.6% |
| Total | 7,617 | 100.0% |
Lincolnia Summary
Lincolnia is a census-designated place (CDP) located in Fairfax County, Virginia. It is a suburb of Washington, D.C., located approximately 10 miles south of the city. The population of Lincolnia was 22,941 at the 2010 census.
Geography
Lincolnia is located at 38°48'7" North, 77°11'45" West (38.801861, -77.195890). It is situated in the southeastern corner of Fairfax County, just south of the City of Alexandria. The CDP has a total area of 4.2 square miles, all of which is land.
Demographics
As of the 2010 census, the population of Lincolnia was 22,941. The racial makeup of the CDP was 68.2% White, 15.3% African American, 0.3% Native American, 8.7% Asian, 0.1% Pacific Islander, 4.2% from other races, and 3.3% from two or more races. Hispanic or Latino of any race were 11.2% of the population.
The median household income in Lincolnia was $90,945 in 2019, up from $86,945 in 2010. The median age was 37.7 years.
Economy
Lincolnia is home to a number of businesses, including the headquarters of the National Rural Electric Cooperative Association, the National Rural Telecommunications Cooperative, and the National Rural Water Association. The area is also home to a number of government contractors, including Northrop Grumman, Booz Allen Hamilton, and Lockheed Martin.
The area is served by the Washington Metropolitan Area Transit Authority (WMATA), which provides bus and rail service to the area. The nearest Metro station is the Van Dorn Street station, located approximately 4 miles away.
Education
Lincolnia is served by the Fairfax County Public Schools system. The area is home to two elementary schools, one middle school, and one high school.
The area is also home to a number of private schools, including the Lincolnia Christian Academy, the Lincolnia Montessori School, and the Lincolnia Academy of Arts and Sciences.
Conclusion
Lincolnia is a census-designated place located in Fairfax County, Virginia. It is a suburb of Washington, D.C., located approximately 10 miles south of the city. The population of Lincolnia was 22,941 at the 2010 census. The CDP has a total area of 4.2 square miles, all of which is land. The racial makeup of the CDP was 68.2% White, 15.3% African American, 0.3% Native American, 8.7% Asian, 0.1% Pacific Islander, 4.2% from other races, and 3.3% from two or more races. The median household income in Lincolnia was $90,945 in 2019, up from $86,945 in 2010. The area is home to a number of businesses, including the headquarters of the National Rural Electric Cooperative Association, the National Rural Telecommunications Cooperative, and the National Rural Water Association. The area is served by the Fairfax County Public Schools system, as well as a number of private schools.
Common Questions
What is Per Capita Income in Lincolnia?
Per Capita income in Lincolnia is $58,952.
What is the Median Family Income in Lincolnia?
Median Family Income in Lincolnia is $119,596.
What is the Median Household income in Lincolnia?
Median Household Income in Lincolnia is $116,122.
What is Income or Wage Gap in Lincolnia?
Income or Wage Gap in Lincolnia is 16.6%.
Women in Lincolnia earn 83.4 cents for every dollar earned by a man.
What is Family Income Deficit in Lincolnia?
Family Income Deficit in Lincolnia is $11,119.
Families that are below poverty line in Lincolnia earn $11,119 less on average than the poverty threshold level.
What is Inequality or Gini Index in Lincolnia?
Inequality or Gini Index in Lincolnia is 0.41.
What is the Total Population of Lincolnia?
Total Population of Lincolnia is 19,812.
What is the Total Male Population of Lincolnia?
Total Male Population of Lincolnia is 10,250.
What is the Total Female Population of Lincolnia?
Total Female Population of Lincolnia is 9,562.
What is the Ratio of Males per 100 Females in Lincolnia?
There are 107.20 Males per 100 Females in Lincolnia.
What is the Ratio of Females per 100 Males in Lincolnia?
There are 93.29 Females per 100 Males in Lincolnia.
What is the Median Population Age in Lincolnia?
Median Population Age in Lincolnia is 38.8 Years.
What is the Average Family Size in Lincolnia
Average Family Size in Lincolnia is 3.1 People.
What is the Average Household Size in Lincolnia
Average Household Size in Lincolnia is 2.6 People.
How Large is the Labor Force in Lincolnia?
There are 12,648 People in the Labor Forcein in Lincolnia.
What is the Percentage of People in the Labor Force in Lincolnia?
76.6% of People are in the Labor Force in Lincolnia.
What is the Unemployment Rate in Lincolnia?
Unemployment Rate in Lincolnia is 4.5%.