Bealeton, VA Map & Demographics
Bealeton Map
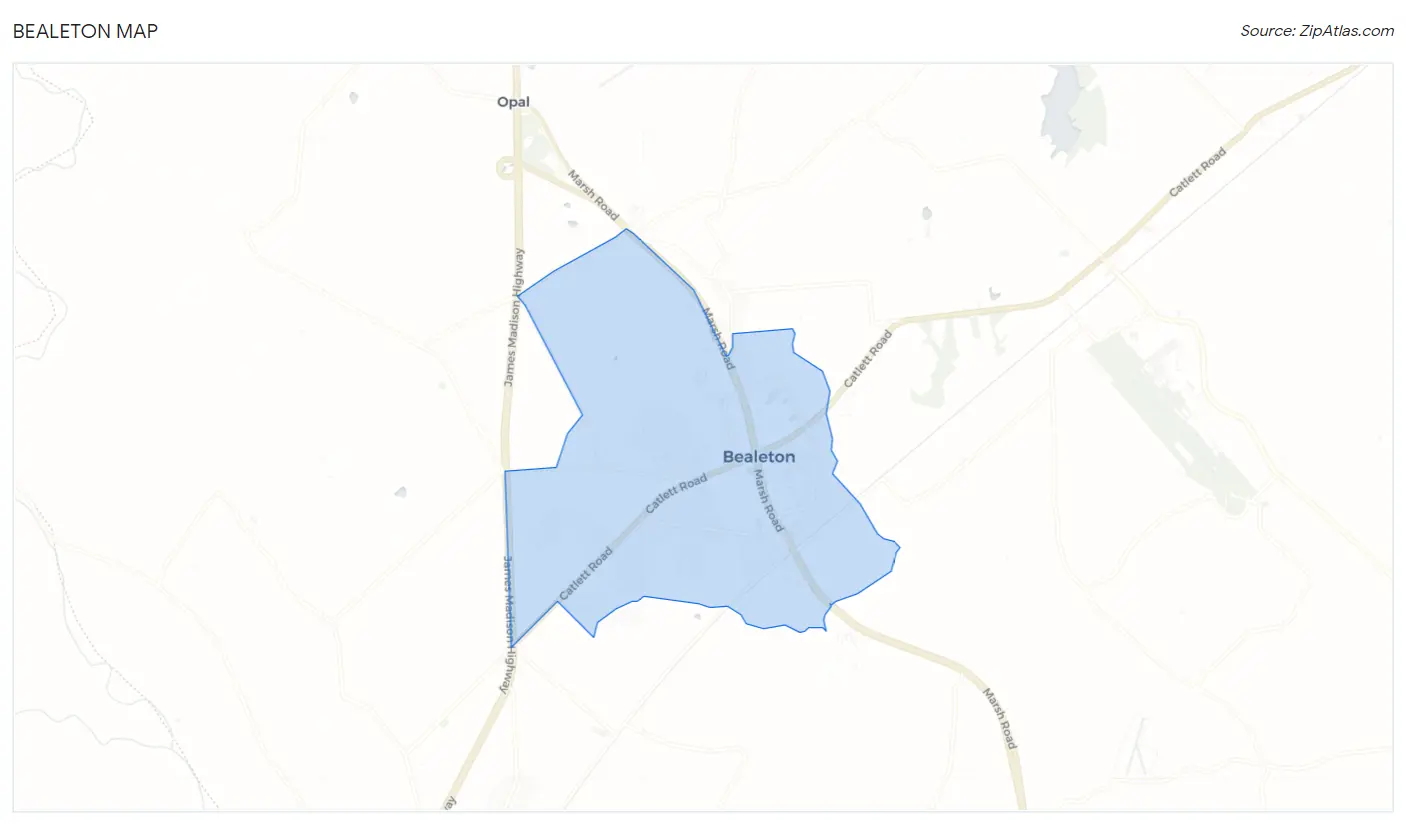
Bealeton Overview
$40,073
PER CAPITA INCOME
$116,947
AVG FAMILY INCOME
$105,449
AVG HOUSEHOLD INCOME
29.8%
WAGE / INCOME GAP [ % ]
70.2¢/ $1
WAGE / INCOME GAP [ $ ]
0.32
INEQUALITY / GINI INDEX
4,670
TOTAL POPULATION
2,344
MALE POPULATION
2,326
FEMALE POPULATION
100.77
MALES / 100 FEMALES
99.23
FEMALES / 100 MALES
33.9
MEDIAN AGE
3.5
AVG FAMILY SIZE
3.0
AVG HOUSEHOLD SIZE
2,677
LABOR FORCE [ PEOPLE ]
72.5%
PERCENT IN LABOR FORCE
0.6%
UNEMPLOYMENT RATE
Bealeton Zip Codes
Bealeton Area Codes
Income in Bealeton
Income Overview in Bealeton
Per Capita Income in Bealeton is $40,073, while median incomes of families and households are $116,947 and $105,449 respectively.
| Characteristic | Number | Measure |
| Per Capita Income | 4,670 | $40,073 |
| Median Family Income | 1,179 | $116,947 |
| Mean Family Income | 1,179 | $134,377 |
| Median Household Income | 1,558 | $105,449 |
| Mean Household Income | 1,558 | $121,275 |
| Income Deficit | 1,179 | $0 |
| Wage / Income Gap (%) | 4,670 | 29.81% |
| Wage / Income Gap ($) | 4,670 | 70.19¢ per $1 |
| Gini / Inequality Index | 4,670 | 0.32 |
Earnings by Sex in Bealeton
Average Earnings in Bealeton are $51,995, $62,120 for men and $43,600 for women, a difference of 29.8%.
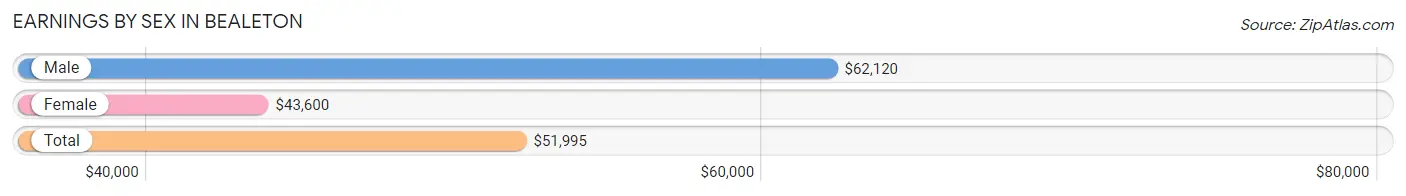
| Sex | Number | Average Earnings |
| Male | 1,429 (50.8%) | $62,120 |
| Female | 1,386 (49.2%) | $43,600 |
| Total | 2,815 (100.0%) | $51,995 |
Earnings by Sex by Income Bracket in Bealeton
The most common earnings brackets in Bealeton are $100,000+ for men (287 | 20.1%) and $75,000 to $99,999 for women (212 | 15.3%).
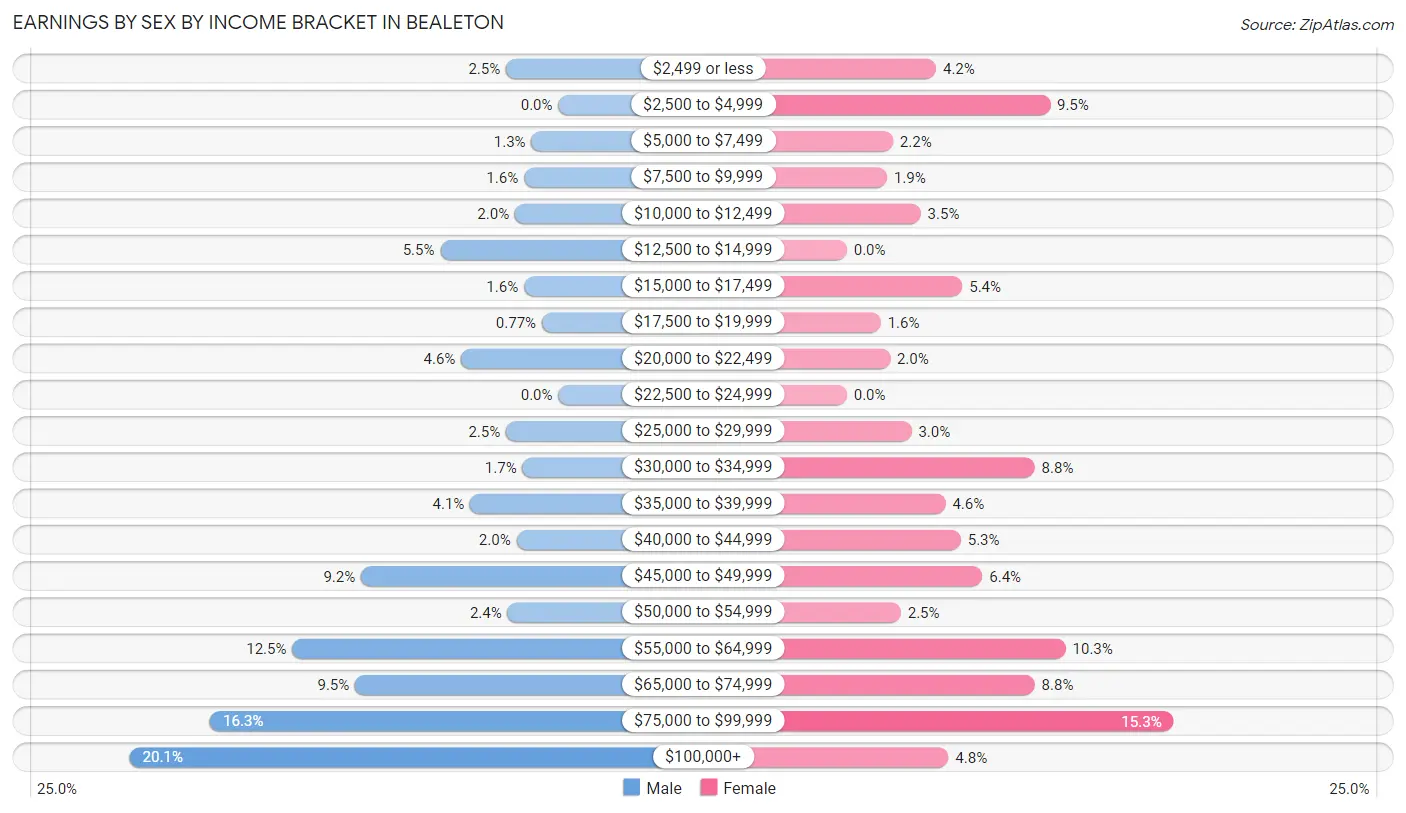
| Income | Male | Female |
| $2,499 or less | 35 (2.5%) | 58 (4.2%) |
| $2,500 to $4,999 | 0 (0.0%) | 132 (9.5%) |
| $5,000 to $7,499 | 18 (1.3%) | 30 (2.2%) |
| $7,500 to $9,999 | 23 (1.6%) | 26 (1.9%) |
| $10,000 to $12,499 | 29 (2.0%) | 48 (3.5%) |
| $12,500 to $14,999 | 79 (5.5%) | 0 (0.0%) |
| $15,000 to $17,499 | 23 (1.6%) | 75 (5.4%) |
| $17,500 to $19,999 | 11 (0.8%) | 22 (1.6%) |
| $20,000 to $22,499 | 65 (4.5%) | 28 (2.0%) |
| $22,500 to $24,999 | 0 (0.0%) | 0 (0.0%) |
| $25,000 to $29,999 | 35 (2.5%) | 42 (3.0%) |
| $30,000 to $34,999 | 24 (1.7%) | 122 (8.8%) |
| $35,000 to $39,999 | 59 (4.1%) | 64 (4.6%) |
| $40,000 to $44,999 | 28 (2.0%) | 74 (5.3%) |
| $45,000 to $49,999 | 132 (9.2%) | 88 (6.4%) |
| $50,000 to $54,999 | 34 (2.4%) | 35 (2.5%) |
| $55,000 to $64,999 | 178 (12.5%) | 142 (10.2%) |
| $65,000 to $74,999 | 136 (9.5%) | 122 (8.8%) |
| $75,000 to $99,999 | 233 (16.3%) | 212 (15.3%) |
| $100,000+ | 287 (20.1%) | 66 (4.8%) |
| Total | 1,429 (100.0%) | 1,386 (100.0%) |
Earnings by Sex by Educational Attainment in Bealeton
Average earnings in Bealeton are $69,701 for men and $49,741 for women, a difference of 28.6%. Men with an educational attainment of bachelor's degree enjoy the highest average annual earnings of $102,727, while those with high school diploma education earn the least with $55,560. Women with an educational attainment of graduate degree earn the most with the average annual earnings of $70,781, while those with college or associate's degree education have the smallest earnings of $41,042.
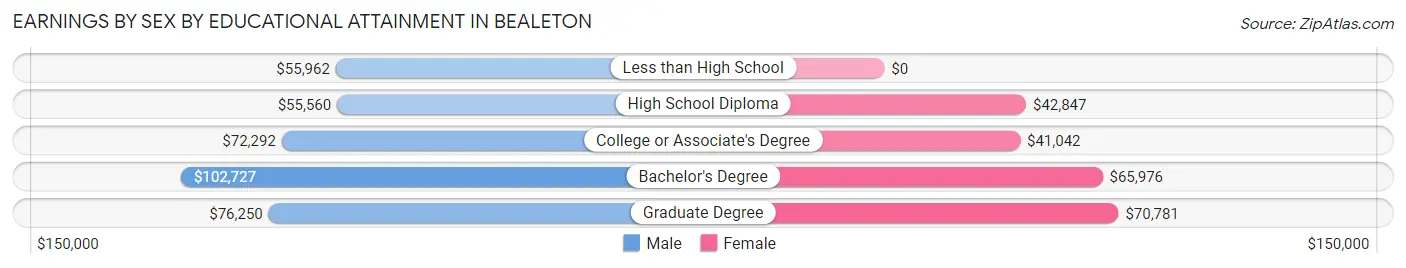
| Educational Attainment | Male Income | Female Income |
| Less than High School | $55,962 | $0 |
| High School Diploma | $55,560 | $42,847 |
| College or Associate's Degree | $72,292 | $41,042 |
| Bachelor's Degree | $102,727 | $65,976 |
| Graduate Degree | $76,250 | $70,781 |
| Total | $69,701 | $49,741 |
Family Income in Bealeton
Family Income Brackets in Bealeton
According to the Bealeton family income data, there are 343 families falling into the $100,000 to $149,999 income range, which is the most common income bracket and makes up 29.1% of all families.
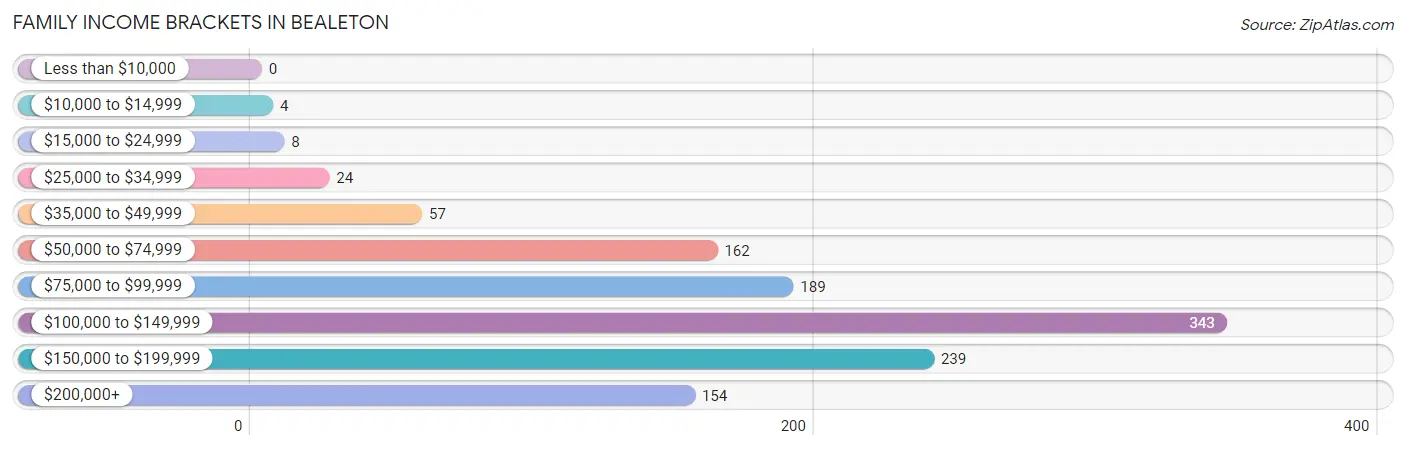
| Income Bracket | # Families | % Families |
| Less than $10,000 | 0 | 0.0% |
| $10,000 to $14,999 | 4 | 0.3% |
| $15,000 to $24,999 | 8 | 0.7% |
| $25,000 to $34,999 | 24 | 2.0% |
| $35,000 to $49,999 | 57 | 4.8% |
| $50,000 to $74,999 | 162 | 13.7% |
| $75,000 to $99,999 | 189 | 16.0% |
| $100,000 to $149,999 | 343 | 29.1% |
| $150,000 to $199,999 | 239 | 20.3% |
| $200,000+ | 154 | 13.1% |
Family Income by Famaliy Size in Bealeton
4-person families (300 | 25.5%) account for the highest median family income in Bealeton with $167,426 per family, while 2-person families (389 | 33.0%) have the highest median income of $51,652 per family member.
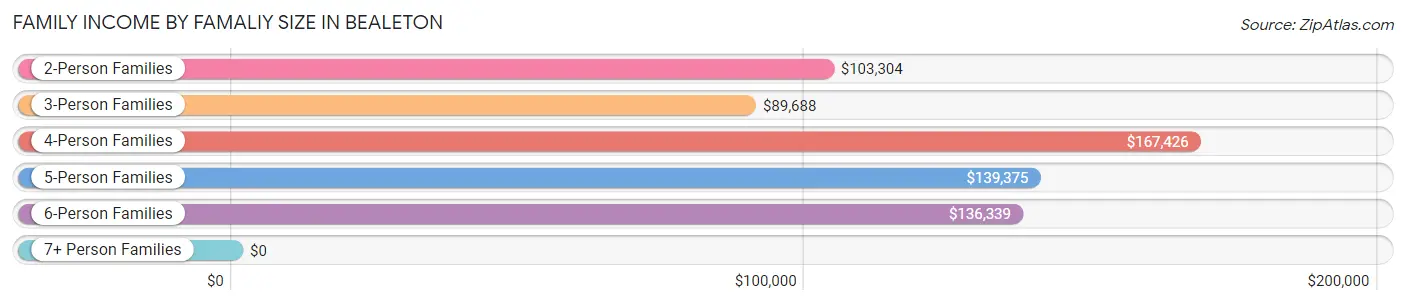
| Income Bracket | # Families | Median Income |
| 2-Person Families | 389 (33.0%) | $103,304 |
| 3-Person Families | 247 (20.9%) | $89,688 |
| 4-Person Families | 300 (25.5%) | $167,426 |
| 5-Person Families | 100 (8.5%) | $139,375 |
| 6-Person Families | 132 (11.2%) | $136,339 |
| 7+ Person Families | 11 (0.9%) | $0 |
| Total | 1,179 (100.0%) | $116,947 |
Family Income by Number of Earners in Bealeton
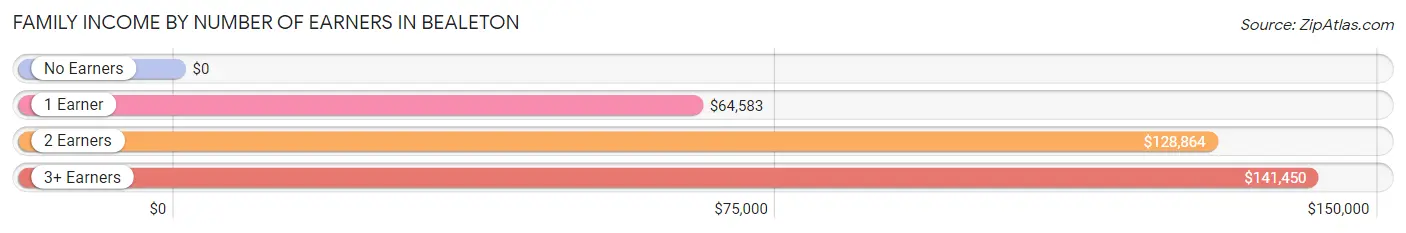
| Number of Earners | # Families | Median Income |
| No Earners | 24 (2.0%) | $0 |
| 1 Earner | 232 (19.7%) | $64,583 |
| 2 Earners | 724 (61.4%) | $128,864 |
| 3+ Earners | 199 (16.9%) | $141,450 |
| Total | 1,179 (100.0%) | $116,947 |
Household Income in Bealeton
Household Income Brackets in Bealeton
With 358 households falling in the category, the $100,000 to $149,999 income range is the most frequent in Bealeton, accounting for 23.0% of all households.
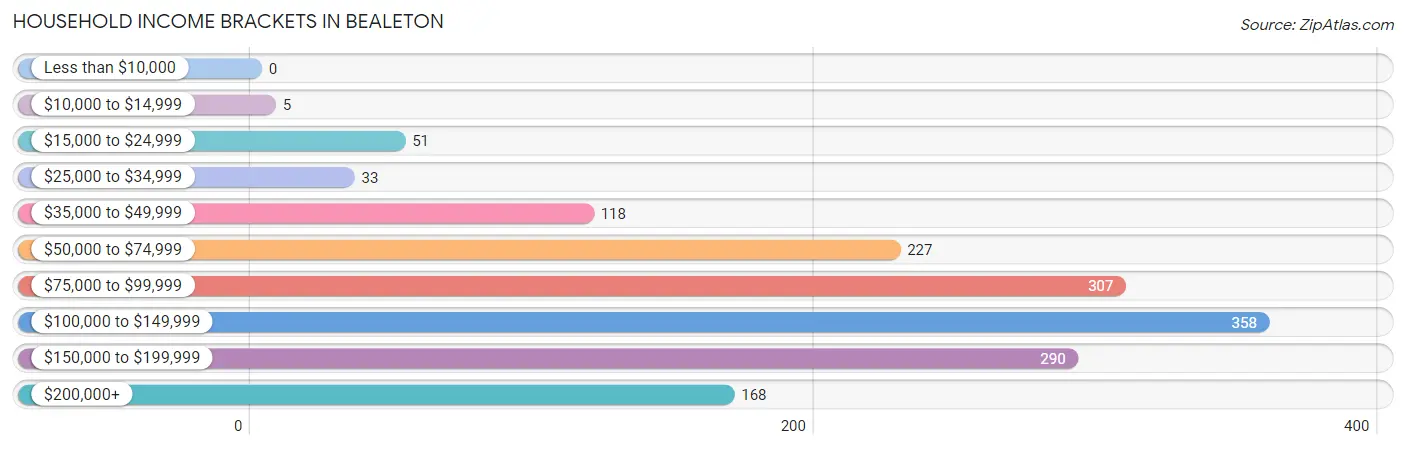
| Income Bracket | # Households | % Households |
| Less than $10,000 | 0 | 0.0% |
| $10,000 to $14,999 | 5 | 0.3% |
| $15,000 to $24,999 | 51 | 3.3% |
| $25,000 to $34,999 | 33 | 2.1% |
| $35,000 to $49,999 | 118 | 7.6% |
| $50,000 to $74,999 | 227 | 14.6% |
| $75,000 to $99,999 | 307 | 19.7% |
| $100,000 to $149,999 | 358 | 23.0% |
| $150,000 to $199,999 | 290 | 18.6% |
| $200,000+ | 168 | 10.8% |
Household Income by Householder Age in Bealeton
The median household income in Bealeton is $105,449, with the highest median household income of $116,369 found in the 45 to 64 years age bracket for the primary householder. A total of 655 households (42.0%) fall into this category. Meanwhile, the 15 to 24 years age bracket for the primary householder has the lowest median household income of $0, with 7 households (0.4%) in this group.
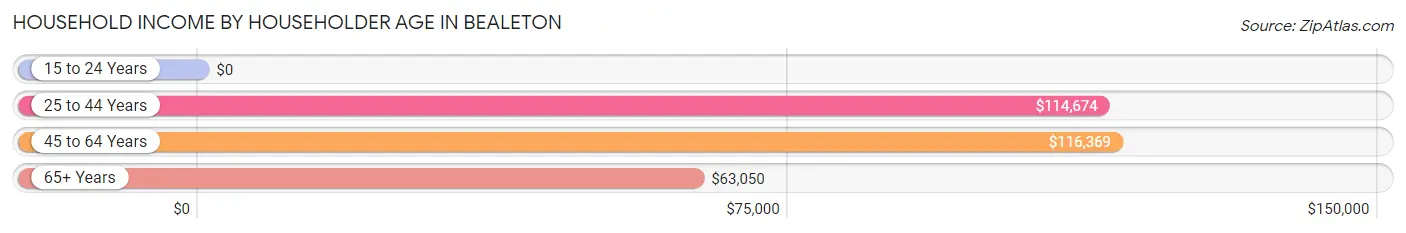
| Income Bracket | # Households | Median Income |
| 15 to 24 Years | 7 (0.4%) | $0 |
| 25 to 44 Years | 652 (41.8%) | $114,674 |
| 45 to 64 Years | 655 (42.0%) | $116,369 |
| 65+ Years | 244 (15.7%) | $63,050 |
| Total | 1,558 (100.0%) | $105,449 |
Poverty in Bealeton
Income Below Poverty by Sex and Age in Bealeton
With 0.6% poverty level for males and 2.5% for females among the residents of Bealeton, 75 year old and over males and 18 to 24 year old females are the most vulnerable to poverty, with 8 males (10.3%) and 21 females (9.6%) in their respective age groups living below the poverty level.
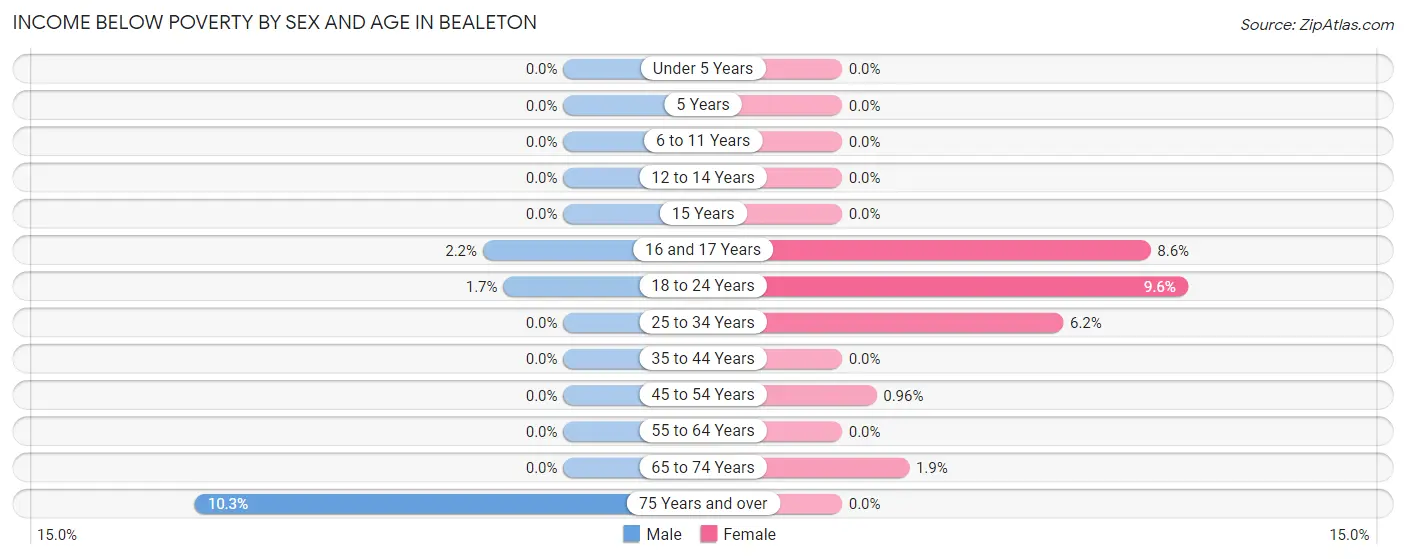
| Age Bracket | Male | Female |
| Under 5 Years | 0 (0.0%) | 0 (0.0%) |
| 5 Years | 0 (0.0%) | 0 (0.0%) |
| 6 to 11 Years | 0 (0.0%) | 0 (0.0%) |
| 12 to 14 Years | 0 (0.0%) | 0 (0.0%) |
| 15 Years | 0 (0.0%) | 0 (0.0%) |
| 16 and 17 Years | 3 (2.2%) | 11 (8.6%) |
| 18 to 24 Years | 4 (1.7%) | 21 (9.6%) |
| 25 to 34 Years | 0 (0.0%) | 21 (6.2%) |
| 35 to 44 Years | 0 (0.0%) | 0 (0.0%) |
| 45 to 54 Years | 0 (0.0%) | 4 (1.0%) |
| 55 to 64 Years | 0 (0.0%) | 0 (0.0%) |
| 65 to 74 Years | 0 (0.0%) | 2 (1.9%) |
| 75 Years and over | 8 (10.3%) | 0 (0.0%) |
| Total | 15 (0.6%) | 59 (2.5%) |
Income Above Poverty by Sex and Age in Bealeton
According to the poverty statistics in Bealeton, males aged under 5 years and females aged under 5 years are the age groups that are most secure financially, with 100.0% of males and 100.0% of females in these age groups living above the poverty line.
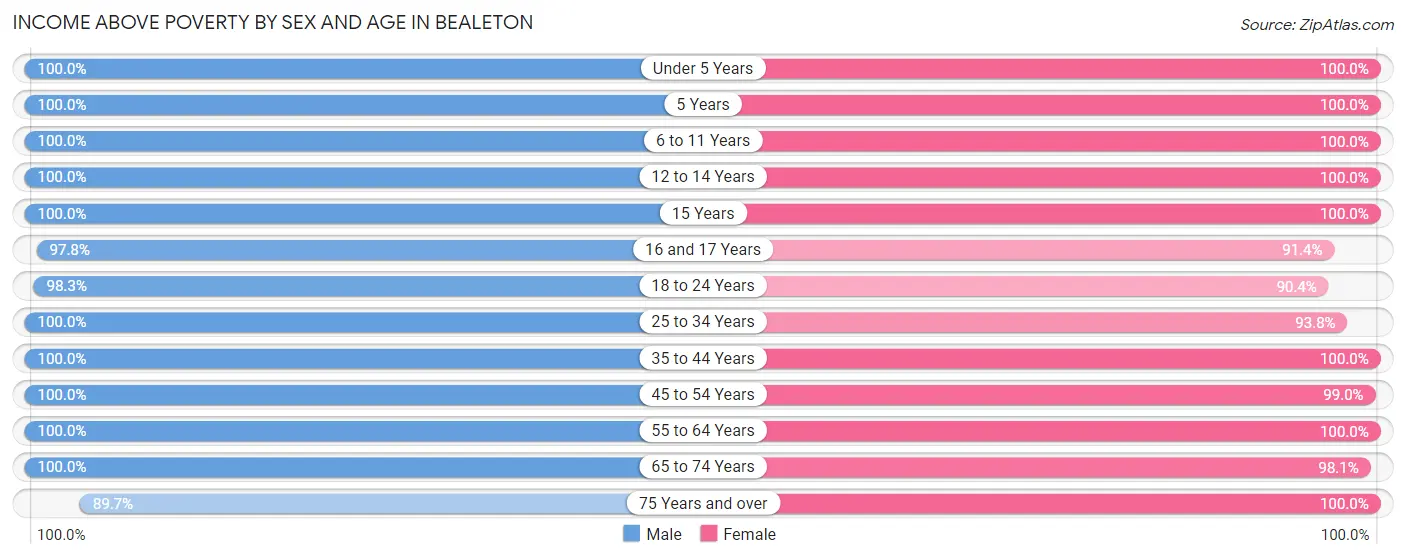
| Age Bracket | Male | Female |
| Under 5 Years | 43 (100.0%) | 87 (100.0%) |
| 5 Years | 16 (100.0%) | 22 (100.0%) |
| 6 to 11 Years | 265 (100.0%) | 157 (100.0%) |
| 12 to 14 Years | 216 (100.0%) | 127 (100.0%) |
| 15 Years | 7 (100.0%) | 37 (100.0%) |
| 16 and 17 Years | 131 (97.8%) | 117 (91.4%) |
| 18 to 24 Years | 235 (98.3%) | 197 (90.4%) |
| 25 to 34 Years | 329 (100.0%) | 320 (93.8%) |
| 35 to 44 Years | 261 (100.0%) | 338 (100.0%) |
| 45 to 54 Years | 306 (100.0%) | 412 (99.0%) |
| 55 to 64 Years | 332 (100.0%) | 199 (100.0%) |
| 65 to 74 Years | 118 (100.0%) | 105 (98.1%) |
| 75 Years and over | 70 (89.7%) | 149 (100.0%) |
| Total | 2,329 (99.4%) | 2,267 (97.5%) |
Income Below Poverty Among Married-Couple Families in Bealeton
The poverty statistics for married-couple families in Bealeton show that 0.9% or 8 of the total 882 families live below the poverty line. Families with no children have the highest poverty rate of 2.1%, comprising of 8 families. On the other hand, families with 1 or 2 children have the lowest poverty rate of 0.0%, which includes 0 families.
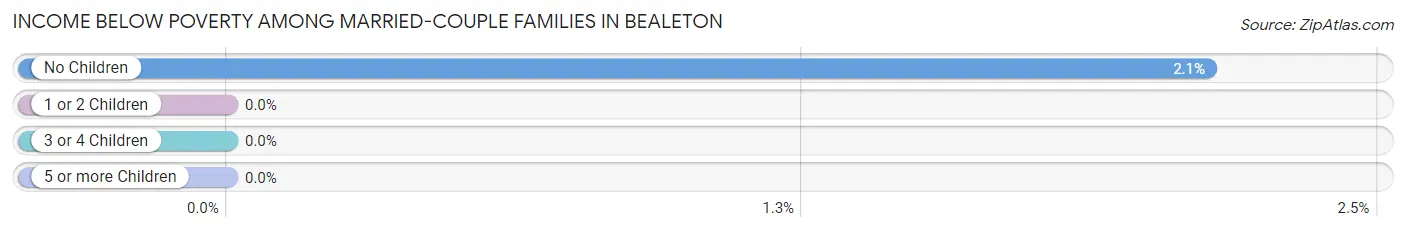
| Children | Above Poverty | Below Poverty |
| No Children | 367 (97.9%) | 8 (2.1%) |
| 1 or 2 Children | 419 (100.0%) | 0 (0.0%) |
| 3 or 4 Children | 81 (100.0%) | 0 (0.0%) |
| 5 or more Children | 7 (100.0%) | 0 (0.0%) |
| Total | 874 (99.1%) | 8 (0.9%) |
Income Below Poverty Among Single-Parent Households in Bealeton
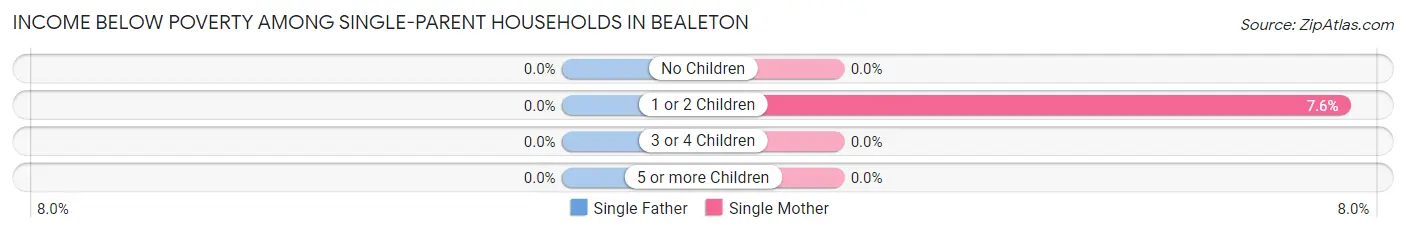
| Children | Single Father | Single Mother |
| No Children | 0 (0.0%) | 0 (0.0%) |
| 1 or 2 Children | 0 (0.0%) | 4 (7.5%) |
| 3 or 4 Children | 0 (0.0%) | 0 (0.0%) |
| 5 or more Children | 0 (0.0%) | 0 (0.0%) |
| Total | 0 (0.0%) | 4 (1.8%) |
Income Below Poverty Among Married-Couple vs Single-Parent Households in Bealeton
The poverty data for Bealeton shows that 8 of the married-couple family households (0.9%) and 4 of the single-parent households (1.3%) are living below the poverty level. Within the married-couple family households, those with no children have the highest poverty rate, with 8 households (2.1%) falling below the poverty line. Among the single-parent households, those with 1 or 2 children have the highest poverty rate, with 4 household (4.8%) living below poverty.
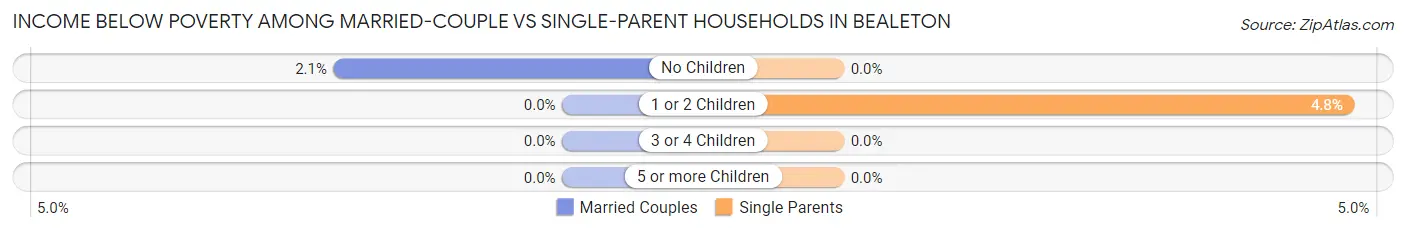
| Children | Married-Couple Families | Single-Parent Households |
| No Children | 8 (2.1%) | 0 (0.0%) |
| 1 or 2 Children | 0 (0.0%) | 4 (4.8%) |
| 3 or 4 Children | 0 (0.0%) | 0 (0.0%) |
| 5 or more Children | 0 (0.0%) | 0 (0.0%) |
| Total | 8 (0.9%) | 4 (1.3%) |
Race in Bealeton
The most populous races in Bealeton are White / Caucasian (3,459 | 74.1%), Hispanic or Latino (691 | 14.8%), and Black / African American (547 | 11.7%).
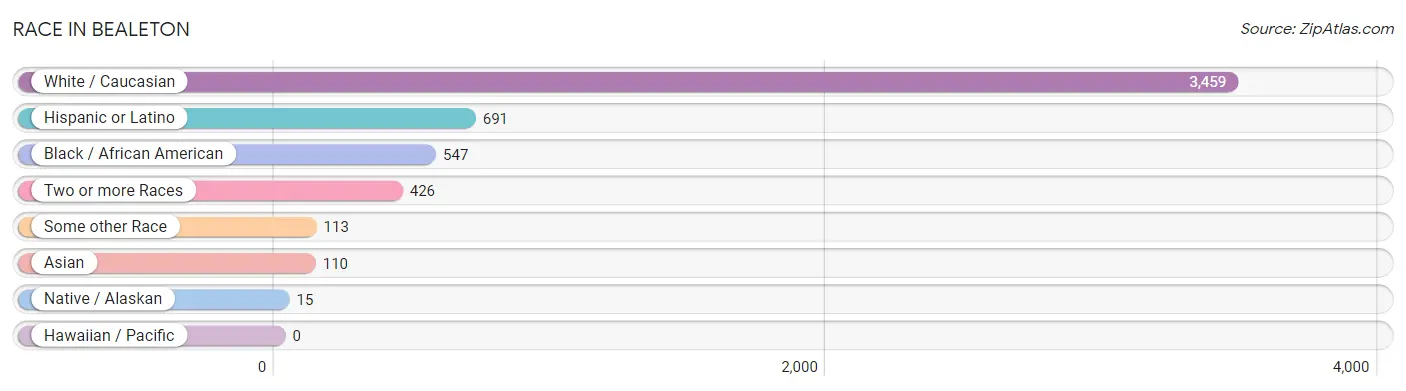
| Race | # Population | % Population |
| Asian | 110 | 2.4% |
| Black / African American | 547 | 11.7% |
| Hawaiian / Pacific | 0 | 0.0% |
| Hispanic or Latino | 691 | 14.8% |
| Native / Alaskan | 15 | 0.3% |
| White / Caucasian | 3,459 | 74.1% |
| Two or more Races | 426 | 9.1% |
| Some other Race | 113 | 2.4% |
| Total | 4,670 | 100.0% |
Ancestry in Bealeton
The most populous ancestries reported in Bealeton are English (532 | 11.4%), German (452 | 9.7%), Central American (363 | 7.8%), Irish (357 | 7.6%), and American (315 | 6.8%), together accounting for 43.2% of all Bealeton residents.
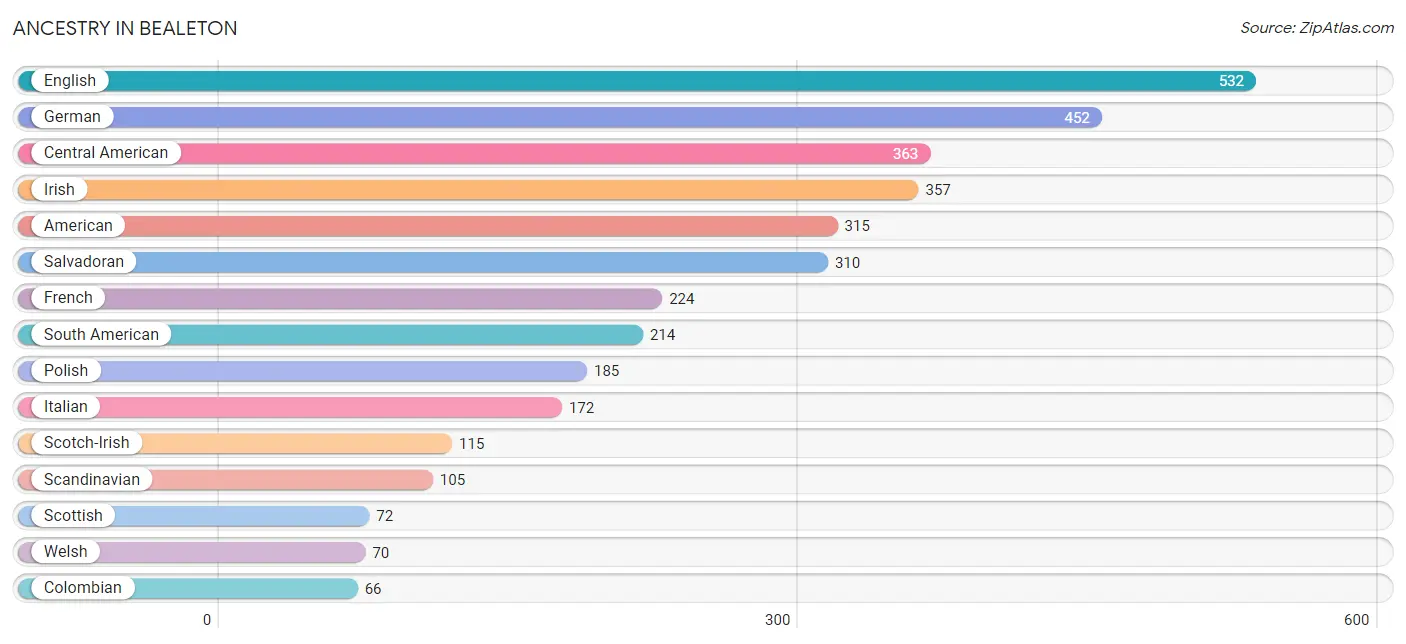
| Ancestry | # Population | % Population |
| American | 315 | 6.8% |
| Arab | 7 | 0.2% |
| Argentinean | 17 | 0.4% |
| Bhutanese | 24 | 0.5% |
| British | 20 | 0.4% |
| Bulgarian | 63 | 1.3% |
| Burmese | 38 | 0.8% |
| Central American | 363 | 7.8% |
| Colombian | 66 | 1.4% |
| Croatian | 10 | 0.2% |
| Danish | 10 | 0.2% |
| Dutch | 16 | 0.3% |
| Dutch West Indian | 10 | 0.2% |
| Ecuadorian | 34 | 0.7% |
| English | 532 | 11.4% |
| European | 25 | 0.5% |
| French | 224 | 4.8% |
| German | 452 | 9.7% |
| Greek | 30 | 0.6% |
| Guatemalan | 53 | 1.1% |
| Hungarian | 8 | 0.2% |
| Indian (Asian) | 18 | 0.4% |
| Irish | 357 | 7.6% |
| Italian | 172 | 3.7% |
| Lebanese | 7 | 0.2% |
| Mexican | 48 | 1.0% |
| Pakistani | 6 | 0.1% |
| Peruvian | 54 | 1.2% |
| Polish | 185 | 4.0% |
| Puerto Rican | 66 | 1.4% |
| Salvadoran | 310 | 6.6% |
| Scandinavian | 105 | 2.2% |
| Scotch-Irish | 115 | 2.5% |
| Scottish | 72 | 1.5% |
| Slovak | 21 | 0.4% |
| South American | 214 | 4.6% |
| Swedish | 11 | 0.2% |
| Trinidadian and Tobagonian | 44 | 0.9% |
| Turkish | 5 | 0.1% |
| Venezuelan | 43 | 0.9% |
| Welsh | 70 | 1.5% | View All 41 Rows |
Immigrants in Bealeton
The most numerous immigrant groups reported in Bealeton came from Latin America (333 | 7.1%), Central America (198 | 4.2%), South America (135 | 2.9%), El Salvador (126 | 2.7%), and Asia (67 | 1.4%), together accounting for 18.4% of all Bealeton residents.
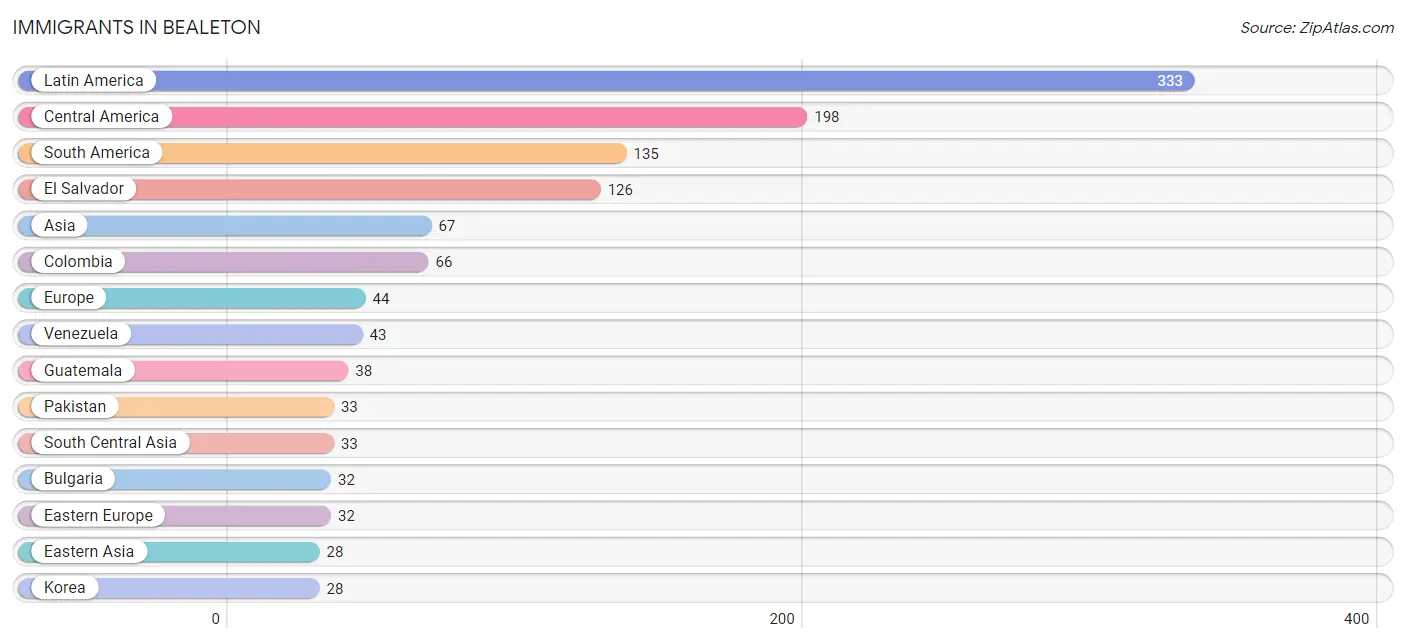
| Immigration Origin | # Population | % Population |
| Asia | 67 | 1.4% |
| Bulgaria | 32 | 0.7% |
| Central America | 198 | 4.2% |
| Colombia | 66 | 1.4% |
| Costa Rica | 14 | 0.3% |
| Eastern Asia | 28 | 0.6% |
| Eastern Europe | 32 | 0.7% |
| El Salvador | 126 | 2.7% |
| Europe | 44 | 0.9% |
| Greece | 12 | 0.3% |
| Guatemala | 38 | 0.8% |
| Korea | 28 | 0.6% |
| Latin America | 333 | 7.1% |
| Mexico | 20 | 0.4% |
| Pakistan | 33 | 0.7% |
| Peru | 26 | 0.6% |
| South America | 135 | 2.9% |
| South Central Asia | 33 | 0.7% |
| South Eastern Asia | 6 | 0.1% |
| Southern Europe | 12 | 0.3% |
| Venezuela | 43 | 0.9% |
| Vietnam | 6 | 0.1% | View All 22 Rows |
Sex and Age in Bealeton
Sex and Age in Bealeton
The most populous age groups in Bealeton are 15 to 19 Years (275 | 11.7%) for men and 15 to 19 Years (318 | 13.7%) for women.
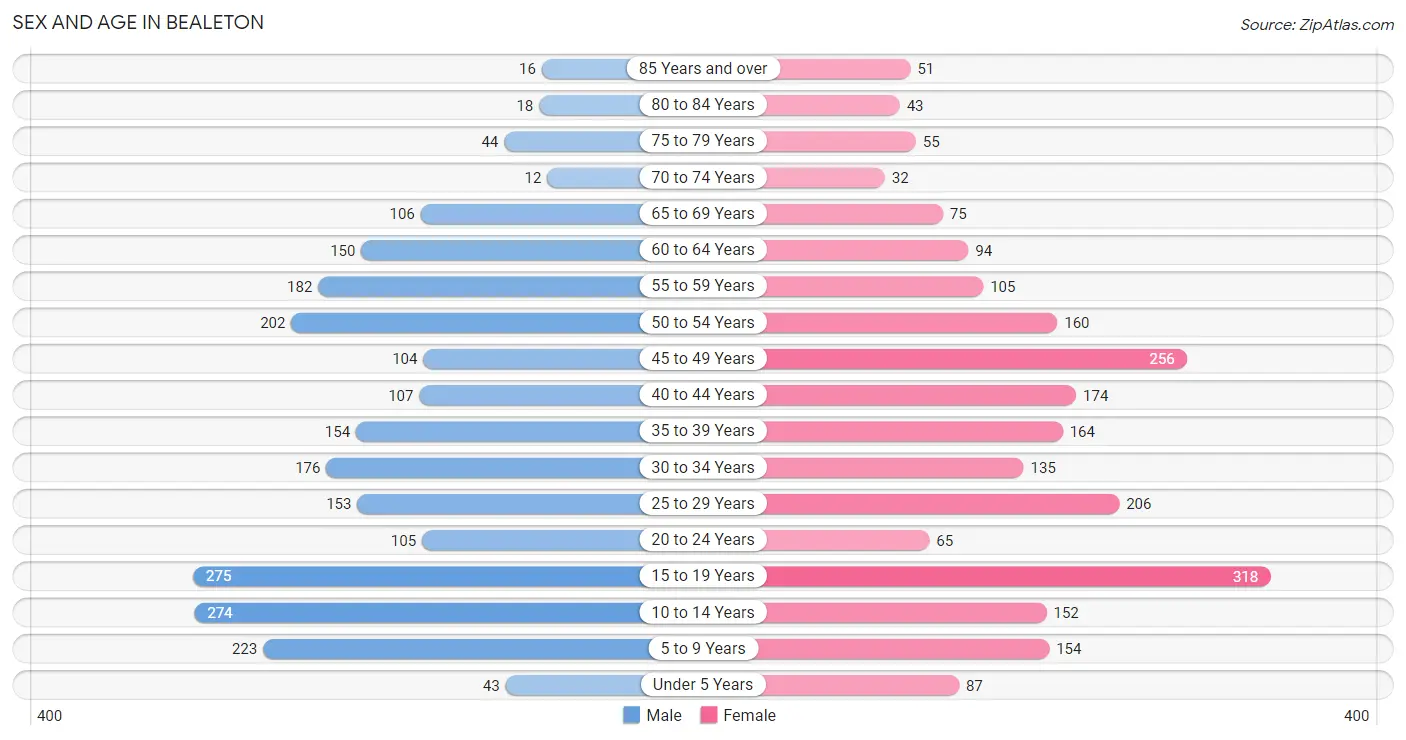
| Age Bracket | Male | Female |
| Under 5 Years | 43 (1.8%) | 87 (3.7%) |
| 5 to 9 Years | 223 (9.5%) | 154 (6.6%) |
| 10 to 14 Years | 274 (11.7%) | 152 (6.5%) |
| 15 to 19 Years | 275 (11.7%) | 318 (13.7%) |
| 20 to 24 Years | 105 (4.5%) | 65 (2.8%) |
| 25 to 29 Years | 153 (6.5%) | 206 (8.9%) |
| 30 to 34 Years | 176 (7.5%) | 135 (5.8%) |
| 35 to 39 Years | 154 (6.6%) | 164 (7.0%) |
| 40 to 44 Years | 107 (4.6%) | 174 (7.5%) |
| 45 to 49 Years | 104 (4.4%) | 256 (11.0%) |
| 50 to 54 Years | 202 (8.6%) | 160 (6.9%) |
| 55 to 59 Years | 182 (7.8%) | 105 (4.5%) |
| 60 to 64 Years | 150 (6.4%) | 94 (4.0%) |
| 65 to 69 Years | 106 (4.5%) | 75 (3.2%) |
| 70 to 74 Years | 12 (0.5%) | 32 (1.4%) |
| 75 to 79 Years | 44 (1.9%) | 55 (2.4%) |
| 80 to 84 Years | 18 (0.8%) | 43 (1.8%) |
| 85 Years and over | 16 (0.7%) | 51 (2.2%) |
| Total | 2,344 (100.0%) | 2,326 (100.0%) |
Families and Households in Bealeton
Median Family Size in Bealeton
The median family size in Bealeton is 3.51 persons per family, with single female/mother families (221 | 18.7%) accounting for the largest median family size of 3.66 persons per family. On the other hand, single male/father families (76 | 6.5%) represent the smallest median family size with 2.50 persons per family.
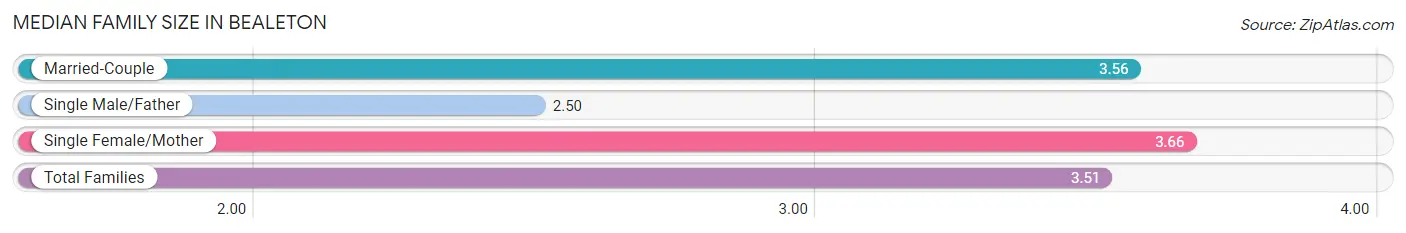
| Family Type | # Families | Family Size |
| Married-Couple | 882 (74.8%) | 3.56 |
| Single Male/Father | 76 (6.5%) | 2.50 |
| Single Female/Mother | 221 (18.7%) | 3.66 |
| Total Families | 1,179 (100.0%) | 3.51 |
Median Household Size in Bealeton
The median household size in Bealeton is 3.00 persons per household, with single female/mother households (221 | 14.2%) accounting for the largest median household size of 3.76 persons per household. non-family households (379 | 24.3%) represent the smallest median household size with 1.22 persons per household.
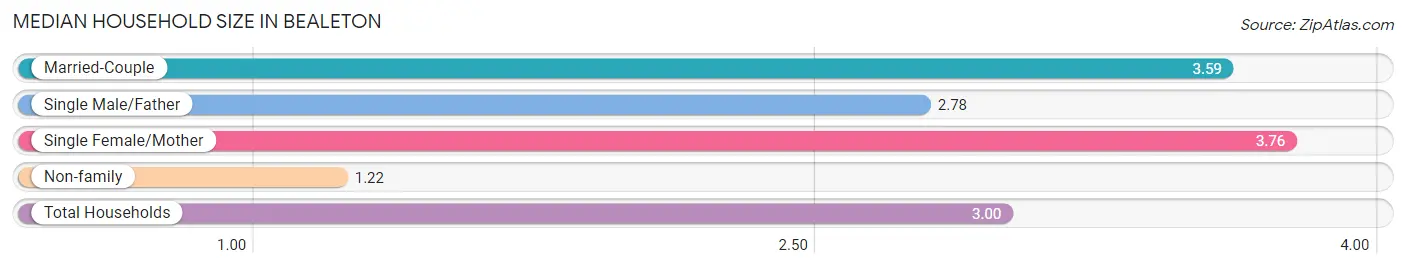
| Household Type | # Households | Household Size |
| Married-Couple | 882 (56.6%) | 3.59 |
| Single Male/Father | 76 (4.9%) | 2.78 |
| Single Female/Mother | 221 (14.2%) | 3.76 |
| Non-family | 379 (24.3%) | 1.22 |
| Total Households | 1,558 (100.0%) | 3.00 |
Household Size by Marriage Status in Bealeton
Out of a total of 1,558 households in Bealeton, 1,179 (75.7%) are family households, while 379 (24.3%) are nonfamily households. The most numerous type of family households are 2-person households, comprising 344, and the most common type of nonfamily households are 1-person households, comprising 318.
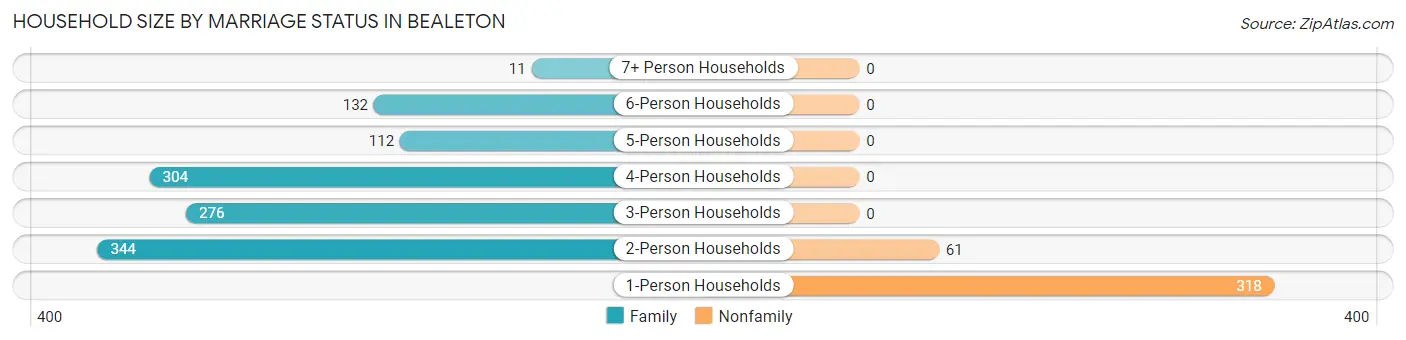
| Household Size | Family Households | Nonfamily Households |
| 1-Person Households | - | 318 (20.4%) |
| 2-Person Households | 344 (22.1%) | 61 (3.9%) |
| 3-Person Households | 276 (17.7%) | 0 (0.0%) |
| 4-Person Households | 304 (19.5%) | 0 (0.0%) |
| 5-Person Households | 112 (7.2%) | 0 (0.0%) |
| 6-Person Households | 132 (8.5%) | 0 (0.0%) |
| 7+ Person Households | 11 (0.7%) | 0 (0.0%) |
| Total | 1,179 (75.7%) | 379 (24.3%) |
Female Fertility in Bealeton
Fertility by Age in Bealeton
Average fertility rate in Bealeton is 34.0 births per 1,000 women. Women in the age bracket of 35 to 50 years have the highest fertility rate with 73.0 births per 1,000 women. Women in the age bracket of 35 to 50 years acount for 100.0% of all women with births.
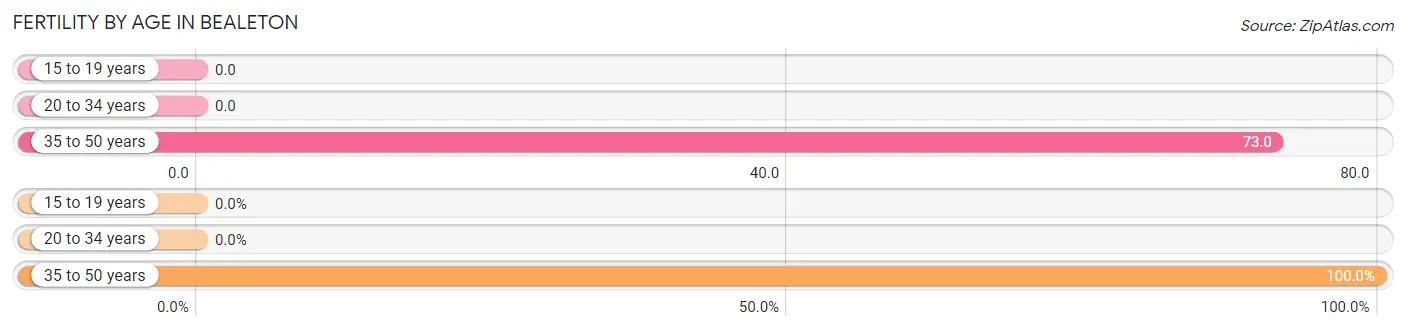
| Age Bracket | Women with Births | Births / 1,000 Women |
| 15 to 19 years | 0 (0.0%) | 0.0 |
| 20 to 34 years | 0 (0.0%) | 0.0 |
| 35 to 50 years | 46 (100.0%) | 73.0 |
| Total | 46 (100.0%) | 34.0 |
Fertility by Age by Marriage Status in Bealeton
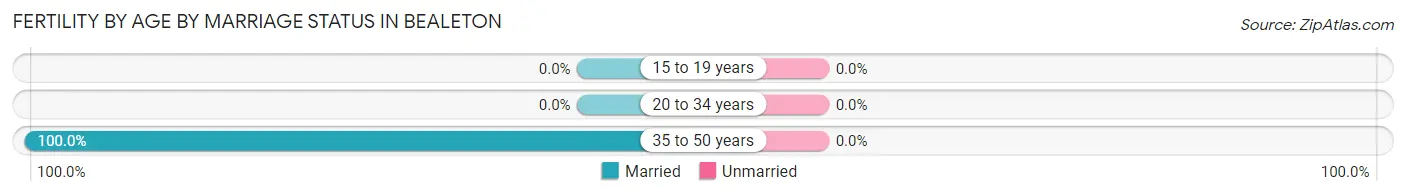
| Age Bracket | Married | Unmarried |
| 15 to 19 years | 0 (0.0%) | 0 (0.0%) |
| 20 to 34 years | 0 (0.0%) | 0 (0.0%) |
| 35 to 50 years | 46 (100.0%) | 0 (0.0%) |
| Total | 46 (100.0%) | 0 (0.0%) |
Fertility by Education in Bealeton
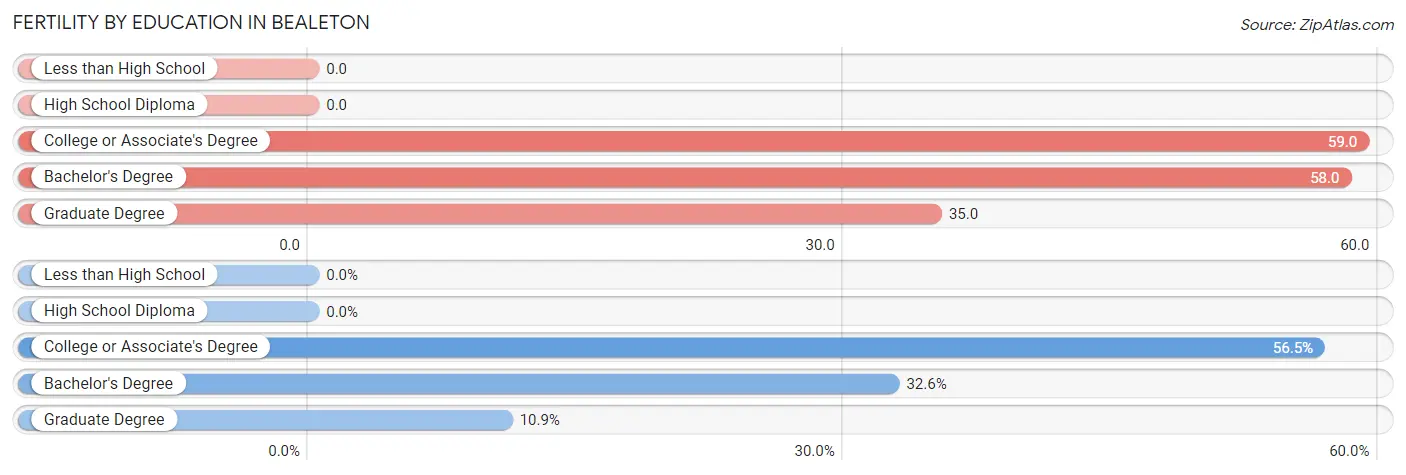
| Educational Attainment | Women with Births | Births / 1,000 Women |
| Less than High School | 0 (0.0%) | 0.0 |
| High School Diploma | 0 (0.0%) | 0.0 |
| College or Associate's Degree | 26 (56.5%) | 59.0 |
| Bachelor's Degree | 15 (32.6%) | 58.0 |
| Graduate Degree | 5 (10.9%) | 35.0 |
| Total | 46 (100.0%) | 34.0 |
Fertility by Education by Marriage Status in Bealeton
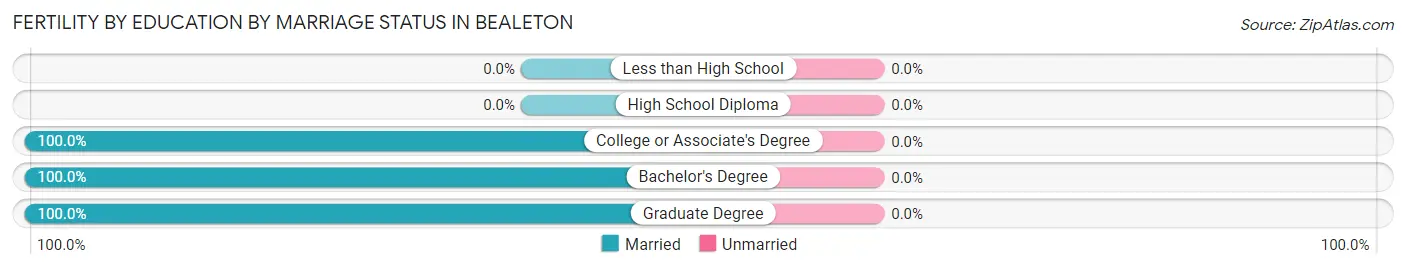
| Educational Attainment | Married | Unmarried |
| Less than High School | 0 (0.0%) | 0 (0.0%) |
| High School Diploma | 0 (0.0%) | 0 (0.0%) |
| College or Associate's Degree | 26 (100.0%) | 0 (0.0%) |
| Bachelor's Degree | 15 (100.0%) | 0 (0.0%) |
| Graduate Degree | 5 (100.0%) | 0 (0.0%) |
| Total | 46 (100.0%) | 0 (0.0%) |
Employment Characteristics in Bealeton
Employment by Class of Employer in Bealeton
Among the 2,621 employed individuals in Bealeton, private company employees (1,694 | 64.6%), local government employees (404 | 15.4%), and not-for-profit organizations (199 | 7.6%) make up the most common classes of employment.
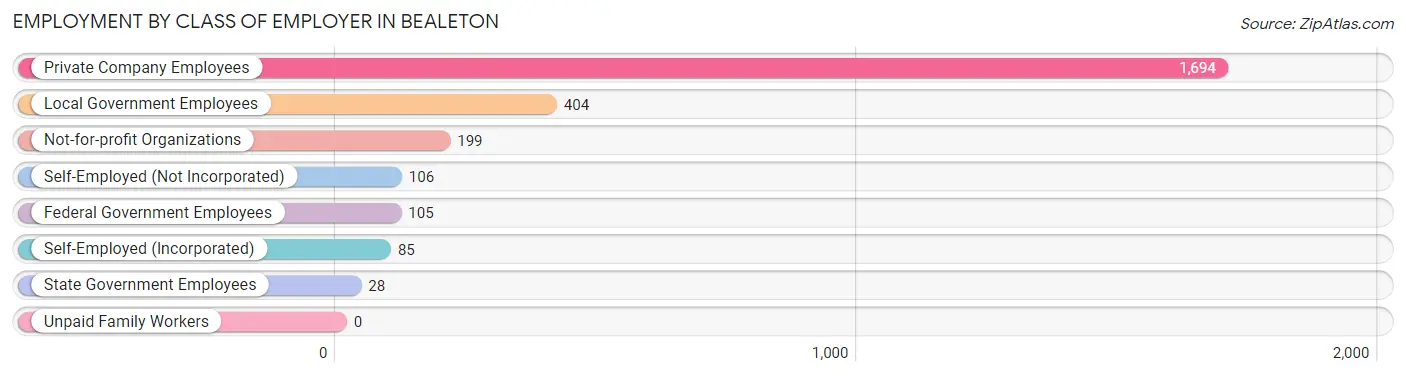
| Employer Class | # Employees | % Employees |
| Private Company Employees | 1,694 | 64.6% |
| Self-Employed (Incorporated) | 85 | 3.2% |
| Self-Employed (Not Incorporated) | 106 | 4.0% |
| Not-for-profit Organizations | 199 | 7.6% |
| Local Government Employees | 404 | 15.4% |
| State Government Employees | 28 | 1.1% |
| Federal Government Employees | 105 | 4.0% |
| Unpaid Family Workers | 0 | 0.0% |
| Total | 2,621 | 100.0% |
Employment Status by Age in Bealeton
According to the labor force statistics for Bealeton, out of the total population over 16 years of age (3,693), 72.5% or 2,677 individuals are in the labor force, with 0.6% or 16 of them unemployed. The age group with the highest labor force participation rate is 25 to 29 years, with 94.4% or 339 individuals in the labor force. Within the labor force, the 20 to 24 years age range has the highest percentage of unemployed individuals, with 10.3% or 15 of them being unemployed.
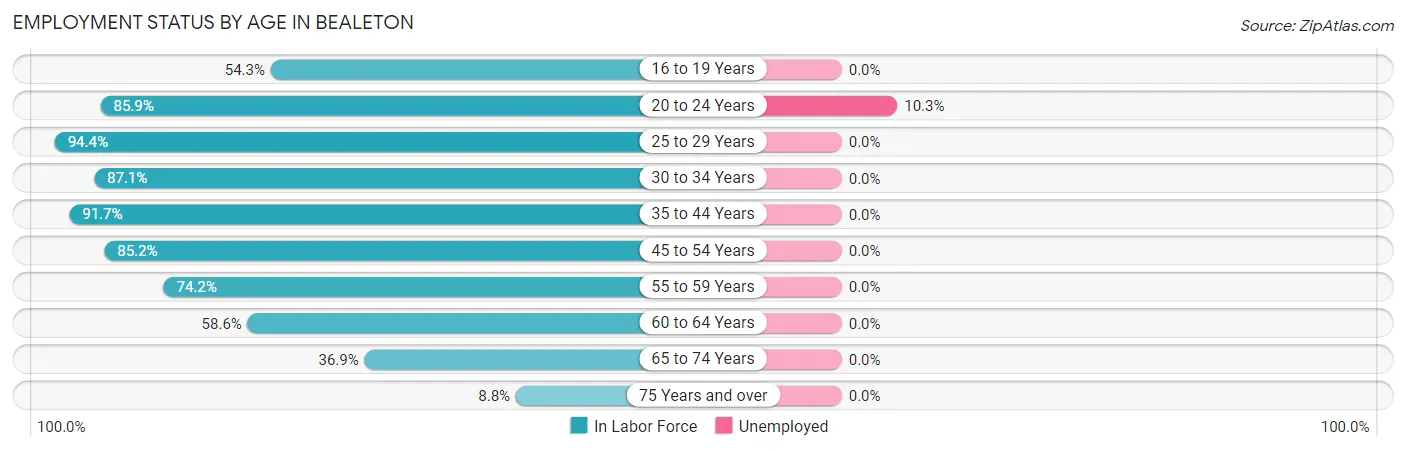
| Age Bracket | In Labor Force | Unemployed |
| 16 to 19 Years | 298 (54.3%) | 0 (0.0%) |
| 20 to 24 Years | 146 (85.9%) | 15 (10.3%) |
| 25 to 29 Years | 339 (94.4%) | 0 (0.0%) |
| 30 to 34 Years | 271 (87.1%) | 0 (0.0%) |
| 35 to 44 Years | 549 (91.7%) | 0 (0.0%) |
| 45 to 54 Years | 615 (85.2%) | 0 (0.0%) |
| 55 to 59 Years | 213 (74.2%) | 0 (0.0%) |
| 60 to 64 Years | 143 (58.6%) | 0 (0.0%) |
| 65 to 74 Years | 83 (36.9%) | 0 (0.0%) |
| 75 Years and over | 20 (8.8%) | 0 (0.0%) |
| Total | 2,677 (72.5%) | 16 (0.6%) |
Employment Status by Educational Attainment in Bealeton
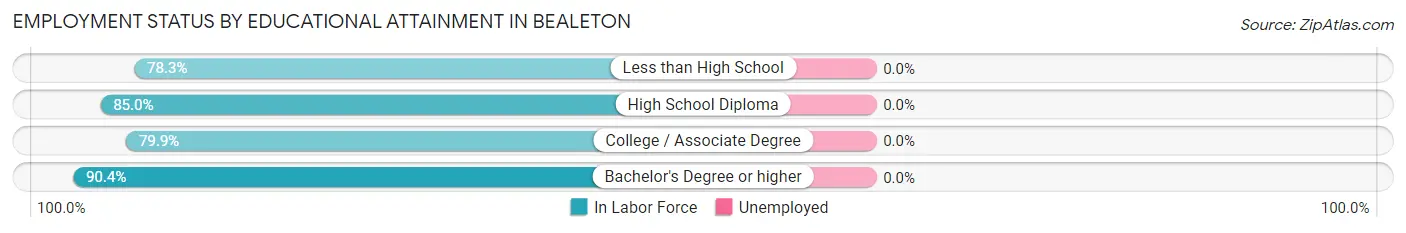
| Educational Attainment | In Labor Force | Unemployed |
| Less than High School | 170 (78.3%) | 0 (0.0%) |
| High School Diploma | 611 (85.0%) | 0 (0.0%) |
| College / Associate Degree | 649 (79.9%) | 0 (0.0%) |
| Bachelor's Degree or higher | 700 (90.4%) | 0 (0.0%) |
| Total | 2,131 (84.5%) | 0 (0.0%) |
Employment Occupations by Sex in Bealeton
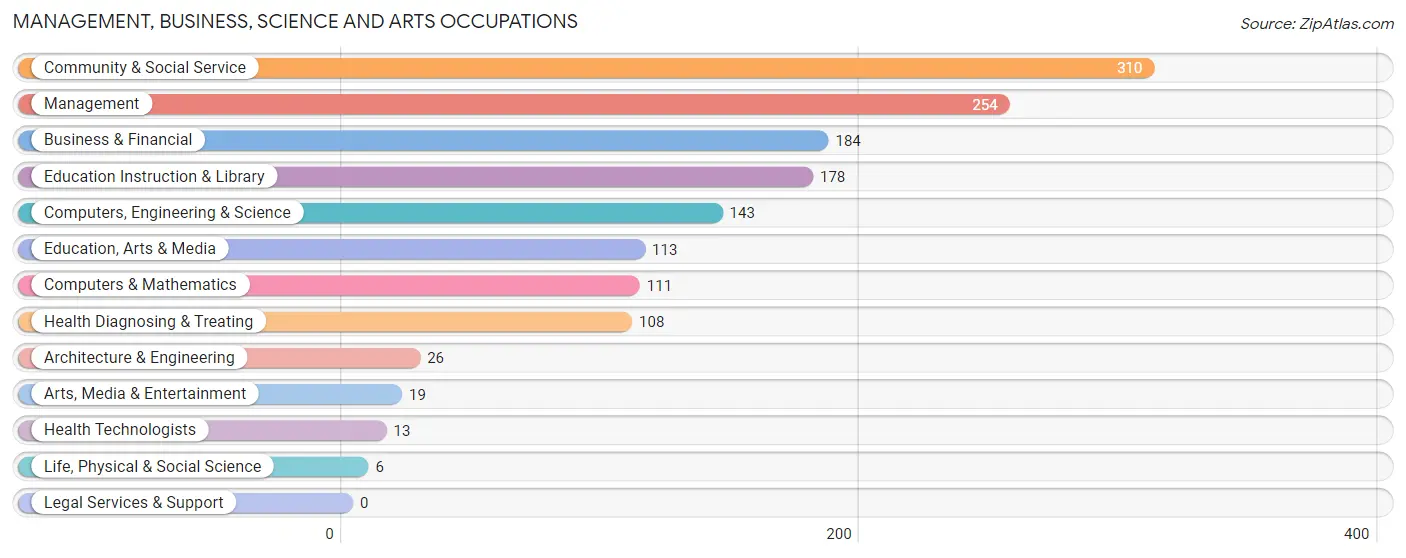
Management, Business, Science and Arts Occupations
The most common Management, Business, Science and Arts occupations in Bealeton are Community & Social Service (310 | 11.7%), Management (254 | 9.6%), Business & Financial (184 | 6.9%), Education Instruction & Library (178 | 6.7%), and Computers, Engineering & Science (143 | 5.4%).
Management, Business, Science and Arts Occupations by Sex
Within the Management, Business, Science and Arts occupations in Bealeton, the most male-oriented occupations are Architecture & Engineering (100.0%), Computers, Engineering & Science (65.0%), and Computers & Mathematics (60.4%), while the most female-oriented occupations are Life, Physical & Social Science (100.0%), Arts, Media & Entertainment (100.0%), and Health Diagnosing & Treating (100.0%).
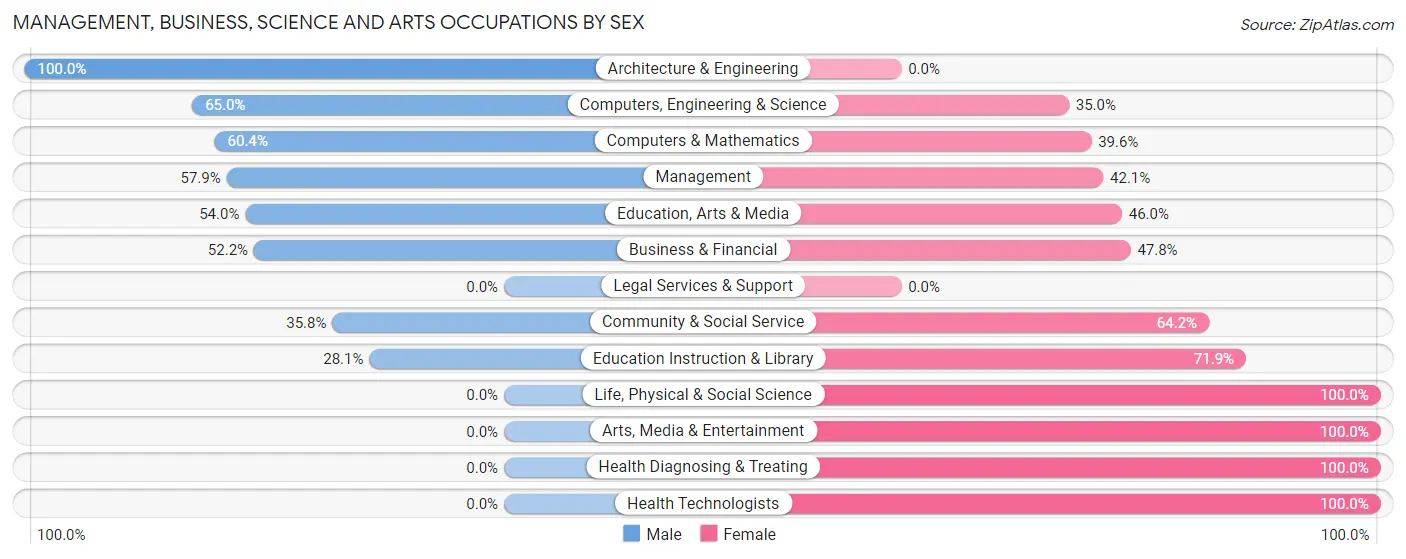
| Occupation | Male | Female |
| Management | 147 (57.9%) | 107 (42.1%) |
| Business & Financial | 96 (52.2%) | 88 (47.8%) |
| Computers, Engineering & Science | 93 (65.0%) | 50 (35.0%) |
| Computers & Mathematics | 67 (60.4%) | 44 (39.6%) |
| Architecture & Engineering | 26 (100.0%) | 0 (0.0%) |
| Life, Physical & Social Science | 0 (0.0%) | 6 (100.0%) |
| Community & Social Service | 111 (35.8%) | 199 (64.2%) |
| Education, Arts & Media | 61 (54.0%) | 52 (46.0%) |
| Legal Services & Support | 0 (0.0%) | 0 (0.0%) |
| Education Instruction & Library | 50 (28.1%) | 128 (71.9%) |
| Arts, Media & Entertainment | 0 (0.0%) | 19 (100.0%) |
| Health Diagnosing & Treating | 0 (0.0%) | 108 (100.0%) |
| Health Technologists | 0 (0.0%) | 13 (100.0%) |
| Total (Category) | 447 (44.7%) | 552 (55.3%) |
| Total (Overall) | 1,357 (51.0%) | 1,301 (48.9%) |
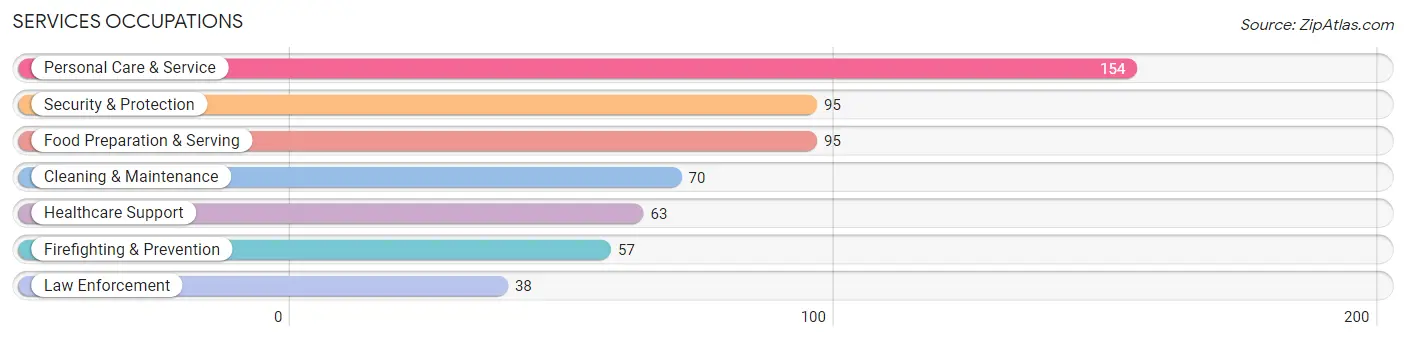
Services Occupations
The most common Services occupations in Bealeton are Personal Care & Service (154 | 5.8%), Security & Protection (95 | 3.6%), Food Preparation & Serving (95 | 3.6%), Cleaning & Maintenance (70 | 2.6%), and Healthcare Support (63 | 2.4%).
Services Occupations by Sex
Within the Services occupations in Bealeton, the most male-oriented occupations are Law Enforcement (94.7%), Security & Protection (91.6%), and Firefighting & Prevention (89.5%), while the most female-oriented occupations are Healthcare Support (100.0%), Food Preparation & Serving (88.4%), and Personal Care & Service (87.7%).
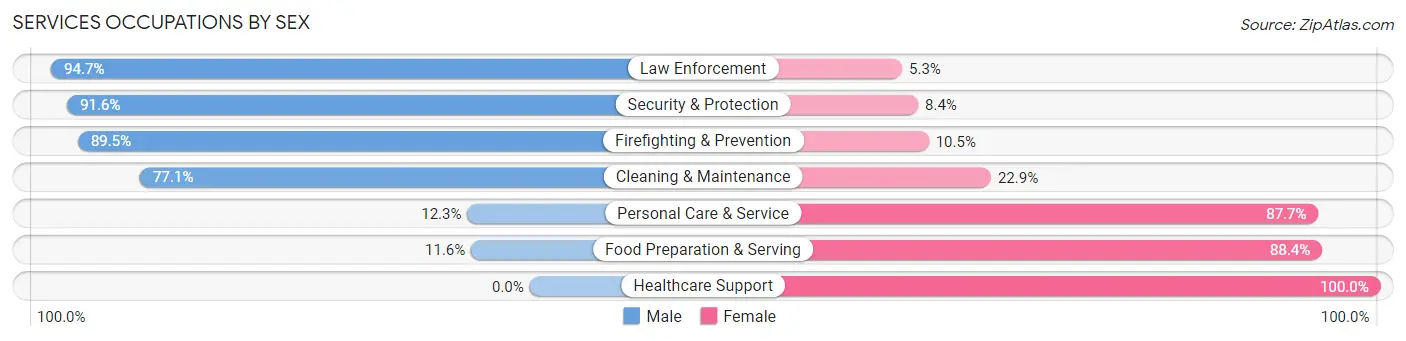
| Occupation | Male | Female |
| Healthcare Support | 0 (0.0%) | 63 (100.0%) |
| Security & Protection | 87 (91.6%) | 8 (8.4%) |
| Firefighting & Prevention | 51 (89.5%) | 6 (10.5%) |
| Law Enforcement | 36 (94.7%) | 2 (5.3%) |
| Food Preparation & Serving | 11 (11.6%) | 84 (88.4%) |
| Cleaning & Maintenance | 54 (77.1%) | 16 (22.9%) |
| Personal Care & Service | 19 (12.3%) | 135 (87.7%) |
| Total (Category) | 171 (35.8%) | 306 (64.1%) |
| Total (Overall) | 1,357 (51.0%) | 1,301 (48.9%) |
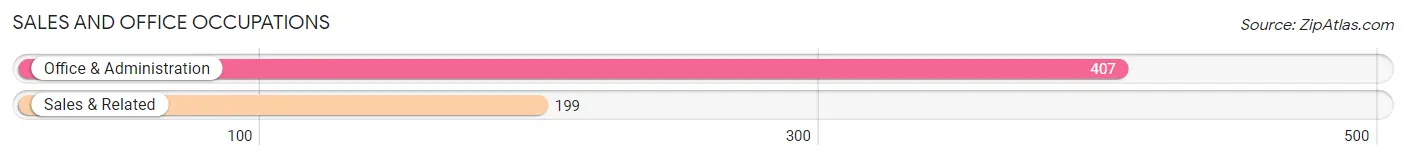
Sales and Office Occupations
The most common Sales and Office occupations in Bealeton are Office & Administration (407 | 15.3%), and Sales & Related (199 | 7.5%).
Sales and Office Occupations by Sex
| Occupation | Male | Female |
| Sales & Related | 102 (51.3%) | 97 (48.7%) |
| Office & Administration | 85 (20.9%) | 322 (79.1%) |
| Total (Category) | 187 (30.9%) | 419 (69.1%) |
| Total (Overall) | 1,357 (51.0%) | 1,301 (48.9%) |
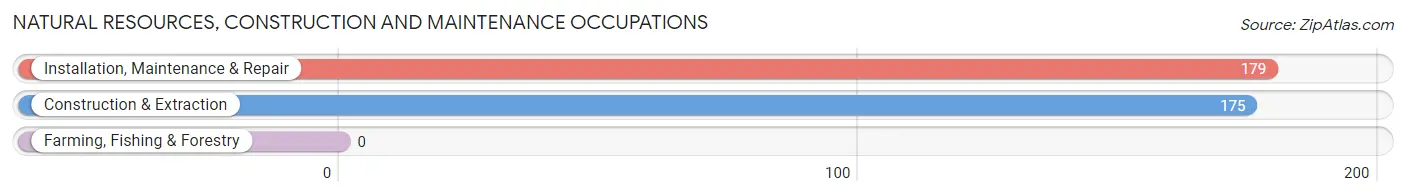
Natural Resources, Construction and Maintenance Occupations
The most common Natural Resources, Construction and Maintenance occupations in Bealeton are Installation, Maintenance & Repair (179 | 6.7%), and Construction & Extraction (175 | 6.6%).
Natural Resources, Construction and Maintenance Occupations by Sex
| Occupation | Male | Female |
| Farming, Fishing & Forestry | 0 (0.0%) | 0 (0.0%) |
| Construction & Extraction | 163 (93.1%) | 12 (6.9%) |
| Installation, Maintenance & Repair | 167 (93.3%) | 12 (6.7%) |
| Total (Category) | 330 (93.2%) | 24 (6.8%) |
| Total (Overall) | 1,357 (51.0%) | 1,301 (48.9%) |
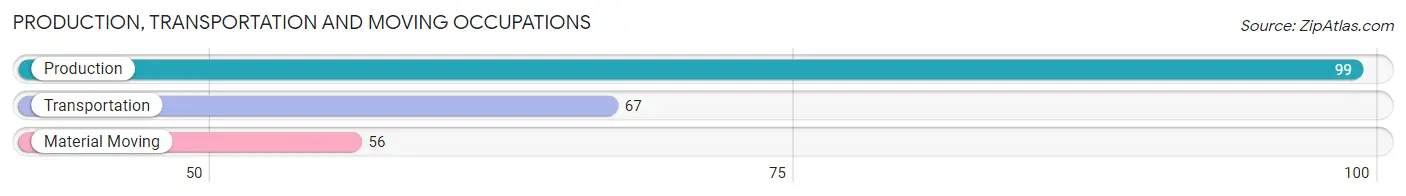
Production, Transportation and Moving Occupations
The most common Production, Transportation and Moving occupations in Bealeton are Production (99 | 3.7%), Transportation (67 | 2.5%), and Material Moving (56 | 2.1%).
Production, Transportation and Moving Occupations by Sex
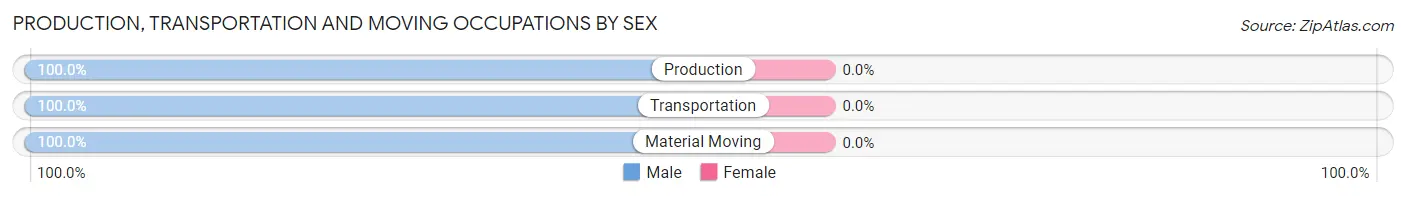
| Occupation | Male | Female |
| Production | 99 (100.0%) | 0 (0.0%) |
| Transportation | 67 (100.0%) | 0 (0.0%) |
| Material Moving | 56 (100.0%) | 0 (0.0%) |
| Total (Category) | 222 (100.0%) | 0 (0.0%) |
| Total (Overall) | 1,357 (51.0%) | 1,301 (48.9%) |
Employment Industries by Sex in Bealeton
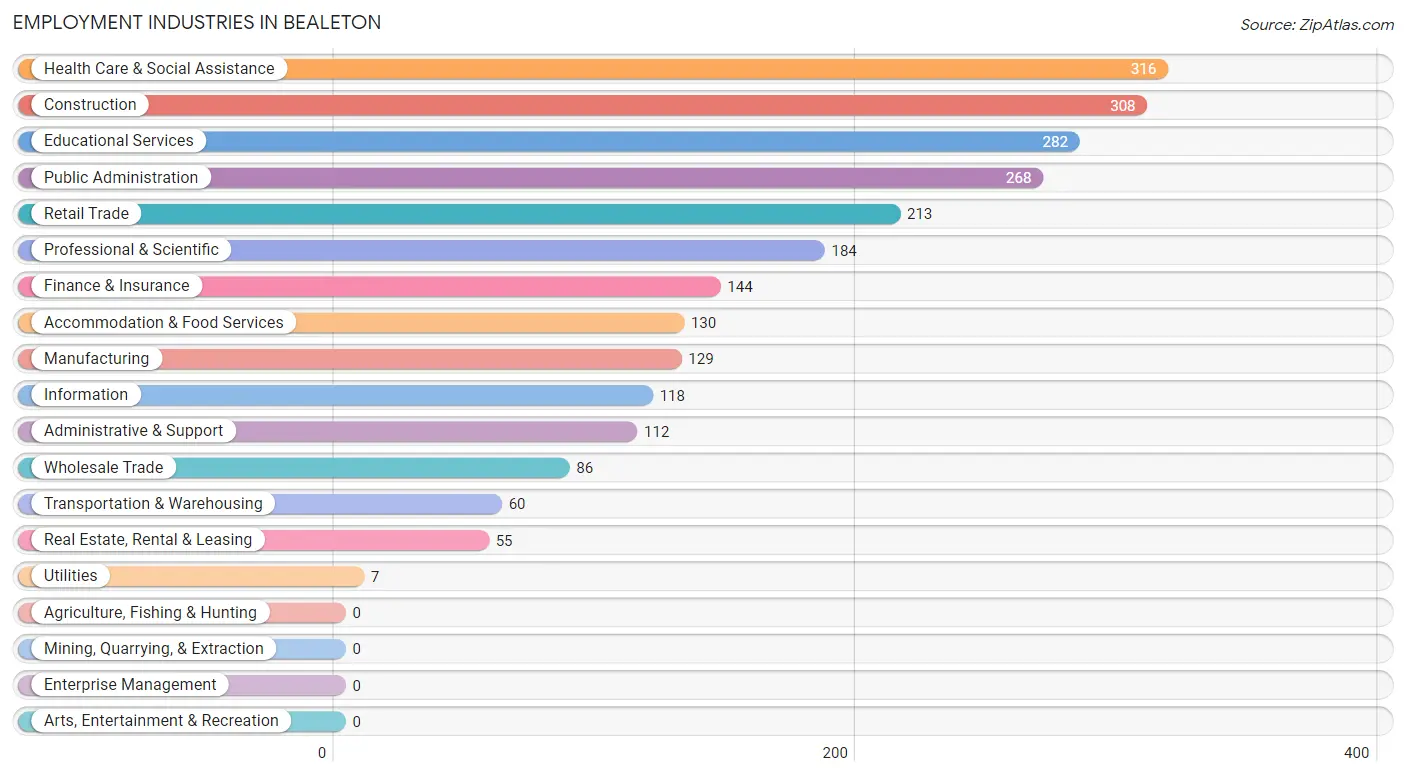
Employment Industries in Bealeton
The major employment industries in Bealeton include Health Care & Social Assistance (316 | 11.9%), Construction (308 | 11.6%), Educational Services (282 | 10.6%), Public Administration (268 | 10.1%), and Retail Trade (213 | 8.0%).
Employment Industries by Sex in Bealeton
The Bealeton industries that see more men than women are Transportation & Warehousing (100.0%), Utilities (100.0%), and Construction (88.6%), whereas the industries that tend to have a higher number of women are Health Care & Social Assistance (84.5%), Finance & Insurance (76.4%), and Accommodation & Food Services (71.5%).
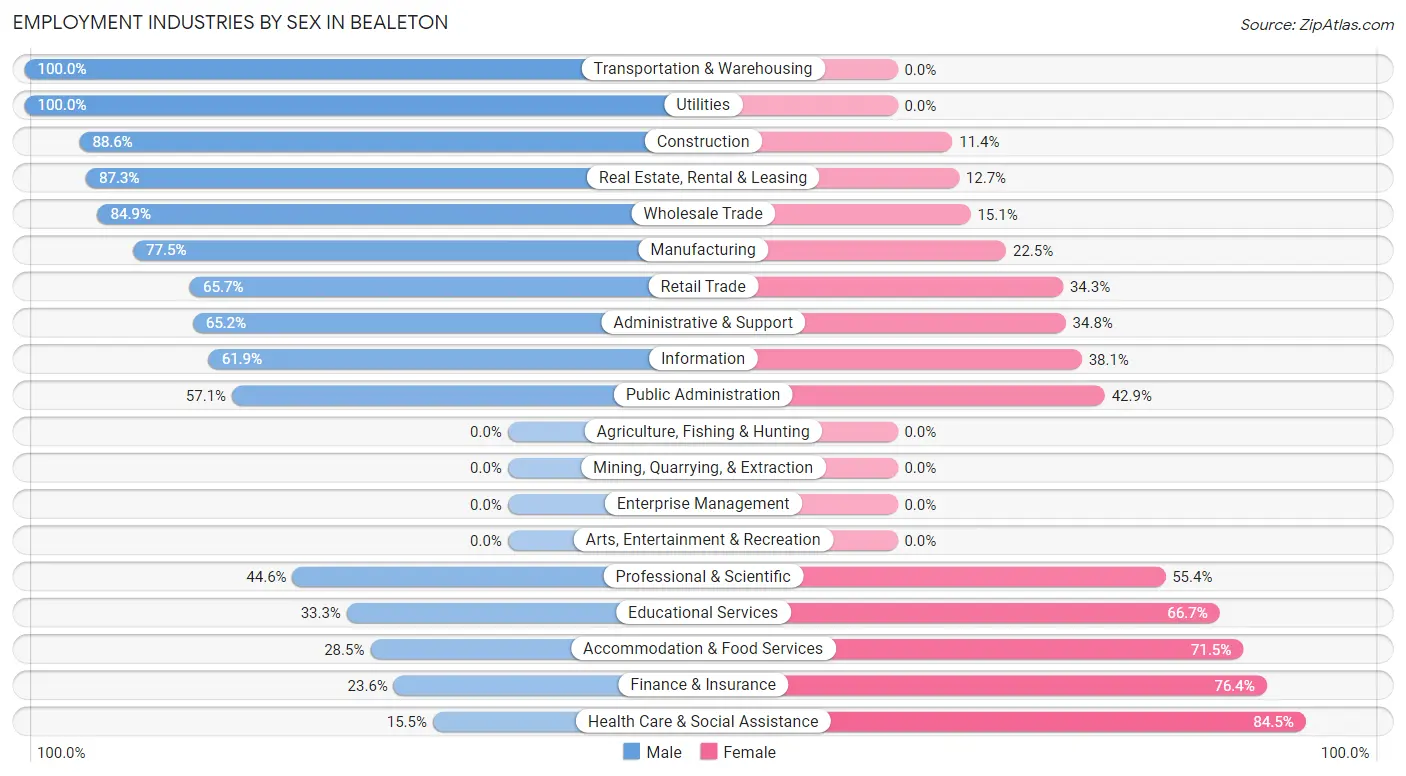
| Industry | Male | Female |
| Agriculture, Fishing & Hunting | 0 (0.0%) | 0 (0.0%) |
| Mining, Quarrying, & Extraction | 0 (0.0%) | 0 (0.0%) |
| Construction | 273 (88.6%) | 35 (11.4%) |
| Manufacturing | 100 (77.5%) | 29 (22.5%) |
| Wholesale Trade | 73 (84.9%) | 13 (15.1%) |
| Retail Trade | 140 (65.7%) | 73 (34.3%) |
| Transportation & Warehousing | 60 (100.0%) | 0 (0.0%) |
| Utilities | 7 (100.0%) | 0 (0.0%) |
| Information | 73 (61.9%) | 45 (38.1%) |
| Finance & Insurance | 34 (23.6%) | 110 (76.4%) |
| Real Estate, Rental & Leasing | 48 (87.3%) | 7 (12.7%) |
| Professional & Scientific | 82 (44.6%) | 102 (55.4%) |
| Enterprise Management | 0 (0.0%) | 0 (0.0%) |
| Administrative & Support | 73 (65.2%) | 39 (34.8%) |
| Educational Services | 94 (33.3%) | 188 (66.7%) |
| Health Care & Social Assistance | 49 (15.5%) | 267 (84.5%) |
| Arts, Entertainment & Recreation | 0 (0.0%) | 0 (0.0%) |
| Accommodation & Food Services | 37 (28.5%) | 93 (71.5%) |
| Public Administration | 153 (57.1%) | 115 (42.9%) |
| Total | 1,357 (51.0%) | 1,301 (48.9%) |
Education in Bealeton
School Enrollment in Bealeton
The most common levels of schooling among the 1,470 students in Bealeton are high school (394 | 26.8%), middle school (357 | 24.3%), and elementary school (343 | 23.3%).
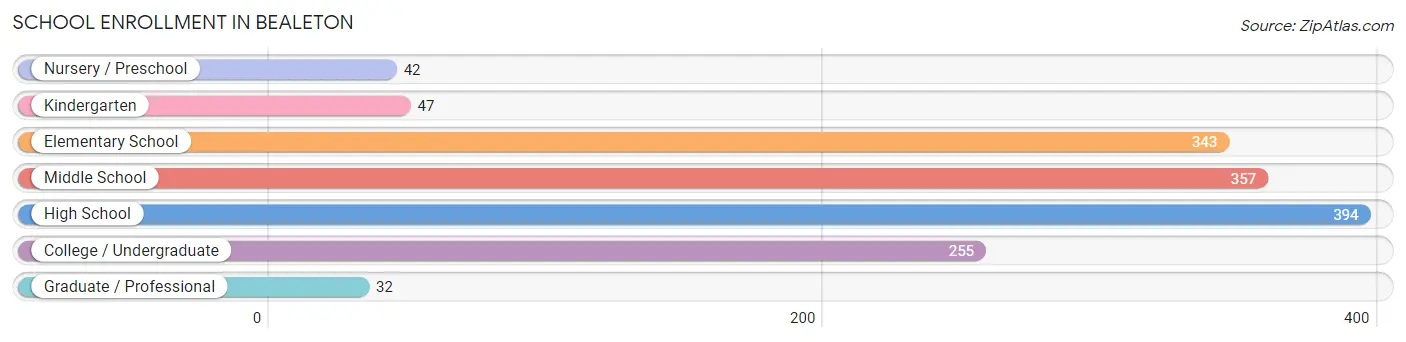
| School Level | # Students | % Students |
| Nursery / Preschool | 42 | 2.9% |
| Kindergarten | 47 | 3.2% |
| Elementary School | 343 | 23.3% |
| Middle School | 357 | 24.3% |
| High School | 394 | 26.8% |
| College / Undergraduate | 255 | 17.3% |
| Graduate / Professional | 32 | 2.2% |
| Total | 1,470 | 100.0% |
School Enrollment by Age by Funding Source in Bealeton
Out of a total of 1,470 students who are enrolled in schools in Bealeton, 268 (18.2%) attend a private institution, while the remaining 1,202 (81.8%) are enrolled in public schools. The age group of 18 to 19 year olds has the highest likelihood of being enrolled in private schools, with 114 (58.5% in the age bracket) enrolled. Conversely, the age group of 20 to 24 year olds has the lowest likelihood of being enrolled in a private school, with 75 (100.0% in the age bracket) attending a public institution.
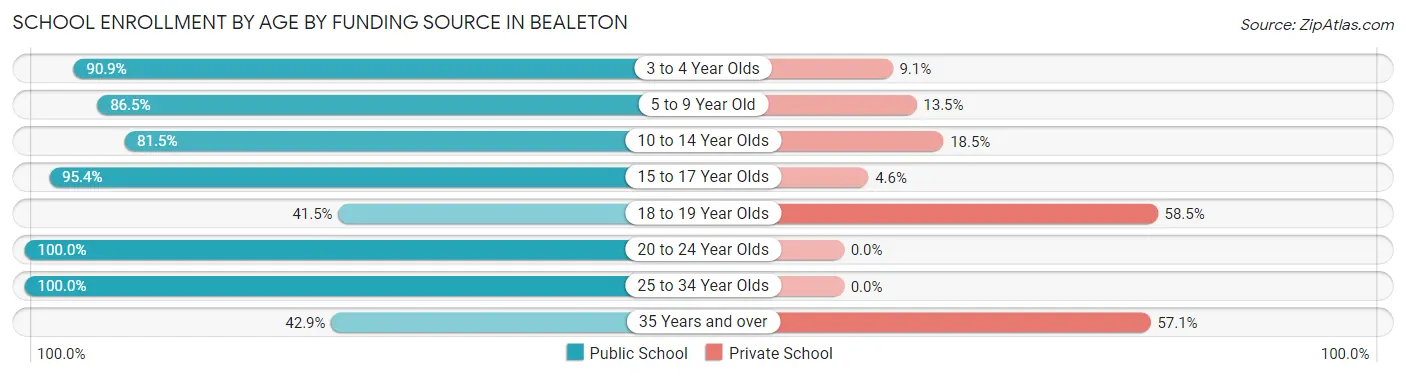
| Age Bracket | Public School | Private School |
| 3 to 4 Year Olds | 30 (90.9%) | 3 (9.1%) |
| 5 to 9 Year Old | 313 (86.5%) | 49 (13.5%) |
| 10 to 14 Year Olds | 347 (81.5%) | 79 (18.5%) |
| 15 to 17 Year Olds | 292 (95.4%) | 14 (4.6%) |
| 18 to 19 Year Olds | 81 (41.5%) | 114 (58.5%) |
| 20 to 24 Year Olds | 75 (100.0%) | 0 (0.0%) |
| 25 to 34 Year Olds | 59 (100.0%) | 0 (0.0%) |
| 35 Years and over | 6 (42.9%) | 8 (57.1%) |
| Total | 1,202 (81.8%) | 268 (18.2%) |
Educational Attainment by Field of Study in Bealeton
Business (145 | 16.5%), psychology (104 | 11.9%), education (93 | 10.6%), computers & mathematics (88 | 10.0%), and engineering (78 | 8.9%) are the most common fields of study among 877 individuals in Bealeton who have obtained a bachelor's degree or higher.
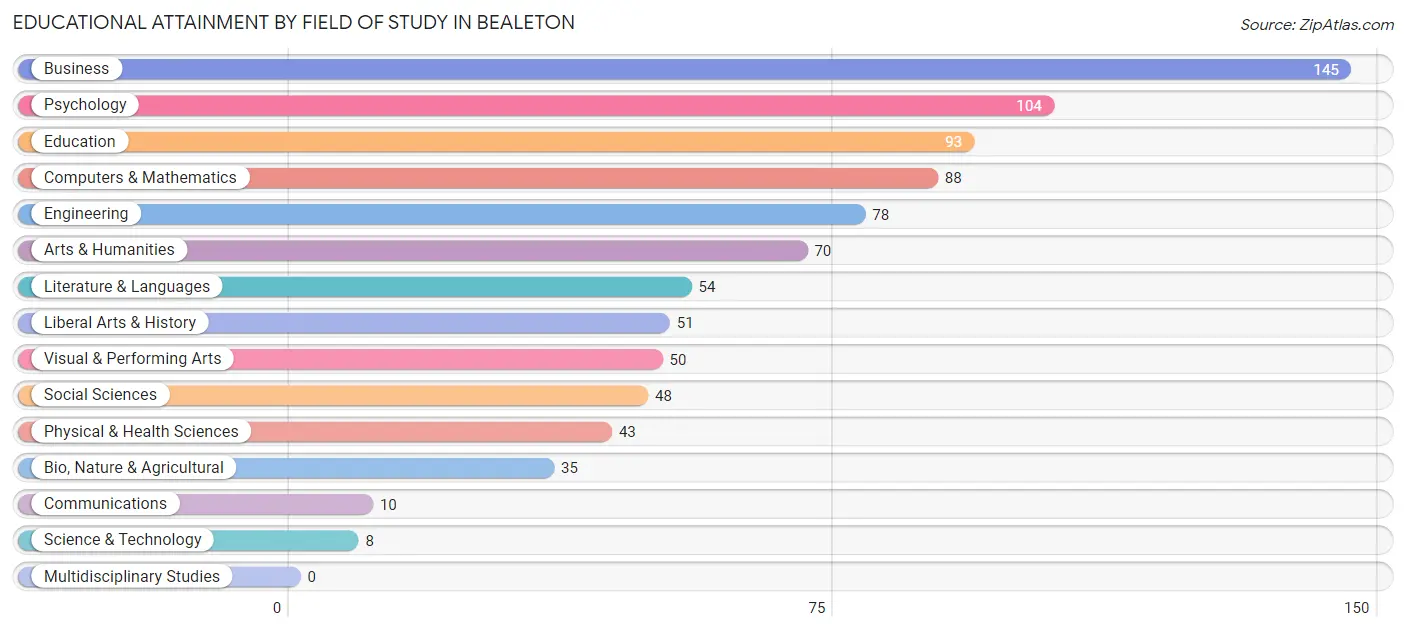
| Field of Study | # Graduates | % Graduates |
| Computers & Mathematics | 88 | 10.0% |
| Bio, Nature & Agricultural | 35 | 4.0% |
| Physical & Health Sciences | 43 | 4.9% |
| Psychology | 104 | 11.9% |
| Social Sciences | 48 | 5.5% |
| Engineering | 78 | 8.9% |
| Multidisciplinary Studies | 0 | 0.0% |
| Science & Technology | 8 | 0.9% |
| Business | 145 | 16.5% |
| Education | 93 | 10.6% |
| Literature & Languages | 54 | 6.2% |
| Liberal Arts & History | 51 | 5.8% |
| Visual & Performing Arts | 50 | 5.7% |
| Communications | 10 | 1.1% |
| Arts & Humanities | 70 | 8.0% |
| Total | 877 | 100.0% |
Transportation & Commute in Bealeton
Vehicle Availability by Sex in Bealeton
The most prevalent vehicle ownership categories in Bealeton are males with 2 vehicles (516, accounting for 38.2%) and females with 2 vehicles (430, making up 40.7%).
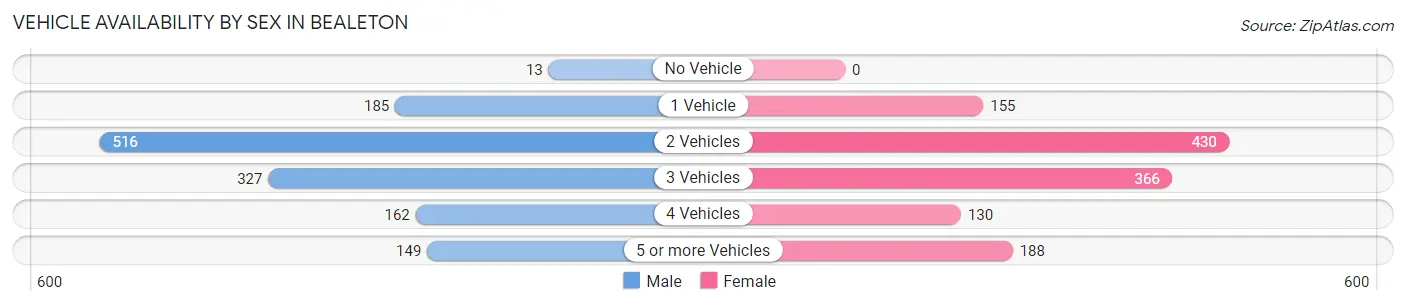
| Vehicles Available | Male | Female |
| No Vehicle | 13 (1.0%) | 0 (0.0%) |
| 1 Vehicle | 185 (13.7%) | 155 (12.2%) |
| 2 Vehicles | 516 (38.2%) | 430 (33.9%) |
| 3 Vehicles | 327 (24.2%) | 366 (28.8%) |
| 4 Vehicles | 162 (12.0%) | 130 (10.2%) |
| 5 or more Vehicles | 149 (11.0%) | 188 (14.8%) |
| Total | 1,352 (100.0%) | 1,269 (100.0%) |
Commute Time in Bealeton
The most frequently occuring commute durations in Bealeton are 30 to 34 minutes (424 commuters, 18.1%), 60 to 89 minutes (370 commuters, 15.8%), and 45 to 59 minutes (349 commuters, 14.9%).
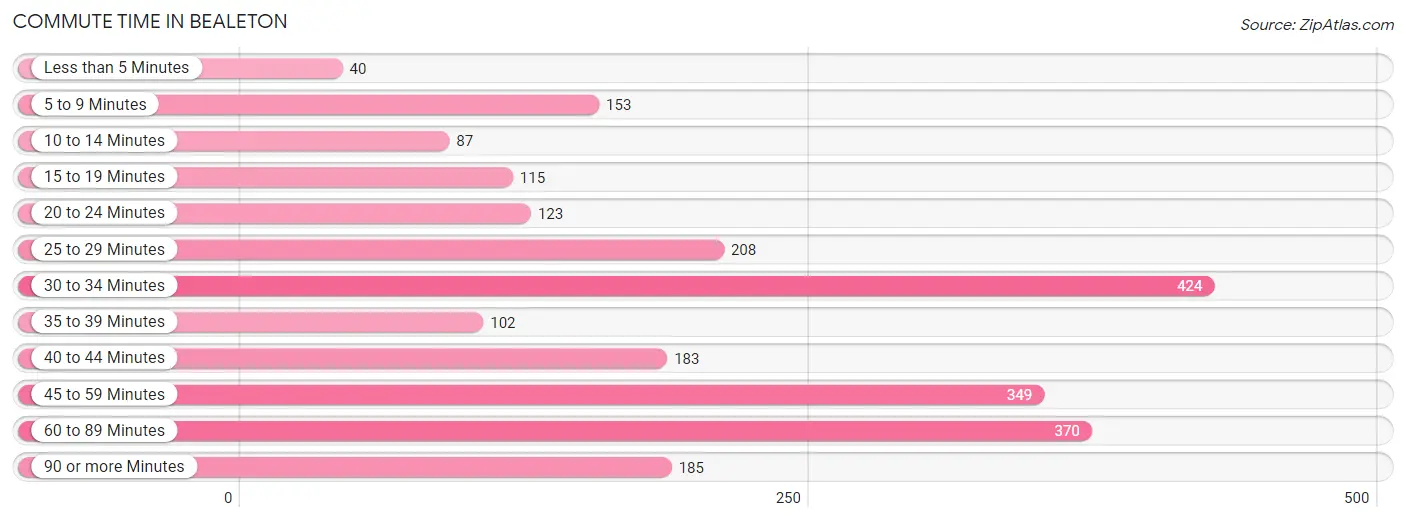
| Commute Time | # Commuters | % Commuters |
| Less than 5 Minutes | 40 | 1.7% |
| 5 to 9 Minutes | 153 | 6.5% |
| 10 to 14 Minutes | 87 | 3.7% |
| 15 to 19 Minutes | 115 | 4.9% |
| 20 to 24 Minutes | 123 | 5.3% |
| 25 to 29 Minutes | 208 | 8.9% |
| 30 to 34 Minutes | 424 | 18.1% |
| 35 to 39 Minutes | 102 | 4.4% |
| 40 to 44 Minutes | 183 | 7.8% |
| 45 to 59 Minutes | 349 | 14.9% |
| 60 to 89 Minutes | 370 | 15.8% |
| 90 or more Minutes | 185 | 7.9% |
Commute Time by Sex in Bealeton
The most common commute times in Bealeton are 60 to 89 minutes (321 commuters, 25.0%) for males and 30 to 34 minutes (236 commuters, 22.4%) for females.
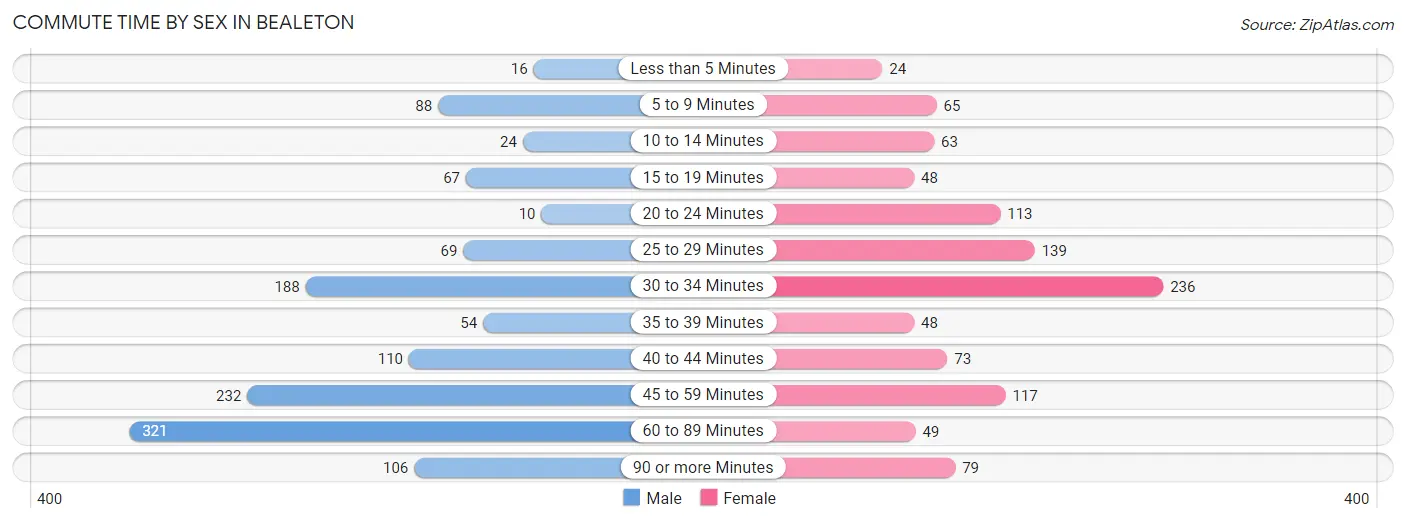
| Commute Time | Male | Female |
| Less than 5 Minutes | 16 (1.3%) | 24 (2.3%) |
| 5 to 9 Minutes | 88 (6.9%) | 65 (6.2%) |
| 10 to 14 Minutes | 24 (1.9%) | 63 (6.0%) |
| 15 to 19 Minutes | 67 (5.2%) | 48 (4.5%) |
| 20 to 24 Minutes | 10 (0.8%) | 113 (10.7%) |
| 25 to 29 Minutes | 69 (5.4%) | 139 (13.2%) |
| 30 to 34 Minutes | 188 (14.6%) | 236 (22.4%) |
| 35 to 39 Minutes | 54 (4.2%) | 48 (4.5%) |
| 40 to 44 Minutes | 110 (8.6%) | 73 (6.9%) |
| 45 to 59 Minutes | 232 (18.0%) | 117 (11.1%) |
| 60 to 89 Minutes | 321 (25.0%) | 49 (4.6%) |
| 90 or more Minutes | 106 (8.3%) | 79 (7.5%) |
Time of Departure to Work by Sex in Bealeton
The most frequent times of departure to work in Bealeton are 5:30 AM to 5:59 AM (236, 18.4%) for males and 12:00 PM to 3:59 PM (190, 18.0%) for females.
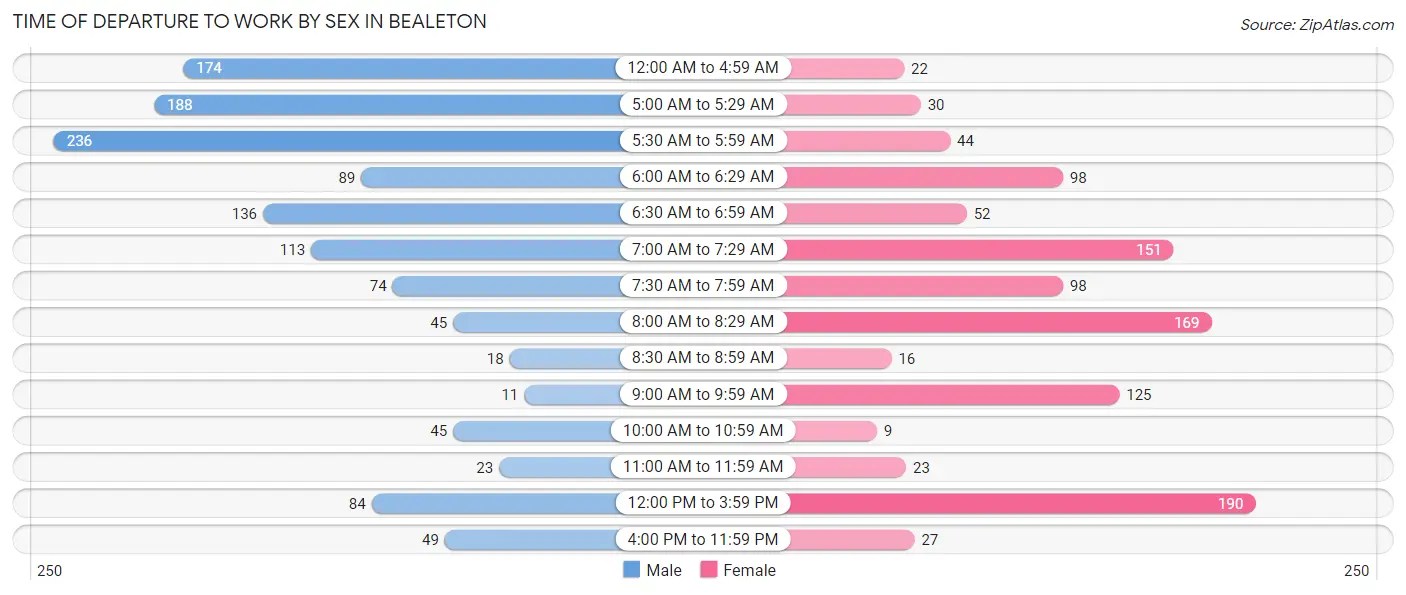
| Time of Departure | Male | Female |
| 12:00 AM to 4:59 AM | 174 (13.5%) | 22 (2.1%) |
| 5:00 AM to 5:29 AM | 188 (14.6%) | 30 (2.9%) |
| 5:30 AM to 5:59 AM | 236 (18.4%) | 44 (4.2%) |
| 6:00 AM to 6:29 AM | 89 (6.9%) | 98 (9.3%) |
| 6:30 AM to 6:59 AM | 136 (10.6%) | 52 (4.9%) |
| 7:00 AM to 7:29 AM | 113 (8.8%) | 151 (14.3%) |
| 7:30 AM to 7:59 AM | 74 (5.8%) | 98 (9.3%) |
| 8:00 AM to 8:29 AM | 45 (3.5%) | 169 (16.0%) |
| 8:30 AM to 8:59 AM | 18 (1.4%) | 16 (1.5%) |
| 9:00 AM to 9:59 AM | 11 (0.9%) | 125 (11.9%) |
| 10:00 AM to 10:59 AM | 45 (3.5%) | 9 (0.9%) |
| 11:00 AM to 11:59 AM | 23 (1.8%) | 23 (2.2%) |
| 12:00 PM to 3:59 PM | 84 (6.5%) | 190 (18.0%) |
| 4:00 PM to 11:59 PM | 49 (3.8%) | 27 (2.6%) |
| Total | 1,285 (100.0%) | 1,054 (100.0%) |
Housing Occupancy in Bealeton
Occupancy by Ownership in Bealeton
Of the total 1,558 dwellings in Bealeton, owner-occupied units account for 1,194 (76.6%), while renter-occupied units make up 364 (23.4%).
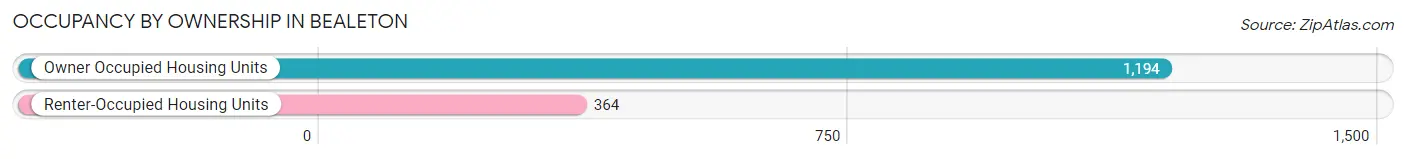
| Occupancy | # Housing Units | % Housing Units |
| Owner Occupied Housing Units | 1,194 | 76.6% |
| Renter-Occupied Housing Units | 364 | 23.4% |
| Total Occupied Housing Units | 1,558 | 100.0% |
Occupancy by Household Size in Bealeton
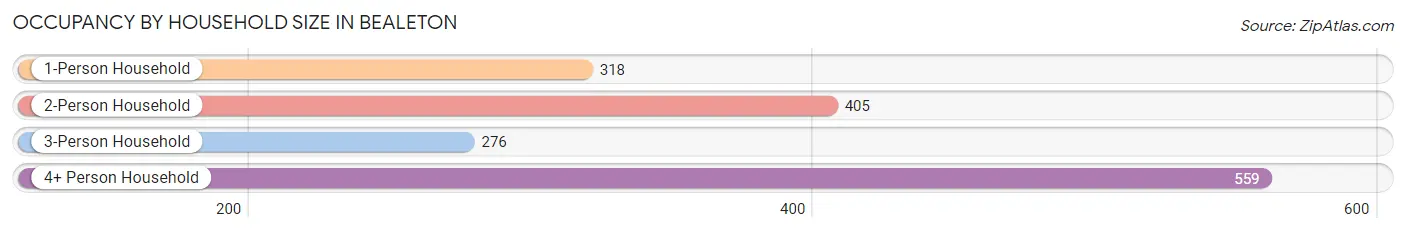
| Household Size | # Housing Units | % Housing Units |
| 1-Person Household | 318 | 20.4% |
| 2-Person Household | 405 | 26.0% |
| 3-Person Household | 276 | 17.7% |
| 4+ Person Household | 559 | 35.9% |
| Total Housing Units | 1,558 | 100.0% |
Occupancy by Ownership by Household Size in Bealeton
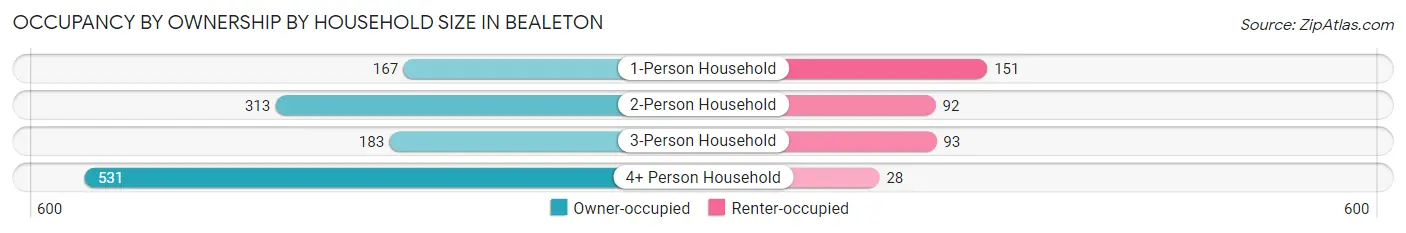
| Household Size | Owner-occupied | Renter-occupied |
| 1-Person Household | 167 (52.5%) | 151 (47.5%) |
| 2-Person Household | 313 (77.3%) | 92 (22.7%) |
| 3-Person Household | 183 (66.3%) | 93 (33.7%) |
| 4+ Person Household | 531 (95.0%) | 28 (5.0%) |
| Total Housing Units | 1,194 (76.6%) | 364 (23.4%) |
Occupancy by Educational Attainment in Bealeton
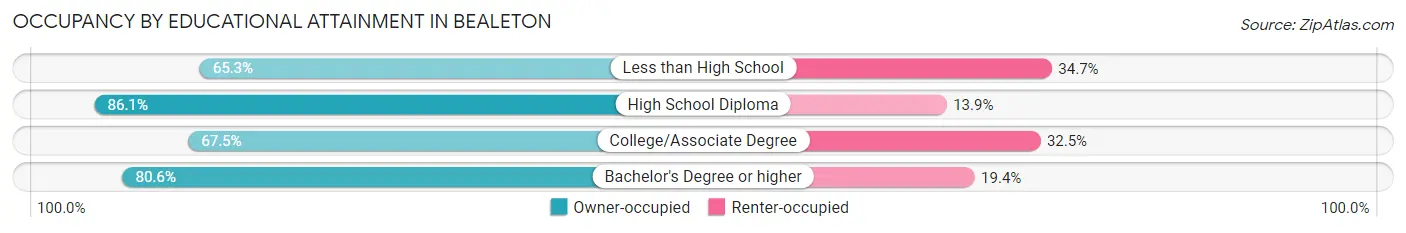
| Household Size | Owner-occupied | Renter-occupied |
| Less than High School | 62 (65.3%) | 33 (34.7%) |
| High School Diploma | 372 (86.1%) | 60 (13.9%) |
| College/Associate Degree | 366 (67.5%) | 176 (32.5%) |
| Bachelor's Degree or higher | 394 (80.6%) | 95 (19.4%) |
Occupancy by Age of Householder in Bealeton
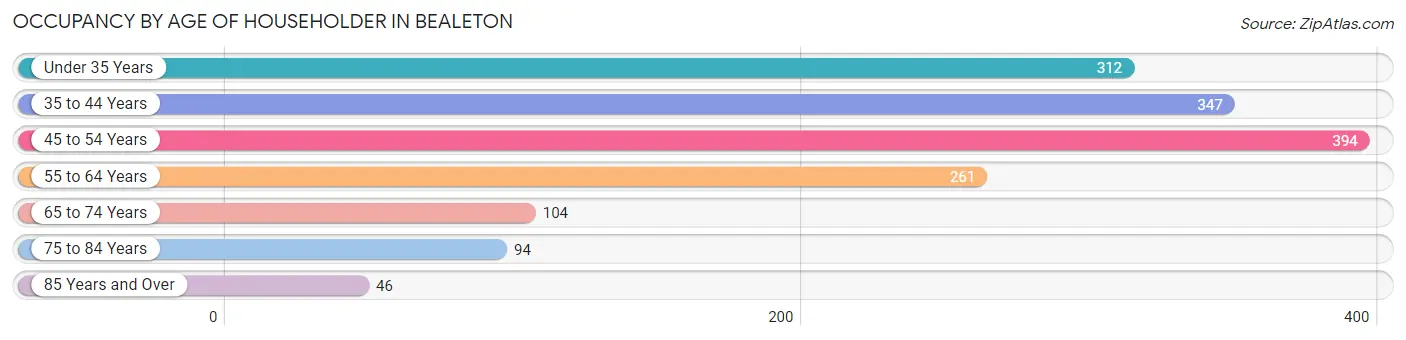
| Age Bracket | # Households | % Households |
| Under 35 Years | 312 | 20.0% |
| 35 to 44 Years | 347 | 22.3% |
| 45 to 54 Years | 394 | 25.3% |
| 55 to 64 Years | 261 | 16.8% |
| 65 to 74 Years | 104 | 6.7% |
| 75 to 84 Years | 94 | 6.0% |
| 85 Years and Over | 46 | 2.9% |
| Total | 1,558 | 100.0% |
Housing Finances in Bealeton
Median Income by Occupancy in Bealeton
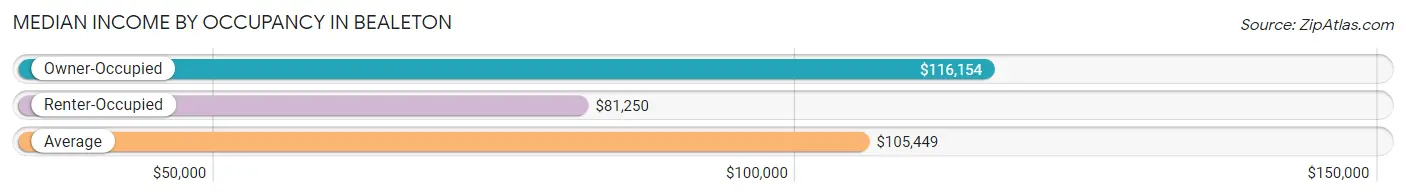
| Occupancy Type | # Households | Median Income |
| Owner-Occupied | 1,194 (76.6%) | $116,154 |
| Renter-Occupied | 364 (23.4%) | $81,250 |
| Average | 1,558 (100.0%) | $105,449 |
Occupancy by Householder Income Bracket in Bealeton
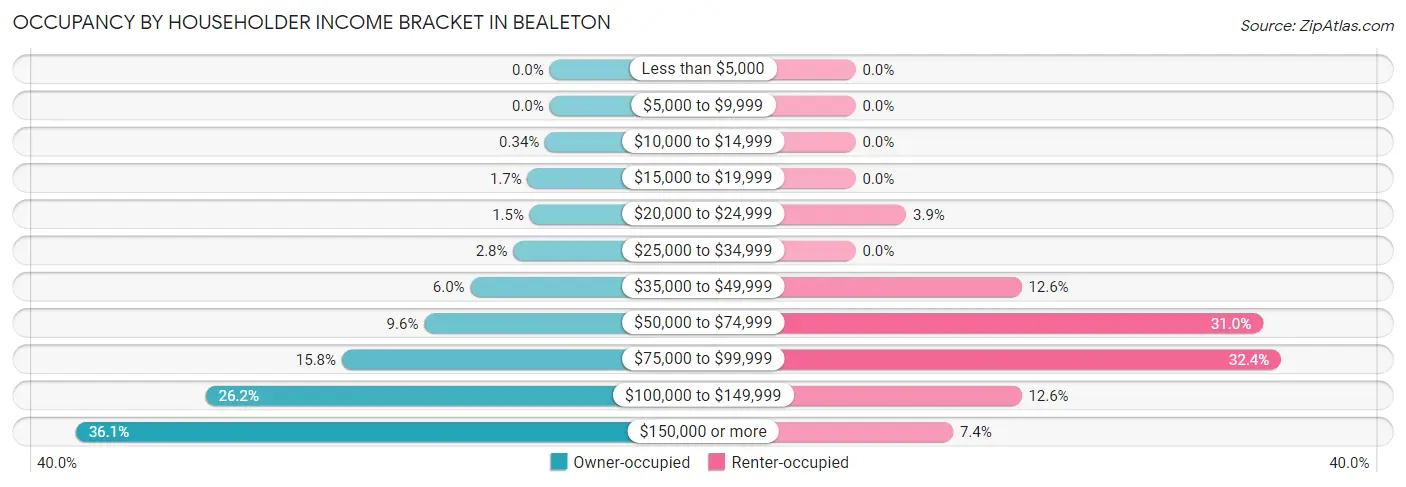
| Income Bracket | Owner-occupied | Renter-occupied |
| Less than $5,000 | 0 (0.0%) | 0 (0.0%) |
| $5,000 to $9,999 | 0 (0.0%) | 0 (0.0%) |
| $10,000 to $14,999 | 4 (0.3%) | 0 (0.0%) |
| $15,000 to $19,999 | 20 (1.7%) | 0 (0.0%) |
| $20,000 to $24,999 | 18 (1.5%) | 14 (3.8%) |
| $25,000 to $34,999 | 33 (2.8%) | 0 (0.0%) |
| $35,000 to $49,999 | 72 (6.0%) | 46 (12.6%) |
| $50,000 to $74,999 | 114 (9.6%) | 113 (31.0%) |
| $75,000 to $99,999 | 189 (15.8%) | 118 (32.4%) |
| $100,000 to $149,999 | 313 (26.2%) | 46 (12.6%) |
| $150,000 or more | 431 (36.1%) | 27 (7.4%) |
| Total | 1,194 (100.0%) | 364 (100.0%) |
Monthly Housing Cost Tiers in Bealeton
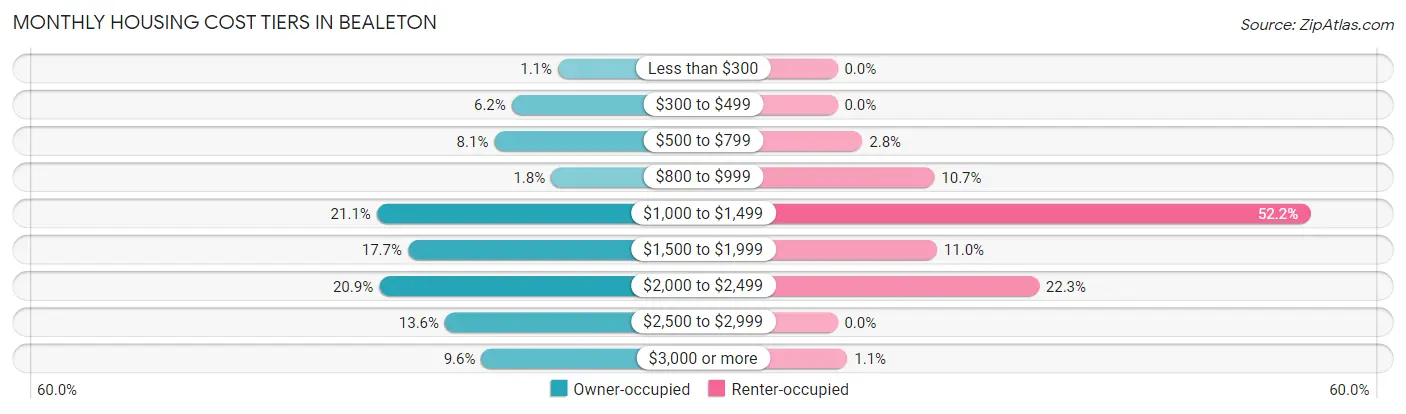
| Monthly Cost | Owner-occupied | Renter-occupied |
| Less than $300 | 13 (1.1%) | 0 (0.0%) |
| $300 to $499 | 74 (6.2%) | 0 (0.0%) |
| $500 to $799 | 97 (8.1%) | 10 (2.8%) |
| $800 to $999 | 22 (1.8%) | 39 (10.7%) |
| $1,000 to $1,499 | 252 (21.1%) | 190 (52.2%) |
| $1,500 to $1,999 | 211 (17.7%) | 40 (11.0%) |
| $2,000 to $2,499 | 249 (20.8%) | 81 (22.3%) |
| $2,500 to $2,999 | 162 (13.6%) | 0 (0.0%) |
| $3,000 or more | 114 (9.6%) | 4 (1.1%) |
| Total | 1,194 (100.0%) | 364 (100.0%) |
Physical Housing Characteristics in Bealeton
Housing Structures in Bealeton
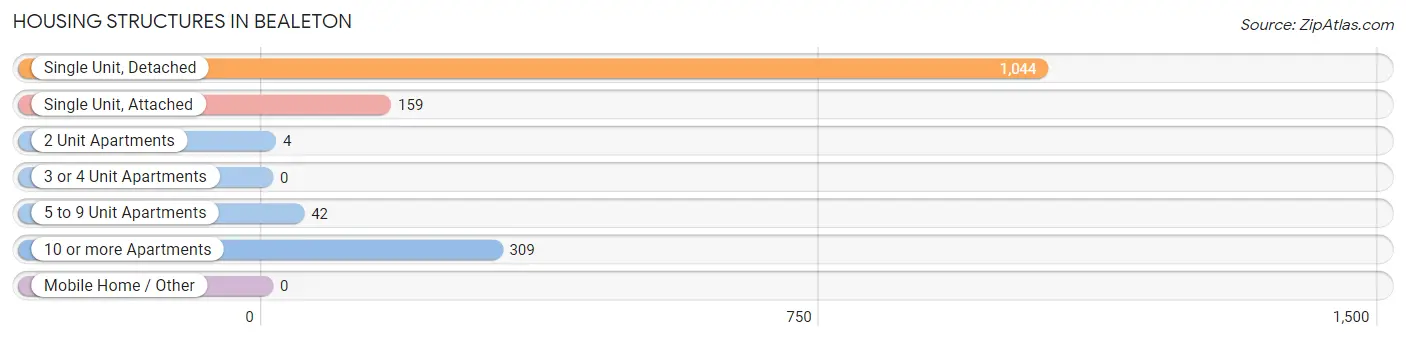
| Structure Type | # Housing Units | % Housing Units |
| Single Unit, Detached | 1,044 | 67.0% |
| Single Unit, Attached | 159 | 10.2% |
| 2 Unit Apartments | 4 | 0.3% |
| 3 or 4 Unit Apartments | 0 | 0.0% |
| 5 to 9 Unit Apartments | 42 | 2.7% |
| 10 or more Apartments | 309 | 19.8% |
| Mobile Home / Other | 0 | 0.0% |
| Total | 1,558 | 100.0% |
Housing Structures by Occupancy in Bealeton
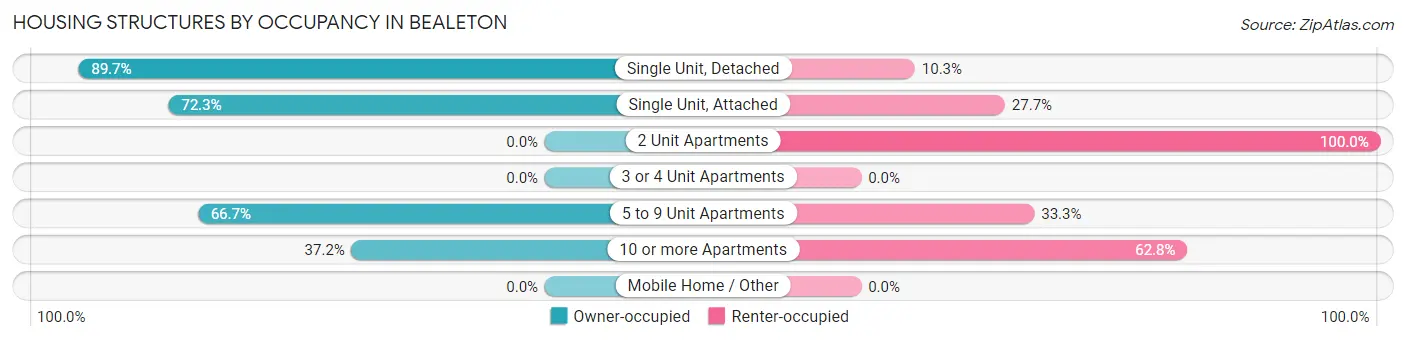
| Structure Type | Owner-occupied | Renter-occupied |
| Single Unit, Detached | 936 (89.7%) | 108 (10.3%) |
| Single Unit, Attached | 115 (72.3%) | 44 (27.7%) |
| 2 Unit Apartments | 0 (0.0%) | 4 (100.0%) |
| 3 or 4 Unit Apartments | 0 (0.0%) | 0 (0.0%) |
| 5 to 9 Unit Apartments | 28 (66.7%) | 14 (33.3%) |
| 10 or more Apartments | 115 (37.2%) | 194 (62.8%) |
| Mobile Home / Other | 0 (0.0%) | 0 (0.0%) |
| Total | 1,194 (76.6%) | 364 (23.4%) |
Housing Structures by Number of Rooms in Bealeton
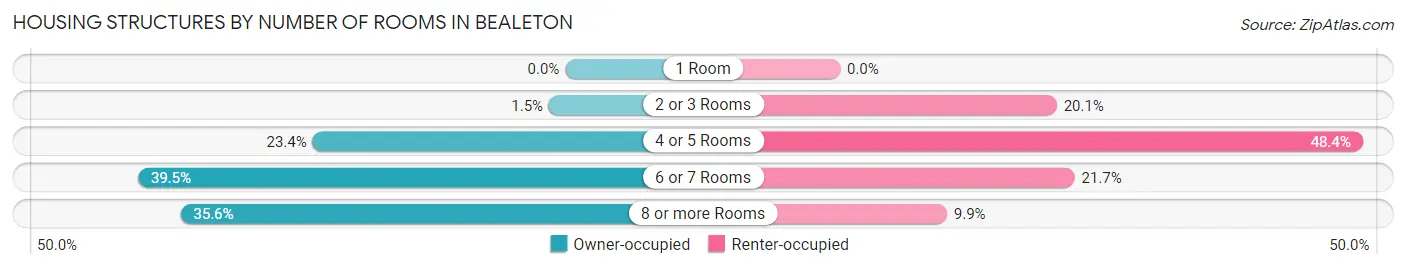
| Number of Rooms | Owner-occupied | Renter-occupied |
| 1 Room | 0 (0.0%) | 0 (0.0%) |
| 2 or 3 Rooms | 18 (1.5%) | 73 (20.1%) |
| 4 or 5 Rooms | 279 (23.4%) | 176 (48.3%) |
| 6 or 7 Rooms | 472 (39.5%) | 79 (21.7%) |
| 8 or more Rooms | 425 (35.6%) | 36 (9.9%) |
| Total | 1,194 (100.0%) | 364 (100.0%) |
Housing Structure by Heating Type in Bealeton
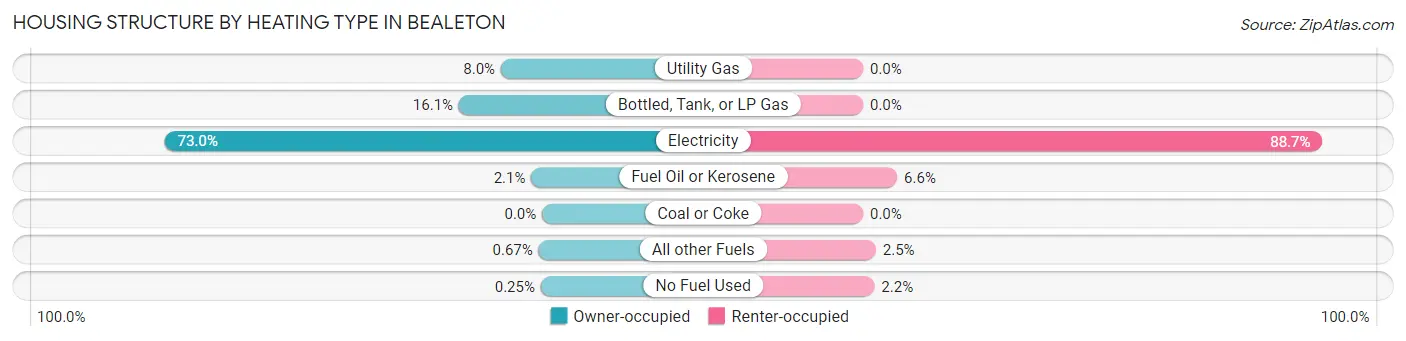
| Heating Type | Owner-occupied | Renter-occupied |
| Utility Gas | 95 (8.0%) | 0 (0.0%) |
| Bottled, Tank, or LP Gas | 192 (16.1%) | 0 (0.0%) |
| Electricity | 871 (73.0%) | 323 (88.7%) |
| Fuel Oil or Kerosene | 25 (2.1%) | 24 (6.6%) |
| Coal or Coke | 0 (0.0%) | 0 (0.0%) |
| All other Fuels | 8 (0.7%) | 9 (2.5%) |
| No Fuel Used | 3 (0.3%) | 8 (2.2%) |
| Total | 1,194 (100.0%) | 364 (100.0%) |
Household Vehicle Usage in Bealeton
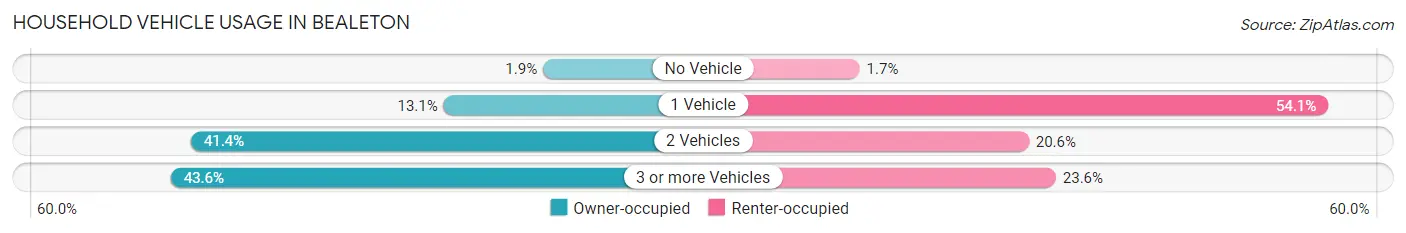
| Vehicles per Household | Owner-occupied | Renter-occupied |
| No Vehicle | 23 (1.9%) | 6 (1.7%) |
| 1 Vehicle | 156 (13.1%) | 197 (54.1%) |
| 2 Vehicles | 494 (41.4%) | 75 (20.6%) |
| 3 or more Vehicles | 521 (43.6%) | 86 (23.6%) |
| Total | 1,194 (100.0%) | 364 (100.0%) |
Real Estate & Mortgages in Bealeton
Real Estate and Mortgage Overview in Bealeton
| Characteristic | Without Mortgage | With Mortgage |
| Housing Units | 224 | 970 |
| Median Property Value | $333,700 | $357,100 |
| Median Household Income | $68,214 | $393 |
| Monthly Housing Costs | $617 | $114 |
| Real Estate Taxes | $2,656 | $32 |
Property Value by Mortgage Status in Bealeton
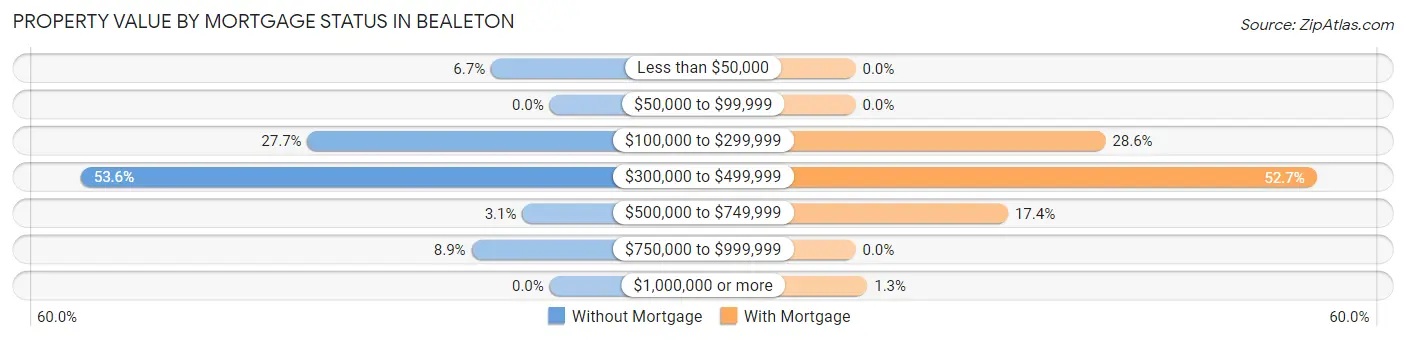
| Property Value | Without Mortgage | With Mortgage |
| Less than $50,000 | 15 (6.7%) | 0 (0.0%) |
| $50,000 to $99,999 | 0 (0.0%) | 0 (0.0%) |
| $100,000 to $299,999 | 62 (27.7%) | 277 (28.6%) |
| $300,000 to $499,999 | 120 (53.6%) | 511 (52.7%) |
| $500,000 to $749,999 | 7 (3.1%) | 169 (17.4%) |
| $750,000 to $999,999 | 20 (8.9%) | 0 (0.0%) |
| $1,000,000 or more | 0 (0.0%) | 13 (1.3%) |
| Total | 224 (100.0%) | 970 (100.0%) |
Household Income by Mortgage Status in Bealeton
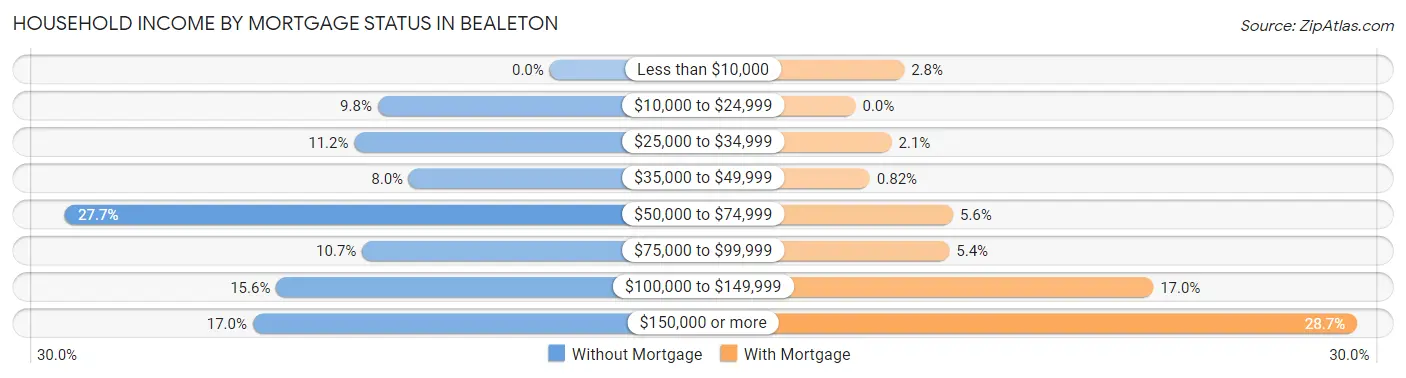
| Household Income | Without Mortgage | With Mortgage |
| Less than $10,000 | 0 (0.0%) | 27 (2.8%) |
| $10,000 to $24,999 | 22 (9.8%) | 0 (0.0%) |
| $25,000 to $34,999 | 25 (11.2%) | 20 (2.1%) |
| $35,000 to $49,999 | 18 (8.0%) | 8 (0.8%) |
| $50,000 to $74,999 | 62 (27.7%) | 54 (5.6%) |
| $75,000 to $99,999 | 24 (10.7%) | 52 (5.4%) |
| $100,000 to $149,999 | 35 (15.6%) | 165 (17.0%) |
| $150,000 or more | 38 (17.0%) | 278 (28.7%) |
| Total | 224 (100.0%) | 970 (100.0%) |
Property Value to Household Income Ratio in Bealeton
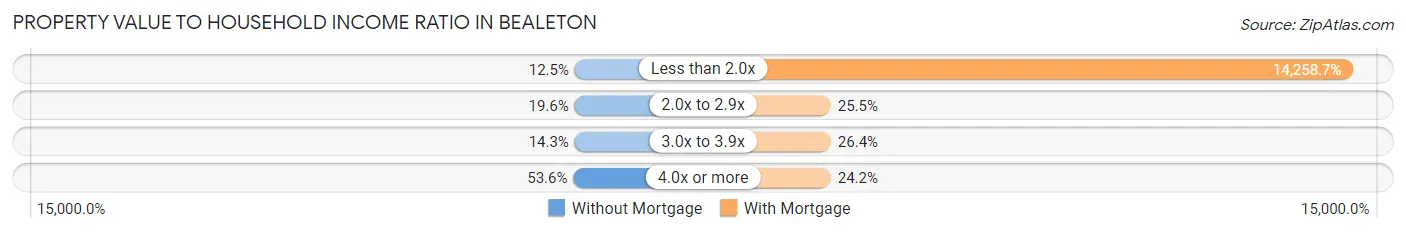
| Value-to-Income Ratio | Without Mortgage | With Mortgage |
| Less than 2.0x | 28 (12.5%) | 138,309 (14,258.7%) |
| 2.0x to 2.9x | 44 (19.6%) | 247 (25.5%) |
| 3.0x to 3.9x | 32 (14.3%) | 256 (26.4%) |
| 4.0x or more | 120 (53.6%) | 235 (24.2%) |
| Total | 224 (100.0%) | 970 (100.0%) |
Real Estate Taxes by Mortgage Status in Bealeton
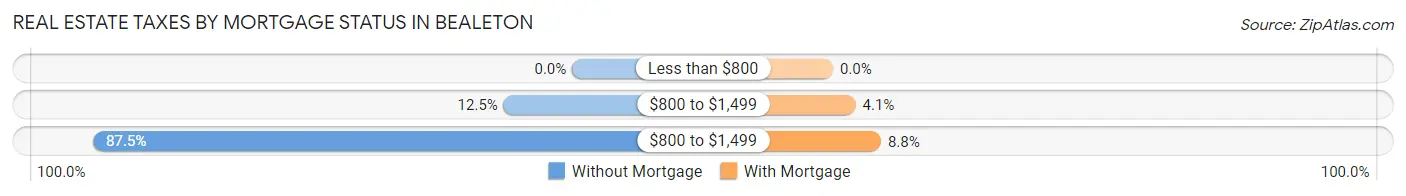
| Property Taxes | Without Mortgage | With Mortgage |
| Less than $800 | 0 (0.0%) | 0 (0.0%) |
| $800 to $1,499 | 28 (12.5%) | 40 (4.1%) |
| $800 to $1,499 | 196 (87.5%) | 85 (8.8%) |
| Total | 224 (100.0%) | 970 (100.0%) |
Health & Disability in Bealeton
Health Insurance Coverage by Age in Bealeton
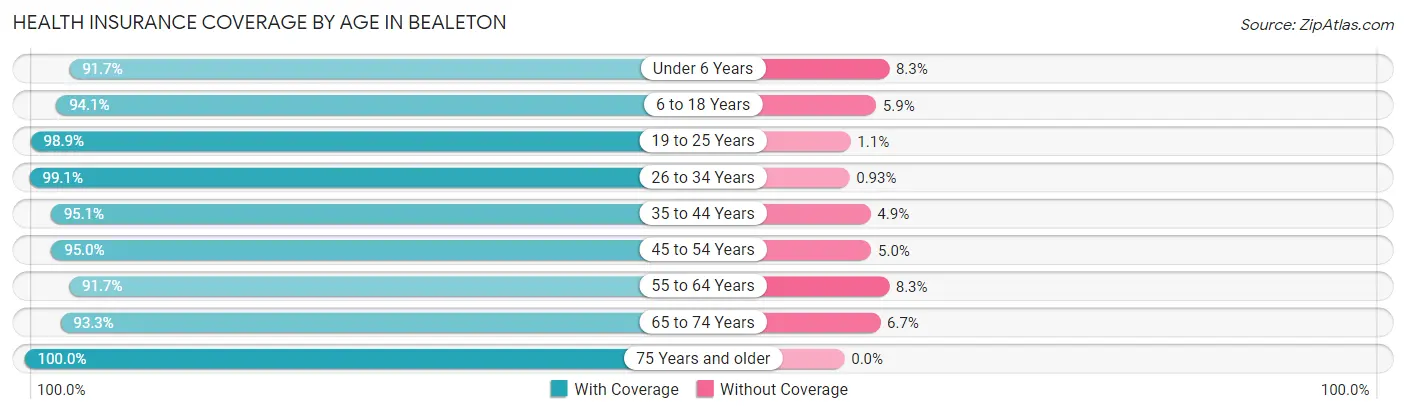
| Age Bracket | With Coverage | Without Coverage |
| Under 6 Years | 154 (91.7%) | 14 (8.3%) |
| 6 to 18 Years | 1,132 (94.1%) | 71 (5.9%) |
| 19 to 25 Years | 348 (98.9%) | 4 (1.1%) |
| 26 to 34 Years | 637 (99.1%) | 6 (0.9%) |
| 35 to 44 Years | 566 (95.1%) | 29 (4.9%) |
| 45 to 54 Years | 686 (95.0%) | 36 (5.0%) |
| 55 to 64 Years | 487 (91.7%) | 44 (8.3%) |
| 65 to 74 Years | 210 (93.3%) | 15 (6.7%) |
| 75 Years and older | 227 (100.0%) | 0 (0.0%) |
| Total | 4,447 (95.3%) | 219 (4.7%) |
Health Insurance Coverage by Citizenship Status in Bealeton
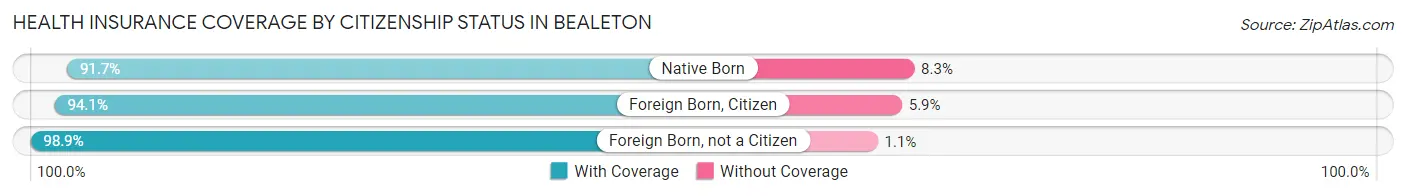
| Citizenship Status | With Coverage | Without Coverage |
| Native Born | 154 (91.7%) | 14 (8.3%) |
| Foreign Born, Citizen | 1,132 (94.1%) | 71 (5.9%) |
| Foreign Born, not a Citizen | 348 (98.9%) | 4 (1.1%) |
Health Insurance Coverage by Household Income in Bealeton
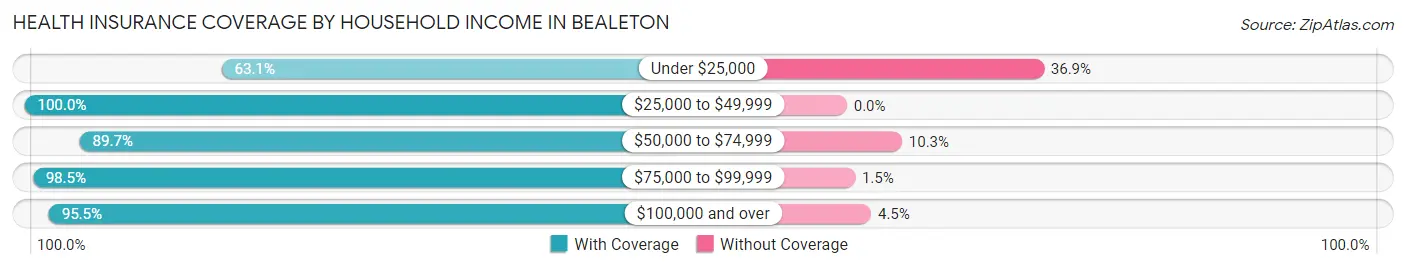
| Household Income | With Coverage | Without Coverage |
| Under $25,000 | 41 (63.1%) | 24 (36.9%) |
| $25,000 to $49,999 | 287 (100.0%) | 0 (0.0%) |
| $50,000 to $74,999 | 417 (89.7%) | 48 (10.3%) |
| $75,000 to $99,999 | 904 (98.5%) | 14 (1.5%) |
| $100,000 and over | 2,798 (95.5%) | 133 (4.5%) |
Public vs Private Health Insurance Coverage by Age in Bealeton
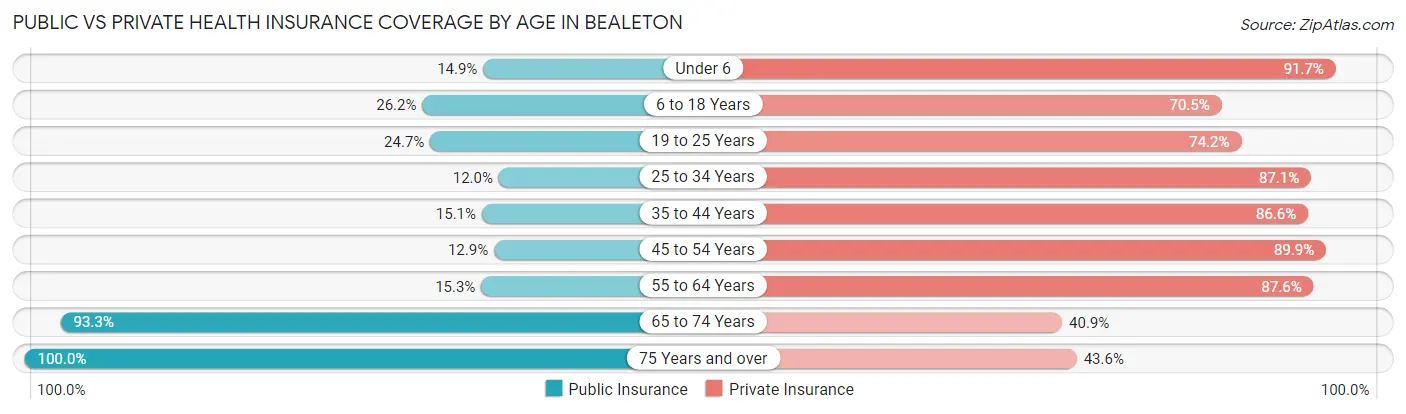
| Age Bracket | Public Insurance | Private Insurance |
| Under 6 | 25 (14.9%) | 154 (91.7%) |
| 6 to 18 Years | 315 (26.2%) | 848 (70.5%) |
| 19 to 25 Years | 87 (24.7%) | 261 (74.2%) |
| 25 to 34 Years | 77 (12.0%) | 560 (87.1%) |
| 35 to 44 Years | 90 (15.1%) | 515 (86.6%) |
| 45 to 54 Years | 93 (12.9%) | 649 (89.9%) |
| 55 to 64 Years | 81 (15.2%) | 465 (87.6%) |
| 65 to 74 Years | 210 (93.3%) | 92 (40.9%) |
| 75 Years and over | 227 (100.0%) | 99 (43.6%) |
| Total | 1,205 (25.8%) | 3,643 (78.1%) |
Disability Status by Sex by Age in Bealeton
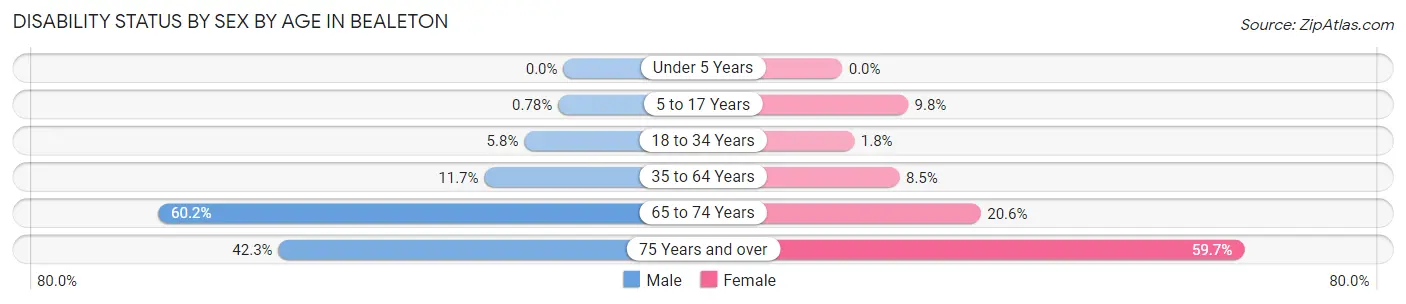
| Age Bracket | Male | Female |
| Under 5 Years | 0 (0.0%) | 0 (0.0%) |
| 5 to 17 Years | 5 (0.8%) | 46 (9.8%) |
| 18 to 34 Years | 33 (5.8%) | 10 (1.8%) |
| 35 to 64 Years | 105 (11.7%) | 81 (8.5%) |
| 65 to 74 Years | 71 (60.2%) | 22 (20.6%) |
| 75 Years and over | 33 (42.3%) | 89 (59.7%) |
Disability Class by Sex by Age in Bealeton
Disability Class: Hearing Difficulty
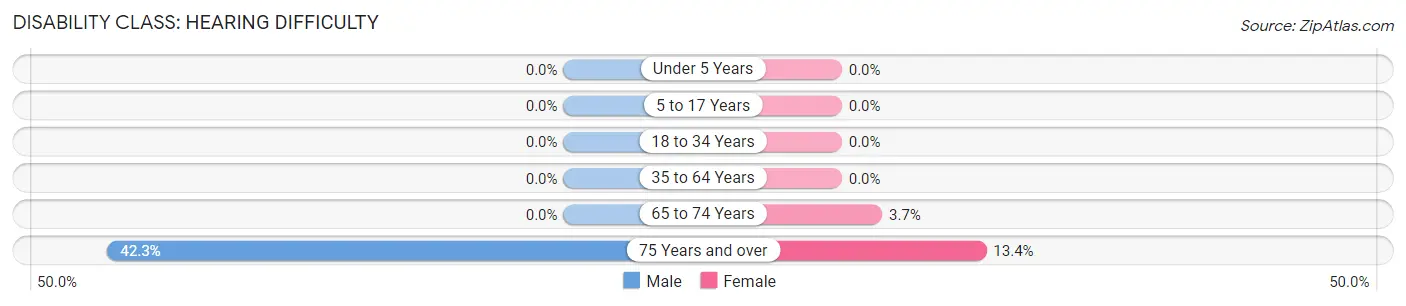
| Age Bracket | Male | Female |
| Under 5 Years | 0 (0.0%) | 0 (0.0%) |
| 5 to 17 Years | 0 (0.0%) | 0 (0.0%) |
| 18 to 34 Years | 0 (0.0%) | 0 (0.0%) |
| 35 to 64 Years | 0 (0.0%) | 0 (0.0%) |
| 65 to 74 Years | 0 (0.0%) | 4 (3.7%) |
| 75 Years and over | 33 (42.3%) | 20 (13.4%) |
Disability Class: Vision Difficulty
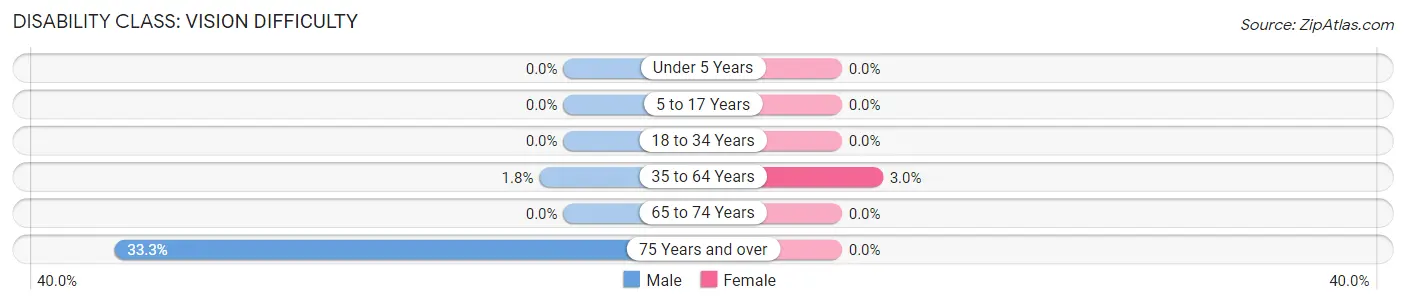
| Age Bracket | Male | Female |
| Under 5 Years | 0 (0.0%) | 0 (0.0%) |
| 5 to 17 Years | 0 (0.0%) | 0 (0.0%) |
| 18 to 34 Years | 0 (0.0%) | 0 (0.0%) |
| 35 to 64 Years | 16 (1.8%) | 29 (3.0%) |
| 65 to 74 Years | 0 (0.0%) | 0 (0.0%) |
| 75 Years and over | 26 (33.3%) | 0 (0.0%) |
Disability Class: Cognitive Difficulty
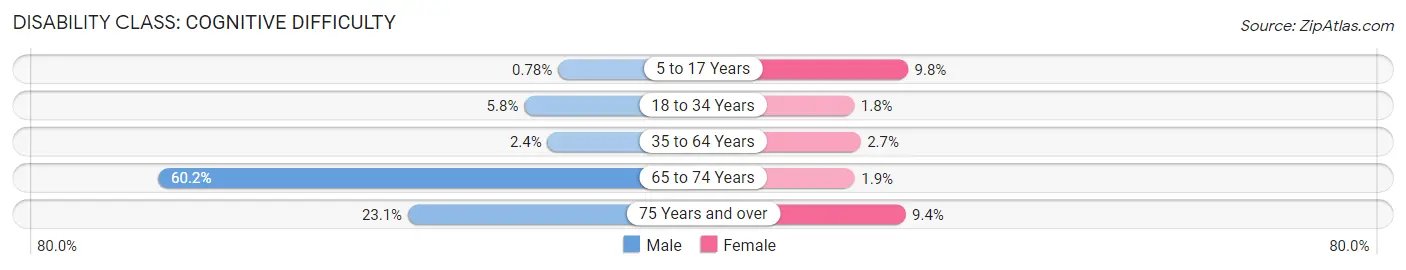
| Age Bracket | Male | Female |
| 5 to 17 Years | 5 (0.8%) | 46 (9.8%) |
| 18 to 34 Years | 33 (5.8%) | 10 (1.8%) |
| 35 to 64 Years | 21 (2.4%) | 26 (2.7%) |
| 65 to 74 Years | 71 (60.2%) | 2 (1.9%) |
| 75 Years and over | 18 (23.1%) | 14 (9.4%) |
Disability Class: Ambulatory Difficulty
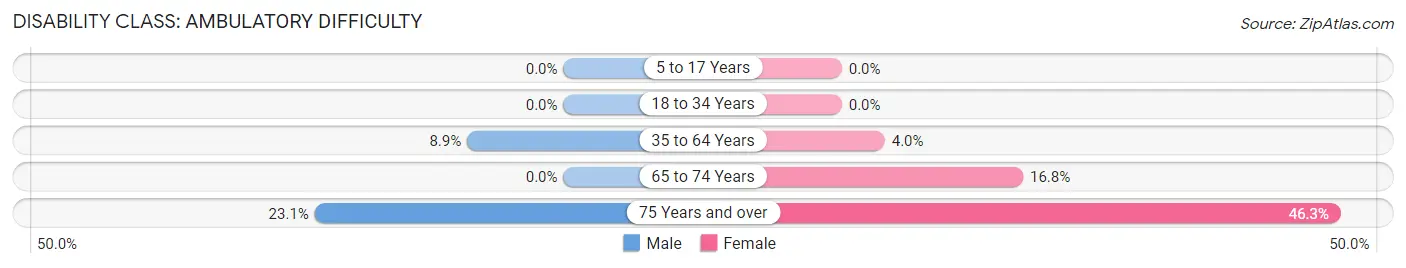
| Age Bracket | Male | Female |
| 5 to 17 Years | 0 (0.0%) | 0 (0.0%) |
| 18 to 34 Years | 0 (0.0%) | 0 (0.0%) |
| 35 to 64 Years | 80 (8.9%) | 38 (4.0%) |
| 65 to 74 Years | 0 (0.0%) | 18 (16.8%) |
| 75 Years and over | 18 (23.1%) | 69 (46.3%) |
Disability Class: Self-Care Difficulty
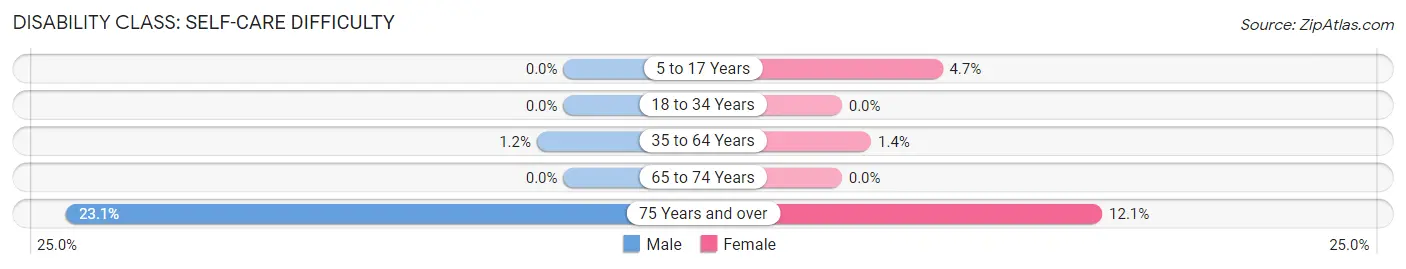
| Age Bracket | Male | Female |
| 5 to 17 Years | 0 (0.0%) | 22 (4.7%) |
| 18 to 34 Years | 0 (0.0%) | 0 (0.0%) |
| 35 to 64 Years | 11 (1.2%) | 13 (1.4%) |
| 65 to 74 Years | 0 (0.0%) | 0 (0.0%) |
| 75 Years and over | 18 (23.1%) | 18 (12.1%) |
Technology Access in Bealeton
Computing Device Access in Bealeton
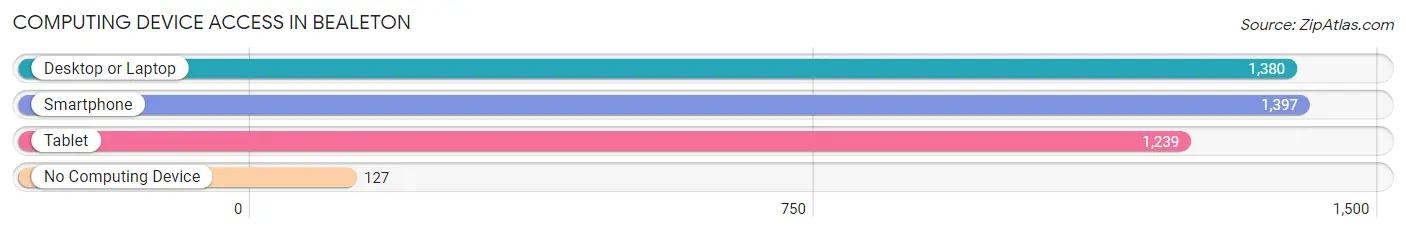
| Device Type | # Households | % Households |
| Desktop or Laptop | 1,380 | 88.6% |
| Smartphone | 1,397 | 89.7% |
| Tablet | 1,239 | 79.5% |
| No Computing Device | 127 | 8.2% |
| Total | 1,558 | 100.0% |
Internet Access in Bealeton
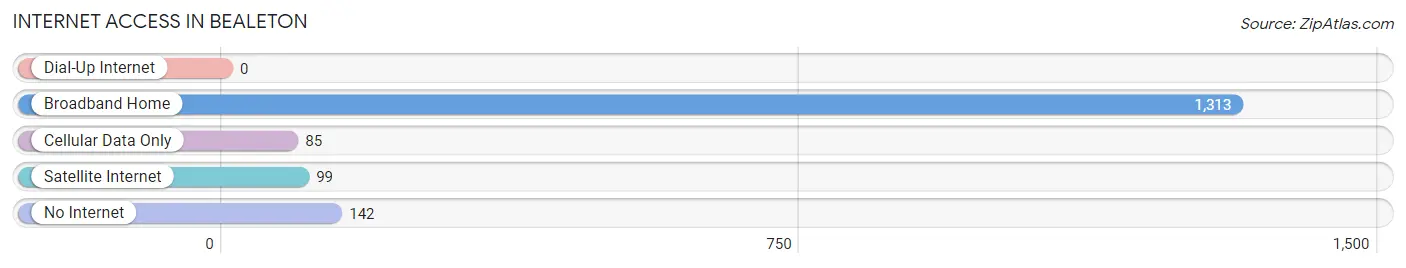
| Internet Type | # Households | % Households |
| Dial-Up Internet | 0 | 0.0% |
| Broadband Home | 1,313 | 84.3% |
| Cellular Data Only | 85 | 5.5% |
| Satellite Internet | 99 | 6.4% |
| No Internet | 142 | 9.1% |
| Total | 1,558 | 100.0% |
Bealeton Summary
Bealeton is a small town located in Fauquier County, Virginia, United States. It is situated in the foothills of the Blue Ridge Mountains, approximately 50 miles west of Washington, D.C. The town is part of the Washington metropolitan area and is located near the intersection of U.S. Route 17 and U.S. Route 29. As of the 2010 census, the population of Bealeton was 4,435.
History
The area that is now Bealeton was first settled in the late 1700s by European settlers. The town was originally known as “Bealeton Station” and was established in 1872 when the Orange and Alexandria Railroad was built through the area. The town was named after the Beal family, who owned a large amount of land in the area.
In the late 1800s, Bealeton was a thriving agricultural community. The town was home to several farms, a grist mill, a saw mill, and a general store. In the early 1900s, the town began to grow and develop. The Bealeton post office was established in 1906 and the town was officially incorporated in 1908.
Geography
Bealeton is located in the foothills of the Blue Ridge Mountains in Fauquier County, Virginia. The town is situated at the intersection of U.S. Route 17 and U.S. Route 29. The town is approximately 50 miles west of Washington, D.C. and is part of the Washington metropolitan area.
The town has a total area of 2.3 square miles, all of which is land. The town is located in a rural area and is surrounded by farms and woodlands. The town is located near the Rappahannock River and is home to several small lakes and ponds.
Economy
The economy of Bealeton is largely based on agriculture. The town is home to several farms, including dairy farms, beef farms, and poultry farms. The town is also home to several small businesses, including restaurants, retail stores, and service providers.
The town is also home to several industrial and manufacturing businesses. The town is home to a large industrial park, which is home to several businesses, including a printing company, a plastics manufacturer, and a metal fabrication company.
Demographics
As of the 2010 census, the population of Bealeton was 4,435. The town has a population density of 1,902 people per square mile. The median age of the town is 38.7 years.
The racial makeup of the town is 87.3% White, 8.2% African American, 0.7% Asian, 0.3% Native American, 0.1% Pacific Islander, and 2.4% from other races. The town has a Hispanic or Latino population of 4.3%.
The median household income in Bealeton is $63,917. The median value of owner-occupied housing units is $269,400. The town has a poverty rate of 8.3%.
Conclusion
Bealeton is a small town located in Fauquier County, Virginia. The town is situated in the foothills of the Blue Ridge Mountains and is part of the Washington metropolitan area. The town has a population of 4,435 and is largely based on agriculture. The town is home to several small businesses and industrial and manufacturing businesses. The median household income in Bealeton is $63,917 and the median value of owner-occupied housing units is $269,400.
Common Questions
What is Per Capita Income in Bealeton?
Per Capita income in Bealeton is $40,073.
What is the Median Family Income in Bealeton?
Median Family Income in Bealeton is $116,947.
What is the Median Household income in Bealeton?
Median Household Income in Bealeton is $105,449.
What is Income or Wage Gap in Bealeton?
Income or Wage Gap in Bealeton is 29.8%.
Women in Bealeton earn 70.2 cents for every dollar earned by a man.
What is Inequality or Gini Index in Bealeton?
Inequality or Gini Index in Bealeton is 0.32.
What is the Total Population of Bealeton?
Total Population of Bealeton is 4,670.
What is the Total Male Population of Bealeton?
Total Male Population of Bealeton is 2,344.
What is the Total Female Population of Bealeton?
Total Female Population of Bealeton is 2,326.
What is the Ratio of Males per 100 Females in Bealeton?
There are 100.77 Males per 100 Females in Bealeton.
What is the Ratio of Females per 100 Males in Bealeton?
There are 99.23 Females per 100 Males in Bealeton.
What is the Median Population Age in Bealeton?
Median Population Age in Bealeton is 33.9 Years.
What is the Average Family Size in Bealeton
Average Family Size in Bealeton is 3.5 People.
What is the Average Household Size in Bealeton
Average Household Size in Bealeton is 3.0 People.
How Large is the Labor Force in Bealeton?
There are 2,677 People in the Labor Forcein in Bealeton.
What is the Percentage of People in the Labor Force in Bealeton?
72.5% of People are in the Labor Force in Bealeton.
What is the Unemployment Rate in Bealeton?
Unemployment Rate in Bealeton is 0.6%.