Lake Ridge, VA Map & Demographics
Lake Ridge Map
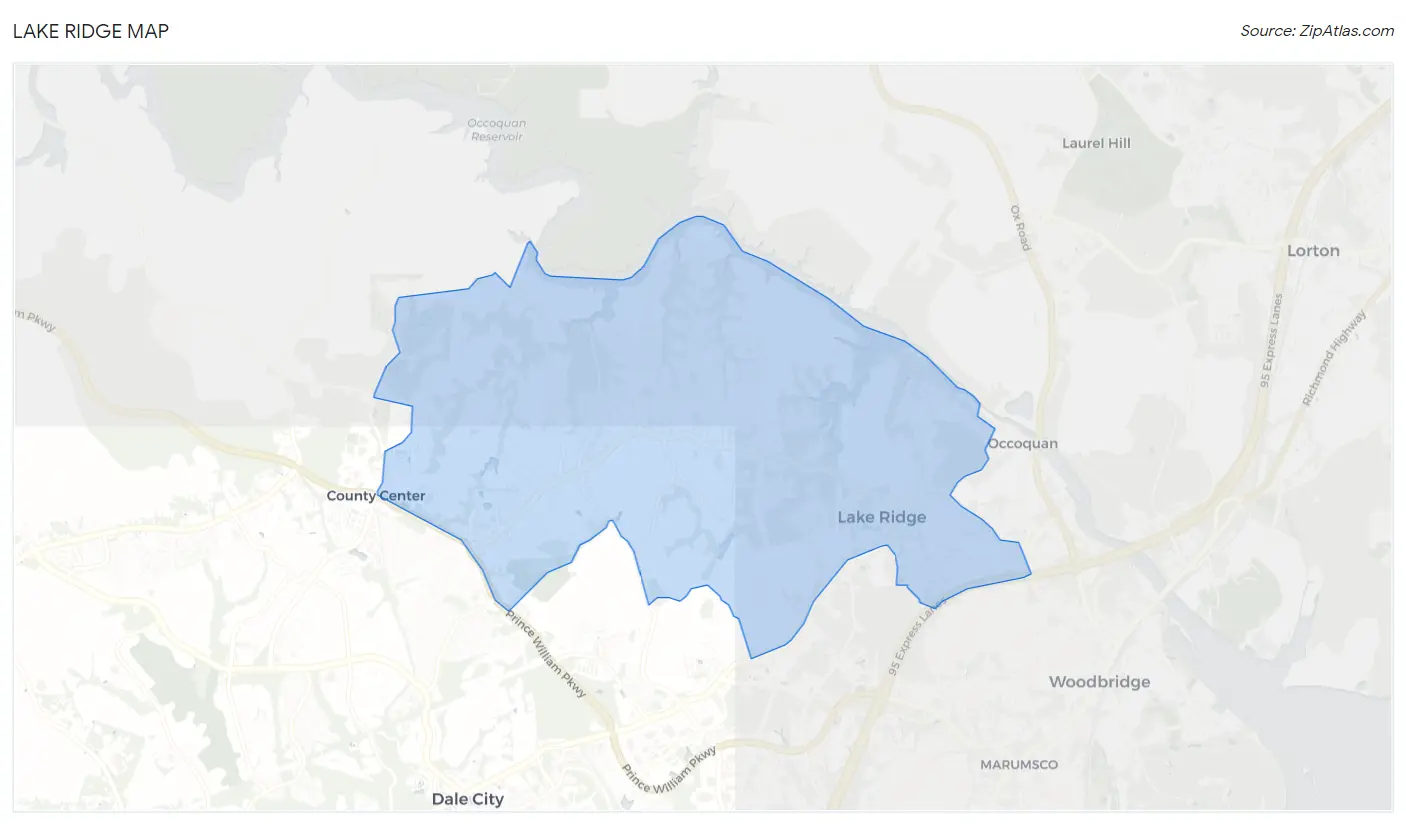
Lake Ridge Overview
$49,020
PER CAPITA INCOME
$127,749
AVG FAMILY INCOME
$116,917
AVG HOUSEHOLD INCOME
40.1%
WAGE / INCOME GAP [ % ]
59.9¢/ $1
WAGE / INCOME GAP [ $ ]
$10,871
FAMILY INCOME DEFICIT
0.36
INEQUALITY / GINI INDEX
44,720
TOTAL POPULATION
21,021
MALE POPULATION
23,699
FEMALE POPULATION
88.70
MALES / 100 FEMALES
112.74
FEMALES / 100 MALES
36.8
MEDIAN AGE
3.4
AVG FAMILY SIZE
2.9
AVG HOUSEHOLD SIZE
25,042
LABOR FORCE [ PEOPLE ]
71.2%
PERCENT IN LABOR FORCE
4.5%
UNEMPLOYMENT RATE
Income in Lake Ridge
Income Overview in Lake Ridge
Per Capita Income in Lake Ridge is $49,020, while median incomes of families and households are $127,749 and $116,917 respectively.
| Characteristic | Number | Measure |
| Per Capita Income | 44,720 | $49,020 |
| Median Family Income | 11,237 | $127,749 |
| Mean Family Income | 11,237 | $148,641 |
| Median Household Income | 15,687 | $116,917 |
| Mean Household Income | 15,687 | $136,808 |
| Income Deficit | 11,237 | $10,871 |
| Wage / Income Gap (%) | 44,720 | 40.07% |
| Wage / Income Gap ($) | 44,720 | 59.93¢ per $1 |
| Gini / Inequality Index | 44,720 | 0.36 |
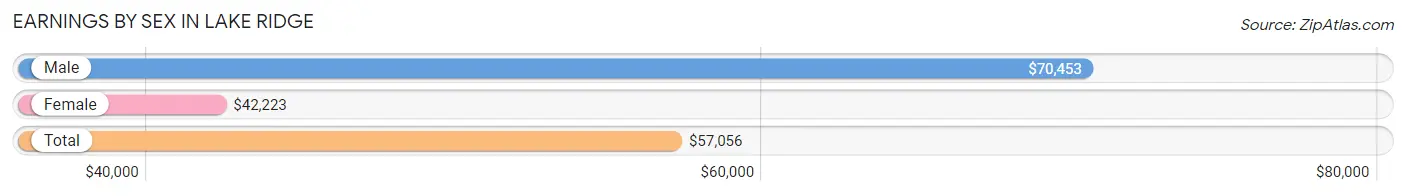
Earnings by Sex in Lake Ridge
Average Earnings in Lake Ridge are $57,056, $70,453 for men and $42,223 for women, a difference of 40.1%.
| Sex | Number | Average Earnings |
| Male | 13,194 (50.1%) | $70,453 |
| Female | 13,162 (49.9%) | $42,223 |
| Total | 26,356 (100.0%) | $57,056 |
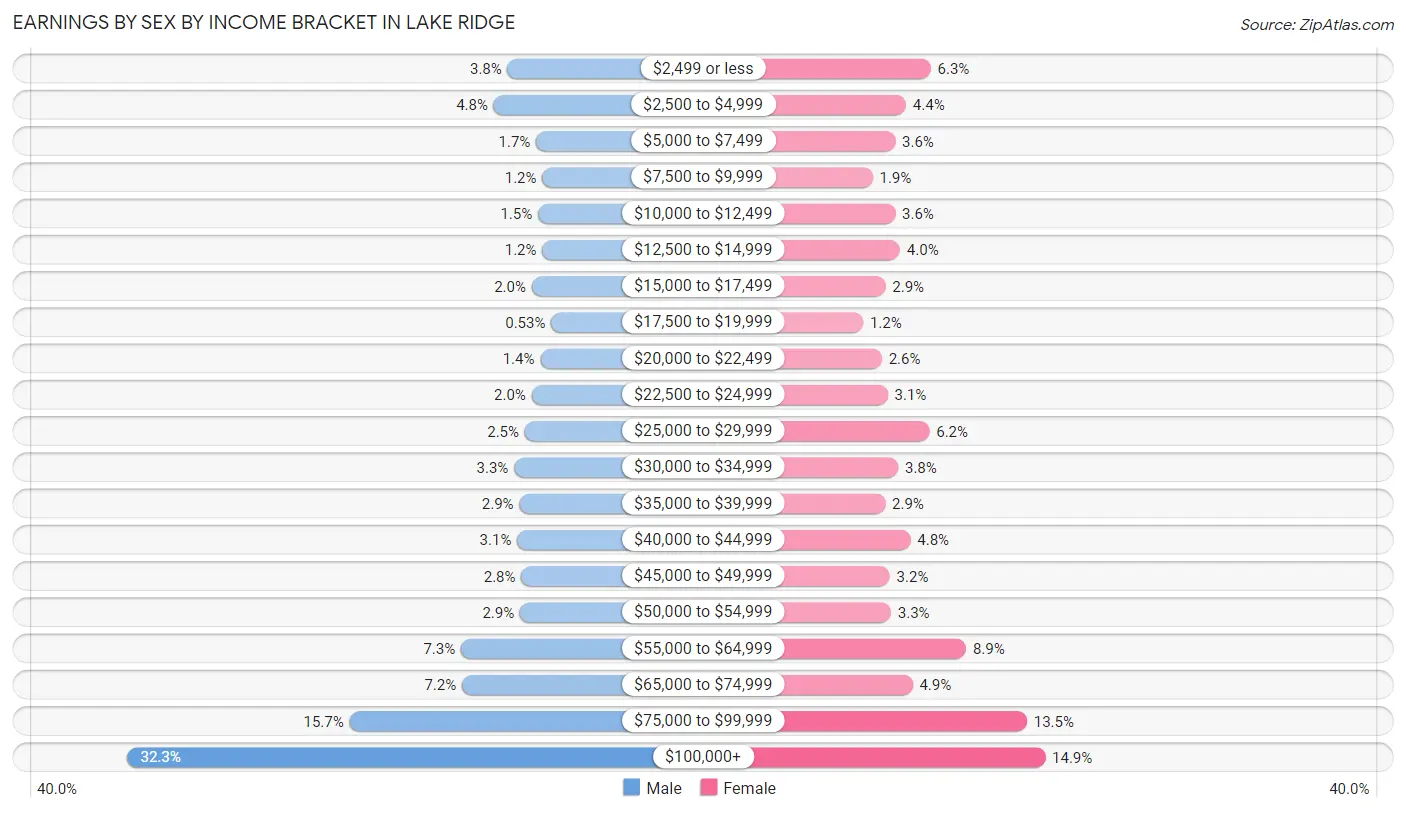
Earnings by Sex by Income Bracket in Lake Ridge
The most common earnings brackets in Lake Ridge are $100,000+ for men (4,259 | 32.3%) and $100,000+ for women (1,956 | 14.9%).
| Income | Male | Female |
| $2,499 or less | 502 (3.8%) | 826 (6.3%) |
| $2,500 to $4,999 | 638 (4.8%) | 583 (4.4%) |
| $5,000 to $7,499 | 219 (1.7%) | 477 (3.6%) |
| $7,500 to $9,999 | 158 (1.2%) | 254 (1.9%) |
| $10,000 to $12,499 | 201 (1.5%) | 476 (3.6%) |
| $12,500 to $14,999 | 158 (1.2%) | 524 (4.0%) |
| $15,000 to $17,499 | 262 (2.0%) | 380 (2.9%) |
| $17,500 to $19,999 | 70 (0.5%) | 159 (1.2%) |
| $20,000 to $22,499 | 178 (1.3%) | 345 (2.6%) |
| $22,500 to $24,999 | 264 (2.0%) | 403 (3.1%) |
| $25,000 to $29,999 | 331 (2.5%) | 813 (6.2%) |
| $30,000 to $34,999 | 437 (3.3%) | 505 (3.8%) |
| $35,000 to $39,999 | 385 (2.9%) | 378 (2.9%) |
| $40,000 to $44,999 | 407 (3.1%) | 627 (4.8%) |
| $45,000 to $49,999 | 366 (2.8%) | 423 (3.2%) |
| $50,000 to $54,999 | 379 (2.9%) | 434 (3.3%) |
| $55,000 to $64,999 | 962 (7.3%) | 1,176 (8.9%) |
| $65,000 to $74,999 | 953 (7.2%) | 647 (4.9%) |
| $75,000 to $99,999 | 2,065 (15.7%) | 1,776 (13.5%) |
| $100,000+ | 4,259 (32.3%) | 1,956 (14.9%) |
| Total | 13,194 (100.0%) | 13,162 (100.0%) |
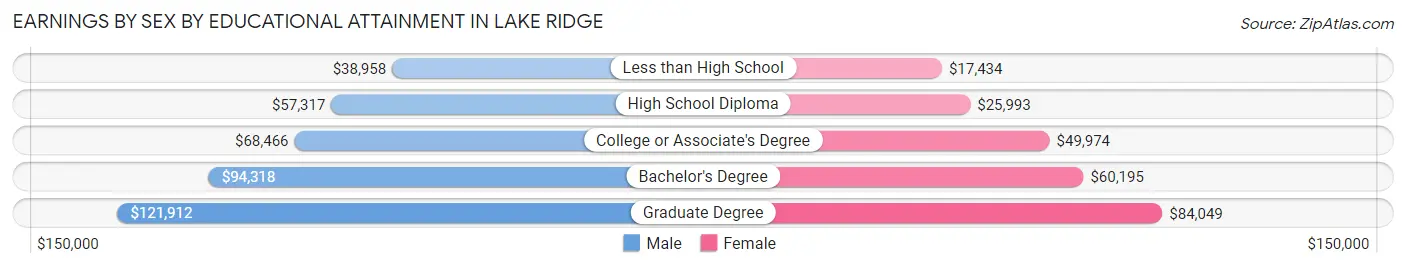
Earnings by Sex by Educational Attainment in Lake Ridge
Average earnings in Lake Ridge are $80,336 for men and $54,768 for women, a difference of 31.8%. Men with an educational attainment of graduate degree enjoy the highest average annual earnings of $121,912, while those with less than high school education earn the least with $38,958. Women with an educational attainment of graduate degree earn the most with the average annual earnings of $84,049, while those with less than high school education have the smallest earnings of $17,434.
| Educational Attainment | Male Income | Female Income |
| Less than High School | $38,958 | $17,434 |
| High School Diploma | $57,317 | $25,993 |
| College or Associate's Degree | $68,466 | $49,974 |
| Bachelor's Degree | $94,318 | $60,195 |
| Graduate Degree | $121,912 | $84,049 |
| Total | $80,336 | $54,768 |
Family Income in Lake Ridge
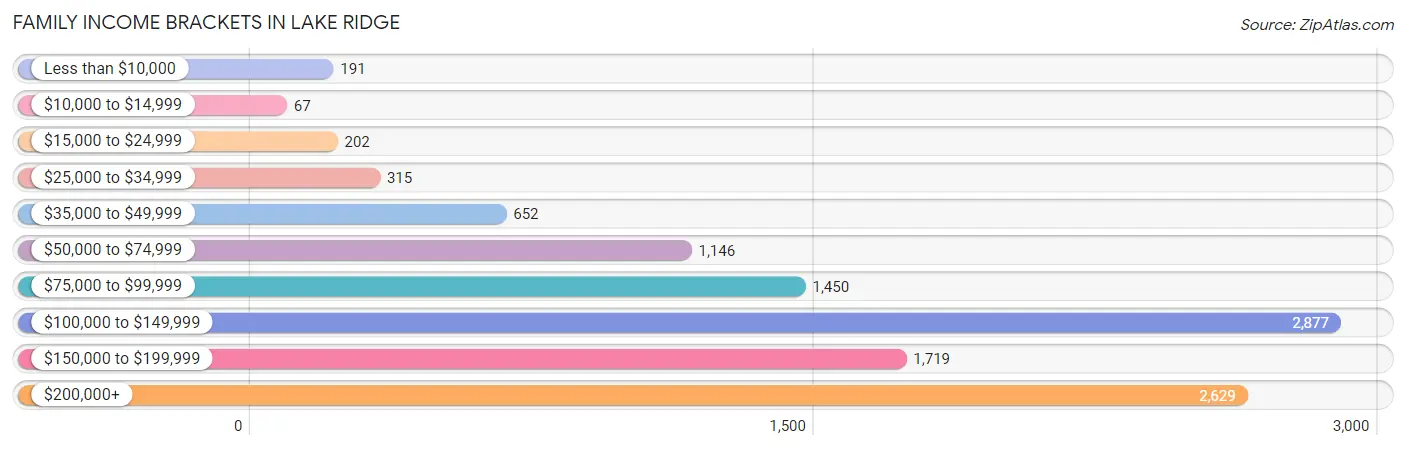
Family Income Brackets in Lake Ridge
According to the Lake Ridge family income data, there are 2,877 families falling into the $100,000 to $149,999 income range, which is the most common income bracket and makes up 25.6% of all families. Conversely, the $10,000 to $14,999 income bracket is the least frequent group with only 67 families (0.6%) belonging to this category.
| Income Bracket | # Families | % Families |
| Less than $10,000 | 191 | 1.7% |
| $10,000 to $14,999 | 67 | 0.6% |
| $15,000 to $24,999 | 202 | 1.8% |
| $25,000 to $34,999 | 315 | 2.8% |
| $35,000 to $49,999 | 652 | 5.8% |
| $50,000 to $74,999 | 1,146 | 10.2% |
| $75,000 to $99,999 | 1,450 | 12.9% |
| $100,000 to $149,999 | 2,877 | 25.6% |
| $150,000 to $199,999 | 1,719 | 15.3% |
| $200,000+ | 2,629 | 23.4% |
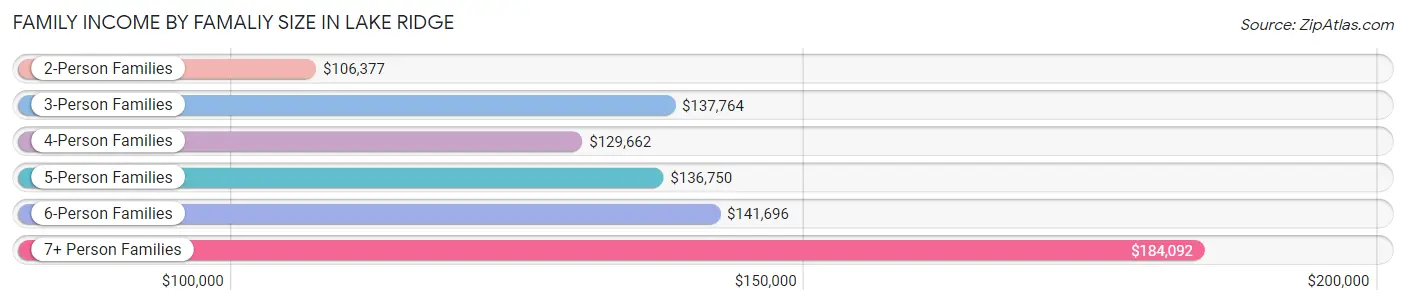
Family Income by Famaliy Size in Lake Ridge
7+ person families (273 | 2.4%) account for the highest median family income in Lake Ridge with $184,092 per family, while 2-person families (4,466 | 39.7%) have the highest median income of $53,188 per family member.
| Income Bracket | # Families | Median Income |
| 2-Person Families | 4,466 (39.7%) | $106,377 |
| 3-Person Families | 2,368 (21.1%) | $137,764 |
| 4-Person Families | 2,804 (24.9%) | $129,662 |
| 5-Person Families | 871 (7.7%) | $136,750 |
| 6-Person Families | 455 (4.1%) | $141,696 |
| 7+ Person Families | 273 (2.4%) | $184,092 |
| Total | 11,237 (100.0%) | $127,749 |
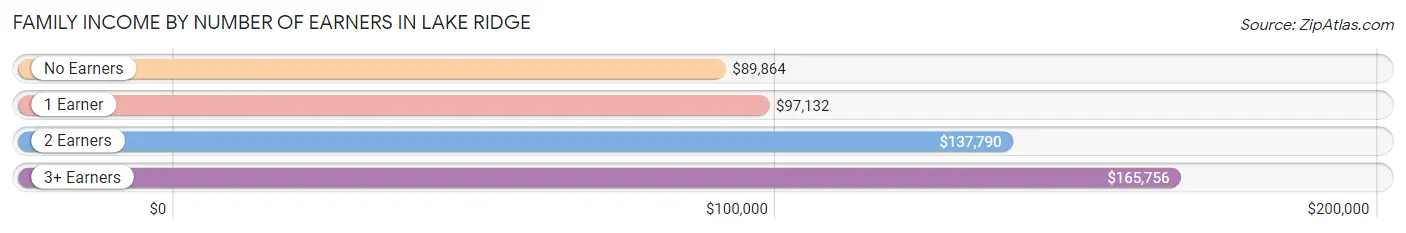
Family Income by Number of Earners in Lake Ridge
The median family income in Lake Ridge is $127,749, with families comprising 3+ earners (2,104) having the highest median family income of $165,756, while families with no earners (944) have the lowest median family income of $89,864, accounting for 18.7% and 8.4% of families, respectively.
| Number of Earners | # Families | Median Income |
| No Earners | 944 (8.4%) | $89,864 |
| 1 Earner | 3,467 (30.8%) | $97,132 |
| 2 Earners | 4,722 (42.0%) | $137,790 |
| 3+ Earners | 2,104 (18.7%) | $165,756 |
| Total | 11,237 (100.0%) | $127,749 |
Household Income in Lake Ridge
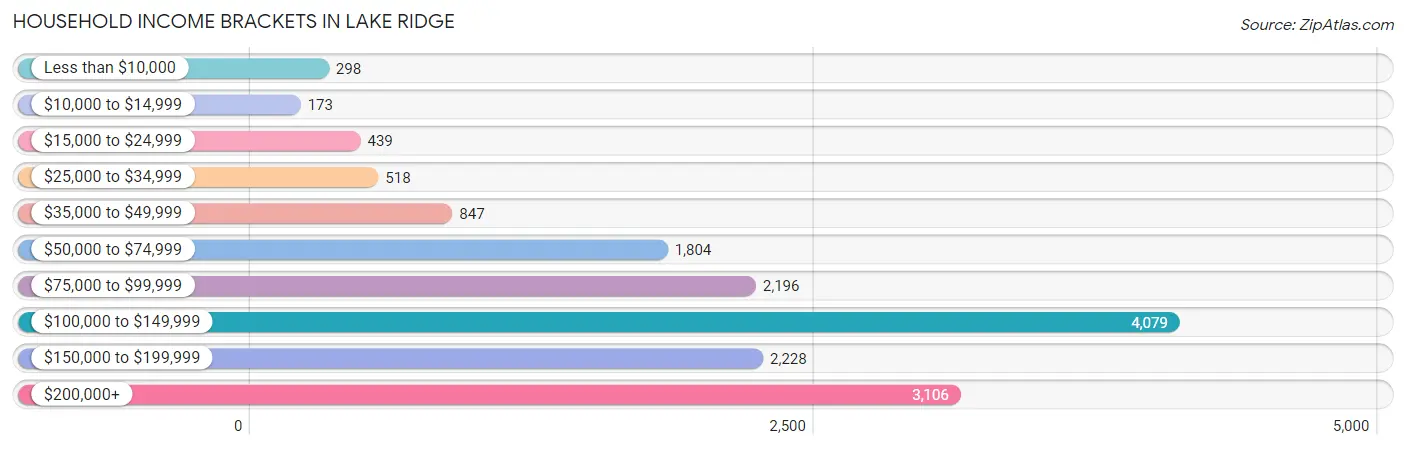
Household Income Brackets in Lake Ridge
With 4,079 households falling in the category, the $100,000 to $149,999 income range is the most frequent in Lake Ridge, accounting for 26.0% of all households. In contrast, only 173 households (1.1%) fall into the $10,000 to $14,999 income bracket, making it the least populous group.
| Income Bracket | # Households | % Households |
| Less than $10,000 | 298 | 1.9% |
| $10,000 to $14,999 | 173 | 1.1% |
| $15,000 to $24,999 | 439 | 2.8% |
| $25,000 to $34,999 | 518 | 3.3% |
| $35,000 to $49,999 | 847 | 5.4% |
| $50,000 to $74,999 | 1,804 | 11.5% |
| $75,000 to $99,999 | 2,196 | 14.0% |
| $100,000 to $149,999 | 4,079 | 26.0% |
| $150,000 to $199,999 | 2,228 | 14.2% |
| $200,000+ | 3,106 | 19.8% |
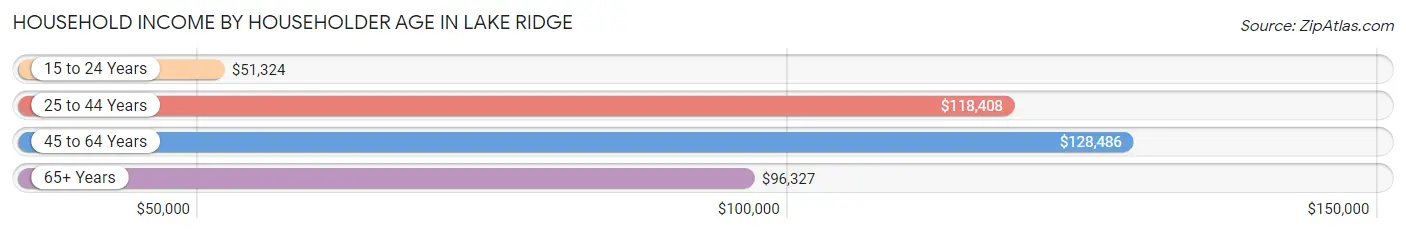
Household Income by Householder Age in Lake Ridge
The median household income in Lake Ridge is $116,917, with the highest median household income of $128,486 found in the 45 to 64 years age bracket for the primary householder. A total of 6,402 households (40.8%) fall into this category. Meanwhile, the 15 to 24 years age bracket for the primary householder has the lowest median household income of $51,324, with 298 households (1.9%) in this group.
| Income Bracket | # Households | Median Income |
| 15 to 24 Years | 298 (1.9%) | $51,324 |
| 25 to 44 Years | 5,765 (36.7%) | $118,408 |
| 45 to 64 Years | 6,402 (40.8%) | $128,486 |
| 65+ Years | 3,222 (20.5%) | $96,327 |
| Total | 15,687 (100.0%) | $116,917 |
Poverty in Lake Ridge
Income Below Poverty by Sex and Age in Lake Ridge
With 4.9% poverty level for males and 6.1% for females among the residents of Lake Ridge, under 5 year old males and 65 to 74 year old females are the most vulnerable to poverty, with 239 males (17.6%) and 187 females (9.2%) in their respective age groups living below the poverty level.
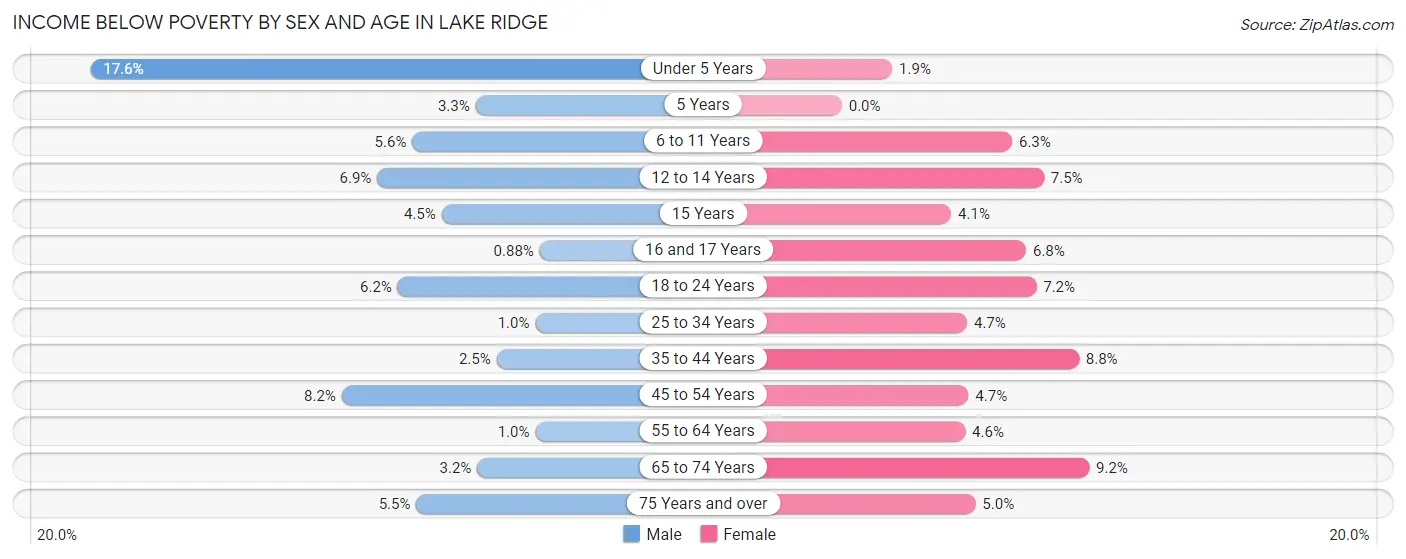
| Age Bracket | Male | Female |
| Under 5 Years | 239 (17.6%) | 24 (1.9%) |
| 5 Years | 10 (3.3%) | 0 (0.0%) |
| 6 to 11 Years | 100 (5.6%) | 120 (6.3%) |
| 12 to 14 Years | 76 (6.9%) | 66 (7.5%) |
| 15 Years | 8 (4.5%) | 14 (4.1%) |
| 16 and 17 Years | 7 (0.9%) | 43 (6.8%) |
| 18 to 24 Years | 111 (6.1%) | 172 (7.2%) |
| 25 to 34 Years | 27 (1.0%) | 148 (4.6%) |
| 35 to 44 Years | 76 (2.5%) | 326 (8.8%) |
| 45 to 54 Years | 256 (8.2%) | 148 (4.7%) |
| 55 to 64 Years | 25 (1.0%) | 126 (4.6%) |
| 65 to 74 Years | 50 (3.2%) | 187 (9.2%) |
| 75 Years and over | 42 (5.5%) | 59 (5.0%) |
| Total | 1,027 (4.9%) | 1,433 (6.1%) |
Income Above Poverty by Sex and Age in Lake Ridge
According to the poverty statistics in Lake Ridge, males aged 16 and 17 years and females aged 5 years are the age groups that are most secure financially, with 99.1% of males and 100.0% of females in these age groups living above the poverty line.
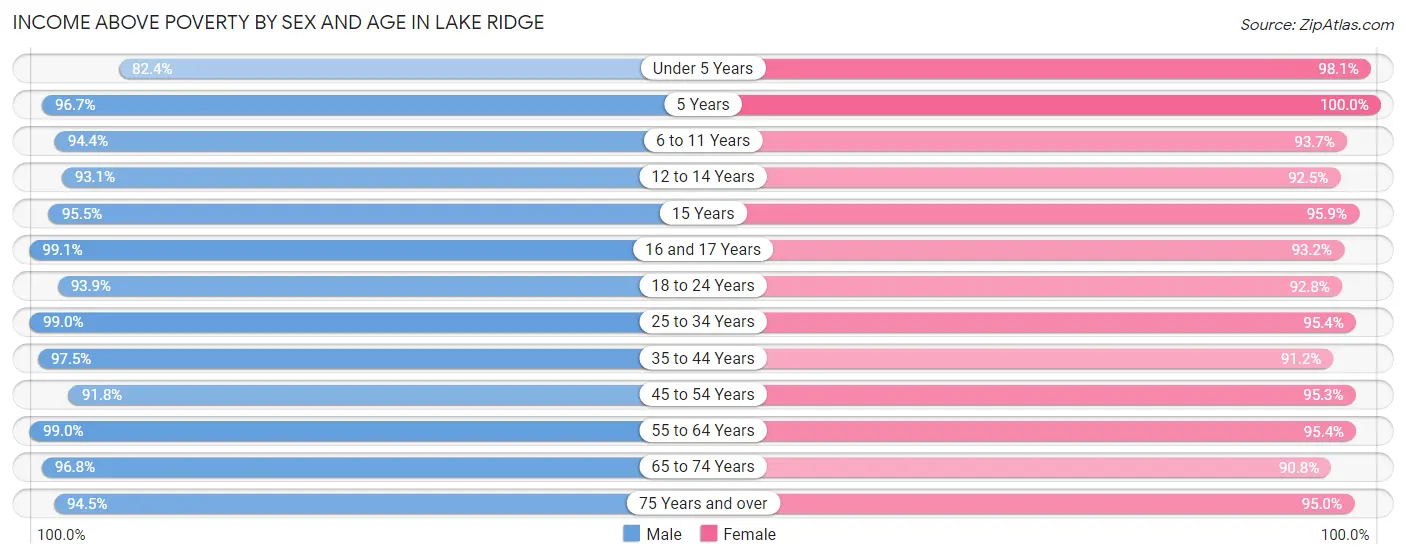
| Age Bracket | Male | Female |
| Under 5 Years | 1,122 (82.4%) | 1,257 (98.1%) |
| 5 Years | 297 (96.7%) | 190 (100.0%) |
| 6 to 11 Years | 1,682 (94.4%) | 1,779 (93.7%) |
| 12 to 14 Years | 1,024 (93.1%) | 814 (92.5%) |
| 15 Years | 169 (95.5%) | 331 (95.9%) |
| 16 and 17 Years | 786 (99.1%) | 586 (93.2%) |
| 18 to 24 Years | 1,694 (93.9%) | 2,210 (92.8%) |
| 25 to 34 Years | 2,578 (99.0%) | 3,035 (95.4%) |
| 35 to 44 Years | 2,994 (97.5%) | 3,379 (91.2%) |
| 45 to 54 Years | 2,855 (91.8%) | 3,001 (95.3%) |
| 55 to 64 Years | 2,373 (99.0%) | 2,623 (95.4%) |
| 65 to 74 Years | 1,511 (96.8%) | 1,850 (90.8%) |
| 75 Years and over | 727 (94.5%) | 1,131 (95.0%) |
| Total | 19,812 (95.1%) | 22,186 (93.9%) |
Income Below Poverty Among Married-Couple Families in Lake Ridge
The poverty statistics for married-couple families in Lake Ridge show that 3.6% or 301 of the total 8,273 families live below the poverty line. Families with 3 or 4 children have the highest poverty rate of 5.3%, comprising of 37 families. On the other hand, families with 5 or more children have the lowest poverty rate of 0.0%, which includes 0 families.
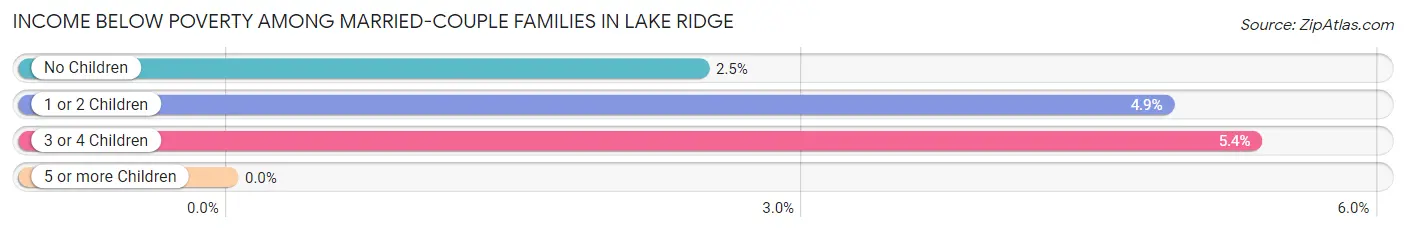
| Children | Above Poverty | Below Poverty |
| No Children | 4,206 (97.5%) | 106 (2.5%) |
| 1 or 2 Children | 3,070 (95.1%) | 158 (4.9%) |
| 3 or 4 Children | 655 (94.7%) | 37 (5.3%) |
| 5 or more Children | 41 (100.0%) | 0 (0.0%) |
| Total | 7,972 (96.4%) | 301 (3.6%) |
Income Below Poverty Among Single-Parent Households in Lake Ridge
According to the poverty data in Lake Ridge, 6.3% or 59 single-father households and 5.5% or 111 single-mother households are living below the poverty line. Among single-father households, those with 1 or 2 children have the highest poverty rate, with 58 households (11.1%) experiencing poverty. Likewise, among single-mother households, those with 5 or more children have the highest poverty rate, with 6 households (100.0%) falling below the poverty line.
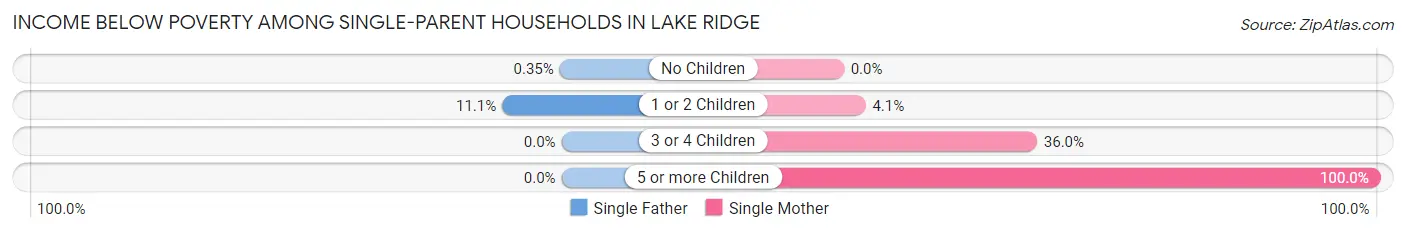
| Children | Single Father | Single Mother |
| No Children | 1 (0.4%) | 0 (0.0%) |
| 1 or 2 Children | 58 (11.1%) | 46 (4.1%) |
| 3 or 4 Children | 0 (0.0%) | 59 (36.0%) |
| 5 or more Children | 0 (0.0%) | 6 (100.0%) |
| Total | 59 (6.3%) | 111 (5.5%) |
Income Below Poverty Among Married-Couple vs Single-Parent Households in Lake Ridge
The poverty data for Lake Ridge shows that 301 of the married-couple family households (3.6%) and 170 of the single-parent households (5.7%) are living below the poverty level. Within the married-couple family households, those with 3 or 4 children have the highest poverty rate, with 37 households (5.3%) falling below the poverty line. Among the single-parent households, those with 5 or more children have the highest poverty rate, with 6 household (100.0%) living below poverty.
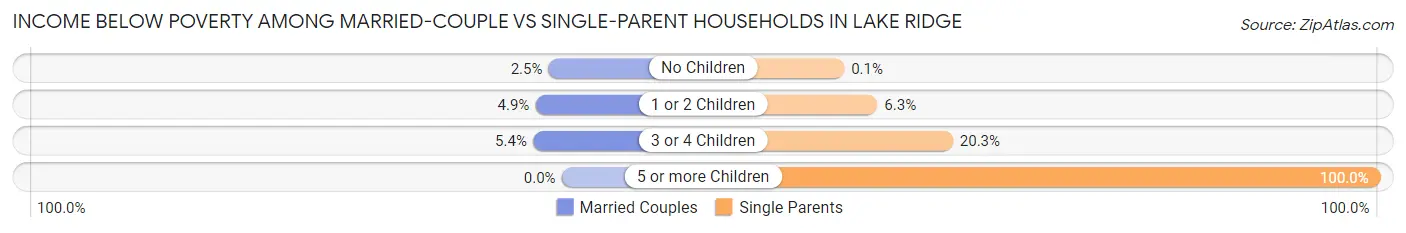
| Children | Married-Couple Families | Single-Parent Households |
| No Children | 106 (2.5%) | 1 (0.1%) |
| 1 or 2 Children | 158 (4.9%) | 104 (6.3%) |
| 3 or 4 Children | 37 (5.3%) | 59 (20.3%) |
| 5 or more Children | 0 (0.0%) | 6 (100.0%) |
| Total | 301 (3.6%) | 170 (5.7%) |
Race in Lake Ridge
The most populous races in Lake Ridge are White / Caucasian (22,767 | 50.9%), Black / African American (9,452 | 21.1%), and Hispanic or Latino (8,982 | 20.1%).
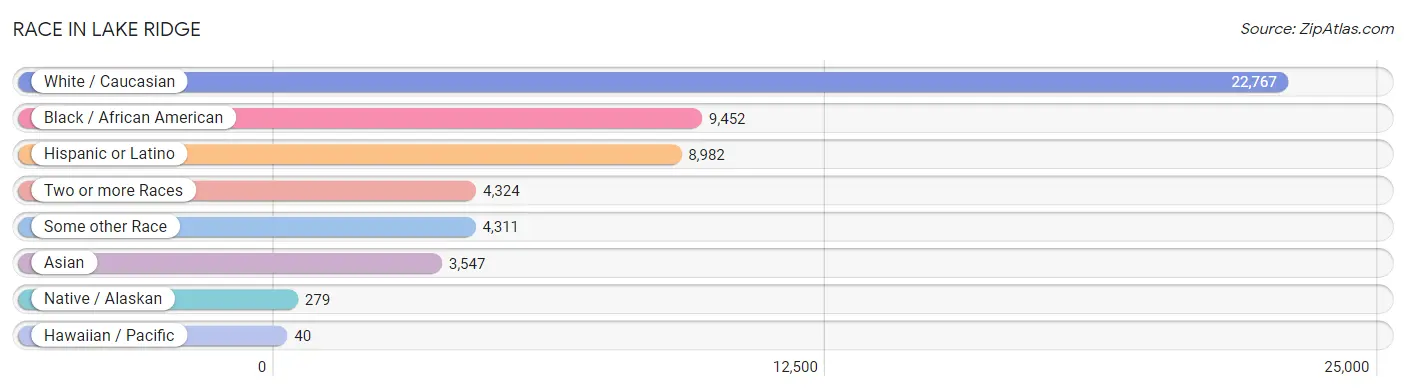
| Race | # Population | % Population |
| Asian | 3,547 | 7.9% |
| Black / African American | 9,452 | 21.1% |
| Hawaiian / Pacific | 40 | 0.1% |
| Hispanic or Latino | 8,982 | 20.1% |
| Native / Alaskan | 279 | 0.6% |
| White / Caucasian | 22,767 | 50.9% |
| Two or more Races | 4,324 | 9.7% |
| Some other Race | 4,311 | 9.6% |
| Total | 44,720 | 100.0% |
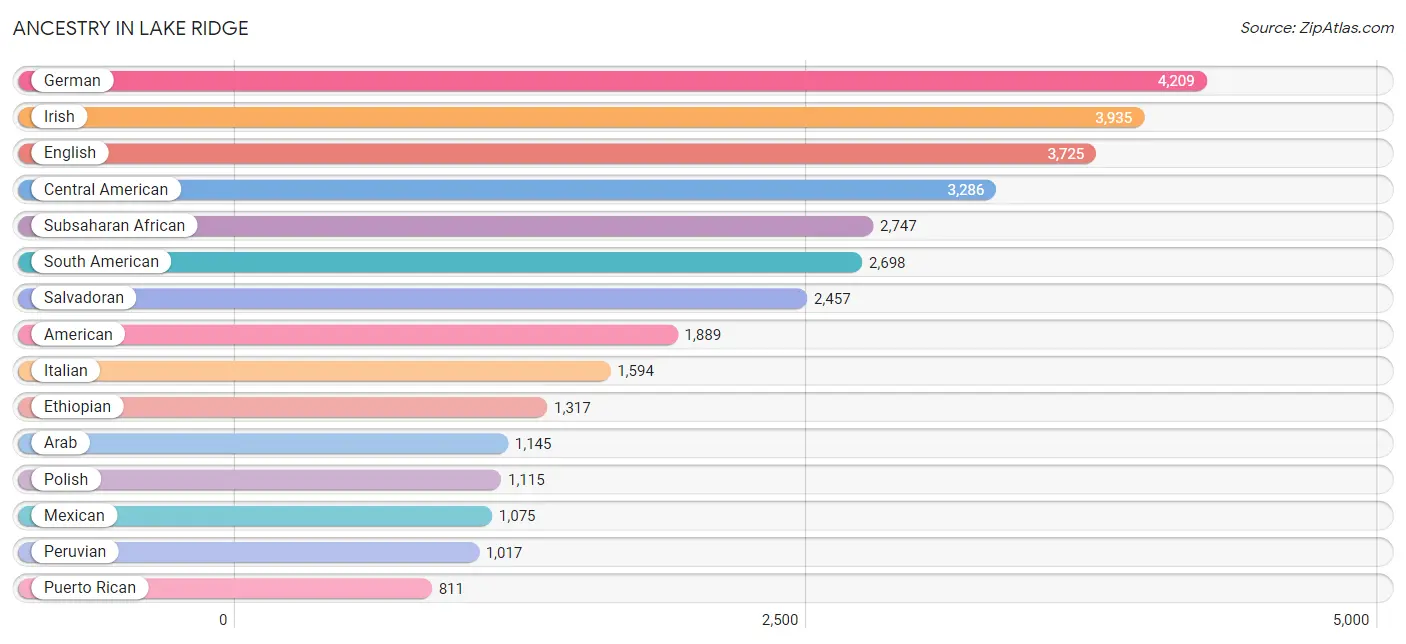
Ancestry in Lake Ridge
The most populous ancestries reported in Lake Ridge are German (4,209 | 9.4%), Irish (3,935 | 8.8%), English (3,725 | 8.3%), Central American (3,286 | 7.3%), and Subsaharan African (2,747 | 6.1%), together accounting for 40.0% of all Lake Ridge residents.
| Ancestry | # Population | % Population |
| Afghan | 288 | 0.6% |
| African | 306 | 0.7% |
| Albanian | 18 | 0.0% |
| American | 1,889 | 4.2% |
| Arab | 1,145 | 2.6% |
| Argentinean | 367 | 0.8% |
| Armenian | 64 | 0.1% |
| Austrian | 147 | 0.3% |
| Bangladeshi | 11 | 0.0% |
| Belgian | 40 | 0.1% |
| Bhutanese | 353 | 0.8% |
| Blackfeet | 42 | 0.1% |
| Bolivian | 753 | 1.7% |
| Brazilian | 19 | 0.0% |
| British | 431 | 1.0% |
| British West Indian | 15 | 0.0% |
| Burmese | 418 | 0.9% |
| Cajun | 4 | 0.0% |
| Canadian | 96 | 0.2% |
| Cape Verdean | 13 | 0.0% |
| Central American | 3,286 | 7.3% |
| Central American Indian | 133 | 0.3% |
| Cherokee | 108 | 0.2% |
| Cheyenne | 5 | 0.0% |
| Chickasaw | 10 | 0.0% |
| Chilean | 16 | 0.0% |
| Chippewa | 40 | 0.1% |
| Choctaw | 11 | 0.0% |
| Colombian | 247 | 0.5% |
| Croatian | 87 | 0.2% |
| Cuban | 83 | 0.2% |
| Czech | 201 | 0.4% |
| Czechoslovakian | 22 | 0.1% |
| Danish | 146 | 0.3% |
| Dominican | 226 | 0.5% |
| Dutch | 333 | 0.7% |
| Eastern European | 80 | 0.2% |
| Ecuadorian | 99 | 0.2% |
| Egyptian | 89 | 0.2% |
| English | 3,725 | 8.3% |
| Estonian | 11 | 0.0% |
| Ethiopian | 1,317 | 2.9% |
| European | 693 | 1.5% |
| Filipino | 28 | 0.1% |
| Finnish | 106 | 0.2% |
| French | 498 | 1.1% |
| French Canadian | 195 | 0.4% |
| German | 4,209 | 9.4% |
| Ghanaian | 715 | 1.6% |
| Greek | 96 | 0.2% |
| Guamanian / Chamorro | 14 | 0.0% |
| Guatemalan | 455 | 1.0% |
| Haitian | 68 | 0.2% |
| Honduran | 78 | 0.2% |
| Hungarian | 145 | 0.3% |
| Indian (Asian) | 529 | 1.2% |
| Indonesian | 9 | 0.0% |
| Iranian | 193 | 0.4% |
| Iraqi | 15 | 0.0% |
| Irish | 3,935 | 8.8% |
| Italian | 1,594 | 3.6% |
| Jamaican | 162 | 0.4% |
| Japanese | 24 | 0.1% |
| Korean | 779 | 1.7% |
| Laotian | 390 | 0.9% |
| Latvian | 63 | 0.1% |
| Lebanese | 523 | 1.2% |
| Liberian | 76 | 0.2% |
| Lithuanian | 96 | 0.2% |
| Lumbee | 44 | 0.1% |
| Maltese | 10 | 0.0% |
| Mexican | 1,075 | 2.4% |
| Mexican American Indian | 55 | 0.1% |
| Mongolian | 14 | 0.0% |
| Moroccan | 204 | 0.5% |
| Native Hawaiian | 45 | 0.1% |
| Navajo | 34 | 0.1% |
| Nicaraguan | 155 | 0.4% |
| Nigerian | 228 | 0.5% |
| Northern European | 14 | 0.0% |
| Norwegian | 204 | 0.5% |
| Pakistani | 46 | 0.1% |
| Panamanian | 141 | 0.3% |
| Pennsylvania German | 87 | 0.2% |
| Peruvian | 1,017 | 2.3% |
| Polish | 1,115 | 2.5% |
| Portuguese | 353 | 0.8% |
| Puerto Rican | 811 | 1.8% |
| Romanian | 398 | 0.9% |
| Russian | 308 | 0.7% |
| Salvadoran | 2,457 | 5.5% |
| Samoan | 73 | 0.2% |
| Scandinavian | 177 | 0.4% |
| Scotch-Irish | 516 | 1.1% |
| Scottish | 721 | 1.6% |
| Seminole | 9 | 0.0% |
| Serbian | 58 | 0.1% |
| Sierra Leonean | 16 | 0.0% |
| Sioux | 73 | 0.2% |
| Slavic | 11 | 0.0% |
| Slovak | 62 | 0.1% |
| Slovene | 16 | 0.0% |
| South American | 2,698 | 6.0% |
| South American Indian | 177 | 0.4% |
| Spaniard | 140 | 0.3% |
| Spanish | 41 | 0.1% |
| Sri Lankan | 202 | 0.4% |
| Subsaharan African | 2,747 | 6.1% |
| Sudanese | 17 | 0.0% |
| Swedish | 249 | 0.6% |
| Swiss | 40 | 0.1% |
| Syrian | 52 | 0.1% |
| Thai | 436 | 1.0% |
| Trinidadian and Tobagonian | 17 | 0.0% |
| Turkish | 176 | 0.4% |
| Ukrainian | 158 | 0.4% |
| Uruguayan | 41 | 0.1% |
| Venezuelan | 158 | 0.4% |
| Vietnamese | 96 | 0.2% |
| Welsh | 212 | 0.5% |
| West Indian | 116 | 0.3% | View All 121 Rows |
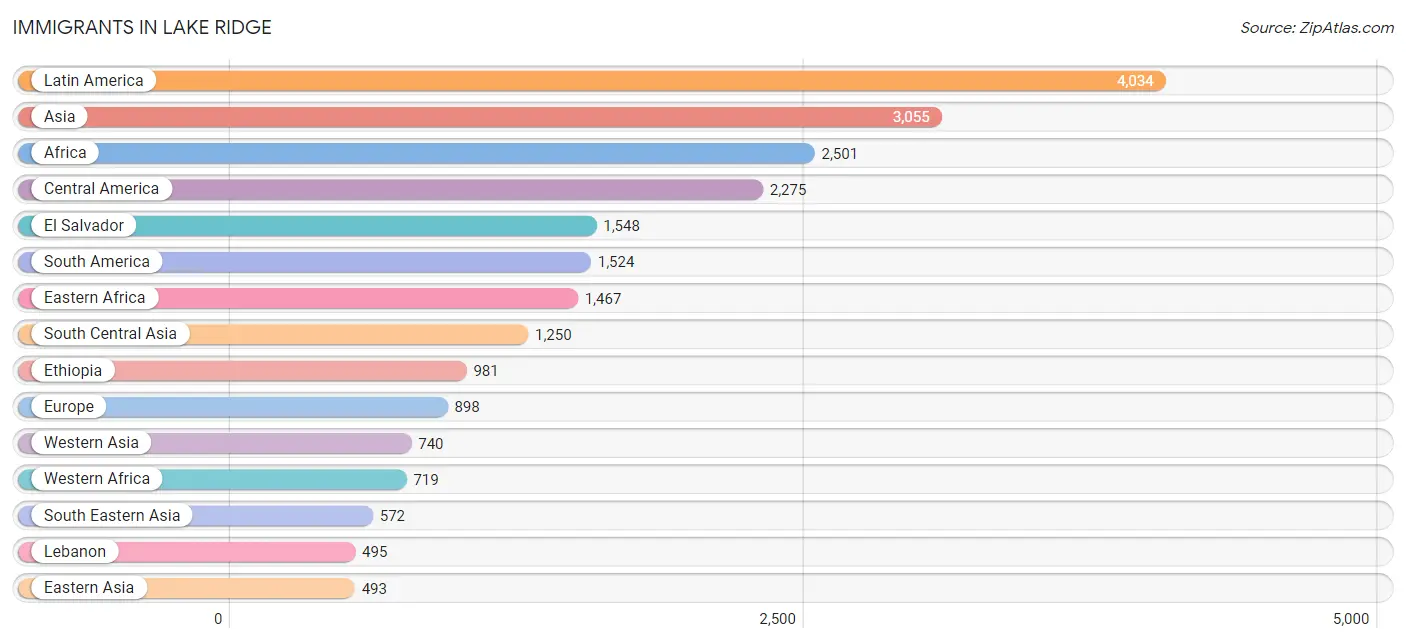
Immigrants in Lake Ridge
The most numerous immigrant groups reported in Lake Ridge came from Latin America (4,034 | 9.0%), Asia (3,055 | 6.8%), Africa (2,501 | 5.6%), Central America (2,275 | 5.1%), and El Salvador (1,548 | 3.5%), together accounting for 30.0% of all Lake Ridge residents.
| Immigration Origin | # Population | % Population |
| Afghanistan | 324 | 0.7% |
| Africa | 2,501 | 5.6% |
| Albania | 20 | 0.0% |
| Argentina | 313 | 0.7% |
| Asia | 3,055 | 6.8% |
| Bangladesh | 83 | 0.2% |
| Belgium | 22 | 0.1% |
| Bolivia | 384 | 0.9% |
| Canada | 66 | 0.2% |
| Caribbean | 235 | 0.5% |
| Central America | 2,275 | 5.1% |
| Chile | 13 | 0.0% |
| China | 228 | 0.5% |
| Colombia | 140 | 0.3% |
| Dominican Republic | 79 | 0.2% |
| Eastern Africa | 1,467 | 3.3% |
| Eastern Asia | 493 | 1.1% |
| Eastern Europe | 447 | 1.0% |
| Ecuador | 133 | 0.3% |
| Egypt | 149 | 0.3% |
| El Salvador | 1,548 | 3.5% |
| England | 136 | 0.3% |
| Eritrea | 352 | 0.8% |
| Ethiopia | 981 | 2.2% |
| Europe | 898 | 2.0% |
| France | 7 | 0.0% |
| Germany | 88 | 0.2% |
| Ghana | 381 | 0.9% |
| Greece | 10 | 0.0% |
| Grenada | 30 | 0.1% |
| Guatemala | 166 | 0.4% |
| Guyana | 26 | 0.1% |
| Haiti | 17 | 0.0% |
| Honduras | 36 | 0.1% |
| Hong Kong | 51 | 0.1% |
| Hungary | 76 | 0.2% |
| India | 224 | 0.5% |
| Iran | 116 | 0.3% |
| Iraq | 57 | 0.1% |
| Israel | 7 | 0.0% |
| Italy | 57 | 0.1% |
| Jamaica | 37 | 0.1% |
| Japan | 49 | 0.1% |
| Kazakhstan | 13 | 0.0% |
| Korea | 216 | 0.5% |
| Latin America | 4,034 | 9.0% |
| Lebanon | 495 | 1.1% |
| Liberia | 76 | 0.2% |
| Malaysia | 12 | 0.0% |
| Mexico | 315 | 0.7% |
| Morocco | 137 | 0.3% |
| Nepal | 51 | 0.1% |
| Netherlands | 8 | 0.0% |
| Nicaragua | 57 | 0.1% |
| Nigeria | 136 | 0.3% |
| Northern Africa | 315 | 0.7% |
| Northern Europe | 221 | 0.5% |
| Norway | 7 | 0.0% |
| Pakistan | 393 | 0.9% |
| Panama | 153 | 0.3% |
| Peru | 393 | 0.9% |
| Philippines | 380 | 0.9% |
| Poland | 8 | 0.0% |
| Portugal | 38 | 0.1% |
| Romania | 165 | 0.4% |
| Russia | 70 | 0.2% |
| Saudi Arabia | 28 | 0.1% |
| Scotland | 4 | 0.0% |
| Sierra Leone | 126 | 0.3% |
| Singapore | 14 | 0.0% |
| South America | 1,524 | 3.4% |
| South Central Asia | 1,250 | 2.8% |
| South Eastern Asia | 572 | 1.3% |
| Southern Europe | 105 | 0.2% |
| Sri Lanka | 16 | 0.0% |
| Syria | 9 | 0.0% |
| Taiwan | 28 | 0.1% |
| Thailand | 46 | 0.1% |
| Trinidad and Tobago | 33 | 0.1% |
| Turkey | 134 | 0.3% |
| Ukraine | 108 | 0.2% |
| Uruguay | 7 | 0.0% |
| Venezuela | 115 | 0.3% |
| Vietnam | 120 | 0.3% |
| West Indies | 39 | 0.1% |
| Western Africa | 719 | 1.6% |
| Western Asia | 740 | 1.7% |
| Western Europe | 125 | 0.3% |
| Yemen | 10 | 0.0% | View All 89 Rows |
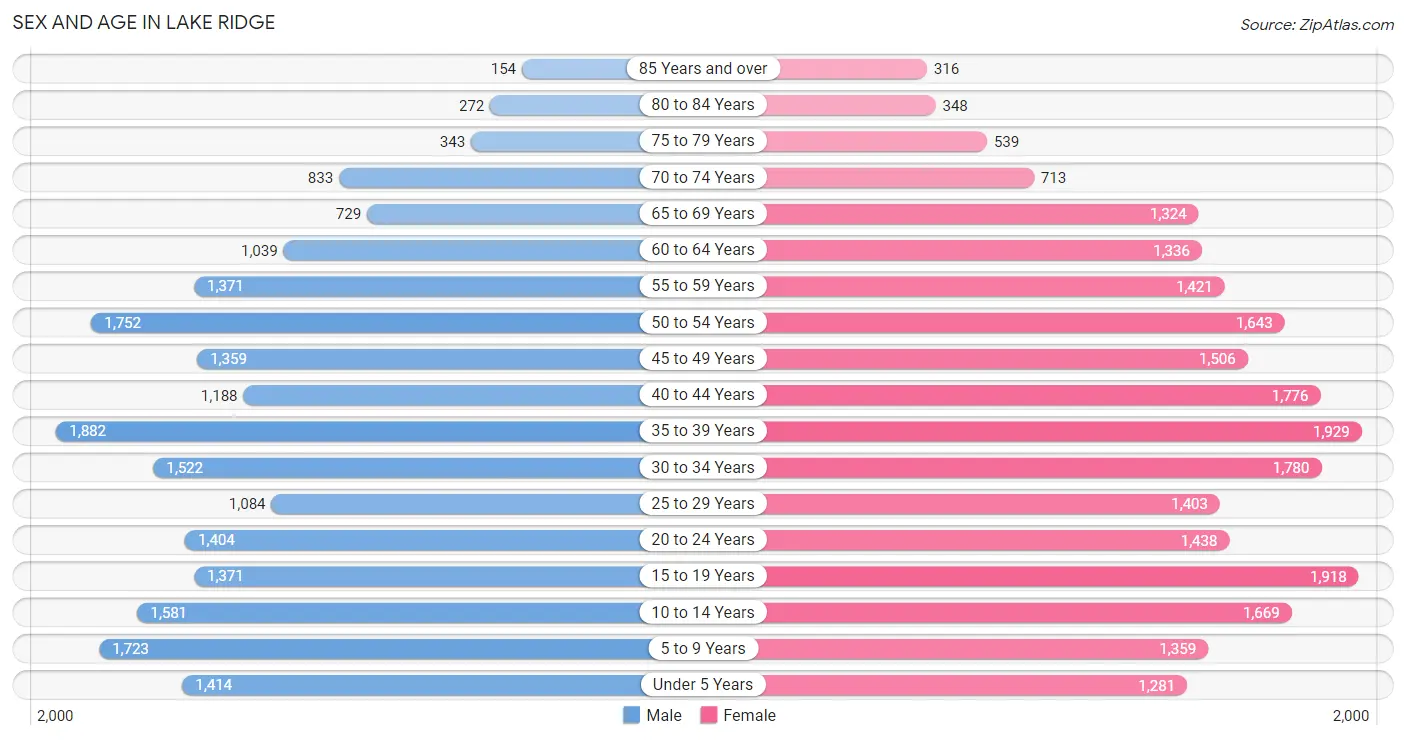
Sex and Age in Lake Ridge
Sex and Age in Lake Ridge
The most populous age groups in Lake Ridge are 35 to 39 Years (1,882 | 8.9%) for men and 35 to 39 Years (1,929 | 8.1%) for women.
| Age Bracket | Male | Female |
| Under 5 Years | 1,414 (6.7%) | 1,281 (5.4%) |
| 5 to 9 Years | 1,723 (8.2%) | 1,359 (5.7%) |
| 10 to 14 Years | 1,581 (7.5%) | 1,669 (7.0%) |
| 15 to 19 Years | 1,371 (6.5%) | 1,918 (8.1%) |
| 20 to 24 Years | 1,404 (6.7%) | 1,438 (6.1%) |
| 25 to 29 Years | 1,084 (5.2%) | 1,403 (5.9%) |
| 30 to 34 Years | 1,522 (7.2%) | 1,780 (7.5%) |
| 35 to 39 Years | 1,882 (8.9%) | 1,929 (8.1%) |
| 40 to 44 Years | 1,188 (5.7%) | 1,776 (7.5%) |
| 45 to 49 Years | 1,359 (6.5%) | 1,506 (6.4%) |
| 50 to 54 Years | 1,752 (8.3%) | 1,643 (6.9%) |
| 55 to 59 Years | 1,371 (6.5%) | 1,421 (6.0%) |
| 60 to 64 Years | 1,039 (4.9%) | 1,336 (5.6%) |
| 65 to 69 Years | 729 (3.5%) | 1,324 (5.6%) |
| 70 to 74 Years | 833 (4.0%) | 713 (3.0%) |
| 75 to 79 Years | 343 (1.6%) | 539 (2.3%) |
| 80 to 84 Years | 272 (1.3%) | 348 (1.5%) |
| 85 Years and over | 154 (0.7%) | 316 (1.3%) |
| Total | 21,021 (100.0%) | 23,699 (100.0%) |
Families and Households in Lake Ridge
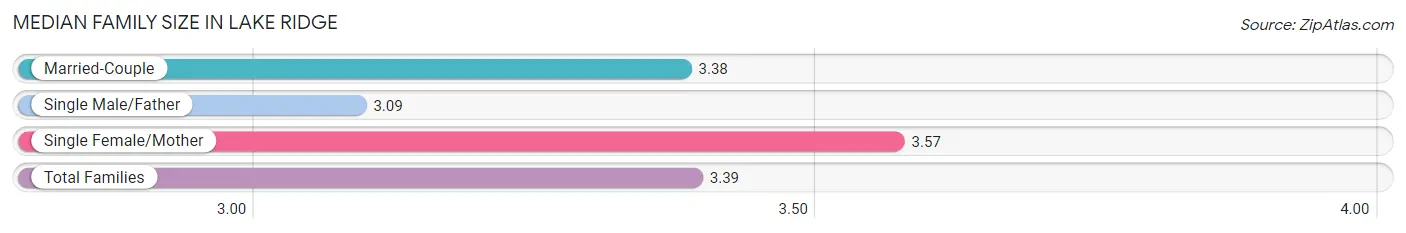
Median Family Size in Lake Ridge
The median family size in Lake Ridge is 3.39 persons per family, with single female/mother families (2,032 | 18.1%) accounting for the largest median family size of 3.57 persons per family. On the other hand, single male/father families (932 | 8.3%) represent the smallest median family size with 3.09 persons per family.
| Family Type | # Families | Family Size |
| Married-Couple | 8,273 (73.6%) | 3.38 |
| Single Male/Father | 932 (8.3%) | 3.09 |
| Single Female/Mother | 2,032 (18.1%) | 3.57 |
| Total Families | 11,237 (100.0%) | 3.39 |
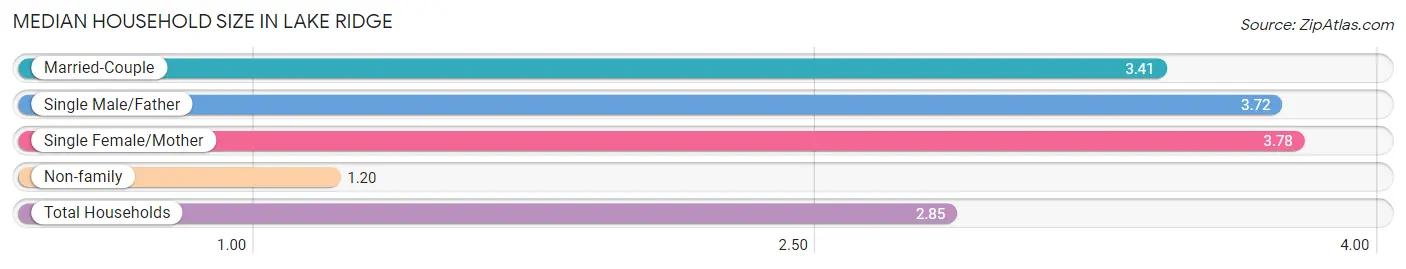
Median Household Size in Lake Ridge
The median household size in Lake Ridge is 2.85 persons per household, with single female/mother households (2,032 | 13.0%) accounting for the largest median household size of 3.78 persons per household. non-family households (4,450 | 28.4%) represent the smallest median household size with 1.20 persons per household.
| Household Type | # Households | Household Size |
| Married-Couple | 8,273 (52.7%) | 3.41 |
| Single Male/Father | 932 (5.9%) | 3.72 |
| Single Female/Mother | 2,032 (13.0%) | 3.78 |
| Non-family | 4,450 (28.4%) | 1.20 |
| Total Households | 15,687 (100.0%) | 2.85 |
Household Size by Marriage Status in Lake Ridge
Out of a total of 15,687 households in Lake Ridge, 11,237 (71.6%) are family households, while 4,450 (28.4%) are nonfamily households. The most numerous type of family households are 2-person households, comprising 4,096, and the most common type of nonfamily households are 1-person households, comprising 3,806.
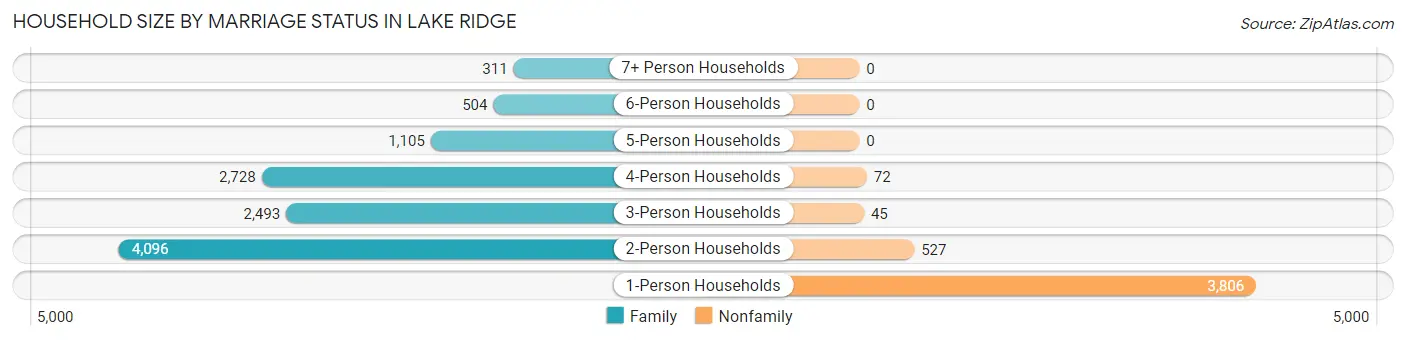
| Household Size | Family Households | Nonfamily Households |
| 1-Person Households | - | 3,806 (24.3%) |
| 2-Person Households | 4,096 (26.1%) | 527 (3.4%) |
| 3-Person Households | 2,493 (15.9%) | 45 (0.3%) |
| 4-Person Households | 2,728 (17.4%) | 72 (0.5%) |
| 5-Person Households | 1,105 (7.0%) | 0 (0.0%) |
| 6-Person Households | 504 (3.2%) | 0 (0.0%) |
| 7+ Person Households | 311 (2.0%) | 0 (0.0%) |
| Total | 11,237 (71.6%) | 4,450 (28.4%) |
Female Fertility in Lake Ridge
Fertility by Age in Lake Ridge
Average fertility rate in Lake Ridge is 60.0 births per 1,000 women. Women in the age bracket of 15 to 19 years have the highest fertility rate with 115.0 births per 1,000 women. Women in the age bracket of 20 to 34 years acount for 38.1% of all women with births.
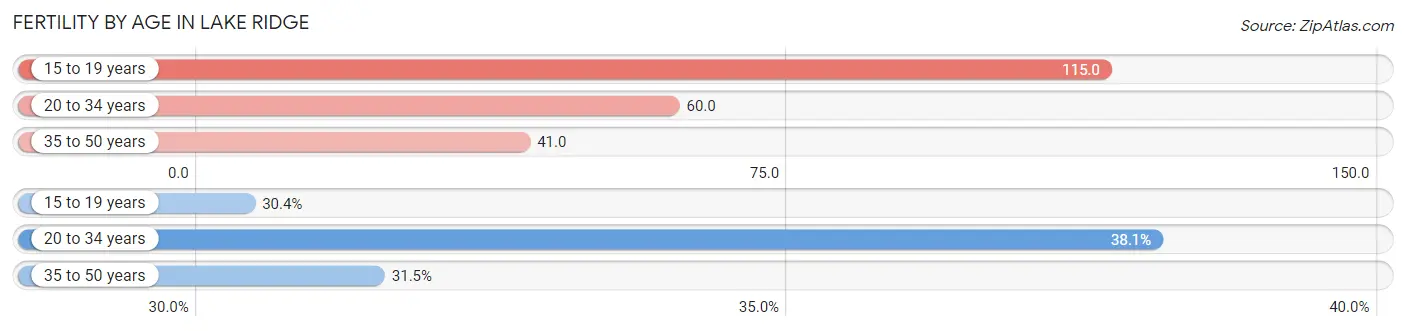
| Age Bracket | Women with Births | Births / 1,000 Women |
| 15 to 19 years | 221 (30.4%) | 115.0 |
| 20 to 34 years | 277 (38.1%) | 60.0 |
| 35 to 50 years | 229 (31.5%) | 41.0 |
| Total | 727 (100.0%) | 60.0 |
Fertility by Age by Marriage Status in Lake Ridge
51.6% of women with births (727) in Lake Ridge are married. The highest percentage of unmarried women with births falls into 15 to 19 years age bracket with 100.0% of them unmarried at the time of birth, while the lowest percentage of unmarried women with births belong to 35 to 50 years age bracket with 10.0% of them unmarried.
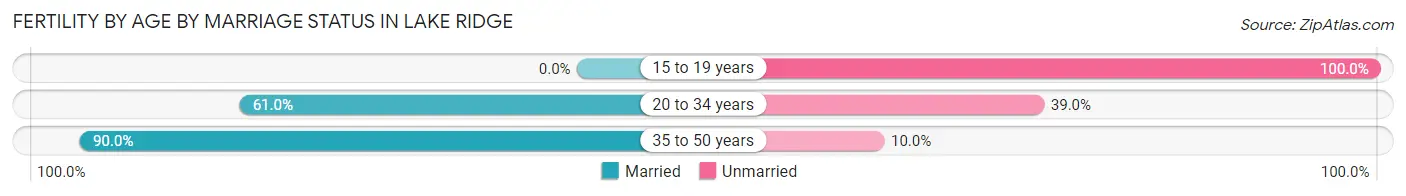
| Age Bracket | Married | Unmarried |
| 15 to 19 years | 0 (0.0%) | 221 (100.0%) |
| 20 to 34 years | 169 (61.0%) | 108 (39.0%) |
| 35 to 50 years | 206 (90.0%) | 23 (10.0%) |
| Total | 375 (51.6%) | 352 (48.4%) |
Fertility by Education in Lake Ridge
Average fertility rate in Lake Ridge is 60.0 births per 1,000 women. Women with the education attainment of high school diploma have the highest fertility rate of 111.0 births per 1,000 women, while women with the education attainment of college or associate's degree have the lowest fertility at 33.0 births per 1,000 women. Women with the education attainment of high school diploma represent 30.9% of all women with births.
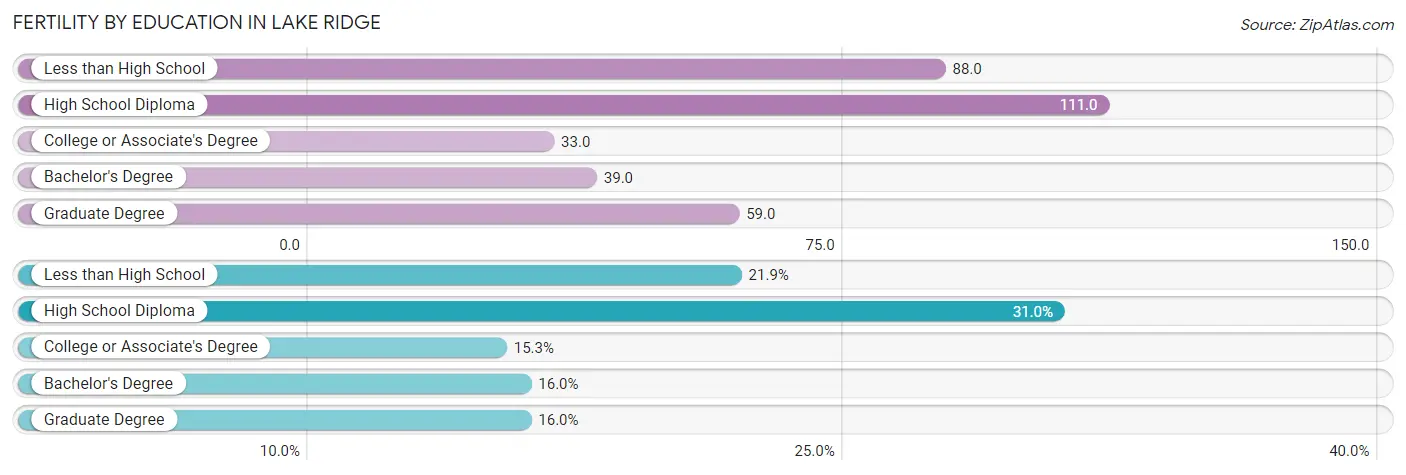
| Educational Attainment | Women with Births | Births / 1,000 Women |
| Less than High School | 159 (21.9%) | 88.0 |
| High School Diploma | 225 (30.9%) | 111.0 |
| College or Associate's Degree | 111 (15.3%) | 33.0 |
| Bachelor's Degree | 116 (16.0%) | 39.0 |
| Graduate Degree | 116 (16.0%) | 59.0 |
| Total | 727 (100.0%) | 60.0 |
Fertility by Education by Marriage Status in Lake Ridge
48.4% of women with births in Lake Ridge are unmarried. Women with the educational attainment of graduate degree are most likely to be married with 100.0% of them married at childbirth, while women with the educational attainment of less than high school are least likely to be married with 83.7% of them unmarried at childbirth.
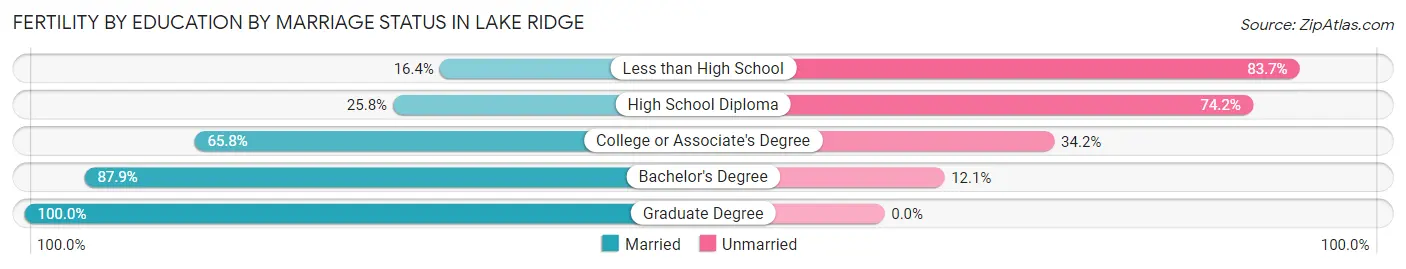
| Educational Attainment | Married | Unmarried |
| Less than High School | 26 (16.4%) | 133 (83.7%) |
| High School Diploma | 58 (25.8%) | 167 (74.2%) |
| College or Associate's Degree | 73 (65.8%) | 38 (34.2%) |
| Bachelor's Degree | 102 (87.9%) | 14 (12.1%) |
| Graduate Degree | 116 (100.0%) | 0 (0.0%) |
| Total | 375 (51.6%) | 352 (48.4%) |
Employment Characteristics in Lake Ridge
Employment by Class of Employer in Lake Ridge
Among the 23,721 employed individuals in Lake Ridge, private company employees (12,904 | 54.4%), federal government employees (4,490 | 18.9%), and local government employees (2,704 | 11.4%) make up the most common classes of employment.
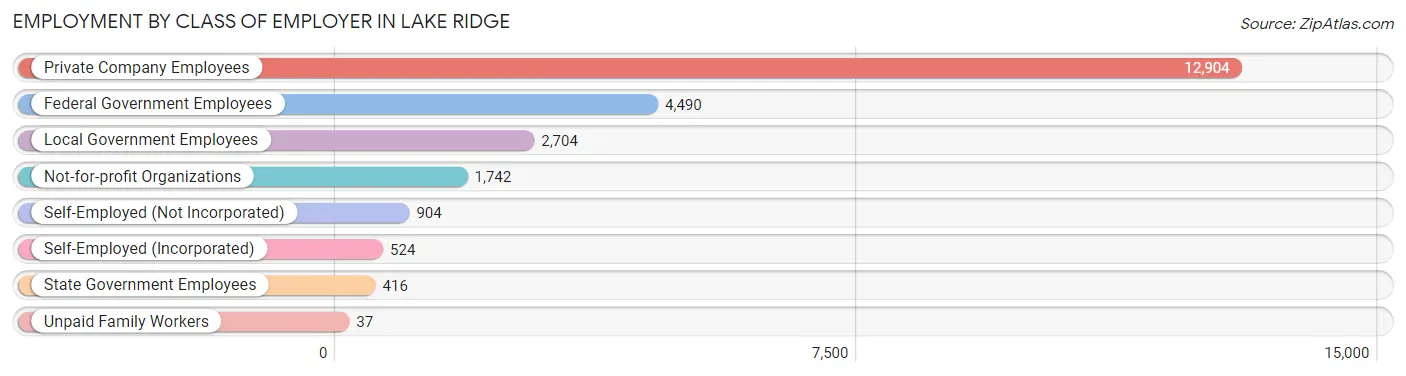
| Employer Class | # Employees | % Employees |
| Private Company Employees | 12,904 | 54.4% |
| Self-Employed (Incorporated) | 524 | 2.2% |
| Self-Employed (Not Incorporated) | 904 | 3.8% |
| Not-for-profit Organizations | 1,742 | 7.3% |
| Local Government Employees | 2,704 | 11.4% |
| State Government Employees | 416 | 1.8% |
| Federal Government Employees | 4,490 | 18.9% |
| Unpaid Family Workers | 37 | 0.2% |
| Total | 23,721 | 100.0% |
Employment Status by Age in Lake Ridge
According to the labor force statistics for Lake Ridge, out of the total population over 16 years of age (35,171), 71.2% or 25,042 individuals are in the labor force, with 4.5% or 1,127 of them unemployed. The age group with the highest labor force participation rate is 25 to 29 years, with 90.1% or 2,241 individuals in the labor force. Within the labor force, the 20 to 24 years age range has the highest percentage of unemployed individuals, with 19.7% or 458 of them being unemployed.
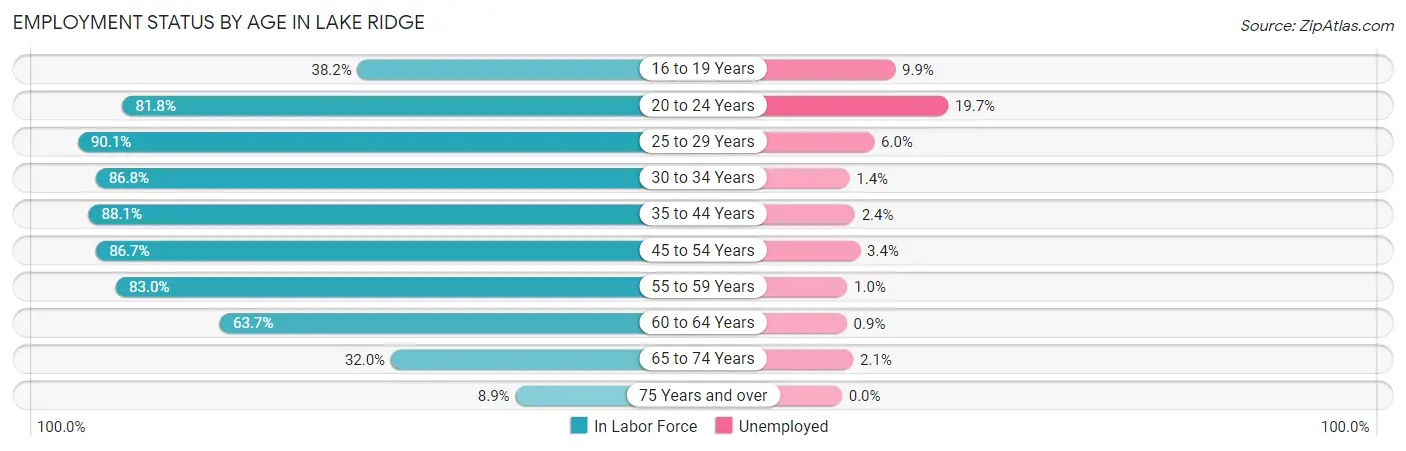
| Age Bracket | In Labor Force | Unemployed |
| 16 to 19 Years | 1,057 (38.2%) | 105 (9.9%) |
| 20 to 24 Years | 2,325 (81.8%) | 458 (19.7%) |
| 25 to 29 Years | 2,241 (90.1%) | 134 (6.0%) |
| 30 to 34 Years | 2,866 (86.8%) | 40 (1.4%) |
| 35 to 44 Years | 5,969 (88.1%) | 143 (2.4%) |
| 45 to 54 Years | 5,427 (86.7%) | 185 (3.4%) |
| 55 to 59 Years | 2,317 (83.0%) | 23 (1.0%) |
| 60 to 64 Years | 1,513 (63.7%) | 14 (0.9%) |
| 65 to 74 Years | 1,152 (32.0%) | 24 (2.1%) |
| 75 Years and over | 176 (8.9%) | 0 (0.0%) |
| Total | 25,042 (71.2%) | 1,127 (4.5%) |
Employment Status by Educational Attainment in Lake Ridge
According to labor force statistics for Lake Ridge, 84.8% of individuals (20,344) out of the total population between 25 and 64 years of age (23,991) are in the labor force, with 2.6% or 529 of them being unemployed. The group with the highest labor force participation rate are those with the educational attainment of bachelor's degree or higher, with 88.2% or 10,527 individuals in the labor force. Within the labor force, individuals with less than high school education have the highest percentage of unemployment, with 8.4% or 113 of them being unemployed.
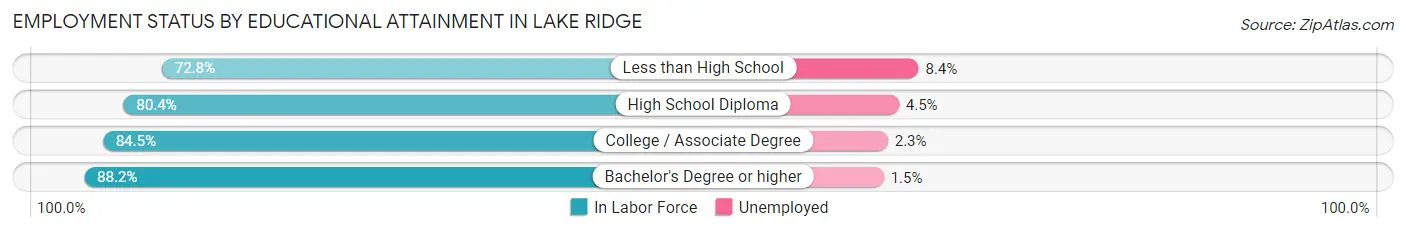
| Educational Attainment | In Labor Force | Unemployed |
| Less than High School | 1,350 (72.8%) | 156 (8.4%) |
| High School Diploma | 3,045 (80.4%) | 170 (4.5%) |
| College / Associate Degree | 5,420 (84.5%) | 148 (2.3%) |
| Bachelor's Degree or higher | 10,527 (88.2%) | 179 (1.5%) |
| Total | 20,344 (84.8%) | 624 (2.6%) |
Employment Occupations by Sex in Lake Ridge
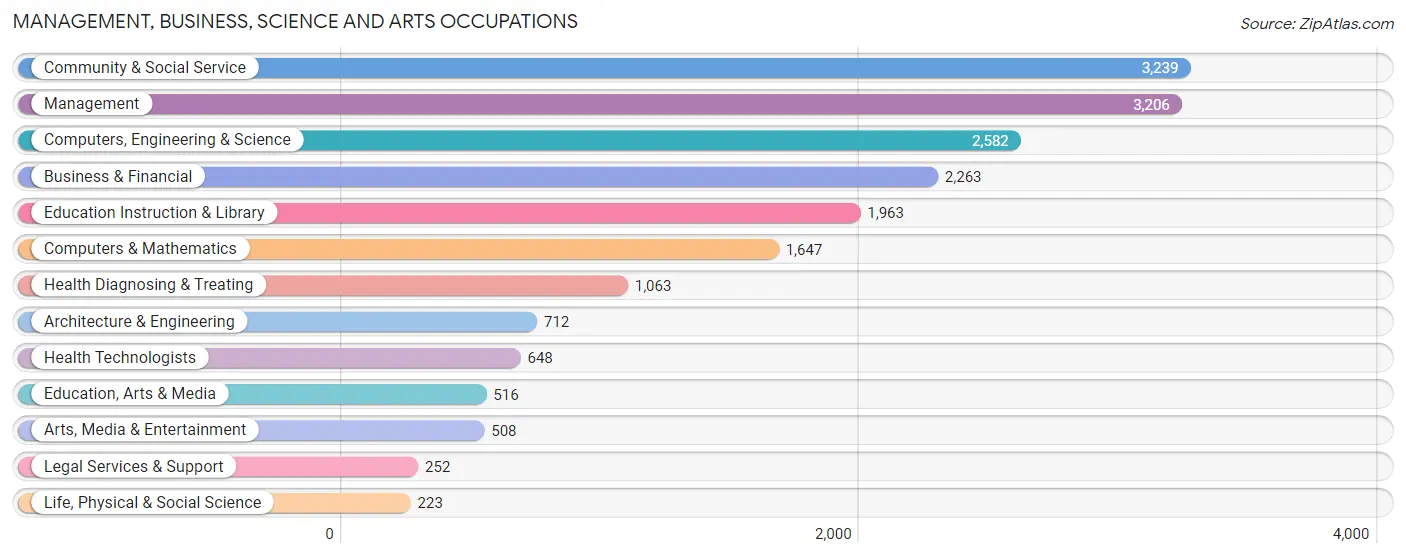
Management, Business, Science and Arts Occupations
The most common Management, Business, Science and Arts occupations in Lake Ridge are Community & Social Service (3,239 | 14.0%), Management (3,206 | 13.8%), Computers, Engineering & Science (2,582 | 11.1%), Business & Financial (2,263 | 9.8%), and Education Instruction & Library (1,963 | 8.5%).
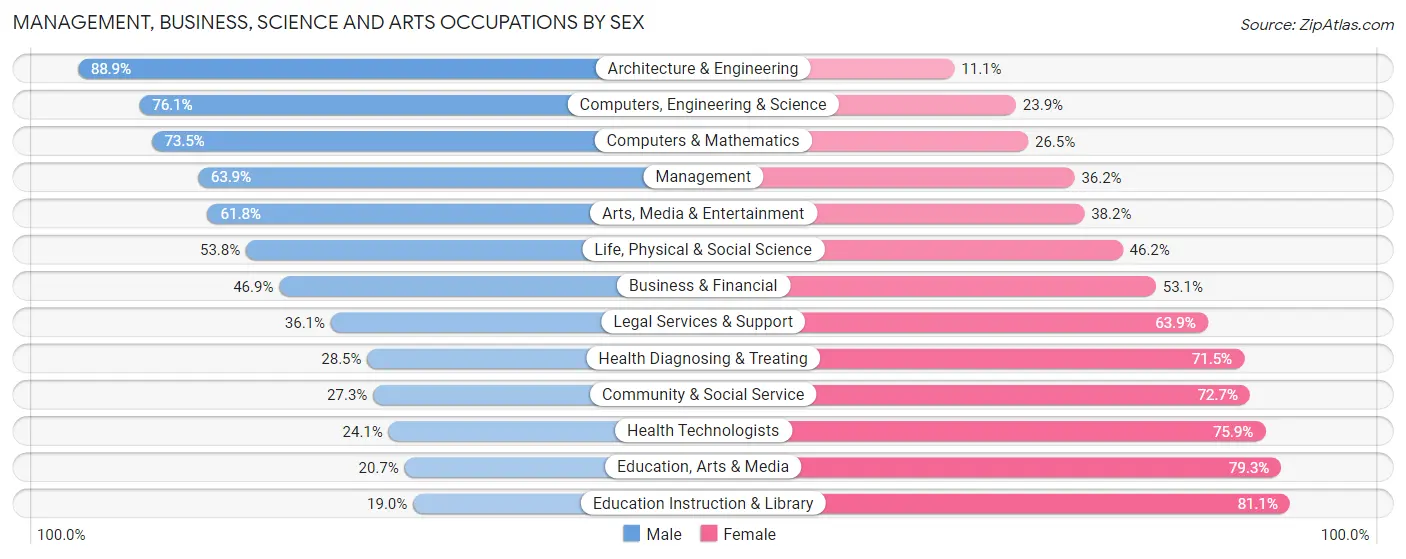
Management, Business, Science and Arts Occupations by Sex
Within the Management, Business, Science and Arts occupations in Lake Ridge, the most male-oriented occupations are Architecture & Engineering (88.9%), Computers, Engineering & Science (76.1%), and Computers & Mathematics (73.5%), while the most female-oriented occupations are Education Instruction & Library (81.0%), Education, Arts & Media (79.3%), and Health Technologists (75.9%).
| Occupation | Male | Female |
| Management | 2,047 (63.8%) | 1,159 (36.1%) |
| Business & Financial | 1,061 (46.9%) | 1,202 (53.1%) |
| Computers, Engineering & Science | 1,964 (76.1%) | 618 (23.9%) |
| Computers & Mathematics | 1,211 (73.5%) | 436 (26.5%) |
| Architecture & Engineering | 633 (88.9%) | 79 (11.1%) |
| Life, Physical & Social Science | 120 (53.8%) | 103 (46.2%) |
| Community & Social Service | 884 (27.3%) | 2,355 (72.7%) |
| Education, Arts & Media | 107 (20.7%) | 409 (79.3%) |
| Legal Services & Support | 91 (36.1%) | 161 (63.9%) |
| Education Instruction & Library | 372 (19.0%) | 1,591 (81.0%) |
| Arts, Media & Entertainment | 314 (61.8%) | 194 (38.2%) |
| Health Diagnosing & Treating | 303 (28.5%) | 760 (71.5%) |
| Health Technologists | 156 (24.1%) | 492 (75.9%) |
| Total (Category) | 6,259 (50.7%) | 6,094 (49.3%) |
| Total (Overall) | 11,538 (49.8%) | 11,640 (50.2%) |
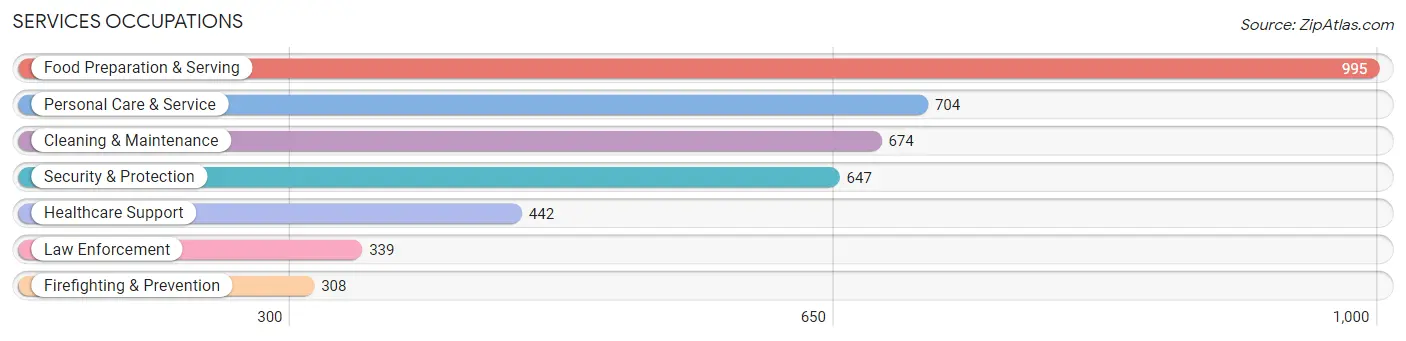
Services Occupations
The most common Services occupations in Lake Ridge are Food Preparation & Serving (995 | 4.3%), Personal Care & Service (704 | 3.0%), Cleaning & Maintenance (674 | 2.9%), Security & Protection (647 | 2.8%), and Healthcare Support (442 | 1.9%).
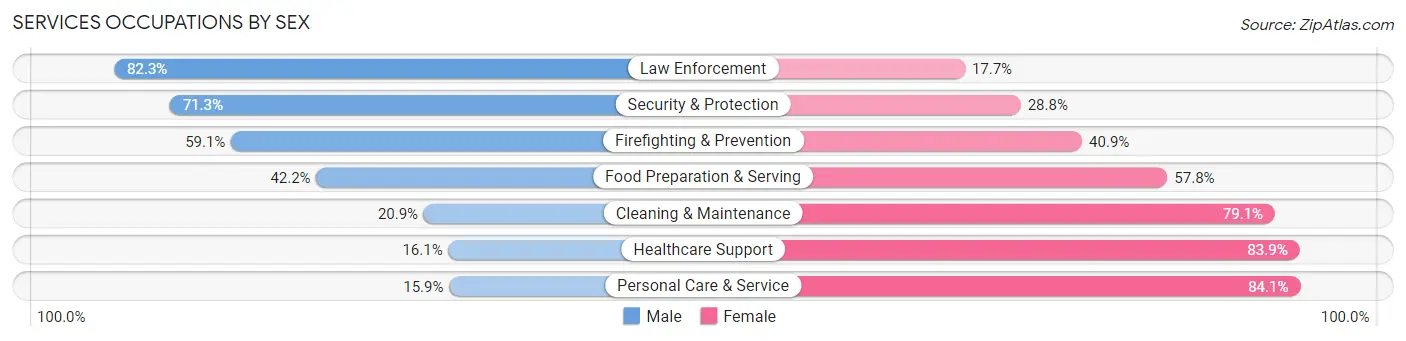
Services Occupations by Sex
Within the Services occupations in Lake Ridge, the most male-oriented occupations are Law Enforcement (82.3%), Security & Protection (71.3%), and Firefighting & Prevention (59.1%), while the most female-oriented occupations are Personal Care & Service (84.1%), Healthcare Support (83.9%), and Cleaning & Maintenance (79.1%).
| Occupation | Male | Female |
| Healthcare Support | 71 (16.1%) | 371 (83.9%) |
| Security & Protection | 461 (71.3%) | 186 (28.7%) |
| Firefighting & Prevention | 182 (59.1%) | 126 (40.9%) |
| Law Enforcement | 279 (82.3%) | 60 (17.7%) |
| Food Preparation & Serving | 420 (42.2%) | 575 (57.8%) |
| Cleaning & Maintenance | 141 (20.9%) | 533 (79.1%) |
| Personal Care & Service | 112 (15.9%) | 592 (84.1%) |
| Total (Category) | 1,205 (34.8%) | 2,257 (65.2%) |
| Total (Overall) | 11,538 (49.8%) | 11,640 (50.2%) |
Sales and Office Occupations
The most common Sales and Office occupations in Lake Ridge are Office & Administration (2,329 | 10.1%), and Sales & Related (1,677 | 7.2%).

Sales and Office Occupations by Sex
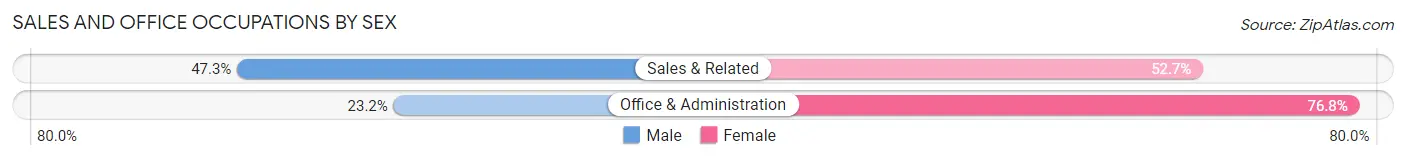
| Occupation | Male | Female |
| Sales & Related | 793 (47.3%) | 884 (52.7%) |
| Office & Administration | 541 (23.2%) | 1,788 (76.8%) |
| Total (Category) | 1,334 (33.3%) | 2,672 (66.7%) |
| Total (Overall) | 11,538 (49.8%) | 11,640 (50.2%) |
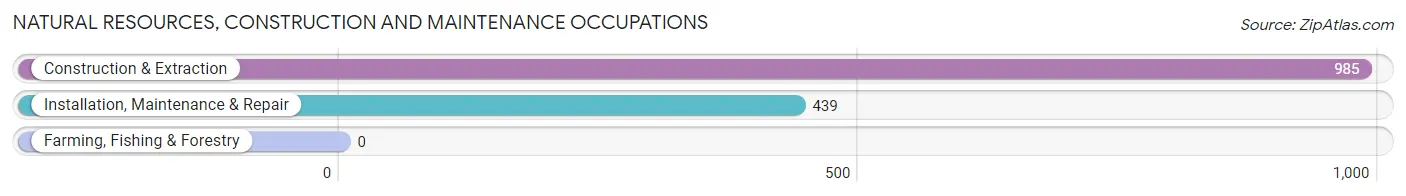
Natural Resources, Construction and Maintenance Occupations
The most common Natural Resources, Construction and Maintenance occupations in Lake Ridge are Construction & Extraction (985 | 4.3%), and Installation, Maintenance & Repair (439 | 1.9%).
Natural Resources, Construction and Maintenance Occupations by Sex
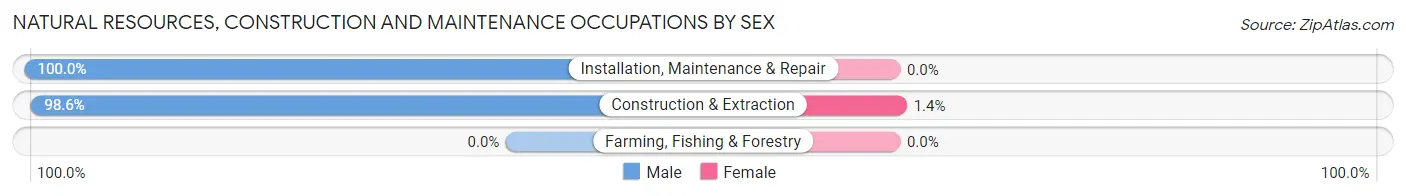
| Occupation | Male | Female |
| Farming, Fishing & Forestry | 0 (0.0%) | 0 (0.0%) |
| Construction & Extraction | 971 (98.6%) | 14 (1.4%) |
| Installation, Maintenance & Repair | 439 (100.0%) | 0 (0.0%) |
| Total (Category) | 1,410 (99.0%) | 14 (1.0%) |
| Total (Overall) | 11,538 (49.8%) | 11,640 (50.2%) |
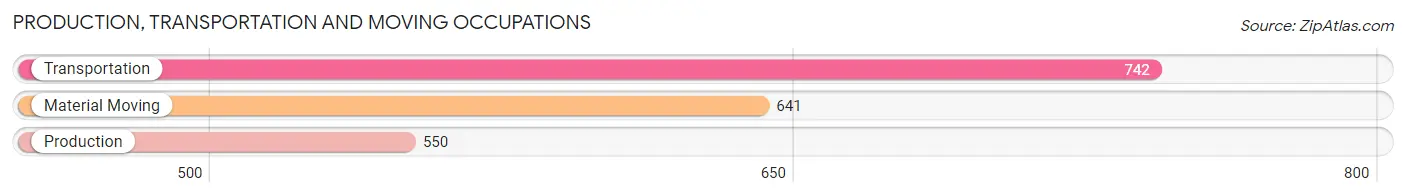
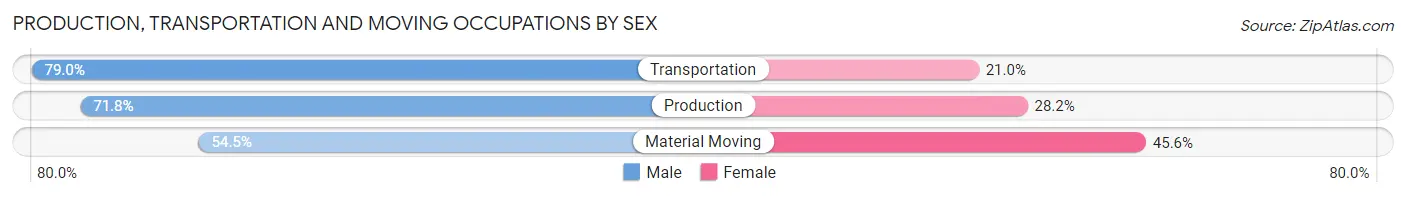
Production, Transportation and Moving Occupations
The most common Production, Transportation and Moving occupations in Lake Ridge are Transportation (742 | 3.2%), Material Moving (641 | 2.8%), and Production (550 | 2.4%).
Production, Transportation and Moving Occupations by Sex
| Occupation | Male | Female |
| Production | 395 (71.8%) | 155 (28.2%) |
| Transportation | 586 (79.0%) | 156 (21.0%) |
| Material Moving | 349 (54.4%) | 292 (45.6%) |
| Total (Category) | 1,330 (68.8%) | 603 (31.2%) |
| Total (Overall) | 11,538 (49.8%) | 11,640 (50.2%) |
Employment Industries by Sex in Lake Ridge
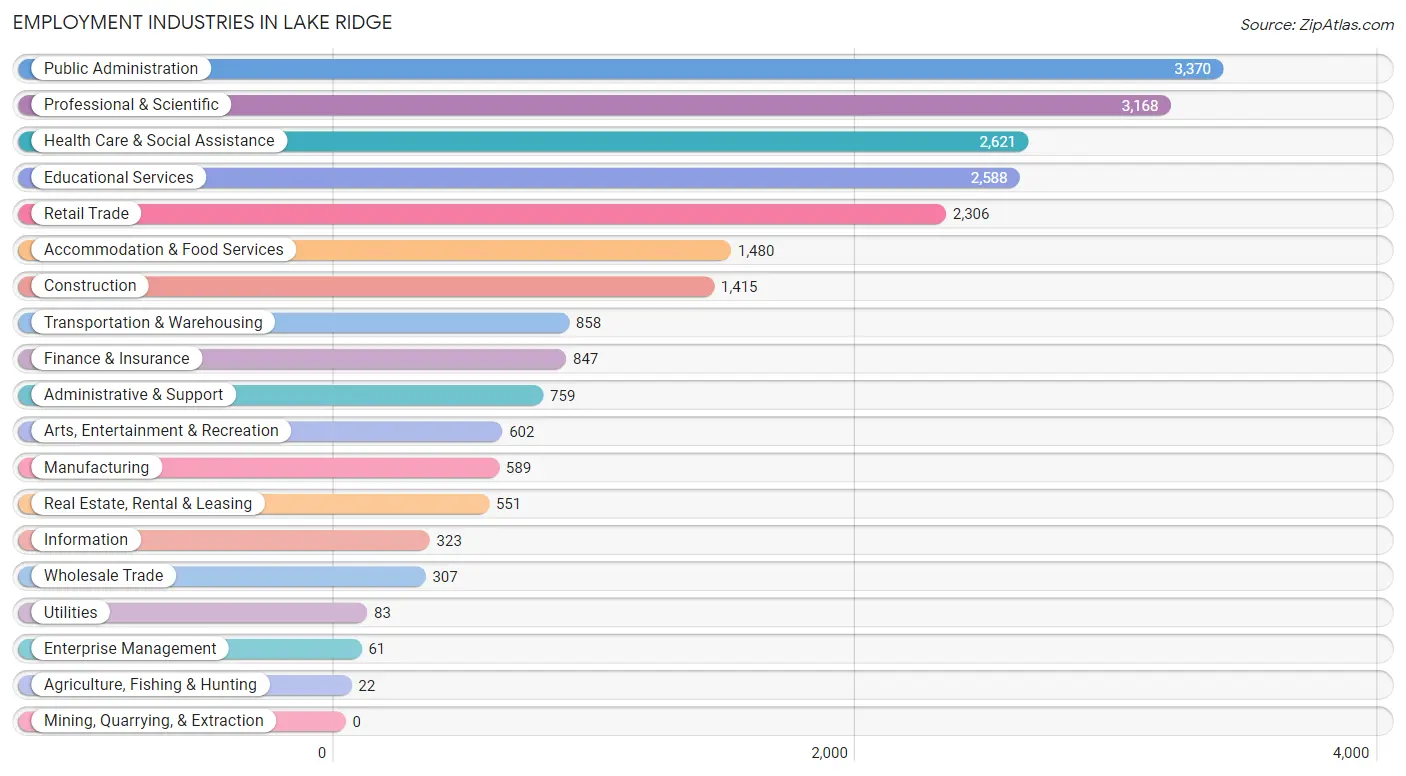
Employment Industries in Lake Ridge
The major employment industries in Lake Ridge include Public Administration (3,370 | 14.5%), Professional & Scientific (3,168 | 13.7%), Health Care & Social Assistance (2,621 | 11.3%), Educational Services (2,588 | 11.2%), and Retail Trade (2,306 | 10.0%).
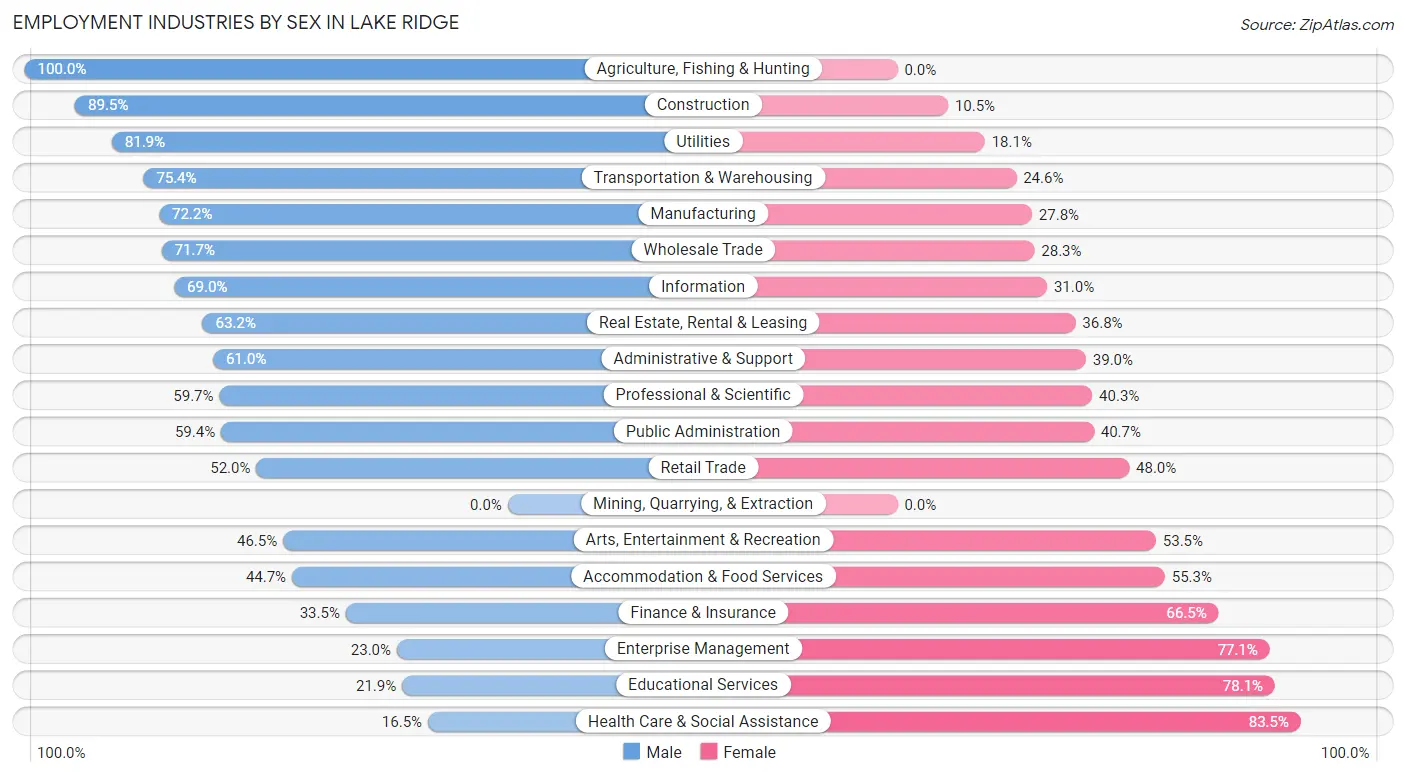
Employment Industries by Sex in Lake Ridge
The Lake Ridge industries that see more men than women are Agriculture, Fishing & Hunting (100.0%), Construction (89.5%), and Utilities (81.9%), whereas the industries that tend to have a higher number of women are Health Care & Social Assistance (83.5%), Educational Services (78.1%), and Enterprise Management (77.0%).
| Industry | Male | Female |
| Agriculture, Fishing & Hunting | 22 (100.0%) | 0 (0.0%) |
| Mining, Quarrying, & Extraction | 0 (0.0%) | 0 (0.0%) |
| Construction | 1,267 (89.5%) | 148 (10.5%) |
| Manufacturing | 425 (72.2%) | 164 (27.8%) |
| Wholesale Trade | 220 (71.7%) | 87 (28.3%) |
| Retail Trade | 1,200 (52.0%) | 1,106 (48.0%) |
| Transportation & Warehousing | 647 (75.4%) | 211 (24.6%) |
| Utilities | 68 (81.9%) | 15 (18.1%) |
| Information | 223 (69.0%) | 100 (31.0%) |
| Finance & Insurance | 284 (33.5%) | 563 (66.5%) |
| Real Estate, Rental & Leasing | 348 (63.2%) | 203 (36.8%) |
| Professional & Scientific | 1,891 (59.7%) | 1,277 (40.3%) |
| Enterprise Management | 14 (23.0%) | 47 (77.0%) |
| Administrative & Support | 463 (61.0%) | 296 (39.0%) |
| Educational Services | 566 (21.9%) | 2,022 (78.1%) |
| Health Care & Social Assistance | 433 (16.5%) | 2,188 (83.5%) |
| Arts, Entertainment & Recreation | 280 (46.5%) | 322 (53.5%) |
| Accommodation & Food Services | 661 (44.7%) | 819 (55.3%) |
| Public Administration | 2,000 (59.4%) | 1,370 (40.6%) |
| Total | 11,538 (49.8%) | 11,640 (50.2%) |
Education in Lake Ridge
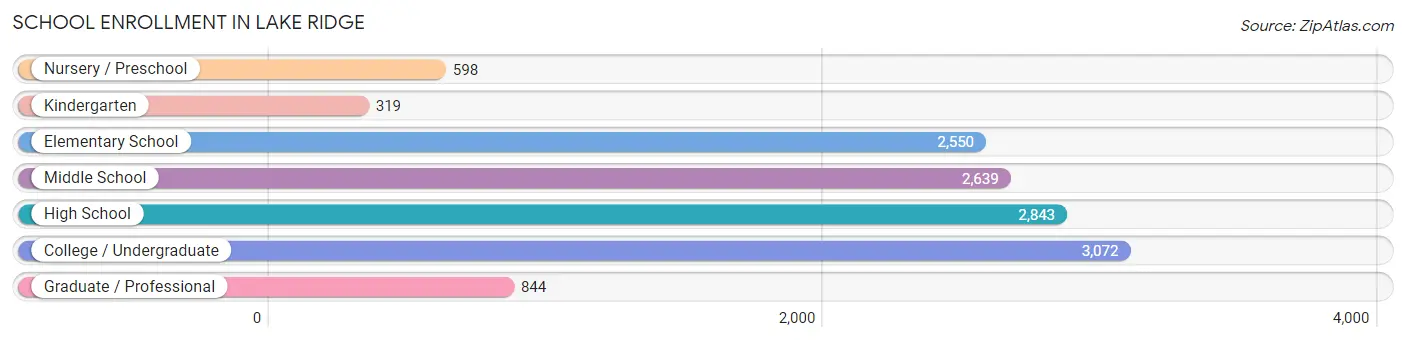
School Enrollment in Lake Ridge
The most common levels of schooling among the 12,865 students in Lake Ridge are college / undergraduate (3,072 | 23.9%), high school (2,843 | 22.1%), and middle school (2,639 | 20.5%).
| School Level | # Students | % Students |
| Nursery / Preschool | 598 | 4.6% |
| Kindergarten | 319 | 2.5% |
| Elementary School | 2,550 | 19.8% |
| Middle School | 2,639 | 20.5% |
| High School | 2,843 | 22.1% |
| College / Undergraduate | 3,072 | 23.9% |
| Graduate / Professional | 844 | 6.6% |
| Total | 12,865 | 100.0% |
School Enrollment by Age by Funding Source in Lake Ridge
Out of a total of 12,865 students who are enrolled in schools in Lake Ridge, 1,891 (14.7%) attend a private institution, while the remaining 10,974 (85.3%) are enrolled in public schools. The age group of 3 to 4 year olds has the highest likelihood of being enrolled in private schools, with 270 (61.8% in the age bracket) enrolled. Conversely, the age group of 15 to 17 year olds has the lowest likelihood of being enrolled in a private school, with 1,820 (94.4% in the age bracket) attending a public institution.
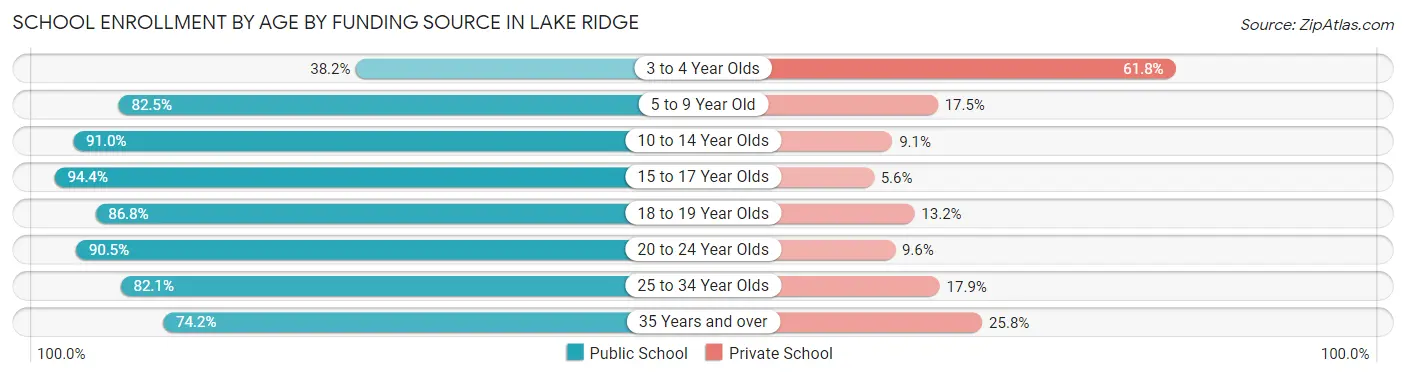
| Age Bracket | Public School | Private School |
| 3 to 4 Year Olds | 167 (38.2%) | 270 (61.8%) |
| 5 to 9 Year Old | 2,383 (82.5%) | 506 (17.5%) |
| 10 to 14 Year Olds | 2,916 (90.9%) | 290 (9.0%) |
| 15 to 17 Year Olds | 1,820 (94.4%) | 108 (5.6%) |
| 18 to 19 Year Olds | 988 (86.8%) | 150 (13.2%) |
| 20 to 24 Year Olds | 1,184 (90.4%) | 125 (9.6%) |
| 25 to 34 Year Olds | 643 (82.1%) | 140 (17.9%) |
| 35 Years and over | 872 (74.2%) | 303 (25.8%) |
| Total | 10,974 (85.3%) | 1,891 (14.7%) |
Educational Attainment by Field of Study in Lake Ridge
Business (3,038 | 19.6%), social sciences (1,677 | 10.8%), engineering (1,297 | 8.4%), science & technology (1,241 | 8.0%), and arts & humanities (1,189 | 7.7%) are the most common fields of study among 15,481 individuals in Lake Ridge who have obtained a bachelor's degree or higher.
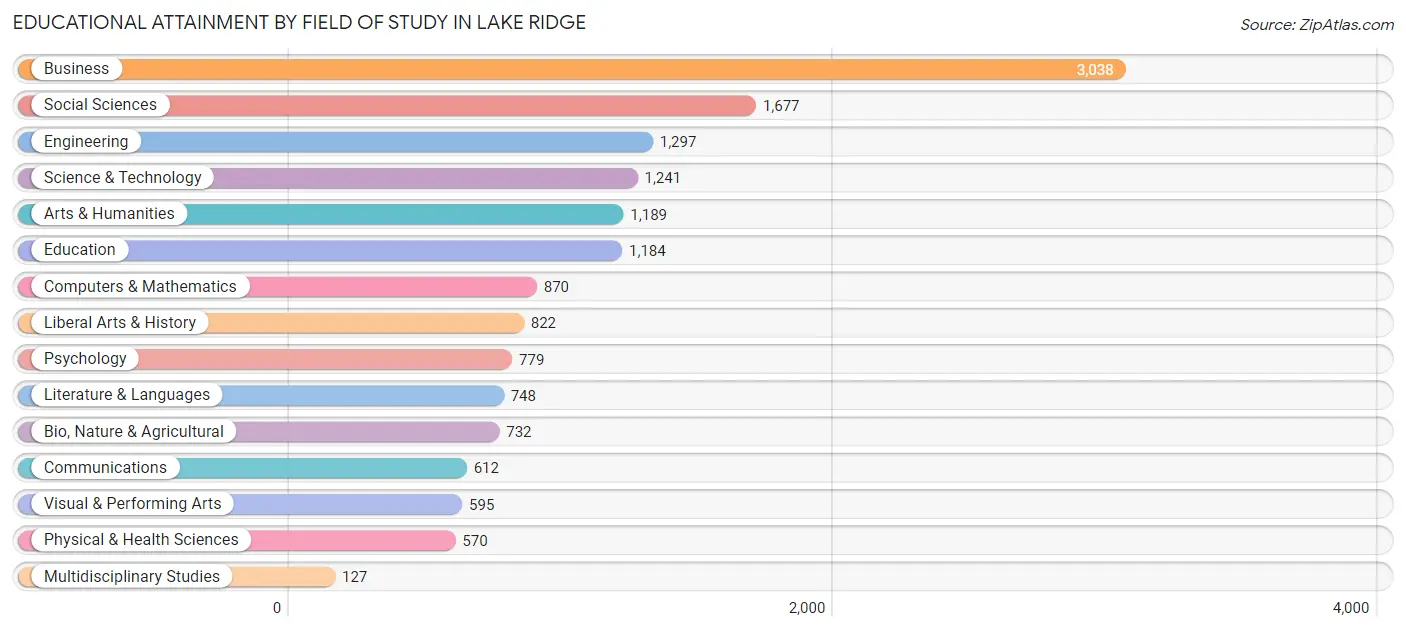
| Field of Study | # Graduates | % Graduates |
| Computers & Mathematics | 870 | 5.6% |
| Bio, Nature & Agricultural | 732 | 4.7% |
| Physical & Health Sciences | 570 | 3.7% |
| Psychology | 779 | 5.0% |
| Social Sciences | 1,677 | 10.8% |
| Engineering | 1,297 | 8.4% |
| Multidisciplinary Studies | 127 | 0.8% |
| Science & Technology | 1,241 | 8.0% |
| Business | 3,038 | 19.6% |
| Education | 1,184 | 7.6% |
| Literature & Languages | 748 | 4.8% |
| Liberal Arts & History | 822 | 5.3% |
| Visual & Performing Arts | 595 | 3.8% |
| Communications | 612 | 4.0% |
| Arts & Humanities | 1,189 | 7.7% |
| Total | 15,481 | 100.0% |
Transportation & Commute in Lake Ridge
Vehicle Availability by Sex in Lake Ridge
The most prevalent vehicle ownership categories in Lake Ridge are males with 2 vehicles (5,479, accounting for 45.1%) and females with 2 vehicles (4,318, making up 47.4%).
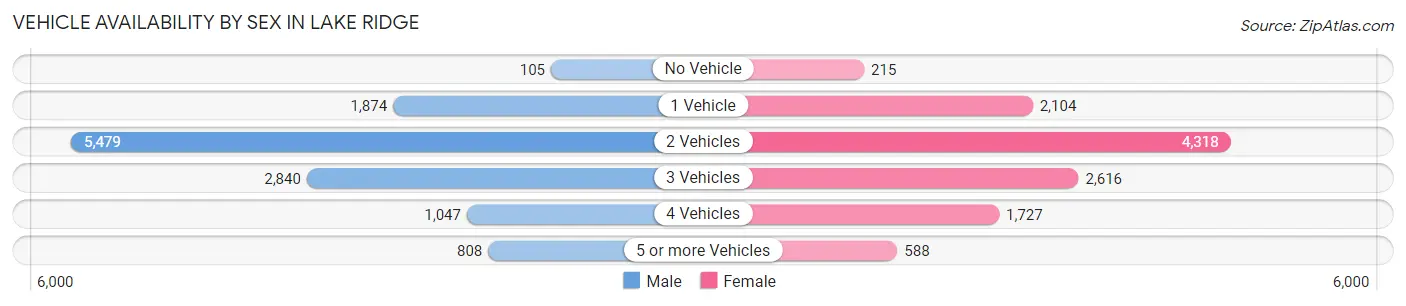
| Vehicles Available | Male | Female |
| No Vehicle | 105 (0.9%) | 215 (1.9%) |
| 1 Vehicle | 1,874 (15.4%) | 2,104 (18.2%) |
| 2 Vehicles | 5,479 (45.1%) | 4,318 (37.3%) |
| 3 Vehicles | 2,840 (23.4%) | 2,616 (22.6%) |
| 4 Vehicles | 1,047 (8.6%) | 1,727 (14.9%) |
| 5 or more Vehicles | 808 (6.7%) | 588 (5.1%) |
| Total | 12,153 (100.0%) | 11,568 (100.0%) |
Commute Time in Lake Ridge
The most frequently occuring commute durations in Lake Ridge are 45 to 59 minutes (4,296 commuters, 21.0%), 60 to 89 minutes (3,567 commuters, 17.4%), and 30 to 34 minutes (3,202 commuters, 15.7%).
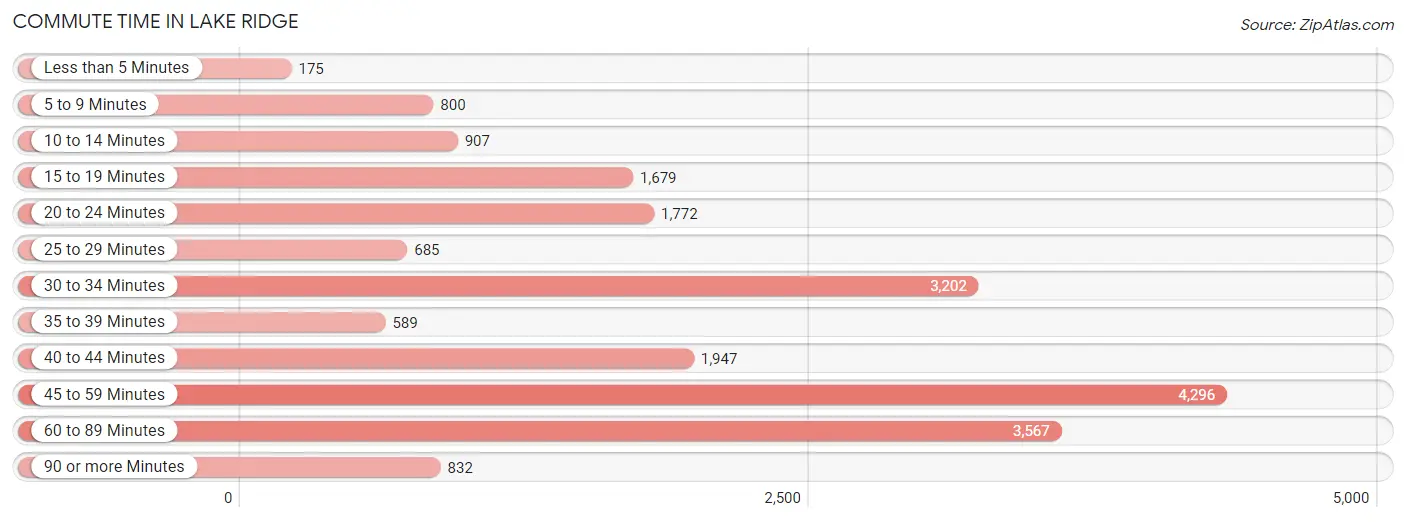
| Commute Time | # Commuters | % Commuters |
| Less than 5 Minutes | 175 | 0.9% |
| 5 to 9 Minutes | 800 | 3.9% |
| 10 to 14 Minutes | 907 | 4.4% |
| 15 to 19 Minutes | 1,679 | 8.2% |
| 20 to 24 Minutes | 1,772 | 8.7% |
| 25 to 29 Minutes | 685 | 3.4% |
| 30 to 34 Minutes | 3,202 | 15.7% |
| 35 to 39 Minutes | 589 | 2.9% |
| 40 to 44 Minutes | 1,947 | 9.5% |
| 45 to 59 Minutes | 4,296 | 21.0% |
| 60 to 89 Minutes | 3,567 | 17.4% |
| 90 or more Minutes | 832 | 4.1% |
Commute Time by Sex in Lake Ridge
The most common commute times in Lake Ridge are 45 to 59 minutes (2,334 commuters, 22.8%) for males and 45 to 59 minutes (1,962 commuters, 19.2%) for females.
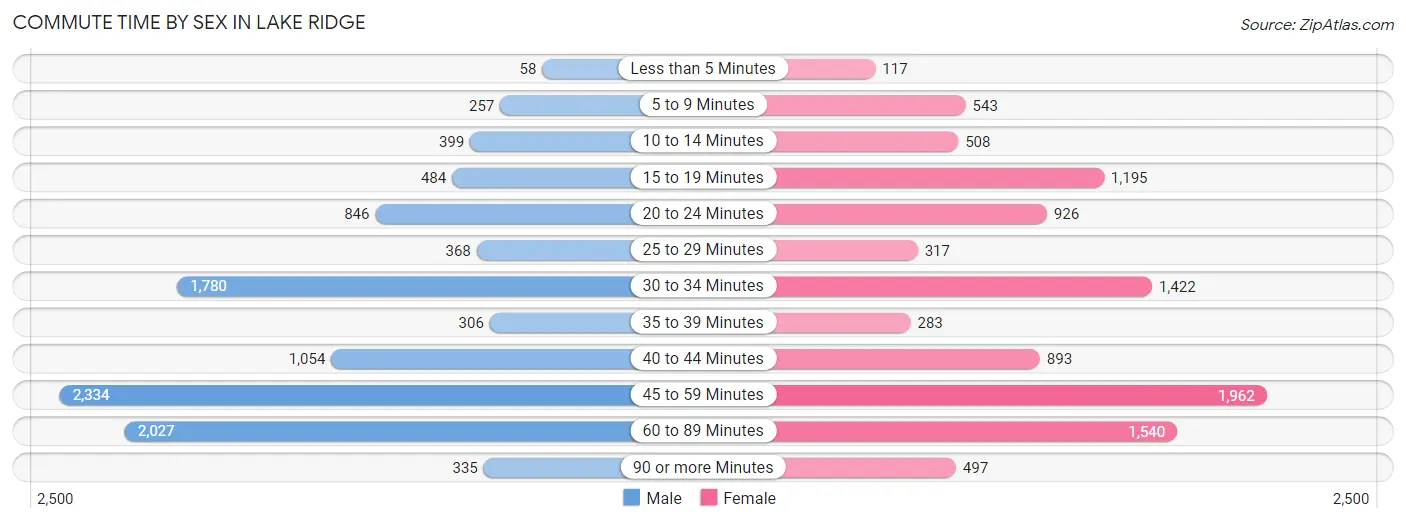
| Commute Time | Male | Female |
| Less than 5 Minutes | 58 (0.6%) | 117 (1.1%) |
| 5 to 9 Minutes | 257 (2.5%) | 543 (5.3%) |
| 10 to 14 Minutes | 399 (3.9%) | 508 (5.0%) |
| 15 to 19 Minutes | 484 (4.7%) | 1,195 (11.7%) |
| 20 to 24 Minutes | 846 (8.3%) | 926 (9.1%) |
| 25 to 29 Minutes | 368 (3.6%) | 317 (3.1%) |
| 30 to 34 Minutes | 1,780 (17.4%) | 1,422 (13.9%) |
| 35 to 39 Minutes | 306 (3.0%) | 283 (2.8%) |
| 40 to 44 Minutes | 1,054 (10.3%) | 893 (8.7%) |
| 45 to 59 Minutes | 2,334 (22.8%) | 1,962 (19.2%) |
| 60 to 89 Minutes | 2,027 (19.8%) | 1,540 (15.1%) |
| 90 or more Minutes | 335 (3.3%) | 497 (4.9%) |
Time of Departure to Work by Sex in Lake Ridge
The most frequent times of departure to work in Lake Ridge are 7:00 AM to 7:29 AM (1,371, 13.4%) for males and 7:00 AM to 7:29 AM (1,430, 14.0%) for females.
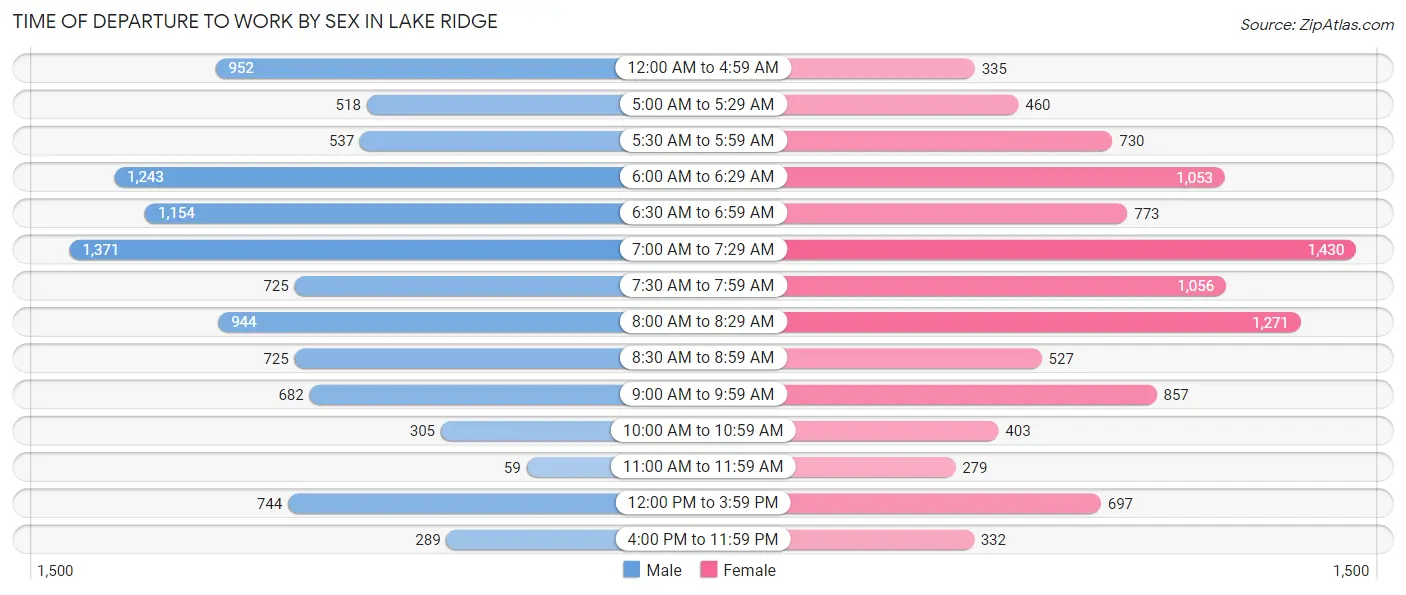
| Time of Departure | Male | Female |
| 12:00 AM to 4:59 AM | 952 (9.3%) | 335 (3.3%) |
| 5:00 AM to 5:29 AM | 518 (5.1%) | 460 (4.5%) |
| 5:30 AM to 5:59 AM | 537 (5.2%) | 730 (7.1%) |
| 6:00 AM to 6:29 AM | 1,243 (12.1%) | 1,053 (10.3%) |
| 6:30 AM to 6:59 AM | 1,154 (11.3%) | 773 (7.6%) |
| 7:00 AM to 7:29 AM | 1,371 (13.4%) | 1,430 (14.0%) |
| 7:30 AM to 7:59 AM | 725 (7.1%) | 1,056 (10.3%) |
| 8:00 AM to 8:29 AM | 944 (9.2%) | 1,271 (12.5%) |
| 8:30 AM to 8:59 AM | 725 (7.1%) | 527 (5.2%) |
| 9:00 AM to 9:59 AM | 682 (6.7%) | 857 (8.4%) |
| 10:00 AM to 10:59 AM | 305 (3.0%) | 403 (4.0%) |
| 11:00 AM to 11:59 AM | 59 (0.6%) | 279 (2.7%) |
| 12:00 PM to 3:59 PM | 744 (7.3%) | 697 (6.8%) |
| 4:00 PM to 11:59 PM | 289 (2.8%) | 332 (3.3%) |
| Total | 10,248 (100.0%) | 10,203 (100.0%) |
Housing Occupancy in Lake Ridge
Occupancy by Ownership in Lake Ridge
Of the total 15,687 dwellings in Lake Ridge, owner-occupied units account for 11,791 (75.2%), while renter-occupied units make up 3,896 (24.8%).
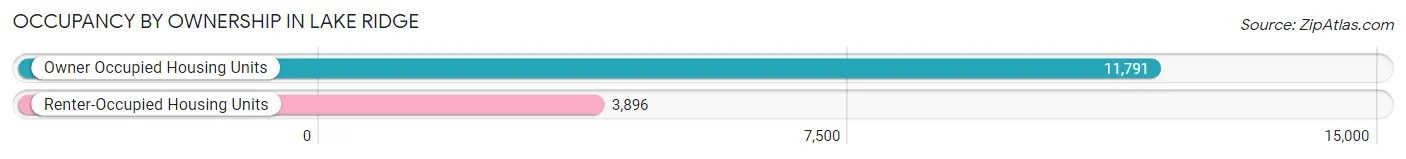
| Occupancy | # Housing Units | % Housing Units |
| Owner Occupied Housing Units | 11,791 | 75.2% |
| Renter-Occupied Housing Units | 3,896 | 24.8% |
| Total Occupied Housing Units | 15,687 | 100.0% |
Occupancy by Household Size in Lake Ridge
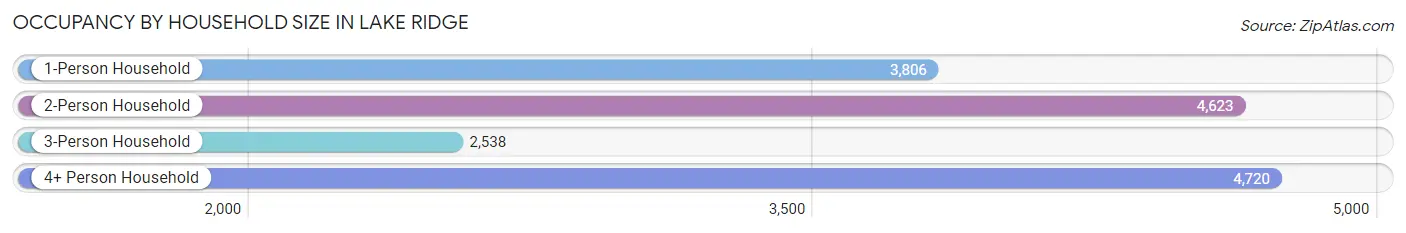
| Household Size | # Housing Units | % Housing Units |
| 1-Person Household | 3,806 | 24.3% |
| 2-Person Household | 4,623 | 29.5% |
| 3-Person Household | 2,538 | 16.2% |
| 4+ Person Household | 4,720 | 30.1% |
| Total Housing Units | 15,687 | 100.0% |
Occupancy by Ownership by Household Size in Lake Ridge
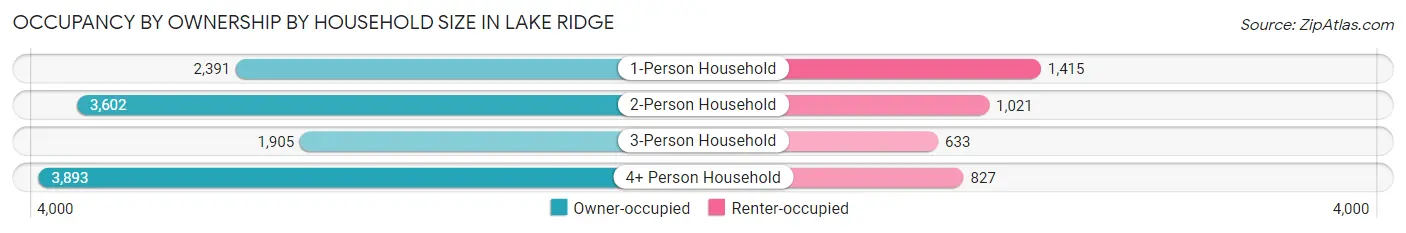
| Household Size | Owner-occupied | Renter-occupied |
| 1-Person Household | 2,391 (62.8%) | 1,415 (37.2%) |
| 2-Person Household | 3,602 (77.9%) | 1,021 (22.1%) |
| 3-Person Household | 1,905 (75.1%) | 633 (24.9%) |
| 4+ Person Household | 3,893 (82.5%) | 827 (17.5%) |
| Total Housing Units | 11,791 (75.2%) | 3,896 (24.8%) |
Occupancy by Educational Attainment in Lake Ridge
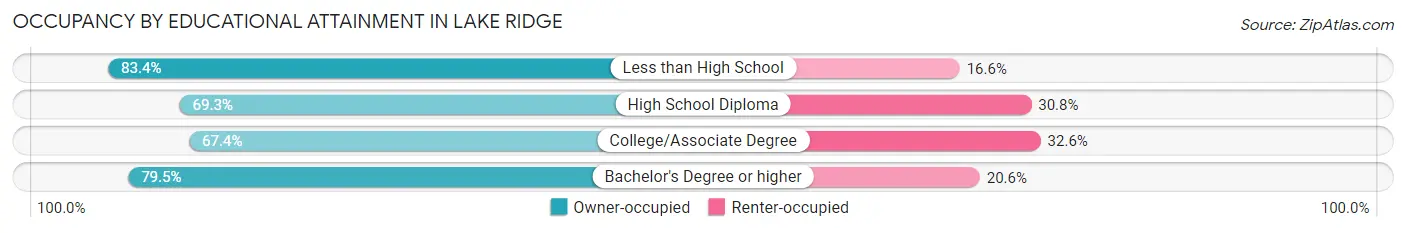
| Household Size | Owner-occupied | Renter-occupied |
| Less than High School | 700 (83.4%) | 139 (16.6%) |
| High School Diploma | 1,450 (69.3%) | 644 (30.7%) |
| College/Associate Degree | 2,749 (67.4%) | 1,330 (32.6%) |
| Bachelor's Degree or higher | 6,892 (79.4%) | 1,783 (20.5%) |
Occupancy by Age of Householder in Lake Ridge
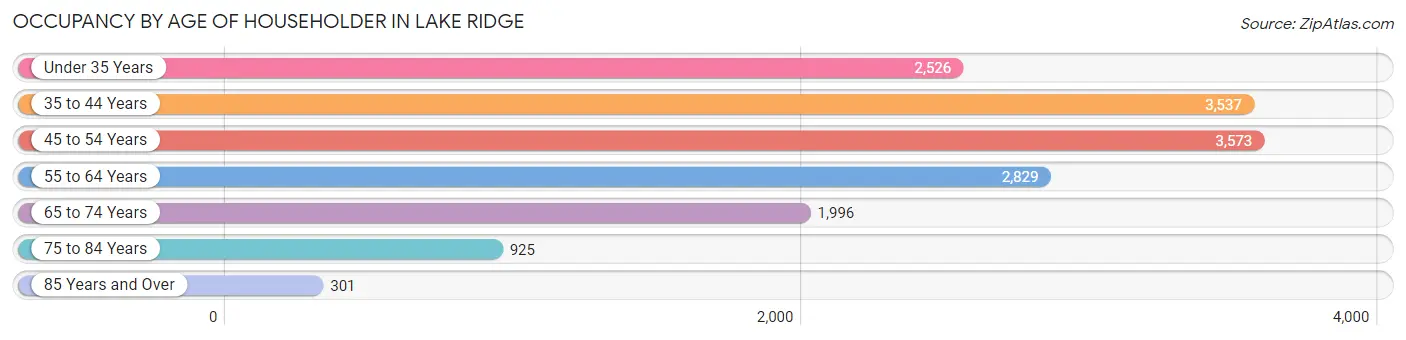
| Age Bracket | # Households | % Households |
| Under 35 Years | 2,526 | 16.1% |
| 35 to 44 Years | 3,537 | 22.6% |
| 45 to 54 Years | 3,573 | 22.8% |
| 55 to 64 Years | 2,829 | 18.0% |
| 65 to 74 Years | 1,996 | 12.7% |
| 75 to 84 Years | 925 | 5.9% |
| 85 Years and Over | 301 | 1.9% |
| Total | 15,687 | 100.0% |
Housing Finances in Lake Ridge
Median Income by Occupancy in Lake Ridge
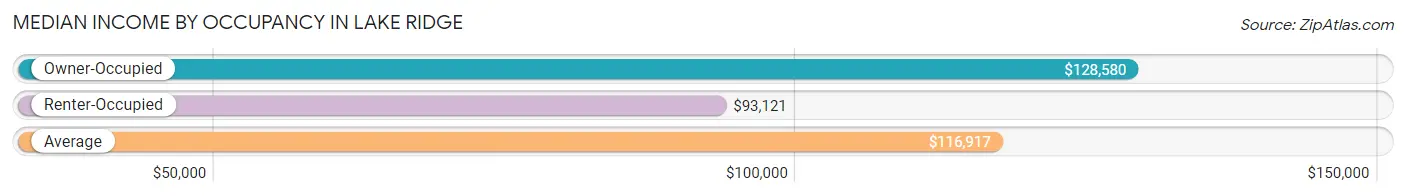
| Occupancy Type | # Households | Median Income |
| Owner-Occupied | 11,791 (75.2%) | $128,580 |
| Renter-Occupied | 3,896 (24.8%) | $93,121 |
| Average | 15,687 (100.0%) | $116,917 |
Occupancy by Householder Income Bracket in Lake Ridge
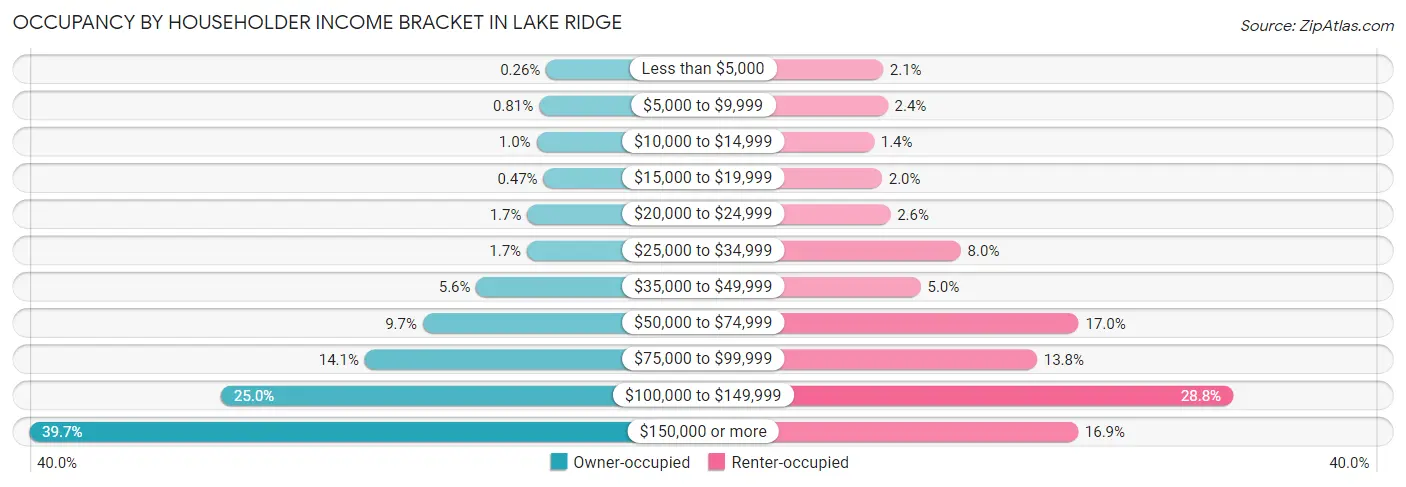
| Income Bracket | Owner-occupied | Renter-occupied |
| Less than $5,000 | 31 (0.3%) | 81 (2.1%) |
| $5,000 to $9,999 | 96 (0.8%) | 95 (2.4%) |
| $10,000 to $14,999 | 118 (1.0%) | 54 (1.4%) |
| $15,000 to $19,999 | 56 (0.5%) | 78 (2.0%) |
| $20,000 to $24,999 | 201 (1.7%) | 103 (2.6%) |
| $25,000 to $34,999 | 204 (1.7%) | 312 (8.0%) |
| $35,000 to $49,999 | 658 (5.6%) | 193 (5.0%) |
| $50,000 to $74,999 | 1,139 (9.7%) | 662 (17.0%) |
| $75,000 to $99,999 | 1,660 (14.1%) | 538 (13.8%) |
| $100,000 to $149,999 | 2,953 (25.0%) | 1,120 (28.7%) |
| $150,000 or more | 4,675 (39.7%) | 660 (16.9%) |
| Total | 11,791 (100.0%) | 3,896 (100.0%) |
Monthly Housing Cost Tiers in Lake Ridge
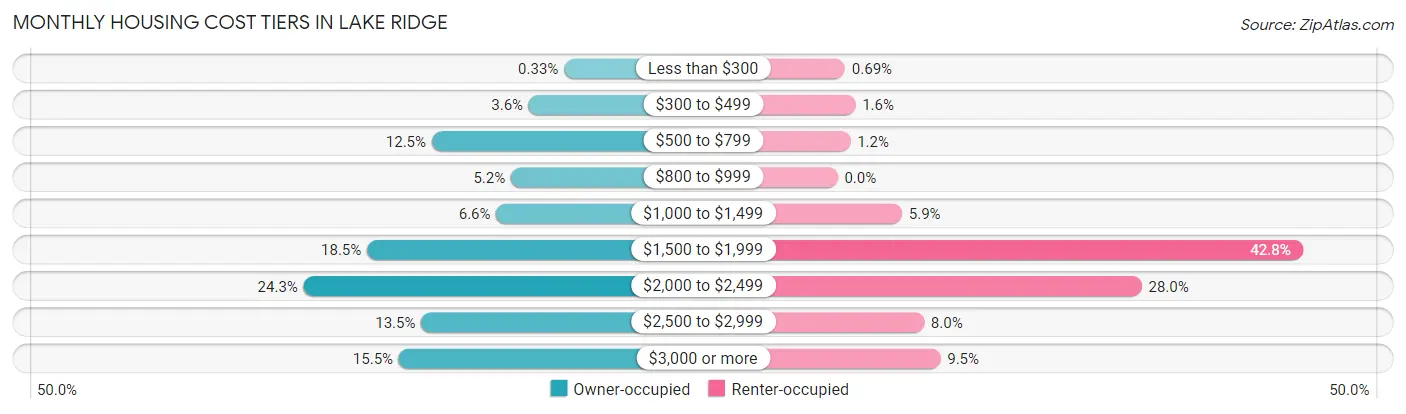
| Monthly Cost | Owner-occupied | Renter-occupied |
| Less than $300 | 39 (0.3%) | 27 (0.7%) |
| $300 to $499 | 421 (3.6%) | 64 (1.6%) |
| $500 to $799 | 1,475 (12.5%) | 46 (1.2%) |
| $800 to $999 | 615 (5.2%) | 0 (0.0%) |
| $1,000 to $1,499 | 775 (6.6%) | 231 (5.9%) |
| $1,500 to $1,999 | 2,178 (18.5%) | 1,668 (42.8%) |
| $2,000 to $2,499 | 2,866 (24.3%) | 1,091 (28.0%) |
| $2,500 to $2,999 | 1,590 (13.5%) | 310 (8.0%) |
| $3,000 or more | 1,832 (15.5%) | 369 (9.5%) |
| Total | 11,791 (100.0%) | 3,896 (100.0%) |
Physical Housing Characteristics in Lake Ridge
Housing Structures in Lake Ridge
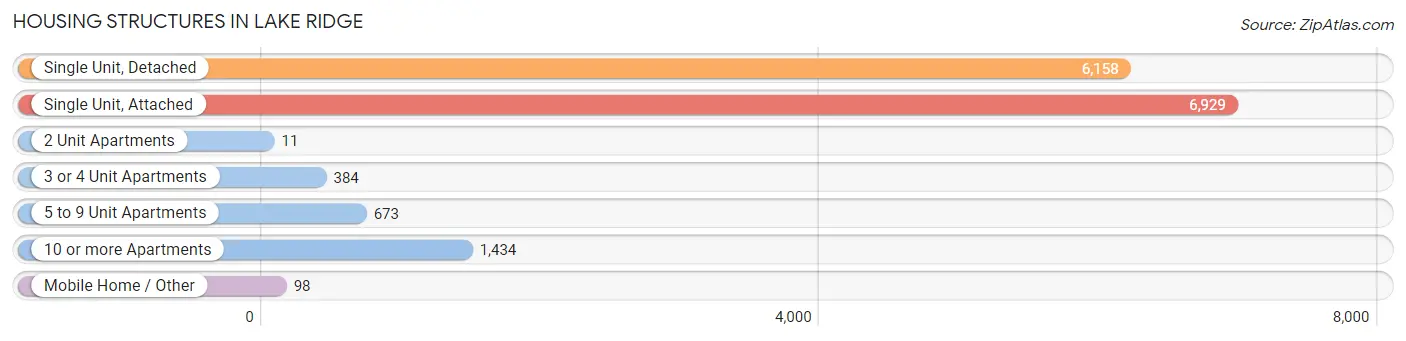
| Structure Type | # Housing Units | % Housing Units |
| Single Unit, Detached | 6,158 | 39.3% |
| Single Unit, Attached | 6,929 | 44.2% |
| 2 Unit Apartments | 11 | 0.1% |
| 3 or 4 Unit Apartments | 384 | 2.5% |
| 5 to 9 Unit Apartments | 673 | 4.3% |
| 10 or more Apartments | 1,434 | 9.1% |
| Mobile Home / Other | 98 | 0.6% |
| Total | 15,687 | 100.0% |
Housing Structures by Occupancy in Lake Ridge
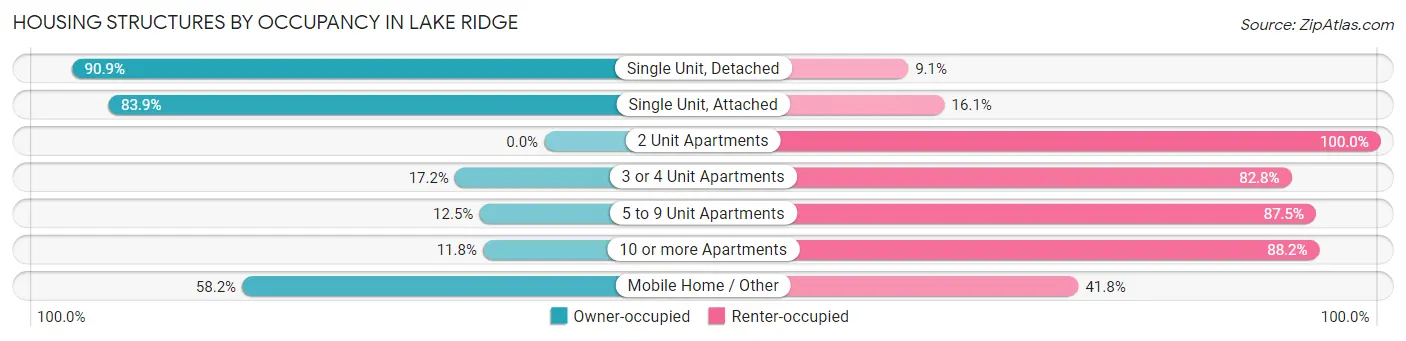
| Structure Type | Owner-occupied | Renter-occupied |
| Single Unit, Detached | 5,600 (90.9%) | 558 (9.1%) |
| Single Unit, Attached | 5,815 (83.9%) | 1,114 (16.1%) |
| 2 Unit Apartments | 0 (0.0%) | 11 (100.0%) |
| 3 or 4 Unit Apartments | 66 (17.2%) | 318 (82.8%) |
| 5 to 9 Unit Apartments | 84 (12.5%) | 589 (87.5%) |
| 10 or more Apartments | 169 (11.8%) | 1,265 (88.2%) |
| Mobile Home / Other | 57 (58.2%) | 41 (41.8%) |
| Total | 11,791 (75.2%) | 3,896 (24.8%) |
Housing Structures by Number of Rooms in Lake Ridge
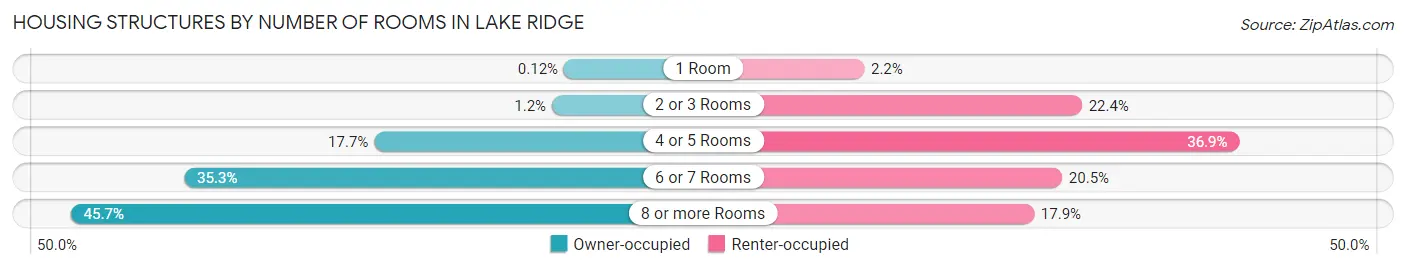
| Number of Rooms | Owner-occupied | Renter-occupied |
| 1 Room | 14 (0.1%) | 87 (2.2%) |
| 2 or 3 Rooms | 145 (1.2%) | 871 (22.4%) |
| 4 or 5 Rooms | 2,083 (17.7%) | 1,439 (36.9%) |
| 6 or 7 Rooms | 4,156 (35.2%) | 800 (20.5%) |
| 8 or more Rooms | 5,393 (45.7%) | 699 (17.9%) |
| Total | 11,791 (100.0%) | 3,896 (100.0%) |
Housing Structure by Heating Type in Lake Ridge
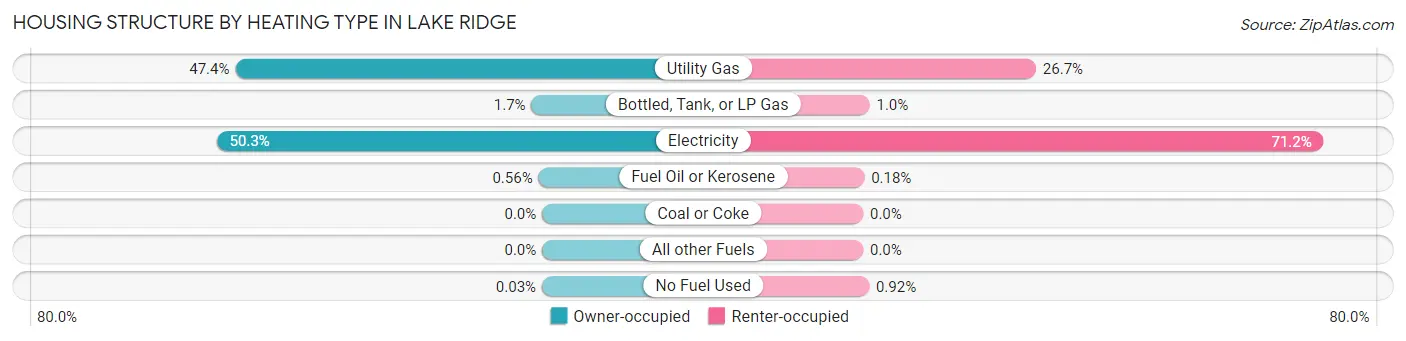
| Heating Type | Owner-occupied | Renter-occupied |
| Utility Gas | 5,593 (47.4%) | 1,041 (26.7%) |
| Bottled, Tank, or LP Gas | 194 (1.7%) | 39 (1.0%) |
| Electricity | 5,935 (50.3%) | 2,773 (71.2%) |
| Fuel Oil or Kerosene | 66 (0.6%) | 7 (0.2%) |
| Coal or Coke | 0 (0.0%) | 0 (0.0%) |
| All other Fuels | 0 (0.0%) | 0 (0.0%) |
| No Fuel Used | 3 (0.0%) | 36 (0.9%) |
| Total | 11,791 (100.0%) | 3,896 (100.0%) |
Household Vehicle Usage in Lake Ridge
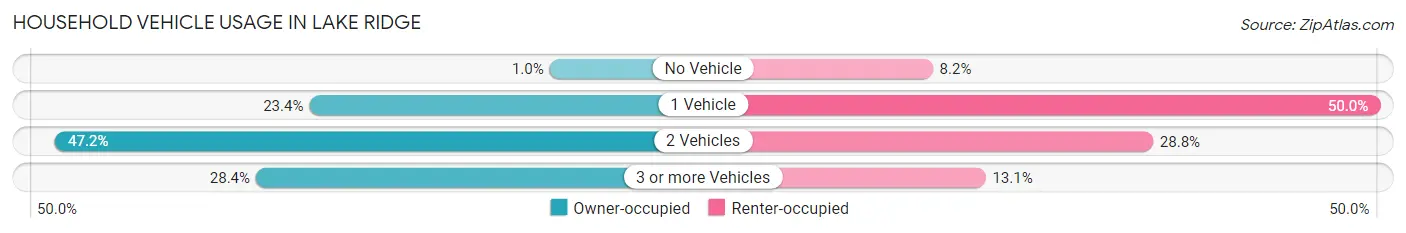
| Vehicles per Household | Owner-occupied | Renter-occupied |
| No Vehicle | 118 (1.0%) | 319 (8.2%) |
| 1 Vehicle | 2,763 (23.4%) | 1,946 (49.9%) |
| 2 Vehicles | 5,560 (47.1%) | 1,120 (28.7%) |
| 3 or more Vehicles | 3,350 (28.4%) | 511 (13.1%) |
| Total | 11,791 (100.0%) | 3,896 (100.0%) |
Real Estate & Mortgages in Lake Ridge
Real Estate and Mortgage Overview in Lake Ridge
| Characteristic | Without Mortgage | With Mortgage |
| Housing Units | 2,524 | 9,267 |
| Median Property Value | $400,400 | $417,900 |
| Median Household Income | $105,573 | $3,829 |
| Monthly Housing Costs | $699 | $1,832 |
| Real Estate Taxes | $4,475 | $427 |
Property Value by Mortgage Status in Lake Ridge
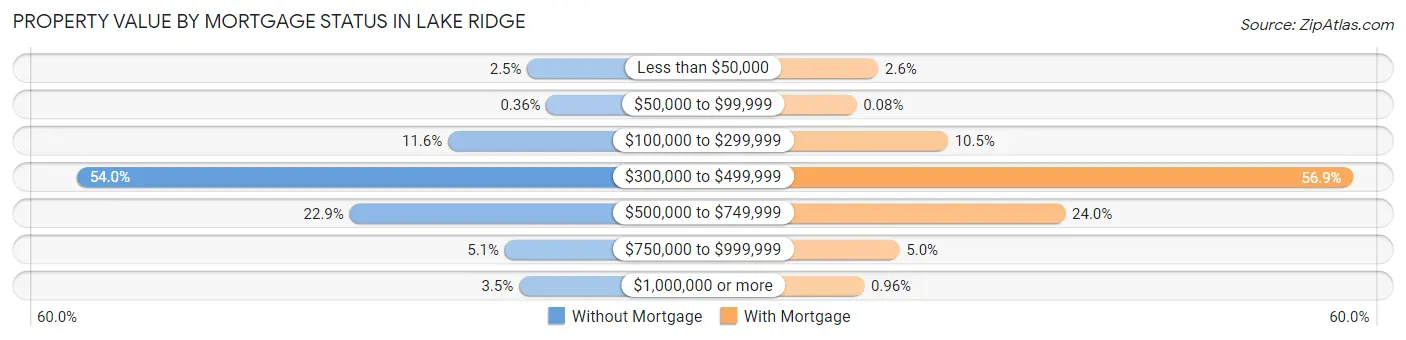
| Property Value | Without Mortgage | With Mortgage |
| Less than $50,000 | 64 (2.5%) | 239 (2.6%) |
| $50,000 to $99,999 | 9 (0.4%) | 7 (0.1%) |
| $100,000 to $299,999 | 293 (11.6%) | 976 (10.5%) |
| $300,000 to $499,999 | 1,364 (54.0%) | 5,273 (56.9%) |
| $500,000 to $749,999 | 577 (22.9%) | 2,219 (23.9%) |
| $750,000 to $999,999 | 129 (5.1%) | 464 (5.0%) |
| $1,000,000 or more | 88 (3.5%) | 89 (1.0%) |
| Total | 2,524 (100.0%) | 9,267 (100.0%) |
Household Income by Mortgage Status in Lake Ridge
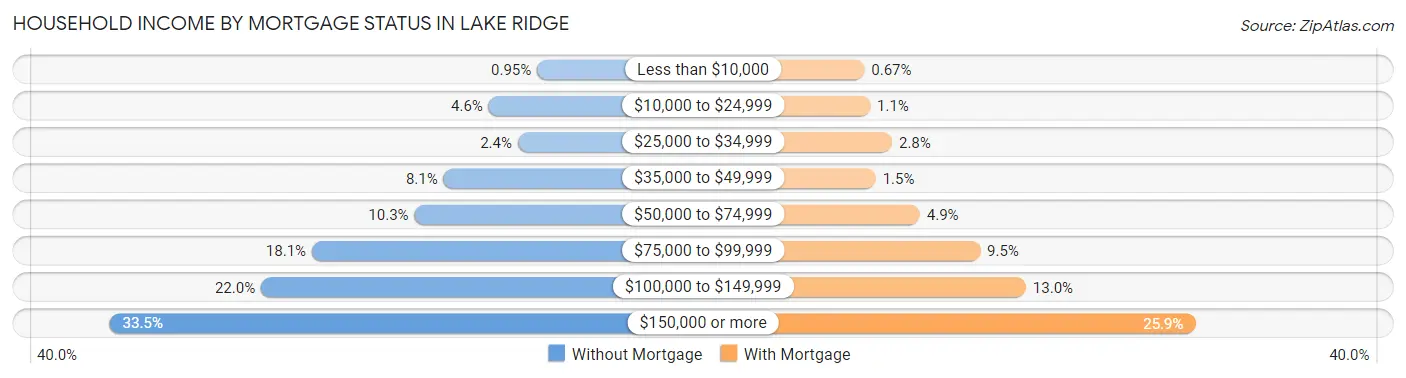
| Household Income | Without Mortgage | With Mortgage |
| Less than $10,000 | 24 (0.9%) | 62 (0.7%) |
| $10,000 to $24,999 | 117 (4.6%) | 103 (1.1%) |
| $25,000 to $34,999 | 61 (2.4%) | 258 (2.8%) |
| $35,000 to $49,999 | 204 (8.1%) | 143 (1.5%) |
| $50,000 to $74,999 | 260 (10.3%) | 454 (4.9%) |
| $75,000 to $99,999 | 457 (18.1%) | 879 (9.5%) |
| $100,000 to $149,999 | 555 (22.0%) | 1,203 (13.0%) |
| $150,000 or more | 846 (33.5%) | 2,398 (25.9%) |
| Total | 2,524 (100.0%) | 9,267 (100.0%) |
Property Value to Household Income Ratio in Lake Ridge
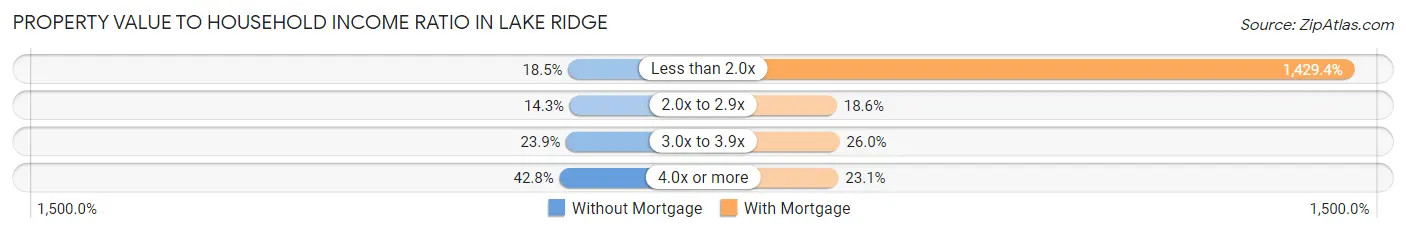
| Value-to-Income Ratio | Without Mortgage | With Mortgage |
| Less than 2.0x | 467 (18.5%) | 132,463 (1,429.4%) |
| 2.0x to 2.9x | 362 (14.3%) | 1,726 (18.6%) |
| 3.0x to 3.9x | 603 (23.9%) | 2,407 (26.0%) |
| 4.0x or more | 1,081 (42.8%) | 2,143 (23.1%) |
| Total | 2,524 (100.0%) | 9,267 (100.0%) |
Real Estate Taxes by Mortgage Status in Lake Ridge
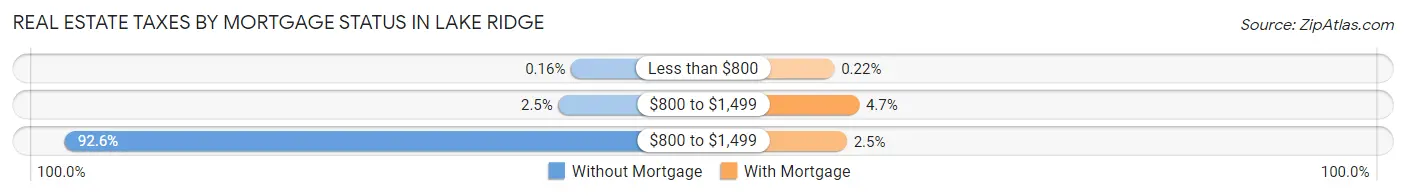
| Property Taxes | Without Mortgage | With Mortgage |
| Less than $800 | 4 (0.2%) | 20 (0.2%) |
| $800 to $1,499 | 62 (2.5%) | 439 (4.7%) |
| $800 to $1,499 | 2,338 (92.6%) | 232 (2.5%) |
| Total | 2,524 (100.0%) | 9,267 (100.0%) |
Health & Disability in Lake Ridge
Health Insurance Coverage by Age in Lake Ridge
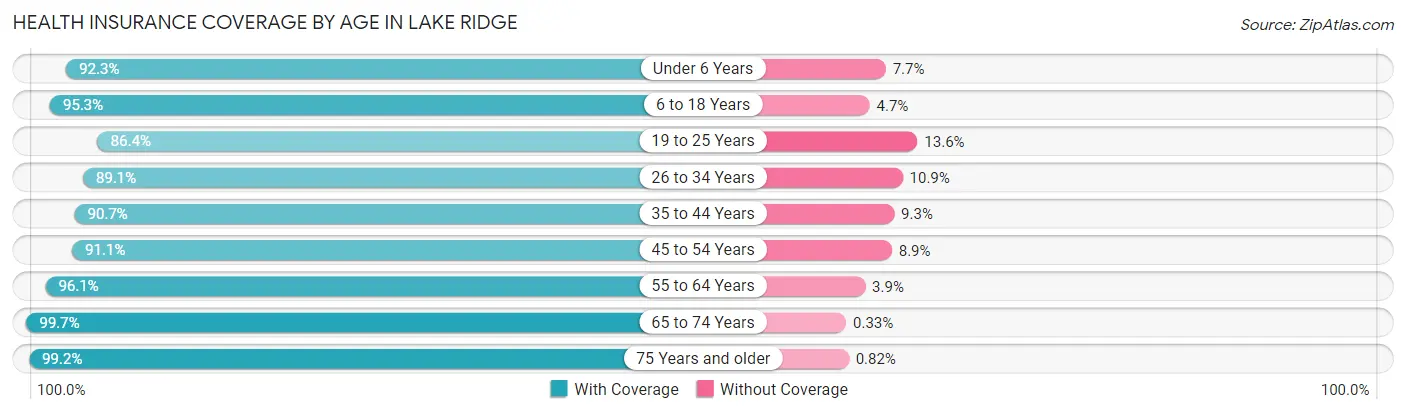
| Age Bracket | With Coverage | Without Coverage |
| Under 6 Years | 2,985 (92.3%) | 250 (7.7%) |
| 6 to 18 Years | 8,051 (95.3%) | 399 (4.7%) |
| 19 to 25 Years | 3,429 (86.4%) | 541 (13.6%) |
| 26 to 34 Years | 4,461 (89.1%) | 544 (10.9%) |
| 35 to 44 Years | 5,816 (90.7%) | 596 (9.3%) |
| 45 to 54 Years | 5,599 (91.1%) | 544 (8.9%) |
| 55 to 64 Years | 4,941 (96.1%) | 200 (3.9%) |
| 65 to 74 Years | 3,586 (99.7%) | 12 (0.3%) |
| 75 Years and older | 1,943 (99.2%) | 16 (0.8%) |
| Total | 40,811 (92.9%) | 3,102 (7.1%) |
Health Insurance Coverage by Citizenship Status in Lake Ridge
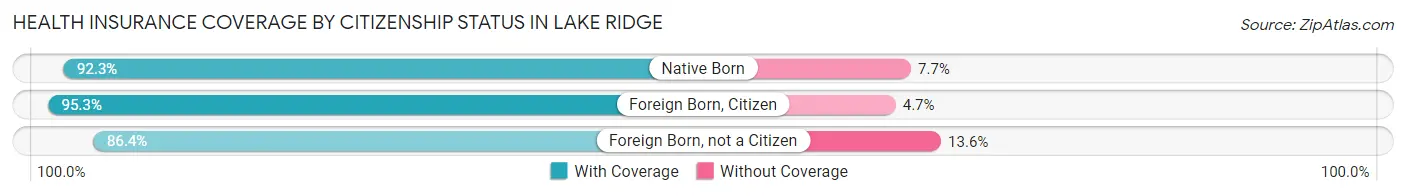
| Citizenship Status | With Coverage | Without Coverage |
| Native Born | 2,985 (92.3%) | 250 (7.7%) |
| Foreign Born, Citizen | 8,051 (95.3%) | 399 (4.7%) |
| Foreign Born, not a Citizen | 3,429 (86.4%) | 541 (13.6%) |
Health Insurance Coverage by Household Income in Lake Ridge
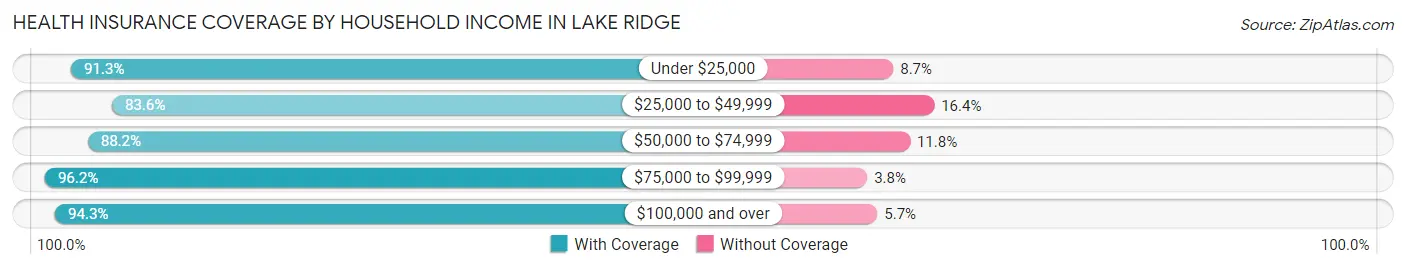
| Household Income | With Coverage | Without Coverage |
| Under $25,000 | 1,677 (91.3%) | 160 (8.7%) |
| $25,000 to $49,999 | 2,935 (83.6%) | 575 (16.4%) |
| $50,000 to $74,999 | 3,648 (88.2%) | 490 (11.8%) |
| $75,000 to $99,999 | 4,823 (96.2%) | 192 (3.8%) |
| $100,000 and over | 27,725 (94.3%) | 1,685 (5.7%) |
Public vs Private Health Insurance Coverage by Age in Lake Ridge
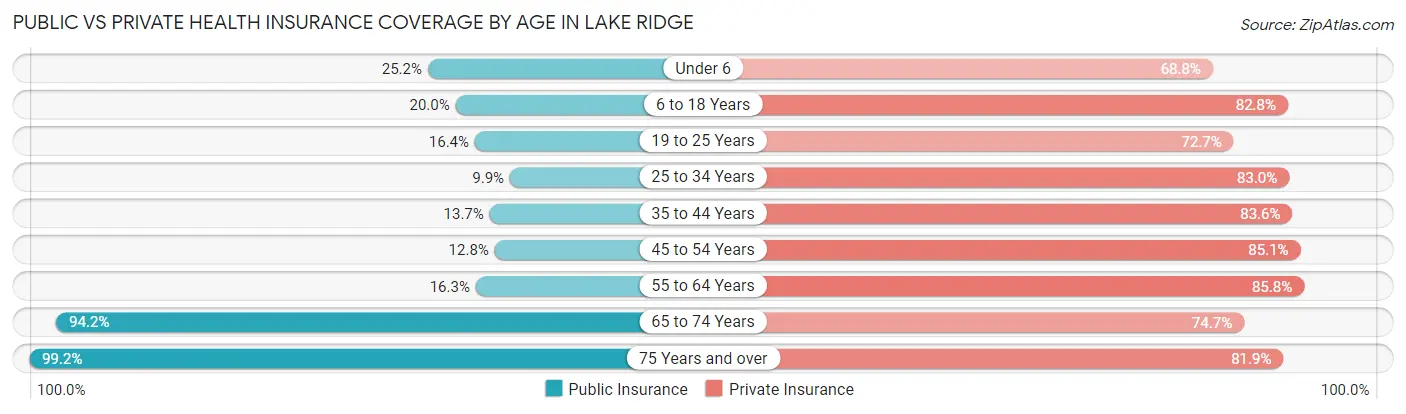
| Age Bracket | Public Insurance | Private Insurance |
| Under 6 | 814 (25.2%) | 2,227 (68.8%) |
| 6 to 18 Years | 1,691 (20.0%) | 6,994 (82.8%) |
| 19 to 25 Years | 652 (16.4%) | 2,887 (72.7%) |
| 25 to 34 Years | 496 (9.9%) | 4,155 (83.0%) |
| 35 to 44 Years | 878 (13.7%) | 5,362 (83.6%) |
| 45 to 54 Years | 783 (12.8%) | 5,229 (85.1%) |
| 55 to 64 Years | 836 (16.3%) | 4,410 (85.8%) |
| 65 to 74 Years | 3,388 (94.2%) | 2,686 (74.7%) |
| 75 Years and over | 1,943 (99.2%) | 1,605 (81.9%) |
| Total | 11,481 (26.1%) | 35,555 (81.0%) |
Disability Status by Sex by Age in Lake Ridge
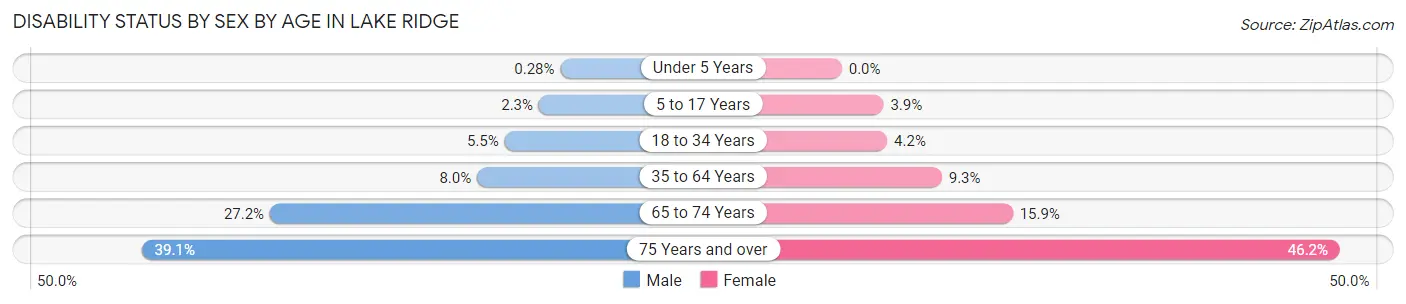
| Age Bracket | Male | Female |
| Under 5 Years | 4 (0.3%) | 0 (0.0%) |
| 5 to 17 Years | 97 (2.3%) | 155 (3.9%) |
| 18 to 34 Years | 226 (5.4%) | 233 (4.2%) |
| 35 to 64 Years | 655 (8.0%) | 883 (9.3%) |
| 65 to 74 Years | 425 (27.2%) | 323 (15.9%) |
| 75 Years and over | 301 (39.1%) | 550 (46.2%) |
Disability Class by Sex by Age in Lake Ridge
Disability Class: Hearing Difficulty
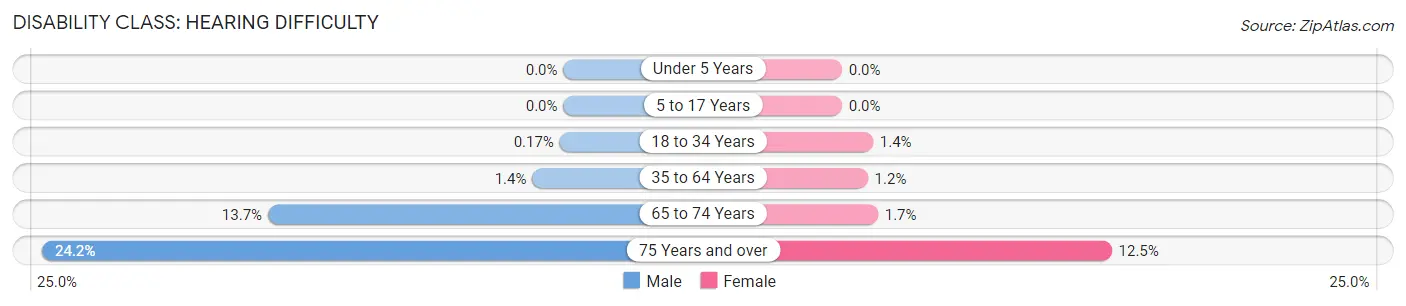
| Age Bracket | Male | Female |
| Under 5 Years | 0 (0.0%) | 0 (0.0%) |
| 5 to 17 Years | 0 (0.0%) | 0 (0.0%) |
| 18 to 34 Years | 7 (0.2%) | 80 (1.4%) |
| 35 to 64 Years | 118 (1.4%) | 114 (1.2%) |
| 65 to 74 Years | 214 (13.7%) | 34 (1.7%) |
| 75 Years and over | 186 (24.2%) | 149 (12.5%) |
Disability Class: Vision Difficulty
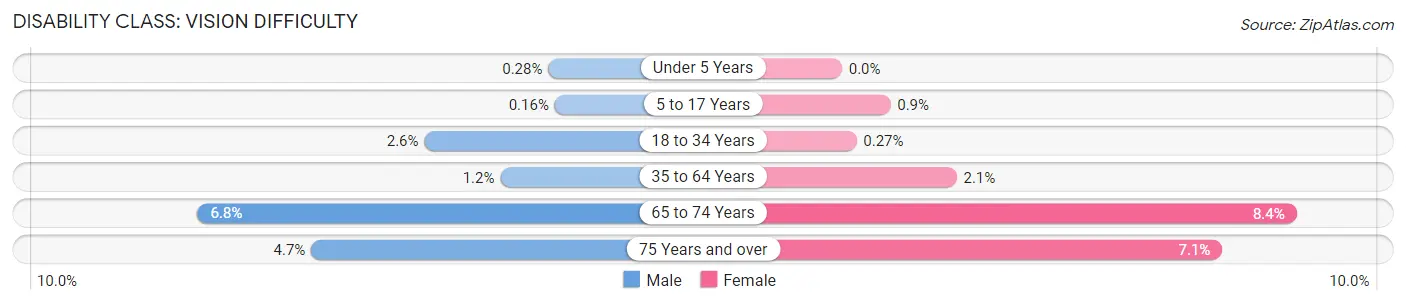
| Age Bracket | Male | Female |
| Under 5 Years | 4 (0.3%) | 0 (0.0%) |
| 5 to 17 Years | 7 (0.2%) | 36 (0.9%) |
| 18 to 34 Years | 107 (2.6%) | 15 (0.3%) |
| 35 to 64 Years | 96 (1.2%) | 203 (2.1%) |
| 65 to 74 Years | 106 (6.8%) | 172 (8.4%) |
| 75 Years and over | 36 (4.7%) | 84 (7.1%) |
Disability Class: Cognitive Difficulty
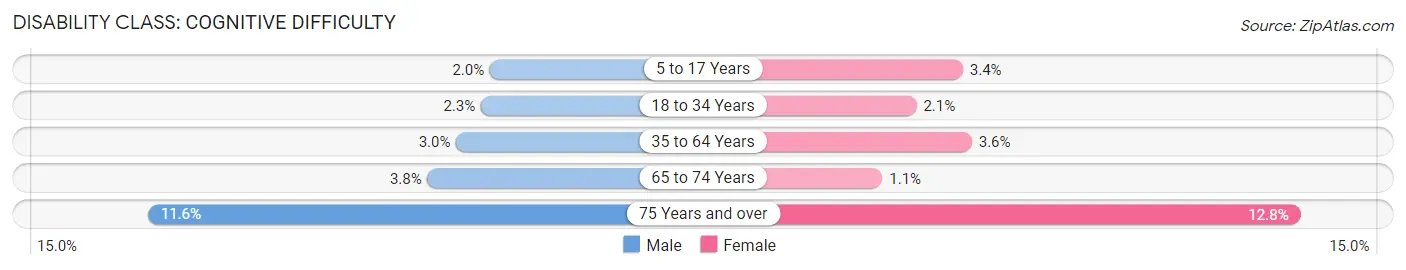
| Age Bracket | Male | Female |
| 5 to 17 Years | 87 (2.0%) | 135 (3.4%) |
| 18 to 34 Years | 95 (2.3%) | 115 (2.1%) |
| 35 to 64 Years | 244 (3.0%) | 344 (3.6%) |
| 65 to 74 Years | 59 (3.8%) | 23 (1.1%) |
| 75 Years and over | 89 (11.6%) | 152 (12.8%) |
Disability Class: Ambulatory Difficulty
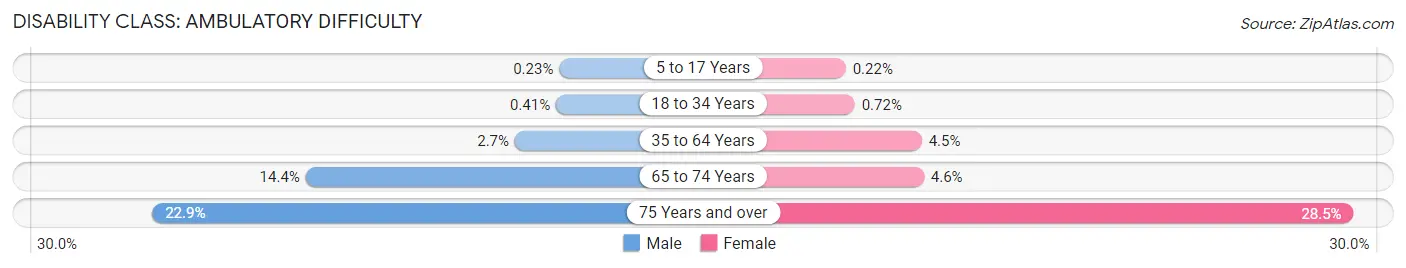
| Age Bracket | Male | Female |
| 5 to 17 Years | 10 (0.2%) | 9 (0.2%) |
| 18 to 34 Years | 17 (0.4%) | 40 (0.7%) |
| 35 to 64 Years | 221 (2.7%) | 423 (4.4%) |
| 65 to 74 Years | 224 (14.3%) | 93 (4.6%) |
| 75 Years and over | 176 (22.9%) | 339 (28.5%) |
Disability Class: Self-Care Difficulty
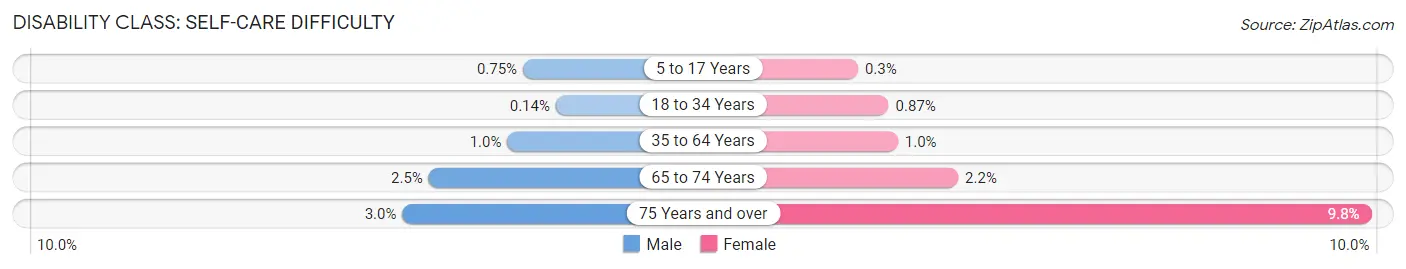
| Age Bracket | Male | Female |
| 5 to 17 Years | 32 (0.7%) | 12 (0.3%) |
| 18 to 34 Years | 6 (0.1%) | 48 (0.9%) |
| 35 to 64 Years | 85 (1.0%) | 99 (1.0%) |
| 65 to 74 Years | 39 (2.5%) | 44 (2.2%) |
| 75 Years and over | 23 (3.0%) | 117 (9.8%) |
Technology Access in Lake Ridge
Computing Device Access in Lake Ridge
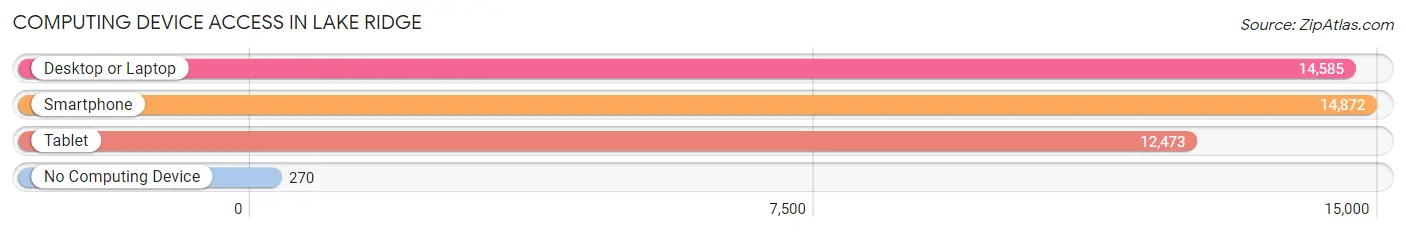
| Device Type | # Households | % Households |
| Desktop or Laptop | 14,585 | 93.0% |
| Smartphone | 14,872 | 94.8% |
| Tablet | 12,473 | 79.5% |
| No Computing Device | 270 | 1.7% |
| Total | 15,687 | 100.0% |
Internet Access in Lake Ridge
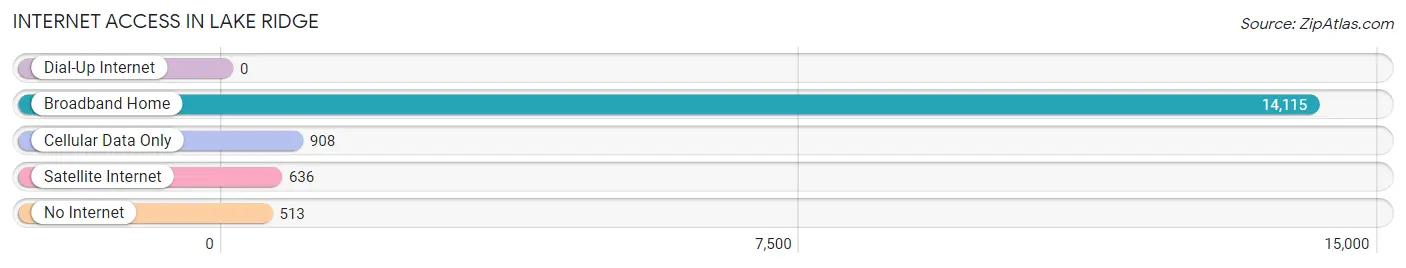
| Internet Type | # Households | % Households |
| Dial-Up Internet | 0 | 0.0% |
| Broadband Home | 14,115 | 90.0% |
| Cellular Data Only | 908 | 5.8% |
| Satellite Internet | 636 | 4.1% |
| No Internet | 513 | 3.3% |
| Total | 15,687 | 100.0% |
Lake Ridge Summary
History
Lake Ridge is an unincorporated community located in Prince William County, Virginia. It is situated on the Occoquan Reservoir, which is part of the Potomac River watershed. The community was established in the late 1960s and early 1970s as a planned community. It was developed by the Lake Ridge Associates, a partnership between the developers of the nearby planned community of Woodbridge and the Occoquan Reservoir.
The area was originally inhabited by Native Americans, including the Doeg, Piscataway, and Iroquois tribes. The first European settlers arrived in the area in the late 1600s. The area was part of the Fairfax Proprietary, a large tract of land granted to Thomas Fairfax, 6th Lord Fairfax of Cameron, by King Charles II of England in 1649. The Fairfax Proprietary included much of what is now Prince William County.
In the late 1800s, the area was home to several small farms and a few small villages. The area was largely rural until the late 1960s, when the Lake Ridge Associates began developing the area. The development was planned to include residential, commercial, and recreational areas. The first homes were built in the early 1970s, and the community has grown steadily since then.
Geography
Lake Ridge is located in Prince William County, Virginia, approximately 25 miles southwest of Washington, D.C. It is situated on the Occoquan Reservoir, which is part of the Potomac River watershed. The community is bordered by the cities of Woodbridge and Manassas to the north, and the towns of Occoquan and Dumfries to the south.
The area is mostly flat, with some rolling hills. The terrain is mostly wooded, with some open fields. The climate is temperate, with hot, humid summers and mild winters.
Economy
The economy of Lake Ridge is largely based on the service industry. The community is home to several large employers, including the U.S. Department of Defense, the U.S. Department of Homeland Security, and the U.S. Department of Veterans Affairs. The community is also home to several retail stores, restaurants, and other businesses.
Demographics
As of the 2010 census, the population of Lake Ridge was 28,717. The racial makeup of the community was 73.3% White, 14.2% African American, 8.2% Asian, and 4.3% Hispanic or Latino. The median household income was $90,945, and the median home value was $346,000.
The majority of the population is employed in the service industry. The largest employers in the area are the U.S. Department of Defense, the U.S. Department of Homeland Security, and the U.S. Department of Veterans Affairs. The community is also home to several retail stores, restaurants, and other businesses.
Common Questions
What is Per Capita Income in Lake Ridge?
Per Capita income in Lake Ridge is $49,020.
What is the Median Family Income in Lake Ridge?
Median Family Income in Lake Ridge is $127,749.
What is the Median Household income in Lake Ridge?
Median Household Income in Lake Ridge is $116,917.
What is Income or Wage Gap in Lake Ridge?
Income or Wage Gap in Lake Ridge is 40.1%.
Women in Lake Ridge earn 59.9 cents for every dollar earned by a man.
What is Family Income Deficit in Lake Ridge?
Family Income Deficit in Lake Ridge is $10,871.
Families that are below poverty line in Lake Ridge earn $10,871 less on average than the poverty threshold level.
What is Inequality or Gini Index in Lake Ridge?
Inequality or Gini Index in Lake Ridge is 0.36.
What is the Total Population of Lake Ridge?
Total Population of Lake Ridge is 44,720.
What is the Total Male Population of Lake Ridge?
Total Male Population of Lake Ridge is 21,021.
What is the Total Female Population of Lake Ridge?
Total Female Population of Lake Ridge is 23,699.
What is the Ratio of Males per 100 Females in Lake Ridge?
There are 88.70 Males per 100 Females in Lake Ridge.
What is the Ratio of Females per 100 Males in Lake Ridge?
There are 112.74 Females per 100 Males in Lake Ridge.
What is the Median Population Age in Lake Ridge?
Median Population Age in Lake Ridge is 36.8 Years.
What is the Average Family Size in Lake Ridge
Average Family Size in Lake Ridge is 3.4 People.
What is the Average Household Size in Lake Ridge
Average Household Size in Lake Ridge is 2.9 People.
How Large is the Labor Force in Lake Ridge?
There are 25,042 People in the Labor Forcein in Lake Ridge.
What is the Percentage of People in the Labor Force in Lake Ridge?
71.2% of People are in the Labor Force in Lake Ridge.
What is the Unemployment Rate in Lake Ridge?
Unemployment Rate in Lake Ridge is 4.5%.