South Run, VA Map & Demographics
South Run Map
South Run Overview
$82,026
PER CAPITA INCOME
$250,001
AVG FAMILY INCOME
$241,786
AVG HOUSEHOLD INCOME
43.6%
WAGE / INCOME GAP [ % ]
56.4¢/ $1
WAGE / INCOME GAP [ $ ]
0.34
INEQUALITY / GINI INDEX
6,940
TOTAL POPULATION
3,838
MALE POPULATION
3,102
FEMALE POPULATION
123.73
MALES / 100 FEMALES
80.82
FEMALES / 100 MALES
39.7
MEDIAN AGE
3.4
AVG FAMILY SIZE
3.3
AVG HOUSEHOLD SIZE
3,241
LABOR FORCE [ PEOPLE ]
65.6%
PERCENT IN LABOR FORCE
3.4%
UNEMPLOYMENT RATE
Income in South Run
Income Overview in South Run
Per Capita Income in South Run is $82,026, while median incomes of families and households are $250,001 and $241,786 respectively.
| Characteristic | Number | Measure |
| Per Capita Income | 6,940 | $82,026 |
| Median Family Income | 1,952 | $250,001 |
| Mean Family Income | 1,952 | $277,336 |
| Median Household Income | 2,098 | $241,786 |
| Mean Household Income | 2,098 | $268,769 |
| Income Deficit | 1,952 | $0 |
| Wage / Income Gap (%) | 6,940 | 43.60% |
| Wage / Income Gap ($) | 6,940 | 56.40¢ per $1 |
| Gini / Inequality Index | 6,940 | 0.34 |
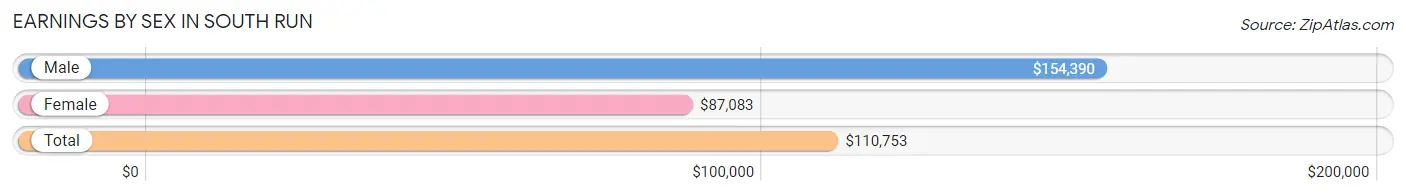
Earnings by Sex in South Run
Average Earnings in South Run are $110,753, $154,390 for men and $87,083 for women, a difference of 43.6%.
| Sex | Number | Average Earnings |
| Male | 1,825 (54.1%) | $154,390 |
| Female | 1,551 (45.9%) | $87,083 |
| Total | 3,376 (100.0%) | $110,753 |
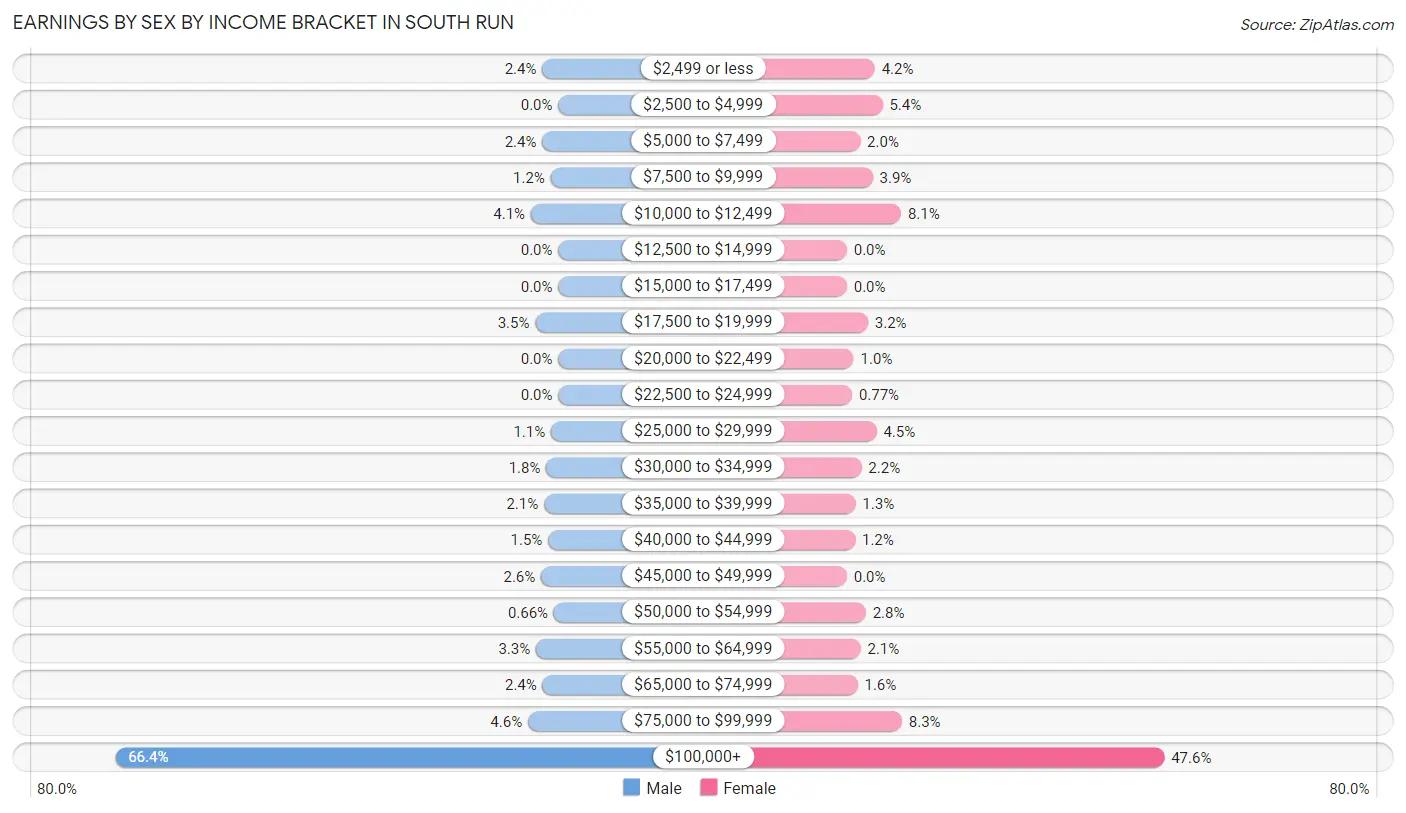
Earnings by Sex by Income Bracket in South Run
The most common earnings brackets in South Run are $100,000+ for men (1,212 | 66.4%) and $100,000+ for women (738 | 47.6%).
| Income | Male | Female |
| $2,499 or less | 44 (2.4%) | 65 (4.2%) |
| $2,500 to $4,999 | 0 (0.0%) | 83 (5.3%) |
| $5,000 to $7,499 | 44 (2.4%) | 31 (2.0%) |
| $7,500 to $9,999 | 21 (1.1%) | 60 (3.9%) |
| $10,000 to $12,499 | 75 (4.1%) | 126 (8.1%) |
| $12,500 to $14,999 | 0 (0.0%) | 0 (0.0%) |
| $15,000 to $17,499 | 0 (0.0%) | 0 (0.0%) |
| $17,500 to $19,999 | 63 (3.5%) | 49 (3.2%) |
| $20,000 to $22,499 | 0 (0.0%) | 16 (1.0%) |
| $22,500 to $24,999 | 0 (0.0%) | 12 (0.8%) |
| $25,000 to $29,999 | 20 (1.1%) | 69 (4.4%) |
| $30,000 to $34,999 | 33 (1.8%) | 34 (2.2%) |
| $35,000 to $39,999 | 39 (2.1%) | 20 (1.3%) |
| $40,000 to $44,999 | 28 (1.5%) | 19 (1.2%) |
| $45,000 to $49,999 | 47 (2.6%) | 0 (0.0%) |
| $50,000 to $54,999 | 12 (0.7%) | 44 (2.8%) |
| $55,000 to $64,999 | 61 (3.3%) | 32 (2.1%) |
| $65,000 to $74,999 | 43 (2.4%) | 25 (1.6%) |
| $75,000 to $99,999 | 83 (4.5%) | 128 (8.3%) |
| $100,000+ | 1,212 (66.4%) | 738 (47.6%) |
| Total | 1,825 (100.0%) | 1,551 (100.0%) |
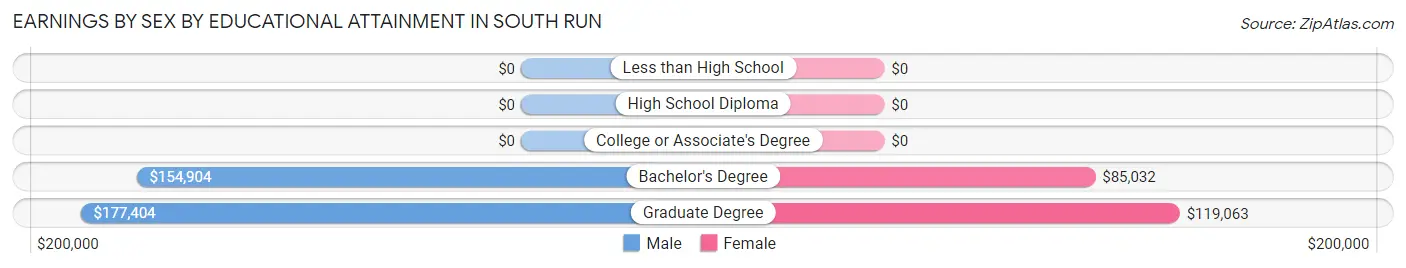
Earnings by Sex by Educational Attainment in South Run
Average earnings in South Run are $165,833 for men and $102,100 for women, a difference of 38.4%. Men with an educational attainment of graduate degree enjoy the highest average annual earnings of $177,404, while those with bachelor's degree education earn the least with $154,904. Women with an educational attainment of graduate degree earn the most with the average annual earnings of $119,063, while those with bachelor's degree education have the smallest earnings of $85,032.
| Educational Attainment | Male Income | Female Income |
| Less than High School | - | - |
| High School Diploma | - | - |
| College or Associate's Degree | - | - |
| Bachelor's Degree | $154,904 | $85,032 |
| Graduate Degree | $177,404 | $119,063 |
| Total | $165,833 | $102,100 |
Family Income in South Run
Family Income Brackets in South Run
According to the South Run family income data, there are 1,212 families falling into the $200,000+ income range, which is the most common income bracket and makes up 62.1% of all families.
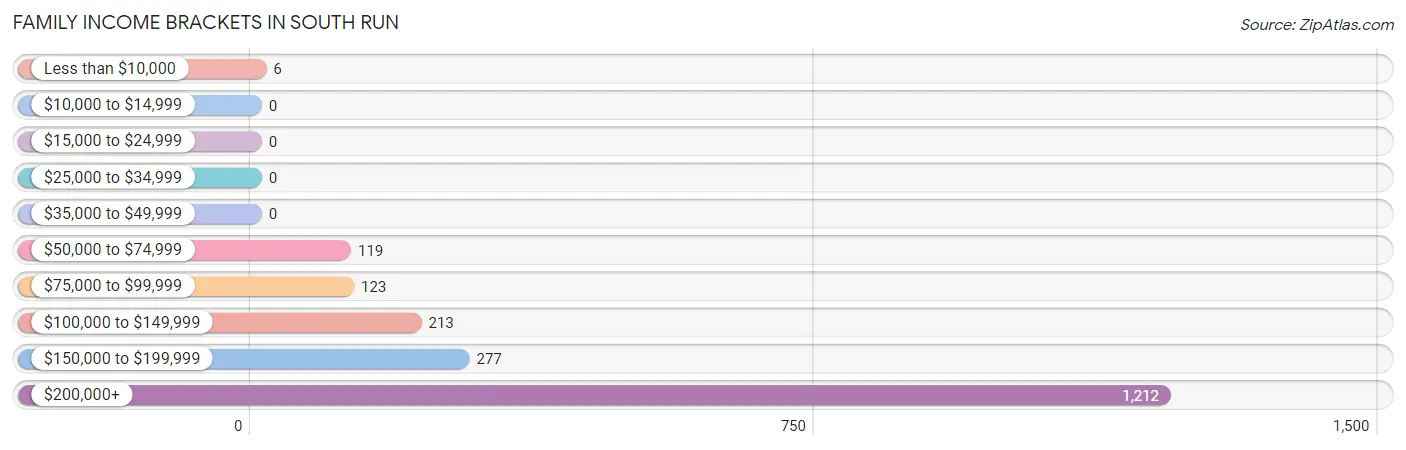
| Income Bracket | # Families | % Families |
| Less than $10,000 | 6 | 0.3% |
| $10,000 to $14,999 | 0 | 0.0% |
| $15,000 to $24,999 | 0 | 0.0% |
| $25,000 to $34,999 | 0 | 0.0% |
| $35,000 to $49,999 | 0 | 0.0% |
| $50,000 to $74,999 | 119 | 6.1% |
| $75,000 to $99,999 | 123 | 6.3% |
| $100,000 to $149,999 | 213 | 10.9% |
| $150,000 to $199,999 | 277 | 14.2% |
| $200,000+ | 1,212 | 62.1% |
Family Income by Famaliy Size in South Run
4-person families (505 | 25.9%) account for the highest median family income in South Run with $250,001 per family, while 2-person families (774 | 39.7%) have the highest median income of $103,793 per family member.
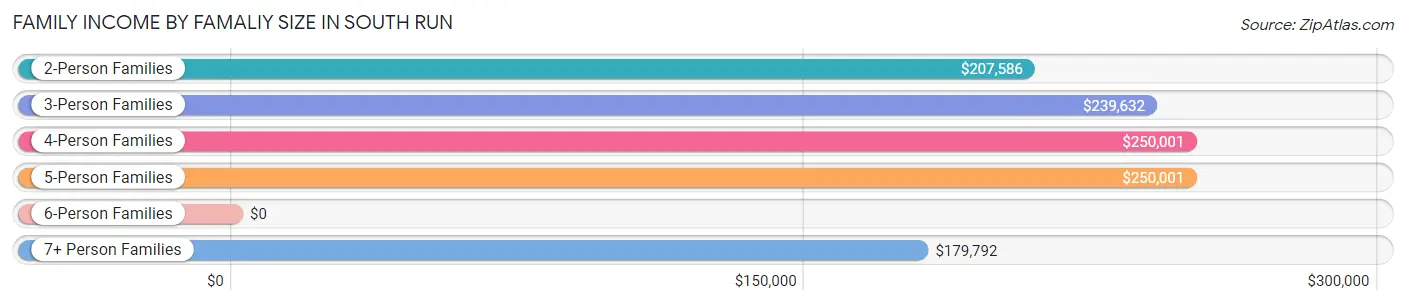
| Income Bracket | # Families | Median Income |
| 2-Person Families | 774 (39.7%) | $207,586 |
| 3-Person Families | 459 (23.5%) | $239,632 |
| 4-Person Families | 505 (25.9%) | $250,001 |
| 5-Person Families | 128 (6.6%) | $250,001 |
| 6-Person Families | 42 (2.1%) | $0 |
| 7+ Person Families | 44 (2.2%) | $179,792 |
| Total | 1,952 (100.0%) | $250,001 |
Family Income by Number of Earners in South Run
The median family income in South Run is $250,001, with families comprising 2 earners (1,020) having the highest median family income of $250,001, while families with no earners (316) have the lowest median family income of $139,038, accounting for 52.2% and 16.2% of families, respectively.
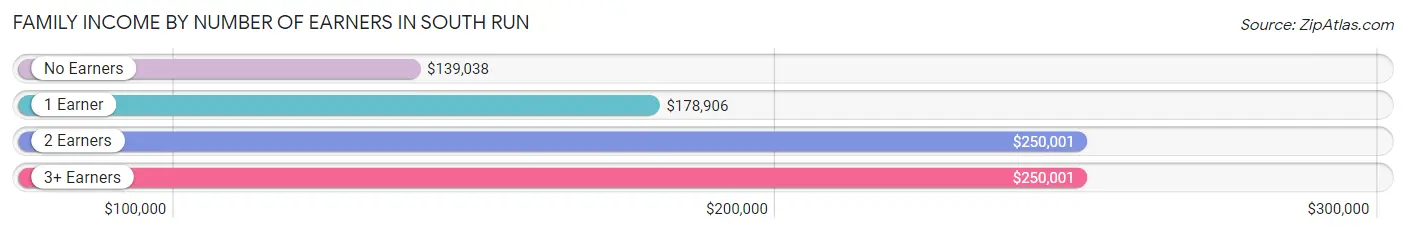
| Number of Earners | # Families | Median Income |
| No Earners | 316 (16.2%) | $139,038 |
| 1 Earner | 403 (20.6%) | $178,906 |
| 2 Earners | 1,020 (52.2%) | $250,001 |
| 3+ Earners | 213 (10.9%) | $250,001 |
| Total | 1,952 (100.0%) | $250,001 |
Household Income in South Run
Household Income Brackets in South Run
With 1,248 households falling in the category, the $200,000+ income range is the most frequent in South Run, accounting for 59.5% of all households.
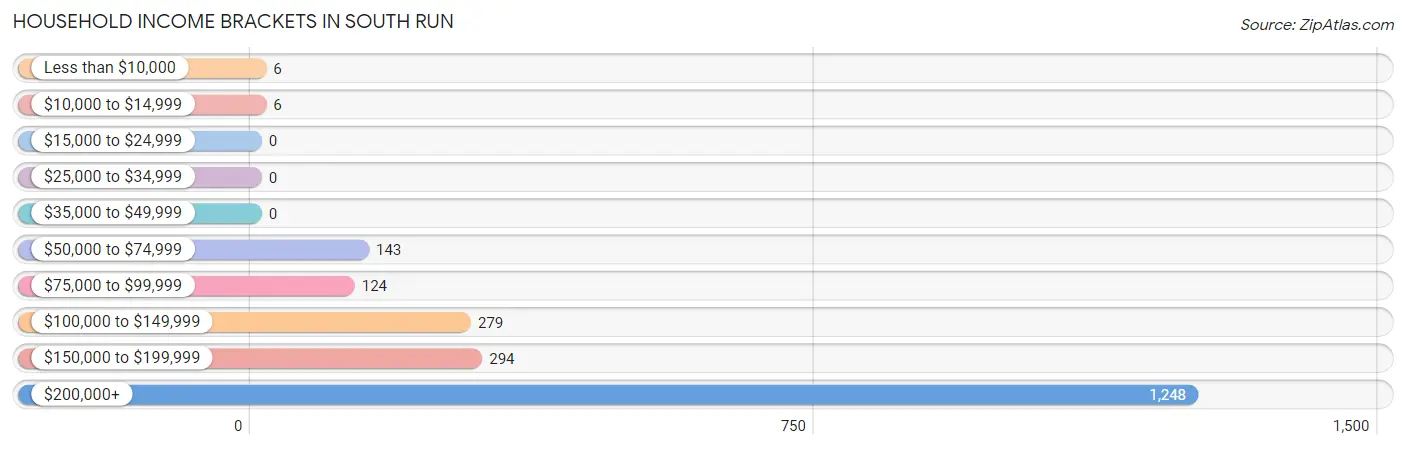
| Income Bracket | # Households | % Households |
| Less than $10,000 | 6 | 0.3% |
| $10,000 to $14,999 | 6 | 0.3% |
| $15,000 to $24,999 | 0 | 0.0% |
| $25,000 to $34,999 | 0 | 0.0% |
| $35,000 to $49,999 | 0 | 0.0% |
| $50,000 to $74,999 | 143 | 6.8% |
| $75,000 to $99,999 | 124 | 5.9% |
| $100,000 to $149,999 | 279 | 13.3% |
| $150,000 to $199,999 | 294 | 14.0% |
| $200,000+ | 1,248 | 59.5% |
Household Income by Householder Age in South Run
The median household income in South Run is $241,786, with the highest median household income of $250,001 found in the 25 to 44 years age bracket for the primary householder. A total of 504 households (24.0%) fall into this category.
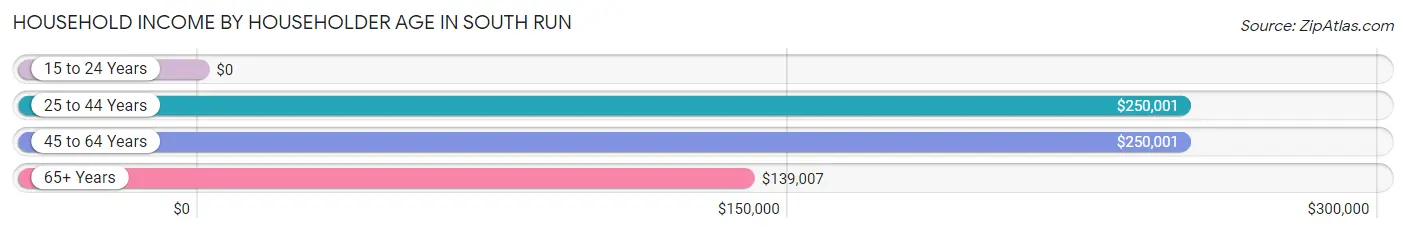
| Income Bracket | # Households | Median Income |
| 15 to 24 Years | 0 (0.0%) | $0 |
| 25 to 44 Years | 504 (24.0%) | $250,001 |
| 45 to 64 Years | 898 (42.8%) | $250,001 |
| 65+ Years | 696 (33.2%) | $139,007 |
| Total | 2,098 (100.0%) | $241,786 |
Poverty in South Run
Income Below Poverty by Sex and Age in South Run
With 0.3% poverty level for males and 1.5% for females among the residents of South Run, 75 year old and over males and 25 to 34 year old females are the most vulnerable to poverty, with 6 males (2.4%) and 41 females (12.6%) in their respective age groups living below the poverty level.
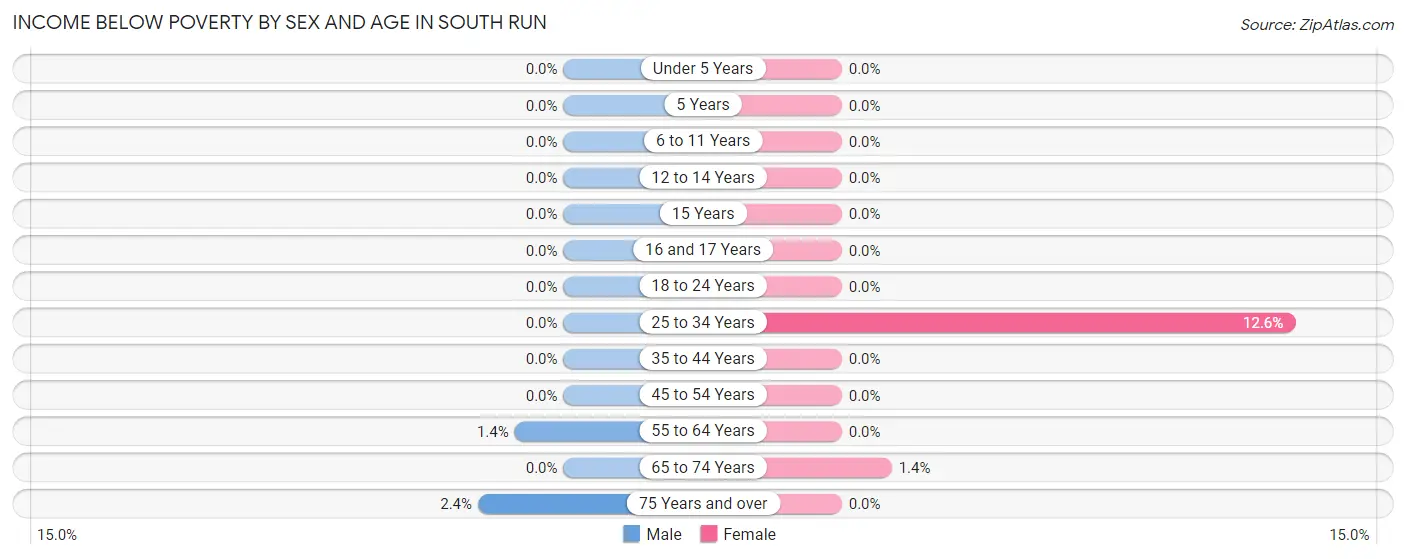
| Age Bracket | Male | Female |
| Under 5 Years | 0 (0.0%) | 0 (0.0%) |
| 5 Years | 0 (0.0%) | 0 (0.0%) |
| 6 to 11 Years | 0 (0.0%) | 0 (0.0%) |
| 12 to 14 Years | 0 (0.0%) | 0 (0.0%) |
| 15 Years | 0 (0.0%) | 0 (0.0%) |
| 16 and 17 Years | 0 (0.0%) | 0 (0.0%) |
| 18 to 24 Years | 0 (0.0%) | 0 (0.0%) |
| 25 to 34 Years | 0 (0.0%) | 41 (12.6%) |
| 35 to 44 Years | 0 (0.0%) | 0 (0.0%) |
| 45 to 54 Years | 0 (0.0%) | 0 (0.0%) |
| 55 to 64 Years | 5 (1.4%) | 0 (0.0%) |
| 65 to 74 Years | 0 (0.0%) | 6 (1.4%) |
| 75 Years and over | 6 (2.4%) | 0 (0.0%) |
| Total | 11 (0.3%) | 47 (1.5%) |
Income Above Poverty by Sex and Age in South Run
According to the poverty statistics in South Run, males aged under 5 years and females aged under 5 years are the age groups that are most secure financially, with 100.0% of males and 100.0% of females in these age groups living above the poverty line.
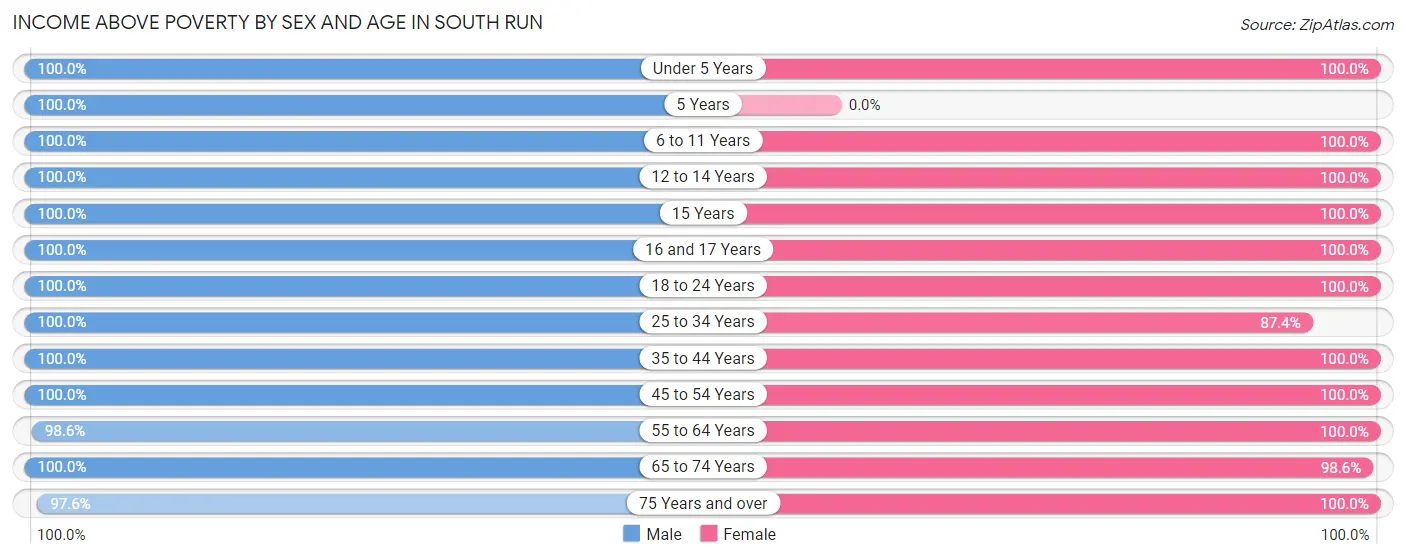
| Age Bracket | Male | Female |
| Under 5 Years | 792 (100.0%) | 121 (100.0%) |
| 5 Years | 97 (100.0%) | 0 (0.0%) |
| 6 to 11 Years | 305 (100.0%) | 275 (100.0%) |
| 12 to 14 Years | 155 (100.0%) | 198 (100.0%) |
| 15 Years | 38 (100.0%) | 19 (100.0%) |
| 16 and 17 Years | 53 (100.0%) | 19 (100.0%) |
| 18 to 24 Years | 344 (100.0%) | 170 (100.0%) |
| 25 to 34 Years | 213 (100.0%) | 284 (87.4%) |
| 35 to 44 Years | 354 (100.0%) | 442 (100.0%) |
| 45 to 54 Years | 527 (100.0%) | 404 (100.0%) |
| 55 to 64 Years | 363 (98.6%) | 491 (100.0%) |
| 65 to 74 Years | 340 (100.0%) | 427 (98.6%) |
| 75 Years and over | 246 (97.6%) | 205 (100.0%) |
| Total | 3,827 (99.7%) | 3,055 (98.5%) |
Income Below Poverty Among Married-Couple Families in South Run
The poverty statistics for married-couple families in South Run show that 0.3% or 6 of the total 1,765 families live below the poverty line. Families with no children have the highest poverty rate of 0.6%, comprising of 6 families. On the other hand, families with 1 or 2 children have the lowest poverty rate of 0.0%, which includes 0 families.
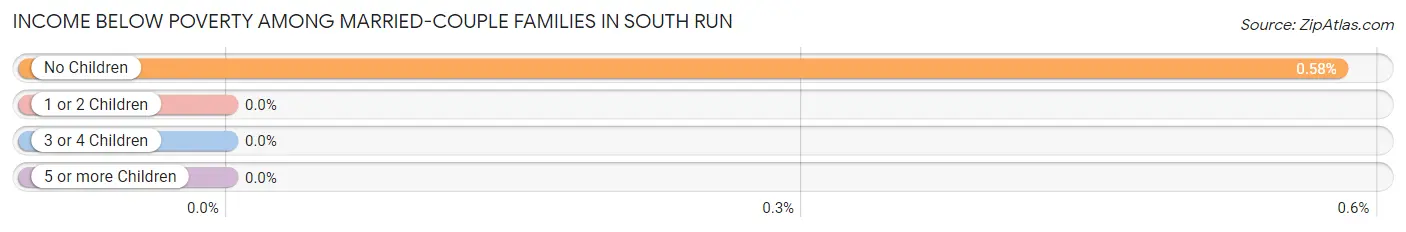
| Children | Above Poverty | Below Poverty |
| No Children | 1,026 (99.4%) | 6 (0.6%) |
| 1 or 2 Children | 560 (100.0%) | 0 (0.0%) |
| 3 or 4 Children | 149 (100.0%) | 0 (0.0%) |
| 5 or more Children | 24 (100.0%) | 0 (0.0%) |
| Total | 1,759 (99.7%) | 6 (0.3%) |
Income Below Poverty Among Single-Parent Households in South Run
| Children | Single Father | Single Mother |
| No Children | 0 (0.0%) | 0 (0.0%) |
| 1 or 2 Children | 0 (0.0%) | 0 (0.0%) |
| 3 or 4 Children | 0 (0.0%) | 0 (0.0%) |
| 5 or more Children | 0 (0.0%) | 0 (0.0%) |
| Total | 0 (0.0%) | 0 (0.0%) |
Income Below Poverty Among Married-Couple vs Single-Parent Households in South Run
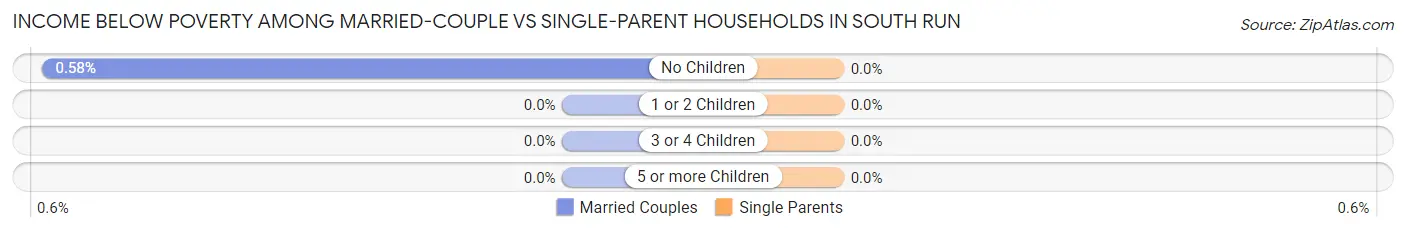
| Children | Married-Couple Families | Single-Parent Households |
| No Children | 6 (0.6%) | 0 (0.0%) |
| 1 or 2 Children | 0 (0.0%) | 0 (0.0%) |
| 3 or 4 Children | 0 (0.0%) | 0 (0.0%) |
| 5 or more Children | 0 (0.0%) | 0 (0.0%) |
| Total | 6 (0.3%) | 0 (0.0%) |
Race in South Run
The most populous races in South Run are White / Caucasian (4,392 | 63.3%), Asian (1,581 | 22.8%), and Two or more Races (566 | 8.2%).
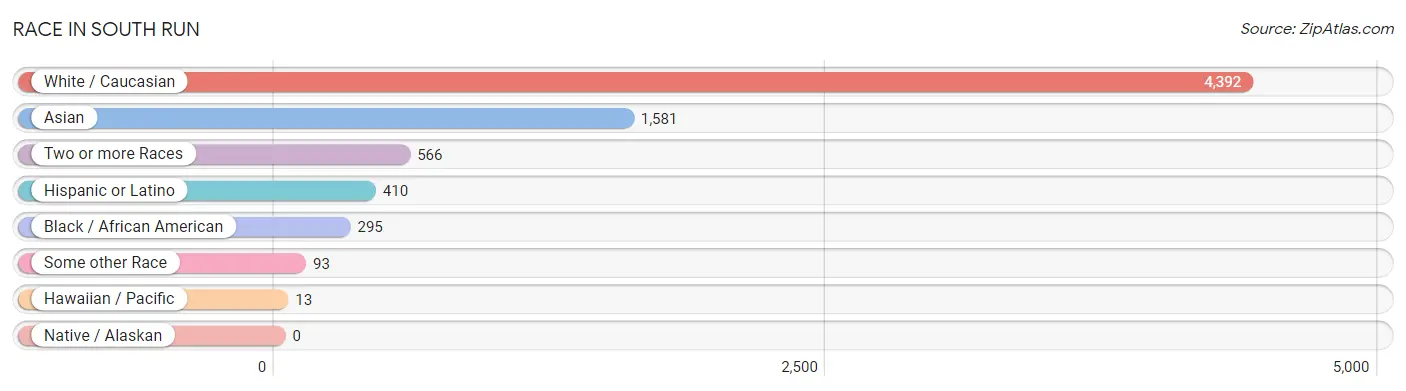
| Race | # Population | % Population |
| Asian | 1,581 | 22.8% |
| Black / African American | 295 | 4.3% |
| Hawaiian / Pacific | 13 | 0.2% |
| Hispanic or Latino | 410 | 5.9% |
| Native / Alaskan | 0 | 0.0% |
| White / Caucasian | 4,392 | 63.3% |
| Two or more Races | 566 | 8.2% |
| Some other Race | 93 | 1.3% |
| Total | 6,940 | 100.0% |
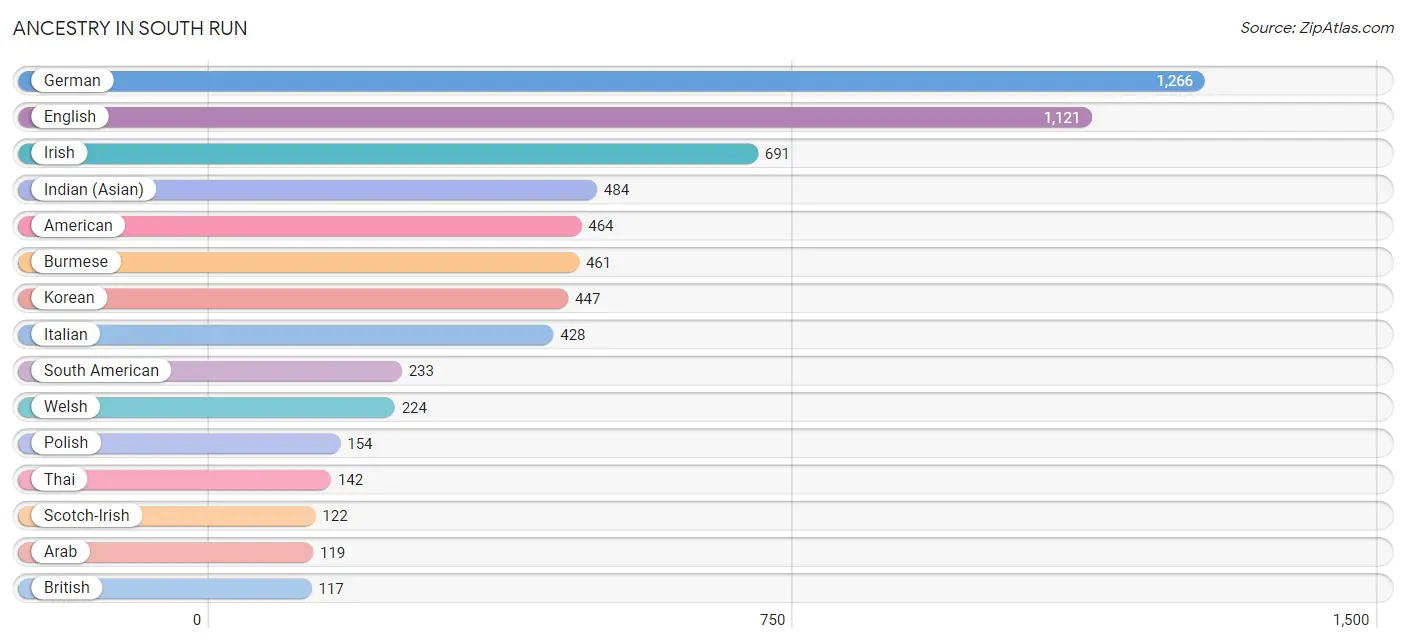
Ancestry in South Run
The most populous ancestries reported in South Run are German (1,266 | 18.2%), English (1,121 | 16.2%), Irish (691 | 10.0%), Indian (Asian) (484 | 7.0%), and American (464 | 6.7%), together accounting for 58.0% of all South Run residents.
| Ancestry | # Population | % Population |
| Afghan | 112 | 1.6% |
| American | 464 | 6.7% |
| Arab | 119 | 1.7% |
| Armenian | 18 | 0.3% |
| Australian | 3 | 0.0% |
| Austrian | 26 | 0.4% |
| Belgian | 8 | 0.1% |
| Bhutanese | 77 | 1.1% |
| Bolivian | 68 | 1.0% |
| Brazilian | 36 | 0.5% |
| British | 117 | 1.7% |
| Burmese | 461 | 6.6% |
| Canadian | 106 | 1.5% |
| Central American | 12 | 0.2% |
| Cherokee | 24 | 0.4% |
| Chilean | 41 | 0.6% |
| Colombian | 41 | 0.6% |
| Croatian | 8 | 0.1% |
| Cuban | 66 | 0.9% |
| Czech | 55 | 0.8% |
| Danish | 23 | 0.3% |
| Dutch | 80 | 1.1% |
| Eastern European | 18 | 0.3% |
| Ecuadorian | 53 | 0.8% |
| Egyptian | 27 | 0.4% |
| English | 1,121 | 16.2% |
| Ethiopian | 19 | 0.3% |
| European | 72 | 1.0% |
| Filipino | 103 | 1.5% |
| French | 86 | 1.2% |
| German | 1,266 | 18.2% |
| Greek | 5 | 0.1% |
| Hungarian | 37 | 0.5% |
| Indian (Asian) | 484 | 7.0% |
| Irish | 691 | 10.0% |
| Israeli | 25 | 0.4% |
| Italian | 428 | 6.2% |
| Jamaican | 100 | 1.4% |
| Korean | 447 | 6.4% |
| Lebanese | 26 | 0.4% |
| Nicaraguan | 12 | 0.2% |
| Northern European | 43 | 0.6% |
| Norwegian | 37 | 0.5% |
| Pakistani | 32 | 0.5% |
| Peruvian | 30 | 0.4% |
| Polish | 154 | 2.2% |
| Portuguese | 43 | 0.6% |
| Puerto Rican | 80 | 1.1% |
| Romanian | 9 | 0.1% |
| Russian | 80 | 1.1% |
| Scotch-Irish | 122 | 1.8% |
| Scottish | 35 | 0.5% |
| Slavic | 19 | 0.3% |
| South American | 233 | 3.4% |
| Spaniard | 19 | 0.3% |
| Sri Lankan | 72 | 1.0% |
| Subsaharan African | 19 | 0.3% |
| Swedish | 89 | 1.3% |
| Thai | 142 | 2.1% |
| Ukrainian | 12 | 0.2% |
| Welsh | 224 | 3.2% | View All 61 Rows |
Immigrants in South Run
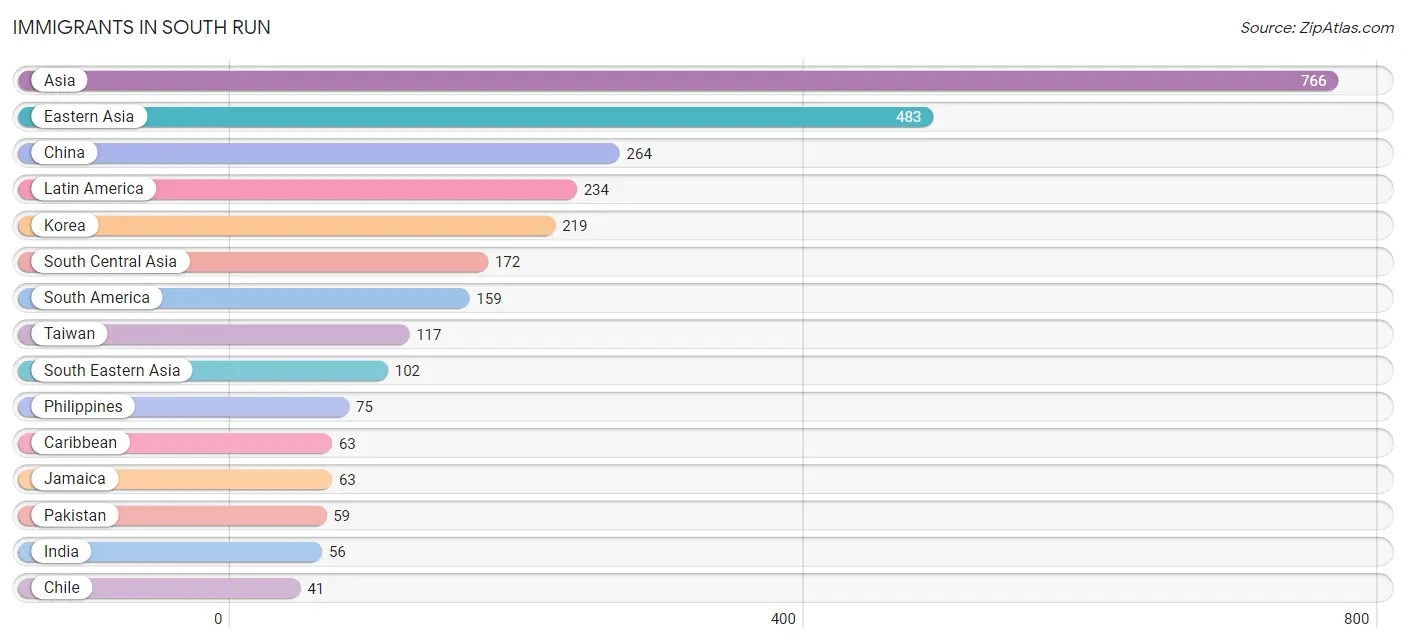
The most numerous immigrant groups reported in South Run came from Asia (766 | 11.0%), Eastern Asia (483 | 7.0%), China (264 | 3.8%), Latin America (234 | 3.4%), and Korea (219 | 3.2%), together accounting for 28.3% of all South Run residents.
| Immigration Origin | # Population | % Population |
| Afghanistan | 37 | 0.5% |
| Africa | 14 | 0.2% |
| Asia | 766 | 11.0% |
| Australia | 5 | 0.1% |
| Belgium | 8 | 0.1% |
| Brazil | 15 | 0.2% |
| Caribbean | 63 | 0.9% |
| Central America | 12 | 0.2% |
| Chile | 41 | 0.6% |
| China | 264 | 3.8% |
| Colombia | 41 | 0.6% |
| Eastern Asia | 483 | 7.0% |
| Ecuador | 32 | 0.5% |
| Egypt | 14 | 0.2% |
| England | 12 | 0.2% |
| Europe | 20 | 0.3% |
| Hong Kong | 39 | 0.6% |
| India | 56 | 0.8% |
| Jamaica | 63 | 0.9% |
| Korea | 219 | 3.2% |
| Latin America | 234 | 3.4% |
| Lebanon | 9 | 0.1% |
| Nicaragua | 12 | 0.2% |
| Northern Africa | 14 | 0.2% |
| Northern Europe | 12 | 0.2% |
| Oceania | 5 | 0.1% |
| Pakistan | 59 | 0.9% |
| Peru | 30 | 0.4% |
| Philippines | 75 | 1.1% |
| South America | 159 | 2.3% |
| South Central Asia | 172 | 2.5% |
| South Eastern Asia | 102 | 1.5% |
| Sri Lanka | 20 | 0.3% |
| Taiwan | 117 | 1.7% |
| Thailand | 14 | 0.2% |
| Vietnam | 13 | 0.2% |
| Western Asia | 9 | 0.1% |
| Western Europe | 8 | 0.1% | View All 38 Rows |
Sex and Age in South Run
Sex and Age in South Run
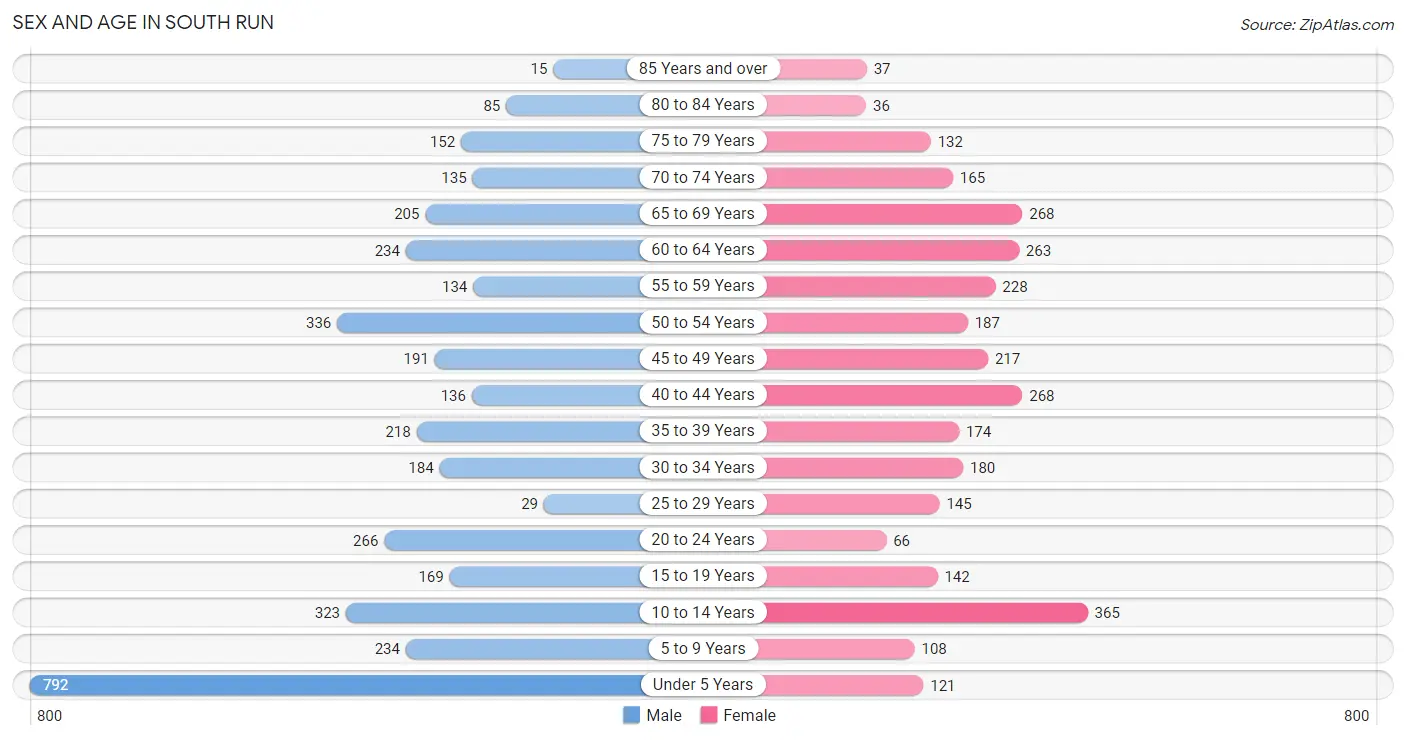
The most populous age groups in South Run are Under 5 Years (792 | 20.6%) for men and 10 to 14 Years (365 | 11.8%) for women.
| Age Bracket | Male | Female |
| Under 5 Years | 792 (20.6%) | 121 (3.9%) |
| 5 to 9 Years | 234 (6.1%) | 108 (3.5%) |
| 10 to 14 Years | 323 (8.4%) | 365 (11.8%) |
| 15 to 19 Years | 169 (4.4%) | 142 (4.6%) |
| 20 to 24 Years | 266 (6.9%) | 66 (2.1%) |
| 25 to 29 Years | 29 (0.8%) | 145 (4.7%) |
| 30 to 34 Years | 184 (4.8%) | 180 (5.8%) |
| 35 to 39 Years | 218 (5.7%) | 174 (5.6%) |
| 40 to 44 Years | 136 (3.5%) | 268 (8.6%) |
| 45 to 49 Years | 191 (5.0%) | 217 (7.0%) |
| 50 to 54 Years | 336 (8.7%) | 187 (6.0%) |
| 55 to 59 Years | 134 (3.5%) | 228 (7.3%) |
| 60 to 64 Years | 234 (6.1%) | 263 (8.5%) |
| 65 to 69 Years | 205 (5.3%) | 268 (8.6%) |
| 70 to 74 Years | 135 (3.5%) | 165 (5.3%) |
| 75 to 79 Years | 152 (4.0%) | 132 (4.3%) |
| 80 to 84 Years | 85 (2.2%) | 36 (1.2%) |
| 85 Years and over | 15 (0.4%) | 37 (1.2%) |
| Total | 3,838 (100.0%) | 3,102 (100.0%) |
Families and Households in South Run
Median Family Size in South Run
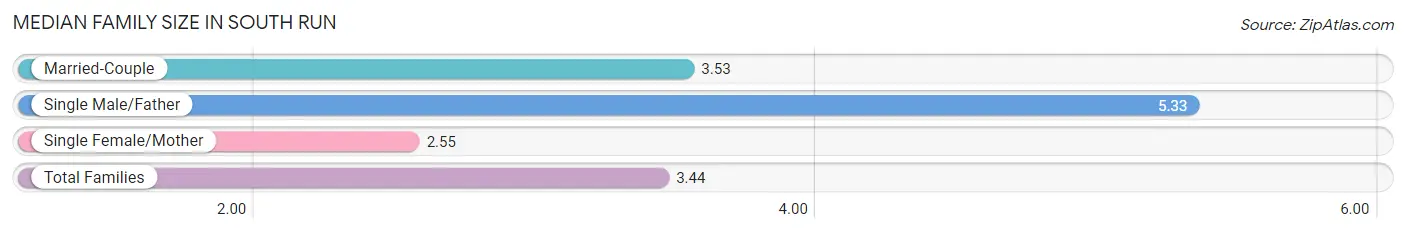
The median family size in South Run is 3.44 persons per family, with single male/father families (6 | 0.3%) accounting for the largest median family size of 5.33 persons per family. On the other hand, single female/mother families (181 | 9.3%) represent the smallest median family size with 2.55 persons per family.
| Family Type | # Families | Family Size |
| Married-Couple | 1,765 (90.4%) | 3.53 |
| Single Male/Father | 6 (0.3%) | 5.33 |
| Single Female/Mother | 181 (9.3%) | 2.55 |
| Total Families | 1,952 (100.0%) | 3.44 |
Median Household Size in South Run
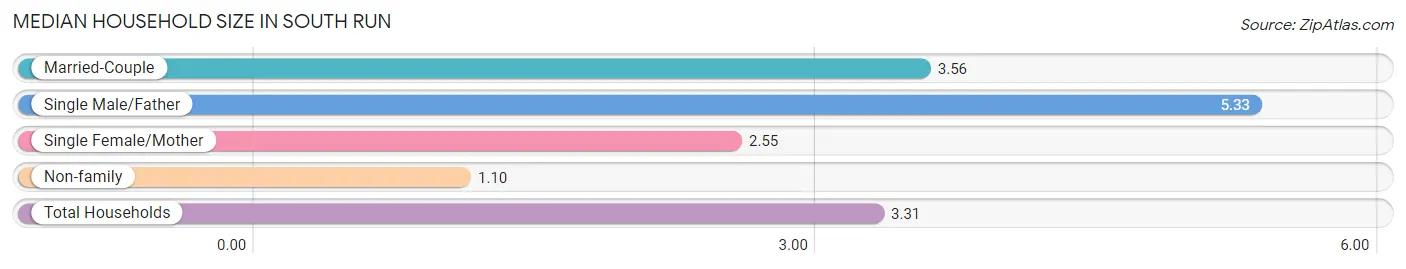
The median household size in South Run is 3.31 persons per household, with single male/father households (6 | 0.3%) accounting for the largest median household size of 5.33 persons per household. non-family households (146 | 7.0%) represent the smallest median household size with 1.10 persons per household.
| Household Type | # Households | Household Size |
| Married-Couple | 1,765 (84.1%) | 3.56 |
| Single Male/Father | 6 (0.3%) | 5.33 |
| Single Female/Mother | 181 (8.6%) | 2.55 |
| Non-family | 146 (7.0%) | 1.10 |
| Total Households | 2,098 (100.0%) | 3.31 |
Household Size by Marriage Status in South Run
Out of a total of 2,098 households in South Run, 1,952 (93.0%) are family households, while 146 (7.0%) are nonfamily households. The most numerous type of family households are 2-person households, comprising 760, and the most common type of nonfamily households are 1-person households, comprising 132.
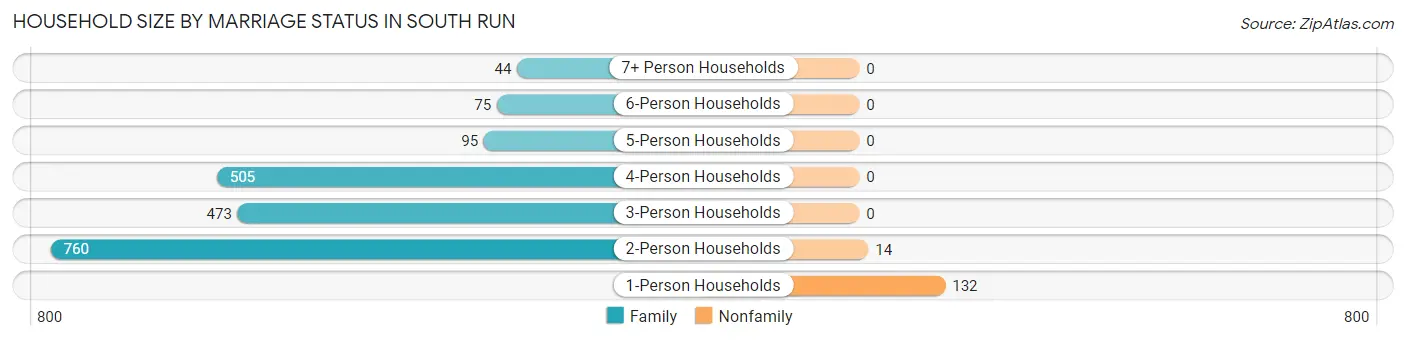
| Household Size | Family Households | Nonfamily Households |
| 1-Person Households | - | 132 (6.3%) |
| 2-Person Households | 760 (36.2%) | 14 (0.7%) |
| 3-Person Households | 473 (22.6%) | 0 (0.0%) |
| 4-Person Households | 505 (24.1%) | 0 (0.0%) |
| 5-Person Households | 95 (4.5%) | 0 (0.0%) |
| 6-Person Households | 75 (3.6%) | 0 (0.0%) |
| 7+ Person Households | 44 (2.1%) | 0 (0.0%) |
| Total | 1,952 (93.0%) | 146 (7.0%) |
Female Fertility in South Run
Fertility by Age in South Run
Average fertility rate in South Run is 148.0 births per 1,000 women. Women in the age bracket of 20 to 34 years have the highest fertility rate with 343.0 births per 1,000 women. Women in the age bracket of 20 to 34 years acount for 74.4% of all women with births.
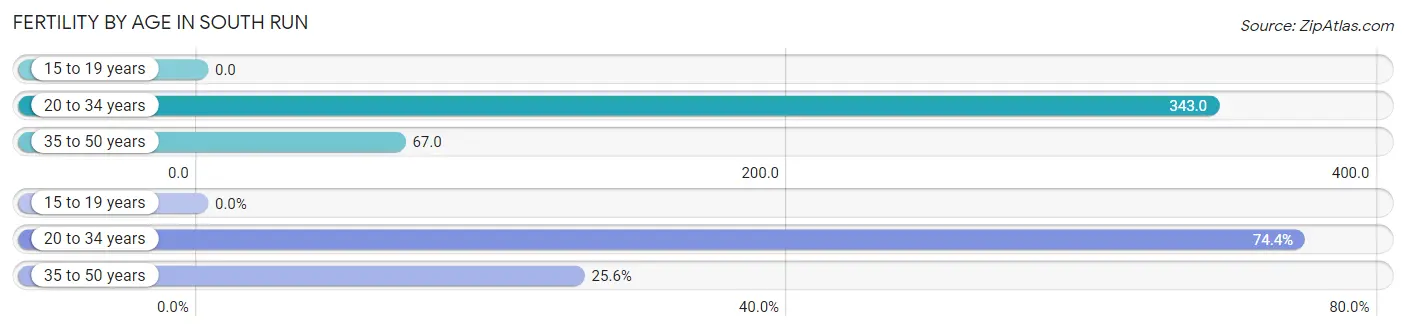
| Age Bracket | Women with Births | Births / 1,000 Women |
| 15 to 19 years | 0 (0.0%) | 0.0 |
| 20 to 34 years | 134 (74.4%) | 343.0 |
| 35 to 50 years | 46 (25.6%) | 67.0 |
| Total | 180 (100.0%) | 148.0 |
Fertility by Age by Marriage Status in South Run
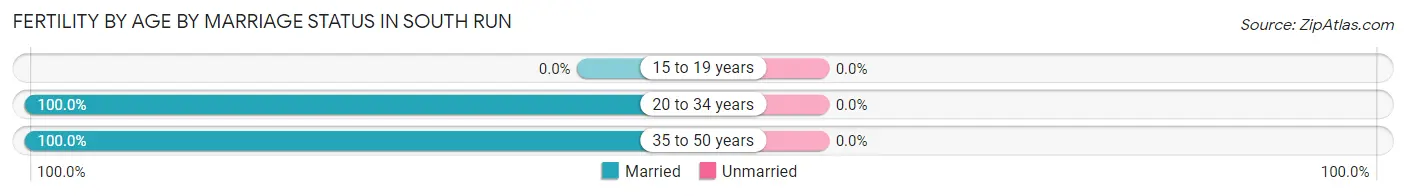
| Age Bracket | Married | Unmarried |
| 15 to 19 years | 0 (0.0%) | 0 (0.0%) |
| 20 to 34 years | 134 (100.0%) | 0 (0.0%) |
| 35 to 50 years | 46 (100.0%) | 0 (0.0%) |
| Total | 180 (100.0%) | 0 (0.0%) |
Fertility by Education in South Run
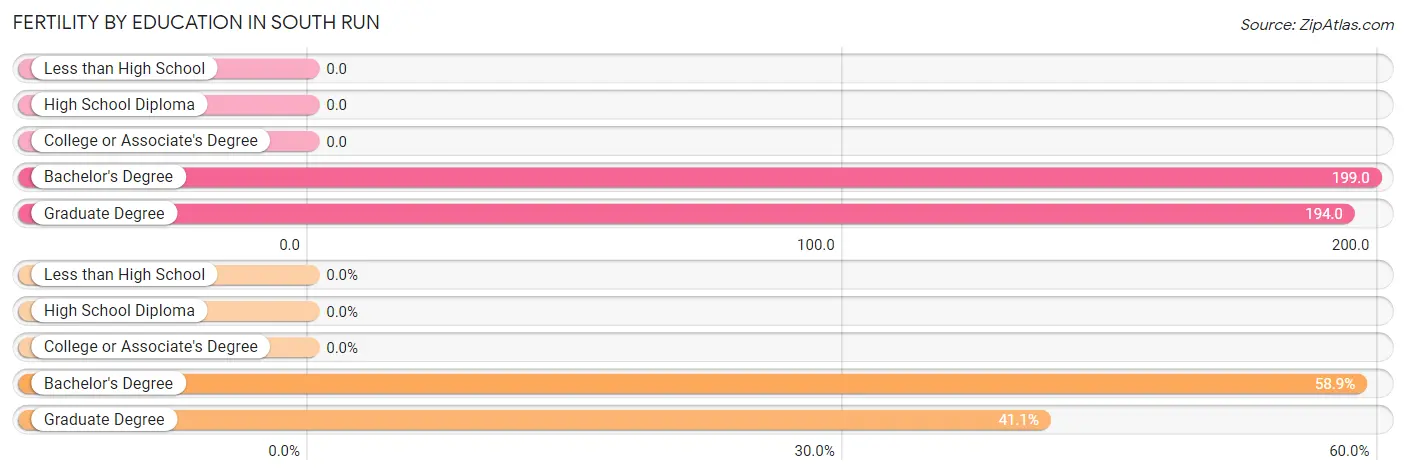
| Educational Attainment | Women with Births | Births / 1,000 Women |
| Less than High School | 0 (0.0%) | 0.0 |
| High School Diploma | 0 (0.0%) | 0.0 |
| College or Associate's Degree | 0 (0.0%) | 0.0 |
| Bachelor's Degree | 106 (58.9%) | 199.0 |
| Graduate Degree | 74 (41.1%) | 194.0 |
| Total | 180 (100.0%) | 148.0 |
Fertility by Education by Marriage Status in South Run
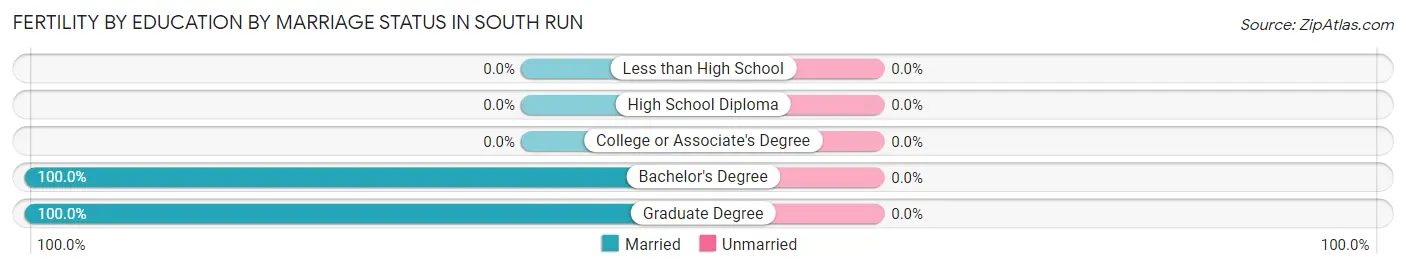
| Educational Attainment | Married | Unmarried |
| Less than High School | 0 (0.0%) | 0 (0.0%) |
| High School Diploma | 0 (0.0%) | 0 (0.0%) |
| College or Associate's Degree | 0 (0.0%) | 0 (0.0%) |
| Bachelor's Degree | 106 (100.0%) | 0 (0.0%) |
| Graduate Degree | 74 (100.0%) | 0 (0.0%) |
| Total | 180 (100.0%) | 0 (0.0%) |
Employment Characteristics in South Run
Employment by Class of Employer in South Run
Among the 3,067 employed individuals in South Run, private company employees (1,595 | 52.0%), federal government employees (618 | 20.2%), and not-for-profit organizations (362 | 11.8%) make up the most common classes of employment.
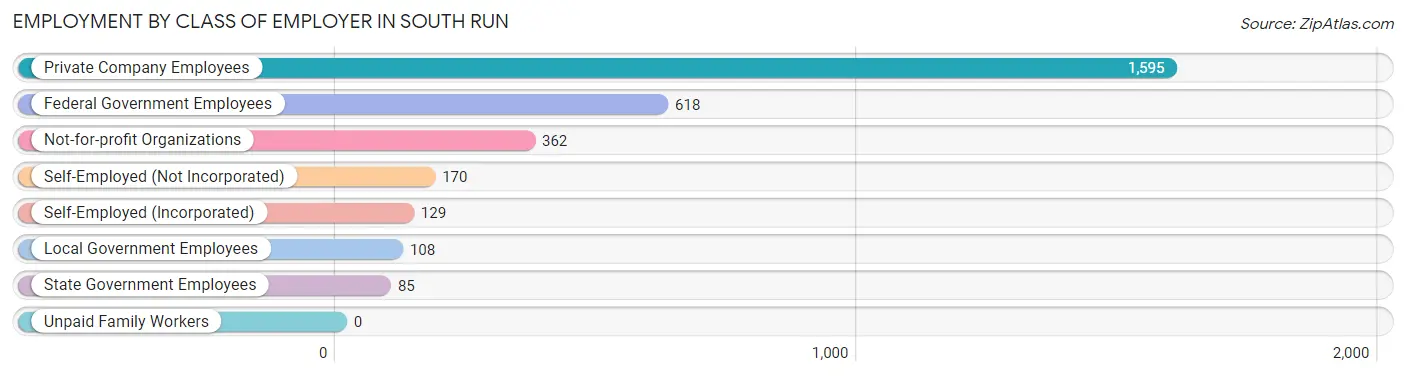
| Employer Class | # Employees | % Employees |
| Private Company Employees | 1,595 | 52.0% |
| Self-Employed (Incorporated) | 129 | 4.2% |
| Self-Employed (Not Incorporated) | 170 | 5.5% |
| Not-for-profit Organizations | 362 | 11.8% |
| Local Government Employees | 108 | 3.5% |
| State Government Employees | 85 | 2.8% |
| Federal Government Employees | 618 | 20.2% |
| Unpaid Family Workers | 0 | 0.0% |
| Total | 3,067 | 100.0% |
Employment Status by Age in South Run
According to the labor force statistics for South Run, out of the total population over 16 years of age (4,940), 65.6% or 3,241 individuals are in the labor force, with 3.4% or 110 of them unemployed. The age group with the highest labor force participation rate is 25 to 29 years, with 100.0% or 174 individuals in the labor force. Within the labor force, the 25 to 29 years age range has the highest percentage of unemployed individuals, with 21.3% or 37 of them being unemployed.
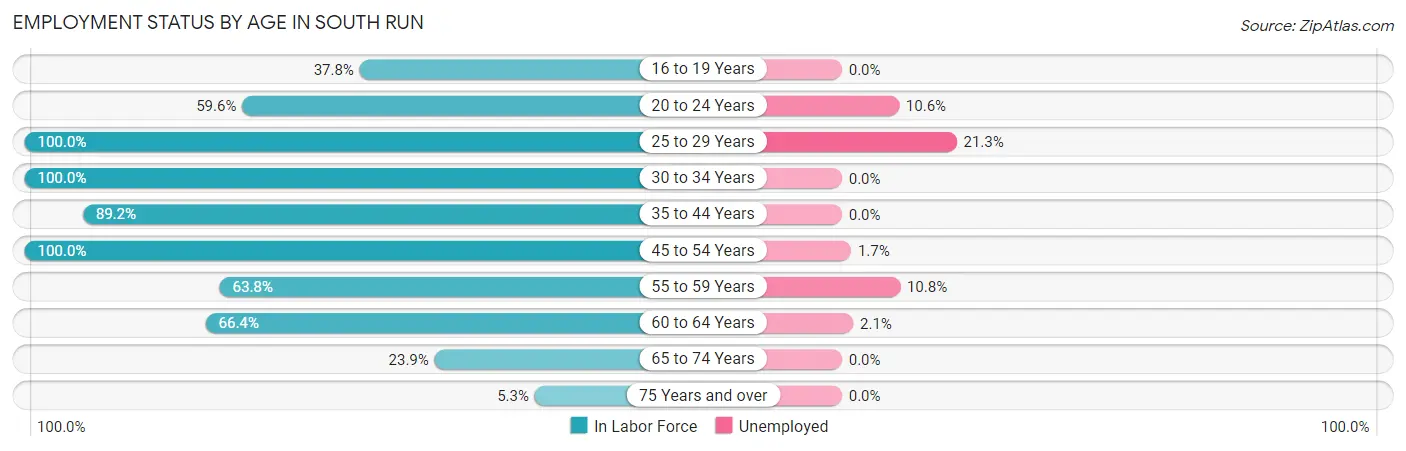
| Age Bracket | In Labor Force | Unemployed |
| 16 to 19 Years | 96 (37.8%) | 0 (0.0%) |
| 20 to 24 Years | 198 (59.6%) | 21 (10.6%) |
| 25 to 29 Years | 174 (100.0%) | 37 (21.3%) |
| 30 to 34 Years | 364 (100.0%) | 0 (0.0%) |
| 35 to 44 Years | 710 (89.2%) | 0 (0.0%) |
| 45 to 54 Years | 931 (100.0%) | 16 (1.7%) |
| 55 to 59 Years | 231 (63.8%) | 25 (10.8%) |
| 60 to 64 Years | 330 (66.4%) | 7 (2.1%) |
| 65 to 74 Years | 185 (23.9%) | 0 (0.0%) |
| 75 Years and over | 24 (5.3%) | 0 (0.0%) |
| Total | 3,241 (65.6%) | 110 (3.4%) |
Employment Status by Educational Attainment in South Run
According to labor force statistics for South Run, 87.7% of individuals (2,740) out of the total population between 25 and 64 years of age (3,124) are in the labor force, with 3.2% or 88 of them being unemployed. The group with the highest labor force participation rate are those with the educational attainment of less than high school, with 100.0% or 12 individuals in the labor force. Within the labor force, individuals with high school diploma education have the highest percentage of unemployment, with 20.1% or 37 of them being unemployed.
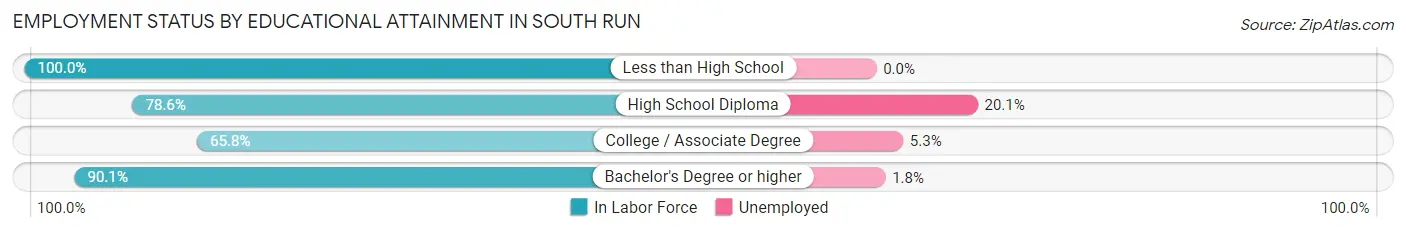
| Educational Attainment | In Labor Force | Unemployed |
| Less than High School | 12 (100.0%) | 0 (0.0%) |
| High School Diploma | 184 (78.6%) | 47 (20.1%) |
| College / Associate Degree | 131 (65.8%) | 11 (5.3%) |
| Bachelor's Degree or higher | 2,414 (90.1%) | 48 (1.8%) |
| Total | 2,740 (87.7%) | 100 (3.2%) |
Employment Occupations by Sex in South Run
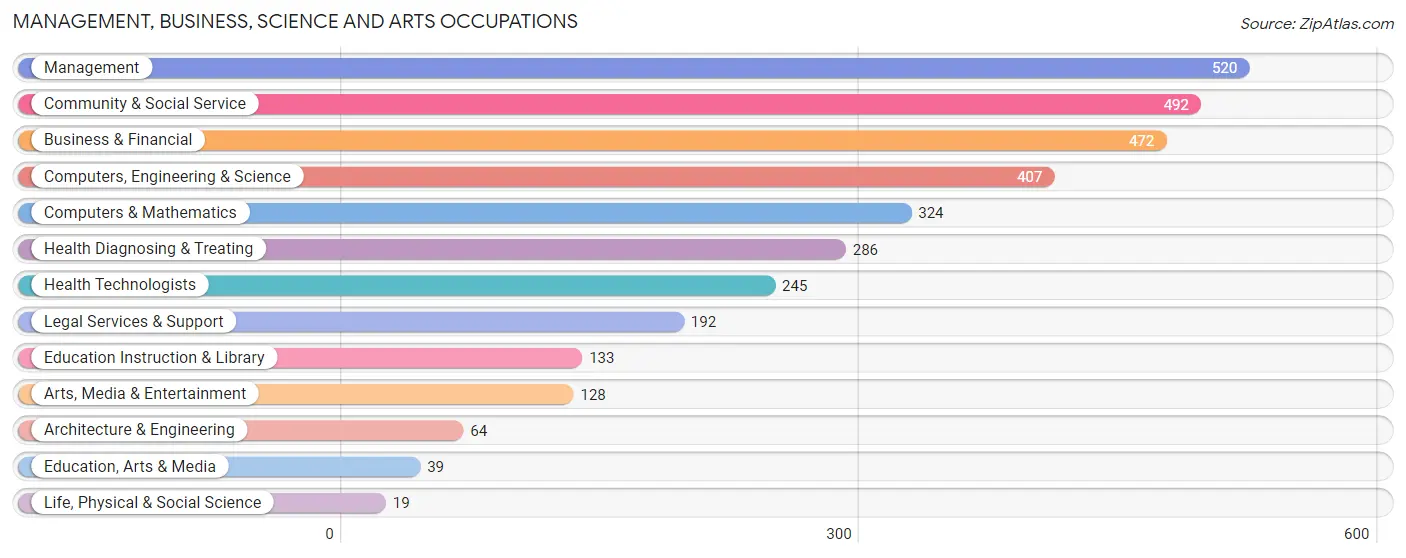
Management, Business, Science and Arts Occupations
The most common Management, Business, Science and Arts occupations in South Run are Management (520 | 17.0%), Community & Social Service (492 | 16.1%), Business & Financial (472 | 15.4%), Computers, Engineering & Science (407 | 13.3%), and Computers & Mathematics (324 | 10.6%).
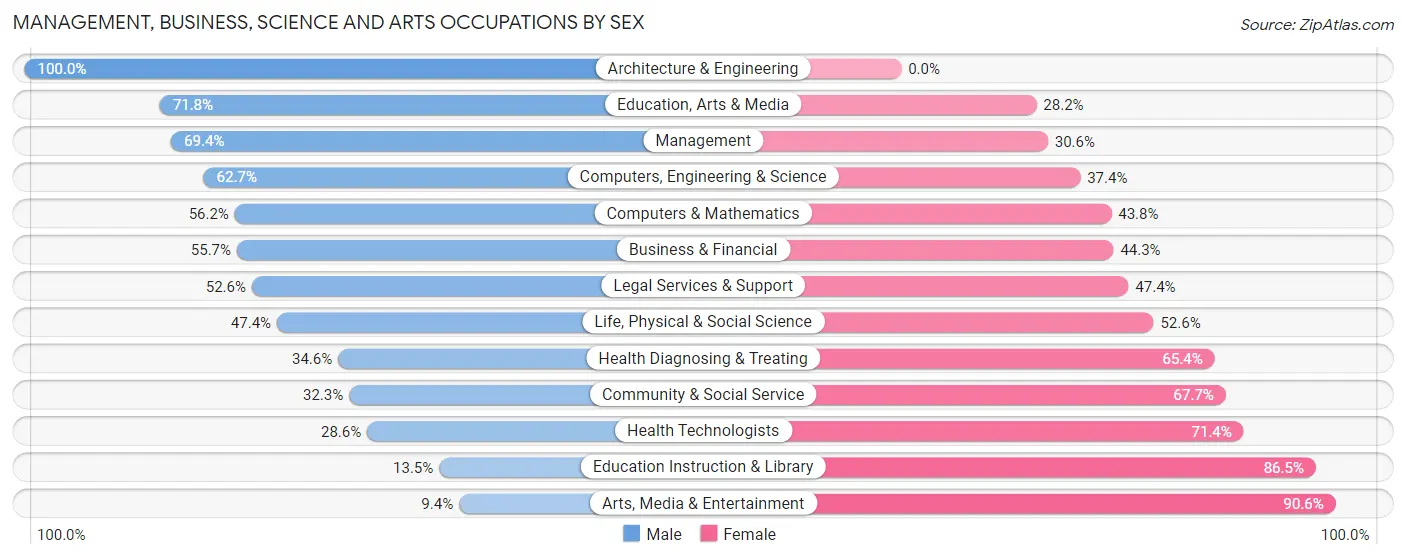
Management, Business, Science and Arts Occupations by Sex
Within the Management, Business, Science and Arts occupations in South Run, the most male-oriented occupations are Architecture & Engineering (100.0%), Education, Arts & Media (71.8%), and Management (69.4%), while the most female-oriented occupations are Arts, Media & Entertainment (90.6%), Education Instruction & Library (86.5%), and Health Technologists (71.4%).
| Occupation | Male | Female |
| Management | 361 (69.4%) | 159 (30.6%) |
| Business & Financial | 263 (55.7%) | 209 (44.3%) |
| Computers, Engineering & Science | 255 (62.6%) | 152 (37.3%) |
| Computers & Mathematics | 182 (56.2%) | 142 (43.8%) |
| Architecture & Engineering | 64 (100.0%) | 0 (0.0%) |
| Life, Physical & Social Science | 9 (47.4%) | 10 (52.6%) |
| Community & Social Service | 159 (32.3%) | 333 (67.7%) |
| Education, Arts & Media | 28 (71.8%) | 11 (28.2%) |
| Legal Services & Support | 101 (52.6%) | 91 (47.4%) |
| Education Instruction & Library | 18 (13.5%) | 115 (86.5%) |
| Arts, Media & Entertainment | 12 (9.4%) | 116 (90.6%) |
| Health Diagnosing & Treating | 99 (34.6%) | 187 (65.4%) |
| Health Technologists | 70 (28.6%) | 175 (71.4%) |
| Total (Category) | 1,137 (52.2%) | 1,040 (47.8%) |
| Total (Overall) | 1,662 (54.3%) | 1,396 (45.7%) |
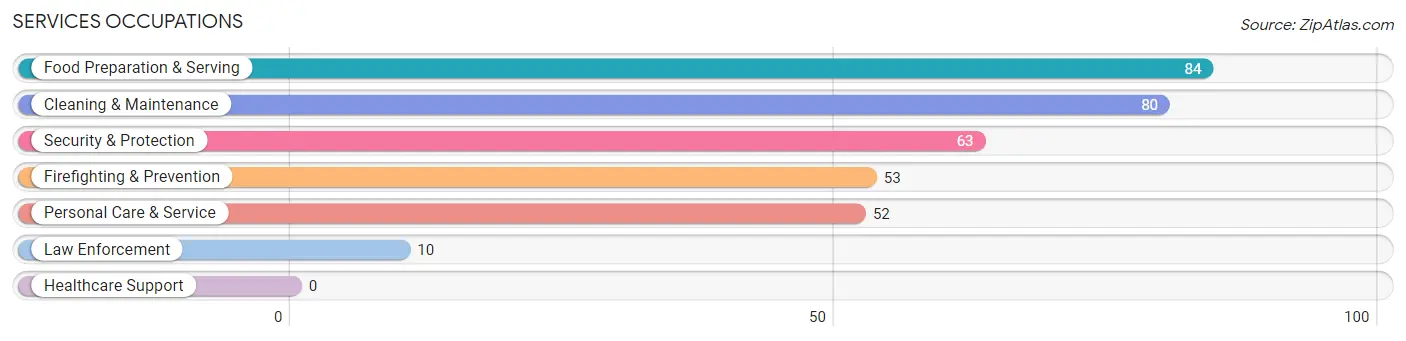
Services Occupations
The most common Services occupations in South Run are Food Preparation & Serving (84 | 2.8%), Cleaning & Maintenance (80 | 2.6%), Security & Protection (63 | 2.1%), Firefighting & Prevention (53 | 1.7%), and Personal Care & Service (52 | 1.7%).
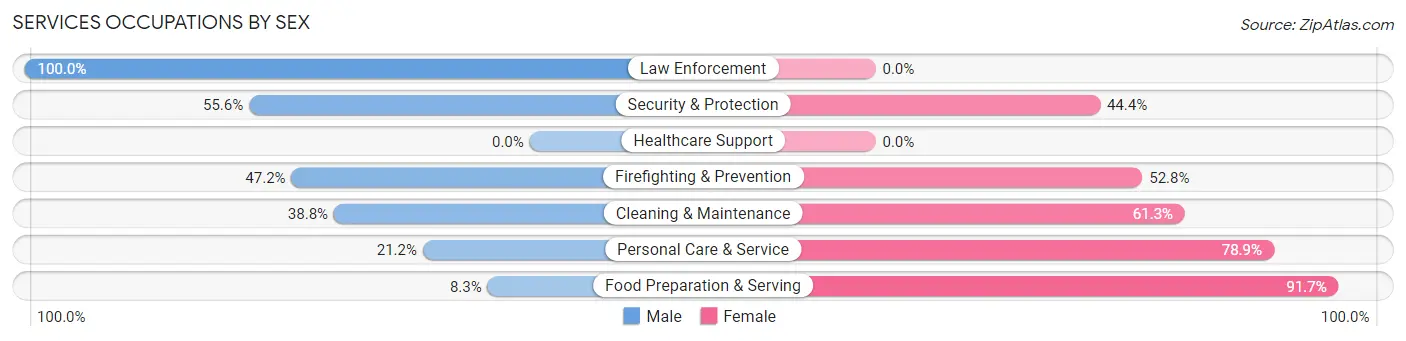
Services Occupations by Sex
Within the Services occupations in South Run, the most male-oriented occupations are Law Enforcement (100.0%), Security & Protection (55.6%), and Firefighting & Prevention (47.2%), while the most female-oriented occupations are Food Preparation & Serving (91.7%), Personal Care & Service (78.8%), and Cleaning & Maintenance (61.3%).
| Occupation | Male | Female |
| Healthcare Support | 0 (0.0%) | 0 (0.0%) |
| Security & Protection | 35 (55.6%) | 28 (44.4%) |
| Firefighting & Prevention | 25 (47.2%) | 28 (52.8%) |
| Law Enforcement | 10 (100.0%) | 0 (0.0%) |
| Food Preparation & Serving | 7 (8.3%) | 77 (91.7%) |
| Cleaning & Maintenance | 31 (38.8%) | 49 (61.3%) |
| Personal Care & Service | 11 (21.1%) | 41 (78.8%) |
| Total (Category) | 84 (30.1%) | 195 (69.9%) |
| Total (Overall) | 1,662 (54.3%) | 1,396 (45.7%) |
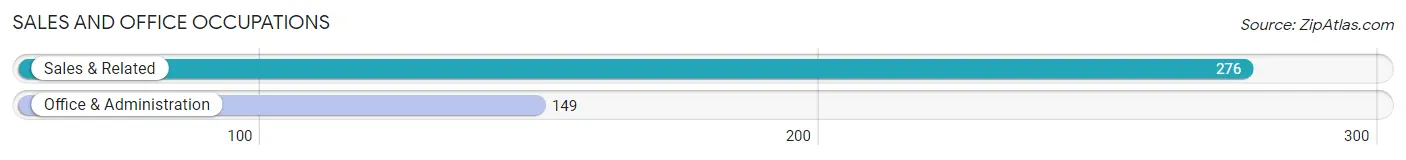
Sales and Office Occupations
The most common Sales and Office occupations in South Run are Sales & Related (276 | 9.0%), and Office & Administration (149 | 4.9%).
Sales and Office Occupations by Sex
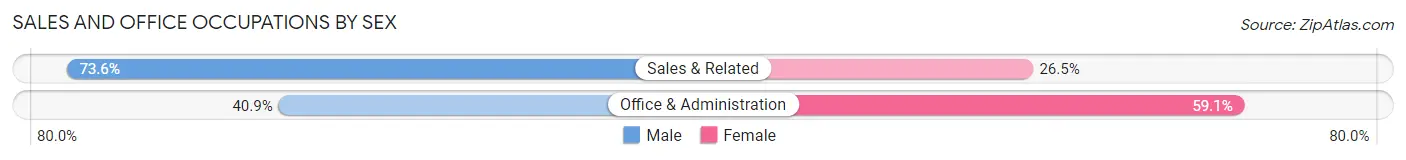
| Occupation | Male | Female |
| Sales & Related | 203 (73.6%) | 73 (26.5%) |
| Office & Administration | 61 (40.9%) | 88 (59.1%) |
| Total (Category) | 264 (62.1%) | 161 (37.9%) |
| Total (Overall) | 1,662 (54.3%) | 1,396 (45.7%) |
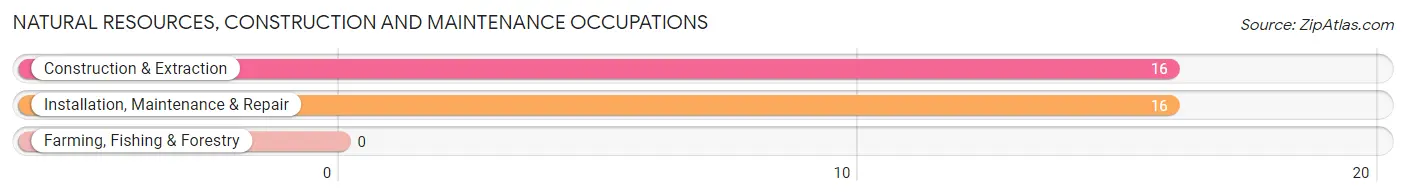
Natural Resources, Construction and Maintenance Occupations
The most common Natural Resources, Construction and Maintenance occupations in South Run are Construction & Extraction (16 | 0.5%), and Installation, Maintenance & Repair (16 | 0.5%).
Natural Resources, Construction and Maintenance Occupations by Sex
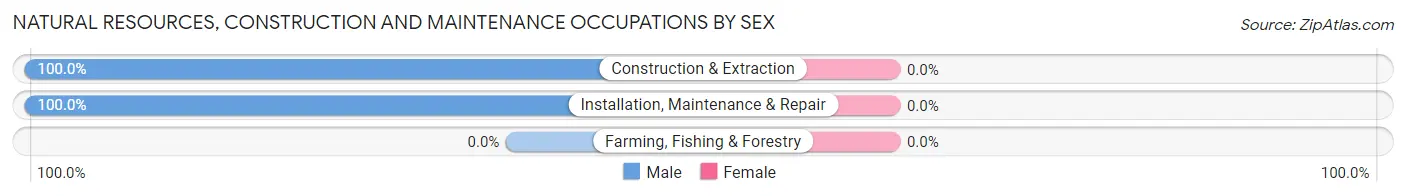
| Occupation | Male | Female |
| Farming, Fishing & Forestry | 0 (0.0%) | 0 (0.0%) |
| Construction & Extraction | 16 (100.0%) | 0 (0.0%) |
| Installation, Maintenance & Repair | 16 (100.0%) | 0 (0.0%) |
| Total (Category) | 32 (100.0%) | 0 (0.0%) |
| Total (Overall) | 1,662 (54.3%) | 1,396 (45.7%) |
Production, Transportation and Moving Occupations
The most common Production, Transportation and Moving occupations in South Run are Transportation (126 | 4.1%), and Material Moving (19 | 0.6%).
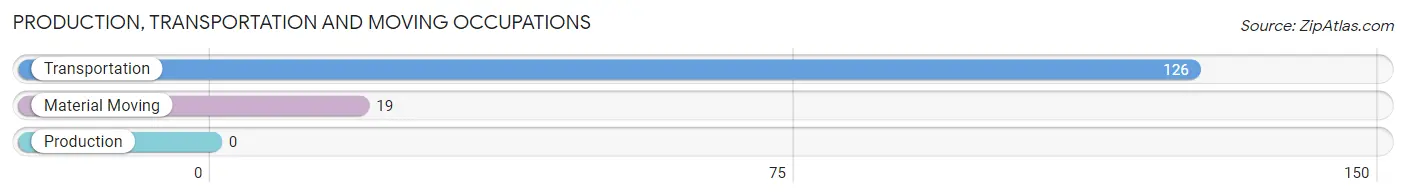
Production, Transportation and Moving Occupations by Sex
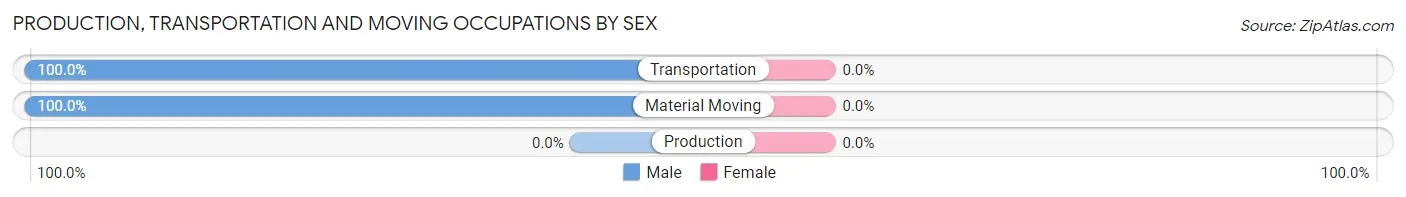
| Occupation | Male | Female |
| Production | 0 (0.0%) | 0 (0.0%) |
| Transportation | 126 (100.0%) | 0 (0.0%) |
| Material Moving | 19 (100.0%) | 0 (0.0%) |
| Total (Category) | 145 (100.0%) | 0 (0.0%) |
| Total (Overall) | 1,662 (54.3%) | 1,396 (45.7%) |
Employment Industries by Sex in South Run
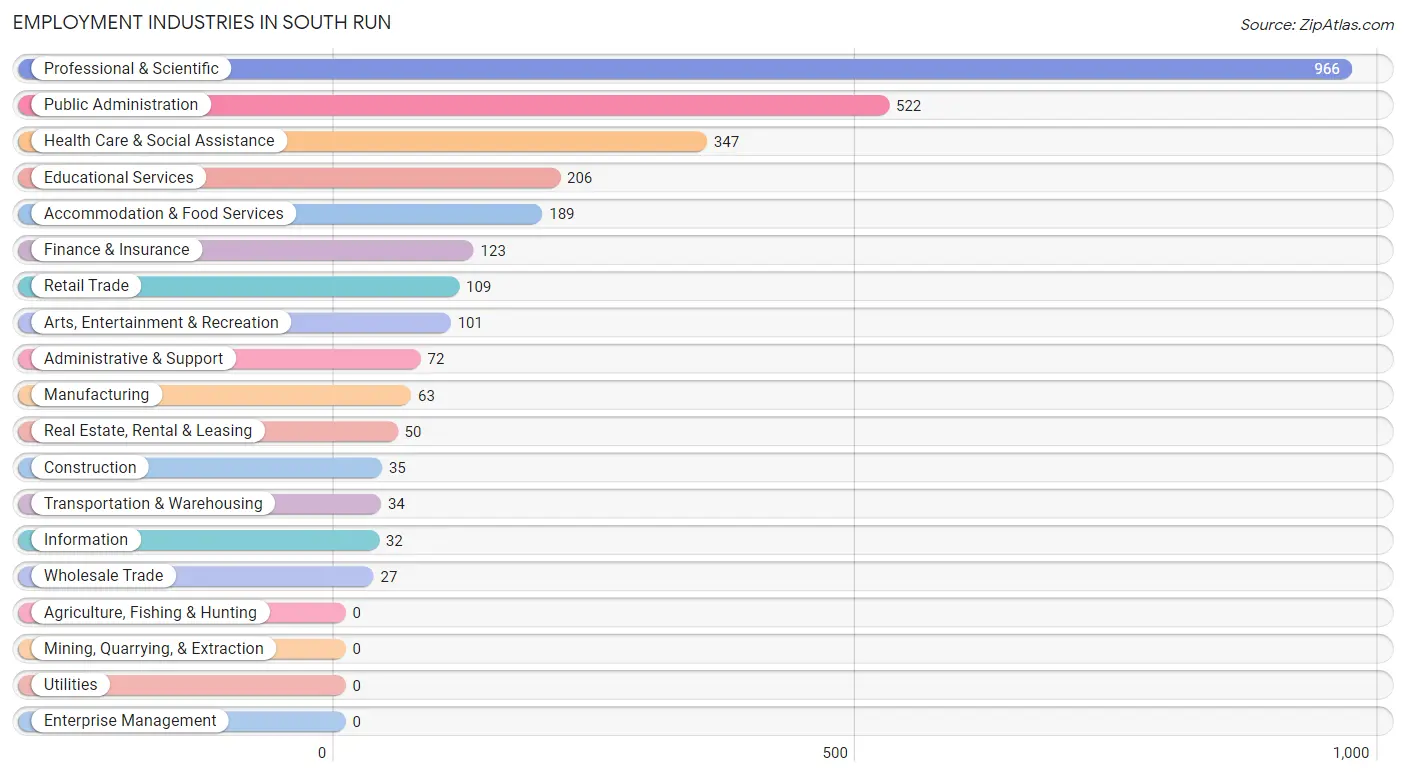
Employment Industries in South Run
The major employment industries in South Run include Professional & Scientific (966 | 31.6%), Public Administration (522 | 17.1%), Health Care & Social Assistance (347 | 11.4%), Educational Services (206 | 6.7%), and Accommodation & Food Services (189 | 6.2%).
Employment Industries by Sex in South Run
The South Run industries that see more men than women are Construction (100.0%), Wholesale Trade (100.0%), and Transportation & Warehousing (100.0%), whereas the industries that tend to have a higher number of women are Arts, Entertainment & Recreation (82.2%), Administrative & Support (72.2%), and Educational Services (70.9%).
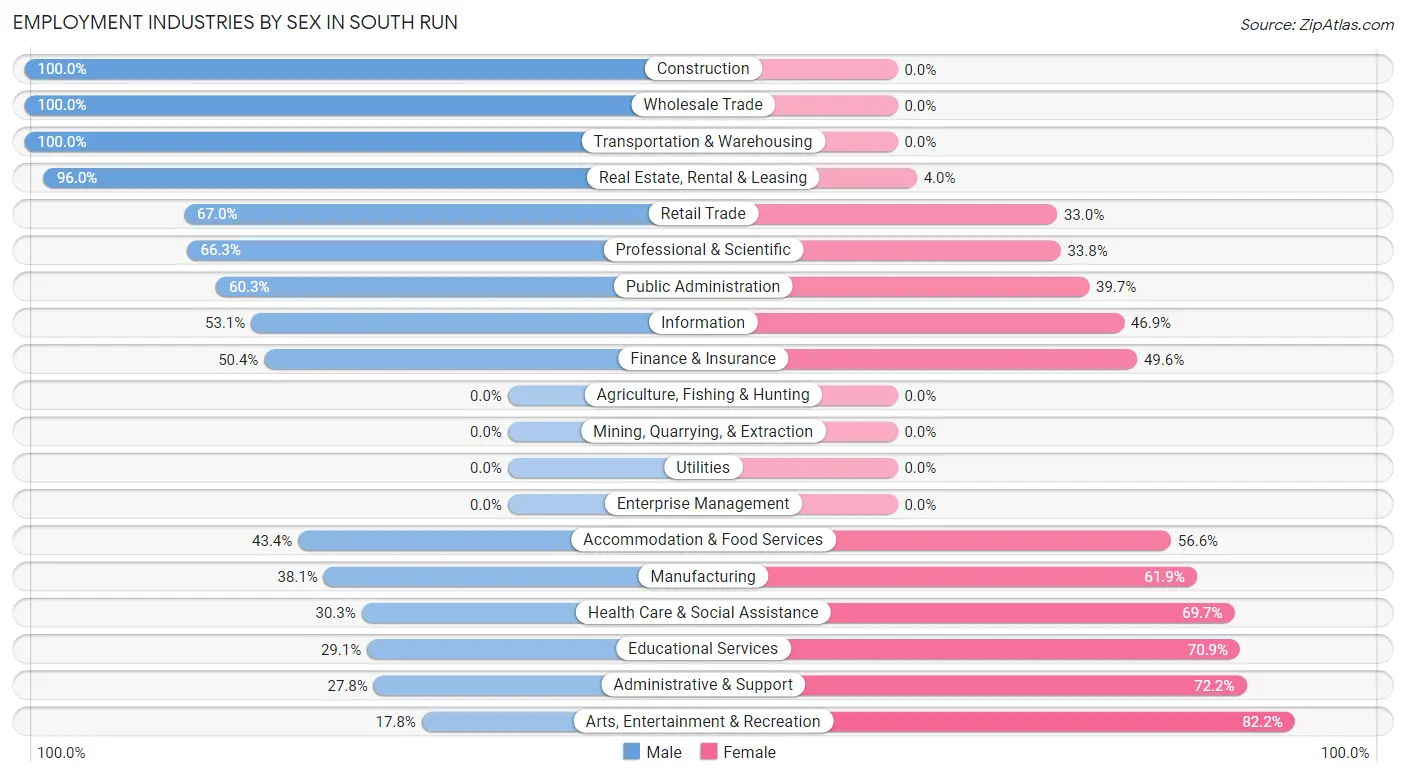
| Industry | Male | Female |
| Agriculture, Fishing & Hunting | 0 (0.0%) | 0 (0.0%) |
| Mining, Quarrying, & Extraction | 0 (0.0%) | 0 (0.0%) |
| Construction | 35 (100.0%) | 0 (0.0%) |
| Manufacturing | 24 (38.1%) | 39 (61.9%) |
| Wholesale Trade | 27 (100.0%) | 0 (0.0%) |
| Retail Trade | 73 (67.0%) | 36 (33.0%) |
| Transportation & Warehousing | 34 (100.0%) | 0 (0.0%) |
| Utilities | 0 (0.0%) | 0 (0.0%) |
| Information | 17 (53.1%) | 15 (46.9%) |
| Finance & Insurance | 62 (50.4%) | 61 (49.6%) |
| Real Estate, Rental & Leasing | 48 (96.0%) | 2 (4.0%) |
| Professional & Scientific | 640 (66.2%) | 326 (33.8%) |
| Enterprise Management | 0 (0.0%) | 0 (0.0%) |
| Administrative & Support | 20 (27.8%) | 52 (72.2%) |
| Educational Services | 60 (29.1%) | 146 (70.9%) |
| Health Care & Social Assistance | 105 (30.3%) | 242 (69.7%) |
| Arts, Entertainment & Recreation | 18 (17.8%) | 83 (82.2%) |
| Accommodation & Food Services | 82 (43.4%) | 107 (56.6%) |
| Public Administration | 315 (60.3%) | 207 (39.7%) |
| Total | 1,662 (54.3%) | 1,396 (45.7%) |
Education in South Run
School Enrollment in South Run
The most common levels of schooling among the 1,614 students in South Run are middle school (523 | 32.4%), college / undergraduate (321 | 19.9%), and elementary school (296 | 18.3%).
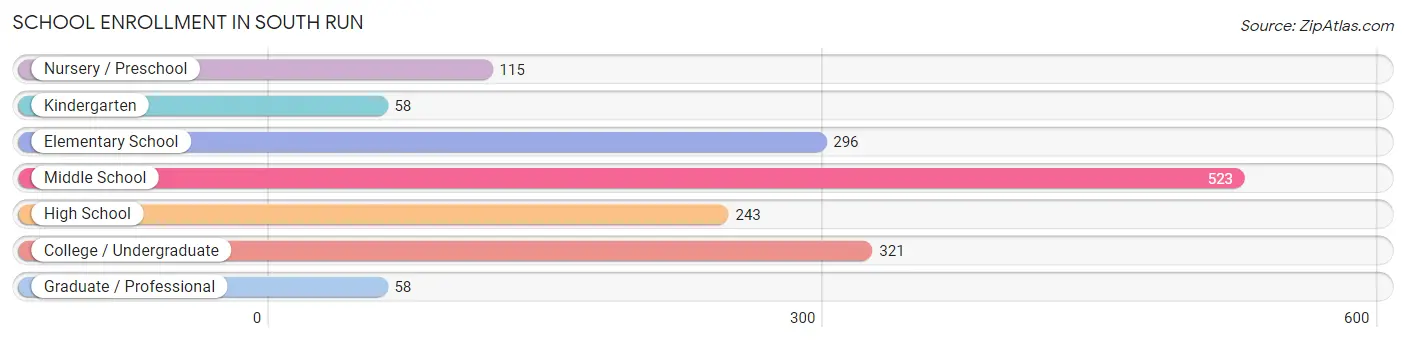
| School Level | # Students | % Students |
| Nursery / Preschool | 115 | 7.1% |
| Kindergarten | 58 | 3.6% |
| Elementary School | 296 | 18.3% |
| Middle School | 523 | 32.4% |
| High School | 243 | 15.1% |
| College / Undergraduate | 321 | 19.9% |
| Graduate / Professional | 58 | 3.6% |
| Total | 1,614 | 100.0% |
School Enrollment by Age by Funding Source in South Run
Out of a total of 1,614 students who are enrolled in schools in South Run, 287 (17.8%) attend a private institution, while the remaining 1,327 (82.2%) are enrolled in public schools. The age group of 3 to 4 year olds has the highest likelihood of being enrolled in private schools, with 48 (63.2% in the age bracket) enrolled. Conversely, the age group of 15 to 17 year olds has the lowest likelihood of being enrolled in a private school, with 129 (100.0% in the age bracket) attending a public institution.
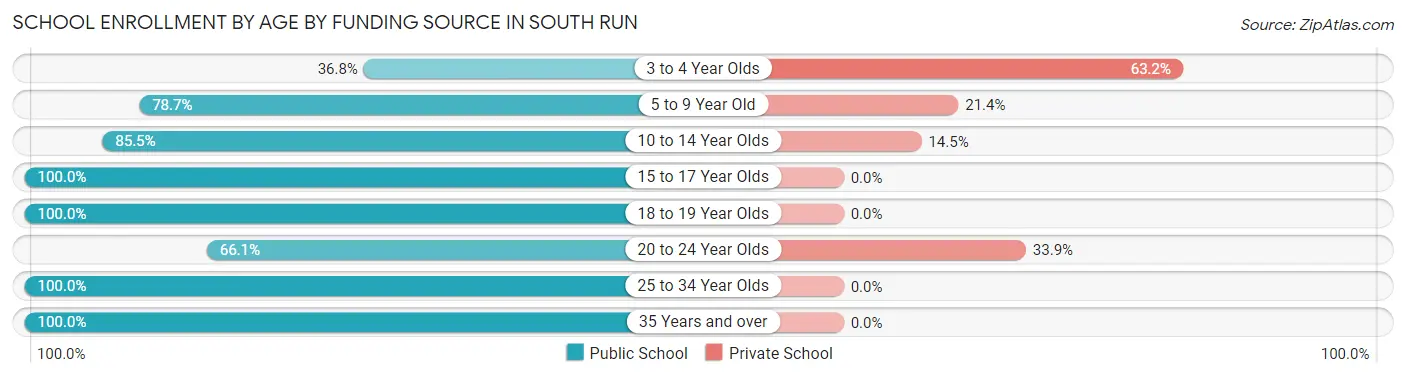
| Age Bracket | Public School | Private School |
| 3 to 4 Year Olds | 28 (36.8%) | 48 (63.2%) |
| 5 to 9 Year Old | 269 (78.6%) | 73 (21.3%) |
| 10 to 14 Year Olds | 537 (85.5%) | 91 (14.5%) |
| 15 to 17 Year Olds | 129 (100.0%) | 0 (0.0%) |
| 18 to 19 Year Olds | 182 (100.0%) | 0 (0.0%) |
| 20 to 24 Year Olds | 146 (66.1%) | 75 (33.9%) |
| 25 to 34 Year Olds | 19 (100.0%) | 0 (0.0%) |
| 35 Years and over | 17 (100.0%) | 0 (0.0%) |
| Total | 1,327 (82.2%) | 287 (17.8%) |
Educational Attainment by Field of Study in South Run
Business (1,011 | 26.5%), social sciences (467 | 12.2%), engineering (331 | 8.7%), bio, nature & agricultural (296 | 7.7%), and computers & mathematics (295 | 7.7%) are the most common fields of study among 3,822 individuals in South Run who have obtained a bachelor's degree or higher.
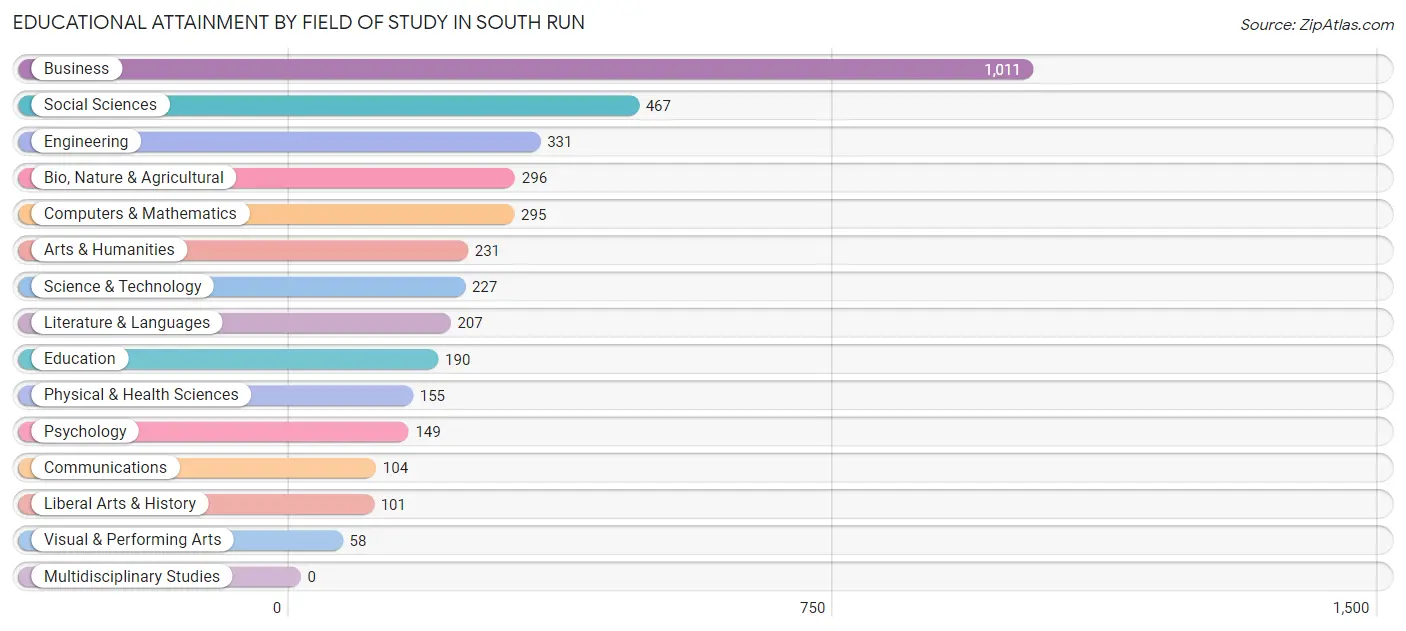
| Field of Study | # Graduates | % Graduates |
| Computers & Mathematics | 295 | 7.7% |
| Bio, Nature & Agricultural | 296 | 7.7% |
| Physical & Health Sciences | 155 | 4.1% |
| Psychology | 149 | 3.9% |
| Social Sciences | 467 | 12.2% |
| Engineering | 331 | 8.7% |
| Multidisciplinary Studies | 0 | 0.0% |
| Science & Technology | 227 | 5.9% |
| Business | 1,011 | 26.5% |
| Education | 190 | 5.0% |
| Literature & Languages | 207 | 5.4% |
| Liberal Arts & History | 101 | 2.6% |
| Visual & Performing Arts | 58 | 1.5% |
| Communications | 104 | 2.7% |
| Arts & Humanities | 231 | 6.0% |
| Total | 3,822 | 100.0% |
Transportation & Commute in South Run
Vehicle Availability by Sex in South Run
The most prevalent vehicle ownership categories in South Run are males with 2 vehicles (903, accounting for 52.5%) and females with 2 vehicles (599, making up 67.0%).
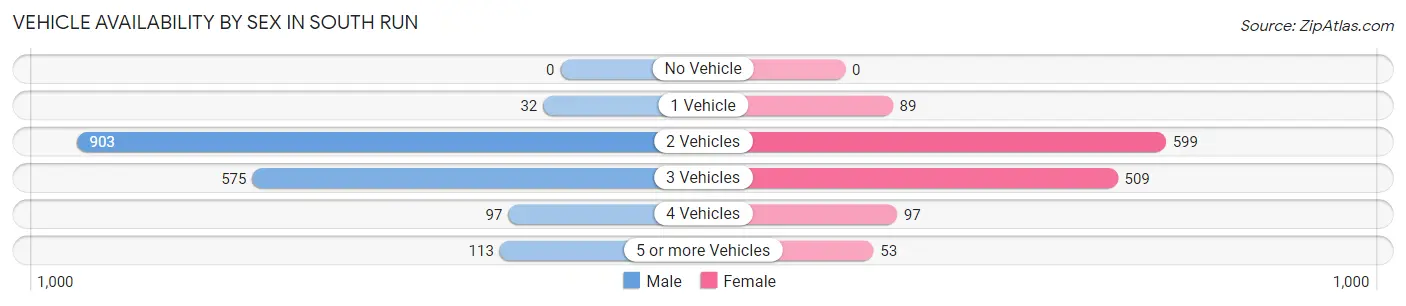
| Vehicles Available | Male | Female |
| No Vehicle | 0 (0.0%) | 0 (0.0%) |
| 1 Vehicle | 32 (1.9%) | 89 (6.6%) |
| 2 Vehicles | 903 (52.5%) | 599 (44.5%) |
| 3 Vehicles | 575 (33.4%) | 509 (37.8%) |
| 4 Vehicles | 97 (5.6%) | 97 (7.2%) |
| 5 or more Vehicles | 113 (6.6%) | 53 (3.9%) |
| Total | 1,720 (100.0%) | 1,347 (100.0%) |
Commute Time in South Run
The most frequently occuring commute durations in South Run are 45 to 59 minutes (482 commuters, 21.2%), 40 to 44 minutes (422 commuters, 18.5%), and 30 to 34 minutes (275 commuters, 12.1%).
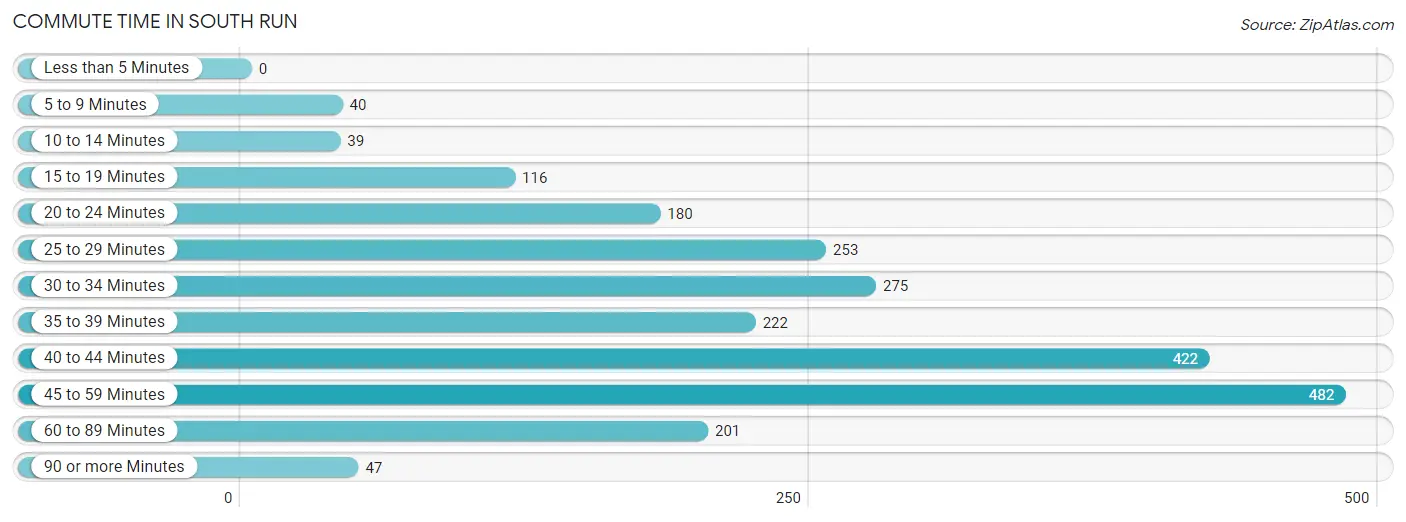
| Commute Time | # Commuters | % Commuters |
| Less than 5 Minutes | 0 | 0.0% |
| 5 to 9 Minutes | 40 | 1.8% |
| 10 to 14 Minutes | 39 | 1.7% |
| 15 to 19 Minutes | 116 | 5.1% |
| 20 to 24 Minutes | 180 | 7.9% |
| 25 to 29 Minutes | 253 | 11.1% |
| 30 to 34 Minutes | 275 | 12.1% |
| 35 to 39 Minutes | 222 | 9.8% |
| 40 to 44 Minutes | 422 | 18.5% |
| 45 to 59 Minutes | 482 | 21.2% |
| 60 to 89 Minutes | 201 | 8.8% |
| 90 or more Minutes | 47 | 2.1% |
Commute Time by Sex in South Run
The most common commute times in South Run are 40 to 44 minutes (359 commuters, 27.8%) for males and 30 to 34 minutes (216 commuters, 21.9%) for females.
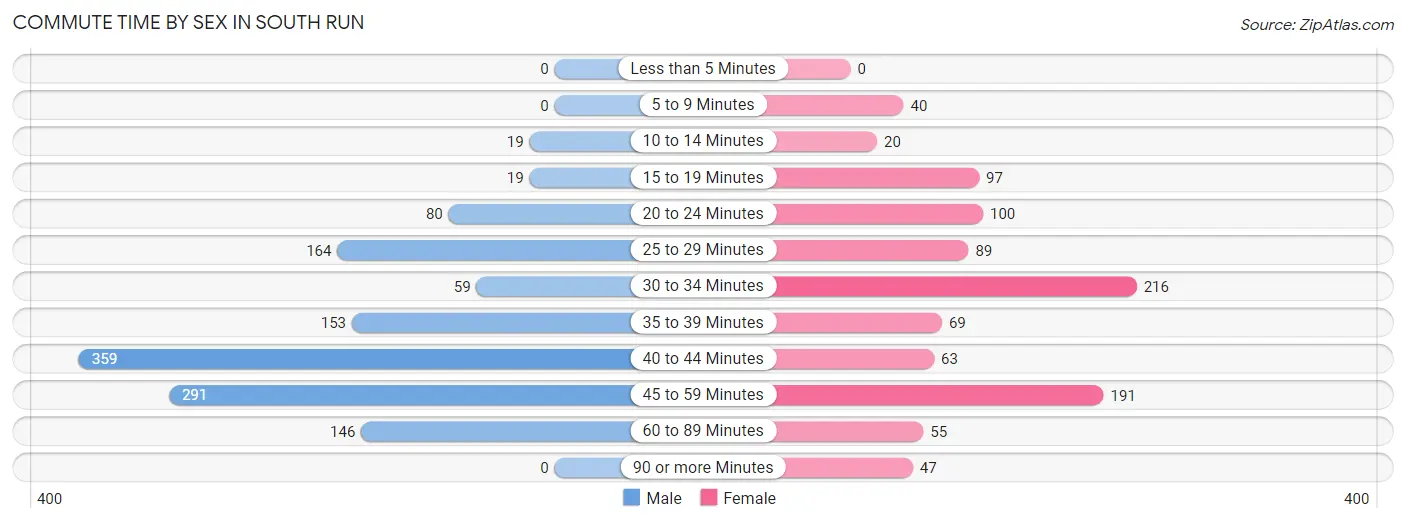
| Commute Time | Male | Female |
| Less than 5 Minutes | 0 (0.0%) | 0 (0.0%) |
| 5 to 9 Minutes | 0 (0.0%) | 40 (4.1%) |
| 10 to 14 Minutes | 19 (1.5%) | 20 (2.0%) |
| 15 to 19 Minutes | 19 (1.5%) | 97 (9.8%) |
| 20 to 24 Minutes | 80 (6.2%) | 100 (10.1%) |
| 25 to 29 Minutes | 164 (12.7%) | 89 (9.0%) |
| 30 to 34 Minutes | 59 (4.6%) | 216 (21.9%) |
| 35 to 39 Minutes | 153 (11.9%) | 69 (7.0%) |
| 40 to 44 Minutes | 359 (27.8%) | 63 (6.4%) |
| 45 to 59 Minutes | 291 (22.6%) | 191 (19.4%) |
| 60 to 89 Minutes | 146 (11.3%) | 55 (5.6%) |
| 90 or more Minutes | 0 (0.0%) | 47 (4.8%) |
Time of Departure to Work by Sex in South Run
The most frequent times of departure to work in South Run are 7:00 AM to 7:29 AM (274, 21.2%) for males and 7:30 AM to 7:59 AM (177, 17.9%) for females.
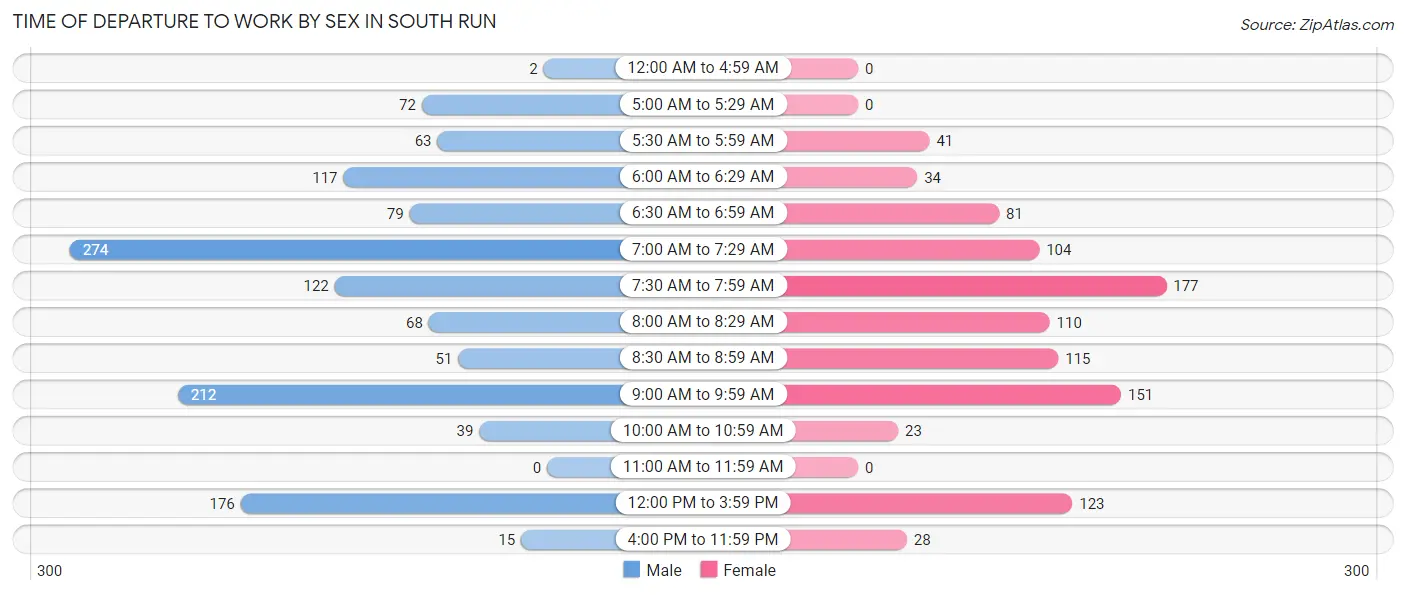
| Time of Departure | Male | Female |
| 12:00 AM to 4:59 AM | 2 (0.2%) | 0 (0.0%) |
| 5:00 AM to 5:29 AM | 72 (5.6%) | 0 (0.0%) |
| 5:30 AM to 5:59 AM | 63 (4.9%) | 41 (4.2%) |
| 6:00 AM to 6:29 AM | 117 (9.1%) | 34 (3.4%) |
| 6:30 AM to 6:59 AM | 79 (6.1%) | 81 (8.2%) |
| 7:00 AM to 7:29 AM | 274 (21.2%) | 104 (10.5%) |
| 7:30 AM to 7:59 AM | 122 (9.5%) | 177 (17.9%) |
| 8:00 AM to 8:29 AM | 68 (5.3%) | 110 (11.1%) |
| 8:30 AM to 8:59 AM | 51 (4.0%) | 115 (11.7%) |
| 9:00 AM to 9:59 AM | 212 (16.4%) | 151 (15.3%) |
| 10:00 AM to 10:59 AM | 39 (3.0%) | 23 (2.3%) |
| 11:00 AM to 11:59 AM | 0 (0.0%) | 0 (0.0%) |
| 12:00 PM to 3:59 PM | 176 (13.6%) | 123 (12.5%) |
| 4:00 PM to 11:59 PM | 15 (1.2%) | 28 (2.8%) |
| Total | 1,290 (100.0%) | 987 (100.0%) |
Housing Occupancy in South Run
Occupancy by Ownership in South Run
Of the total 2,098 dwellings in South Run, owner-occupied units account for 2,058 (98.1%), while renter-occupied units make up 40 (1.9%).
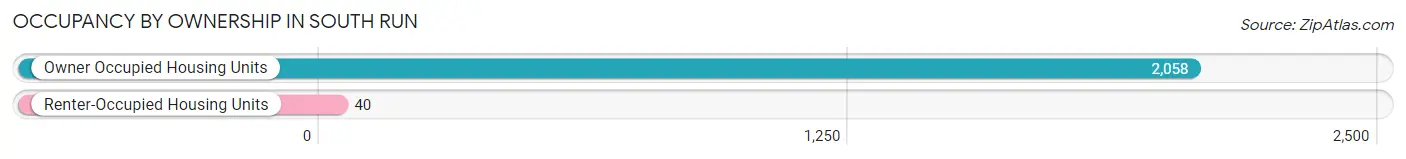
| Occupancy | # Housing Units | % Housing Units |
| Owner Occupied Housing Units | 2,058 | 98.1% |
| Renter-Occupied Housing Units | 40 | 1.9% |
| Total Occupied Housing Units | 2,098 | 100.0% |
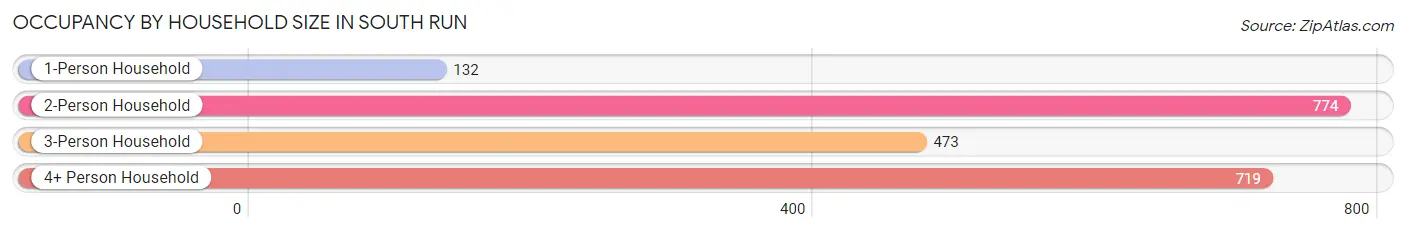
Occupancy by Household Size in South Run
| Household Size | # Housing Units | % Housing Units |
| 1-Person Household | 132 | 6.3% |
| 2-Person Household | 774 | 36.9% |
| 3-Person Household | 473 | 22.6% |
| 4+ Person Household | 719 | 34.3% |
| Total Housing Units | 2,098 | 100.0% |
Occupancy by Ownership by Household Size in South Run
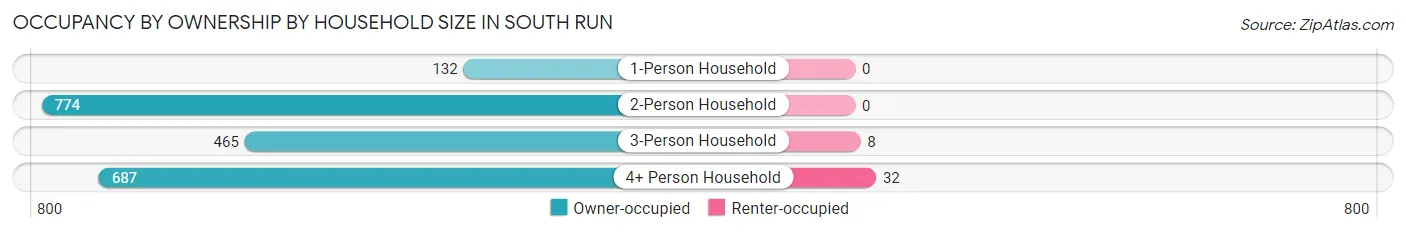
| Household Size | Owner-occupied | Renter-occupied |
| 1-Person Household | 132 (100.0%) | 0 (0.0%) |
| 2-Person Household | 774 (100.0%) | 0 (0.0%) |
| 3-Person Household | 465 (98.3%) | 8 (1.7%) |
| 4+ Person Household | 687 (95.6%) | 32 (4.4%) |
| Total Housing Units | 2,058 (98.1%) | 40 (1.9%) |
Occupancy by Educational Attainment in South Run
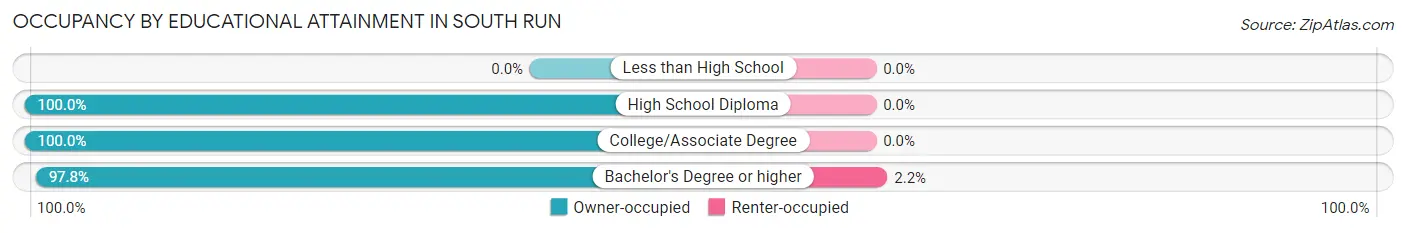
| Household Size | Owner-occupied | Renter-occupied |
| Less than High School | 0 (0.0%) | 0 (0.0%) |
| High School Diploma | 71 (100.0%) | 0 (0.0%) |
| College/Associate Degree | 218 (100.0%) | 0 (0.0%) |
| Bachelor's Degree or higher | 1,769 (97.8%) | 40 (2.2%) |
Occupancy by Age of Householder in South Run
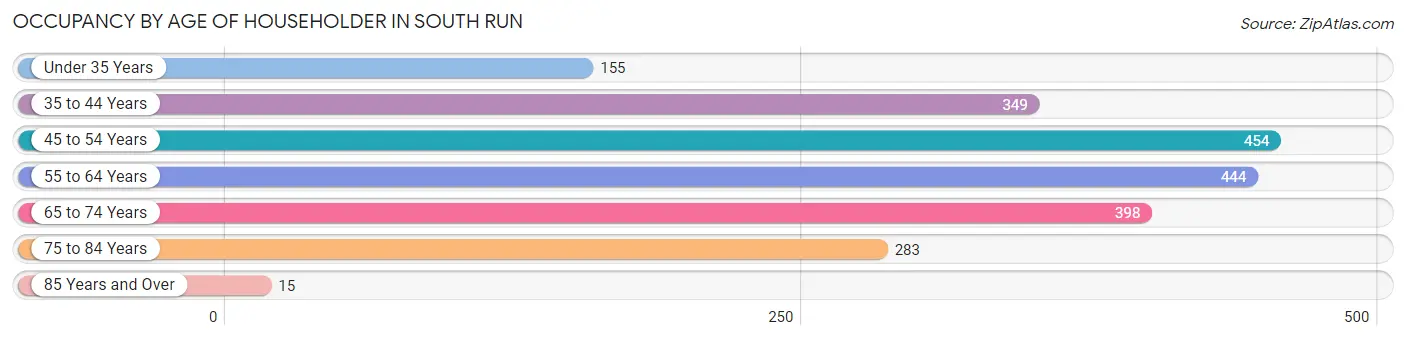
| Age Bracket | # Households | % Households |
| Under 35 Years | 155 | 7.4% |
| 35 to 44 Years | 349 | 16.6% |
| 45 to 54 Years | 454 | 21.6% |
| 55 to 64 Years | 444 | 21.2% |
| 65 to 74 Years | 398 | 19.0% |
| 75 to 84 Years | 283 | 13.5% |
| 85 Years and Over | 15 | 0.7% |
| Total | 2,098 | 100.0% |
Housing Finances in South Run
Median Income by Occupancy in South Run
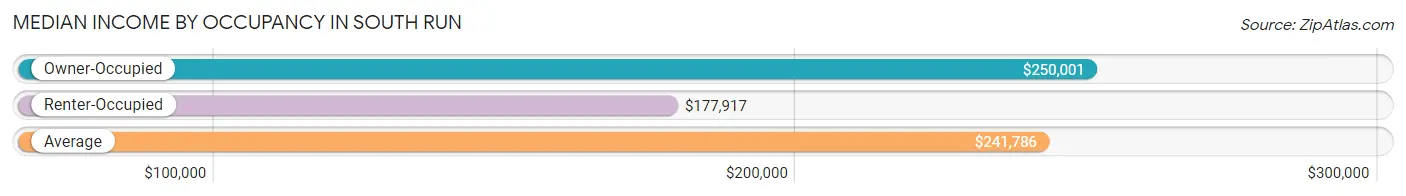
| Occupancy Type | # Households | Median Income |
| Owner-Occupied | 2,058 (98.1%) | $250,001 |
| Renter-Occupied | 40 (1.9%) | $177,917 |
| Average | 2,098 (100.0%) | $241,786 |
Occupancy by Householder Income Bracket in South Run
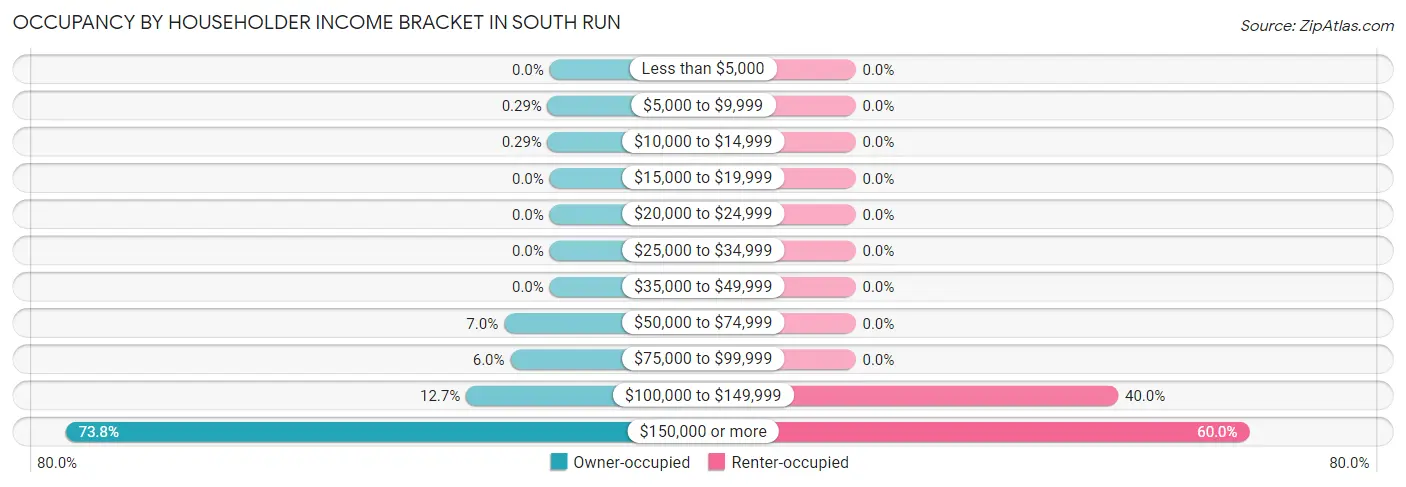
| Income Bracket | Owner-occupied | Renter-occupied |
| Less than $5,000 | 0 (0.0%) | 0 (0.0%) |
| $5,000 to $9,999 | 6 (0.3%) | 0 (0.0%) |
| $10,000 to $14,999 | 6 (0.3%) | 0 (0.0%) |
| $15,000 to $19,999 | 0 (0.0%) | 0 (0.0%) |
| $20,000 to $24,999 | 0 (0.0%) | 0 (0.0%) |
| $25,000 to $34,999 | 0 (0.0%) | 0 (0.0%) |
| $35,000 to $49,999 | 0 (0.0%) | 0 (0.0%) |
| $50,000 to $74,999 | 143 (7.0%) | 0 (0.0%) |
| $75,000 to $99,999 | 123 (6.0%) | 0 (0.0%) |
| $100,000 to $149,999 | 262 (12.7%) | 16 (40.0%) |
| $150,000 or more | 1,518 (73.8%) | 24 (60.0%) |
| Total | 2,058 (100.0%) | 40 (100.0%) |
Monthly Housing Cost Tiers in South Run
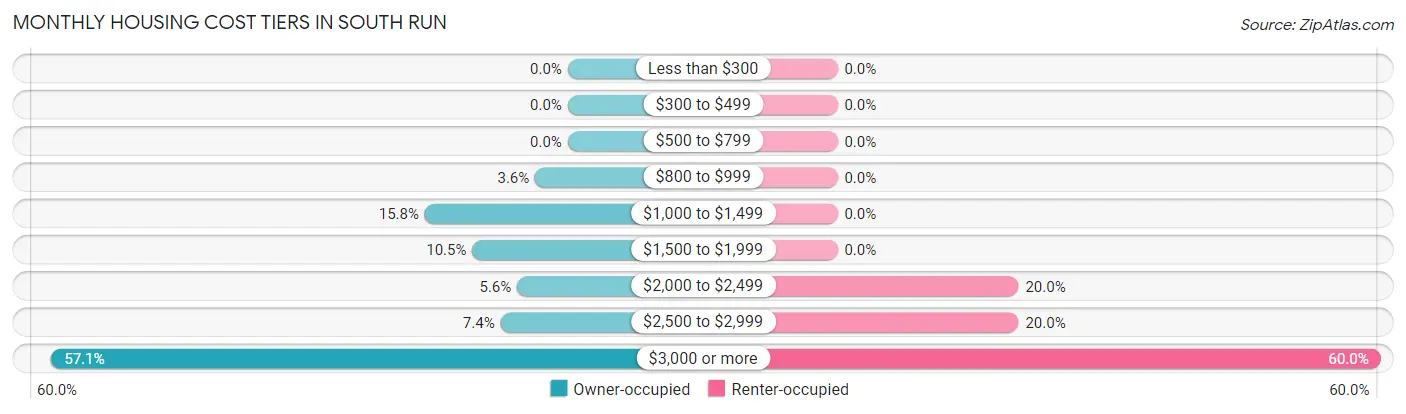
| Monthly Cost | Owner-occupied | Renter-occupied |
| Less than $300 | 0 (0.0%) | 0 (0.0%) |
| $300 to $499 | 0 (0.0%) | 0 (0.0%) |
| $500 to $799 | 0 (0.0%) | 0 (0.0%) |
| $800 to $999 | 74 (3.6%) | 0 (0.0%) |
| $1,000 to $1,499 | 325 (15.8%) | 0 (0.0%) |
| $1,500 to $1,999 | 217 (10.5%) | 0 (0.0%) |
| $2,000 to $2,499 | 115 (5.6%) | 8 (20.0%) |
| $2,500 to $2,999 | 153 (7.4%) | 8 (20.0%) |
| $3,000 or more | 1,174 (57.1%) | 24 (60.0%) |
| Total | 2,058 (100.0%) | 40 (100.0%) |
Physical Housing Characteristics in South Run
Housing Structures in South Run
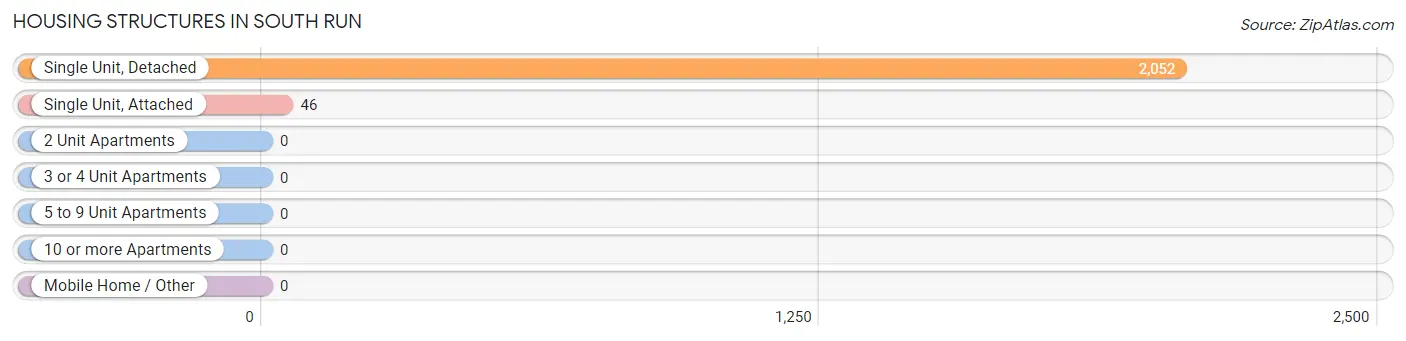
| Structure Type | # Housing Units | % Housing Units |
| Single Unit, Detached | 2,052 | 97.8% |
| Single Unit, Attached | 46 | 2.2% |
| 2 Unit Apartments | 0 | 0.0% |
| 3 or 4 Unit Apartments | 0 | 0.0% |
| 5 to 9 Unit Apartments | 0 | 0.0% |
| 10 or more Apartments | 0 | 0.0% |
| Mobile Home / Other | 0 | 0.0% |
| Total | 2,098 | 100.0% |
Housing Structures by Occupancy in South Run
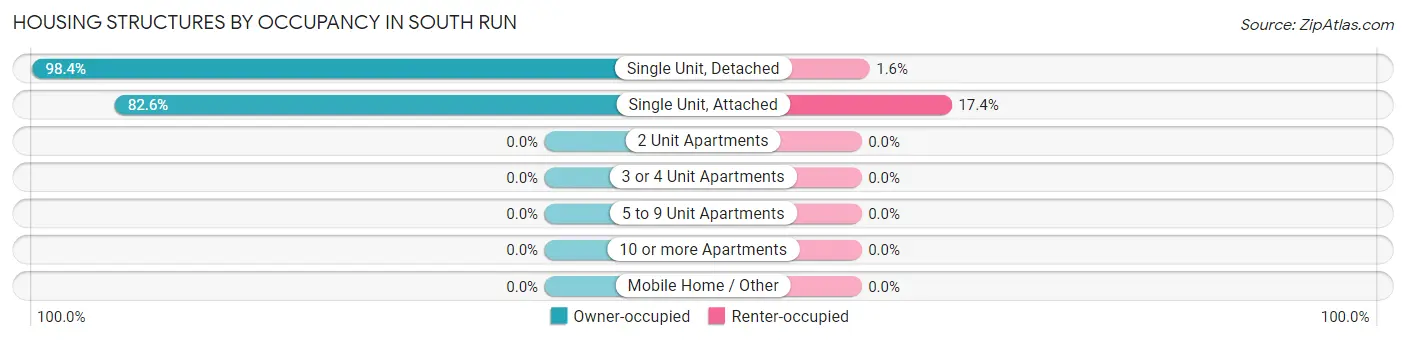
| Structure Type | Owner-occupied | Renter-occupied |
| Single Unit, Detached | 2,020 (98.4%) | 32 (1.6%) |
| Single Unit, Attached | 38 (82.6%) | 8 (17.4%) |
| 2 Unit Apartments | 0 (0.0%) | 0 (0.0%) |
| 3 or 4 Unit Apartments | 0 (0.0%) | 0 (0.0%) |
| 5 to 9 Unit Apartments | 0 (0.0%) | 0 (0.0%) |
| 10 or more Apartments | 0 (0.0%) | 0 (0.0%) |
| Mobile Home / Other | 0 (0.0%) | 0 (0.0%) |
| Total | 2,058 (98.1%) | 40 (1.9%) |
Housing Structures by Number of Rooms in South Run
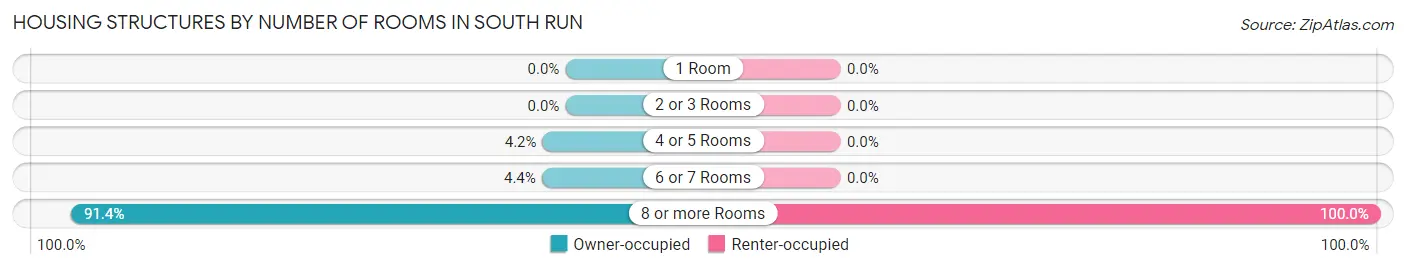
| Number of Rooms | Owner-occupied | Renter-occupied |
| 1 Room | 0 (0.0%) | 0 (0.0%) |
| 2 or 3 Rooms | 0 (0.0%) | 0 (0.0%) |
| 4 or 5 Rooms | 87 (4.2%) | 0 (0.0%) |
| 6 or 7 Rooms | 90 (4.4%) | 0 (0.0%) |
| 8 or more Rooms | 1,881 (91.4%) | 40 (100.0%) |
| Total | 2,058 (100.0%) | 40 (100.0%) |
Housing Structure by Heating Type in South Run
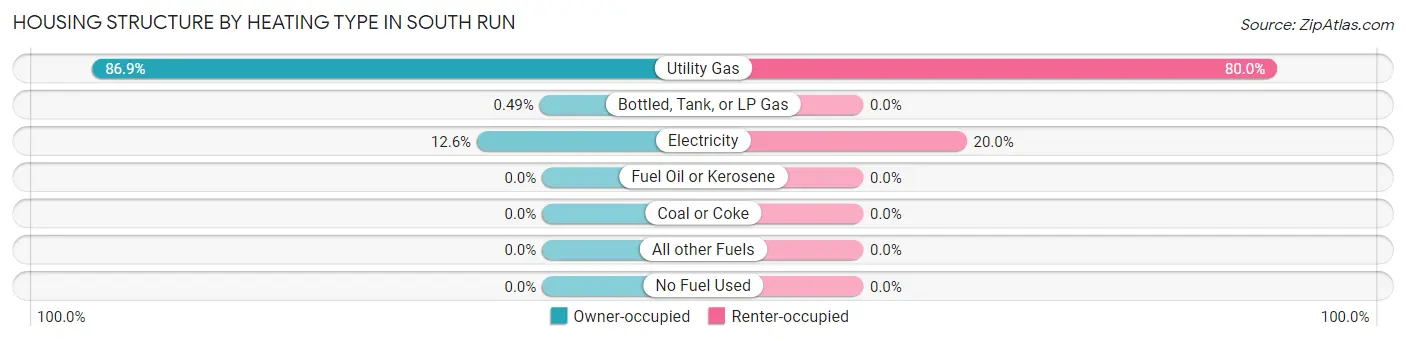
| Heating Type | Owner-occupied | Renter-occupied |
| Utility Gas | 1,789 (86.9%) | 32 (80.0%) |
| Bottled, Tank, or LP Gas | 10 (0.5%) | 0 (0.0%) |
| Electricity | 259 (12.6%) | 8 (20.0%) |
| Fuel Oil or Kerosene | 0 (0.0%) | 0 (0.0%) |
| Coal or Coke | 0 (0.0%) | 0 (0.0%) |
| All other Fuels | 0 (0.0%) | 0 (0.0%) |
| No Fuel Used | 0 (0.0%) | 0 (0.0%) |
| Total | 2,058 (100.0%) | 40 (100.0%) |
Household Vehicle Usage in South Run
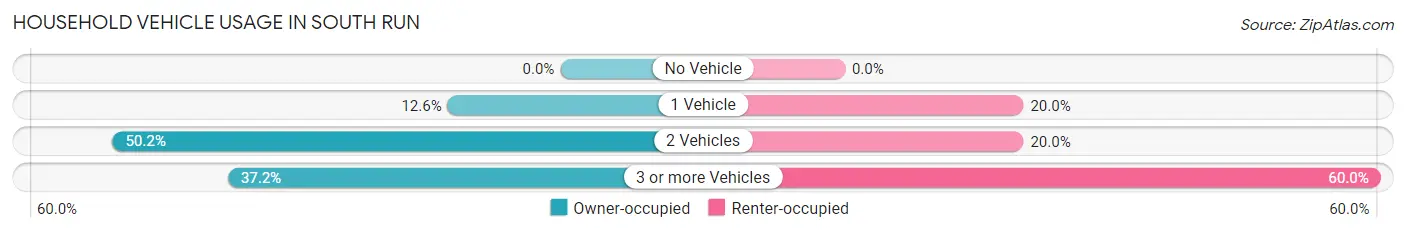
| Vehicles per Household | Owner-occupied | Renter-occupied |
| No Vehicle | 0 (0.0%) | 0 (0.0%) |
| 1 Vehicle | 260 (12.6%) | 8 (20.0%) |
| 2 Vehicles | 1,032 (50.1%) | 8 (20.0%) |
| 3 or more Vehicles | 766 (37.2%) | 24 (60.0%) |
| Total | 2,058 (100.0%) | 40 (100.0%) |
Real Estate & Mortgages in South Run
Real Estate and Mortgage Overview in South Run
| Characteristic | Without Mortgage | With Mortgage |
| Housing Units | 528 | 1,530 |
| Median Property Value | $867,200 | $906,500 |
| Median Household Income | $156,071 | $1,226 |
| Monthly Housing Costs | $1,302 | $1,174 |
| Real Estate Taxes | $9,885 | $18 |
Property Value by Mortgage Status in South Run
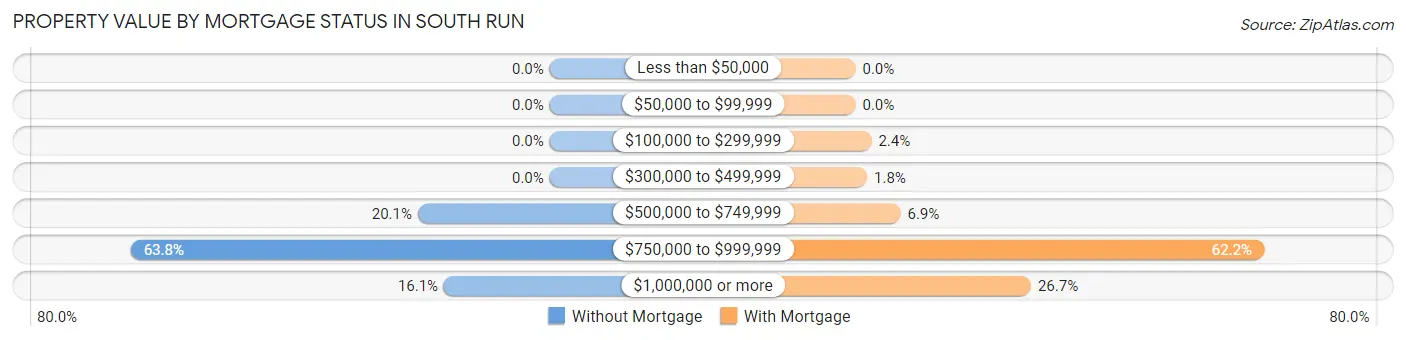
| Property Value | Without Mortgage | With Mortgage |
| Less than $50,000 | 0 (0.0%) | 0 (0.0%) |
| $50,000 to $99,999 | 0 (0.0%) | 0 (0.0%) |
| $100,000 to $299,999 | 0 (0.0%) | 37 (2.4%) |
| $300,000 to $499,999 | 0 (0.0%) | 27 (1.8%) |
| $500,000 to $749,999 | 106 (20.1%) | 105 (6.9%) |
| $750,000 to $999,999 | 337 (63.8%) | 952 (62.2%) |
| $1,000,000 or more | 85 (16.1%) | 409 (26.7%) |
| Total | 528 (100.0%) | 1,530 (100.0%) |
Household Income by Mortgage Status in South Run
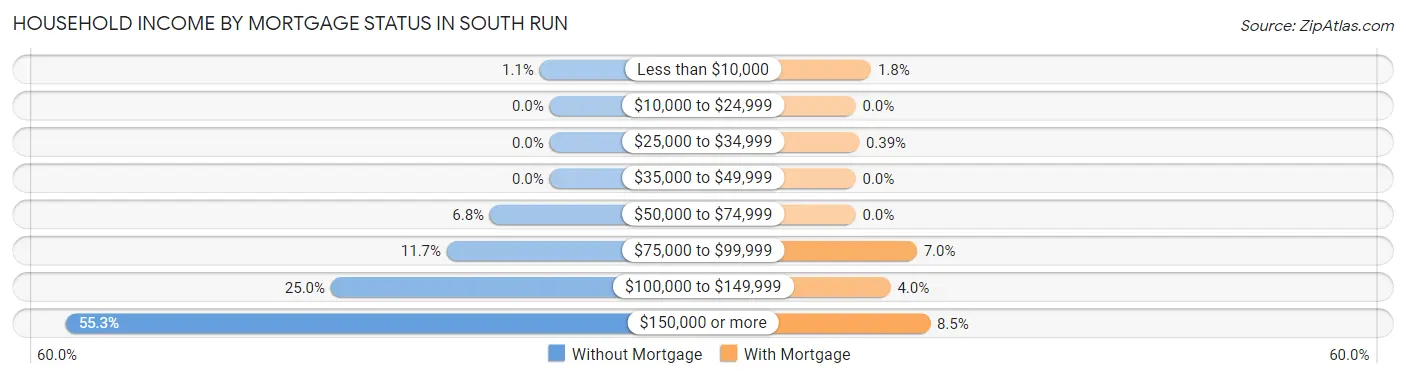
| Household Income | Without Mortgage | With Mortgage |
| Less than $10,000 | 6 (1.1%) | 27 (1.8%) |
| $10,000 to $24,999 | 0 (0.0%) | 0 (0.0%) |
| $25,000 to $34,999 | 0 (0.0%) | 6 (0.4%) |
| $35,000 to $49,999 | 0 (0.0%) | 0 (0.0%) |
| $50,000 to $74,999 | 36 (6.8%) | 0 (0.0%) |
| $75,000 to $99,999 | 62 (11.7%) | 107 (7.0%) |
| $100,000 to $149,999 | 132 (25.0%) | 61 (4.0%) |
| $150,000 or more | 292 (55.3%) | 130 (8.5%) |
| Total | 528 (100.0%) | 1,530 (100.0%) |
Property Value to Household Income Ratio in South Run
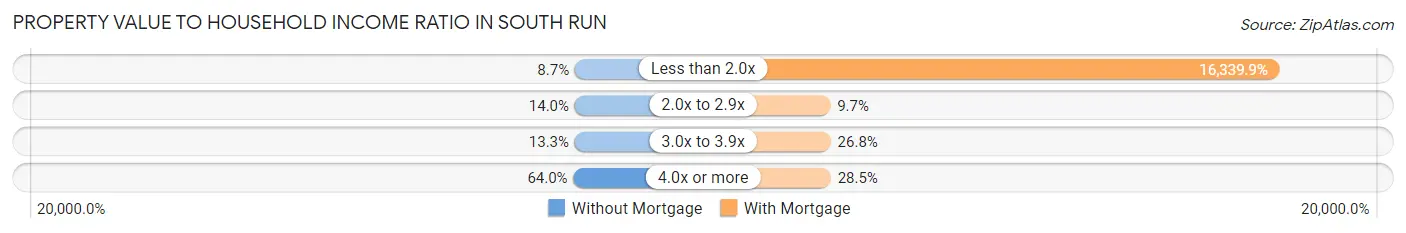
| Value-to-Income Ratio | Without Mortgage | With Mortgage |
| Less than 2.0x | 46 (8.7%) | 250,001 (16,339.9%) |
| 2.0x to 2.9x | 74 (14.0%) | 149 (9.7%) |
| 3.0x to 3.9x | 70 (13.3%) | 410 (26.8%) |
| 4.0x or more | 338 (64.0%) | 436 (28.5%) |
| Total | 528 (100.0%) | 1,530 (100.0%) |
Real Estate Taxes by Mortgage Status in South Run
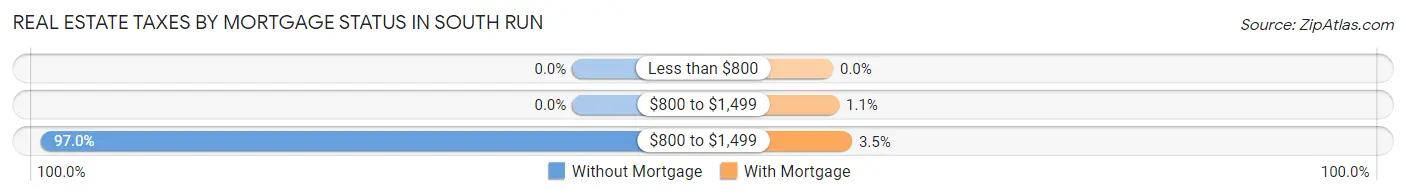
| Property Taxes | Without Mortgage | With Mortgage |
| Less than $800 | 0 (0.0%) | 0 (0.0%) |
| $800 to $1,499 | 0 (0.0%) | 17 (1.1%) |
| $800 to $1,499 | 512 (97.0%) | 53 (3.5%) |
| Total | 528 (100.0%) | 1,530 (100.0%) |
Health & Disability in South Run
Health Insurance Coverage by Age in South Run
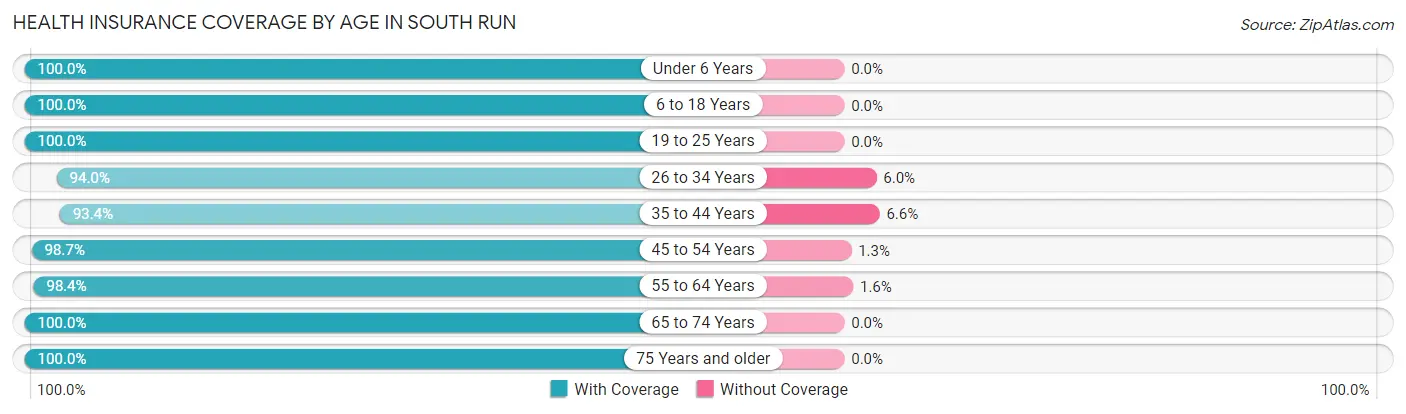
| Age Bracket | With Coverage | Without Coverage |
| Under 6 Years | 1,010 (100.0%) | 0 (0.0%) |
| 6 to 18 Years | 1,177 (100.0%) | 0 (0.0%) |
| 19 to 25 Years | 418 (100.0%) | 0 (0.0%) |
| 26 to 34 Years | 488 (94.0%) | 31 (6.0%) |
| 35 to 44 Years | 670 (93.4%) | 47 (6.6%) |
| 45 to 54 Years | 919 (98.7%) | 12 (1.3%) |
| 55 to 64 Years | 845 (98.4%) | 14 (1.6%) |
| 65 to 74 Years | 773 (100.0%) | 0 (0.0%) |
| 75 Years and older | 457 (100.0%) | 0 (0.0%) |
| Total | 6,757 (98.5%) | 104 (1.5%) |
Health Insurance Coverage by Citizenship Status in South Run
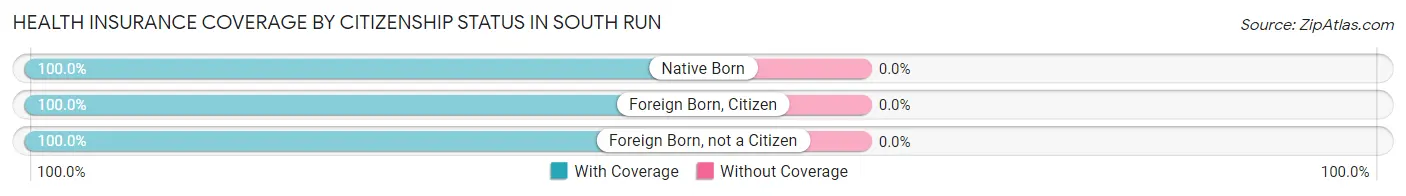
| Citizenship Status | With Coverage | Without Coverage |
| Native Born | 1,010 (100.0%) | 0 (0.0%) |
| Foreign Born, Citizen | 1,177 (100.0%) | 0 (0.0%) |
| Foreign Born, not a Citizen | 418 (100.0%) | 0 (0.0%) |
Health Insurance Coverage by Household Income in South Run
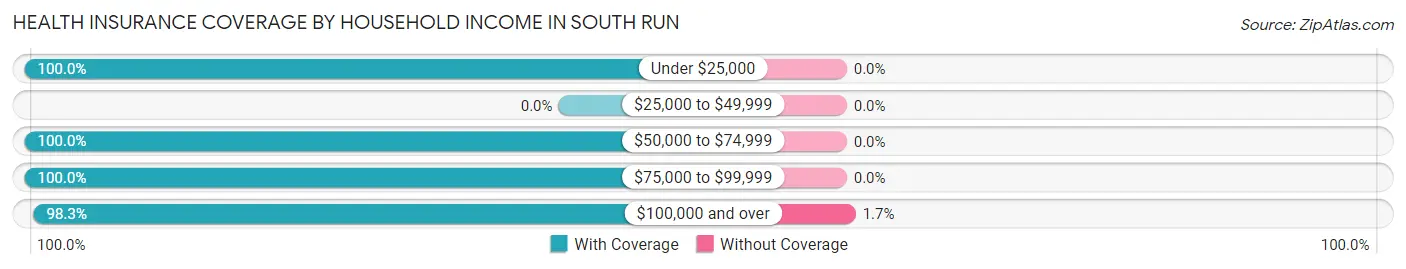
| Household Income | With Coverage | Without Coverage |
| Under $25,000 | 17 (100.0%) | 0 (0.0%) |
| $25,000 to $49,999 | 0 (0.0%) | 0 (0.0%) |
| $50,000 to $74,999 | 343 (100.0%) | 0 (0.0%) |
| $75,000 to $99,999 | 268 (100.0%) | 0 (0.0%) |
| $100,000 and over | 6,129 (98.3%) | 104 (1.7%) |
Public vs Private Health Insurance Coverage by Age in South Run
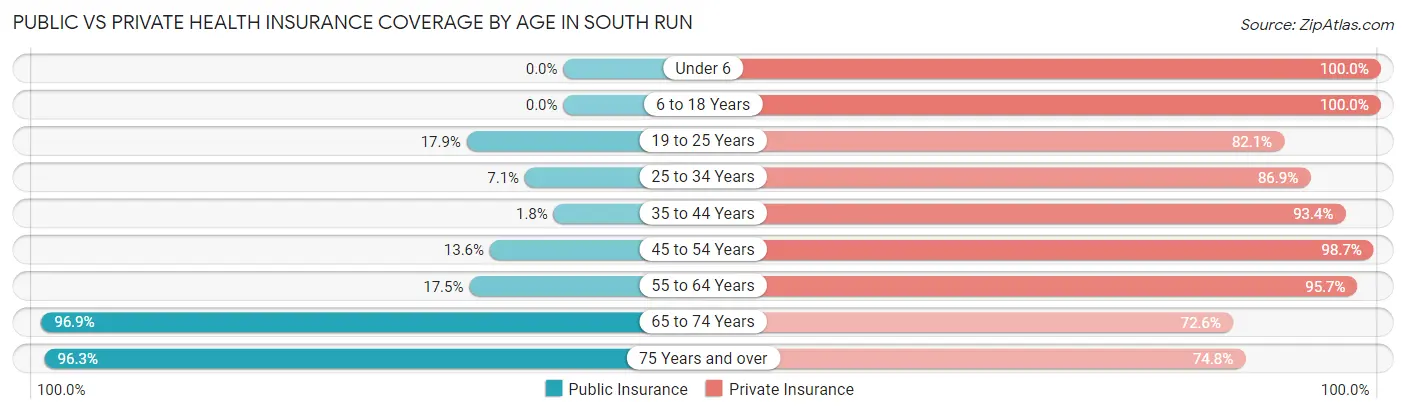
| Age Bracket | Public Insurance | Private Insurance |
| Under 6 | 0 (0.0%) | 1,010 (100.0%) |
| 6 to 18 Years | 0 (0.0%) | 1,177 (100.0%) |
| 19 to 25 Years | 75 (17.9%) | 343 (82.1%) |
| 25 to 34 Years | 37 (7.1%) | 451 (86.9%) |
| 35 to 44 Years | 13 (1.8%) | 670 (93.4%) |
| 45 to 54 Years | 127 (13.6%) | 919 (98.7%) |
| 55 to 64 Years | 150 (17.5%) | 822 (95.7%) |
| 65 to 74 Years | 749 (96.9%) | 561 (72.6%) |
| 75 Years and over | 440 (96.3%) | 342 (74.8%) |
| Total | 1,591 (23.2%) | 6,295 (91.7%) |
Disability Status by Sex by Age in South Run
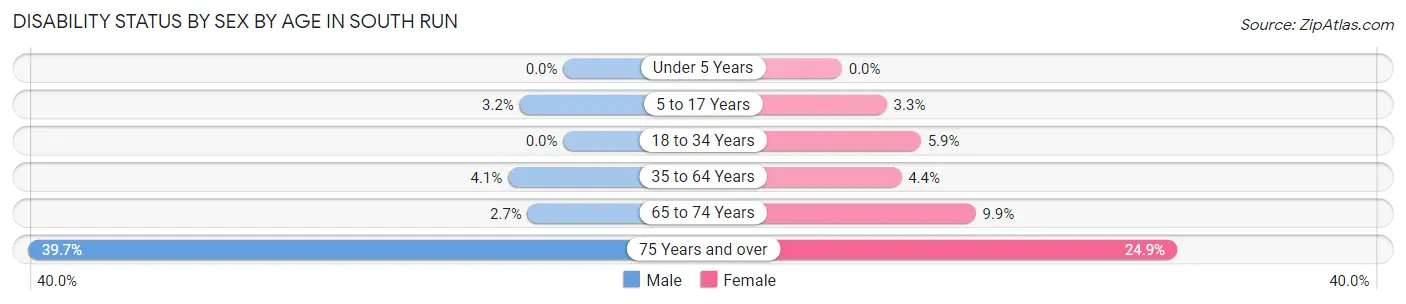
| Age Bracket | Male | Female |
| Under 5 Years | 0 (0.0%) | 0 (0.0%) |
| 5 to 17 Years | 21 (3.2%) | 17 (3.3%) |
| 18 to 34 Years | 0 (0.0%) | 29 (5.9%) |
| 35 to 64 Years | 48 (4.1%) | 59 (4.4%) |
| 65 to 74 Years | 9 (2.6%) | 43 (9.9%) |
| 75 Years and over | 100 (39.7%) | 51 (24.9%) |
Disability Class by Sex by Age in South Run
Disability Class: Hearing Difficulty
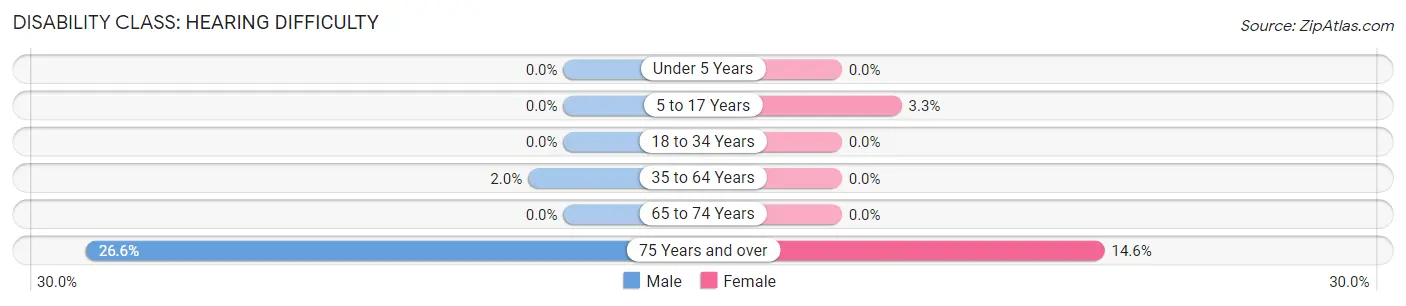
| Age Bracket | Male | Female |
| Under 5 Years | 0 (0.0%) | 0 (0.0%) |
| 5 to 17 Years | 0 (0.0%) | 17 (3.3%) |
| 18 to 34 Years | 0 (0.0%) | 0 (0.0%) |
| 35 to 64 Years | 23 (2.0%) | 0 (0.0%) |
| 65 to 74 Years | 0 (0.0%) | 0 (0.0%) |
| 75 Years and over | 67 (26.6%) | 30 (14.6%) |
Disability Class: Vision Difficulty
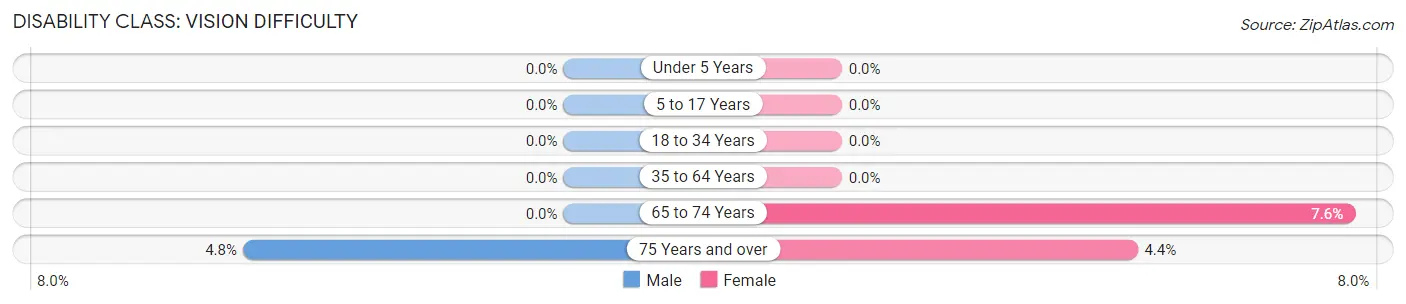
| Age Bracket | Male | Female |
| Under 5 Years | 0 (0.0%) | 0 (0.0%) |
| 5 to 17 Years | 0 (0.0%) | 0 (0.0%) |
| 18 to 34 Years | 0 (0.0%) | 0 (0.0%) |
| 35 to 64 Years | 0 (0.0%) | 0 (0.0%) |
| 65 to 74 Years | 0 (0.0%) | 33 (7.6%) |
| 75 Years and over | 12 (4.8%) | 9 (4.4%) |
Disability Class: Cognitive Difficulty
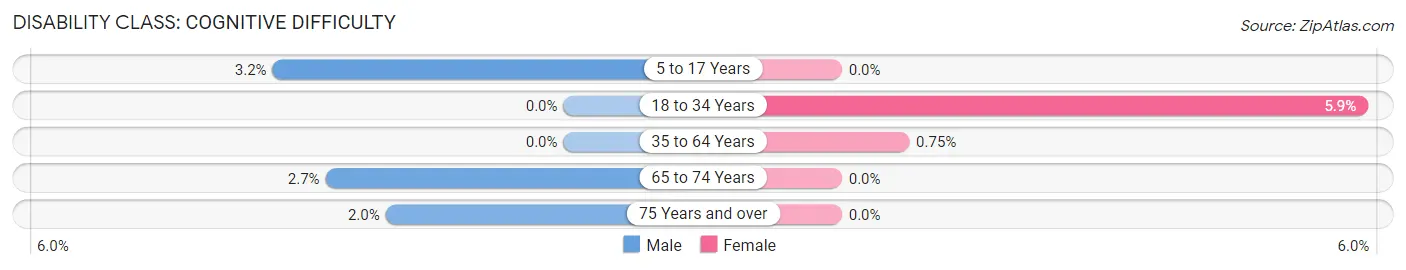
| Age Bracket | Male | Female |
| 5 to 17 Years | 21 (3.2%) | 0 (0.0%) |
| 18 to 34 Years | 0 (0.0%) | 29 (5.9%) |
| 35 to 64 Years | 0 (0.0%) | 10 (0.7%) |
| 65 to 74 Years | 9 (2.6%) | 0 (0.0%) |
| 75 Years and over | 5 (2.0%) | 0 (0.0%) |
Disability Class: Ambulatory Difficulty
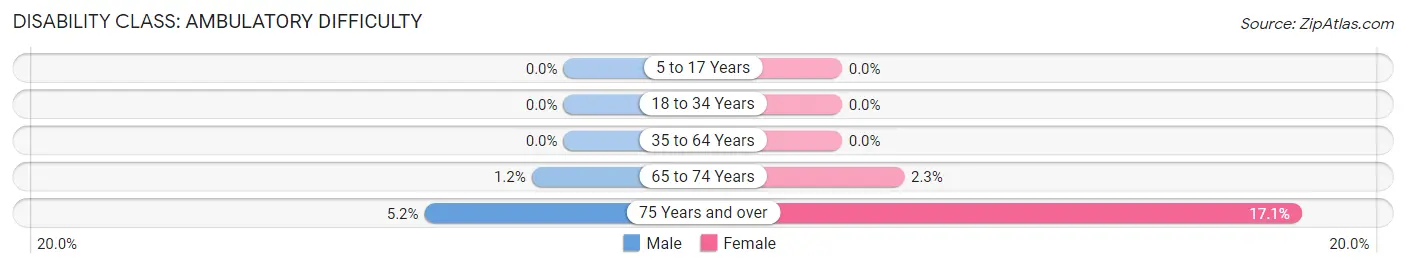
| Age Bracket | Male | Female |
| 5 to 17 Years | 0 (0.0%) | 0 (0.0%) |
| 18 to 34 Years | 0 (0.0%) | 0 (0.0%) |
| 35 to 64 Years | 0 (0.0%) | 0 (0.0%) |
| 65 to 74 Years | 4 (1.2%) | 10 (2.3%) |
| 75 Years and over | 13 (5.2%) | 35 (17.1%) |
Disability Class: Self-Care Difficulty
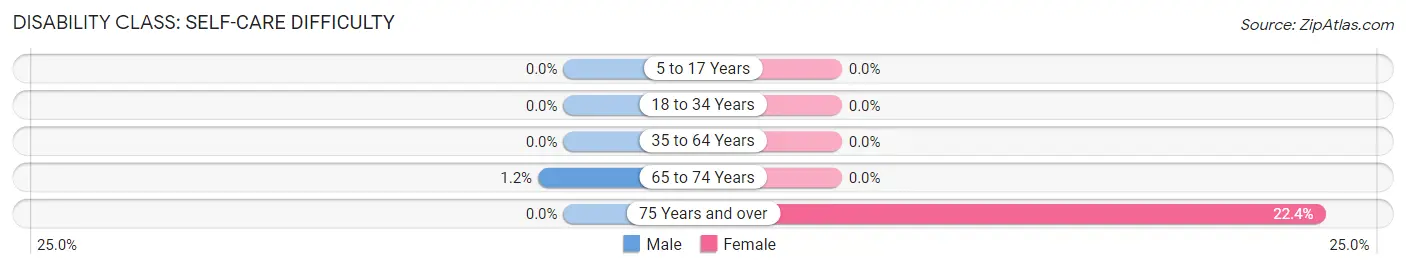
| Age Bracket | Male | Female |
| 5 to 17 Years | 0 (0.0%) | 0 (0.0%) |
| 18 to 34 Years | 0 (0.0%) | 0 (0.0%) |
| 35 to 64 Years | 0 (0.0%) | 0 (0.0%) |
| 65 to 74 Years | 4 (1.2%) | 0 (0.0%) |
| 75 Years and over | 0 (0.0%) | 46 (22.4%) |
Technology Access in South Run
Computing Device Access in South Run
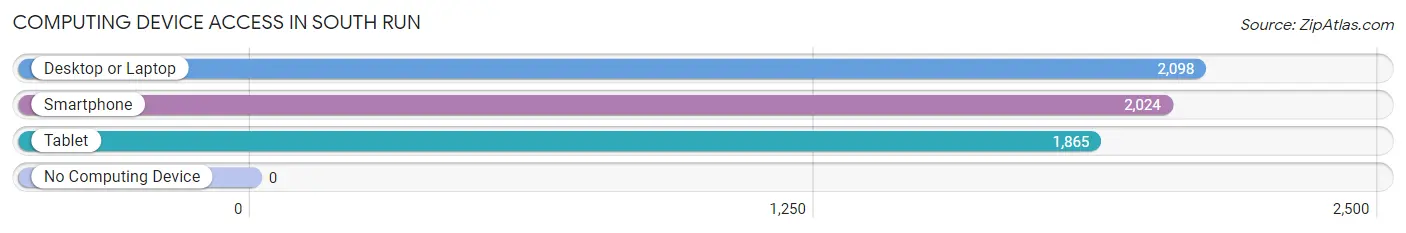
| Device Type | # Households | % Households |
| Desktop or Laptop | 2,098 | 100.0% |
| Smartphone | 2,024 | 96.5% |
| Tablet | 1,865 | 88.9% |
| No Computing Device | 0 | 0.0% |
| Total | 2,098 | 100.0% |
Internet Access in South Run
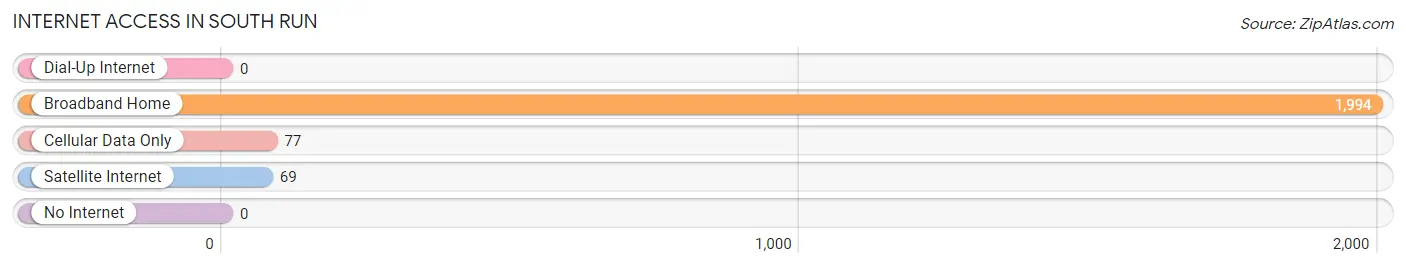
| Internet Type | # Households | % Households |
| Dial-Up Internet | 0 | 0.0% |
| Broadband Home | 1,994 | 95.0% |
| Cellular Data Only | 77 | 3.7% |
| Satellite Internet | 69 | 3.3% |
| No Internet | 0 | 0.0% |
| Total | 2,098 | 100.0% |
South Run Summary
Run, Virginia is a small unincorporated community located in Fairfax County, Virginia. It is situated in the southeastern corner of the county, just south of the city of Fairfax. The community is bordered by the towns of Clifton and Centreville to the north, and by the towns of Burke and Springfield to the south.
History
Run, Virginia was first settled in the late 1700s by a group of German immigrants. The area was originally known as “Run”, after the nearby creek of the same name. The creek was named after a local Native American tribe, the Runaways, who lived in the area prior to the arrival of the Europeans.
The area was primarily agricultural in nature, with the main crops being corn, wheat, and tobacco. The area was also home to a number of small businesses, including a blacksmith, a general store, and a post office.
In the late 1800s, the area began to experience a period of growth and development. The railroad was extended to the area, and a number of new businesses were established. The area also saw the construction of a number of churches, schools, and other public buildings.
Geography
Run, Virginia is located in the southeastern corner of Fairfax County, Virginia. It is situated just south of the city of Fairfax, and is bordered by the towns of Clifton and Centreville to the north, and by the towns of Burke and Springfield to the south.
The area is primarily rural in nature, with rolling hills and wooded areas. The area is also home to a number of small streams and creeks, including the Run Creek, which gives the area its name.
Economy
Run, Virginia is primarily a residential community, with a number of small businesses located in the area. The area is home to a number of small retail stores, restaurants, and other businesses. The area is also home to a number of small farms, which produce a variety of crops, including corn, wheat, and tobacco.
Demographics
As of the 2010 census, the population of Run, Virginia was 1,845. The population is primarily white (90.2%), with a small percentage of African Americans (4.2%) and Hispanics (3.2%). The median household income in the area is $90,000, and the median home value is $400,000.
Conclusion
Run, Virginia is a small unincorporated community located in Fairfax County, Virginia. It is situated in the southeastern corner of the county, just south of the city of Fairfax. The area is primarily rural in nature, with rolling hills and wooded areas. The area is primarily residential in nature, with a number of small businesses located in the area. The population of Run, Virginia is primarily white, with a small percentage of African Americans and Hispanics. The median household income in the area is $90,000, and the median home value is $400,000.
Common Questions
What is Per Capita Income in South Run?
Per Capita income in South Run is $82,026.
What is the Median Family Income in South Run?
Median Family Income in South Run is $250,001.
What is the Median Household income in South Run?
Median Household Income in South Run is $241,786.
What is Income or Wage Gap in South Run?
Income or Wage Gap in South Run is 43.6%.
Women in South Run earn 56.4 cents for every dollar earned by a man.
What is Inequality or Gini Index in South Run?
Inequality or Gini Index in South Run is 0.34.
What is the Total Population of South Run?
Total Population of South Run is 6,940.
What is the Total Male Population of South Run?
Total Male Population of South Run is 3,838.
What is the Total Female Population of South Run?
Total Female Population of South Run is 3,102.
What is the Ratio of Males per 100 Females in South Run?
There are 123.73 Males per 100 Females in South Run.
What is the Ratio of Females per 100 Males in South Run?
There are 80.82 Females per 100 Males in South Run.
What is the Median Population Age in South Run?
Median Population Age in South Run is 39.7 Years.
What is the Average Family Size in South Run
Average Family Size in South Run is 3.4 People.
What is the Average Household Size in South Run
Average Household Size in South Run is 3.3 People.
How Large is the Labor Force in South Run?
There are 3,241 People in the Labor Forcein in South Run.
What is the Percentage of People in the Labor Force in South Run?
65.6% of People are in the Labor Force in South Run.
What is the Unemployment Rate in South Run?
Unemployment Rate in South Run is 3.4%.