Stuart, VA Map & Demographics
Stuart Map
Stuart Overview
$22,332
PER CAPITA INCOME
$67,813
AVG FAMILY INCOME
$34,792
AVG HOUSEHOLD INCOME
25.3%
WAGE / INCOME GAP [ % ]
74.7¢/ $1
WAGE / INCOME GAP [ $ ]
0.48
INEQUALITY / GINI INDEX
1,533
TOTAL POPULATION
820
MALE POPULATION
713
FEMALE POPULATION
115.01
MALES / 100 FEMALES
86.95
FEMALES / 100 MALES
54.8
MEDIAN AGE
3.2
AVG FAMILY SIZE
2.1
AVG HOUSEHOLD SIZE
463
LABOR FORCE [ PEOPLE ]
35.7%
PERCENT IN LABOR FORCE
8.6%
UNEMPLOYMENT RATE
Stuart Zip Codes
Stuart Area Codes
Income in Stuart
Income Overview in Stuart
Per Capita Income in Stuart is $22,332, while median incomes of families and households are $67,813 and $34,792 respectively.
| Characteristic | Number | Measure |
| Per Capita Income | 1,533 | $22,332 |
| Median Family Income | 231 | $67,813 |
| Mean Family Income | 231 | $83,273 |
| Median Household Income | 538 | $34,792 |
| Mean Household Income | 538 | $54,141 |
| Income Deficit | 231 | $0 |
| Wage / Income Gap (%) | 1,533 | 25.34% |
| Wage / Income Gap ($) | 1,533 | 74.66¢ per $1 |
| Gini / Inequality Index | 1,533 | 0.48 |
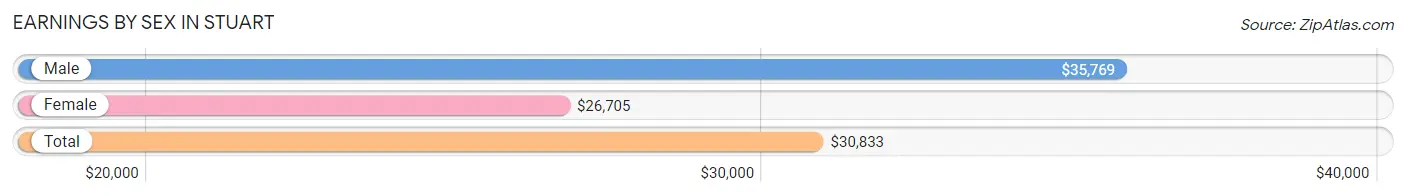
Earnings by Sex in Stuart
Average Earnings in Stuart are $30,833, $35,769 for men and $26,705 for women, a difference of 25.3%.
| Sex | Number | Average Earnings |
| Male | 264 (52.2%) | $35,769 |
| Female | 242 (47.8%) | $26,705 |
| Total | 506 (100.0%) | $30,833 |
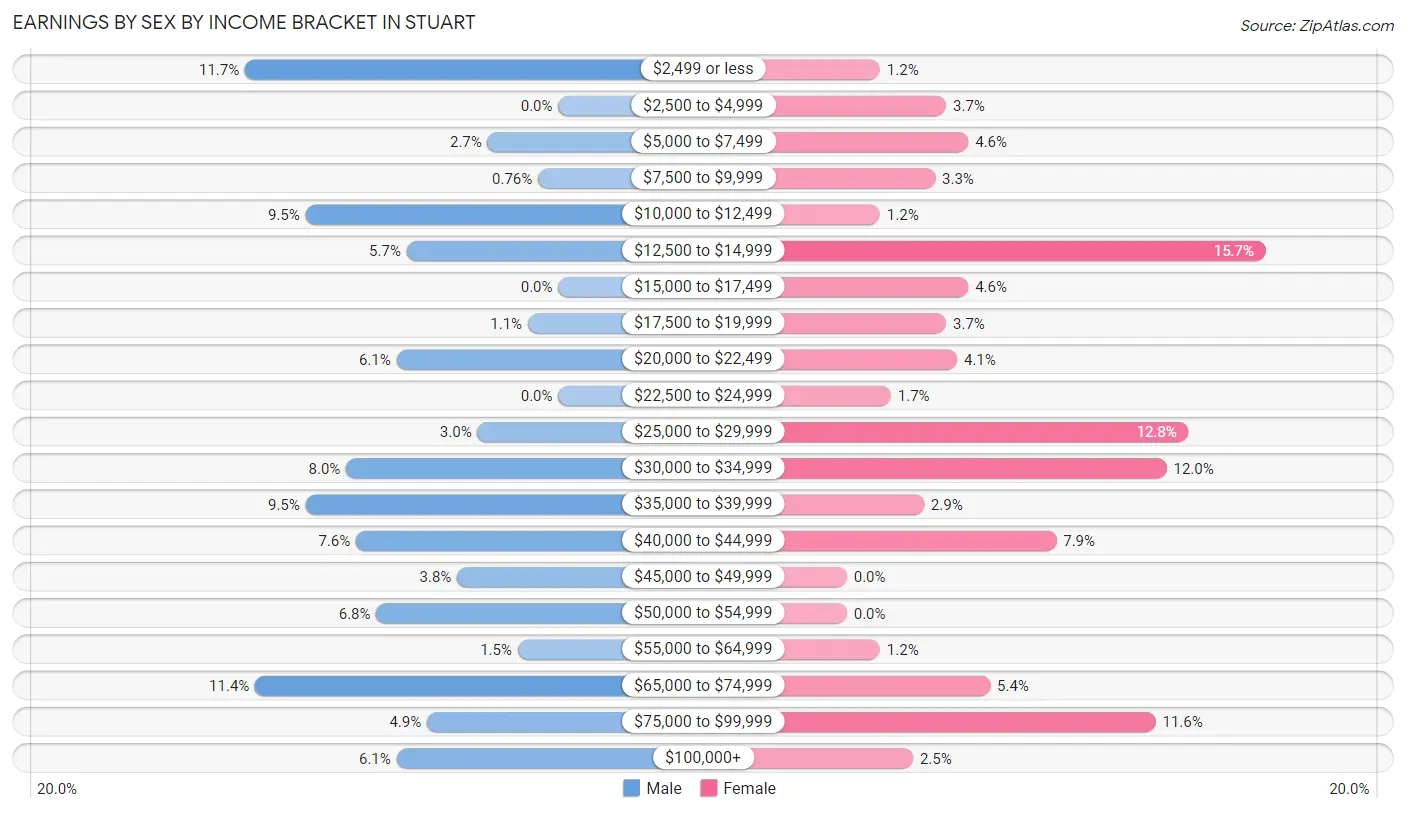
Earnings by Sex by Income Bracket in Stuart
The most common earnings brackets in Stuart are $2,499 or less for men (31 | 11.7%) and $12,500 to $14,999 for women (38 | 15.7%).
| Income | Male | Female |
| $2,499 or less | 31 (11.7%) | 3 (1.2%) |
| $2,500 to $4,999 | 0 (0.0%) | 9 (3.7%) |
| $5,000 to $7,499 | 7 (2.6%) | 11 (4.5%) |
| $7,500 to $9,999 | 2 (0.8%) | 8 (3.3%) |
| $10,000 to $12,499 | 25 (9.5%) | 3 (1.2%) |
| $12,500 to $14,999 | 15 (5.7%) | 38 (15.7%) |
| $15,000 to $17,499 | 0 (0.0%) | 11 (4.5%) |
| $17,500 to $19,999 | 3 (1.1%) | 9 (3.7%) |
| $20,000 to $22,499 | 16 (6.1%) | 10 (4.1%) |
| $22,500 to $24,999 | 0 (0.0%) | 4 (1.7%) |
| $25,000 to $29,999 | 8 (3.0%) | 31 (12.8%) |
| $30,000 to $34,999 | 21 (8.0%) | 29 (12.0%) |
| $35,000 to $39,999 | 25 (9.5%) | 7 (2.9%) |
| $40,000 to $44,999 | 20 (7.6%) | 19 (7.9%) |
| $45,000 to $49,999 | 10 (3.8%) | 0 (0.0%) |
| $50,000 to $54,999 | 18 (6.8%) | 0 (0.0%) |
| $55,000 to $64,999 | 4 (1.5%) | 3 (1.2%) |
| $65,000 to $74,999 | 30 (11.4%) | 13 (5.4%) |
| $75,000 to $99,999 | 13 (4.9%) | 28 (11.6%) |
| $100,000+ | 16 (6.1%) | 6 (2.5%) |
| Total | 264 (100.0%) | 242 (100.0%) |
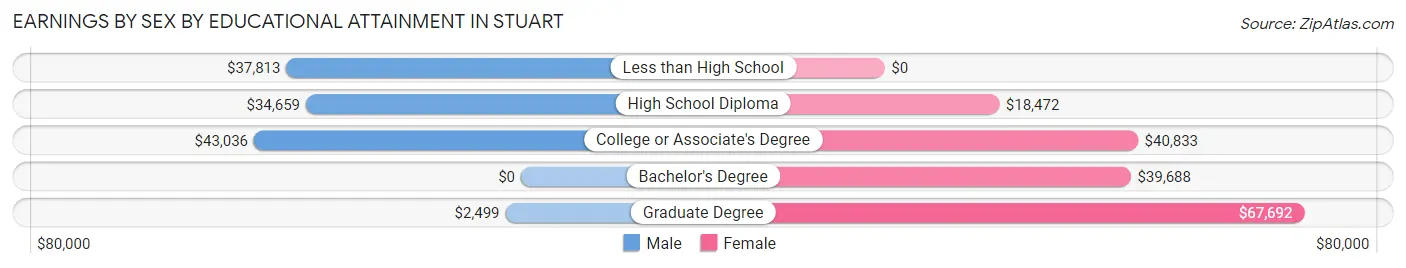
Earnings by Sex by Educational Attainment in Stuart
Average earnings in Stuart are $37,500 for men and $29,028 for women, a difference of 22.6%. Men with an educational attainment of college or associate's degree enjoy the highest average annual earnings of $43,036, while those with graduate degree education earn the least with $2,499. Women with an educational attainment of graduate degree earn the most with the average annual earnings of $67,692, while those with high school diploma education have the smallest earnings of $18,472.
| Educational Attainment | Male Income | Female Income |
| Less than High School | $37,813 | $0 |
| High School Diploma | $34,659 | $18,472 |
| College or Associate's Degree | $43,036 | $40,833 |
| Bachelor's Degree | - | - |
| Graduate Degree | $2,499 | $67,692 |
| Total | $37,500 | $29,028 |
Family Income in Stuart
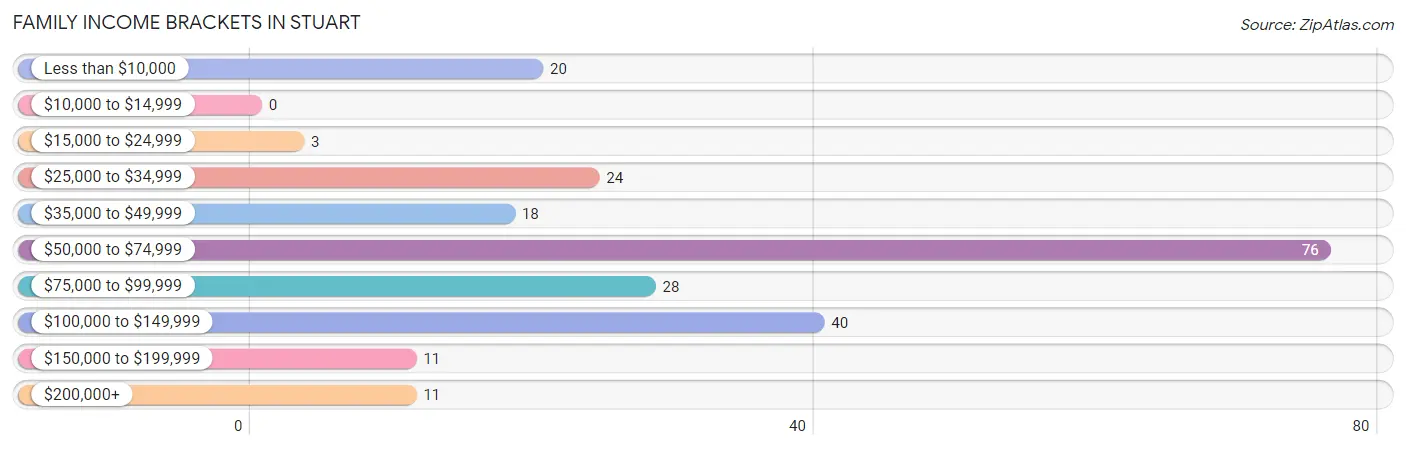
Family Income Brackets in Stuart
According to the Stuart family income data, there are 76 families falling into the $50,000 to $74,999 income range, which is the most common income bracket and makes up 32.9% of all families.
| Income Bracket | # Families | % Families |
| Less than $10,000 | 20 | 8.7% |
| $10,000 to $14,999 | 0 | 0.0% |
| $15,000 to $24,999 | 3 | 1.3% |
| $25,000 to $34,999 | 24 | 10.4% |
| $35,000 to $49,999 | 18 | 7.8% |
| $50,000 to $74,999 | 76 | 32.9% |
| $75,000 to $99,999 | 28 | 12.1% |
| $100,000 to $149,999 | 40 | 17.3% |
| $150,000 to $199,999 | 11 | 4.8% |
| $200,000+ | 11 | 4.8% |
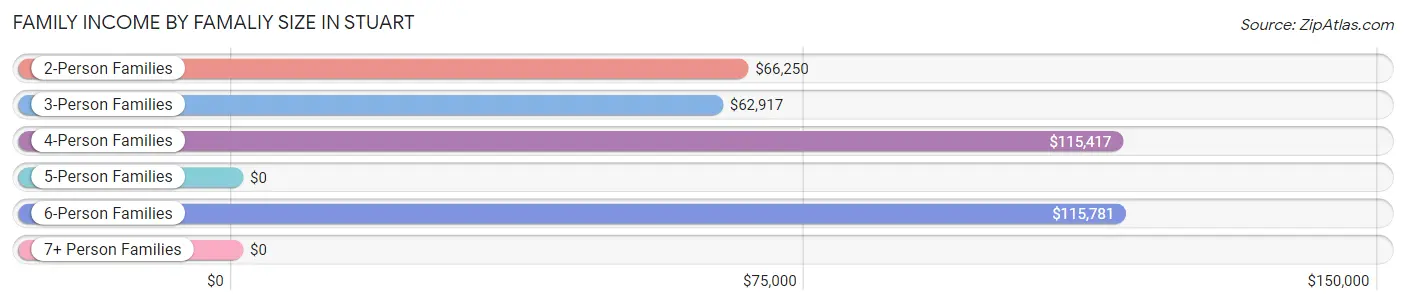
Family Income by Famaliy Size in Stuart
6-person families (17 | 7.4%) account for the highest median family income in Stuart with $115,781 per family, while 2-person families (128 | 55.4%) have the highest median income of $33,125 per family member.
| Income Bracket | # Families | Median Income |
| 2-Person Families | 128 (55.4%) | $66,250 |
| 3-Person Families | 48 (20.8%) | $62,917 |
| 4-Person Families | 23 (10.0%) | $115,417 |
| 5-Person Families | 15 (6.5%) | $0 |
| 6-Person Families | 17 (7.4%) | $115,781 |
| 7+ Person Families | 0 (0.0%) | $0 |
| Total | 231 (100.0%) | $67,813 |
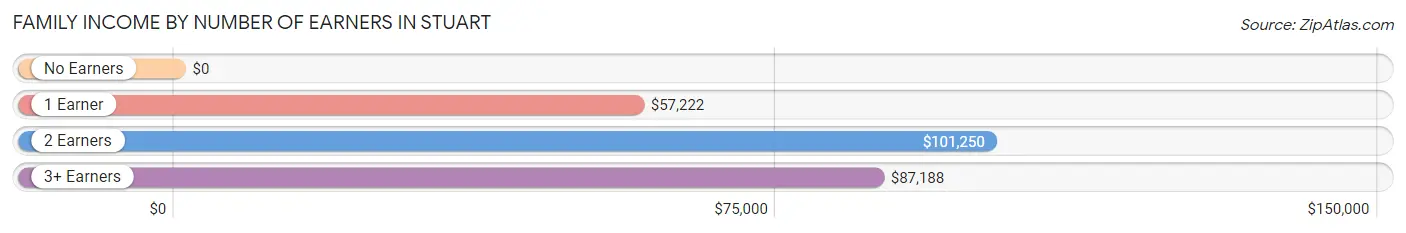
Family Income by Number of Earners in Stuart
| Number of Earners | # Families | Median Income |
| No Earners | 40 (17.3%) | $0 |
| 1 Earner | 92 (39.8%) | $57,222 |
| 2 Earners | 80 (34.6%) | $101,250 |
| 3+ Earners | 19 (8.2%) | $87,188 |
| Total | 231 (100.0%) | $67,813 |
Household Income in Stuart
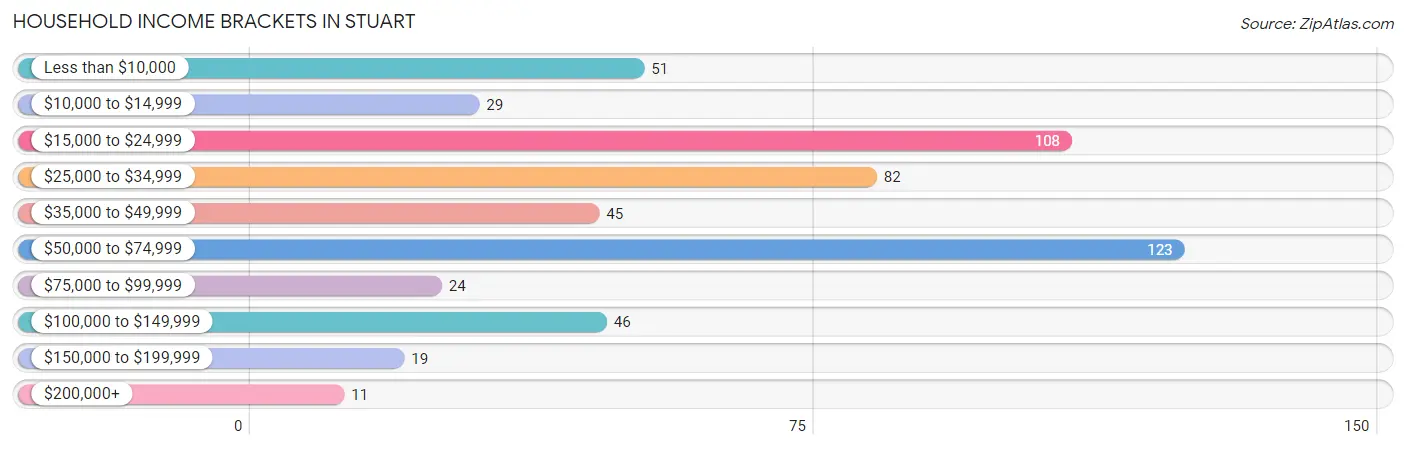
Household Income Brackets in Stuart
With 123 households falling in the category, the $50,000 to $74,999 income range is the most frequent in Stuart, accounting for 22.9% of all households. In contrast, only 11 households (2.0%) fall into the $200,000+ income bracket, making it the least populous group.
| Income Bracket | # Households | % Households |
| Less than $10,000 | 51 | 9.5% |
| $10,000 to $14,999 | 29 | 5.4% |
| $15,000 to $24,999 | 108 | 20.1% |
| $25,000 to $34,999 | 82 | 15.2% |
| $35,000 to $49,999 | 45 | 8.4% |
| $50,000 to $74,999 | 123 | 22.9% |
| $75,000 to $99,999 | 24 | 4.5% |
| $100,000 to $149,999 | 46 | 8.6% |
| $150,000 to $199,999 | 19 | 3.5% |
| $200,000+ | 11 | 2.0% |
Household Income by Householder Age in Stuart
The median household income in Stuart is $34,792, with the highest median household income of $56,250 found in the 45 to 64 years age bracket for the primary householder. A total of 230 households (42.7%) fall into this category. Meanwhile, the 15 to 24 years age bracket for the primary householder has the lowest median household income of $2,499, with 30 households (5.6%) in this group.
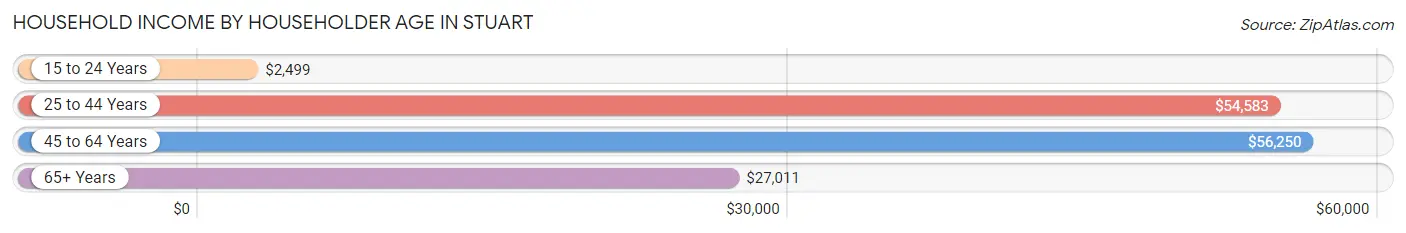
| Income Bracket | # Households | Median Income |
| 15 to 24 Years | 30 (5.6%) | $2,499 |
| 25 to 44 Years | 85 (15.8%) | $54,583 |
| 45 to 64 Years | 230 (42.7%) | $56,250 |
| 65+ Years | 193 (35.9%) | $27,011 |
| Total | 538 (100.0%) | $34,792 |
Poverty in Stuart
Income Below Poverty by Sex and Age in Stuart
With 13.8% poverty level for males and 20.0% for females among the residents of Stuart, 18 to 24 year old males and 18 to 24 year old females are the most vulnerable to poverty, with 24 males (54.5%) and 40 females (69.0%) in their respective age groups living below the poverty level.
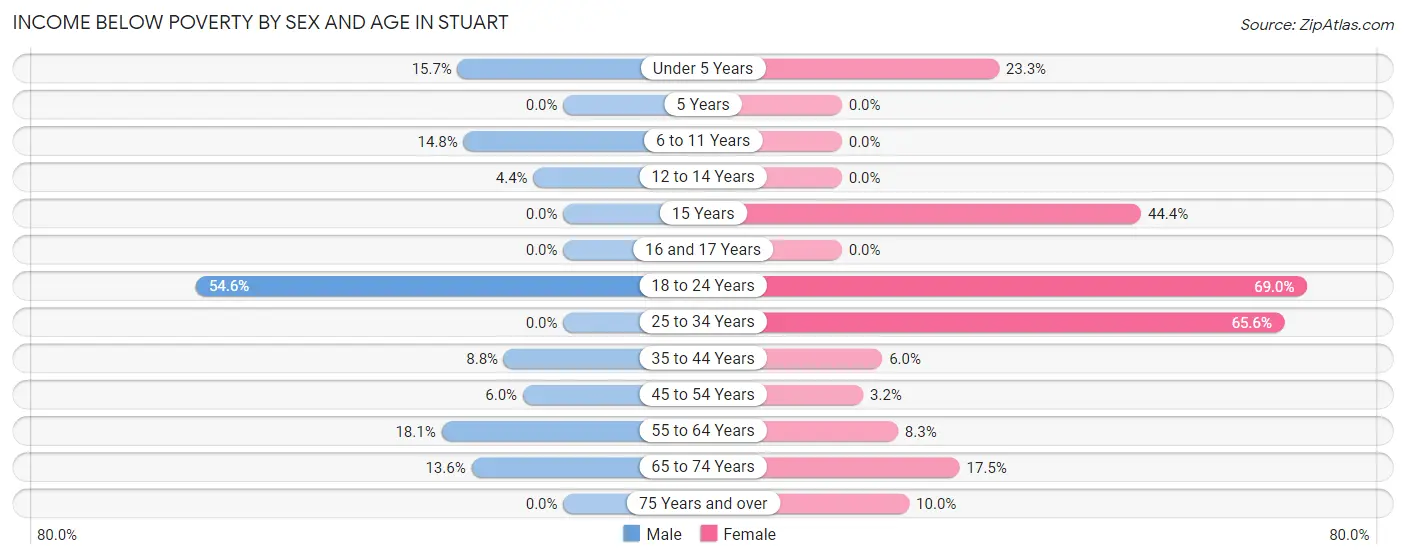
| Age Bracket | Male | Female |
| Under 5 Years | 8 (15.7%) | 7 (23.3%) |
| 5 Years | 0 (0.0%) | 0 (0.0%) |
| 6 to 11 Years | 12 (14.8%) | 0 (0.0%) |
| 12 to 14 Years | 2 (4.4%) | 0 (0.0%) |
| 15 Years | 0 (0.0%) | 4 (44.4%) |
| 16 and 17 Years | 0 (0.0%) | 0 (0.0%) |
| 18 to 24 Years | 24 (54.5%) | 40 (69.0%) |
| 25 to 34 Years | 0 (0.0%) | 21 (65.6%) |
| 35 to 44 Years | 3 (8.8%) | 3 (6.0%) |
| 45 to 54 Years | 3 (6.0%) | 3 (3.2%) |
| 55 to 64 Years | 19 (18.1%) | 7 (8.3%) |
| 65 to 74 Years | 9 (13.6%) | 14 (17.5%) |
| 75 Years and over | 0 (0.0%) | 7 (10.0%) |
| Total | 80 (13.8%) | 106 (20.0%) |
Income Above Poverty by Sex and Age in Stuart
According to the poverty statistics in Stuart, males aged 15 years and females aged 6 to 11 years are the age groups that are most secure financially, with 100.0% of males and 100.0% of females in these age groups living above the poverty line.
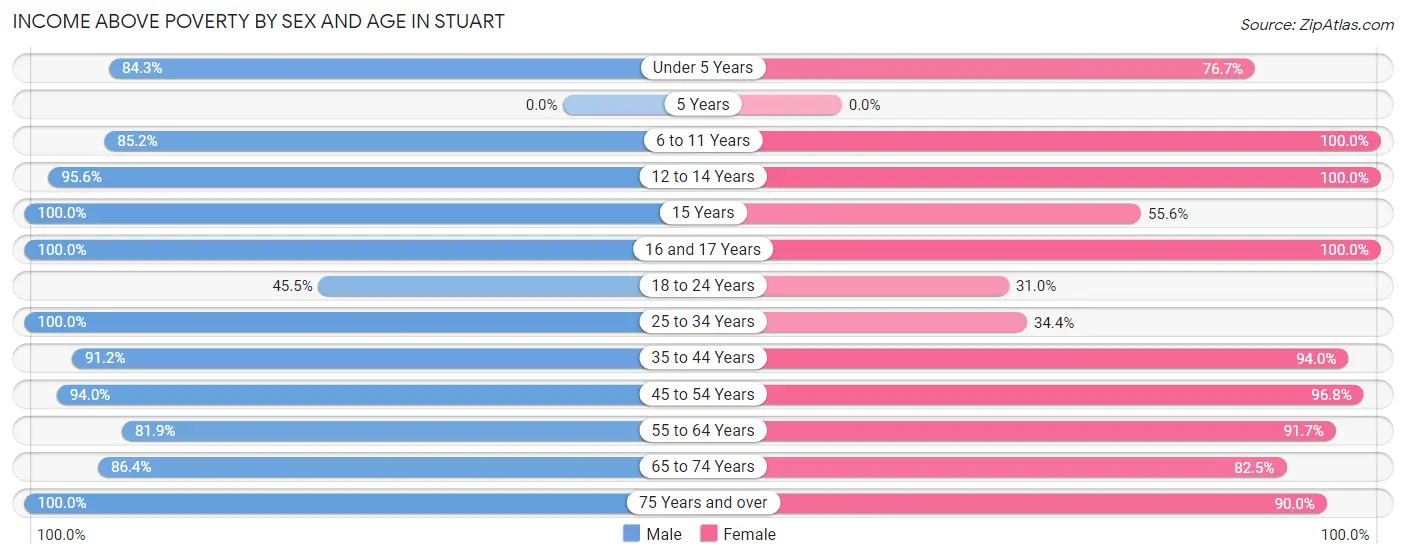
| Age Bracket | Male | Female |
| Under 5 Years | 43 (84.3%) | 23 (76.7%) |
| 5 Years | 0 (0.0%) | 0 (0.0%) |
| 6 to 11 Years | 69 (85.2%) | 12 (100.0%) |
| 12 to 14 Years | 43 (95.6%) | 2 (100.0%) |
| 15 Years | 5 (100.0%) | 5 (55.6%) |
| 16 and 17 Years | 5 (100.0%) | 9 (100.0%) |
| 18 to 24 Years | 20 (45.5%) | 18 (31.0%) |
| 25 to 34 Years | 34 (100.0%) | 11 (34.4%) |
| 35 to 44 Years | 31 (91.2%) | 47 (94.0%) |
| 45 to 54 Years | 47 (94.0%) | 92 (96.8%) |
| 55 to 64 Years | 86 (81.9%) | 77 (91.7%) |
| 65 to 74 Years | 57 (86.4%) | 66 (82.5%) |
| 75 Years and over | 62 (100.0%) | 63 (90.0%) |
| Total | 502 (86.3%) | 425 (80.0%) |
Income Below Poverty Among Married-Couple Families in Stuart
The poverty statistics for married-couple families in Stuart show that 1.3% or 2 of the total 160 families live below the poverty line. Families with no children have the highest poverty rate of 1.9%, comprising of 2 families. On the other hand, families with 1 or 2 children have the lowest poverty rate of 0.0%, which includes 0 families.
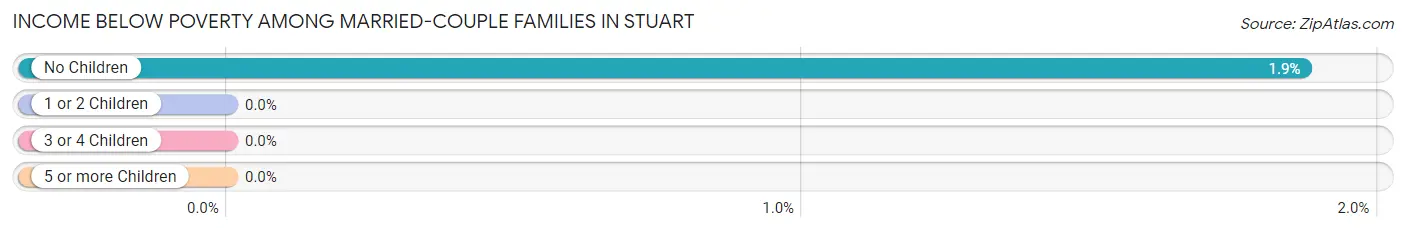
| Children | Above Poverty | Below Poverty |
| No Children | 105 (98.1%) | 2 (1.9%) |
| 1 or 2 Children | 24 (100.0%) | 0 (0.0%) |
| 3 or 4 Children | 29 (100.0%) | 0 (0.0%) |
| 5 or more Children | 0 (0.0%) | 0 (0.0%) |
| Total | 158 (98.8%) | 2 (1.3%) |
Income Below Poverty Among Single-Parent Households in Stuart
According to the poverty data in Stuart, 15.0% or 3 single-father households and 45.1% or 23 single-mother households are living below the poverty line. Among single-father households, those with no children have the highest poverty rate, with 3 households (21.4%) experiencing poverty. Likewise, among single-mother households, those with 3 or 4 children have the highest poverty rate, with 5 households (100.0%) falling below the poverty line.
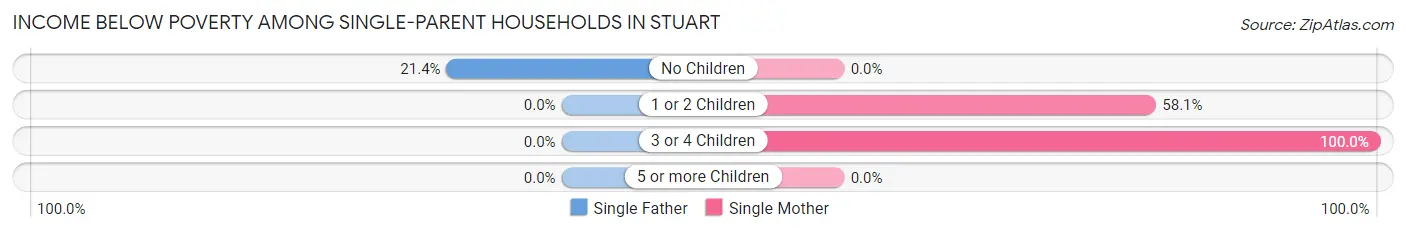
| Children | Single Father | Single Mother |
| No Children | 3 (21.4%) | 0 (0.0%) |
| 1 or 2 Children | 0 (0.0%) | 18 (58.1%) |
| 3 or 4 Children | 0 (0.0%) | 5 (100.0%) |
| 5 or more Children | 0 (0.0%) | 0 (0.0%) |
| Total | 3 (15.0%) | 23 (45.1%) |
Income Below Poverty Among Married-Couple vs Single-Parent Households in Stuart
The poverty data for Stuart shows that 2 of the married-couple family households (1.3%) and 26 of the single-parent households (36.6%) are living below the poverty level. Within the married-couple family households, those with no children have the highest poverty rate, with 2 households (1.9%) falling below the poverty line. Among the single-parent households, those with 3 or 4 children have the highest poverty rate, with 5 household (100.0%) living below poverty.
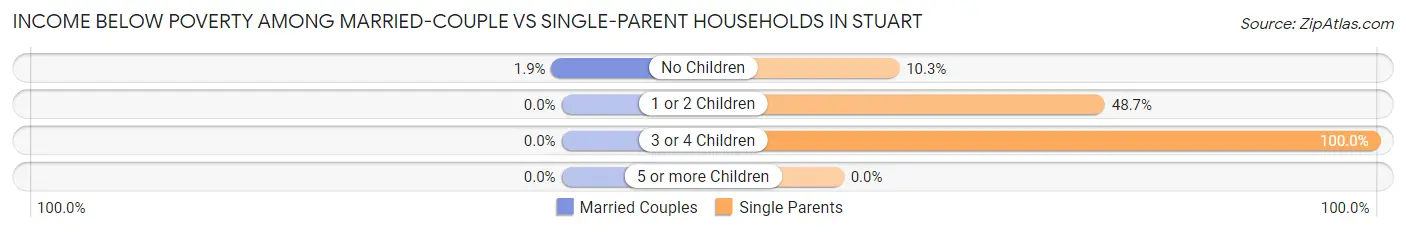
| Children | Married-Couple Families | Single-Parent Households |
| No Children | 2 (1.9%) | 3 (10.3%) |
| 1 or 2 Children | 0 (0.0%) | 18 (48.6%) |
| 3 or 4 Children | 0 (0.0%) | 5 (100.0%) |
| 5 or more Children | 0 (0.0%) | 0 (0.0%) |
| Total | 2 (1.3%) | 26 (36.6%) |
Race in Stuart
The most populous races in Stuart are White / Caucasian (1,328 | 86.6%), Black / African American (125 | 8.2%), and Hispanic or Latino (60 | 3.9%).
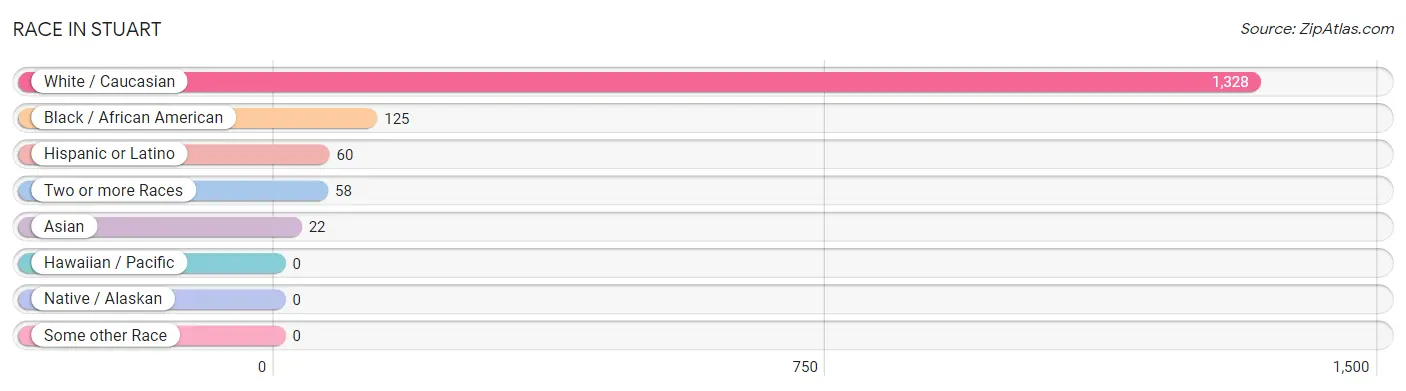
| Race | # Population | % Population |
| Asian | 22 | 1.4% |
| Black / African American | 125 | 8.2% |
| Hawaiian / Pacific | 0 | 0.0% |
| Hispanic or Latino | 60 | 3.9% |
| Native / Alaskan | 0 | 0.0% |
| White / Caucasian | 1,328 | 86.6% |
| Two or more Races | 58 | 3.8% |
| Some other Race | 0 | 0.0% |
| Total | 1,533 | 100.0% |
Ancestry in Stuart
The most populous ancestries reported in Stuart are American (588 | 38.4%), English (228 | 14.9%), German (131 | 8.6%), Irish (58 | 3.8%), and Italian (29 | 1.9%), together accounting for 67.4% of all Stuart residents.
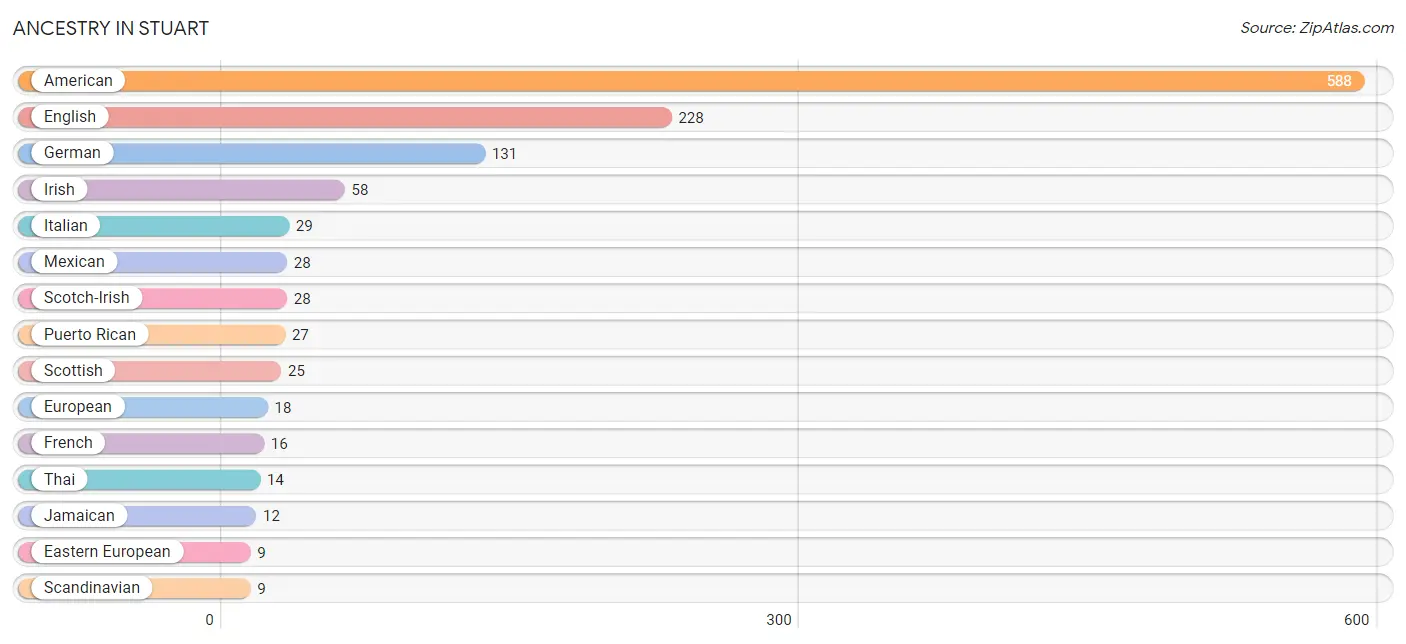
| Ancestry | # Population | % Population |
| American | 588 | 38.4% |
| Blackfeet | 3 | 0.2% |
| Cherokee | 3 | 0.2% |
| Eastern European | 9 | 0.6% |
| English | 228 | 14.9% |
| European | 18 | 1.2% |
| French | 16 | 1.0% |
| German | 131 | 8.6% |
| Irish | 58 | 3.8% |
| Italian | 29 | 1.9% |
| Jamaican | 12 | 0.8% |
| Mexican | 28 | 1.8% |
| Puerto Rican | 27 | 1.8% |
| Russian | 4 | 0.3% |
| Scandinavian | 9 | 0.6% |
| Scotch-Irish | 28 | 1.8% |
| Scottish | 25 | 1.6% |
| Subsaharan African | 2 | 0.1% |
| Thai | 14 | 0.9% |
| Welsh | 2 | 0.1% | View All 20 Rows |
Immigrants in Stuart
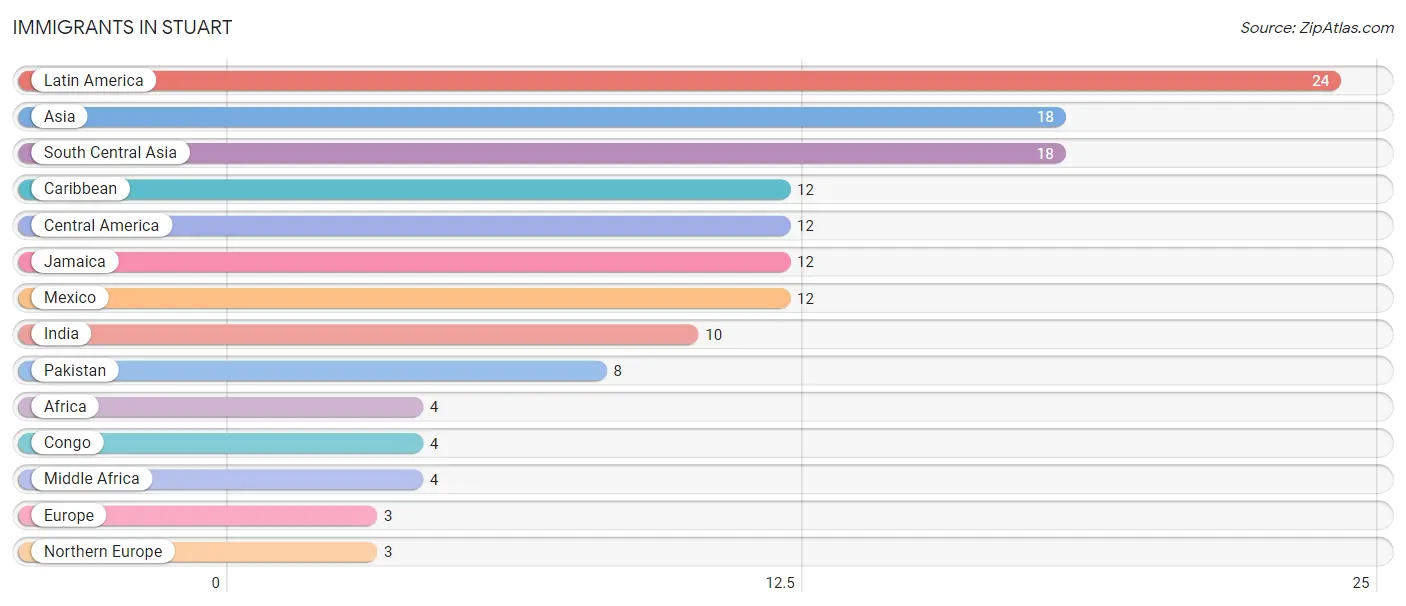
The most numerous immigrant groups reported in Stuart came from Latin America (24 | 1.6%), Asia (18 | 1.2%), South Central Asia (18 | 1.2%), Caribbean (12 | 0.8%), and Central America (12 | 0.8%), together accounting for 5.5% of all Stuart residents.
| Immigration Origin | # Population | % Population |
| Africa | 4 | 0.3% |
| Asia | 18 | 1.2% |
| Caribbean | 12 | 0.8% |
| Central America | 12 | 0.8% |
| Congo | 4 | 0.3% |
| Europe | 3 | 0.2% |
| India | 10 | 0.6% |
| Jamaica | 12 | 0.8% |
| Latin America | 24 | 1.6% |
| Mexico | 12 | 0.8% |
| Middle Africa | 4 | 0.3% |
| Northern Europe | 3 | 0.2% |
| Pakistan | 8 | 0.5% |
| South Central Asia | 18 | 1.2% | View All 14 Rows |
Sex and Age in Stuart
Sex and Age in Stuart
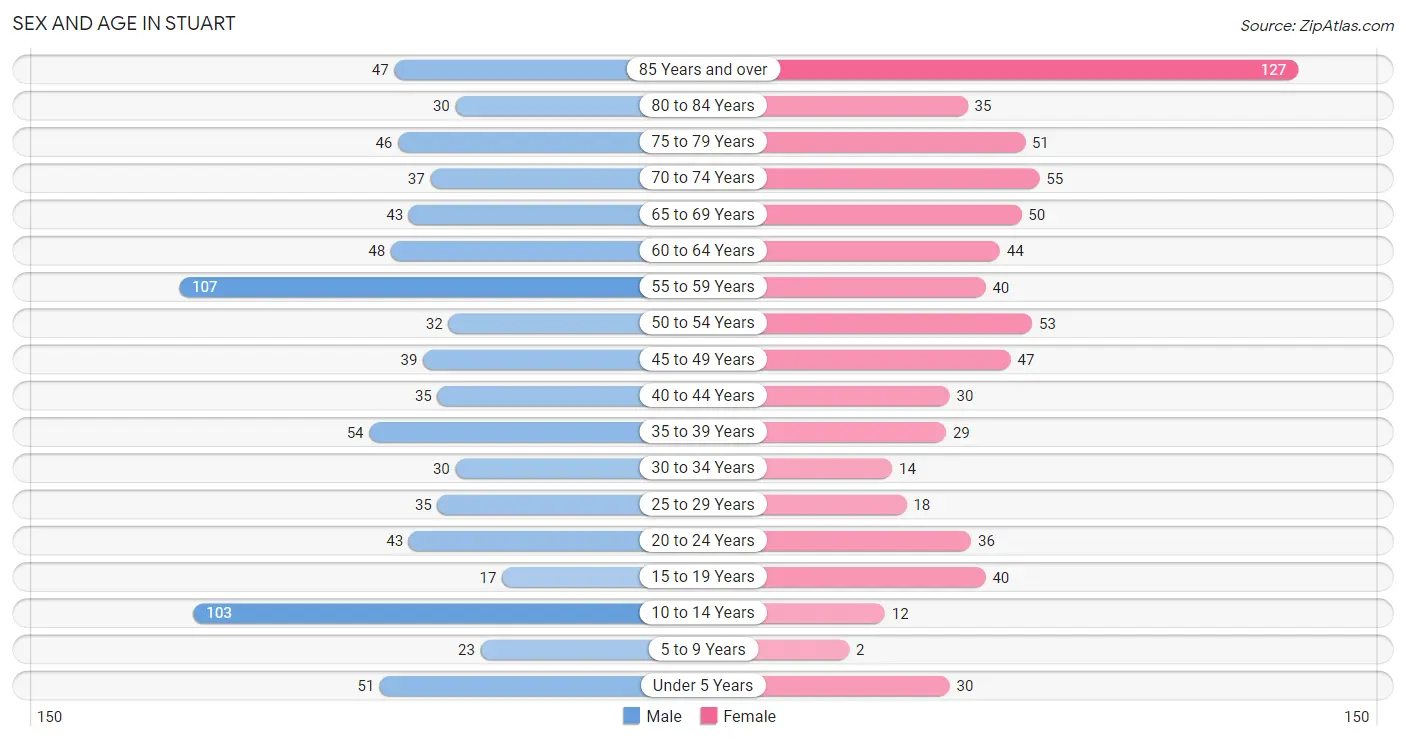
The most populous age groups in Stuart are 55 to 59 Years (107 | 13.1%) for men and 85 Years and over (127 | 17.8%) for women.
| Age Bracket | Male | Female |
| Under 5 Years | 51 (6.2%) | 30 (4.2%) |
| 5 to 9 Years | 23 (2.8%) | 2 (0.3%) |
| 10 to 14 Years | 103 (12.6%) | 12 (1.7%) |
| 15 to 19 Years | 17 (2.1%) | 40 (5.6%) |
| 20 to 24 Years | 43 (5.2%) | 36 (5.1%) |
| 25 to 29 Years | 35 (4.3%) | 18 (2.5%) |
| 30 to 34 Years | 30 (3.7%) | 14 (2.0%) |
| 35 to 39 Years | 54 (6.6%) | 29 (4.1%) |
| 40 to 44 Years | 35 (4.3%) | 30 (4.2%) |
| 45 to 49 Years | 39 (4.8%) | 47 (6.6%) |
| 50 to 54 Years | 32 (3.9%) | 53 (7.4%) |
| 55 to 59 Years | 107 (13.1%) | 40 (5.6%) |
| 60 to 64 Years | 48 (5.9%) | 44 (6.2%) |
| 65 to 69 Years | 43 (5.2%) | 50 (7.0%) |
| 70 to 74 Years | 37 (4.5%) | 55 (7.7%) |
| 75 to 79 Years | 46 (5.6%) | 51 (7.1%) |
| 80 to 84 Years | 30 (3.7%) | 35 (4.9%) |
| 85 Years and over | 47 (5.7%) | 127 (17.8%) |
| Total | 820 (100.0%) | 713 (100.0%) |
Families and Households in Stuart
Median Family Size in Stuart
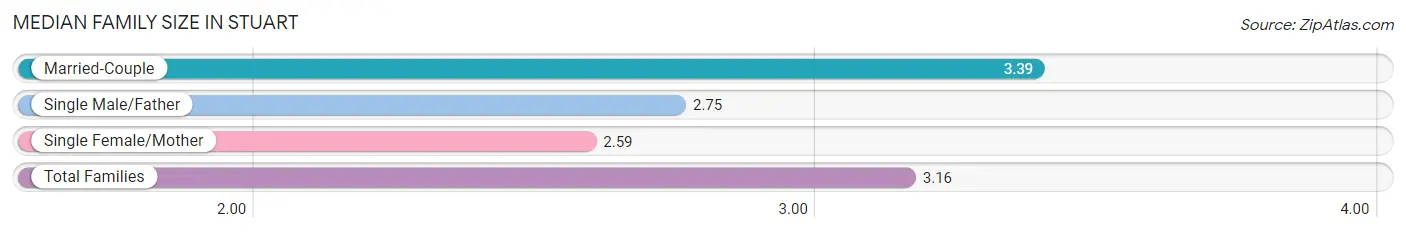
The median family size in Stuart is 3.16 persons per family, with married-couple families (160 | 69.3%) accounting for the largest median family size of 3.39 persons per family. On the other hand, single female/mother families (51 | 22.1%) represent the smallest median family size with 2.59 persons per family.
| Family Type | # Families | Family Size |
| Married-Couple | 160 (69.3%) | 3.39 |
| Single Male/Father | 20 (8.7%) | 2.75 |
| Single Female/Mother | 51 (22.1%) | 2.59 |
| Total Families | 231 (100.0%) | 3.16 |
Median Household Size in Stuart
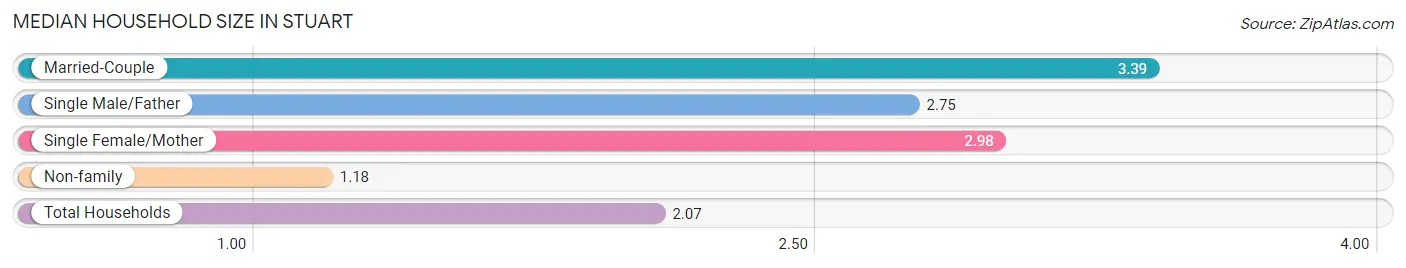
The median household size in Stuart is 2.07 persons per household, with married-couple households (160 | 29.7%) accounting for the largest median household size of 3.39 persons per household. non-family households (307 | 57.1%) represent the smallest median household size with 1.18 persons per household.
| Household Type | # Households | Household Size |
| Married-Couple | 160 (29.7%) | 3.39 |
| Single Male/Father | 20 (3.7%) | 2.75 |
| Single Female/Mother | 51 (9.5%) | 2.98 |
| Non-family | 307 (57.1%) | 1.18 |
| Total Households | 538 (100.0%) | 2.07 |
Household Size by Marriage Status in Stuart
Out of a total of 538 households in Stuart, 231 (42.9%) are family households, while 307 (57.1%) are nonfamily households. The most numerous type of family households are 2-person households, comprising 128, and the most common type of nonfamily households are 1-person households, comprising 258.
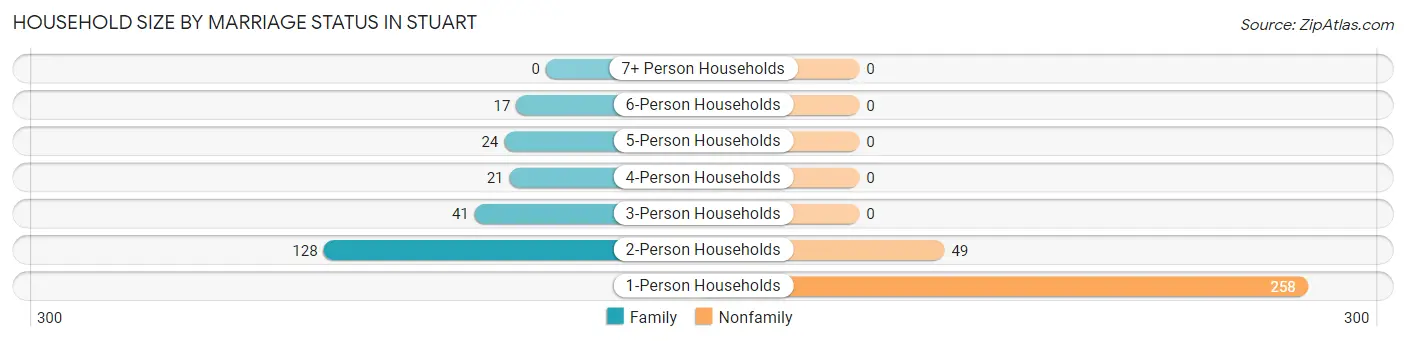
| Household Size | Family Households | Nonfamily Households |
| 1-Person Households | - | 258 (48.0%) |
| 2-Person Households | 128 (23.8%) | 49 (9.1%) |
| 3-Person Households | 41 (7.6%) | 0 (0.0%) |
| 4-Person Households | 21 (3.9%) | 0 (0.0%) |
| 5-Person Households | 24 (4.5%) | 0 (0.0%) |
| 6-Person Households | 17 (3.2%) | 0 (0.0%) |
| 7+ Person Households | 0 (0.0%) | 0 (0.0%) |
| Total | 231 (42.9%) | 307 (57.1%) |
Female Fertility in Stuart
Fertility by Age in Stuart
Average fertility rate in Stuart is 107.0 births per 1,000 women. Women in the age bracket of 20 to 34 years have the highest fertility rate with 191.0 births per 1,000 women. Women in the age bracket of 20 to 34 years acount for 56.5% of all women with births.
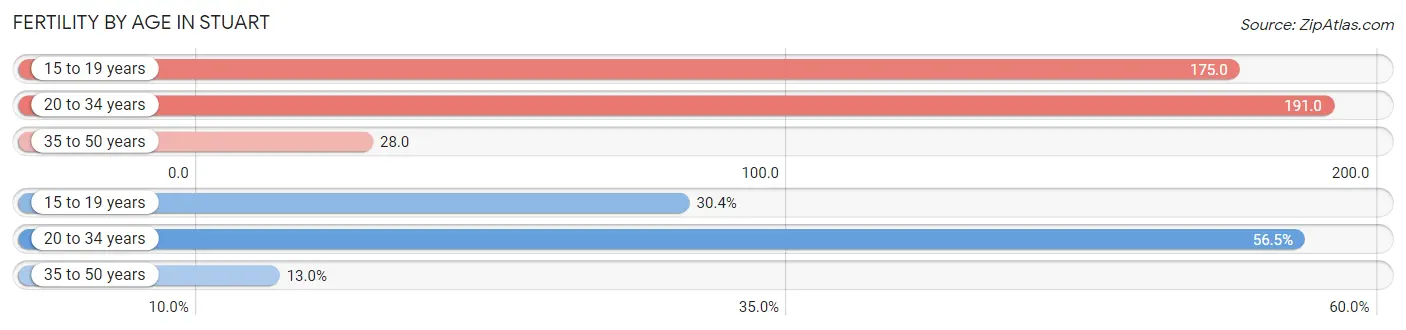
| Age Bracket | Women with Births | Births / 1,000 Women |
| 15 to 19 years | 7 (30.4%) | 175.0 |
| 20 to 34 years | 13 (56.5%) | 191.0 |
| 35 to 50 years | 3 (13.0%) | 28.0 |
| Total | 23 (100.0%) | 107.0 |
Fertility by Age by Marriage Status in Stuart
13.0% of women with births (23) in Stuart are married. The highest percentage of unmarried women with births falls into 15 to 19 years age bracket with 100.0% of them unmarried at the time of birth, while the lowest percentage of unmarried women with births belong to 35 to 50 years age bracket with 0.0% of them unmarried.
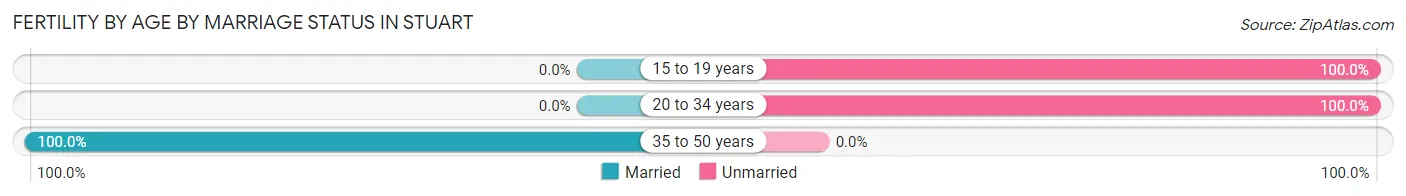
| Age Bracket | Married | Unmarried |
| 15 to 19 years | 0 (0.0%) | 7 (100.0%) |
| 20 to 34 years | 0 (0.0%) | 13 (100.0%) |
| 35 to 50 years | 3 (100.0%) | 0 (0.0%) |
| Total | 3 (13.0%) | 20 (87.0%) |
Fertility by Education in Stuart
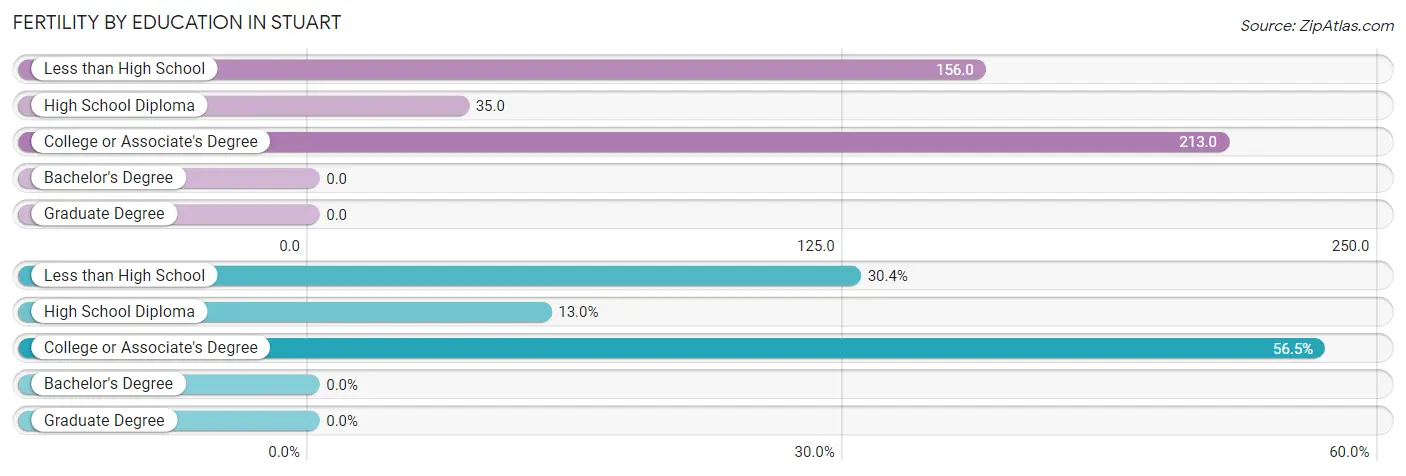
| Educational Attainment | Women with Births | Births / 1,000 Women |
| Less than High School | 7 (30.4%) | 156.0 |
| High School Diploma | 3 (13.0%) | 35.0 |
| College or Associate's Degree | 13 (56.5%) | 213.0 |
| Bachelor's Degree | 0 (0.0%) | 0.0 |
| Graduate Degree | 0 (0.0%) | 0.0 |
| Total | 23 (100.0%) | 107.0 |
Fertility by Education by Marriage Status in Stuart
87.0% of women with births in Stuart are unmarried. Women with the educational attainment of high school diploma are most likely to be married with 100.0% of them married at childbirth, while women with the educational attainment of less than high school are least likely to be married with 100.0% of them unmarried at childbirth.
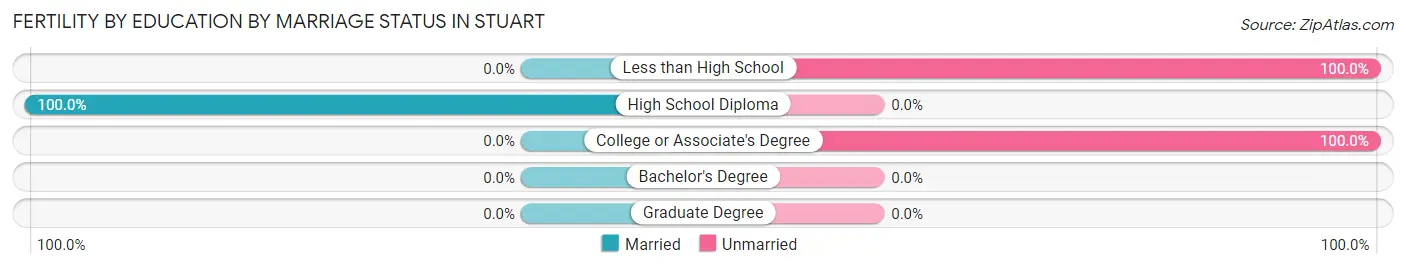
| Educational Attainment | Married | Unmarried |
| Less than High School | 0 (0.0%) | 7 (100.0%) |
| High School Diploma | 3 (100.0%) | 0 (0.0%) |
| College or Associate's Degree | 0 (0.0%) | 13 (100.0%) |
| Bachelor's Degree | 0 (0.0%) | 0 (0.0%) |
| Graduate Degree | 0 (0.0%) | 0 (0.0%) |
| Total | 3 (13.0%) | 20 (87.0%) |
Employment Characteristics in Stuart
Employment by Class of Employer in Stuart
Among the 424 employed individuals in Stuart, private company employees (257 | 60.6%), local government employees (47 | 11.1%), and self-employed (incorporated) (36 | 8.5%) make up the most common classes of employment.
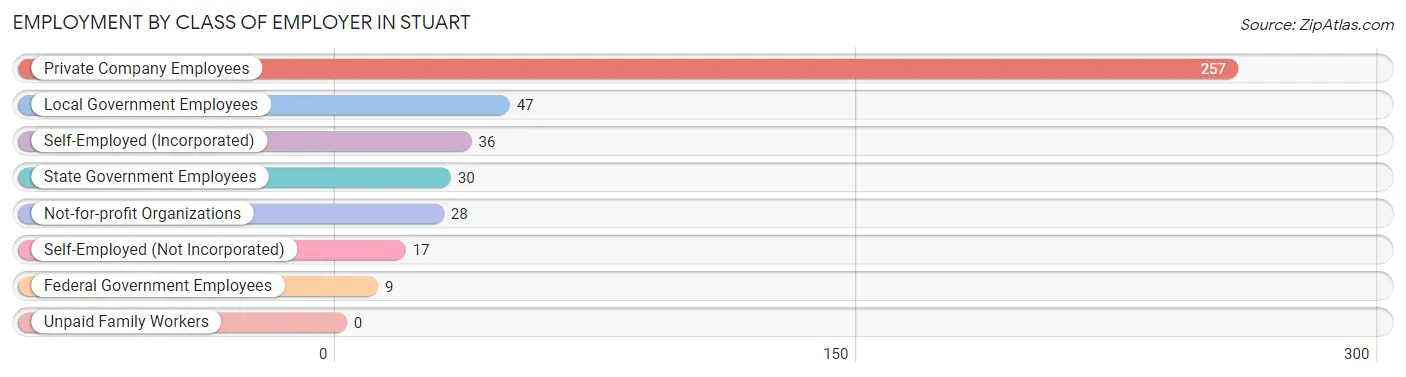
| Employer Class | # Employees | % Employees |
| Private Company Employees | 257 | 60.6% |
| Self-Employed (Incorporated) | 36 | 8.5% |
| Self-Employed (Not Incorporated) | 17 | 4.0% |
| Not-for-profit Organizations | 28 | 6.6% |
| Local Government Employees | 47 | 11.1% |
| State Government Employees | 30 | 7.1% |
| Federal Government Employees | 9 | 2.1% |
| Unpaid Family Workers | 0 | 0.0% |
| Total | 424 | 100.0% |
Employment Status by Age in Stuart
According to the labor force statistics for Stuart, out of the total population over 16 years of age (1,298), 35.7% or 463 individuals are in the labor force, with 8.6% or 40 of them unemployed. The age group with the highest labor force participation rate is 60 to 64 years, with 63.0% or 58 individuals in the labor force. Within the labor force, the 25 to 29 years age range has the highest percentage of unemployed individuals, with 50.0% or 10 of them being unemployed.
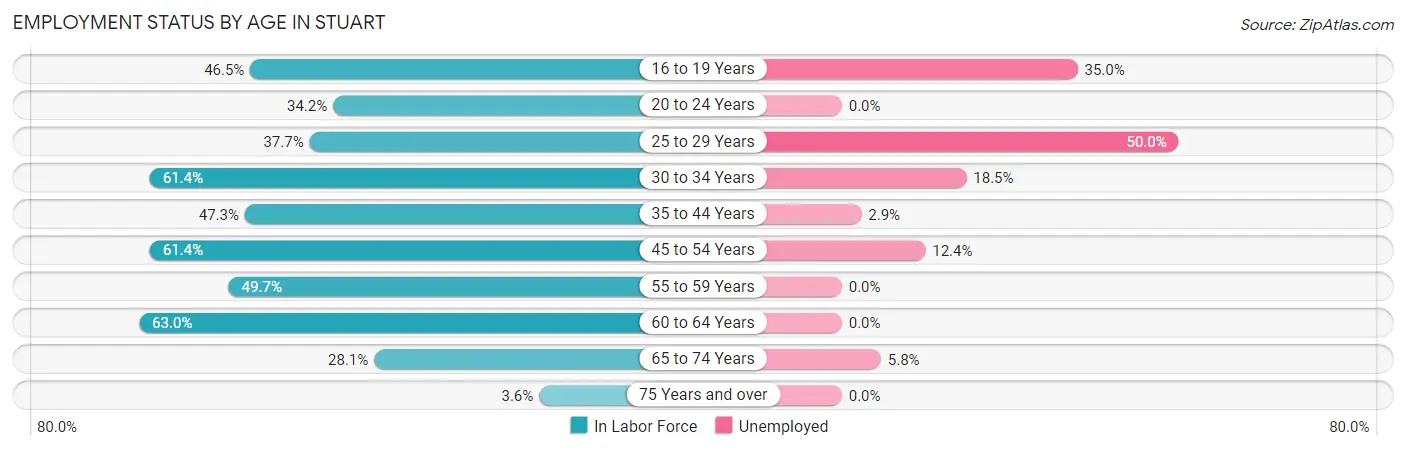
| Age Bracket | In Labor Force | Unemployed |
| 16 to 19 Years | 20 (46.5%) | 7 (35.0%) |
| 20 to 24 Years | 27 (34.2%) | 0 (0.0%) |
| 25 to 29 Years | 20 (37.7%) | 10 (50.0%) |
| 30 to 34 Years | 27 (61.4%) | 5 (18.5%) |
| 35 to 44 Years | 70 (47.3%) | 2 (2.9%) |
| 45 to 54 Years | 105 (61.4%) | 13 (12.4%) |
| 55 to 59 Years | 73 (49.7%) | 0 (0.0%) |
| 60 to 64 Years | 58 (63.0%) | 0 (0.0%) |
| 65 to 74 Years | 52 (28.1%) | 3 (5.8%) |
| 75 Years and over | 12 (3.6%) | 0 (0.0%) |
| Total | 463 (35.7%) | 40 (8.6%) |
Employment Status by Educational Attainment in Stuart
According to labor force statistics for Stuart, 53.9% of individuals (353) out of the total population between 25 and 64 years of age (655) are in the labor force, with 8.5% or 30 of them being unemployed. The group with the highest labor force participation rate are those with the educational attainment of bachelor's degree or higher, with 75.0% or 90 individuals in the labor force. Within the labor force, individuals with high school diploma education have the highest percentage of unemployment, with 14.2% or 17 of them being unemployed.
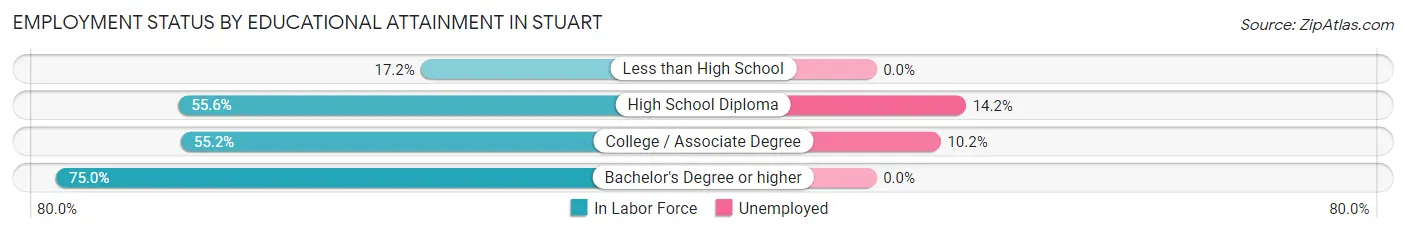
| Educational Attainment | In Labor Force | Unemployed |
| Less than High School | 15 (17.2%) | 0 (0.0%) |
| High School Diploma | 120 (55.6%) | 31 (14.2%) |
| College / Associate Degree | 128 (55.2%) | 24 (10.2%) |
| Bachelor's Degree or higher | 90 (75.0%) | 0 (0.0%) |
| Total | 353 (53.9%) | 56 (8.5%) |
Employment Occupations by Sex in Stuart
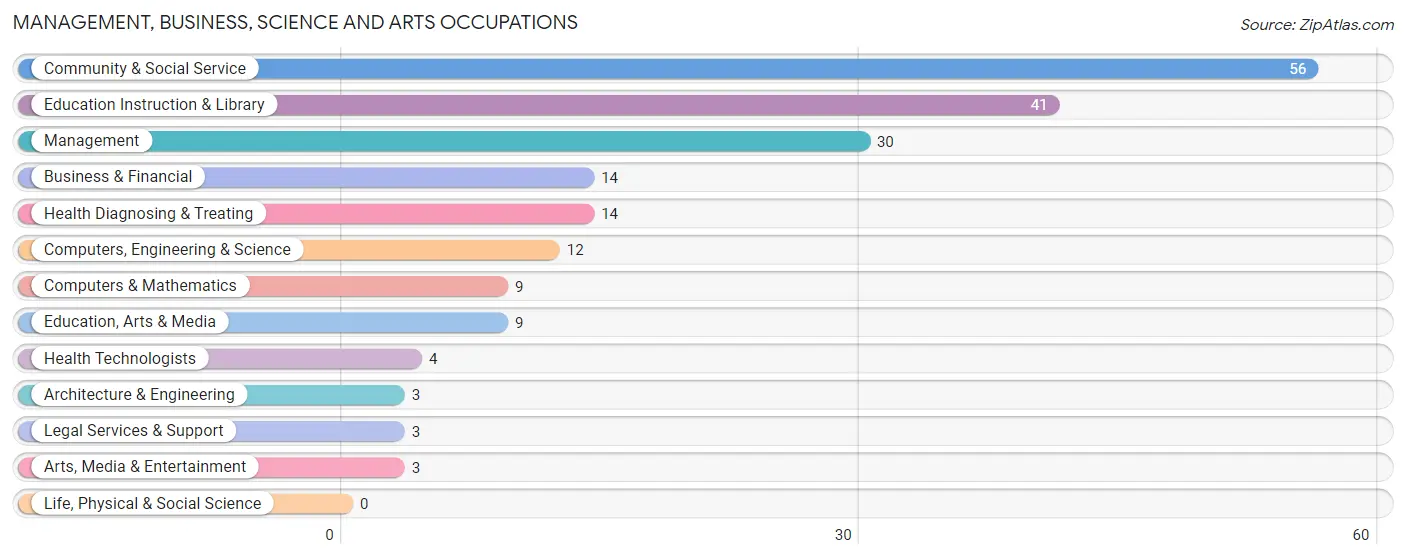
Management, Business, Science and Arts Occupations
The most common Management, Business, Science and Arts occupations in Stuart are Community & Social Service (56 | 13.2%), Education Instruction & Library (41 | 9.7%), Management (30 | 7.1%), Business & Financial (14 | 3.3%), and Health Diagnosing & Treating (14 | 3.3%).
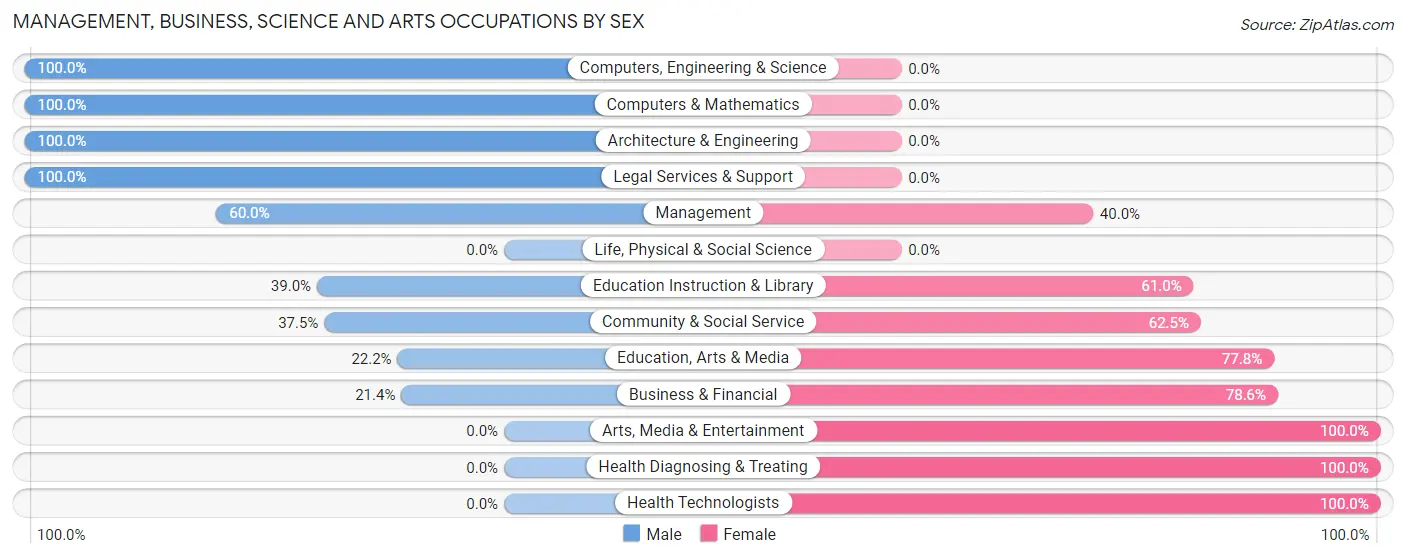
Management, Business, Science and Arts Occupations by Sex
Within the Management, Business, Science and Arts occupations in Stuart, the most male-oriented occupations are Computers, Engineering & Science (100.0%), Computers & Mathematics (100.0%), and Architecture & Engineering (100.0%), while the most female-oriented occupations are Arts, Media & Entertainment (100.0%), Health Diagnosing & Treating (100.0%), and Health Technologists (100.0%).
| Occupation | Male | Female |
| Management | 18 (60.0%) | 12 (40.0%) |
| Business & Financial | 3 (21.4%) | 11 (78.6%) |
| Computers, Engineering & Science | 12 (100.0%) | 0 (0.0%) |
| Computers & Mathematics | 9 (100.0%) | 0 (0.0%) |
| Architecture & Engineering | 3 (100.0%) | 0 (0.0%) |
| Life, Physical & Social Science | 0 (0.0%) | 0 (0.0%) |
| Community & Social Service | 21 (37.5%) | 35 (62.5%) |
| Education, Arts & Media | 2 (22.2%) | 7 (77.8%) |
| Legal Services & Support | 3 (100.0%) | 0 (0.0%) |
| Education Instruction & Library | 16 (39.0%) | 25 (61.0%) |
| Arts, Media & Entertainment | 0 (0.0%) | 3 (100.0%) |
| Health Diagnosing & Treating | 0 (0.0%) | 14 (100.0%) |
| Health Technologists | 0 (0.0%) | 4 (100.0%) |
| Total (Category) | 54 (42.9%) | 72 (57.1%) |
| Total (Overall) | 209 (49.3%) | 215 (50.7%) |
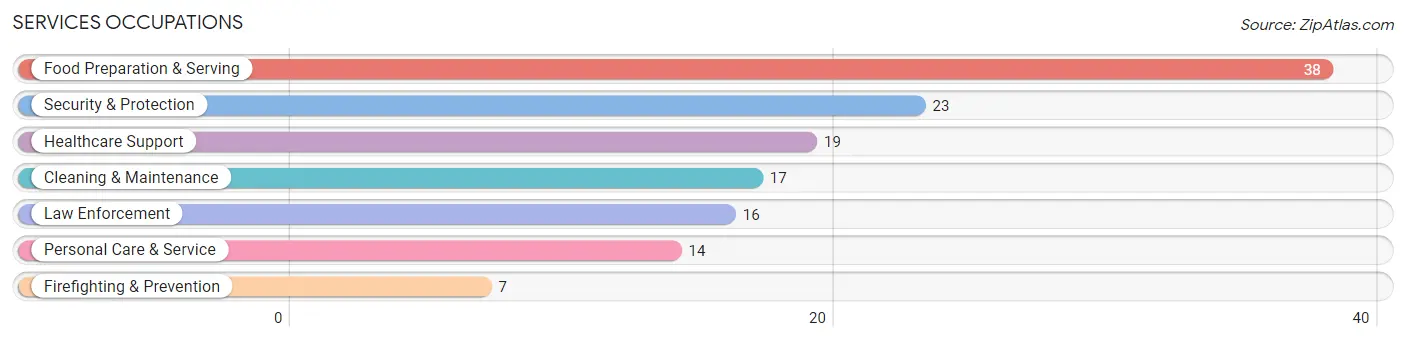
Services Occupations
The most common Services occupations in Stuart are Food Preparation & Serving (38 | 9.0%), Security & Protection (23 | 5.4%), Healthcare Support (19 | 4.5%), Cleaning & Maintenance (17 | 4.0%), and Law Enforcement (16 | 3.8%).
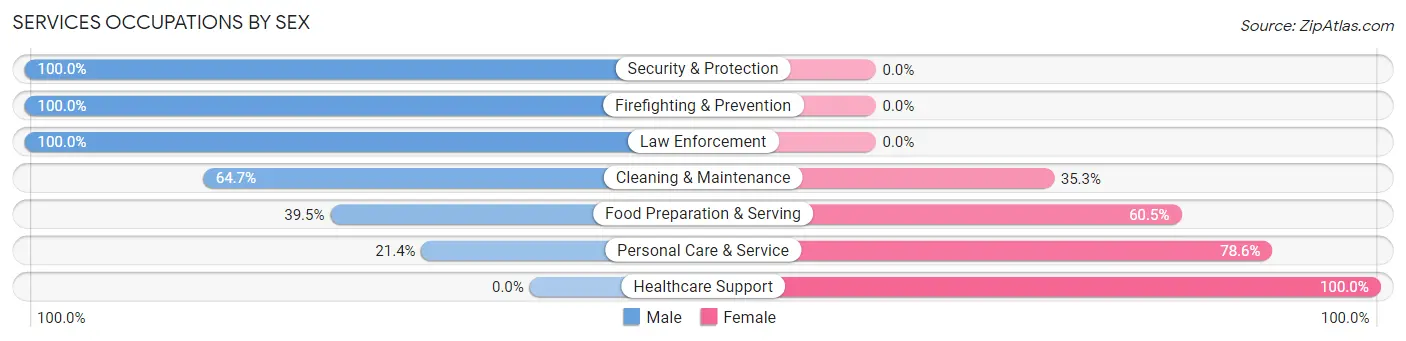
Services Occupations by Sex
Within the Services occupations in Stuart, the most male-oriented occupations are Security & Protection (100.0%), Firefighting & Prevention (100.0%), and Law Enforcement (100.0%), while the most female-oriented occupations are Healthcare Support (100.0%), Personal Care & Service (78.6%), and Food Preparation & Serving (60.5%).
| Occupation | Male | Female |
| Healthcare Support | 0 (0.0%) | 19 (100.0%) |
| Security & Protection | 23 (100.0%) | 0 (0.0%) |
| Firefighting & Prevention | 7 (100.0%) | 0 (0.0%) |
| Law Enforcement | 16 (100.0%) | 0 (0.0%) |
| Food Preparation & Serving | 15 (39.5%) | 23 (60.5%) |
| Cleaning & Maintenance | 11 (64.7%) | 6 (35.3%) |
| Personal Care & Service | 3 (21.4%) | 11 (78.6%) |
| Total (Category) | 52 (46.9%) | 59 (53.1%) |
| Total (Overall) | 209 (49.3%) | 215 (50.7%) |
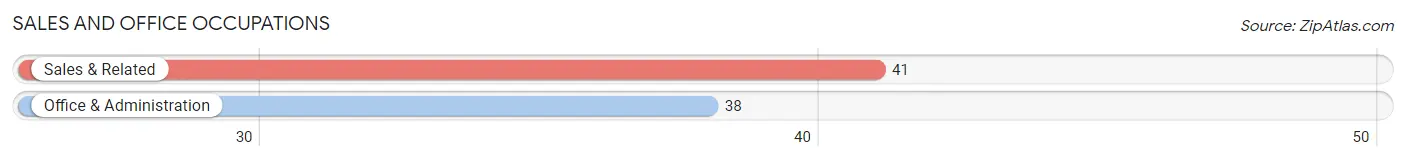
Sales and Office Occupations
The most common Sales and Office occupations in Stuart are Sales & Related (41 | 9.7%), and Office & Administration (38 | 9.0%).
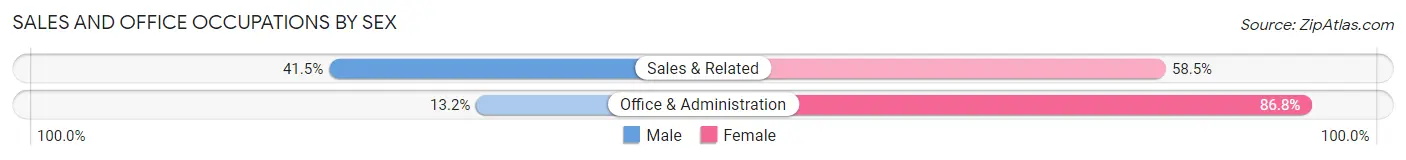
Sales and Office Occupations by Sex
| Occupation | Male | Female |
| Sales & Related | 17 (41.5%) | 24 (58.5%) |
| Office & Administration | 5 (13.2%) | 33 (86.8%) |
| Total (Category) | 22 (27.9%) | 57 (72.2%) |
| Total (Overall) | 209 (49.3%) | 215 (50.7%) |
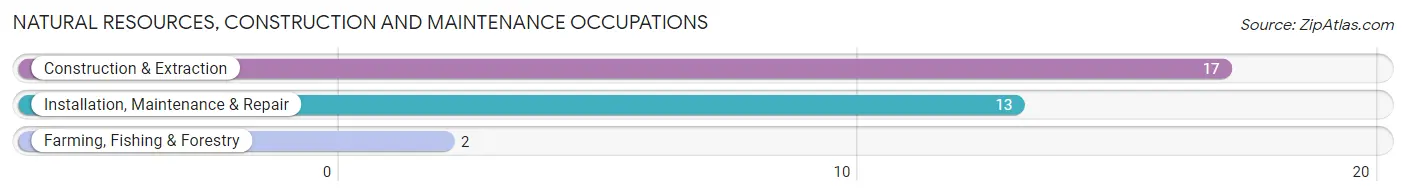
Natural Resources, Construction and Maintenance Occupations
The most common Natural Resources, Construction and Maintenance occupations in Stuart are Construction & Extraction (17 | 4.0%), Installation, Maintenance & Repair (13 | 3.1%), and Farming, Fishing & Forestry (2 | 0.5%).
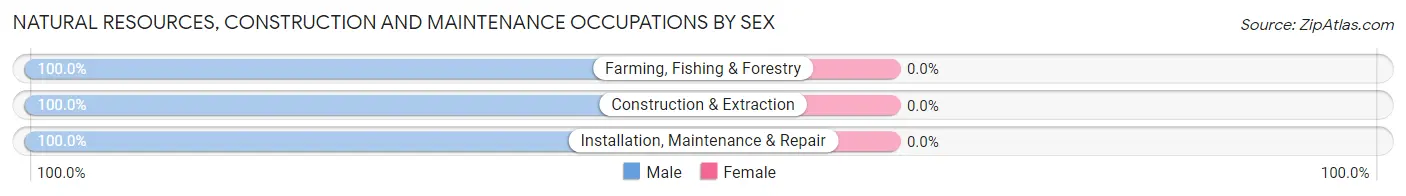
Natural Resources, Construction and Maintenance Occupations by Sex
| Occupation | Male | Female |
| Farming, Fishing & Forestry | 2 (100.0%) | 0 (0.0%) |
| Construction & Extraction | 17 (100.0%) | 0 (0.0%) |
| Installation, Maintenance & Repair | 13 (100.0%) | 0 (0.0%) |
| Total (Category) | 32 (100.0%) | 0 (0.0%) |
| Total (Overall) | 209 (49.3%) | 215 (50.7%) |
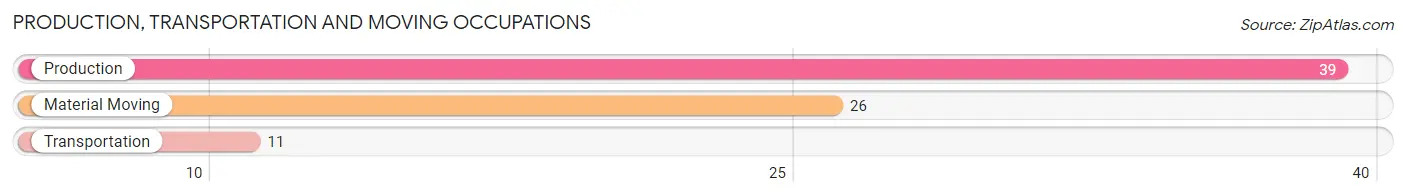
Production, Transportation and Moving Occupations
The most common Production, Transportation and Moving occupations in Stuart are Production (39 | 9.2%), Material Moving (26 | 6.1%), and Transportation (11 | 2.6%).
Production, Transportation and Moving Occupations by Sex
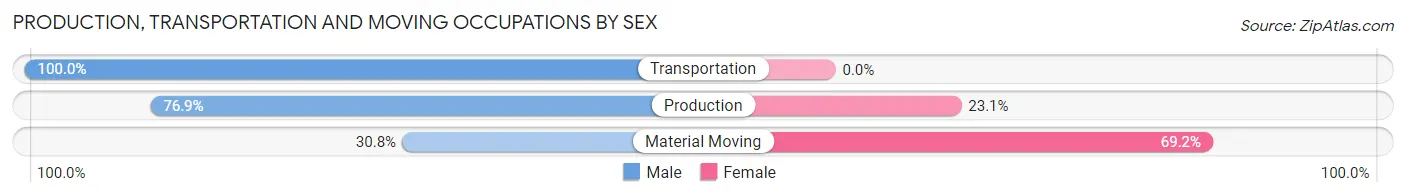
| Occupation | Male | Female |
| Production | 30 (76.9%) | 9 (23.1%) |
| Transportation | 11 (100.0%) | 0 (0.0%) |
| Material Moving | 8 (30.8%) | 18 (69.2%) |
| Total (Category) | 49 (64.5%) | 27 (35.5%) |
| Total (Overall) | 209 (49.3%) | 215 (50.7%) |
Employment Industries by Sex in Stuart
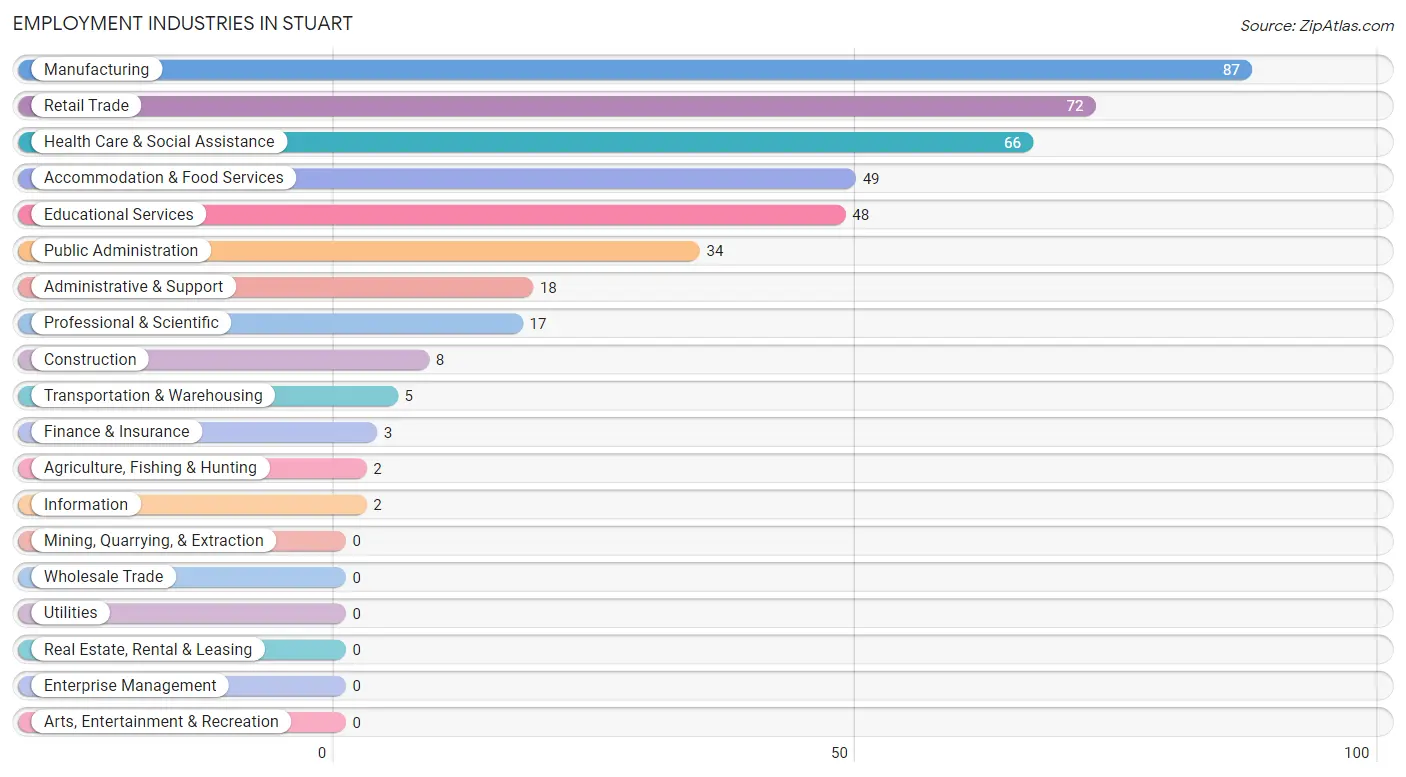
Employment Industries in Stuart
The major employment industries in Stuart include Manufacturing (87 | 20.5%), Retail Trade (72 | 17.0%), Health Care & Social Assistance (66 | 15.6%), Accommodation & Food Services (49 | 11.6%), and Educational Services (48 | 11.3%).
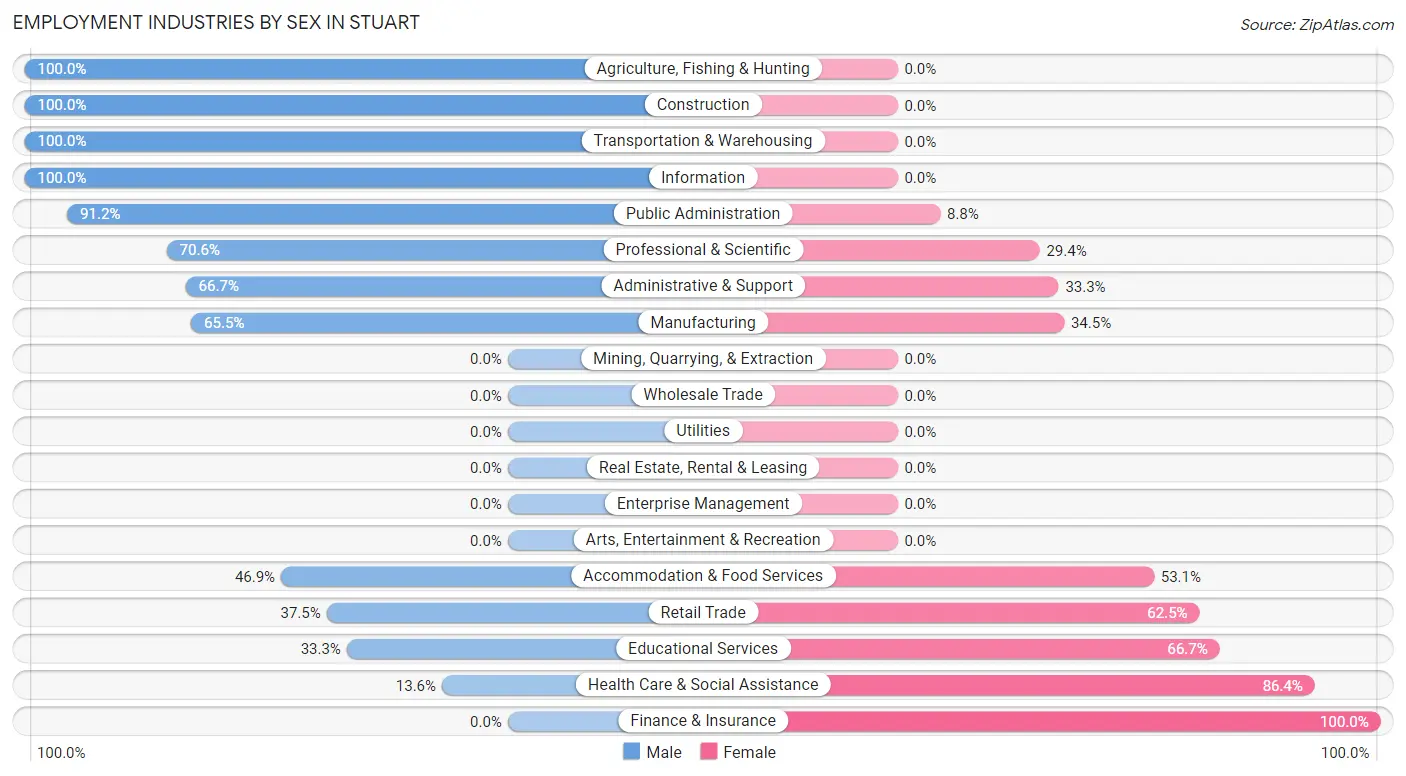
Employment Industries by Sex in Stuart
The Stuart industries that see more men than women are Agriculture, Fishing & Hunting (100.0%), Construction (100.0%), and Transportation & Warehousing (100.0%), whereas the industries that tend to have a higher number of women are Finance & Insurance (100.0%), Health Care & Social Assistance (86.4%), and Educational Services (66.7%).
| Industry | Male | Female |
| Agriculture, Fishing & Hunting | 2 (100.0%) | 0 (0.0%) |
| Mining, Quarrying, & Extraction | 0 (0.0%) | 0 (0.0%) |
| Construction | 8 (100.0%) | 0 (0.0%) |
| Manufacturing | 57 (65.5%) | 30 (34.5%) |
| Wholesale Trade | 0 (0.0%) | 0 (0.0%) |
| Retail Trade | 27 (37.5%) | 45 (62.5%) |
| Transportation & Warehousing | 5 (100.0%) | 0 (0.0%) |
| Utilities | 0 (0.0%) | 0 (0.0%) |
| Information | 2 (100.0%) | 0 (0.0%) |
| Finance & Insurance | 0 (0.0%) | 3 (100.0%) |
| Real Estate, Rental & Leasing | 0 (0.0%) | 0 (0.0%) |
| Professional & Scientific | 12 (70.6%) | 5 (29.4%) |
| Enterprise Management | 0 (0.0%) | 0 (0.0%) |
| Administrative & Support | 12 (66.7%) | 6 (33.3%) |
| Educational Services | 16 (33.3%) | 32 (66.7%) |
| Health Care & Social Assistance | 9 (13.6%) | 57 (86.4%) |
| Arts, Entertainment & Recreation | 0 (0.0%) | 0 (0.0%) |
| Accommodation & Food Services | 23 (46.9%) | 26 (53.1%) |
| Public Administration | 31 (91.2%) | 3 (8.8%) |
| Total | 209 (49.3%) | 215 (50.7%) |
Education in Stuart
School Enrollment in Stuart
The most common levels of schooling among the 245 students in Stuart are elementary school (69 | 28.2%), middle school (63 | 25.7%), and college / undergraduate (46 | 18.8%).
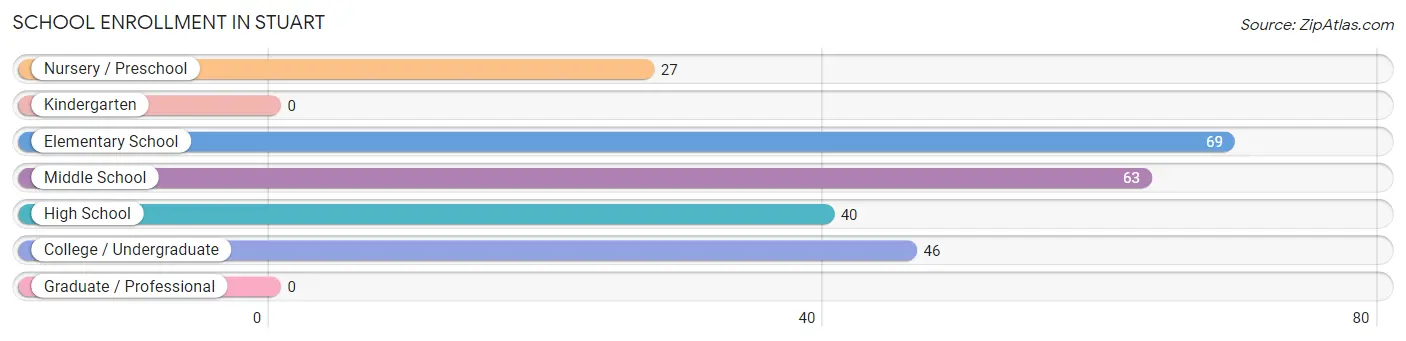
| School Level | # Students | % Students |
| Nursery / Preschool | 27 | 11.0% |
| Kindergarten | 0 | 0.0% |
| Elementary School | 69 | 28.2% |
| Middle School | 63 | 25.7% |
| High School | 40 | 16.3% |
| College / Undergraduate | 46 | 18.8% |
| Graduate / Professional | 0 | 0.0% |
| Total | 245 | 100.0% |
School Enrollment by Age by Funding Source in Stuart
Out of a total of 245 students who are enrolled in schools in Stuart, 10 (4.1%) attend a private institution, while the remaining 235 (95.9%) are enrolled in public schools. The age group of 25 to 34 year olds has the highest likelihood of being enrolled in private schools, with 4 (18.2% in the age bracket) enrolled. Conversely, the age group of 3 to 4 year olds has the lowest likelihood of being enrolled in a private school, with 27 (100.0% in the age bracket) attending a public institution.
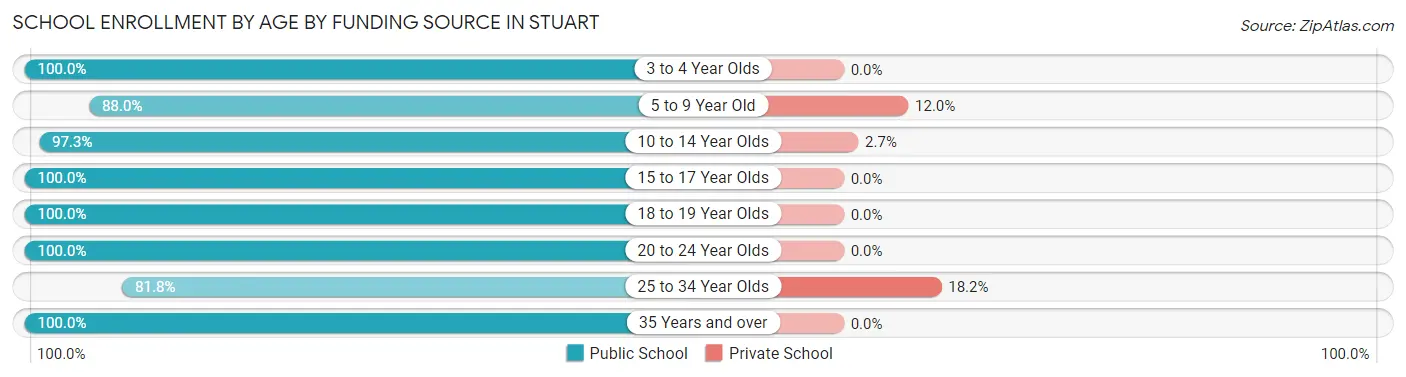
| Age Bracket | Public School | Private School |
| 3 to 4 Year Olds | 27 (100.0%) | 0 (0.0%) |
| 5 to 9 Year Old | 22 (88.0%) | 3 (12.0%) |
| 10 to 14 Year Olds | 108 (97.3%) | 3 (2.7%) |
| 15 to 17 Year Olds | 28 (100.0%) | 0 (0.0%) |
| 18 to 19 Year Olds | 16 (100.0%) | 0 (0.0%) |
| 20 to 24 Year Olds | 2 (100.0%) | 0 (0.0%) |
| 25 to 34 Year Olds | 18 (81.8%) | 4 (18.2%) |
| 35 Years and over | 14 (100.0%) | 0 (0.0%) |
| Total | 235 (95.9%) | 10 (4.1%) |
Educational Attainment by Field of Study in Stuart
Education (47 | 23.4%), social sciences (38 | 18.9%), business (37 | 18.4%), engineering (15 | 7.5%), and communications (15 | 7.5%) are the most common fields of study among 201 individuals in Stuart who have obtained a bachelor's degree or higher.
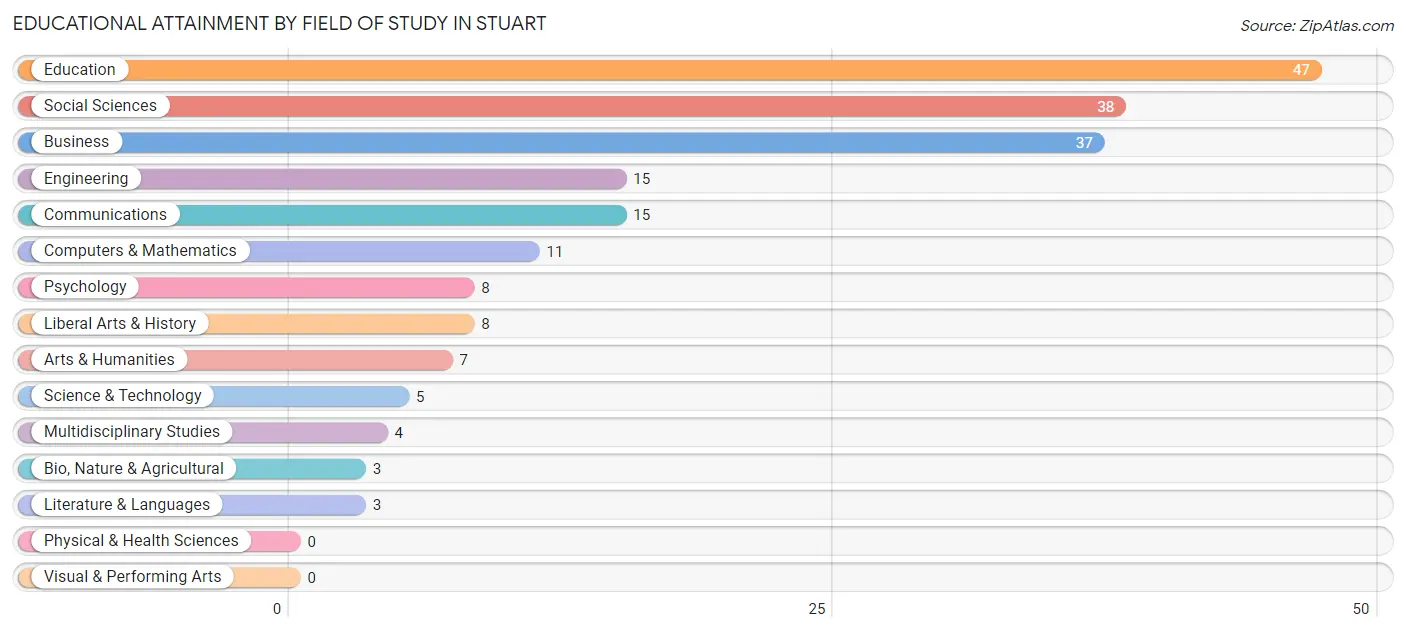
| Field of Study | # Graduates | % Graduates |
| Computers & Mathematics | 11 | 5.5% |
| Bio, Nature & Agricultural | 3 | 1.5% |
| Physical & Health Sciences | 0 | 0.0% |
| Psychology | 8 | 4.0% |
| Social Sciences | 38 | 18.9% |
| Engineering | 15 | 7.5% |
| Multidisciplinary Studies | 4 | 2.0% |
| Science & Technology | 5 | 2.5% |
| Business | 37 | 18.4% |
| Education | 47 | 23.4% |
| Literature & Languages | 3 | 1.5% |
| Liberal Arts & History | 8 | 4.0% |
| Visual & Performing Arts | 0 | 0.0% |
| Communications | 15 | 7.5% |
| Arts & Humanities | 7 | 3.5% |
| Total | 201 | 100.0% |
Transportation & Commute in Stuart
Vehicle Availability by Sex in Stuart
The most prevalent vehicle ownership categories in Stuart are males with 2 vehicles (78, accounting for 37.3%) and females with 2 vehicles (76, making up 36.3%).
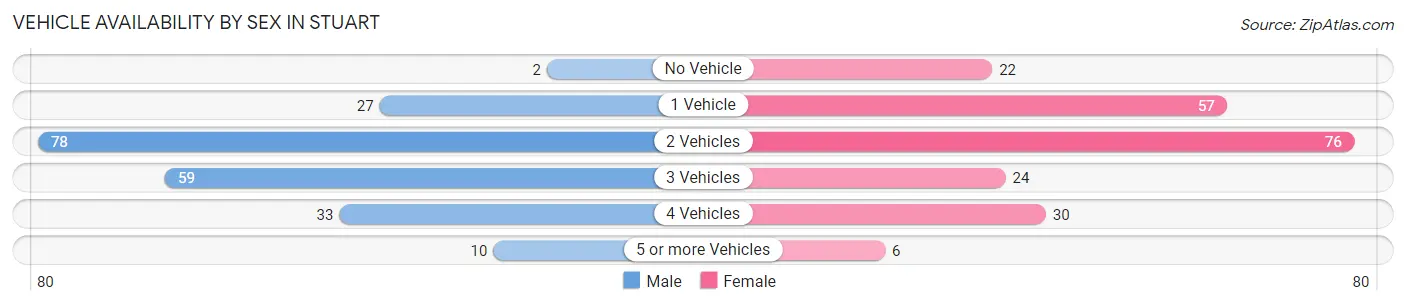
| Vehicles Available | Male | Female |
| No Vehicle | 2 (1.0%) | 22 (10.2%) |
| 1 Vehicle | 27 (12.9%) | 57 (26.5%) |
| 2 Vehicles | 78 (37.3%) | 76 (35.3%) |
| 3 Vehicles | 59 (28.2%) | 24 (11.2%) |
| 4 Vehicles | 33 (15.8%) | 30 (14.0%) |
| 5 or more Vehicles | 10 (4.8%) | 6 (2.8%) |
| Total | 209 (100.0%) | 215 (100.0%) |
Commute Time in Stuart
The most frequently occuring commute durations in Stuart are 5 to 9 minutes (83 commuters, 21.9%), 10 to 14 minutes (52 commuters, 13.7%), and less than 5 minutes (51 commuters, 13.5%).
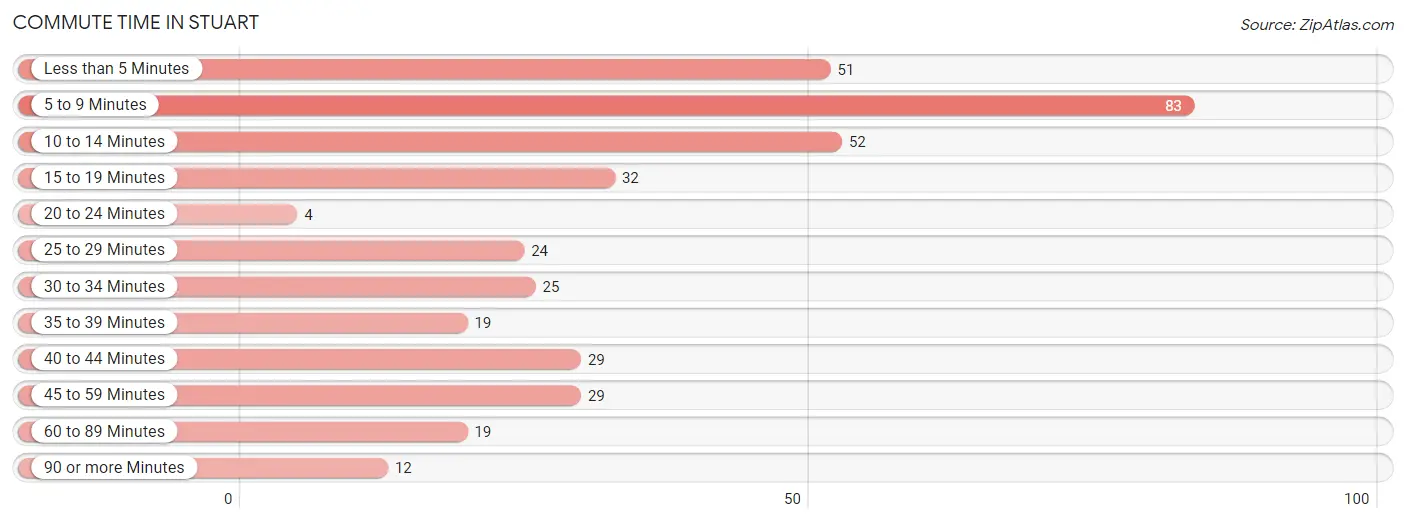
| Commute Time | # Commuters | % Commuters |
| Less than 5 Minutes | 51 | 13.5% |
| 5 to 9 Minutes | 83 | 21.9% |
| 10 to 14 Minutes | 52 | 13.7% |
| 15 to 19 Minutes | 32 | 8.4% |
| 20 to 24 Minutes | 4 | 1.1% |
| 25 to 29 Minutes | 24 | 6.3% |
| 30 to 34 Minutes | 25 | 6.6% |
| 35 to 39 Minutes | 19 | 5.0% |
| 40 to 44 Minutes | 29 | 7.6% |
| 45 to 59 Minutes | 29 | 7.6% |
| 60 to 89 Minutes | 19 | 5.0% |
| 90 or more Minutes | 12 | 3.2% |
Commute Time by Sex in Stuart
The most common commute times in Stuart are 5 to 9 minutes (45 commuters, 22.8%) for males and less than 5 minutes (39 commuters, 21.4%) for females.
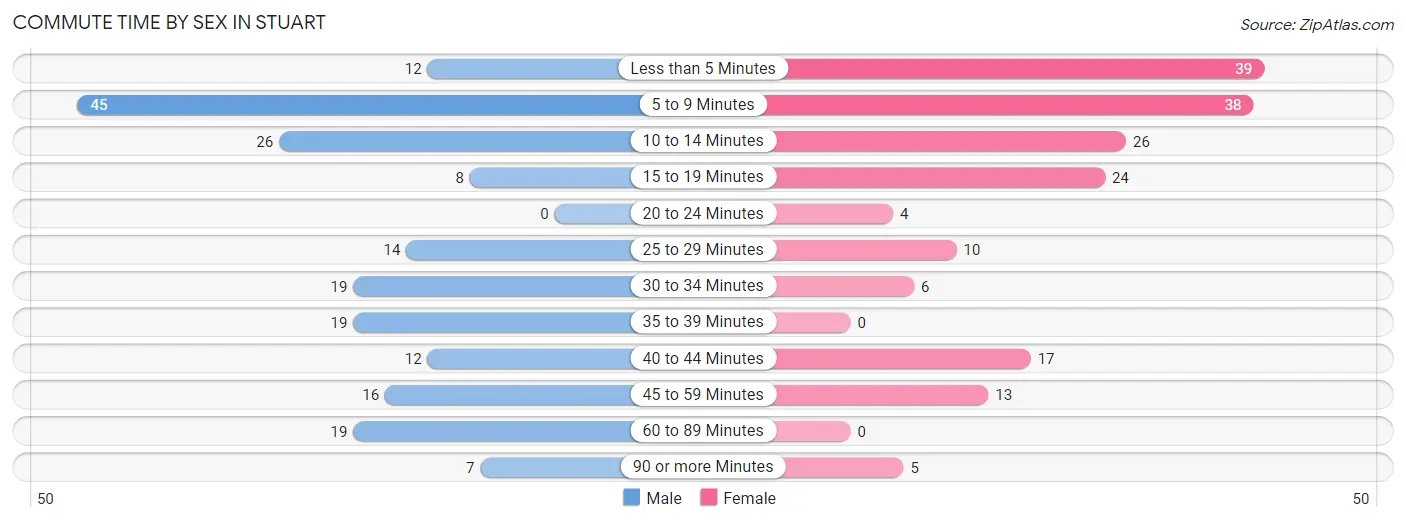
| Commute Time | Male | Female |
| Less than 5 Minutes | 12 (6.1%) | 39 (21.4%) |
| 5 to 9 Minutes | 45 (22.8%) | 38 (20.9%) |
| 10 to 14 Minutes | 26 (13.2%) | 26 (14.3%) |
| 15 to 19 Minutes | 8 (4.1%) | 24 (13.2%) |
| 20 to 24 Minutes | 0 (0.0%) | 4 (2.2%) |
| 25 to 29 Minutes | 14 (7.1%) | 10 (5.5%) |
| 30 to 34 Minutes | 19 (9.6%) | 6 (3.3%) |
| 35 to 39 Minutes | 19 (9.6%) | 0 (0.0%) |
| 40 to 44 Minutes | 12 (6.1%) | 17 (9.3%) |
| 45 to 59 Minutes | 16 (8.1%) | 13 (7.1%) |
| 60 to 89 Minutes | 19 (9.6%) | 0 (0.0%) |
| 90 or more Minutes | 7 (3.5%) | 5 (2.8%) |
Time of Departure to Work by Sex in Stuart
The most frequent times of departure to work in Stuart are 6:00 AM to 6:29 AM (27, 13.7%) for males and 6:30 AM to 6:59 AM (38, 20.9%) for females.
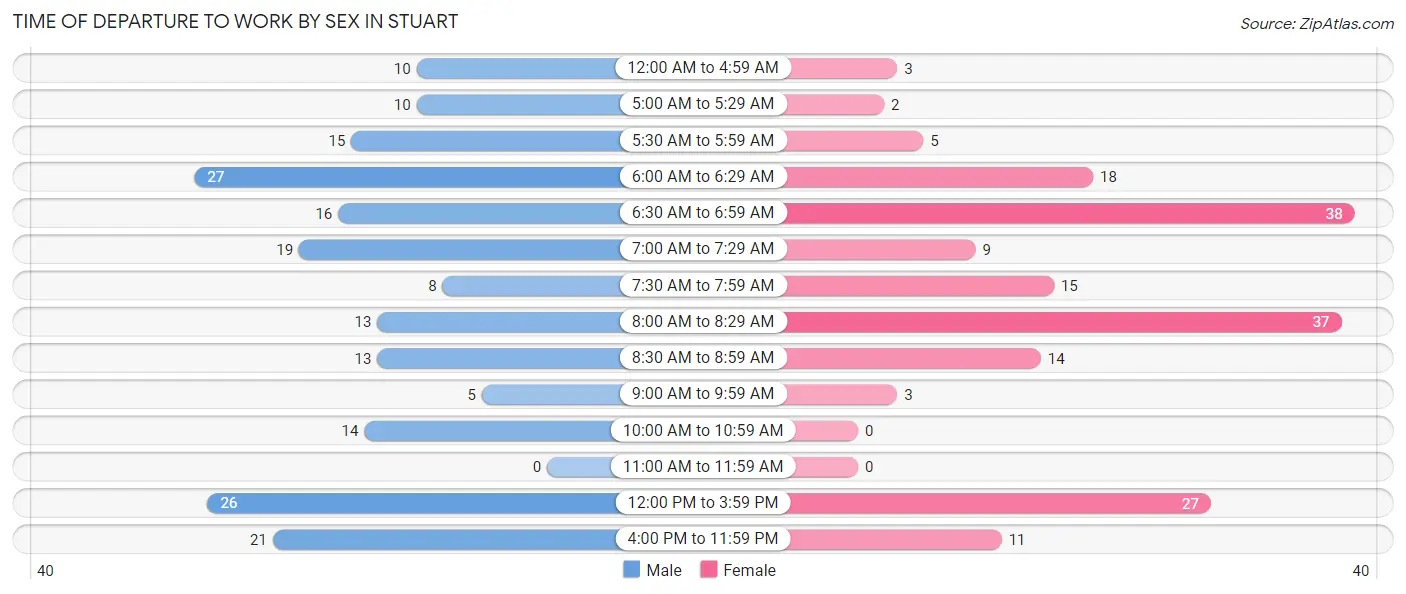
| Time of Departure | Male | Female |
| 12:00 AM to 4:59 AM | 10 (5.1%) | 3 (1.7%) |
| 5:00 AM to 5:29 AM | 10 (5.1%) | 2 (1.1%) |
| 5:30 AM to 5:59 AM | 15 (7.6%) | 5 (2.8%) |
| 6:00 AM to 6:29 AM | 27 (13.7%) | 18 (9.9%) |
| 6:30 AM to 6:59 AM | 16 (8.1%) | 38 (20.9%) |
| 7:00 AM to 7:29 AM | 19 (9.6%) | 9 (5.0%) |
| 7:30 AM to 7:59 AM | 8 (4.1%) | 15 (8.2%) |
| 8:00 AM to 8:29 AM | 13 (6.6%) | 37 (20.3%) |
| 8:30 AM to 8:59 AM | 13 (6.6%) | 14 (7.7%) |
| 9:00 AM to 9:59 AM | 5 (2.5%) | 3 (1.7%) |
| 10:00 AM to 10:59 AM | 14 (7.1%) | 0 (0.0%) |
| 11:00 AM to 11:59 AM | 0 (0.0%) | 0 (0.0%) |
| 12:00 PM to 3:59 PM | 26 (13.2%) | 27 (14.8%) |
| 4:00 PM to 11:59 PM | 21 (10.7%) | 11 (6.0%) |
| Total | 197 (100.0%) | 182 (100.0%) |
Housing Occupancy in Stuart
Occupancy by Ownership in Stuart
Of the total 538 dwellings in Stuart, owner-occupied units account for 264 (49.1%), while renter-occupied units make up 274 (50.9%).
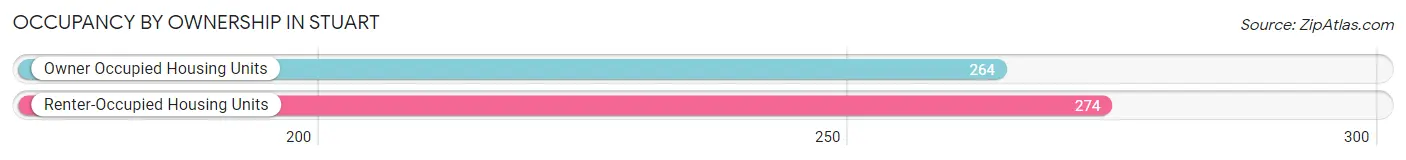
| Occupancy | # Housing Units | % Housing Units |
| Owner Occupied Housing Units | 264 | 49.1% |
| Renter-Occupied Housing Units | 274 | 50.9% |
| Total Occupied Housing Units | 538 | 100.0% |
Occupancy by Household Size in Stuart
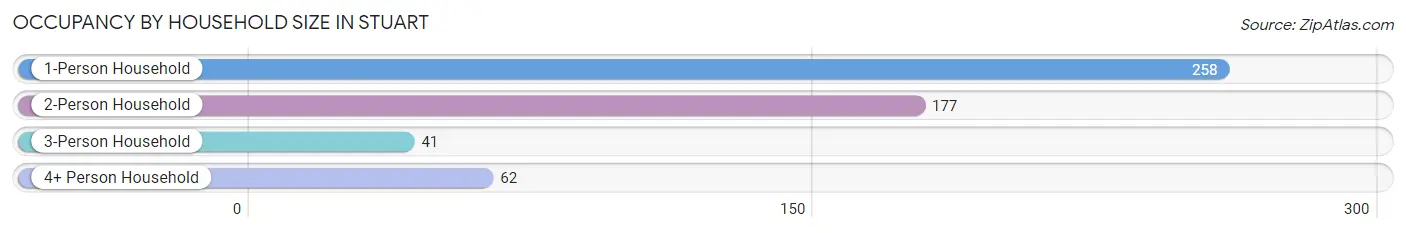
| Household Size | # Housing Units | % Housing Units |
| 1-Person Household | 258 | 48.0% |
| 2-Person Household | 177 | 32.9% |
| 3-Person Household | 41 | 7.6% |
| 4+ Person Household | 62 | 11.5% |
| Total Housing Units | 538 | 100.0% |
Occupancy by Ownership by Household Size in Stuart
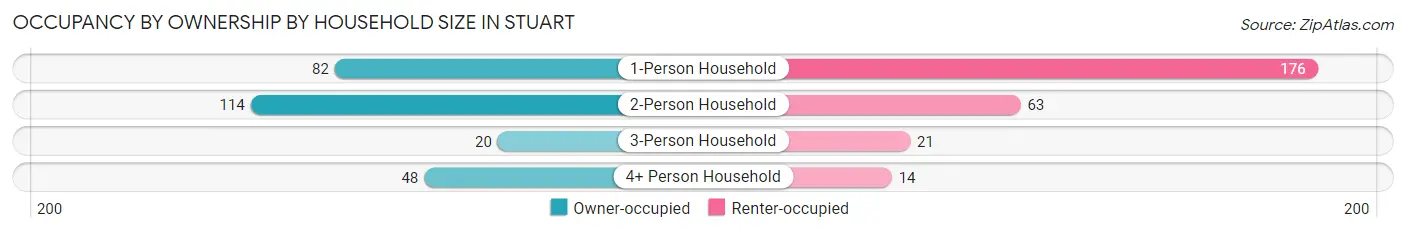
| Household Size | Owner-occupied | Renter-occupied |
| 1-Person Household | 82 (31.8%) | 176 (68.2%) |
| 2-Person Household | 114 (64.4%) | 63 (35.6%) |
| 3-Person Household | 20 (48.8%) | 21 (51.2%) |
| 4+ Person Household | 48 (77.4%) | 14 (22.6%) |
| Total Housing Units | 264 (49.1%) | 274 (50.9%) |
Occupancy by Educational Attainment in Stuart
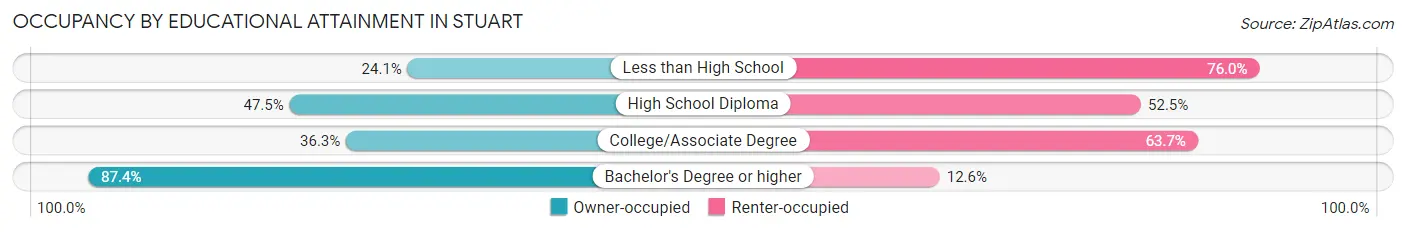
| Household Size | Owner-occupied | Renter-occupied |
| Less than High School | 19 (24.0%) | 60 (75.9%) |
| High School Diploma | 75 (47.5%) | 83 (52.5%) |
| College/Associate Degree | 66 (36.3%) | 116 (63.7%) |
| Bachelor's Degree or higher | 104 (87.4%) | 15 (12.6%) |
Occupancy by Age of Householder in Stuart
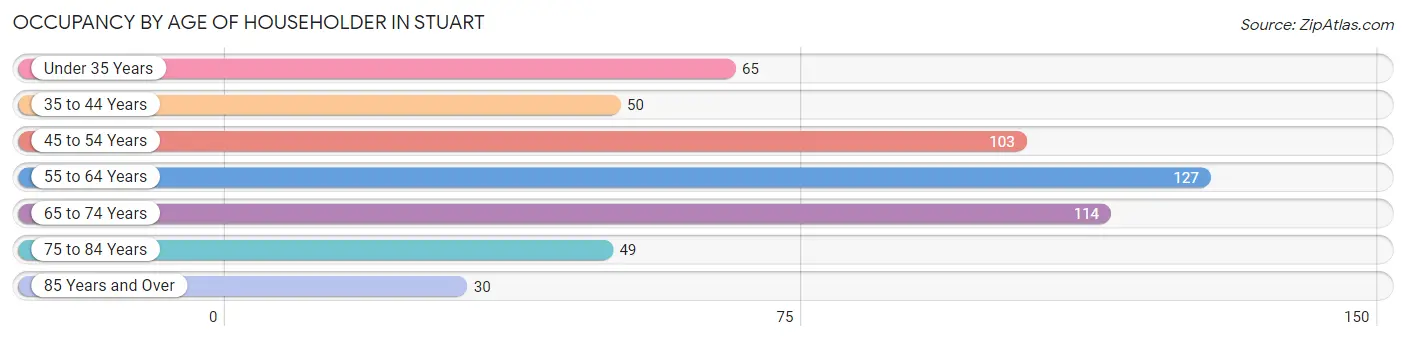
| Age Bracket | # Households | % Households |
| Under 35 Years | 65 | 12.1% |
| 35 to 44 Years | 50 | 9.3% |
| 45 to 54 Years | 103 | 19.1% |
| 55 to 64 Years | 127 | 23.6% |
| 65 to 74 Years | 114 | 21.2% |
| 75 to 84 Years | 49 | 9.1% |
| 85 Years and Over | 30 | 5.6% |
| Total | 538 | 100.0% |
Housing Finances in Stuart
Median Income by Occupancy in Stuart
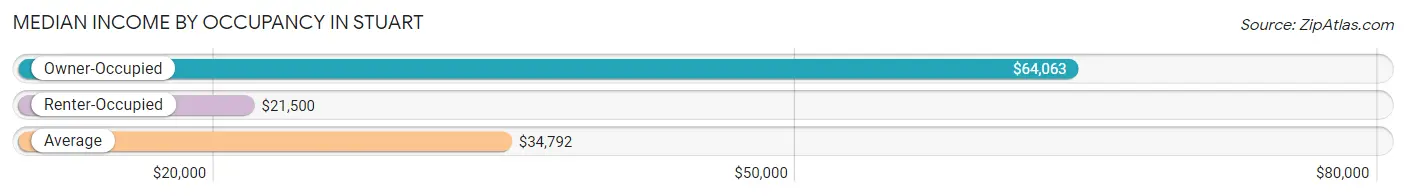
| Occupancy Type | # Households | Median Income |
| Owner-Occupied | 264 (49.1%) | $64,063 |
| Renter-Occupied | 274 (50.9%) | $21,500 |
| Average | 538 (100.0%) | $34,792 |
Occupancy by Householder Income Bracket in Stuart
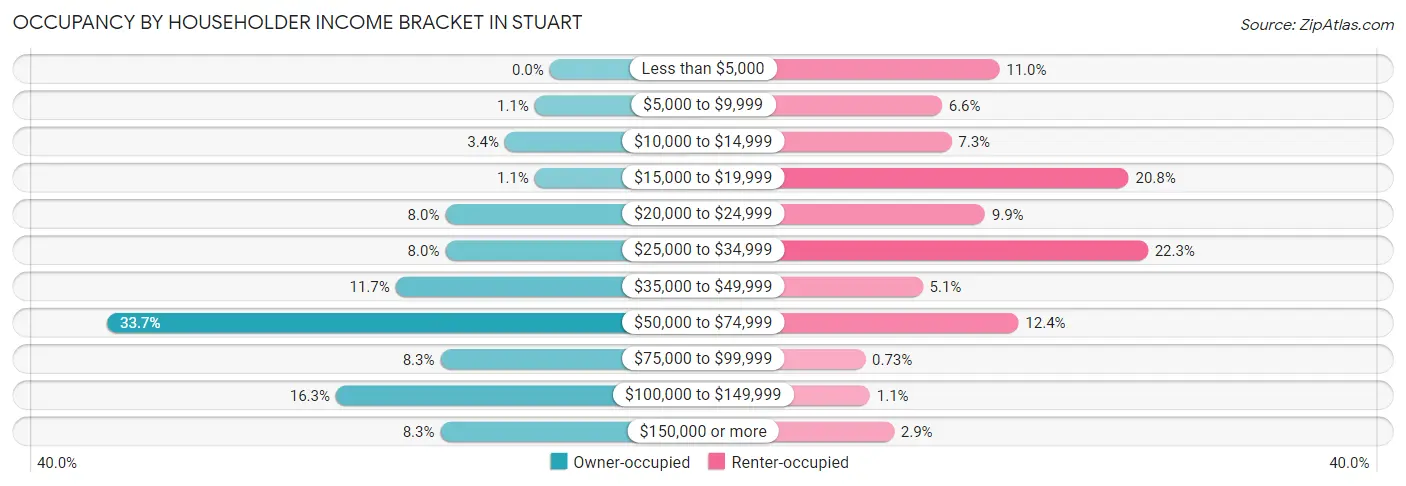
| Income Bracket | Owner-occupied | Renter-occupied |
| Less than $5,000 | 0 (0.0%) | 30 (11.0%) |
| $5,000 to $9,999 | 3 (1.1%) | 18 (6.6%) |
| $10,000 to $14,999 | 9 (3.4%) | 20 (7.3%) |
| $15,000 to $19,999 | 3 (1.1%) | 57 (20.8%) |
| $20,000 to $24,999 | 21 (8.0%) | 27 (9.9%) |
| $25,000 to $34,999 | 21 (8.0%) | 61 (22.3%) |
| $35,000 to $49,999 | 31 (11.7%) | 14 (5.1%) |
| $50,000 to $74,999 | 89 (33.7%) | 34 (12.4%) |
| $75,000 to $99,999 | 22 (8.3%) | 2 (0.7%) |
| $100,000 to $149,999 | 43 (16.3%) | 3 (1.1%) |
| $150,000 or more | 22 (8.3%) | 8 (2.9%) |
| Total | 264 (100.0%) | 274 (100.0%) |
Monthly Housing Cost Tiers in Stuart
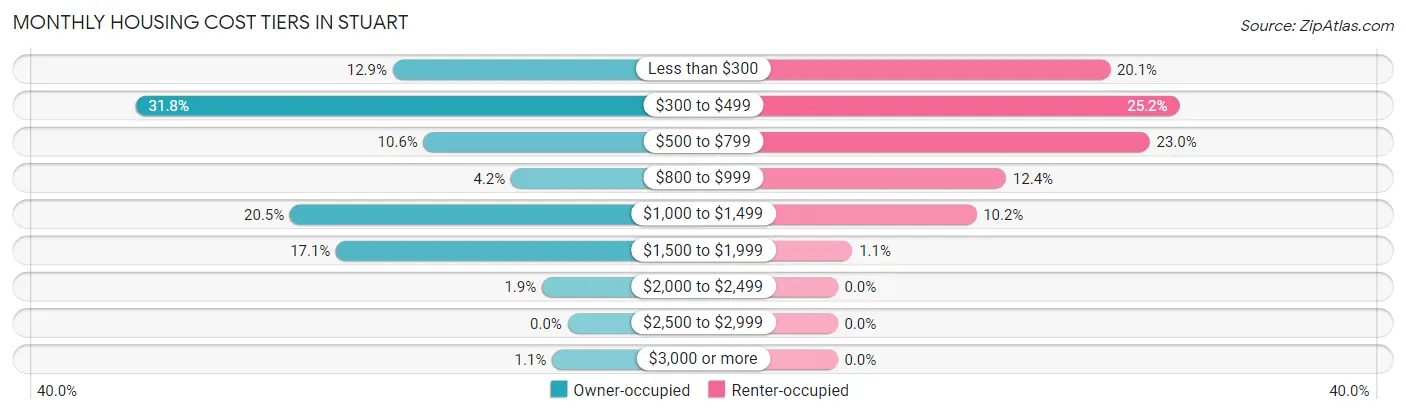
| Monthly Cost | Owner-occupied | Renter-occupied |
| Less than $300 | 34 (12.9%) | 55 (20.1%) |
| $300 to $499 | 84 (31.8%) | 69 (25.2%) |
| $500 to $799 | 28 (10.6%) | 63 (23.0%) |
| $800 to $999 | 11 (4.2%) | 34 (12.4%) |
| $1,000 to $1,499 | 54 (20.4%) | 28 (10.2%) |
| $1,500 to $1,999 | 45 (17.1%) | 3 (1.1%) |
| $2,000 to $2,499 | 5 (1.9%) | 0 (0.0%) |
| $2,500 to $2,999 | 0 (0.0%) | 0 (0.0%) |
| $3,000 or more | 3 (1.1%) | 0 (0.0%) |
| Total | 264 (100.0%) | 274 (100.0%) |
Physical Housing Characteristics in Stuart
Housing Structures in Stuart
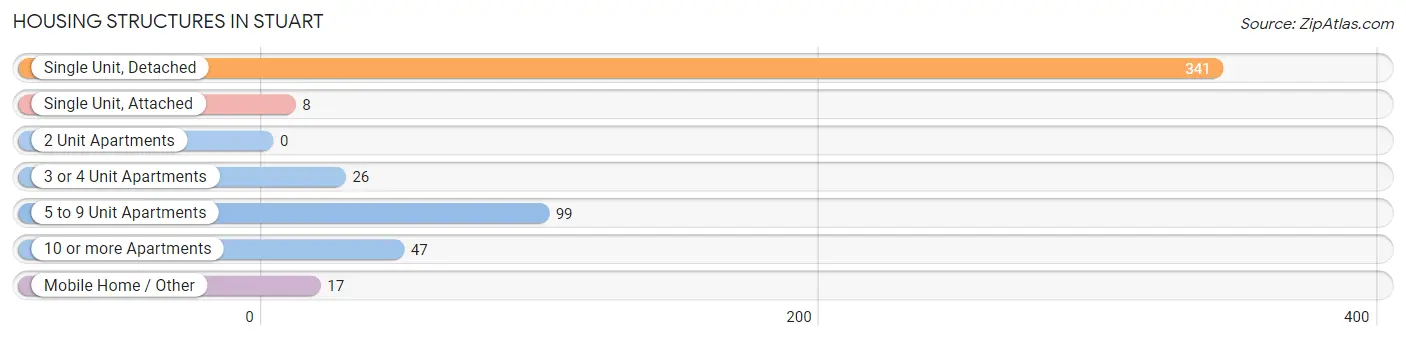
| Structure Type | # Housing Units | % Housing Units |
| Single Unit, Detached | 341 | 63.4% |
| Single Unit, Attached | 8 | 1.5% |
| 2 Unit Apartments | 0 | 0.0% |
| 3 or 4 Unit Apartments | 26 | 4.8% |
| 5 to 9 Unit Apartments | 99 | 18.4% |
| 10 or more Apartments | 47 | 8.7% |
| Mobile Home / Other | 17 | 3.2% |
| Total | 538 | 100.0% |
Housing Structures by Occupancy in Stuart
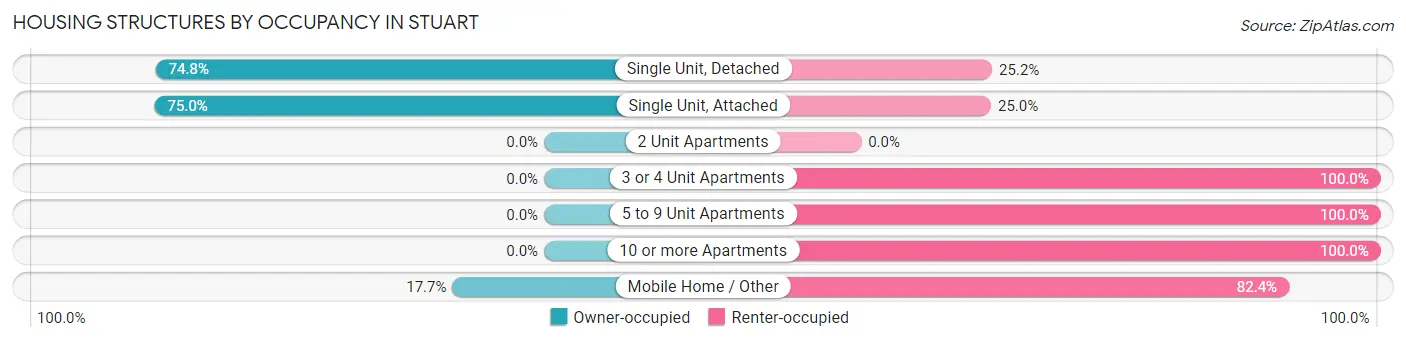
| Structure Type | Owner-occupied | Renter-occupied |
| Single Unit, Detached | 255 (74.8%) | 86 (25.2%) |
| Single Unit, Attached | 6 (75.0%) | 2 (25.0%) |
| 2 Unit Apartments | 0 (0.0%) | 0 (0.0%) |
| 3 or 4 Unit Apartments | 0 (0.0%) | 26 (100.0%) |
| 5 to 9 Unit Apartments | 0 (0.0%) | 99 (100.0%) |
| 10 or more Apartments | 0 (0.0%) | 47 (100.0%) |
| Mobile Home / Other | 3 (17.6%) | 14 (82.4%) |
| Total | 264 (49.1%) | 274 (50.9%) |
Housing Structures by Number of Rooms in Stuart
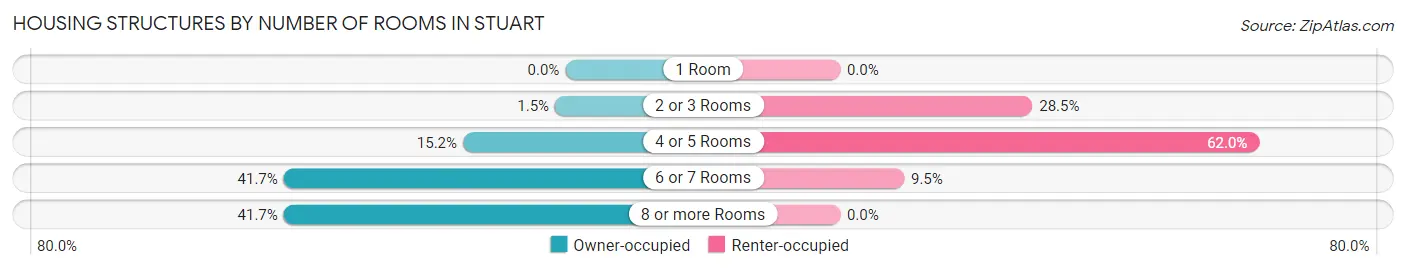
| Number of Rooms | Owner-occupied | Renter-occupied |
| 1 Room | 0 (0.0%) | 0 (0.0%) |
| 2 or 3 Rooms | 4 (1.5%) | 78 (28.5%) |
| 4 or 5 Rooms | 40 (15.1%) | 170 (62.0%) |
| 6 or 7 Rooms | 110 (41.7%) | 26 (9.5%) |
| 8 or more Rooms | 110 (41.7%) | 0 (0.0%) |
| Total | 264 (100.0%) | 274 (100.0%) |
Housing Structure by Heating Type in Stuart
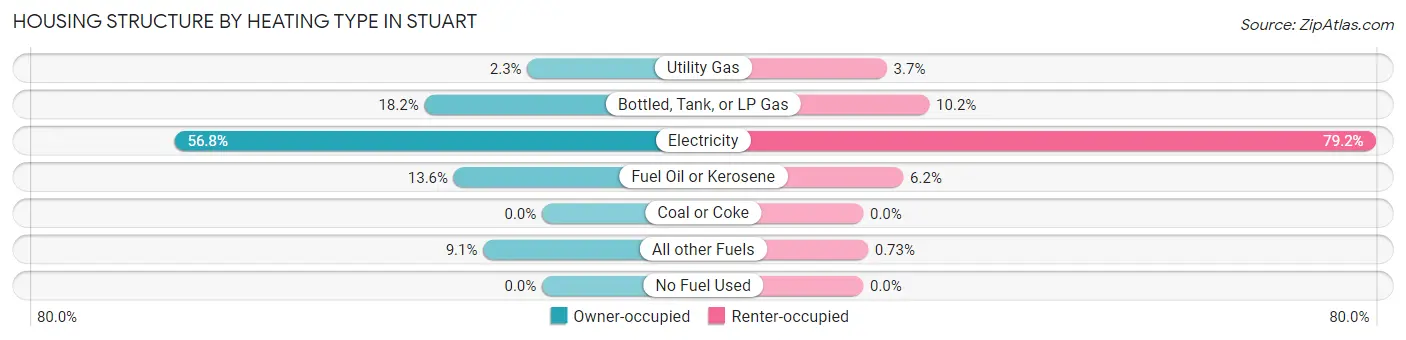
| Heating Type | Owner-occupied | Renter-occupied |
| Utility Gas | 6 (2.3%) | 10 (3.6%) |
| Bottled, Tank, or LP Gas | 48 (18.2%) | 28 (10.2%) |
| Electricity | 150 (56.8%) | 217 (79.2%) |
| Fuel Oil or Kerosene | 36 (13.6%) | 17 (6.2%) |
| Coal or Coke | 0 (0.0%) | 0 (0.0%) |
| All other Fuels | 24 (9.1%) | 2 (0.7%) |
| No Fuel Used | 0 (0.0%) | 0 (0.0%) |
| Total | 264 (100.0%) | 274 (100.0%) |
Household Vehicle Usage in Stuart
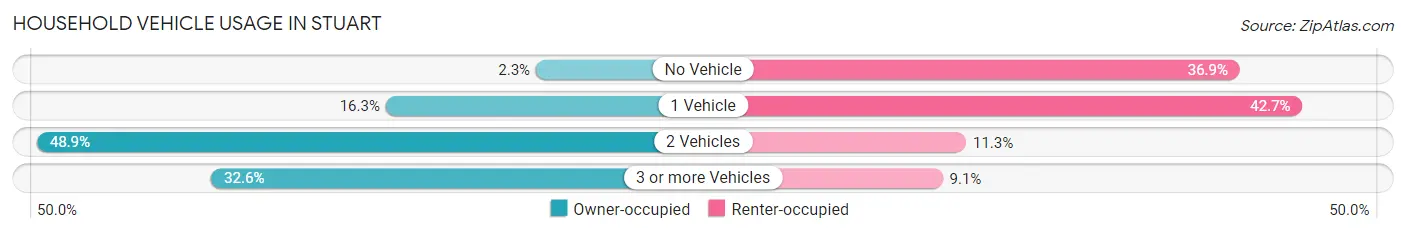
| Vehicles per Household | Owner-occupied | Renter-occupied |
| No Vehicle | 6 (2.3%) | 101 (36.9%) |
| 1 Vehicle | 43 (16.3%) | 117 (42.7%) |
| 2 Vehicles | 129 (48.9%) | 31 (11.3%) |
| 3 or more Vehicles | 86 (32.6%) | 25 (9.1%) |
| Total | 264 (100.0%) | 274 (100.0%) |
Real Estate & Mortgages in Stuart
Real Estate and Mortgage Overview in Stuart
| Characteristic | Without Mortgage | With Mortgage |
| Housing Units | 142 | 122 |
| Median Property Value | $136,500 | $238,900 |
| Median Household Income | $57,500 | $16 |
| Monthly Housing Costs | $390 | $3 |
| Real Estate Taxes | $1,125 | $0 |
Property Value by Mortgage Status in Stuart
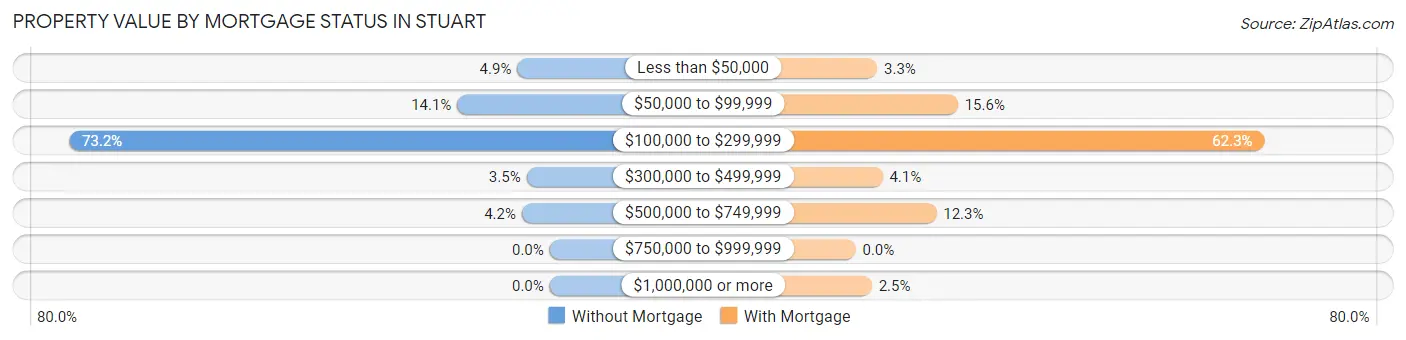
| Property Value | Without Mortgage | With Mortgage |
| Less than $50,000 | 7 (4.9%) | 4 (3.3%) |
| $50,000 to $99,999 | 20 (14.1%) | 19 (15.6%) |
| $100,000 to $299,999 | 104 (73.2%) | 76 (62.3%) |
| $300,000 to $499,999 | 5 (3.5%) | 5 (4.1%) |
| $500,000 to $749,999 | 6 (4.2%) | 15 (12.3%) |
| $750,000 to $999,999 | 0 (0.0%) | 0 (0.0%) |
| $1,000,000 or more | 0 (0.0%) | 3 (2.5%) |
| Total | 142 (100.0%) | 122 (100.0%) |
Household Income by Mortgage Status in Stuart
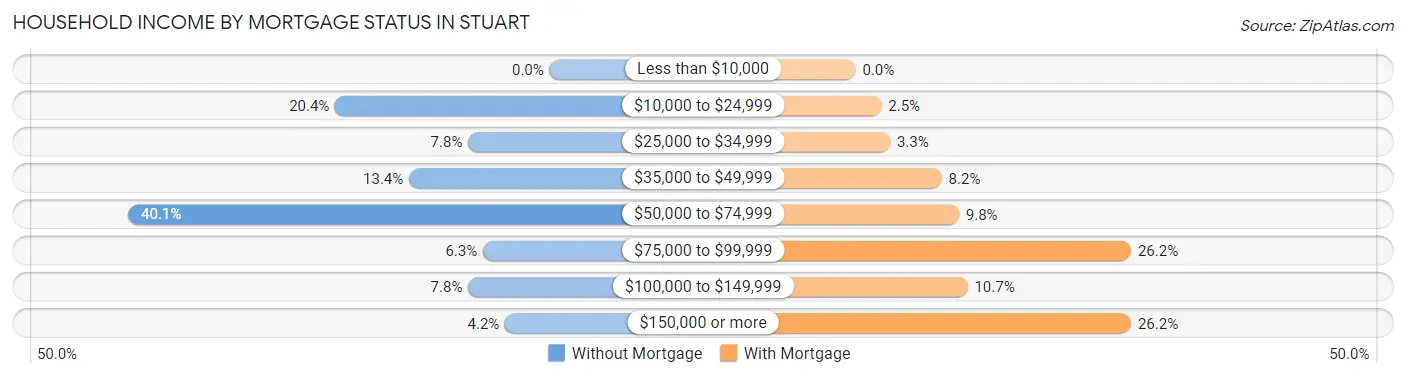
| Household Income | Without Mortgage | With Mortgage |
| Less than $10,000 | 0 (0.0%) | 0 (0.0%) |
| $10,000 to $24,999 | 29 (20.4%) | 3 (2.5%) |
| $25,000 to $34,999 | 11 (7.7%) | 4 (3.3%) |
| $35,000 to $49,999 | 19 (13.4%) | 10 (8.2%) |
| $50,000 to $74,999 | 57 (40.1%) | 12 (9.8%) |
| $75,000 to $99,999 | 9 (6.3%) | 32 (26.2%) |
| $100,000 to $149,999 | 11 (7.7%) | 13 (10.7%) |
| $150,000 or more | 6 (4.2%) | 32 (26.2%) |
| Total | 142 (100.0%) | 122 (100.0%) |
Property Value to Household Income Ratio in Stuart
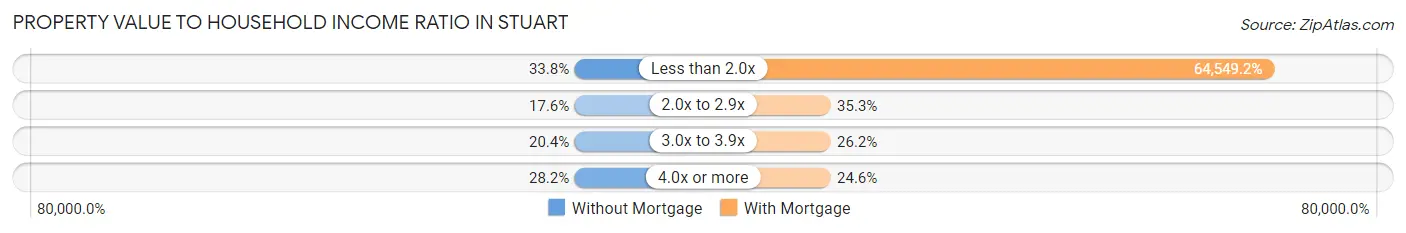
| Value-to-Income Ratio | Without Mortgage | With Mortgage |
| Less than 2.0x | 48 (33.8%) | 78,750 (64,549.2%) |
| 2.0x to 2.9x | 25 (17.6%) | 43 (35.2%) |
| 3.0x to 3.9x | 29 (20.4%) | 32 (26.2%) |
| 4.0x or more | 40 (28.2%) | 30 (24.6%) |
| Total | 142 (100.0%) | 122 (100.0%) |
Real Estate Taxes by Mortgage Status in Stuart
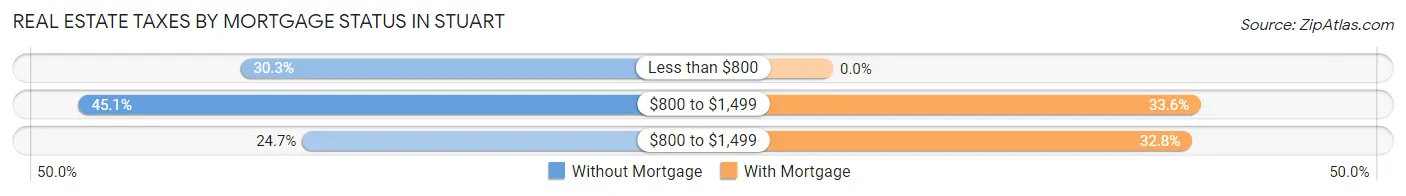
| Property Taxes | Without Mortgage | With Mortgage |
| Less than $800 | 43 (30.3%) | 0 (0.0%) |
| $800 to $1,499 | 64 (45.1%) | 41 (33.6%) |
| $800 to $1,499 | 35 (24.6%) | 40 (32.8%) |
| Total | 142 (100.0%) | 122 (100.0%) |
Health & Disability in Stuart
Health Insurance Coverage by Age in Stuart
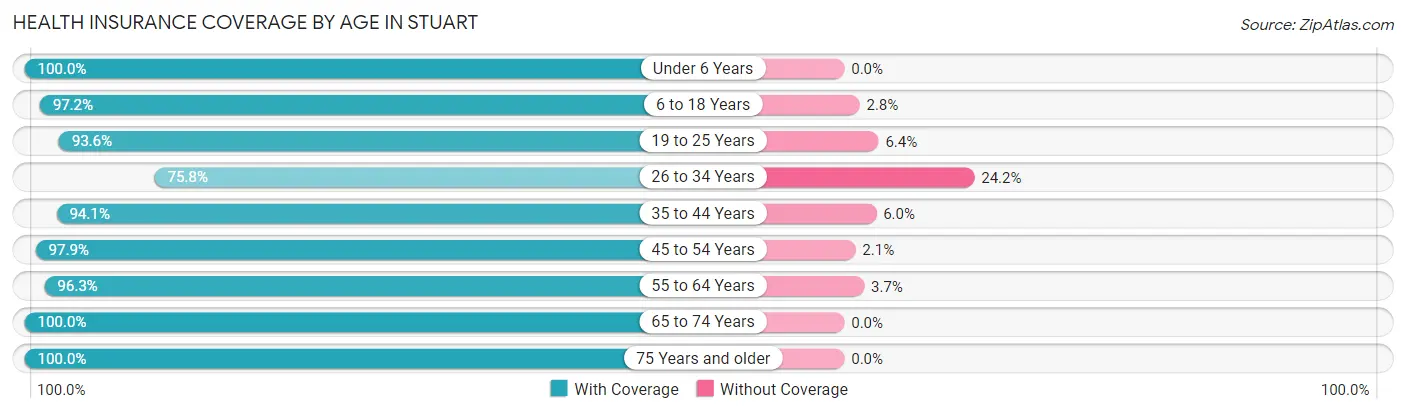
| Age Bracket | With Coverage | Without Coverage |
| Under 6 Years | 81 (100.0%) | 0 (0.0%) |
| 6 to 18 Years | 171 (97.2%) | 5 (2.8%) |
| 19 to 25 Years | 88 (93.6%) | 6 (6.4%) |
| 26 to 34 Years | 50 (75.8%) | 16 (24.2%) |
| 35 to 44 Years | 79 (94.1%) | 5 (5.9%) |
| 45 to 54 Years | 142 (97.9%) | 3 (2.1%) |
| 55 to 64 Years | 182 (96.3%) | 7 (3.7%) |
| 65 to 74 Years | 146 (100.0%) | 0 (0.0%) |
| 75 Years and older | 132 (100.0%) | 0 (0.0%) |
| Total | 1,071 (96.2%) | 42 (3.8%) |
Health Insurance Coverage by Citizenship Status in Stuart
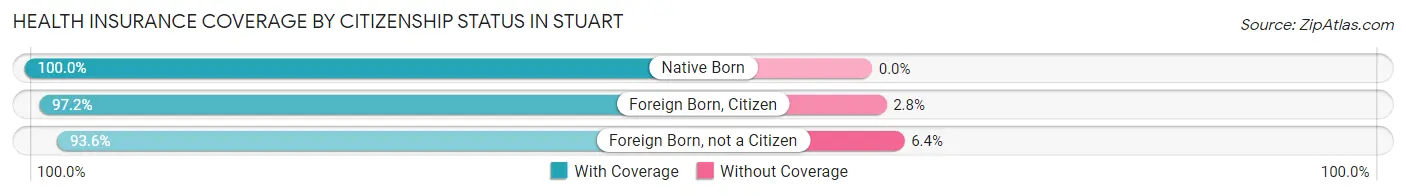
| Citizenship Status | With Coverage | Without Coverage |
| Native Born | 81 (100.0%) | 0 (0.0%) |
| Foreign Born, Citizen | 171 (97.2%) | 5 (2.8%) |
| Foreign Born, not a Citizen | 88 (93.6%) | 6 (6.4%) |
Health Insurance Coverage by Household Income in Stuart
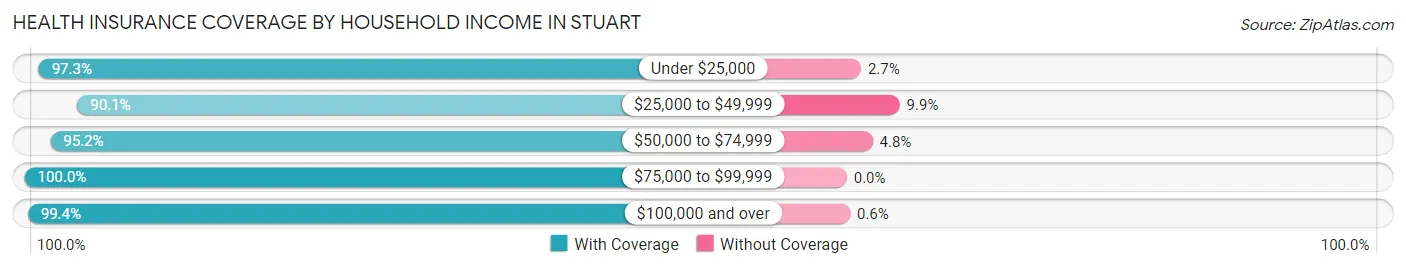
| Household Income | With Coverage | Without Coverage |
| Under $25,000 | 256 (97.3%) | 7 (2.7%) |
| $25,000 to $49,999 | 182 (90.1%) | 20 (9.9%) |
| $50,000 to $74,999 | 256 (95.2%) | 13 (4.8%) |
| $75,000 to $99,999 | 45 (100.0%) | 0 (0.0%) |
| $100,000 and over | 332 (99.4%) | 2 (0.6%) |
Public vs Private Health Insurance Coverage by Age in Stuart
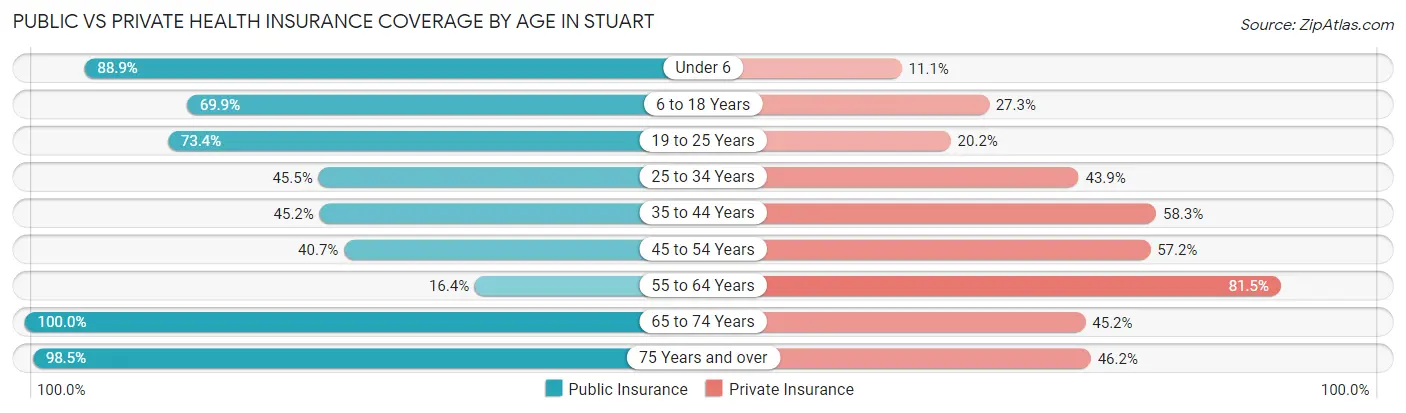
| Age Bracket | Public Insurance | Private Insurance |
| Under 6 | 72 (88.9%) | 9 (11.1%) |
| 6 to 18 Years | 123 (69.9%) | 48 (27.3%) |
| 19 to 25 Years | 69 (73.4%) | 19 (20.2%) |
| 25 to 34 Years | 30 (45.5%) | 29 (43.9%) |
| 35 to 44 Years | 38 (45.2%) | 49 (58.3%) |
| 45 to 54 Years | 59 (40.7%) | 83 (57.2%) |
| 55 to 64 Years | 31 (16.4%) | 154 (81.5%) |
| 65 to 74 Years | 146 (100.0%) | 66 (45.2%) |
| 75 Years and over | 130 (98.5%) | 61 (46.2%) |
| Total | 698 (62.7%) | 518 (46.5%) |
Disability Status by Sex by Age in Stuart
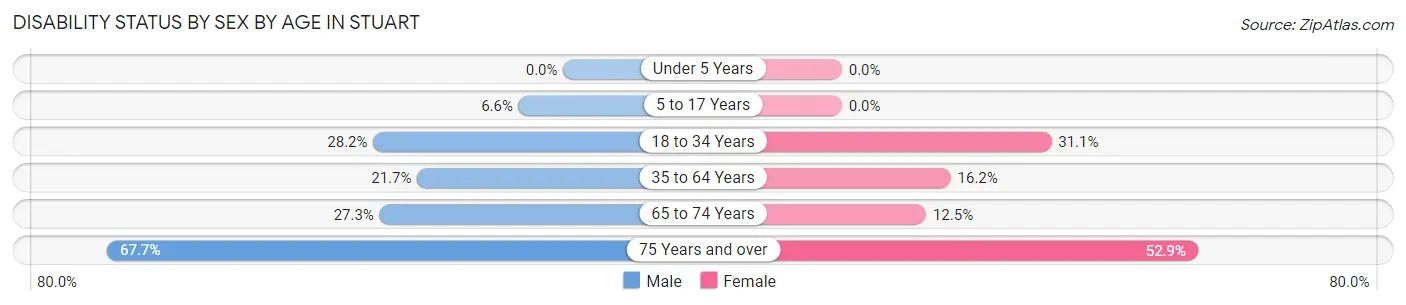
| Age Bracket | Male | Female |
| Under 5 Years | 0 (0.0%) | 0 (0.0%) |
| 5 to 17 Years | 9 (6.6%) | 0 (0.0%) |
| 18 to 34 Years | 22 (28.2%) | 28 (31.1%) |
| 35 to 64 Years | 41 (21.7%) | 37 (16.2%) |
| 65 to 74 Years | 18 (27.3%) | 10 (12.5%) |
| 75 Years and over | 42 (67.7%) | 37 (52.9%) |
Disability Class by Sex by Age in Stuart
Disability Class: Hearing Difficulty
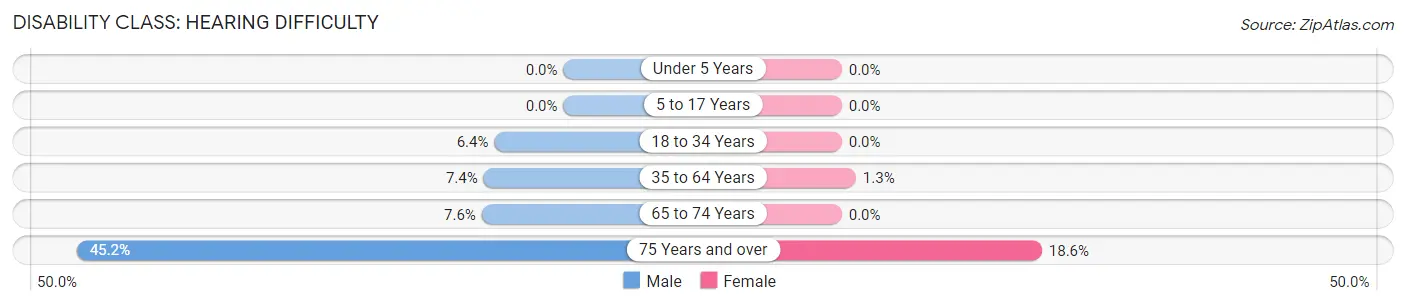
| Age Bracket | Male | Female |
| Under 5 Years | 0 (0.0%) | 0 (0.0%) |
| 5 to 17 Years | 0 (0.0%) | 0 (0.0%) |
| 18 to 34 Years | 5 (6.4%) | 0 (0.0%) |
| 35 to 64 Years | 14 (7.4%) | 3 (1.3%) |
| 65 to 74 Years | 5 (7.6%) | 0 (0.0%) |
| 75 Years and over | 28 (45.2%) | 13 (18.6%) |
Disability Class: Vision Difficulty
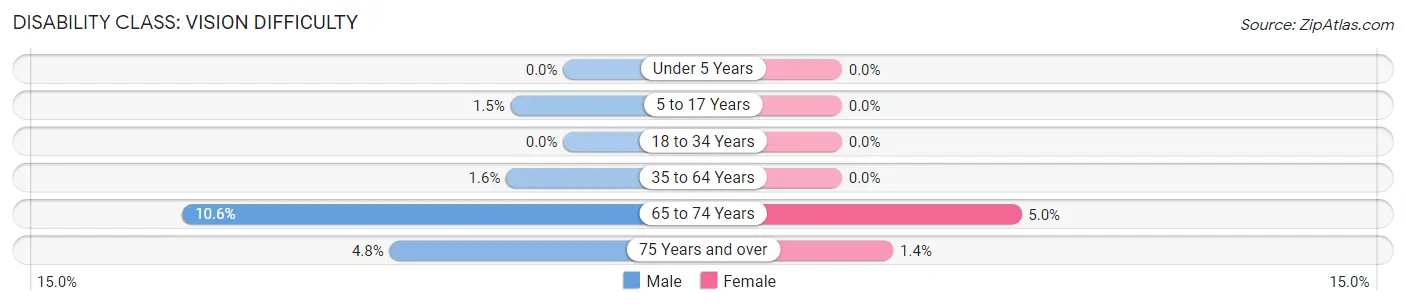
| Age Bracket | Male | Female |
| Under 5 Years | 0 (0.0%) | 0 (0.0%) |
| 5 to 17 Years | 2 (1.5%) | 0 (0.0%) |
| 18 to 34 Years | 0 (0.0%) | 0 (0.0%) |
| 35 to 64 Years | 3 (1.6%) | 0 (0.0%) |
| 65 to 74 Years | 7 (10.6%) | 4 (5.0%) |
| 75 Years and over | 3 (4.8%) | 1 (1.4%) |
Disability Class: Cognitive Difficulty
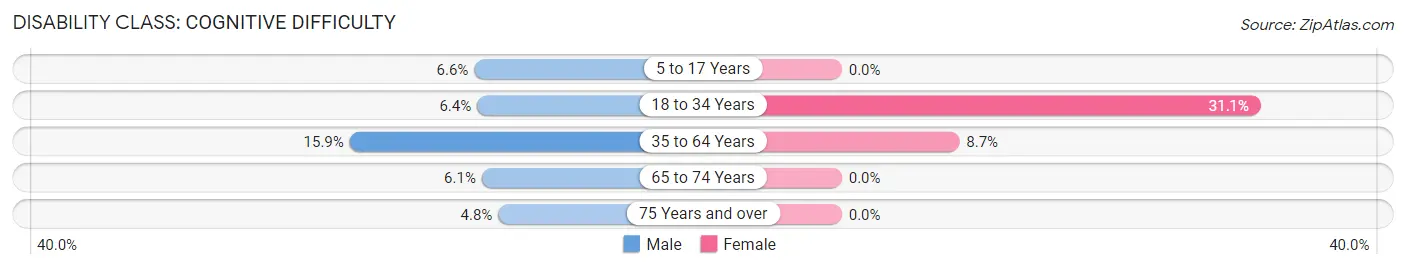
| Age Bracket | Male | Female |
| 5 to 17 Years | 9 (6.6%) | 0 (0.0%) |
| 18 to 34 Years | 5 (6.4%) | 28 (31.1%) |
| 35 to 64 Years | 30 (15.9%) | 20 (8.7%) |
| 65 to 74 Years | 4 (6.1%) | 0 (0.0%) |
| 75 Years and over | 3 (4.8%) | 0 (0.0%) |
Disability Class: Ambulatory Difficulty
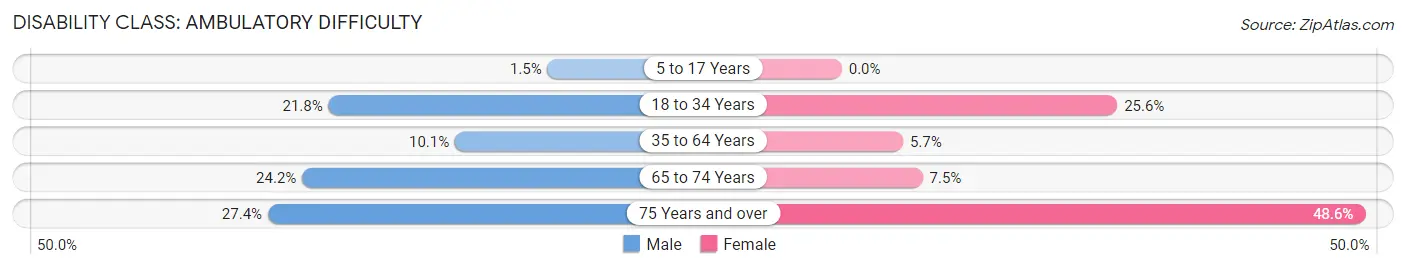
| Age Bracket | Male | Female |
| 5 to 17 Years | 2 (1.5%) | 0 (0.0%) |
| 18 to 34 Years | 17 (21.8%) | 23 (25.6%) |
| 35 to 64 Years | 19 (10.1%) | 13 (5.7%) |
| 65 to 74 Years | 16 (24.2%) | 6 (7.5%) |
| 75 Years and over | 17 (27.4%) | 34 (48.6%) |
Disability Class: Self-Care Difficulty
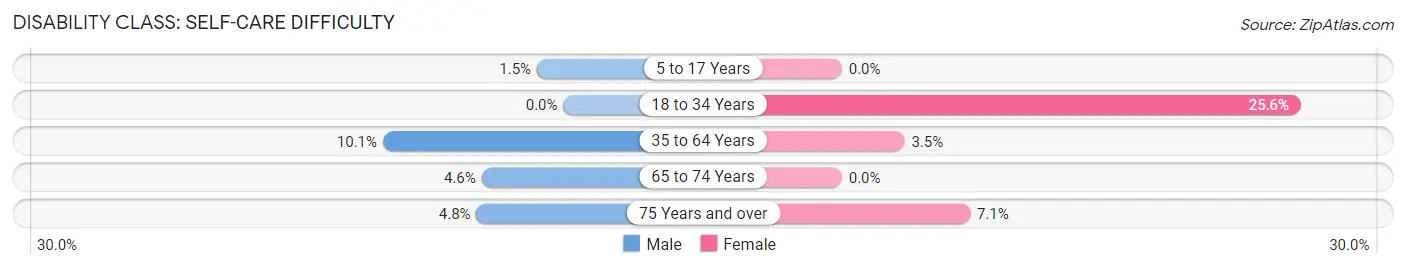
| Age Bracket | Male | Female |
| 5 to 17 Years | 2 (1.5%) | 0 (0.0%) |
| 18 to 34 Years | 0 (0.0%) | 23 (25.6%) |
| 35 to 64 Years | 19 (10.1%) | 8 (3.5%) |
| 65 to 74 Years | 3 (4.5%) | 0 (0.0%) |
| 75 Years and over | 3 (4.8%) | 5 (7.1%) |
Technology Access in Stuart
Computing Device Access in Stuart
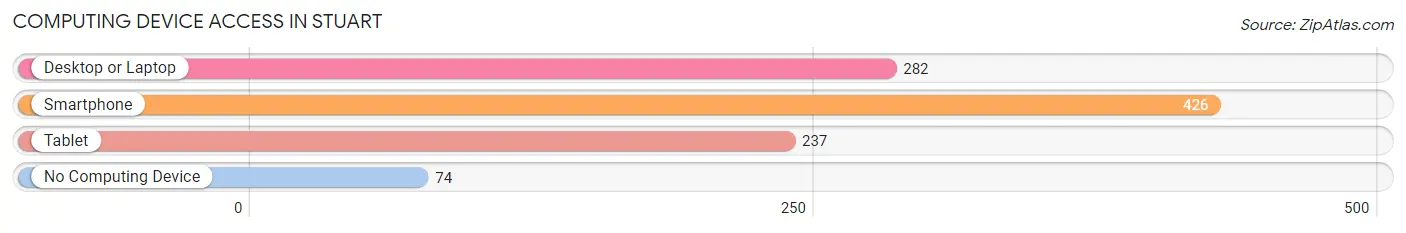
| Device Type | # Households | % Households |
| Desktop or Laptop | 282 | 52.4% |
| Smartphone | 426 | 79.2% |
| Tablet | 237 | 44.1% |
| No Computing Device | 74 | 13.8% |
| Total | 538 | 100.0% |
Internet Access in Stuart
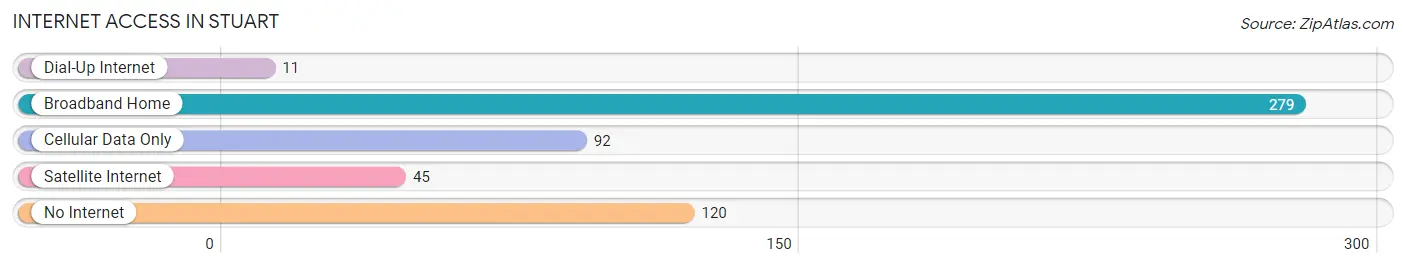
| Internet Type | # Households | % Households |
| Dial-Up Internet | 11 | 2.0% |
| Broadband Home | 279 | 51.9% |
| Cellular Data Only | 92 | 17.1% |
| Satellite Internet | 45 | 8.4% |
| No Internet | 120 | 22.3% |
| Total | 538 | 100.0% |
Stuart Summary
Stuart, Virginia is a small town located in Patrick County, Virginia. It is situated in the foothills of the Blue Ridge Mountains and is part of the Blue Ridge Highlands region. The town is located along the Smith River and is home to a population of approximately 1,400 people.
History
Stuart was founded in 1792 by William Stuart, a Revolutionary War veteran. The town was originally known as Stuartsville, but the name was changed to Stuart in 1891. The town was incorporated in 1894 and has remained a small, rural community ever since.
Stuart has a rich history of industry and agriculture. The town was once home to a thriving tobacco industry, as well as a number of other businesses. The town was also home to a number of mills, including a grist mill, a saw mill, and a woolen mill.
Geography
Stuart is located in the foothills of the Blue Ridge Mountains in Patrick County, Virginia. The town is situated along the Smith River and is surrounded by rolling hills and forests. The town is located approximately 30 miles from the city of Roanoke and is accessible via US Route 58.
Economy
Stuart’s economy is largely based on agriculture and tourism. The town is home to a number of farms, including cattle, sheep, and poultry farms. The town is also home to a number of small businesses, including restaurants, shops, and other services.
Tourism is an important part of the local economy. The town is home to a number of attractions, including the Stuart Historic District, the Stuart Farmers Market, and the Stuart Country Club. The town is also home to a number of outdoor recreation opportunities, including hiking, fishing, and camping.
Demographics
As of the 2010 census, the population of Stuart was 1,400. The town is predominantly white, with approximately 95% of the population identifying as white. The median household income in Stuart is $35,000, and the median age is 44.
Stuart is a small, rural community with a rich history and a strong sense of community. The town is home to a number of businesses and attractions, and is a popular destination for outdoor recreation. The town is also home to a number of farms and is a popular destination for tourists.
Common Questions
What is Per Capita Income in Stuart?
Per Capita income in Stuart is $22,332.
What is the Median Family Income in Stuart?
Median Family Income in Stuart is $67,813.
What is the Median Household income in Stuart?
Median Household Income in Stuart is $34,792.
What is Income or Wage Gap in Stuart?
Income or Wage Gap in Stuart is 25.3%.
Women in Stuart earn 74.7 cents for every dollar earned by a man.
What is Inequality or Gini Index in Stuart?
Inequality or Gini Index in Stuart is 0.48.
What is the Total Population of Stuart?
Total Population of Stuart is 1,533.
What is the Total Male Population of Stuart?
Total Male Population of Stuart is 820.
What is the Total Female Population of Stuart?
Total Female Population of Stuart is 713.
What is the Ratio of Males per 100 Females in Stuart?
There are 115.01 Males per 100 Females in Stuart.
What is the Ratio of Females per 100 Males in Stuart?
There are 86.95 Females per 100 Males in Stuart.
What is the Median Population Age in Stuart?
Median Population Age in Stuart is 54.8 Years.
What is the Average Family Size in Stuart
Average Family Size in Stuart is 3.2 People.
What is the Average Household Size in Stuart
Average Household Size in Stuart is 2.1 People.
How Large is the Labor Force in Stuart?
There are 463 People in the Labor Forcein in Stuart.
What is the Percentage of People in the Labor Force in Stuart?
35.7% of People are in the Labor Force in Stuart.
What is the Unemployment Rate in Stuart?
Unemployment Rate in Stuart is 8.6%.