Colonial Heights, VA Map & Demographics
Colonial Heights Map
Colonial Heights Overview
$37,039
PER CAPITA INCOME
$90,408
AVG FAMILY INCOME
$72,216
AVG HOUSEHOLD INCOME
27.0%
WAGE / INCOME GAP [ % ]
73.0¢/ $1
WAGE / INCOME GAP [ $ ]
0.41
INEQUALITY / GINI INDEX
18,158
TOTAL POPULATION
8,304
MALE POPULATION
9,854
FEMALE POPULATION
84.27
MALES / 100 FEMALES
118.67
FEMALES / 100 MALES
38.4
MEDIAN AGE
2.9
AVG FAMILY SIZE
2.4
AVG HOUSEHOLD SIZE
9,348
LABOR FORCE [ PEOPLE ]
65.0%
PERCENT IN LABOR FORCE
6.1%
UNEMPLOYMENT RATE
Colonial Heights Zip Codes
Income in Colonial Heights
Income Overview in Colonial Heights
Per Capita Income in Colonial Heights is $37,039, while median incomes of families and households are $90,408 and $72,216 respectively.
| Characteristic | Number | Measure |
| Per Capita Income | 18,158 | $37,039 |
| Median Family Income | 4,960 | $90,408 |
| Mean Family Income | 4,960 | $101,270 |
| Median Household Income | 7,612 | $72,216 |
| Mean Household Income | 7,612 | $87,287 |
| Income Deficit | 4,960 | $0 |
| Wage / Income Gap (%) | 18,158 | 26.95% |
| Wage / Income Gap ($) | 18,158 | 73.05¢ per $1 |
| Gini / Inequality Index | 18,158 | 0.41 |
Earnings by Sex in Colonial Heights
Average Earnings in Colonial Heights are $39,509, $48,092 for men and $35,129 for women, a difference of 27.0%.
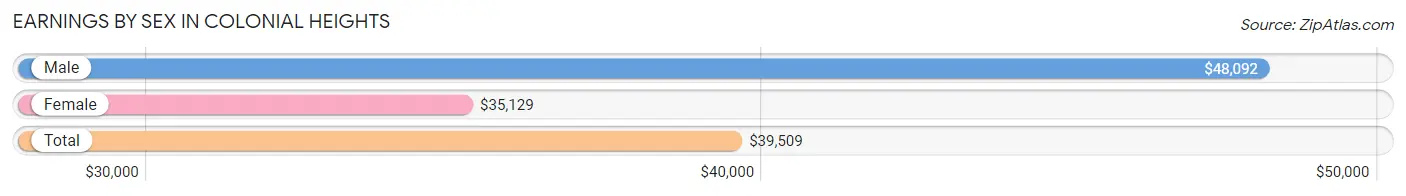
| Sex | Number | Average Earnings |
| Male | 4,631 (48.5%) | $48,092 |
| Female | 4,924 (51.5%) | $35,129 |
| Total | 9,555 (100.0%) | $39,509 |
Earnings by Sex by Income Bracket in Colonial Heights
The most common earnings brackets in Colonial Heights are $100,000+ for men (708 | 15.3%) and $55,000 to $64,999 for women (565 | 11.5%).
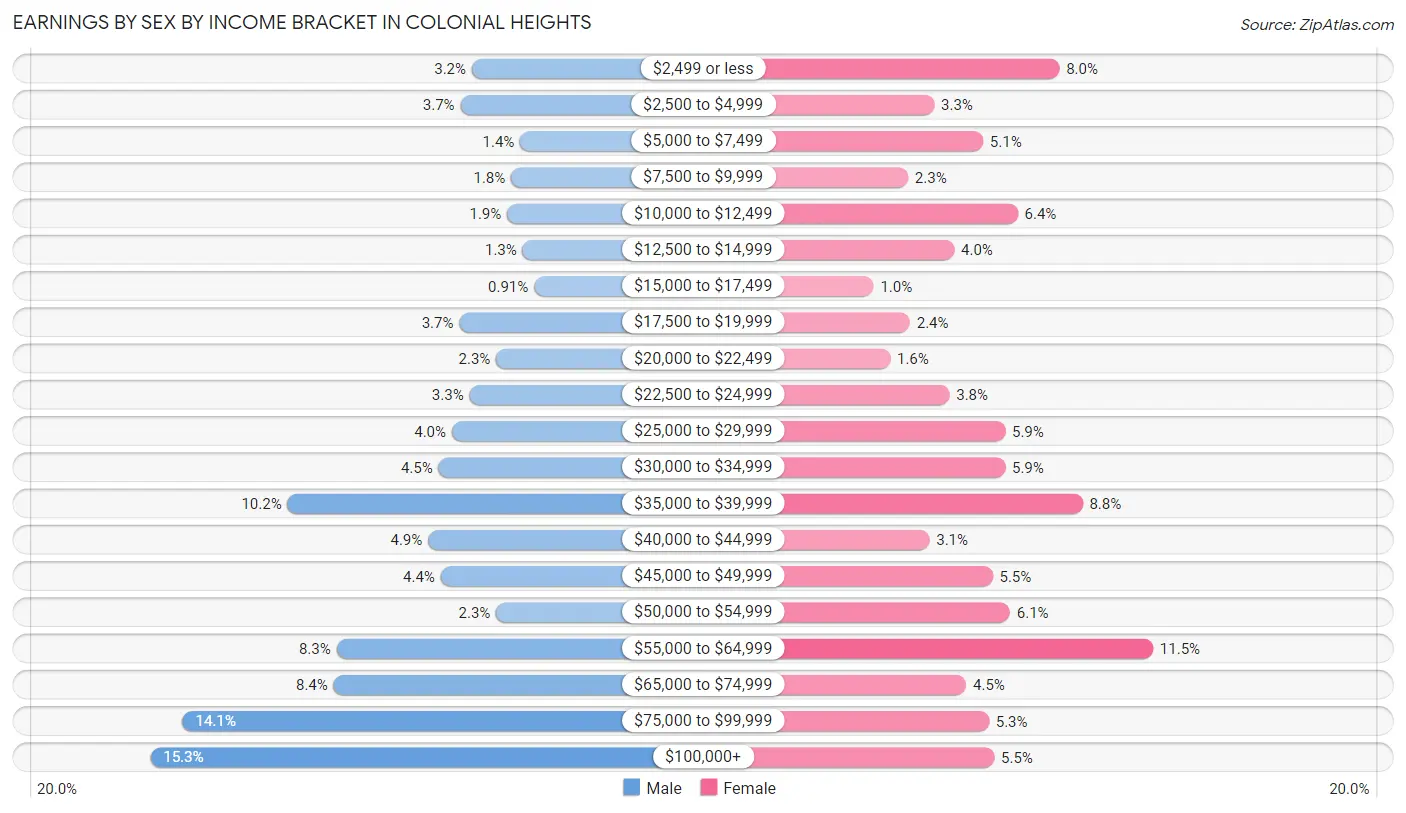
| Income | Male | Female |
| $2,499 or less | 150 (3.2%) | 392 (8.0%) |
| $2,500 to $4,999 | 170 (3.7%) | 161 (3.3%) |
| $5,000 to $7,499 | 66 (1.4%) | 251 (5.1%) |
| $7,500 to $9,999 | 82 (1.8%) | 113 (2.3%) |
| $10,000 to $12,499 | 89 (1.9%) | 315 (6.4%) |
| $12,500 to $14,999 | 62 (1.3%) | 198 (4.0%) |
| $15,000 to $17,499 | 42 (0.9%) | 49 (1.0%) |
| $17,500 to $19,999 | 172 (3.7%) | 116 (2.4%) |
| $20,000 to $22,499 | 108 (2.3%) | 80 (1.6%) |
| $22,500 to $24,999 | 154 (3.3%) | 189 (3.8%) |
| $25,000 to $29,999 | 185 (4.0%) | 292 (5.9%) |
| $30,000 to $34,999 | 208 (4.5%) | 292 (5.9%) |
| $35,000 to $39,999 | 470 (10.2%) | 435 (8.8%) |
| $40,000 to $44,999 | 226 (4.9%) | 152 (3.1%) |
| $45,000 to $49,999 | 204 (4.4%) | 269 (5.5%) |
| $50,000 to $54,999 | 108 (2.3%) | 301 (6.1%) |
| $55,000 to $64,999 | 385 (8.3%) | 565 (11.5%) |
| $65,000 to $74,999 | 390 (8.4%) | 220 (4.5%) |
| $75,000 to $99,999 | 652 (14.1%) | 262 (5.3%) |
| $100,000+ | 708 (15.3%) | 272 (5.5%) |
| Total | 4,631 (100.0%) | 4,924 (100.0%) |
Earnings by Sex by Educational Attainment in Colonial Heights
Average earnings in Colonial Heights are $56,976 for men and $37,311 for women, a difference of 34.5%. Men with an educational attainment of graduate degree enjoy the highest average annual earnings of $79,815, while those with less than high school education earn the least with $18,242. Women with an educational attainment of graduate degree earn the most with the average annual earnings of $56,823, while those with high school diploma education have the smallest earnings of $32,464.
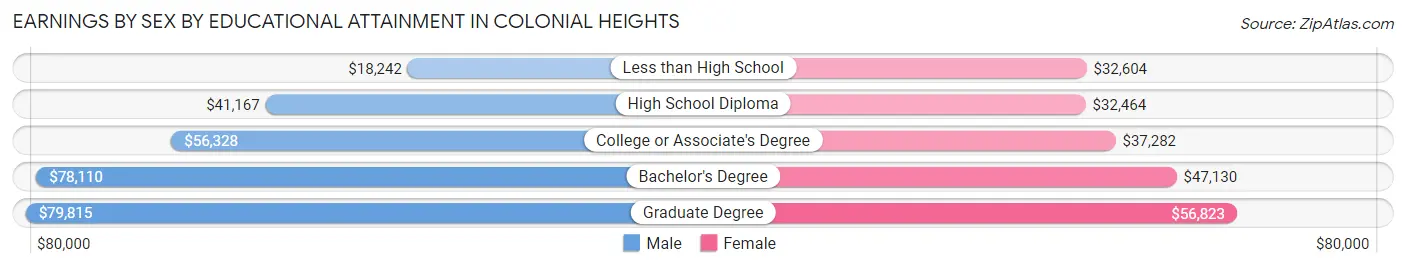
| Educational Attainment | Male Income | Female Income |
| Less than High School | $18,242 | $32,604 |
| High School Diploma | $41,167 | $32,464 |
| College or Associate's Degree | $56,328 | $37,282 |
| Bachelor's Degree | $78,110 | $47,130 |
| Graduate Degree | $79,815 | $56,823 |
| Total | $56,976 | $37,311 |
Family Income in Colonial Heights
Family Income Brackets in Colonial Heights
According to the Colonial Heights family income data, there are 1,433 families falling into the $100,000 to $149,999 income range, which is the most common income bracket and makes up 28.9% of all families. Conversely, the $10,000 to $14,999 income bracket is the least frequent group with only 30 families (0.6%) belonging to this category.
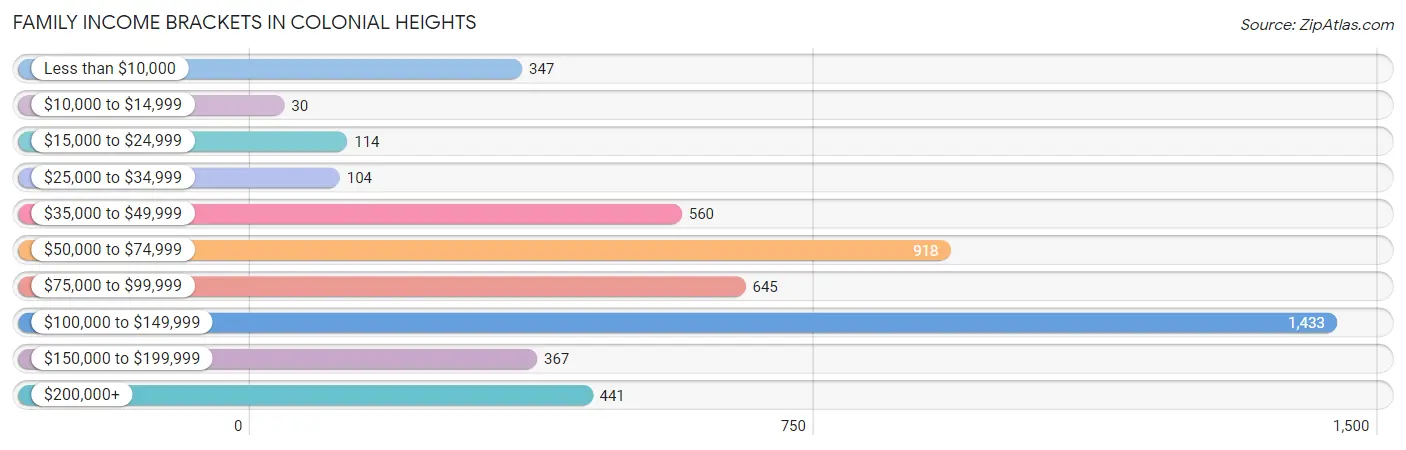
| Income Bracket | # Families | % Families |
| Less than $10,000 | 347 | 7.0% |
| $10,000 to $14,999 | 30 | 0.6% |
| $15,000 to $24,999 | 114 | 2.3% |
| $25,000 to $34,999 | 104 | 2.1% |
| $35,000 to $49,999 | 560 | 11.3% |
| $50,000 to $74,999 | 918 | 18.5% |
| $75,000 to $99,999 | 645 | 13.0% |
| $100,000 to $149,999 | 1,433 | 28.9% |
| $150,000 to $199,999 | 367 | 7.4% |
| $200,000+ | 441 | 8.9% |
Family Income by Famaliy Size in Colonial Heights
7+ person families (134 | 2.7%) account for the highest median family income in Colonial Heights with $155,568 per family, while 2-person families (2,478 | 50.0%) have the highest median income of $44,332 per family member.
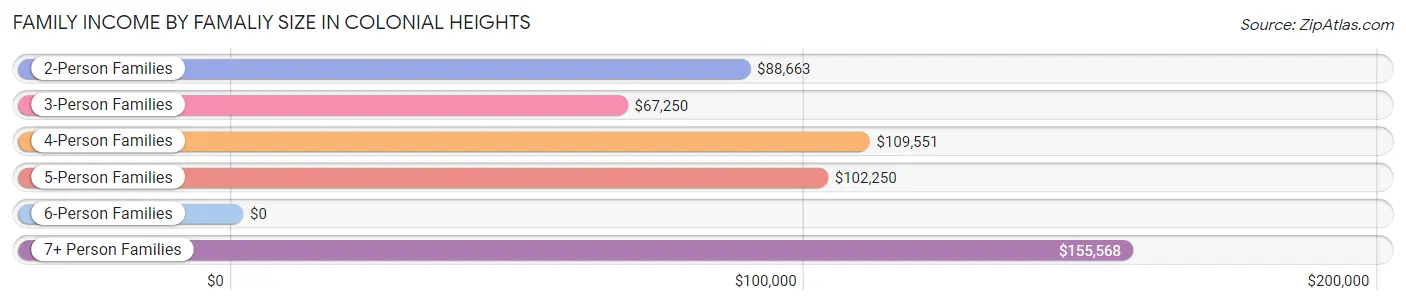
| Income Bracket | # Families | Median Income |
| 2-Person Families | 2,478 (50.0%) | $88,663 |
| 3-Person Families | 1,401 (28.2%) | $67,250 |
| 4-Person Families | 700 (14.1%) | $109,551 |
| 5-Person Families | 197 (4.0%) | $102,250 |
| 6-Person Families | 50 (1.0%) | $0 |
| 7+ Person Families | 134 (2.7%) | $155,568 |
| Total | 4,960 (100.0%) | $90,408 |
Family Income by Number of Earners in Colonial Heights
The median family income in Colonial Heights is $90,408, with families comprising 3+ earners (481) having the highest median family income of $152,569, while families with 1 earner (1,842) have the lowest median family income of $55,756, accounting for 9.7% and 37.1% of families, respectively.
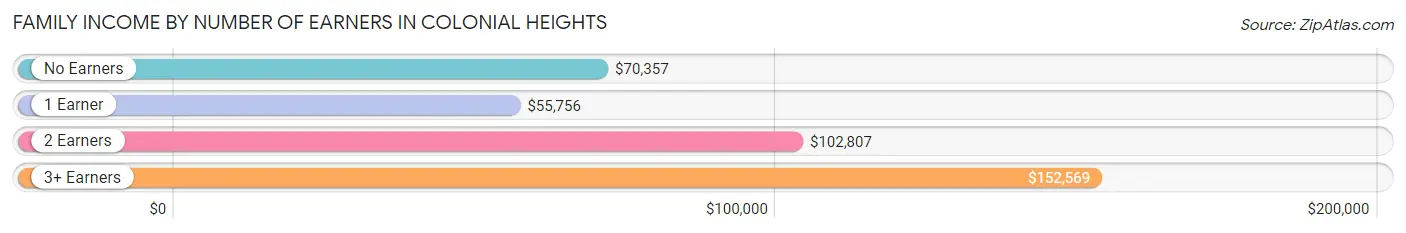
| Number of Earners | # Families | Median Income |
| No Earners | 790 (15.9%) | $70,357 |
| 1 Earner | 1,842 (37.1%) | $55,756 |
| 2 Earners | 1,847 (37.2%) | $102,807 |
| 3+ Earners | 481 (9.7%) | $152,569 |
| Total | 4,960 (100.0%) | $90,408 |
Household Income in Colonial Heights
Household Income Brackets in Colonial Heights
With 1,690 households falling in the category, the $100,000 to $149,999 income range is the most frequent in Colonial Heights, accounting for 22.2% of all households. In contrast, only 183 households (2.4%) fall into the $10,000 to $14,999 income bracket, making it the least populous group.
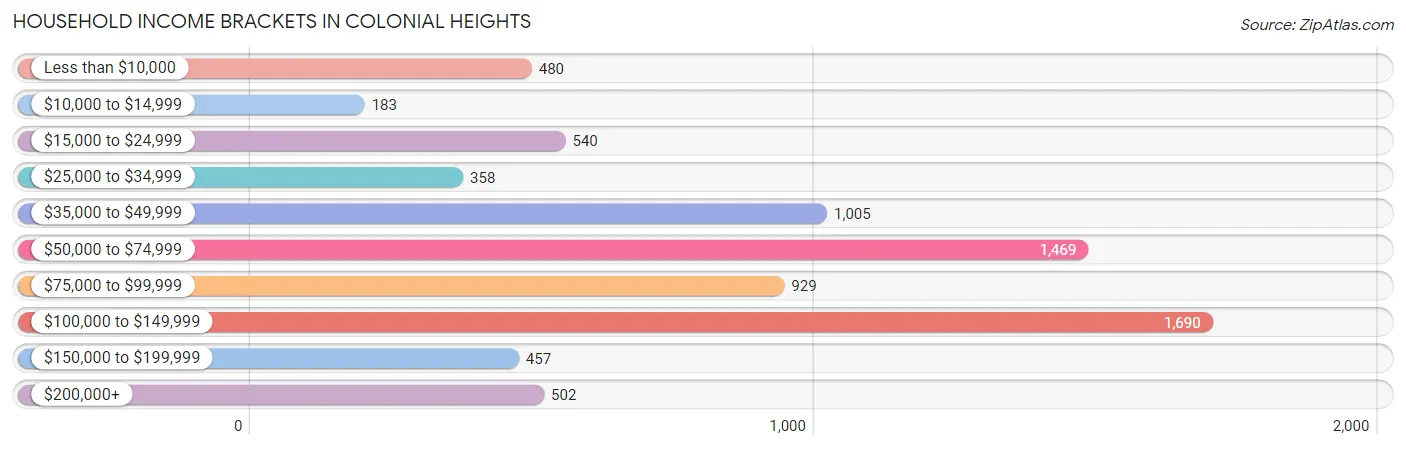
| Income Bracket | # Households | % Households |
| Less than $10,000 | 480 | 6.3% |
| $10,000 to $14,999 | 183 | 2.4% |
| $15,000 to $24,999 | 540 | 7.1% |
| $25,000 to $34,999 | 358 | 4.7% |
| $35,000 to $49,999 | 1,005 | 13.2% |
| $50,000 to $74,999 | 1,469 | 19.3% |
| $75,000 to $99,999 | 929 | 12.2% |
| $100,000 to $149,999 | 1,690 | 22.2% |
| $150,000 to $199,999 | 457 | 6.0% |
| $200,000+ | 502 | 6.6% |
Household Income by Householder Age in Colonial Heights
The median household income in Colonial Heights is $72,216, with the highest median household income of $89,692 found in the 45 to 64 years age bracket for the primary householder. A total of 2,663 households (35.0%) fall into this category. Meanwhile, the 15 to 24 years age bracket for the primary householder has the lowest median household income of $0, with 185 households (2.4%) in this group.
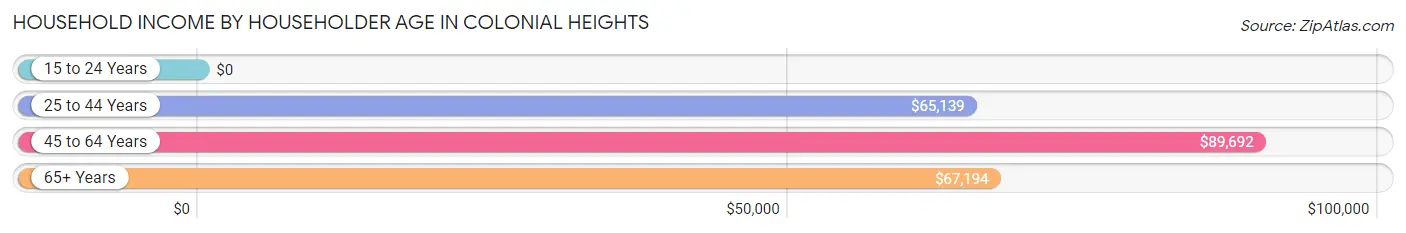
| Income Bracket | # Households | Median Income |
| 15 to 24 Years | 185 (2.4%) | $0 |
| 25 to 44 Years | 2,549 (33.5%) | $65,139 |
| 45 to 64 Years | 2,663 (35.0%) | $89,692 |
| 65+ Years | 2,215 (29.1%) | $67,194 |
| Total | 7,612 (100.0%) | $72,216 |
Poverty in Colonial Heights
Income Below Poverty by Sex and Age in Colonial Heights
With 8.6% poverty level for males and 11.6% for females among the residents of Colonial Heights, under 5 year old males and 5 year old females are the most vulnerable to poverty, with 142 males (33.5%) and 68 females (37.6%) in their respective age groups living below the poverty level.
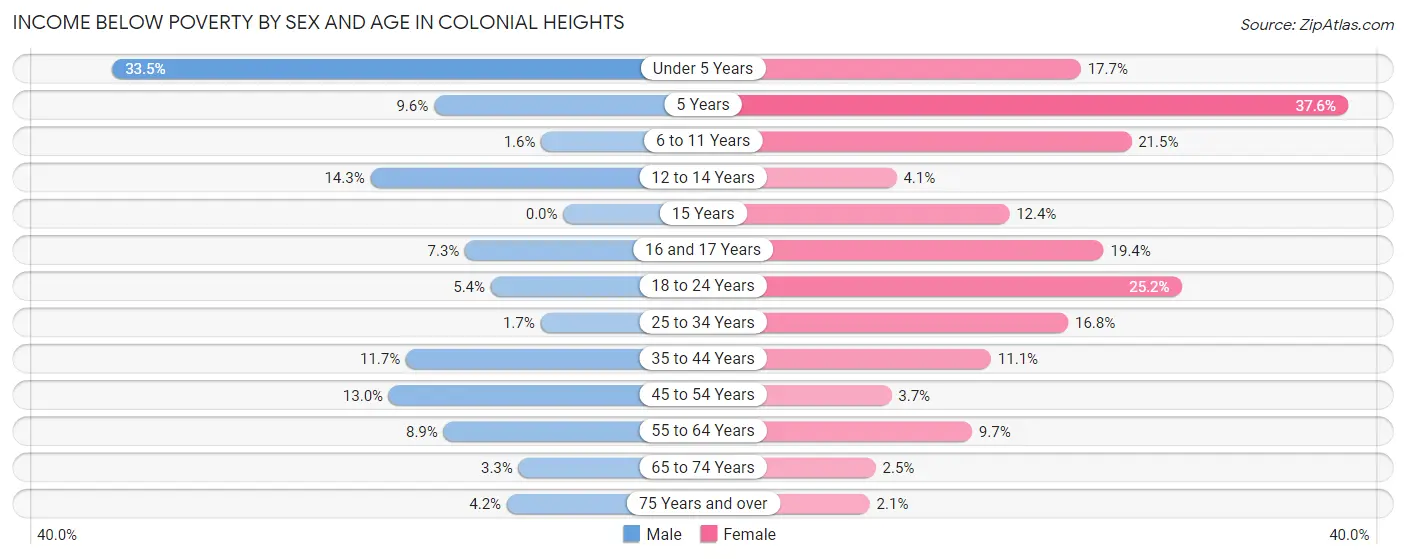
| Age Bracket | Male | Female |
| Under 5 Years | 142 (33.5%) | 121 (17.7%) |
| 5 Years | 12 (9.6%) | 68 (37.6%) |
| 6 to 11 Years | 10 (1.6%) | 133 (21.5%) |
| 12 to 14 Years | 57 (14.3%) | 14 (4.1%) |
| 15 Years | 0 (0.0%) | 22 (12.4%) |
| 16 and 17 Years | 18 (7.3%) | 42 (19.4%) |
| 18 to 24 Years | 33 (5.4%) | 149 (25.2%) |
| 25 to 34 Years | 19 (1.7%) | 243 (16.8%) |
| 35 to 44 Years | 116 (11.7%) | 136 (11.1%) |
| 45 to 54 Years | 144 (13.0%) | 40 (3.7%) |
| 55 to 64 Years | 95 (8.9%) | 118 (9.7%) |
| 65 to 74 Years | 24 (3.3%) | 25 (2.5%) |
| 75 Years and over | 26 (4.2%) | 19 (2.1%) |
| Total | 696 (8.6%) | 1,130 (11.6%) |
Income Above Poverty by Sex and Age in Colonial Heights
According to the poverty statistics in Colonial Heights, males aged 15 years and females aged 75 years and over are the age groups that are most secure financially, with 100.0% of males and 97.9% of females in these age groups living above the poverty line.
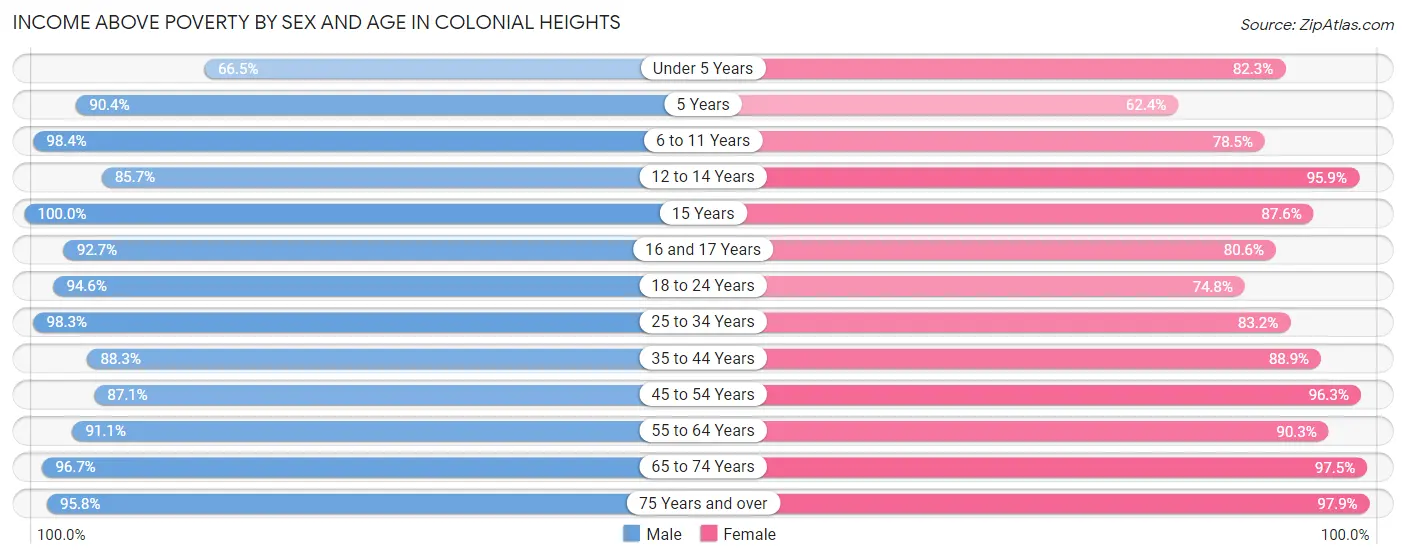
| Age Bracket | Male | Female |
| Under 5 Years | 282 (66.5%) | 561 (82.3%) |
| 5 Years | 113 (90.4%) | 113 (62.4%) |
| 6 to 11 Years | 601 (98.4%) | 486 (78.5%) |
| 12 to 14 Years | 341 (85.7%) | 331 (95.9%) |
| 15 Years | 87 (100.0%) | 155 (87.6%) |
| 16 and 17 Years | 229 (92.7%) | 174 (80.6%) |
| 18 to 24 Years | 580 (94.6%) | 442 (74.8%) |
| 25 to 34 Years | 1,103 (98.3%) | 1,203 (83.2%) |
| 35 to 44 Years | 877 (88.3%) | 1,093 (88.9%) |
| 45 to 54 Years | 968 (87.1%) | 1,047 (96.3%) |
| 55 to 64 Years | 974 (91.1%) | 1,103 (90.3%) |
| 65 to 74 Years | 699 (96.7%) | 973 (97.5%) |
| 75 Years and over | 595 (95.8%) | 898 (97.9%) |
| Total | 7,449 (91.4%) | 8,579 (88.4%) |
Income Below Poverty Among Married-Couple Families in Colonial Heights
The poverty statistics for married-couple families in Colonial Heights show that 2.8% or 85 of the total 3,081 families live below the poverty line. Families with 3 or 4 children have the highest poverty rate of 14.5%, comprising of 24 families. On the other hand, families with 5 or more children have the lowest poverty rate of 0.0%, which includes 0 families.
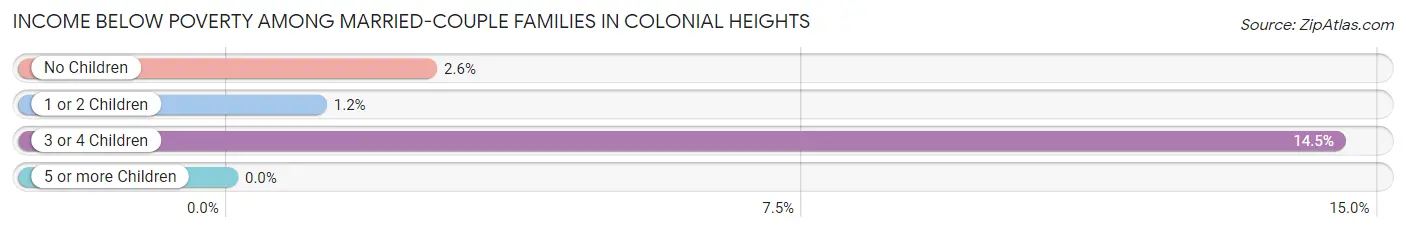
| Children | Above Poverty | Below Poverty |
| No Children | 1,876 (97.4%) | 50 (2.6%) |
| 1 or 2 Children | 940 (98.8%) | 11 (1.2%) |
| 3 or 4 Children | 142 (85.5%) | 24 (14.5%) |
| 5 or more Children | 38 (100.0%) | 0 (0.0%) |
| Total | 2,996 (97.2%) | 85 (2.8%) |
Income Below Poverty Among Single-Parent Households in Colonial Heights
According to the poverty data in Colonial Heights, 4.2% or 13 single-father households and 24.2% or 379 single-mother households are living below the poverty line. Among single-father households, those with 1 or 2 children have the highest poverty rate, with 13 households (9.2%) experiencing poverty. Likewise, among single-mother households, those with 5 or more children have the highest poverty rate, with 20 households (100.0%) falling below the poverty line.
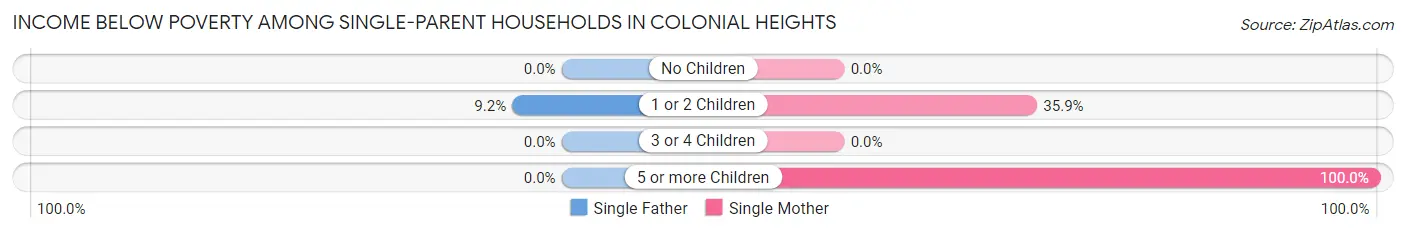
| Children | Single Father | Single Mother |
| No Children | 0 (0.0%) | 0 (0.0%) |
| 1 or 2 Children | 13 (9.2%) | 359 (35.9%) |
| 3 or 4 Children | 0 (0.0%) | 0 (0.0%) |
| 5 or more Children | 0 (0.0%) | 20 (100.0%) |
| Total | 13 (4.2%) | 379 (24.2%) |
Income Below Poverty Among Married-Couple vs Single-Parent Households in Colonial Heights
The poverty data for Colonial Heights shows that 85 of the married-couple family households (2.8%) and 392 of the single-parent households (20.9%) are living below the poverty level. Within the married-couple family households, those with 3 or 4 children have the highest poverty rate, with 24 households (14.5%) falling below the poverty line. Among the single-parent households, those with 5 or more children have the highest poverty rate, with 20 household (100.0%) living below poverty.
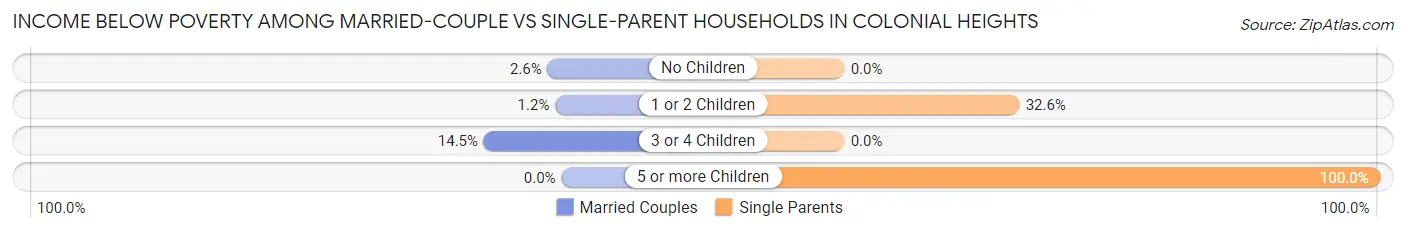
| Children | Married-Couple Families | Single-Parent Households |
| No Children | 50 (2.6%) | 0 (0.0%) |
| 1 or 2 Children | 11 (1.2%) | 372 (32.6%) |
| 3 or 4 Children | 24 (14.5%) | 0 (0.0%) |
| 5 or more Children | 0 (0.0%) | 20 (100.0%) |
| Total | 85 (2.8%) | 392 (20.9%) |
Race in Colonial Heights
The most populous races in Colonial Heights are White / Caucasian (13,079 | 72.0%), Black / African American (3,127 | 17.2%), and Hispanic or Latino (1,316 | 7.2%).
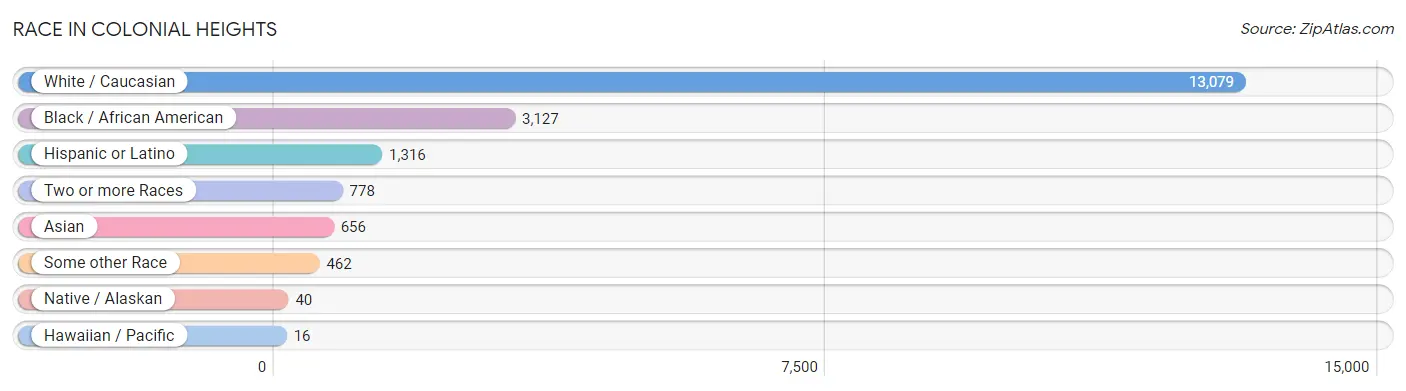
| Race | # Population | % Population |
| Asian | 656 | 3.6% |
| Black / African American | 3,127 | 17.2% |
| Hawaiian / Pacific | 16 | 0.1% |
| Hispanic or Latino | 1,316 | 7.2% |
| Native / Alaskan | 40 | 0.2% |
| White / Caucasian | 13,079 | 72.0% |
| Two or more Races | 778 | 4.3% |
| Some other Race | 462 | 2.5% |
| Total | 18,158 | 100.0% |
Ancestry in Colonial Heights
The most populous ancestries reported in Colonial Heights are English (2,426 | 13.4%), German (2,024 | 11.2%), Irish (1,854 | 10.2%), American (1,377 | 7.6%), and Italian (677 | 3.7%), together accounting for 46.0% of all Colonial Heights residents.
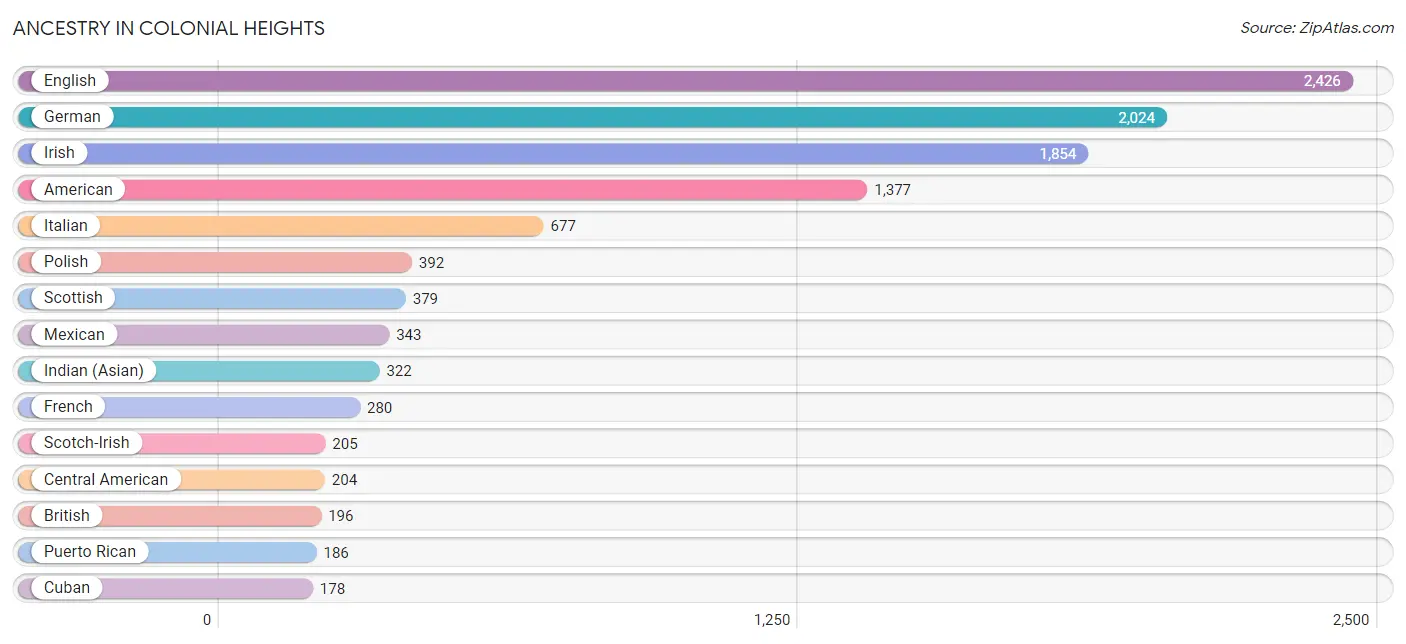
| Ancestry | # Population | % Population |
| African | 109 | 0.6% |
| American | 1,377 | 7.6% |
| Arab | 82 | 0.4% |
| Austrian | 8 | 0.0% |
| Belgian | 9 | 0.1% |
| Bhutanese | 76 | 0.4% |
| British | 196 | 1.1% |
| Burmese | 125 | 0.7% |
| Canadian | 80 | 0.4% |
| Celtic | 60 | 0.3% |
| Central American | 204 | 1.1% |
| Central American Indian | 23 | 0.1% |
| Cherokee | 20 | 0.1% |
| Chickasaw | 20 | 0.1% |
| Chippewa | 9 | 0.1% |
| Colombian | 42 | 0.2% |
| Croatian | 3 | 0.0% |
| Cuban | 178 | 1.0% |
| Czech | 53 | 0.3% |
| Czechoslovakian | 84 | 0.5% |
| Danish | 25 | 0.1% |
| Dutch | 89 | 0.5% |
| Ecuadorian | 64 | 0.4% |
| Egyptian | 20 | 0.1% |
| English | 2,426 | 13.4% |
| European | 134 | 0.7% |
| French | 280 | 1.5% |
| French Canadian | 25 | 0.1% |
| German | 2,024 | 11.2% |
| Greek | 53 | 0.3% |
| Guatemalan | 91 | 0.5% |
| Guyanese | 8 | 0.0% |
| Hungarian | 5 | 0.0% |
| Indian (Asian) | 322 | 1.8% |
| Irish | 1,854 | 10.2% |
| Italian | 677 | 3.7% |
| Jamaican | 21 | 0.1% |
| Korean | 20 | 0.1% |
| Lebanese | 18 | 0.1% |
| Mexican | 343 | 1.9% |
| Mongolian | 1 | 0.0% |
| Nicaraguan | 98 | 0.5% |
| Northern European | 24 | 0.1% |
| Norwegian | 22 | 0.1% |
| Pakistani | 27 | 0.2% |
| Palestinian | 35 | 0.2% |
| Panamanian | 15 | 0.1% |
| Pennsylvania German | 54 | 0.3% |
| Peruvian | 47 | 0.3% |
| Polish | 392 | 2.2% |
| Portuguese | 103 | 0.6% |
| Puerto Rican | 186 | 1.0% |
| Russian | 27 | 0.2% |
| Samoan | 16 | 0.1% |
| Scandinavian | 8 | 0.0% |
| Scotch-Irish | 205 | 1.1% |
| Scottish | 379 | 2.1% |
| Serbian | 3 | 0.0% |
| Slovak | 8 | 0.0% |
| South American | 153 | 0.8% |
| Spaniard | 25 | 0.1% |
| Sri Lankan | 36 | 0.2% |
| Subsaharan African | 111 | 0.6% |
| Swedish | 7 | 0.0% |
| Swiss | 65 | 0.4% |
| Thai | 84 | 0.5% |
| Welsh | 108 | 0.6% |
| West Indian | 23 | 0.1% | View All 68 Rows |
Immigrants in Colonial Heights
The most numerous immigrant groups reported in Colonial Heights came from Asia (486 | 2.7%), Eastern Asia (291 | 1.6%), Europe (248 | 1.4%), China (195 | 1.1%), and Latin America (176 | 1.0%), together accounting for 7.7% of all Colonial Heights residents.
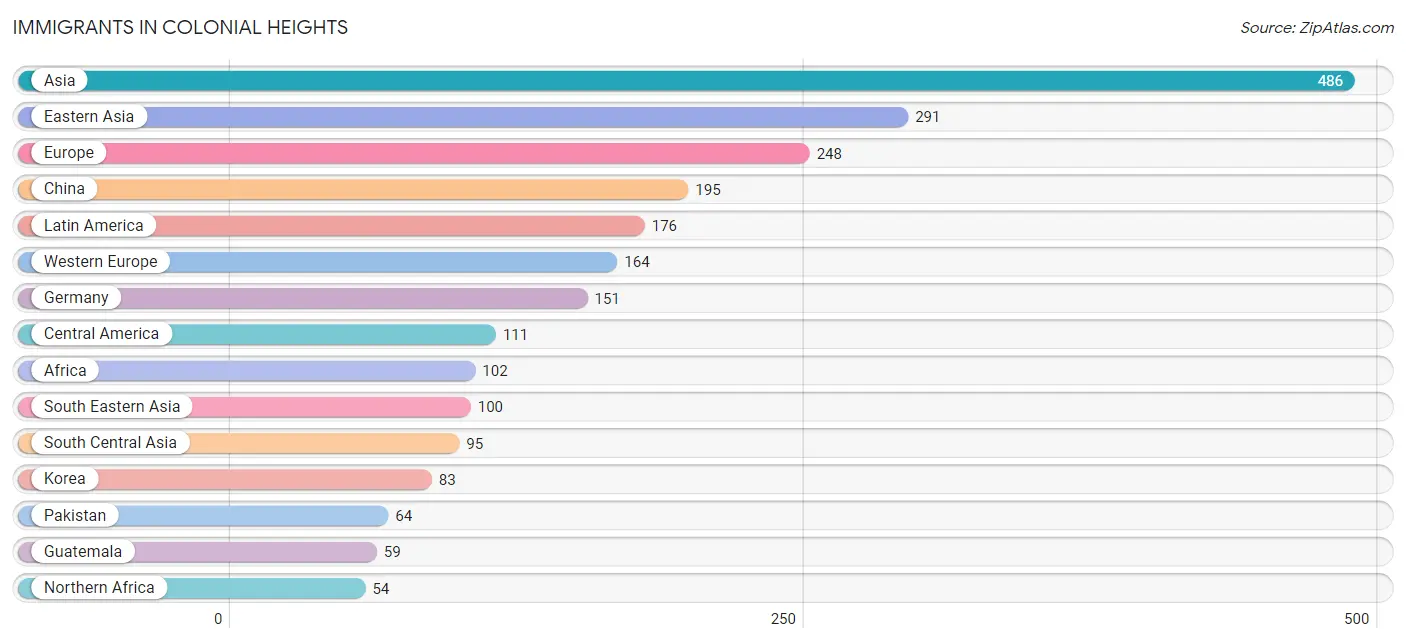
| Immigration Origin | # Population | % Population |
| Africa | 102 | 0.6% |
| Asia | 486 | 2.7% |
| Australia | 9 | 0.1% |
| Canada | 7 | 0.0% |
| Caribbean | 12 | 0.1% |
| Central America | 111 | 0.6% |
| China | 195 | 1.1% |
| Cuba | 12 | 0.1% |
| Eastern Africa | 2 | 0.0% |
| Eastern Asia | 291 | 1.6% |
| Egypt | 44 | 0.2% |
| England | 33 | 0.2% |
| Europe | 248 | 1.4% |
| Germany | 151 | 0.8% |
| Guatemala | 59 | 0.3% |
| Guyana | 26 | 0.1% |
| Hong Kong | 9 | 0.1% |
| India | 31 | 0.2% |
| Italy | 51 | 0.3% |
| Japan | 13 | 0.1% |
| Korea | 83 | 0.5% |
| Laos | 8 | 0.0% |
| Latin America | 176 | 1.0% |
| Malaysia | 1 | 0.0% |
| Nicaragua | 37 | 0.2% |
| Nigeria | 27 | 0.2% |
| Northern Africa | 54 | 0.3% |
| Northern Europe | 33 | 0.2% |
| Oceania | 9 | 0.1% |
| Pakistan | 64 | 0.4% |
| Panama | 15 | 0.1% |
| Peru | 27 | 0.2% |
| Philippines | 29 | 0.2% |
| South Africa | 19 | 0.1% |
| South America | 53 | 0.3% |
| South Central Asia | 95 | 0.5% |
| South Eastern Asia | 100 | 0.5% |
| Southern Europe | 51 | 0.3% |
| Switzerland | 13 | 0.1% |
| Thailand | 19 | 0.1% |
| Vietnam | 43 | 0.2% |
| Western Africa | 27 | 0.2% |
| Western Europe | 164 | 0.9% | View All 43 Rows |
Sex and Age in Colonial Heights
Sex and Age in Colonial Heights
The most populous age groups in Colonial Heights are 50 to 54 Years (683 | 8.2%) for men and 35 to 39 Years (853 | 8.7%) for women.
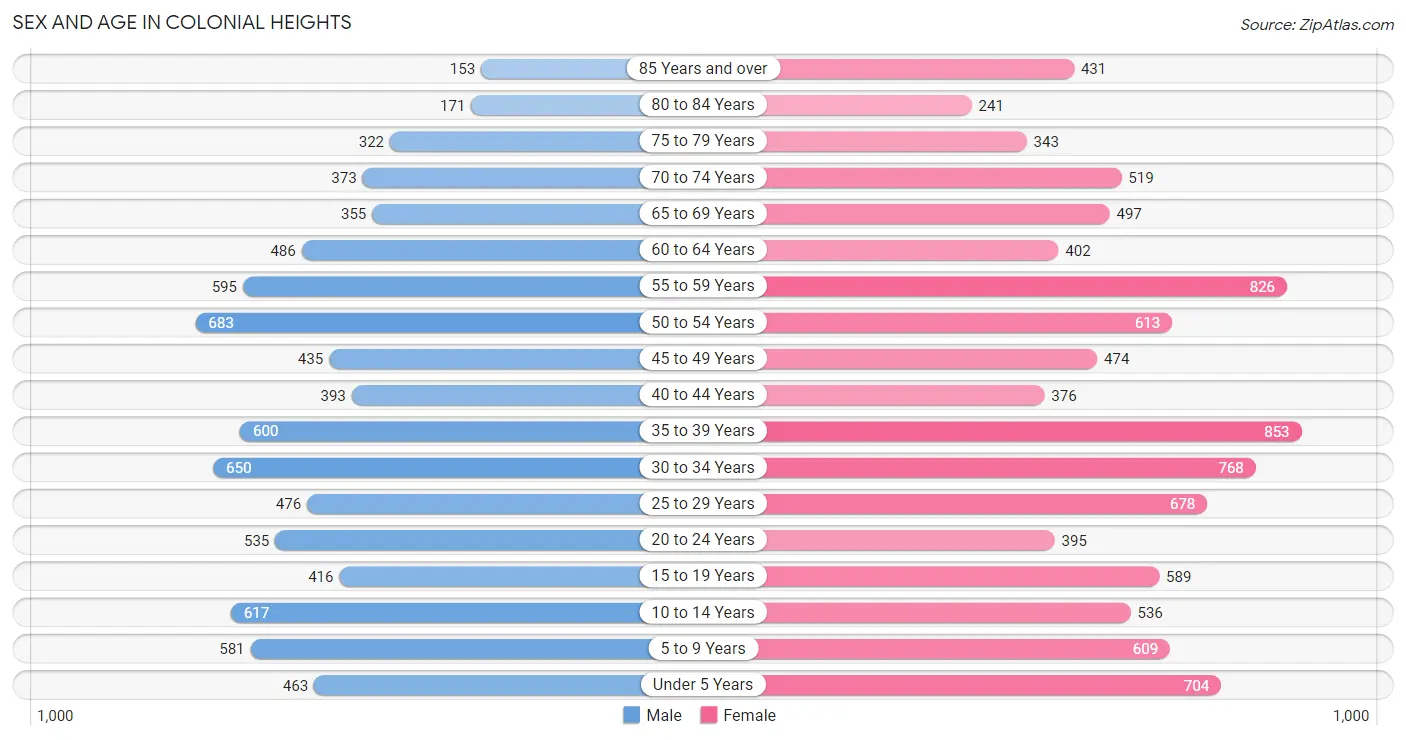
| Age Bracket | Male | Female |
| Under 5 Years | 463 (5.6%) | 704 (7.1%) |
| 5 to 9 Years | 581 (7.0%) | 609 (6.2%) |
| 10 to 14 Years | 617 (7.4%) | 536 (5.4%) |
| 15 to 19 Years | 416 (5.0%) | 589 (6.0%) |
| 20 to 24 Years | 535 (6.4%) | 395 (4.0%) |
| 25 to 29 Years | 476 (5.7%) | 678 (6.9%) |
| 30 to 34 Years | 650 (7.8%) | 768 (7.8%) |
| 35 to 39 Years | 600 (7.2%) | 853 (8.7%) |
| 40 to 44 Years | 393 (4.7%) | 376 (3.8%) |
| 45 to 49 Years | 435 (5.2%) | 474 (4.8%) |
| 50 to 54 Years | 683 (8.2%) | 613 (6.2%) |
| 55 to 59 Years | 595 (7.2%) | 826 (8.4%) |
| 60 to 64 Years | 486 (5.9%) | 402 (4.1%) |
| 65 to 69 Years | 355 (4.3%) | 497 (5.0%) |
| 70 to 74 Years | 373 (4.5%) | 519 (5.3%) |
| 75 to 79 Years | 322 (3.9%) | 343 (3.5%) |
| 80 to 84 Years | 171 (2.1%) | 241 (2.5%) |
| 85 Years and over | 153 (1.8%) | 431 (4.4%) |
| Total | 8,304 (100.0%) | 9,854 (100.0%) |
Families and Households in Colonial Heights
Median Family Size in Colonial Heights
The median family size in Colonial Heights is 2.90 persons per family, with single female/mother families (1,569 | 31.6%) accounting for the largest median family size of 2.97 persons per family. On the other hand, single male/father families (310 | 6.2%) represent the smallest median family size with 2.11 persons per family.
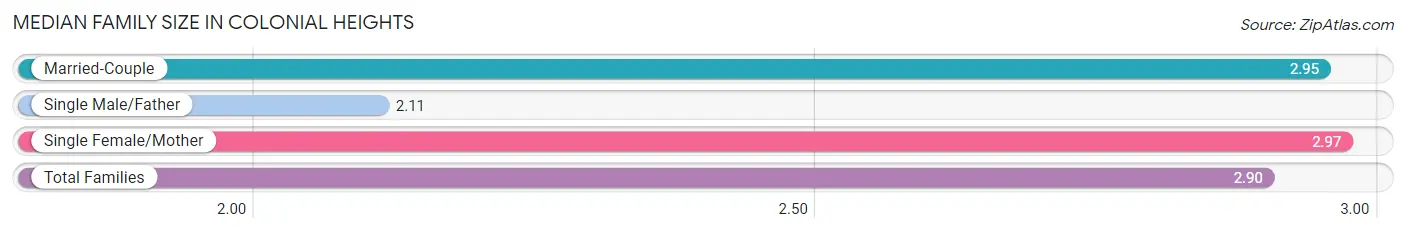
| Family Type | # Families | Family Size |
| Married-Couple | 3,081 (62.1%) | 2.95 |
| Single Male/Father | 310 (6.2%) | 2.11 |
| Single Female/Mother | 1,569 (31.6%) | 2.97 |
| Total Families | 4,960 (100.0%) | 2.90 |
Median Household Size in Colonial Heights
The median household size in Colonial Heights is 2.36 persons per household, with single female/mother households (1,569 | 20.6%) accounting for the largest median household size of 3.14 persons per household. non-family households (2,652 | 34.8%) represent the smallest median household size with 1.17 persons per household.
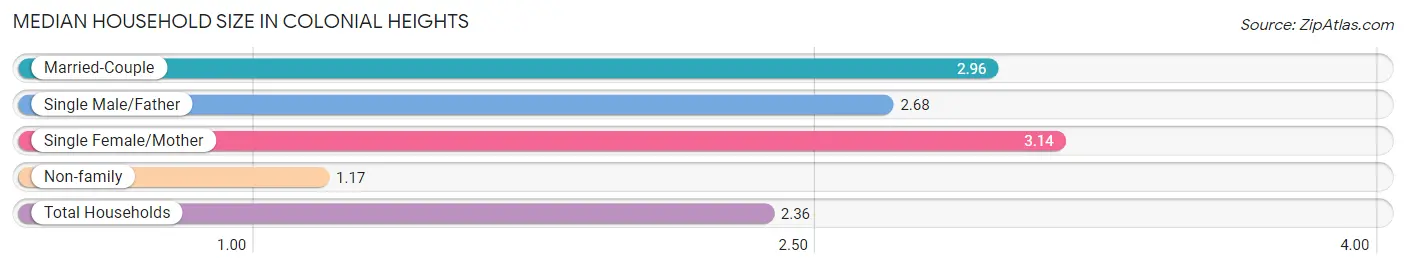
| Household Type | # Households | Household Size |
| Married-Couple | 3,081 (40.5%) | 2.96 |
| Single Male/Father | 310 (4.1%) | 2.68 |
| Single Female/Mother | 1,569 (20.6%) | 3.14 |
| Non-family | 2,652 (34.8%) | 1.17 |
| Total Households | 7,612 (100.0%) | 2.36 |
Household Size by Marriage Status in Colonial Heights
Out of a total of 7,612 households in Colonial Heights, 4,960 (65.2%) are family households, while 2,652 (34.8%) are nonfamily households. The most numerous type of family households are 2-person households, comprising 2,282, and the most common type of nonfamily households are 1-person households, comprising 2,326.
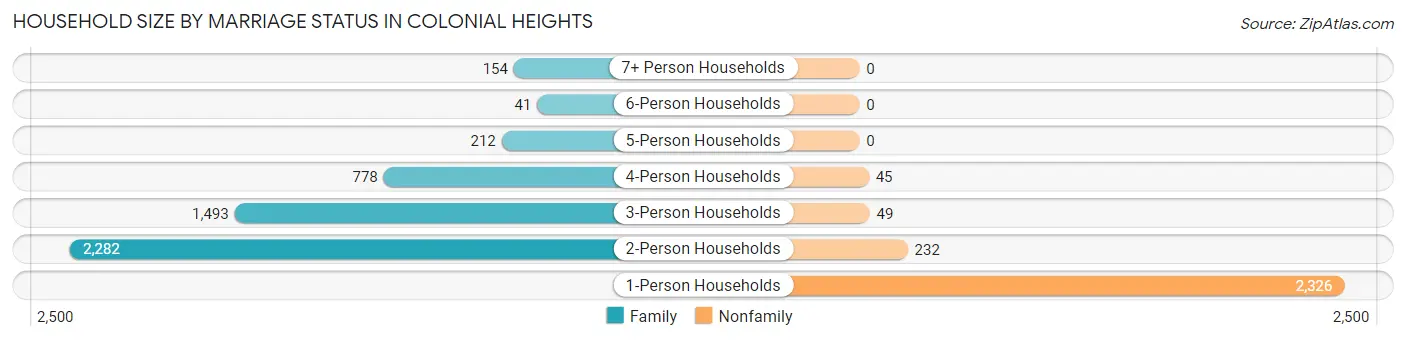
| Household Size | Family Households | Nonfamily Households |
| 1-Person Households | - | 2,326 (30.6%) |
| 2-Person Households | 2,282 (30.0%) | 232 (3.0%) |
| 3-Person Households | 1,493 (19.6%) | 49 (0.6%) |
| 4-Person Households | 778 (10.2%) | 45 (0.6%) |
| 5-Person Households | 212 (2.8%) | 0 (0.0%) |
| 6-Person Households | 41 (0.5%) | 0 (0.0%) |
| 7+ Person Households | 154 (2.0%) | 0 (0.0%) |
| Total | 4,960 (65.2%) | 2,652 (34.8%) |
Female Fertility in Colonial Heights
Fertility by Age in Colonial Heights
Average fertility rate in Colonial Heights is 55.0 births per 1,000 women. Women in the age bracket of 35 to 50 years have the highest fertility rate with 66.0 births per 1,000 women. Women in the age bracket of 35 to 50 years acount for 52.1% of all women with births.
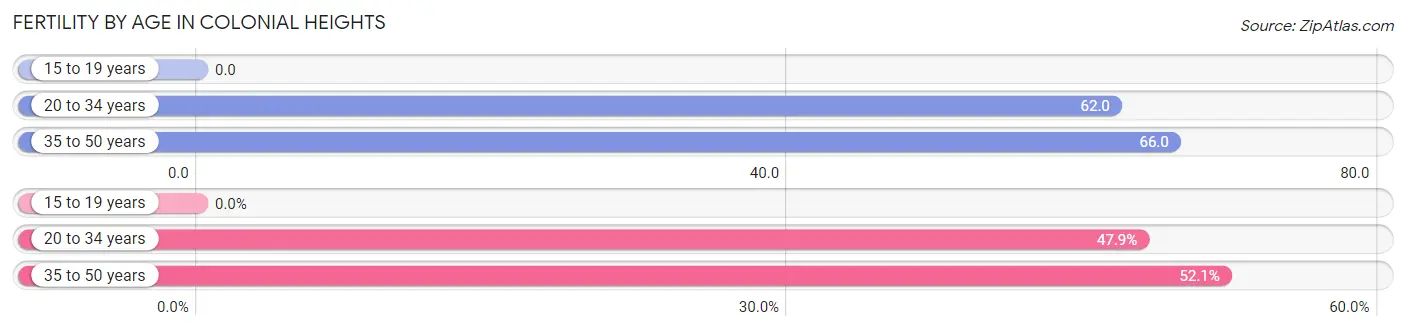
| Age Bracket | Women with Births | Births / 1,000 Women |
| 15 to 19 years | 0 (0.0%) | 0.0 |
| 20 to 34 years | 114 (47.9%) | 62.0 |
| 35 to 50 years | 124 (52.1%) | 66.0 |
| Total | 238 (100.0%) | 55.0 |
Fertility by Age by Marriage Status in Colonial Heights
68.1% of women with births (238) in Colonial Heights are married. The highest percentage of unmarried women with births falls into 20 to 34 years age bracket with 66.7% of them unmarried at the time of birth, while the lowest percentage of unmarried women with births belong to 35 to 50 years age bracket with 0.0% of them unmarried.
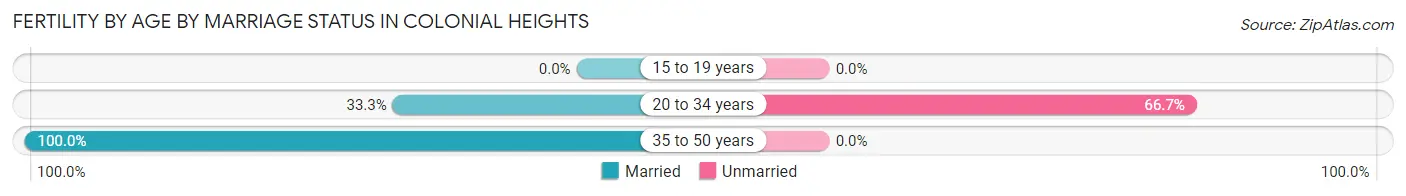
| Age Bracket | Married | Unmarried |
| 15 to 19 years | 0 (0.0%) | 0 (0.0%) |
| 20 to 34 years | 38 (33.3%) | 76 (66.7%) |
| 35 to 50 years | 124 (100.0%) | 0 (0.0%) |
| Total | 162 (68.1%) | 76 (31.9%) |
Fertility by Education in Colonial Heights
Average fertility rate in Colonial Heights is 55.0 births per 1,000 women. Women with the education attainment of bachelor's degree have the highest fertility rate of 142.0 births per 1,000 women, while women with the education attainment of college or associate's degree have the lowest fertility at 15.0 births per 1,000 women. Women with the education attainment of less than high school represent 36.1% of all women with births.
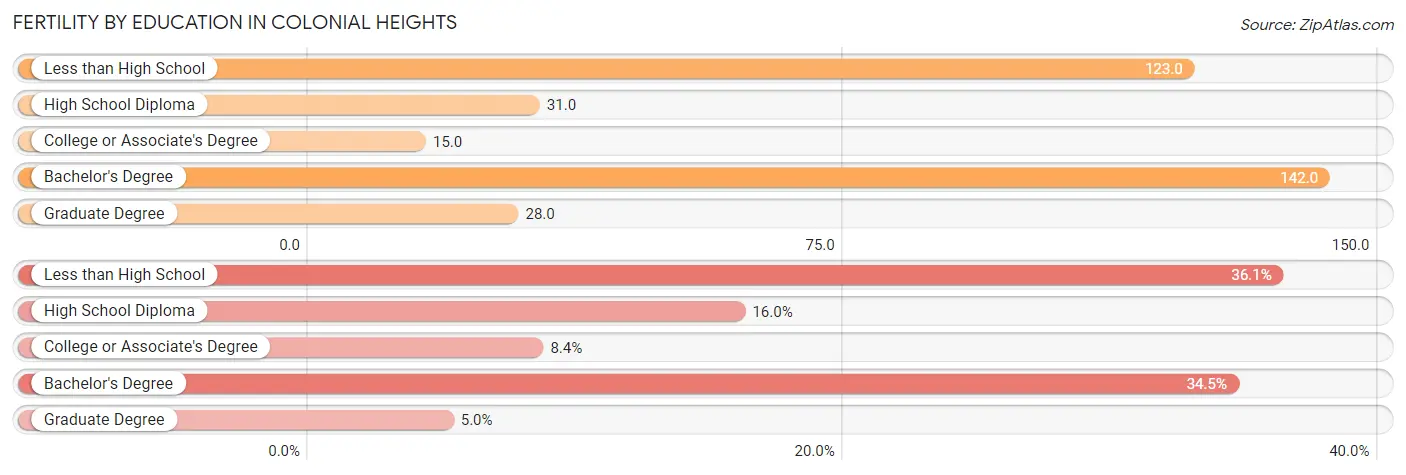
| Educational Attainment | Women with Births | Births / 1,000 Women |
| Less than High School | 86 (36.1%) | 123.0 |
| High School Diploma | 38 (16.0%) | 31.0 |
| College or Associate's Degree | 20 (8.4%) | 15.0 |
| Bachelor's Degree | 82 (34.4%) | 142.0 |
| Graduate Degree | 12 (5.0%) | 28.0 |
| Total | 238 (100.0%) | 55.0 |
Fertility by Education by Marriage Status in Colonial Heights
31.9% of women with births in Colonial Heights are unmarried. Women with the educational attainment of bachelor's degree are most likely to be married with 100.0% of them married at childbirth, while women with the educational attainment of college or associate's degree are least likely to be married with 100.0% of them unmarried at childbirth.
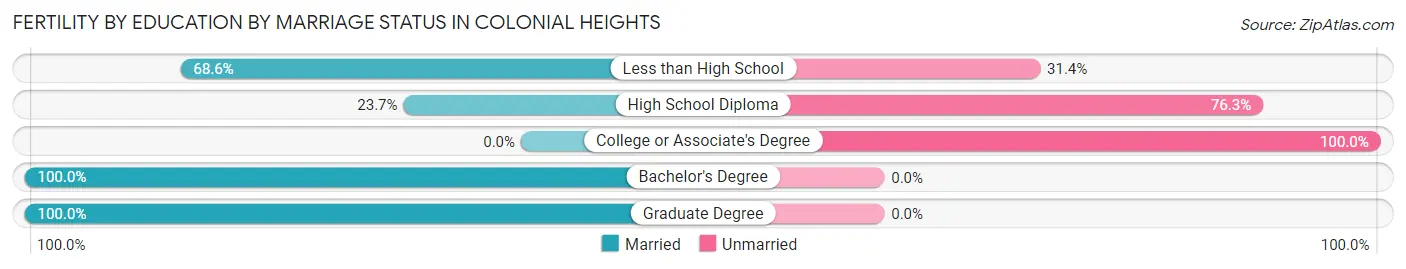
| Educational Attainment | Married | Unmarried |
| Less than High School | 59 (68.6%) | 27 (31.4%) |
| High School Diploma | 9 (23.7%) | 29 (76.3%) |
| College or Associate's Degree | 0 (0.0%) | 20 (100.0%) |
| Bachelor's Degree | 82 (100.0%) | 0 (0.0%) |
| Graduate Degree | 12 (100.0%) | 0 (0.0%) |
| Total | 162 (68.1%) | 76 (31.9%) |
Employment Characteristics in Colonial Heights
Employment by Class of Employer in Colonial Heights
Among the 8,540 employed individuals in Colonial Heights, private company employees (5,439 | 63.7%), local government employees (1,021 | 12.0%), and federal government employees (655 | 7.7%) make up the most common classes of employment.
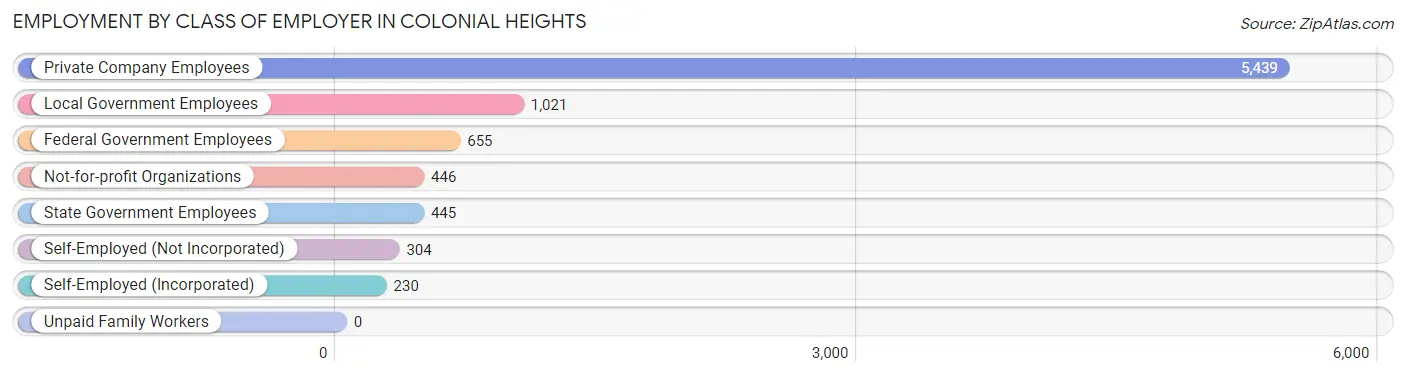
| Employer Class | # Employees | % Employees |
| Private Company Employees | 5,439 | 63.7% |
| Self-Employed (Incorporated) | 230 | 2.7% |
| Self-Employed (Not Incorporated) | 304 | 3.6% |
| Not-for-profit Organizations | 446 | 5.2% |
| Local Government Employees | 1,021 | 12.0% |
| State Government Employees | 445 | 5.2% |
| Federal Government Employees | 655 | 7.7% |
| Unpaid Family Workers | 0 | 0.0% |
| Total | 8,540 | 100.0% |
Employment Status by Age in Colonial Heights
According to the labor force statistics for Colonial Heights, out of the total population over 16 years of age (14,381), 65.0% or 9,348 individuals are in the labor force, with 6.1% or 570 of them unemployed. The age group with the highest labor force participation rate is 35 to 44 years, with 93.8% or 2,084 individuals in the labor force. Within the labor force, the 20 to 24 years age range has the highest percentage of unemployed individuals, with 18.9% or 156 of them being unemployed.
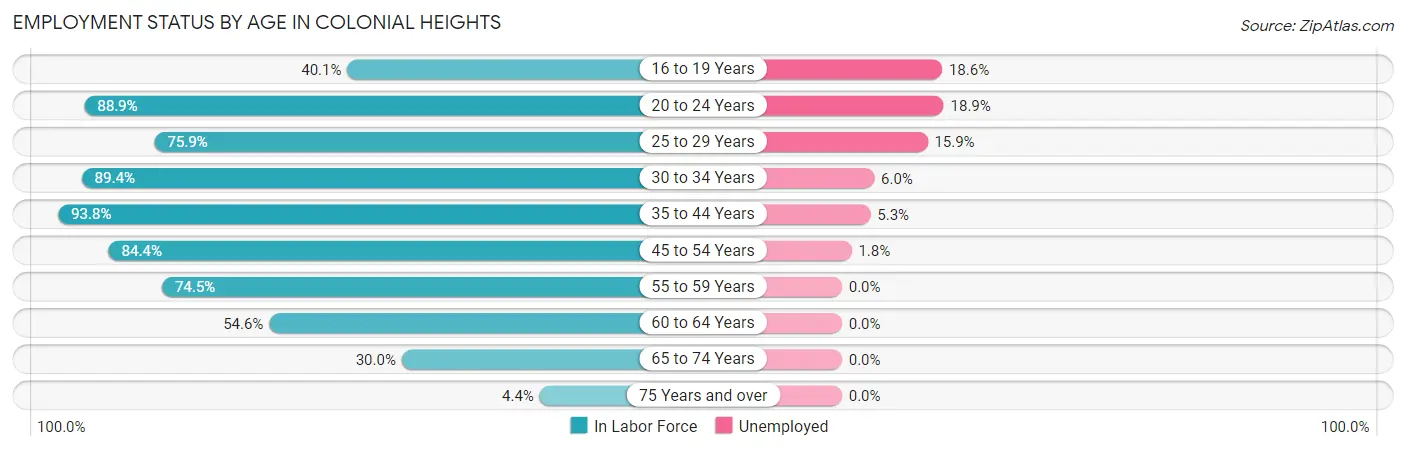
| Age Bracket | In Labor Force | Unemployed |
| 16 to 19 Years | 296 (40.1%) | 55 (18.6%) |
| 20 to 24 Years | 827 (88.9%) | 156 (18.9%) |
| 25 to 29 Years | 876 (75.9%) | 139 (15.9%) |
| 30 to 34 Years | 1,268 (89.4%) | 76 (6.0%) |
| 35 to 44 Years | 2,084 (93.8%) | 110 (5.3%) |
| 45 to 54 Years | 1,861 (84.4%) | 33 (1.8%) |
| 55 to 59 Years | 1,059 (74.5%) | 0 (0.0%) |
| 60 to 64 Years | 485 (54.6%) | 0 (0.0%) |
| 65 to 74 Years | 523 (30.0%) | 0 (0.0%) |
| 75 Years and over | 73 (4.4%) | 0 (0.0%) |
| Total | 9,348 (65.0%) | 570 (6.1%) |
Employment Status by Educational Attainment in Colonial Heights
According to labor force statistics for Colonial Heights, 82.0% of individuals (7,633) out of the total population between 25 and 64 years of age (9,308) are in the labor force, with 4.7% or 359 of them being unemployed. The group with the highest labor force participation rate are those with the educational attainment of bachelor's degree or higher, with 90.4% or 2,357 individuals in the labor force. Within the labor force, individuals with less than high school education have the highest percentage of unemployment, with 10.3% or 41 of them being unemployed.
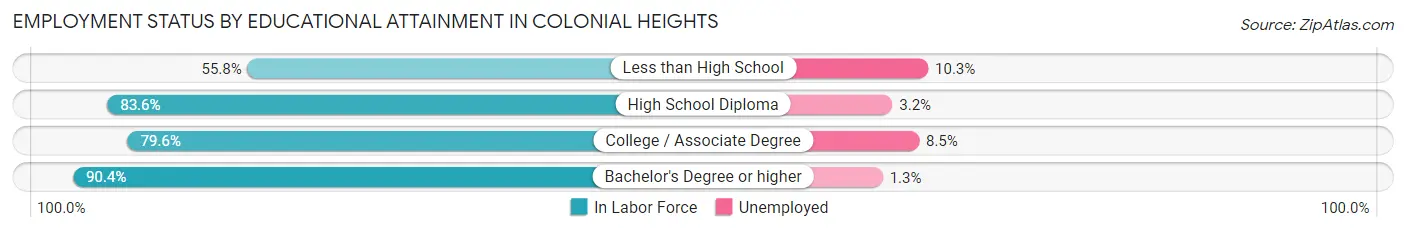
| Educational Attainment | In Labor Force | Unemployed |
| Less than High School | 397 (55.8%) | 73 (10.3%) |
| High School Diploma | 2,319 (83.6%) | 89 (3.2%) |
| College / Associate Degree | 2,559 (79.6%) | 273 (8.5%) |
| Bachelor's Degree or higher | 2,357 (90.4%) | 34 (1.3%) |
| Total | 7,633 (82.0%) | 437 (4.7%) |
Employment Occupations by Sex in Colonial Heights
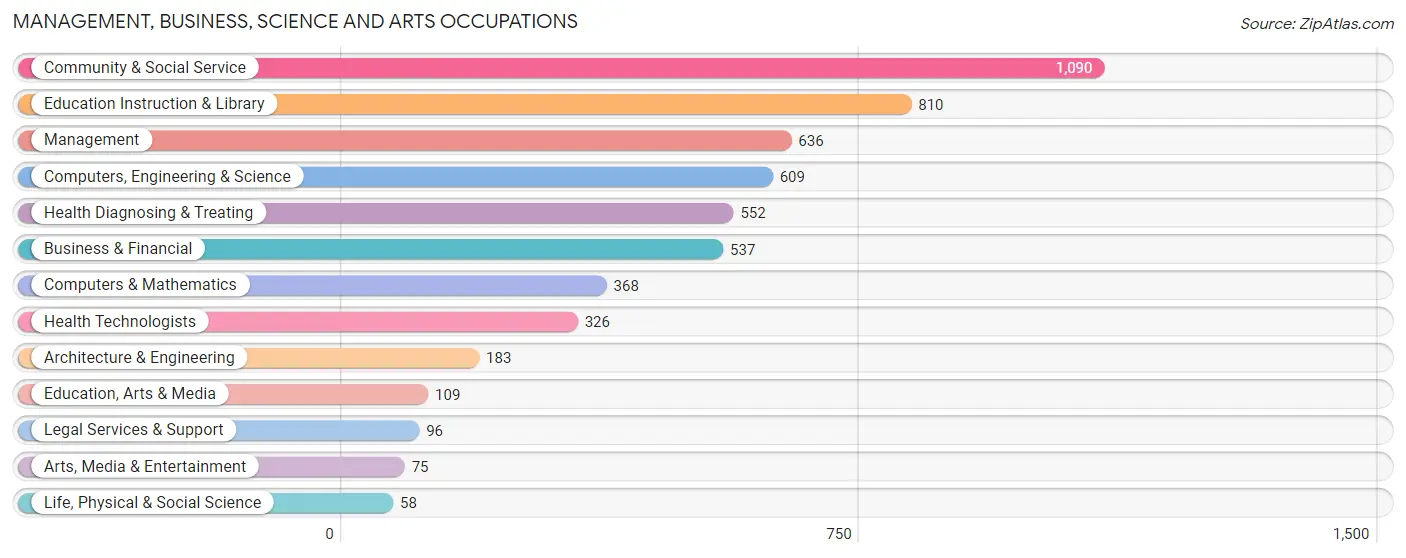
Management, Business, Science and Arts Occupations
The most common Management, Business, Science and Arts occupations in Colonial Heights are Community & Social Service (1,090 | 12.5%), Education Instruction & Library (810 | 9.3%), Management (636 | 7.3%), Computers, Engineering & Science (609 | 7.0%), and Health Diagnosing & Treating (552 | 6.3%).
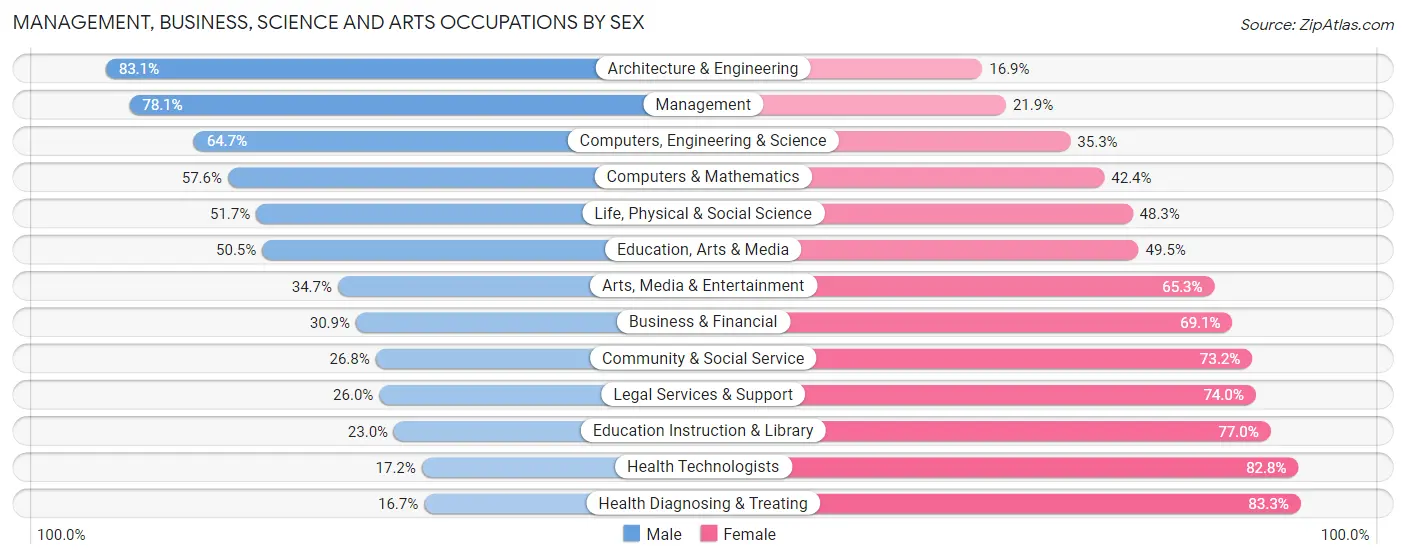
Management, Business, Science and Arts Occupations by Sex
Within the Management, Business, Science and Arts occupations in Colonial Heights, the most male-oriented occupations are Architecture & Engineering (83.1%), Management (78.1%), and Computers, Engineering & Science (64.7%), while the most female-oriented occupations are Health Diagnosing & Treating (83.3%), Health Technologists (82.8%), and Education Instruction & Library (77.0%).
| Occupation | Male | Female |
| Management | 497 (78.1%) | 139 (21.9%) |
| Business & Financial | 166 (30.9%) | 371 (69.1%) |
| Computers, Engineering & Science | 394 (64.7%) | 215 (35.3%) |
| Computers & Mathematics | 212 (57.6%) | 156 (42.4%) |
| Architecture & Engineering | 152 (83.1%) | 31 (16.9%) |
| Life, Physical & Social Science | 30 (51.7%) | 28 (48.3%) |
| Community & Social Service | 292 (26.8%) | 798 (73.2%) |
| Education, Arts & Media | 55 (50.5%) | 54 (49.5%) |
| Legal Services & Support | 25 (26.0%) | 71 (74.0%) |
| Education Instruction & Library | 186 (23.0%) | 624 (77.0%) |
| Arts, Media & Entertainment | 26 (34.7%) | 49 (65.3%) |
| Health Diagnosing & Treating | 92 (16.7%) | 460 (83.3%) |
| Health Technologists | 56 (17.2%) | 270 (82.8%) |
| Total (Category) | 1,441 (42.1%) | 1,983 (57.9%) |
| Total (Overall) | 4,347 (50.0%) | 4,353 (50.0%) |
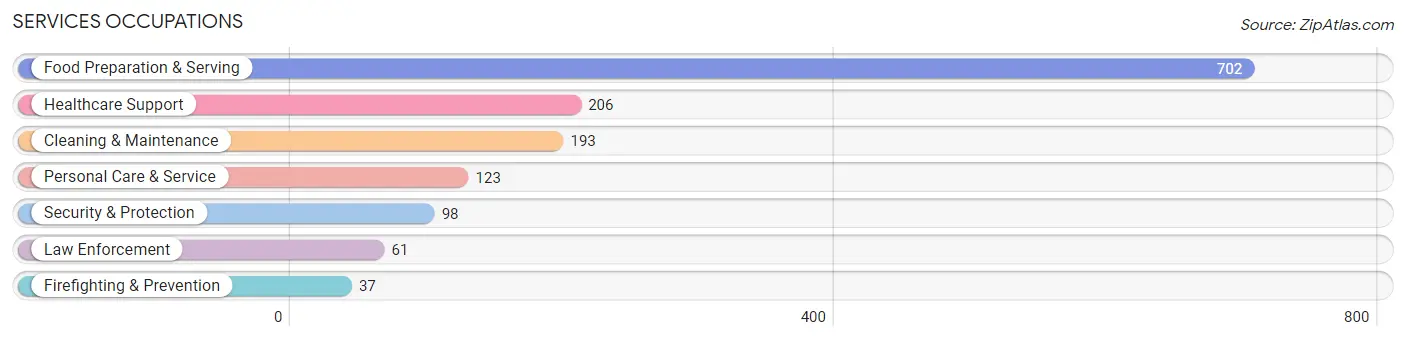
Services Occupations
The most common Services occupations in Colonial Heights are Food Preparation & Serving (702 | 8.1%), Healthcare Support (206 | 2.4%), Cleaning & Maintenance (193 | 2.2%), Personal Care & Service (123 | 1.4%), and Security & Protection (98 | 1.1%).
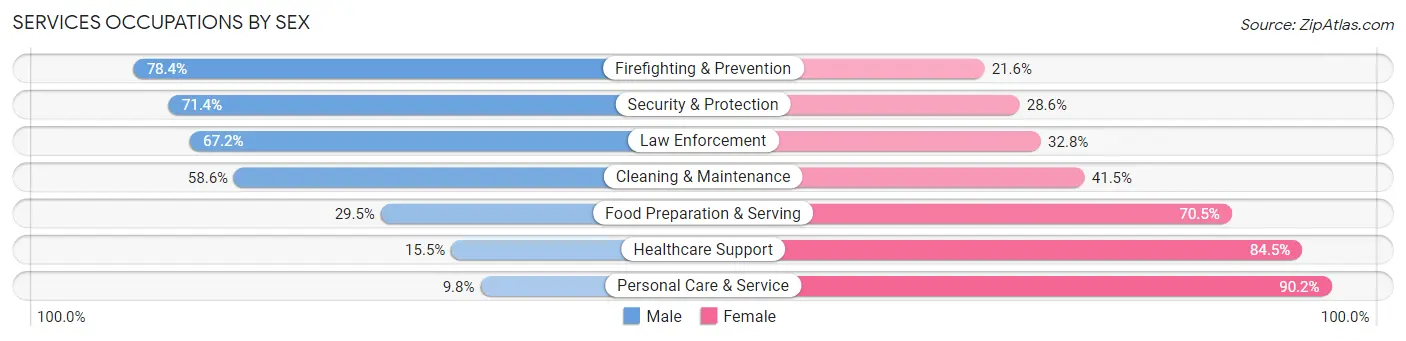
Services Occupations by Sex
Within the Services occupations in Colonial Heights, the most male-oriented occupations are Firefighting & Prevention (78.4%), Security & Protection (71.4%), and Law Enforcement (67.2%), while the most female-oriented occupations are Personal Care & Service (90.2%), Healthcare Support (84.5%), and Food Preparation & Serving (70.5%).
| Occupation | Male | Female |
| Healthcare Support | 32 (15.5%) | 174 (84.5%) |
| Security & Protection | 70 (71.4%) | 28 (28.6%) |
| Firefighting & Prevention | 29 (78.4%) | 8 (21.6%) |
| Law Enforcement | 41 (67.2%) | 20 (32.8%) |
| Food Preparation & Serving | 207 (29.5%) | 495 (70.5%) |
| Cleaning & Maintenance | 113 (58.6%) | 80 (41.4%) |
| Personal Care & Service | 12 (9.8%) | 111 (90.2%) |
| Total (Category) | 434 (32.8%) | 888 (67.2%) |
| Total (Overall) | 4,347 (50.0%) | 4,353 (50.0%) |
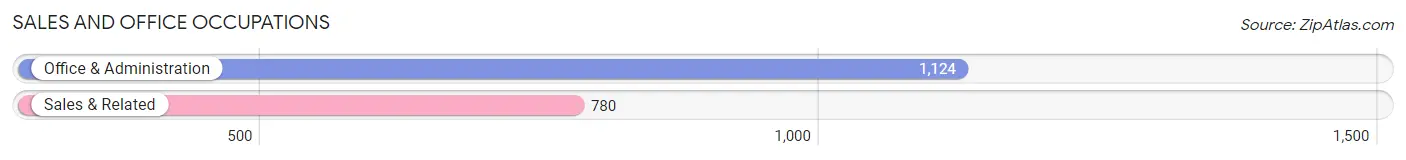
Sales and Office Occupations
The most common Sales and Office occupations in Colonial Heights are Office & Administration (1,124 | 12.9%), and Sales & Related (780 | 9.0%).
Sales and Office Occupations by Sex
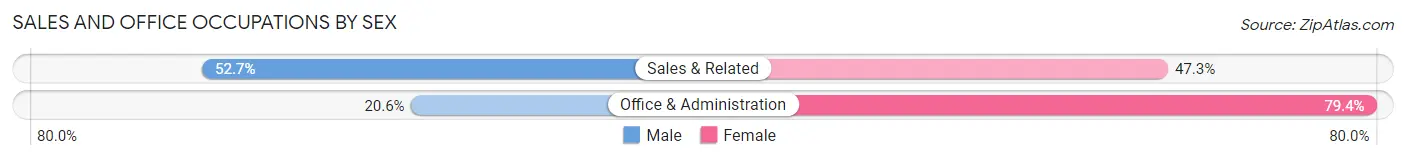
| Occupation | Male | Female |
| Sales & Related | 411 (52.7%) | 369 (47.3%) |
| Office & Administration | 232 (20.6%) | 892 (79.4%) |
| Total (Category) | 643 (33.8%) | 1,261 (66.2%) |
| Total (Overall) | 4,347 (50.0%) | 4,353 (50.0%) |
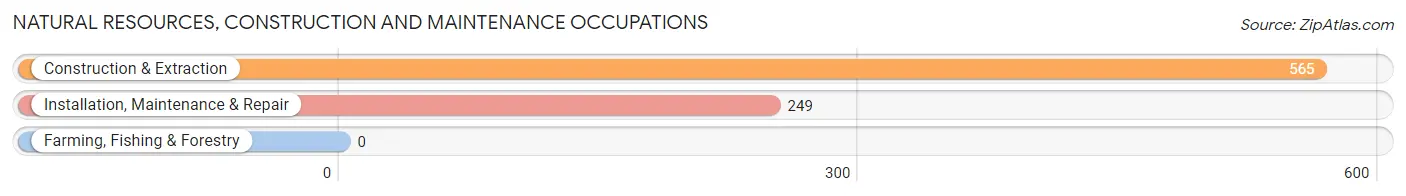
Natural Resources, Construction and Maintenance Occupations
The most common Natural Resources, Construction and Maintenance occupations in Colonial Heights are Construction & Extraction (565 | 6.5%), and Installation, Maintenance & Repair (249 | 2.9%).
Natural Resources, Construction and Maintenance Occupations by Sex
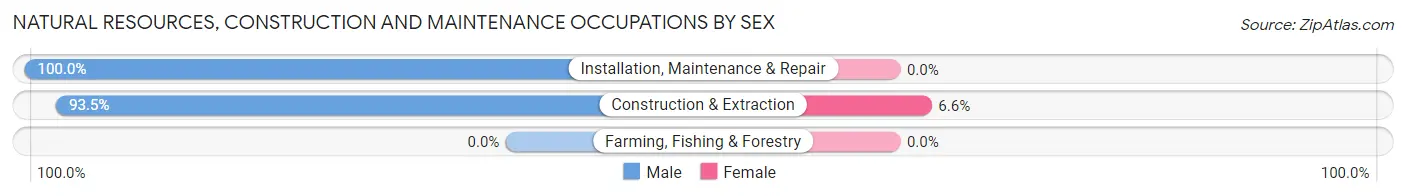
| Occupation | Male | Female |
| Farming, Fishing & Forestry | 0 (0.0%) | 0 (0.0%) |
| Construction & Extraction | 528 (93.4%) | 37 (6.6%) |
| Installation, Maintenance & Repair | 249 (100.0%) | 0 (0.0%) |
| Total (Category) | 777 (95.5%) | 37 (4.5%) |
| Total (Overall) | 4,347 (50.0%) | 4,353 (50.0%) |
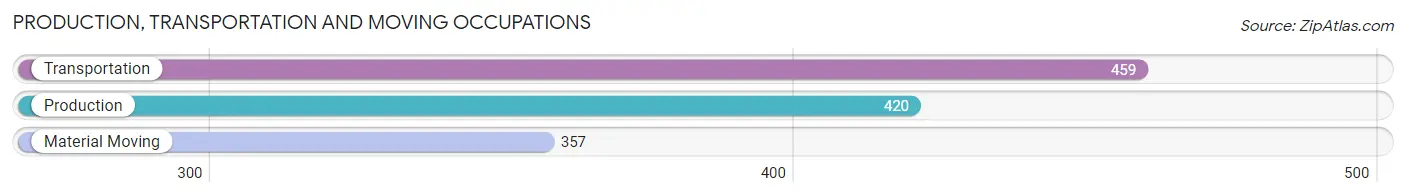
Production, Transportation and Moving Occupations
The most common Production, Transportation and Moving occupations in Colonial Heights are Transportation (459 | 5.3%), Production (420 | 4.8%), and Material Moving (357 | 4.1%).
Production, Transportation and Moving Occupations by Sex
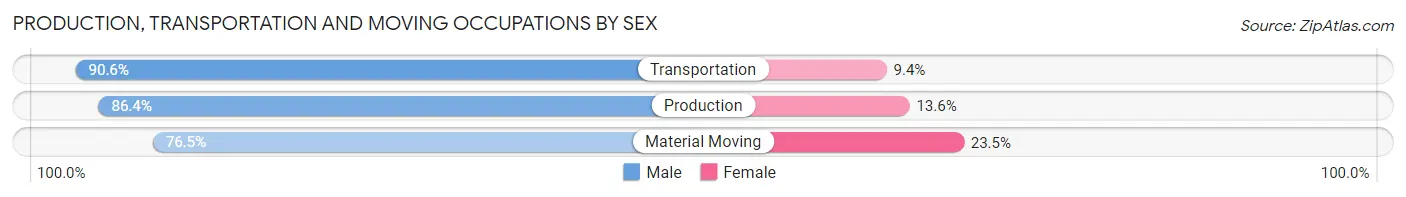
| Occupation | Male | Female |
| Production | 363 (86.4%) | 57 (13.6%) |
| Transportation | 416 (90.6%) | 43 (9.4%) |
| Material Moving | 273 (76.5%) | 84 (23.5%) |
| Total (Category) | 1,052 (85.1%) | 184 (14.9%) |
| Total (Overall) | 4,347 (50.0%) | 4,353 (50.0%) |
Employment Industries by Sex in Colonial Heights
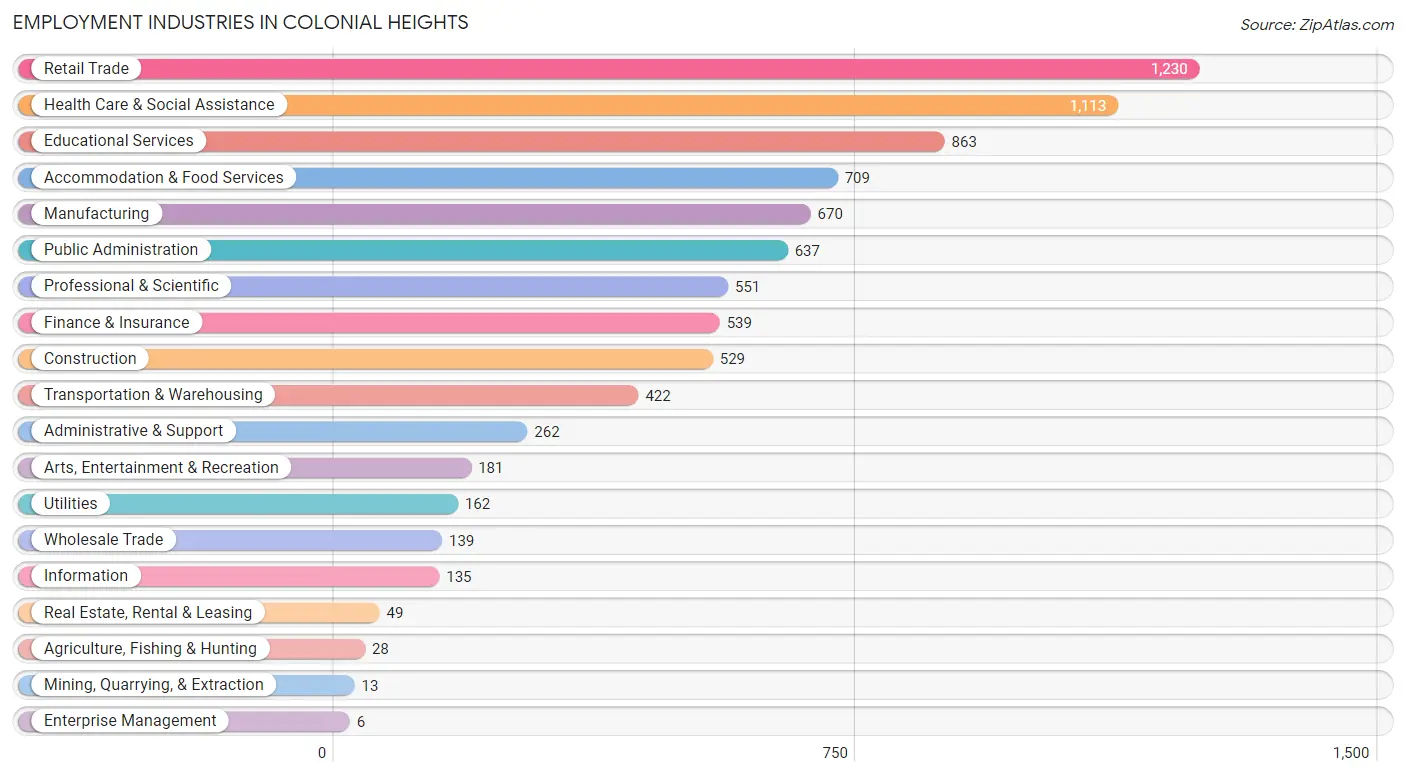
Employment Industries in Colonial Heights
The major employment industries in Colonial Heights include Retail Trade (1,230 | 14.1%), Health Care & Social Assistance (1,113 | 12.8%), Educational Services (863 | 9.9%), Accommodation & Food Services (709 | 8.2%), and Manufacturing (670 | 7.7%).
Employment Industries by Sex in Colonial Heights
The Colonial Heights industries that see more men than women are Mining, Quarrying, & Extraction (100.0%), Construction (88.7%), and Manufacturing (88.2%), whereas the industries that tend to have a higher number of women are Enterprise Management (100.0%), Health Care & Social Assistance (84.4%), and Finance & Insurance (78.8%).
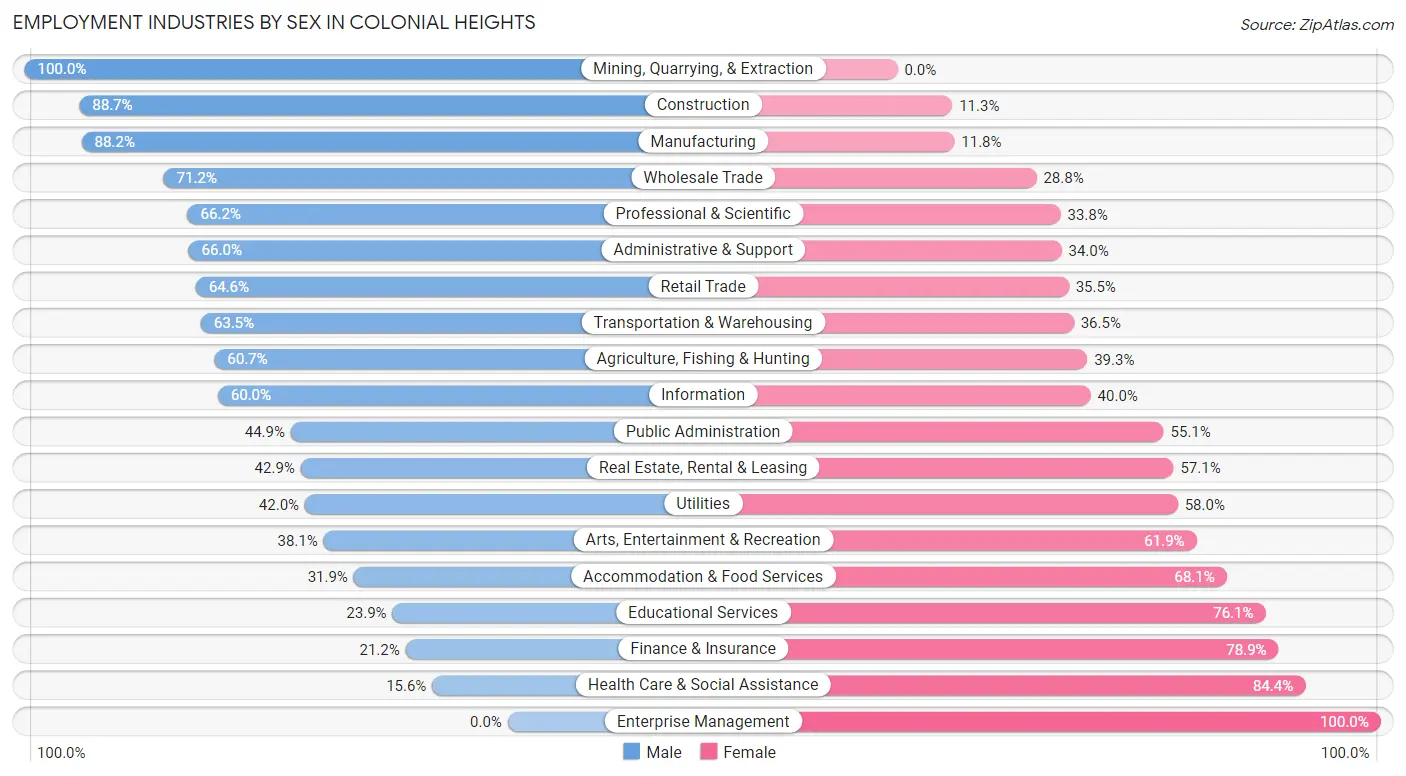
| Industry | Male | Female |
| Agriculture, Fishing & Hunting | 17 (60.7%) | 11 (39.3%) |
| Mining, Quarrying, & Extraction | 13 (100.0%) | 0 (0.0%) |
| Construction | 469 (88.7%) | 60 (11.3%) |
| Manufacturing | 591 (88.2%) | 79 (11.8%) |
| Wholesale Trade | 99 (71.2%) | 40 (28.8%) |
| Retail Trade | 794 (64.5%) | 436 (35.4%) |
| Transportation & Warehousing | 268 (63.5%) | 154 (36.5%) |
| Utilities | 68 (42.0%) | 94 (58.0%) |
| Information | 81 (60.0%) | 54 (40.0%) |
| Finance & Insurance | 114 (21.1%) | 425 (78.8%) |
| Real Estate, Rental & Leasing | 21 (42.9%) | 28 (57.1%) |
| Professional & Scientific | 365 (66.2%) | 186 (33.8%) |
| Enterprise Management | 0 (0.0%) | 6 (100.0%) |
| Administrative & Support | 173 (66.0%) | 89 (34.0%) |
| Educational Services | 206 (23.9%) | 657 (76.1%) |
| Health Care & Social Assistance | 174 (15.6%) | 939 (84.4%) |
| Arts, Entertainment & Recreation | 69 (38.1%) | 112 (61.9%) |
| Accommodation & Food Services | 226 (31.9%) | 483 (68.1%) |
| Public Administration | 286 (44.9%) | 351 (55.1%) |
| Total | 4,347 (50.0%) | 4,353 (50.0%) |
Education in Colonial Heights
School Enrollment in Colonial Heights
The most common levels of schooling among the 4,117 students in Colonial Heights are high school (962 | 23.4%), elementary school (905 | 22.0%), and middle school (811 | 19.7%).
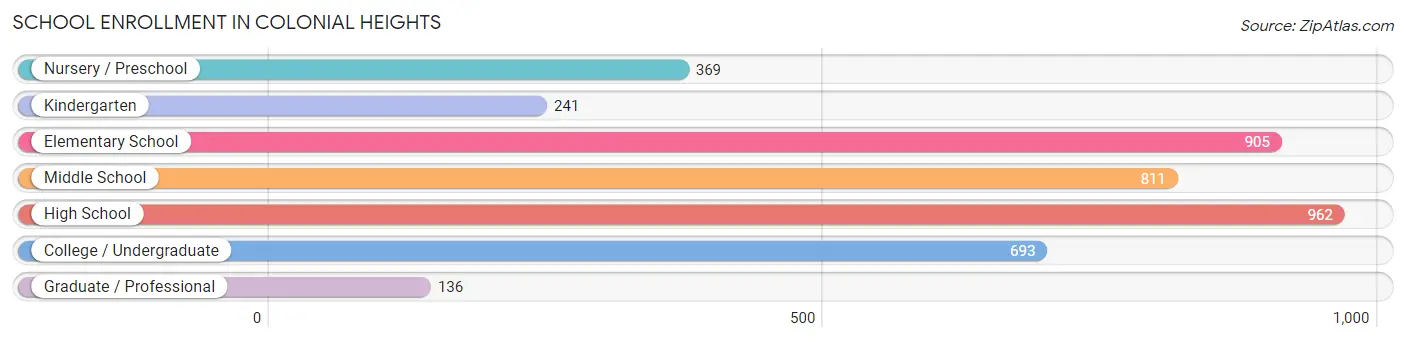
| School Level | # Students | % Students |
| Nursery / Preschool | 369 | 9.0% |
| Kindergarten | 241 | 5.9% |
| Elementary School | 905 | 22.0% |
| Middle School | 811 | 19.7% |
| High School | 962 | 23.4% |
| College / Undergraduate | 693 | 16.8% |
| Graduate / Professional | 136 | 3.3% |
| Total | 4,117 | 100.0% |
School Enrollment by Age by Funding Source in Colonial Heights
Out of a total of 4,117 students who are enrolled in schools in Colonial Heights, 803 (19.5%) attend a private institution, while the remaining 3,314 (80.5%) are enrolled in public schools. The age group of 3 to 4 year olds has the highest likelihood of being enrolled in private schools, with 175 (66.8% in the age bracket) enrolled. Conversely, the age group of 10 to 14 year olds has the lowest likelihood of being enrolled in a private school, with 1,098 (95.2% in the age bracket) attending a public institution.
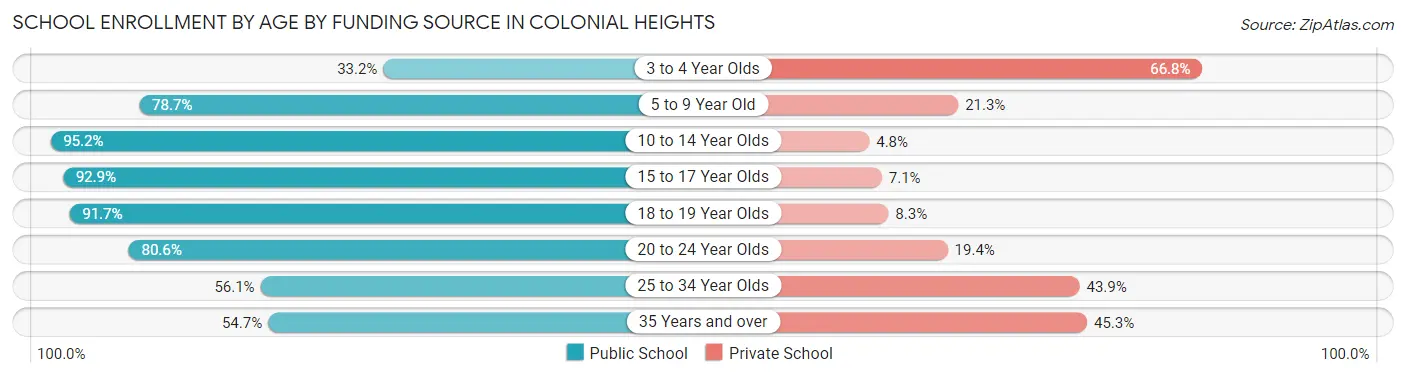
| Age Bracket | Public School | Private School |
| 3 to 4 Year Olds | 87 (33.2%) | 175 (66.8%) |
| 5 to 9 Year Old | 852 (78.7%) | 231 (21.3%) |
| 10 to 14 Year Olds | 1,098 (95.2%) | 55 (4.8%) |
| 15 to 17 Year Olds | 640 (92.9%) | 49 (7.1%) |
| 18 to 19 Year Olds | 165 (91.7%) | 15 (8.3%) |
| 20 to 24 Year Olds | 179 (80.6%) | 43 (19.4%) |
| 25 to 34 Year Olds | 134 (56.1%) | 105 (43.9%) |
| 35 Years and over | 158 (54.7%) | 131 (45.3%) |
| Total | 3,314 (80.5%) | 803 (19.5%) |
Educational Attainment by Field of Study in Colonial Heights
Business (727 | 18.4%), education (510 | 12.9%), science & technology (417 | 10.6%), social sciences (337 | 8.5%), and psychology (270 | 6.8%) are the most common fields of study among 3,950 individuals in Colonial Heights who have obtained a bachelor's degree or higher.
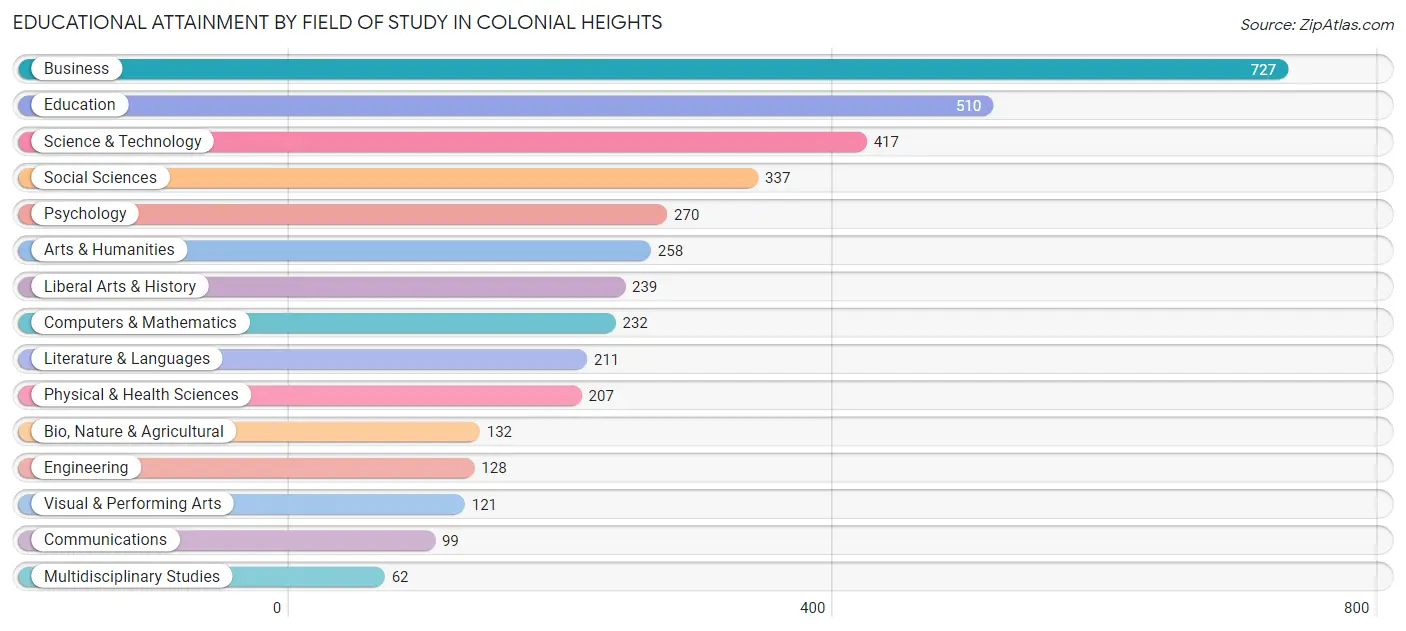
| Field of Study | # Graduates | % Graduates |
| Computers & Mathematics | 232 | 5.9% |
| Bio, Nature & Agricultural | 132 | 3.3% |
| Physical & Health Sciences | 207 | 5.2% |
| Psychology | 270 | 6.8% |
| Social Sciences | 337 | 8.5% |
| Engineering | 128 | 3.2% |
| Multidisciplinary Studies | 62 | 1.6% |
| Science & Technology | 417 | 10.6% |
| Business | 727 | 18.4% |
| Education | 510 | 12.9% |
| Literature & Languages | 211 | 5.3% |
| Liberal Arts & History | 239 | 6.0% |
| Visual & Performing Arts | 121 | 3.1% |
| Communications | 99 | 2.5% |
| Arts & Humanities | 258 | 6.5% |
| Total | 3,950 | 100.0% |
Transportation & Commute in Colonial Heights
Vehicle Availability by Sex in Colonial Heights
The most prevalent vehicle ownership categories in Colonial Heights are males with 2 vehicles (1,770, accounting for 40.4%) and females with 2 vehicles (1,686, making up 42.6%).
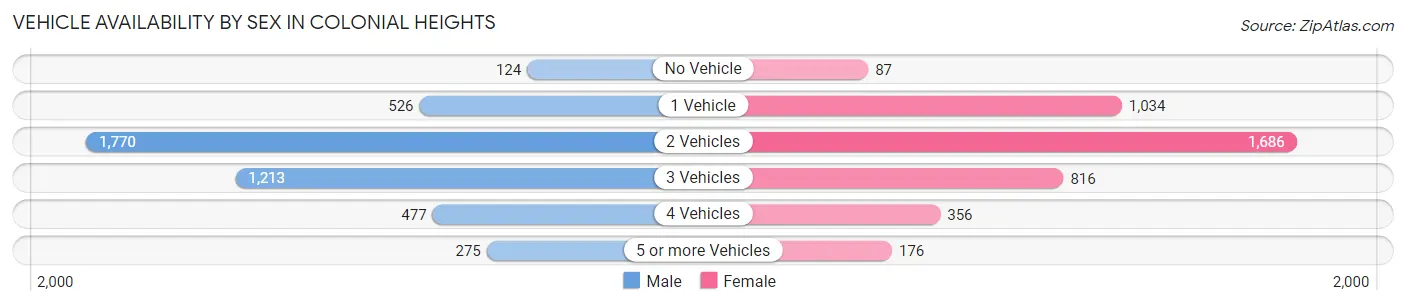
| Vehicles Available | Male | Female |
| No Vehicle | 124 (2.8%) | 87 (2.1%) |
| 1 Vehicle | 526 (12.0%) | 1,034 (24.9%) |
| 2 Vehicles | 1,770 (40.4%) | 1,686 (40.6%) |
| 3 Vehicles | 1,213 (27.7%) | 816 (19.6%) |
| 4 Vehicles | 477 (10.9%) | 356 (8.6%) |
| 5 or more Vehicles | 275 (6.3%) | 176 (4.2%) |
| Total | 4,385 (100.0%) | 4,155 (100.0%) |
Commute Time in Colonial Heights
The most frequently occuring commute durations in Colonial Heights are 15 to 19 minutes (1,278 commuters, 16.2%), 30 to 34 minutes (1,222 commuters, 15.5%), and 20 to 24 minutes (1,019 commuters, 12.9%).
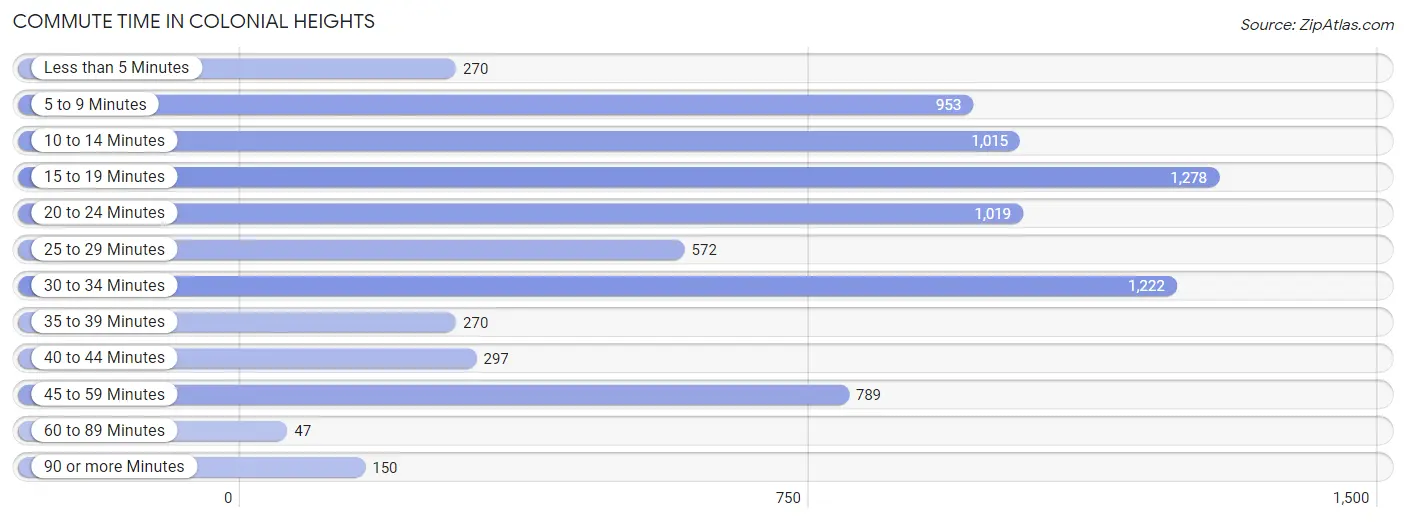
| Commute Time | # Commuters | % Commuters |
| Less than 5 Minutes | 270 | 3.4% |
| 5 to 9 Minutes | 953 | 12.1% |
| 10 to 14 Minutes | 1,015 | 12.9% |
| 15 to 19 Minutes | 1,278 | 16.2% |
| 20 to 24 Minutes | 1,019 | 12.9% |
| 25 to 29 Minutes | 572 | 7.3% |
| 30 to 34 Minutes | 1,222 | 15.5% |
| 35 to 39 Minutes | 270 | 3.4% |
| 40 to 44 Minutes | 297 | 3.8% |
| 45 to 59 Minutes | 789 | 10.0% |
| 60 to 89 Minutes | 47 | 0.6% |
| 90 or more Minutes | 150 | 1.9% |
Commute Time by Sex in Colonial Heights
The most common commute times in Colonial Heights are 30 to 34 minutes (861 commuters, 20.7%) for males and 5 to 9 minutes (709 commuters, 19.1%) for females.
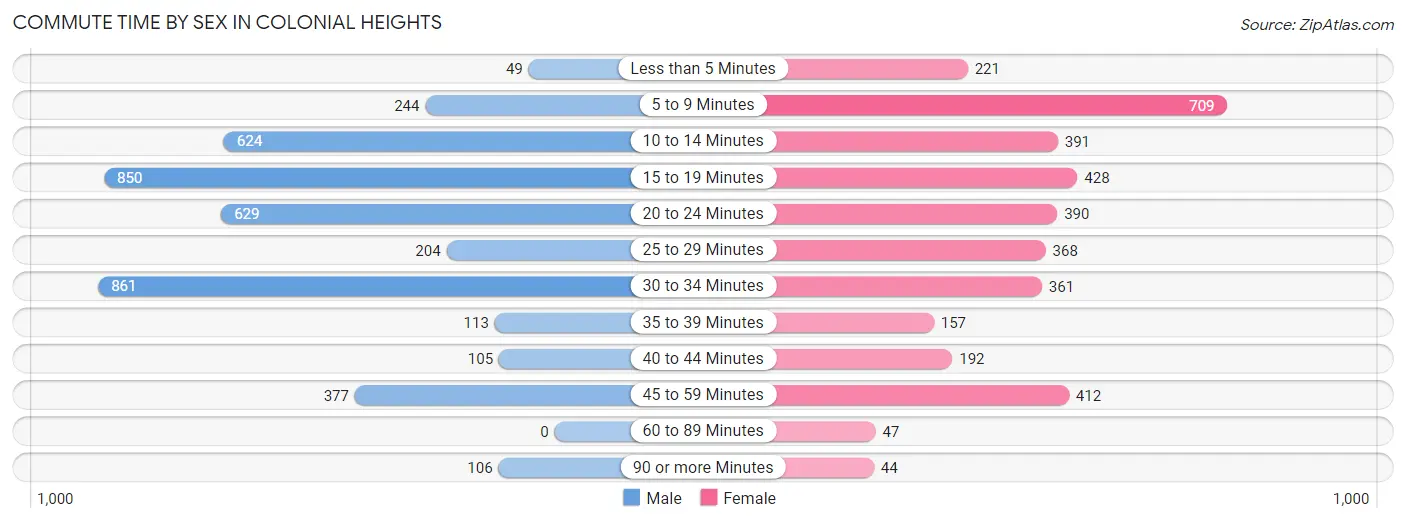
| Commute Time | Male | Female |
| Less than 5 Minutes | 49 (1.2%) | 221 (5.9%) |
| 5 to 9 Minutes | 244 (5.9%) | 709 (19.1%) |
| 10 to 14 Minutes | 624 (15.0%) | 391 (10.5%) |
| 15 to 19 Minutes | 850 (20.4%) | 428 (11.5%) |
| 20 to 24 Minutes | 629 (15.1%) | 390 (10.5%) |
| 25 to 29 Minutes | 204 (4.9%) | 368 (9.9%) |
| 30 to 34 Minutes | 861 (20.7%) | 361 (9.7%) |
| 35 to 39 Minutes | 113 (2.7%) | 157 (4.2%) |
| 40 to 44 Minutes | 105 (2.5%) | 192 (5.2%) |
| 45 to 59 Minutes | 377 (9.1%) | 412 (11.1%) |
| 60 to 89 Minutes | 0 (0.0%) | 47 (1.3%) |
| 90 or more Minutes | 106 (2.5%) | 44 (1.2%) |
Time of Departure to Work by Sex in Colonial Heights
The most frequent times of departure to work in Colonial Heights are 6:00 AM to 6:29 AM (687, 16.5%) for males and 7:30 AM to 7:59 AM (613, 16.5%) for females.
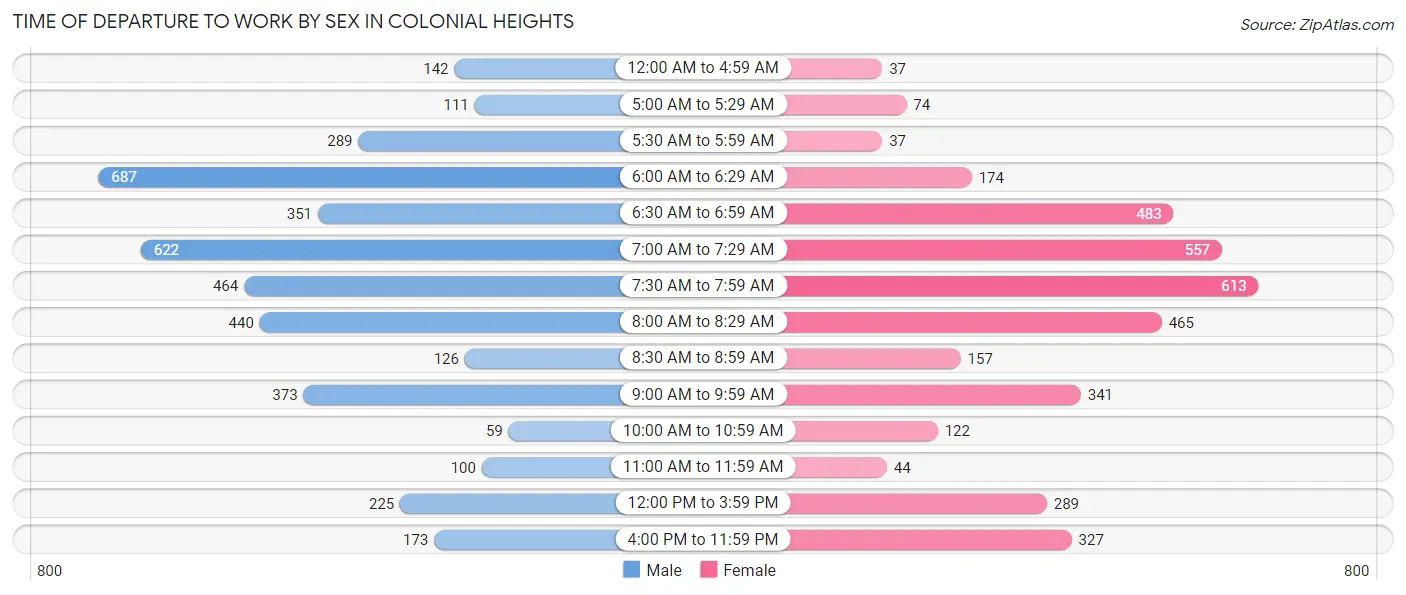
| Time of Departure | Male | Female |
| 12:00 AM to 4:59 AM | 142 (3.4%) | 37 (1.0%) |
| 5:00 AM to 5:29 AM | 111 (2.7%) | 74 (2.0%) |
| 5:30 AM to 5:59 AM | 289 (6.9%) | 37 (1.0%) |
| 6:00 AM to 6:29 AM | 687 (16.5%) | 174 (4.7%) |
| 6:30 AM to 6:59 AM | 351 (8.4%) | 483 (13.0%) |
| 7:00 AM to 7:29 AM | 622 (14.9%) | 557 (15.0%) |
| 7:30 AM to 7:59 AM | 464 (11.2%) | 613 (16.5%) |
| 8:00 AM to 8:29 AM | 440 (10.6%) | 465 (12.5%) |
| 8:30 AM to 8:59 AM | 126 (3.0%) | 157 (4.2%) |
| 9:00 AM to 9:59 AM | 373 (9.0%) | 341 (9.2%) |
| 10:00 AM to 10:59 AM | 59 (1.4%) | 122 (3.3%) |
| 11:00 AM to 11:59 AM | 100 (2.4%) | 44 (1.2%) |
| 12:00 PM to 3:59 PM | 225 (5.4%) | 289 (7.8%) |
| 4:00 PM to 11:59 PM | 173 (4.2%) | 327 (8.8%) |
| Total | 4,162 (100.0%) | 3,720 (100.0%) |
Housing Occupancy in Colonial Heights
Occupancy by Ownership in Colonial Heights
Of the total 7,612 dwellings in Colonial Heights, owner-occupied units account for 5,057 (66.4%), while renter-occupied units make up 2,555 (33.6%).
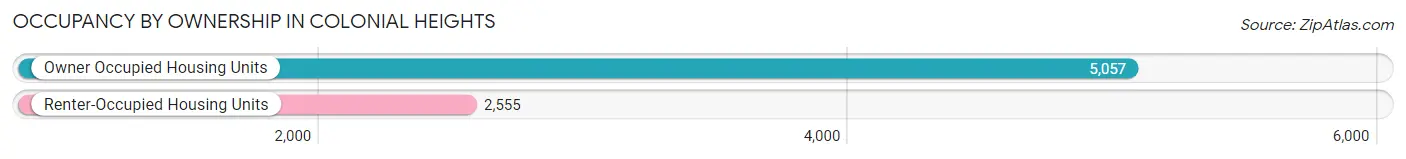
| Occupancy | # Housing Units | % Housing Units |
| Owner Occupied Housing Units | 5,057 | 66.4% |
| Renter-Occupied Housing Units | 2,555 | 33.6% |
| Total Occupied Housing Units | 7,612 | 100.0% |
Occupancy by Household Size in Colonial Heights
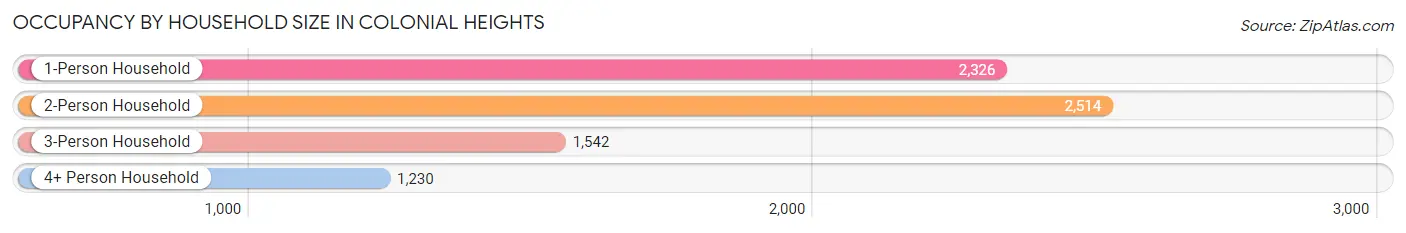
| Household Size | # Housing Units | % Housing Units |
| 1-Person Household | 2,326 | 30.6% |
| 2-Person Household | 2,514 | 33.0% |
| 3-Person Household | 1,542 | 20.3% |
| 4+ Person Household | 1,230 | 16.2% |
| Total Housing Units | 7,612 | 100.0% |
Occupancy by Ownership by Household Size in Colonial Heights
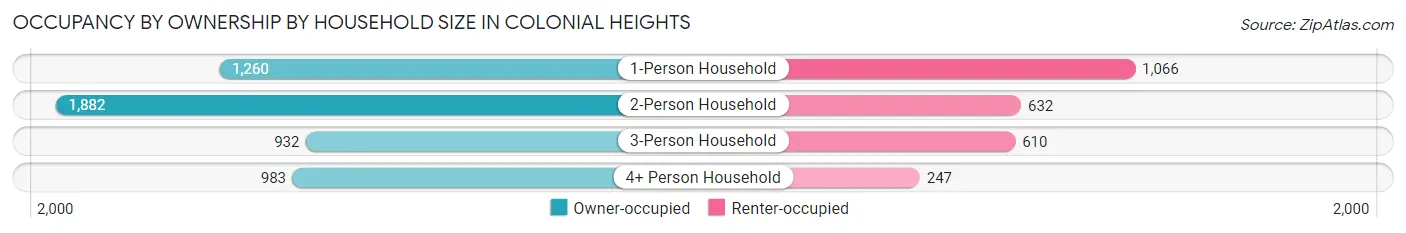
| Household Size | Owner-occupied | Renter-occupied |
| 1-Person Household | 1,260 (54.2%) | 1,066 (45.8%) |
| 2-Person Household | 1,882 (74.9%) | 632 (25.1%) |
| 3-Person Household | 932 (60.4%) | 610 (39.6%) |
| 4+ Person Household | 983 (79.9%) | 247 (20.1%) |
| Total Housing Units | 5,057 (66.4%) | 2,555 (33.6%) |
Occupancy by Educational Attainment in Colonial Heights
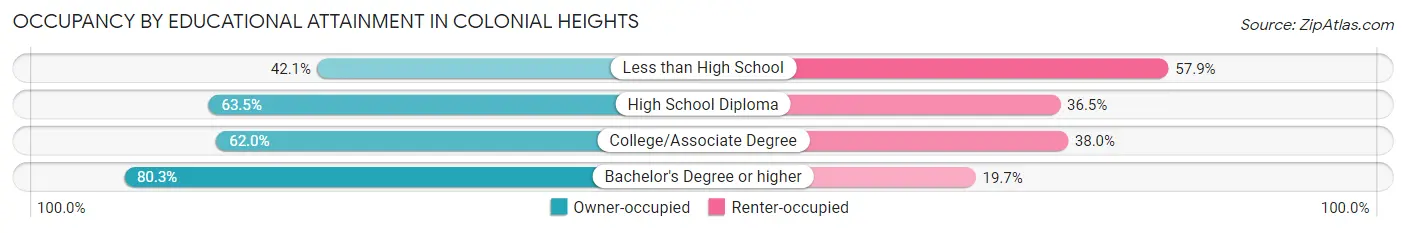
| Household Size | Owner-occupied | Renter-occupied |
| Less than High School | 204 (42.1%) | 281 (57.9%) |
| High School Diploma | 1,413 (63.5%) | 811 (36.5%) |
| College/Associate Degree | 1,683 (62.0%) | 1,032 (38.0%) |
| Bachelor's Degree or higher | 1,757 (80.3%) | 431 (19.7%) |
Occupancy by Age of Householder in Colonial Heights
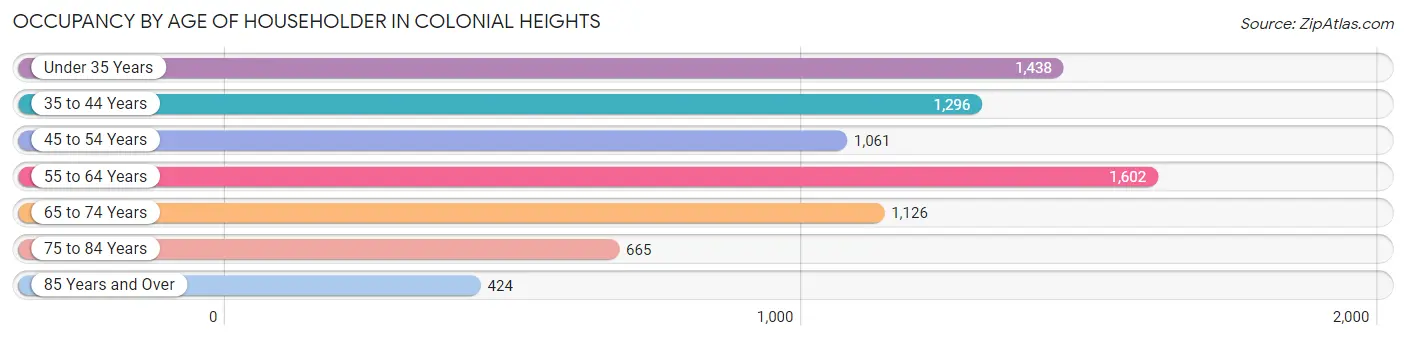
| Age Bracket | # Households | % Households |
| Under 35 Years | 1,438 | 18.9% |
| 35 to 44 Years | 1,296 | 17.0% |
| 45 to 54 Years | 1,061 | 13.9% |
| 55 to 64 Years | 1,602 | 21.0% |
| 65 to 74 Years | 1,126 | 14.8% |
| 75 to 84 Years | 665 | 8.7% |
| 85 Years and Over | 424 | 5.6% |
| Total | 7,612 | 100.0% |
Housing Finances in Colonial Heights
Median Income by Occupancy in Colonial Heights
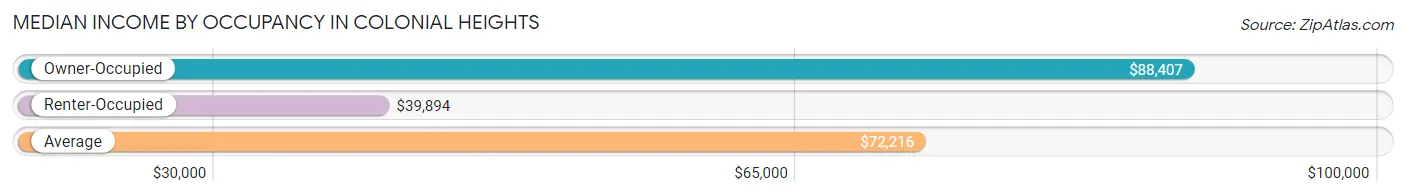
| Occupancy Type | # Households | Median Income |
| Owner-Occupied | 5,057 (66.4%) | $88,407 |
| Renter-Occupied | 2,555 (33.6%) | $39,894 |
| Average | 7,612 (100.0%) | $72,216 |
Occupancy by Householder Income Bracket in Colonial Heights
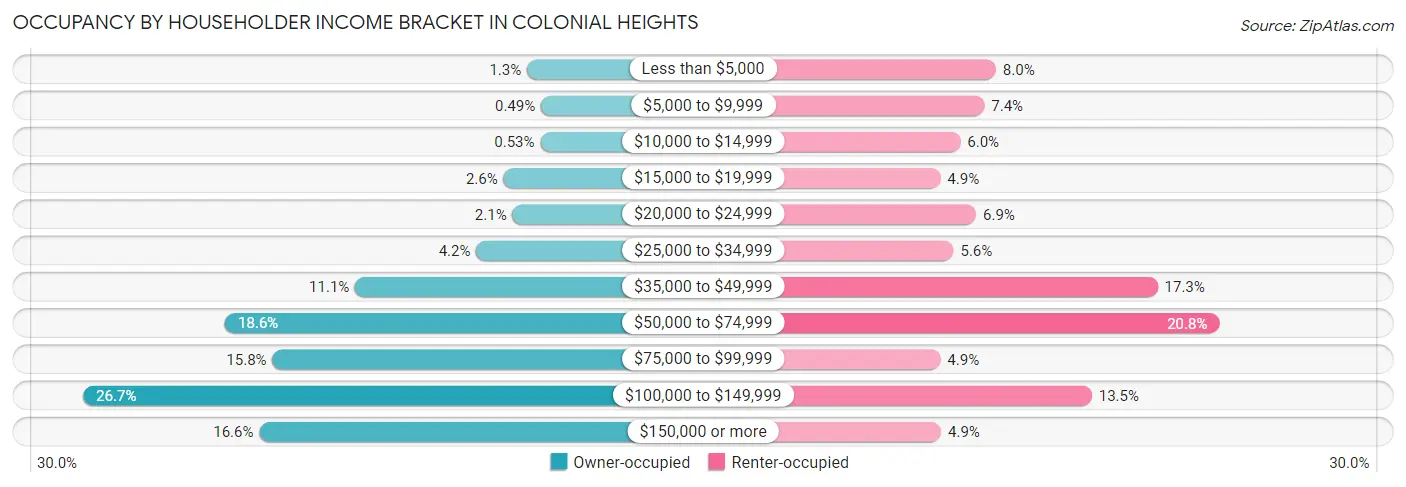
| Income Bracket | Owner-occupied | Renter-occupied |
| Less than $5,000 | 65 (1.3%) | 205 (8.0%) |
| $5,000 to $9,999 | 25 (0.5%) | 188 (7.4%) |
| $10,000 to $14,999 | 27 (0.5%) | 153 (6.0%) |
| $15,000 to $19,999 | 133 (2.6%) | 124 (4.9%) |
| $20,000 to $24,999 | 107 (2.1%) | 176 (6.9%) |
| $25,000 to $34,999 | 212 (4.2%) | 143 (5.6%) |
| $35,000 to $49,999 | 562 (11.1%) | 441 (17.3%) |
| $50,000 to $74,999 | 938 (18.5%) | 531 (20.8%) |
| $75,000 to $99,999 | 801 (15.8%) | 124 (4.9%) |
| $100,000 to $149,999 | 1,348 (26.7%) | 345 (13.5%) |
| $150,000 or more | 839 (16.6%) | 125 (4.9%) |
| Total | 5,057 (100.0%) | 2,555 (100.0%) |
Monthly Housing Cost Tiers in Colonial Heights
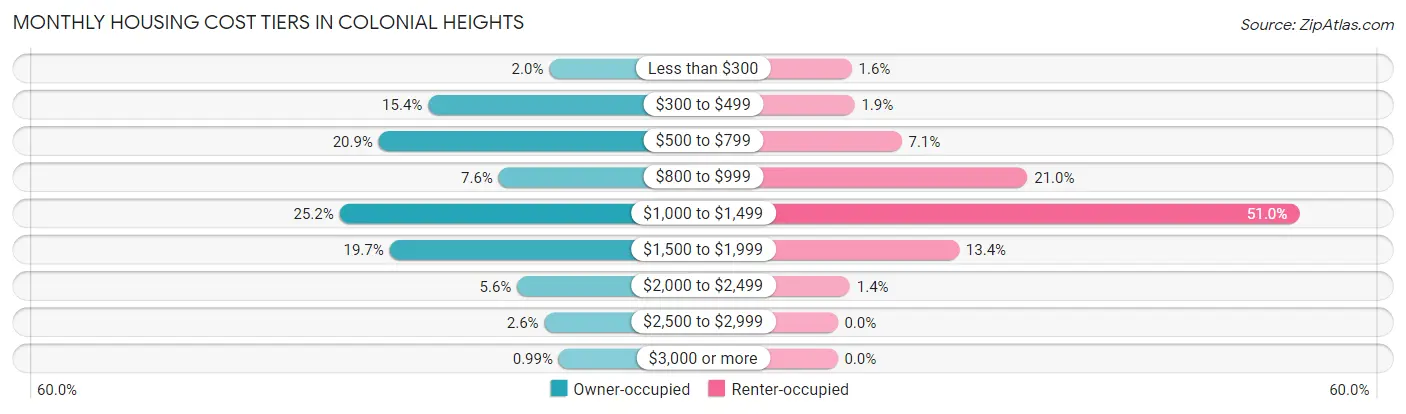
| Monthly Cost | Owner-occupied | Renter-occupied |
| Less than $300 | 103 (2.0%) | 40 (1.6%) |
| $300 to $499 | 780 (15.4%) | 48 (1.9%) |
| $500 to $799 | 1,056 (20.9%) | 181 (7.1%) |
| $800 to $999 | 386 (7.6%) | 536 (21.0%) |
| $1,000 to $1,499 | 1,275 (25.2%) | 1,303 (51.0%) |
| $1,500 to $1,999 | 995 (19.7%) | 343 (13.4%) |
| $2,000 to $2,499 | 282 (5.6%) | 35 (1.4%) |
| $2,500 to $2,999 | 130 (2.6%) | 0 (0.0%) |
| $3,000 or more | 50 (1.0%) | 0 (0.0%) |
| Total | 5,057 (100.0%) | 2,555 (100.0%) |
Physical Housing Characteristics in Colonial Heights
Housing Structures in Colonial Heights
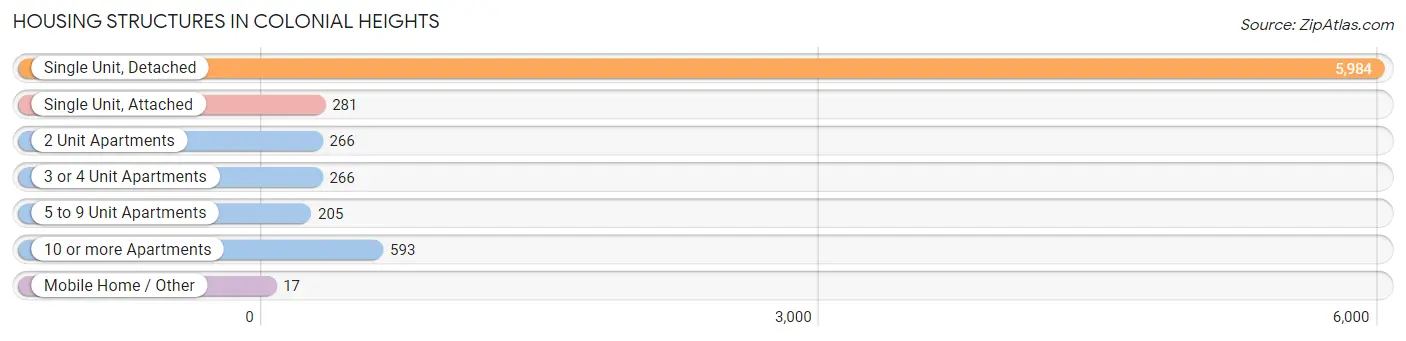
| Structure Type | # Housing Units | % Housing Units |
| Single Unit, Detached | 5,984 | 78.6% |
| Single Unit, Attached | 281 | 3.7% |
| 2 Unit Apartments | 266 | 3.5% |
| 3 or 4 Unit Apartments | 266 | 3.5% |
| 5 to 9 Unit Apartments | 205 | 2.7% |
| 10 or more Apartments | 593 | 7.8% |
| Mobile Home / Other | 17 | 0.2% |
| Total | 7,612 | 100.0% |
Housing Structures by Occupancy in Colonial Heights
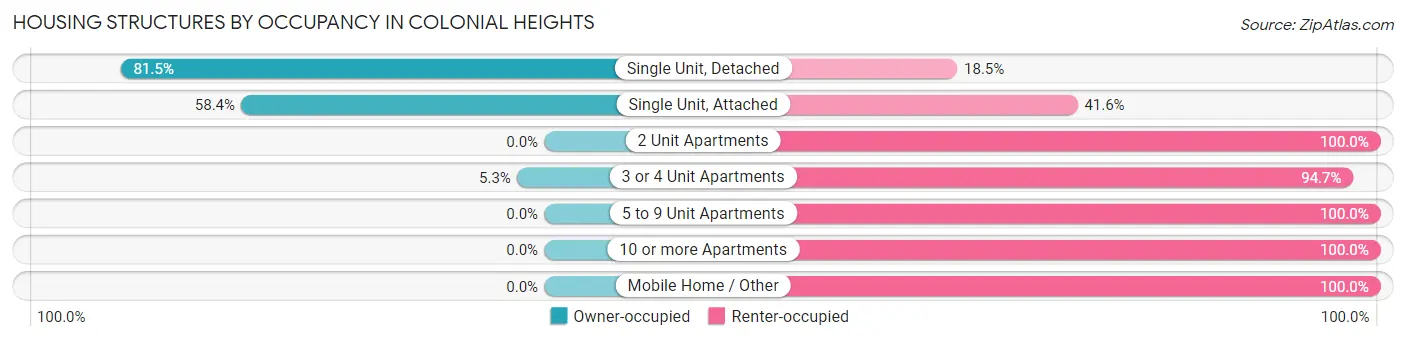
| Structure Type | Owner-occupied | Renter-occupied |
| Single Unit, Detached | 4,879 (81.5%) | 1,105 (18.5%) |
| Single Unit, Attached | 164 (58.4%) | 117 (41.6%) |
| 2 Unit Apartments | 0 (0.0%) | 266 (100.0%) |
| 3 or 4 Unit Apartments | 14 (5.3%) | 252 (94.7%) |
| 5 to 9 Unit Apartments | 0 (0.0%) | 205 (100.0%) |
| 10 or more Apartments | 0 (0.0%) | 593 (100.0%) |
| Mobile Home / Other | 0 (0.0%) | 17 (100.0%) |
| Total | 5,057 (66.4%) | 2,555 (33.6%) |
Housing Structures by Number of Rooms in Colonial Heights
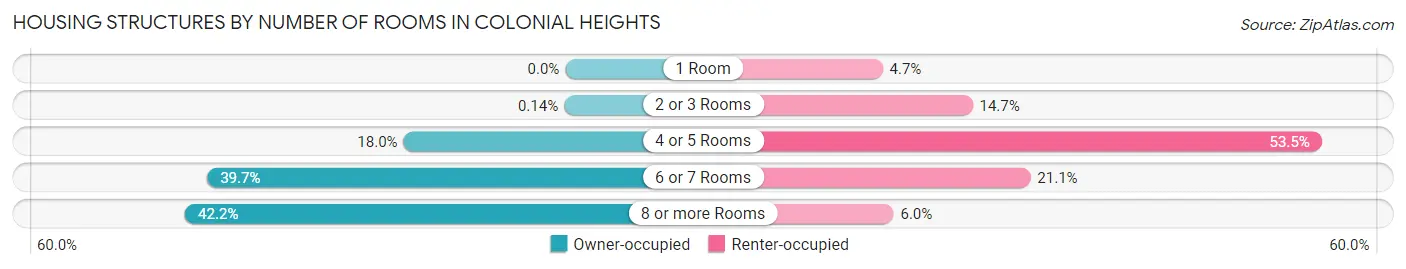
| Number of Rooms | Owner-occupied | Renter-occupied |
| 1 Room | 0 (0.0%) | 121 (4.7%) |
| 2 or 3 Rooms | 7 (0.1%) | 376 (14.7%) |
| 4 or 5 Rooms | 908 (18.0%) | 1,366 (53.5%) |
| 6 or 7 Rooms | 2,009 (39.7%) | 540 (21.1%) |
| 8 or more Rooms | 2,133 (42.2%) | 152 (5.9%) |
| Total | 5,057 (100.0%) | 2,555 (100.0%) |
Housing Structure by Heating Type in Colonial Heights
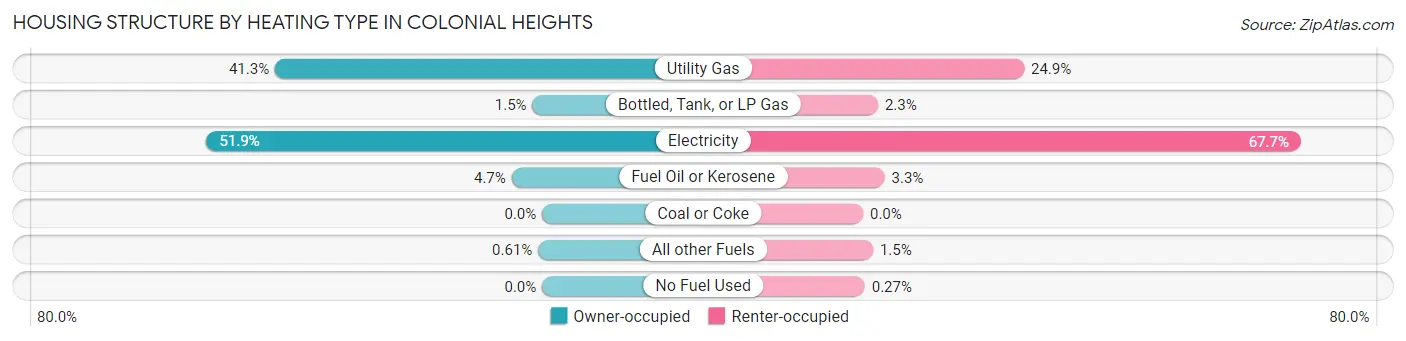
| Heating Type | Owner-occupied | Renter-occupied |
| Utility Gas | 2,088 (41.3%) | 636 (24.9%) |
| Bottled, Tank, or LP Gas | 76 (1.5%) | 59 (2.3%) |
| Electricity | 2,624 (51.9%) | 1,729 (67.7%) |
| Fuel Oil or Kerosene | 238 (4.7%) | 85 (3.3%) |
| Coal or Coke | 0 (0.0%) | 0 (0.0%) |
| All other Fuels | 31 (0.6%) | 39 (1.5%) |
| No Fuel Used | 0 (0.0%) | 7 (0.3%) |
| Total | 5,057 (100.0%) | 2,555 (100.0%) |
Household Vehicle Usage in Colonial Heights
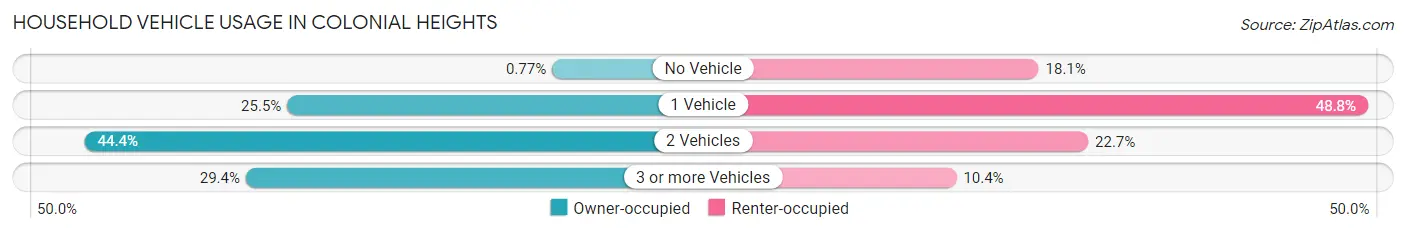
| Vehicles per Household | Owner-occupied | Renter-occupied |
| No Vehicle | 39 (0.8%) | 462 (18.1%) |
| 1 Vehicle | 1,289 (25.5%) | 1,247 (48.8%) |
| 2 Vehicles | 2,245 (44.4%) | 580 (22.7%) |
| 3 or more Vehicles | 1,484 (29.3%) | 266 (10.4%) |
| Total | 5,057 (100.0%) | 2,555 (100.0%) |
Real Estate & Mortgages in Colonial Heights
Real Estate and Mortgage Overview in Colonial Heights
| Characteristic | Without Mortgage | With Mortgage |
| Housing Units | 1,943 | 3,114 |
| Median Property Value | $220,600 | $221,800 |
| Median Household Income | $67,181 | $638 |
| Monthly Housing Costs | $526 | $50 |
| Real Estate Taxes | $2,189 | $97 |
Property Value by Mortgage Status in Colonial Heights
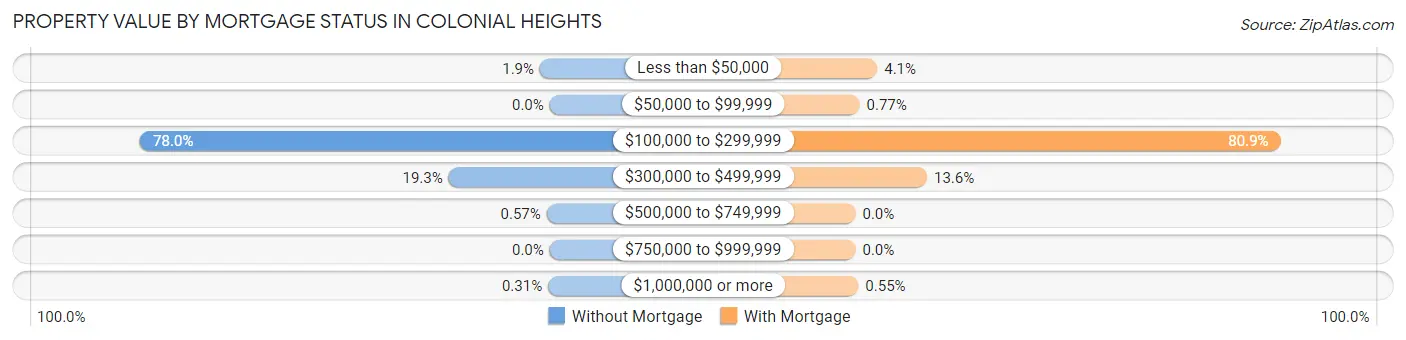
| Property Value | Without Mortgage | With Mortgage |
| Less than $50,000 | 36 (1.8%) | 129 (4.1%) |
| $50,000 to $99,999 | 0 (0.0%) | 24 (0.8%) |
| $100,000 to $299,999 | 1,516 (78.0%) | 2,520 (80.9%) |
| $300,000 to $499,999 | 374 (19.3%) | 424 (13.6%) |
| $500,000 to $749,999 | 11 (0.6%) | 0 (0.0%) |
| $750,000 to $999,999 | 0 (0.0%) | 0 (0.0%) |
| $1,000,000 or more | 6 (0.3%) | 17 (0.5%) |
| Total | 1,943 (100.0%) | 3,114 (100.0%) |
Household Income by Mortgage Status in Colonial Heights
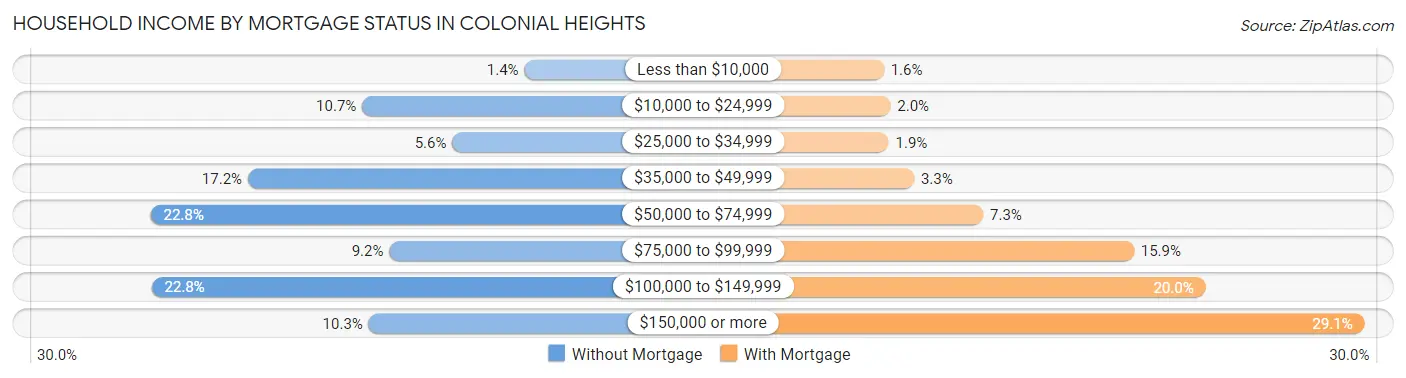
| Household Income | Without Mortgage | With Mortgage |
| Less than $10,000 | 28 (1.4%) | 50 (1.6%) |
| $10,000 to $24,999 | 208 (10.7%) | 62 (2.0%) |
| $25,000 to $34,999 | 108 (5.6%) | 59 (1.9%) |
| $35,000 to $49,999 | 335 (17.2%) | 104 (3.3%) |
| $50,000 to $74,999 | 443 (22.8%) | 227 (7.3%) |
| $75,000 to $99,999 | 178 (9.2%) | 495 (15.9%) |
| $100,000 to $149,999 | 442 (22.8%) | 623 (20.0%) |
| $150,000 or more | 201 (10.3%) | 906 (29.1%) |
| Total | 1,943 (100.0%) | 3,114 (100.0%) |
Property Value to Household Income Ratio in Colonial Heights
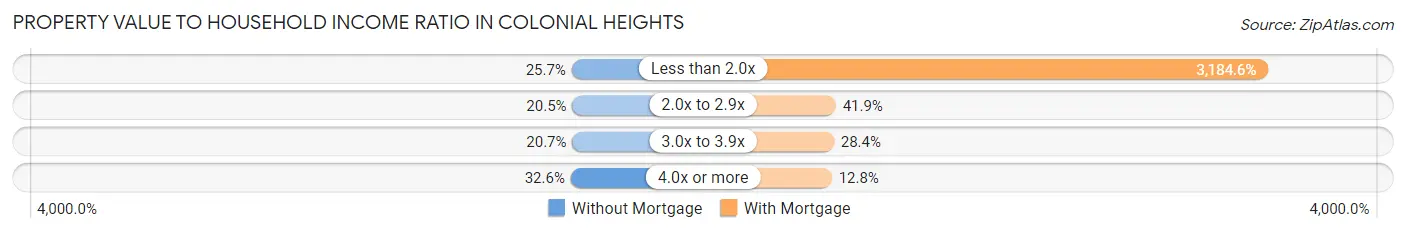
| Value-to-Income Ratio | Without Mortgage | With Mortgage |
| Less than 2.0x | 499 (25.7%) | 99,167 (3,184.6%) |
| 2.0x to 2.9x | 399 (20.5%) | 1,304 (41.9%) |
| 3.0x to 3.9x | 402 (20.7%) | 883 (28.4%) |
| 4.0x or more | 633 (32.6%) | 398 (12.8%) |
| Total | 1,943 (100.0%) | 3,114 (100.0%) |
Real Estate Taxes by Mortgage Status in Colonial Heights
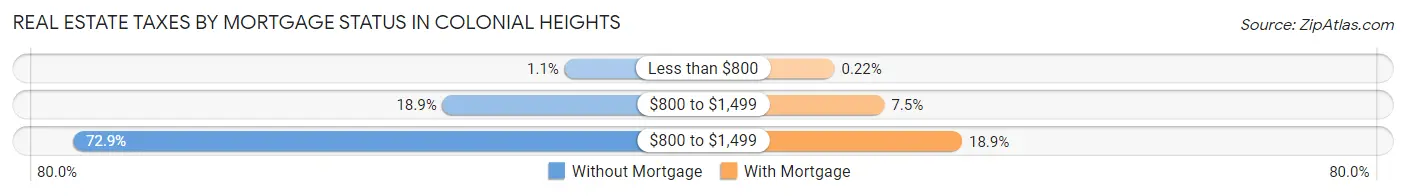
| Property Taxes | Without Mortgage | With Mortgage |
| Less than $800 | 21 (1.1%) | 7 (0.2%) |
| $800 to $1,499 | 368 (18.9%) | 234 (7.5%) |
| $800 to $1,499 | 1,417 (72.9%) | 587 (18.9%) |
| Total | 1,943 (100.0%) | 3,114 (100.0%) |
Health & Disability in Colonial Heights
Health Insurance Coverage by Age in Colonial Heights
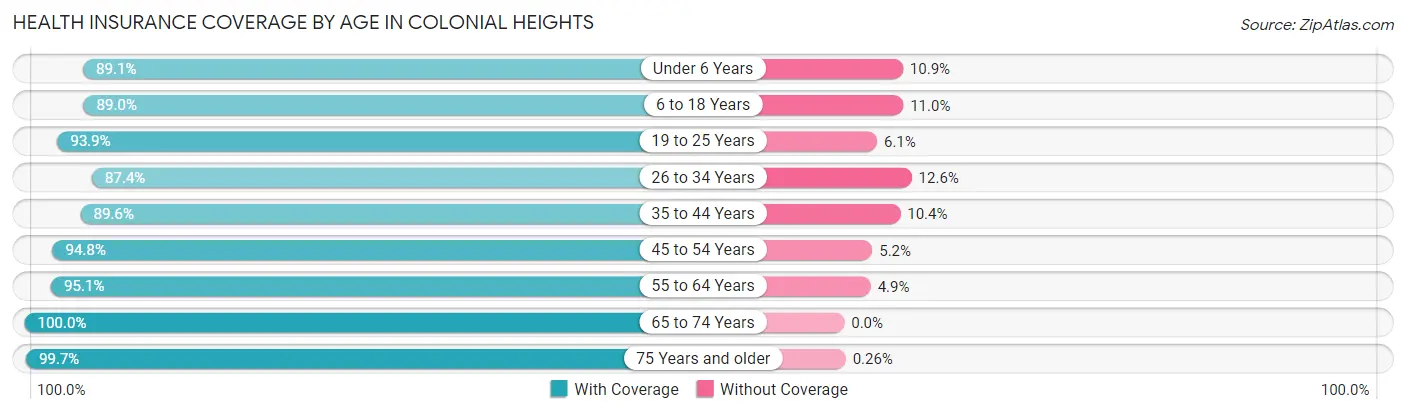
| Age Bracket | With Coverage | Without Coverage |
| Under 6 Years | 1,312 (89.1%) | 161 (10.9%) |
| 6 to 18 Years | 2,575 (89.0%) | 318 (11.0%) |
| 19 to 25 Years | 1,245 (93.9%) | 81 (6.1%) |
| 26 to 34 Years | 2,012 (87.4%) | 289 (12.6%) |
| 35 to 44 Years | 1,938 (89.6%) | 226 (10.4%) |
| 45 to 54 Years | 2,070 (94.8%) | 114 (5.2%) |
| 55 to 64 Years | 2,177 (95.1%) | 113 (4.9%) |
| 65 to 74 Years | 1,721 (100.0%) | 0 (0.0%) |
| 75 Years and older | 1,534 (99.7%) | 4 (0.3%) |
| Total | 16,584 (92.7%) | 1,306 (7.3%) |
Health Insurance Coverage by Citizenship Status in Colonial Heights
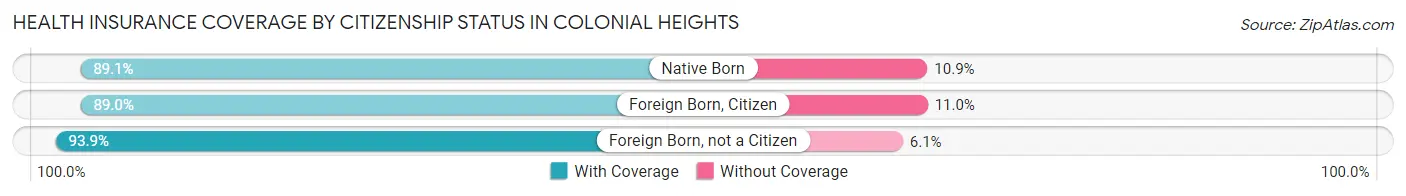
| Citizenship Status | With Coverage | Without Coverage |
| Native Born | 1,312 (89.1%) | 161 (10.9%) |
| Foreign Born, Citizen | 2,575 (89.0%) | 318 (11.0%) |
| Foreign Born, not a Citizen | 1,245 (93.9%) | 81 (6.1%) |
Health Insurance Coverage by Household Income in Colonial Heights
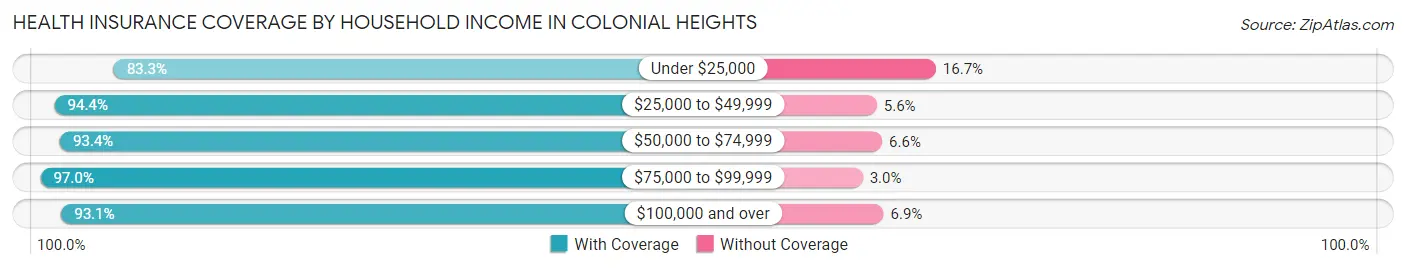
| Household Income | With Coverage | Without Coverage |
| Under $25,000 | 1,686 (83.3%) | 338 (16.7%) |
| $25,000 to $49,999 | 2,363 (94.4%) | 141 (5.6%) |
| $50,000 to $74,999 | 2,941 (93.4%) | 209 (6.6%) |
| $75,000 to $99,999 | 2,114 (97.0%) | 65 (3.0%) |
| $100,000 and over | 7,477 (93.1%) | 553 (6.9%) |
Public vs Private Health Insurance Coverage by Age in Colonial Heights
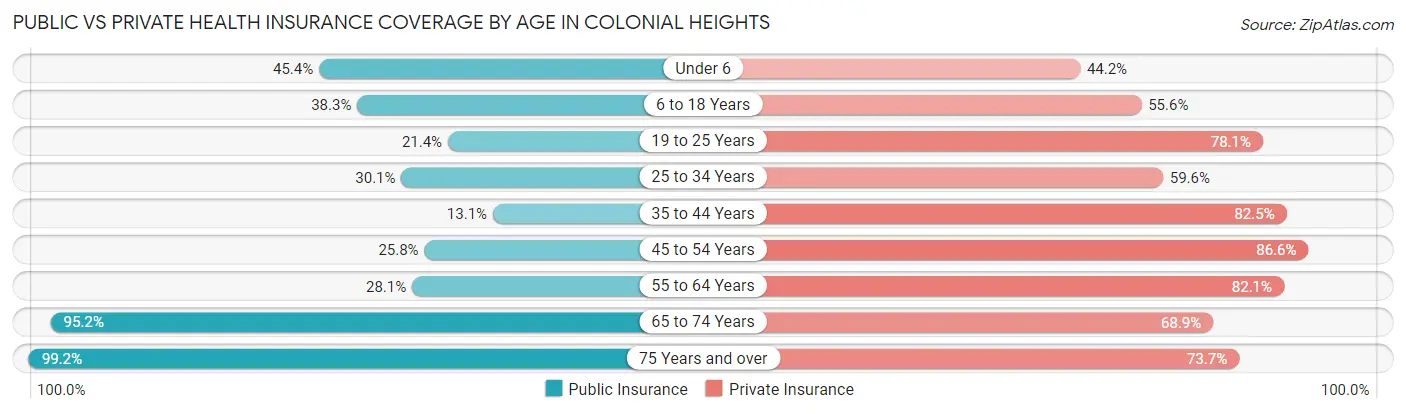
| Age Bracket | Public Insurance | Private Insurance |
| Under 6 | 668 (45.4%) | 651 (44.2%) |
| 6 to 18 Years | 1,107 (38.3%) | 1,608 (55.6%) |
| 19 to 25 Years | 284 (21.4%) | 1,036 (78.1%) |
| 25 to 34 Years | 692 (30.1%) | 1,371 (59.6%) |
| 35 to 44 Years | 283 (13.1%) | 1,786 (82.5%) |
| 45 to 54 Years | 563 (25.8%) | 1,891 (86.6%) |
| 55 to 64 Years | 643 (28.1%) | 1,879 (82.1%) |
| 65 to 74 Years | 1,638 (95.2%) | 1,186 (68.9%) |
| 75 Years and over | 1,526 (99.2%) | 1,134 (73.7%) |
| Total | 7,404 (41.4%) | 12,542 (70.1%) |
Disability Status by Sex by Age in Colonial Heights
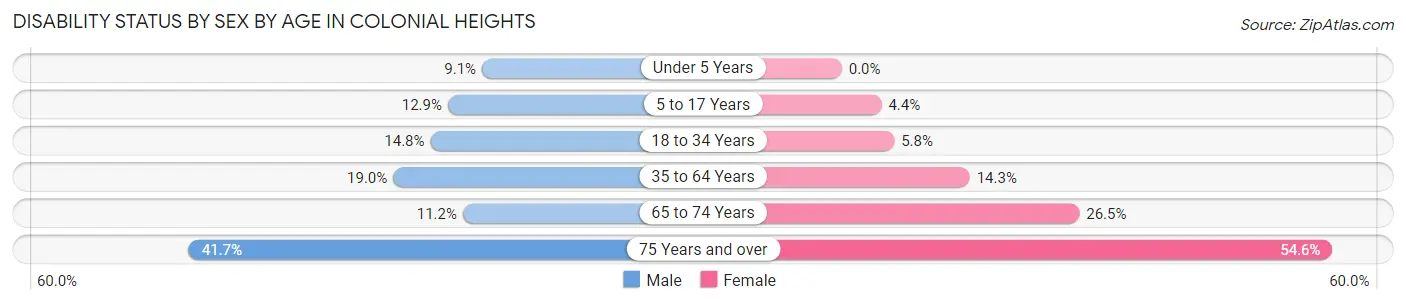
| Age Bracket | Male | Female |
| Under 5 Years | 42 (9.1%) | 0 (0.0%) |
| 5 to 17 Years | 197 (12.9%) | 68 (4.4%) |
| 18 to 34 Years | 257 (14.8%) | 118 (5.8%) |
| 35 to 64 Years | 588 (19.0%) | 504 (14.2%) |
| 65 to 74 Years | 81 (11.2%) | 264 (26.5%) |
| 75 Years and over | 259 (41.7%) | 501 (54.6%) |
Disability Class by Sex by Age in Colonial Heights
Disability Class: Hearing Difficulty
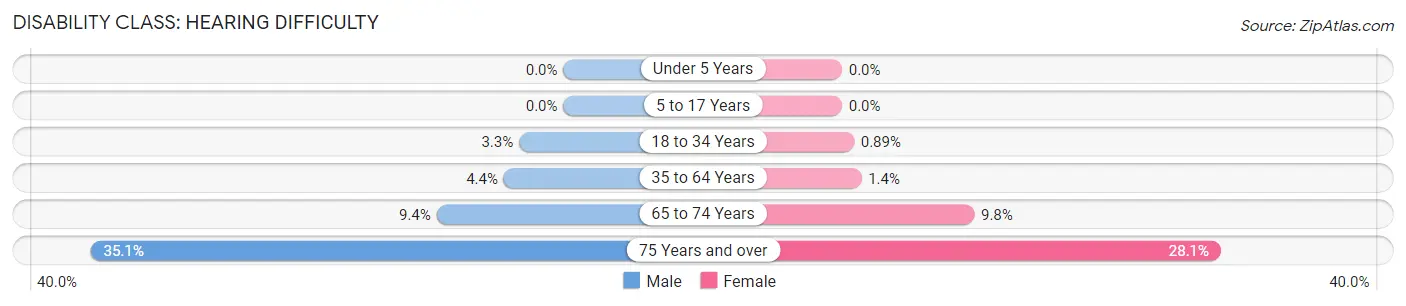
| Age Bracket | Male | Female |
| Under 5 Years | 0 (0.0%) | 0 (0.0%) |
| 5 to 17 Years | 0 (0.0%) | 0 (0.0%) |
| 18 to 34 Years | 57 (3.3%) | 18 (0.9%) |
| 35 to 64 Years | 137 (4.4%) | 51 (1.4%) |
| 65 to 74 Years | 68 (9.4%) | 98 (9.8%) |
| 75 Years and over | 218 (35.1%) | 258 (28.1%) |
Disability Class: Vision Difficulty
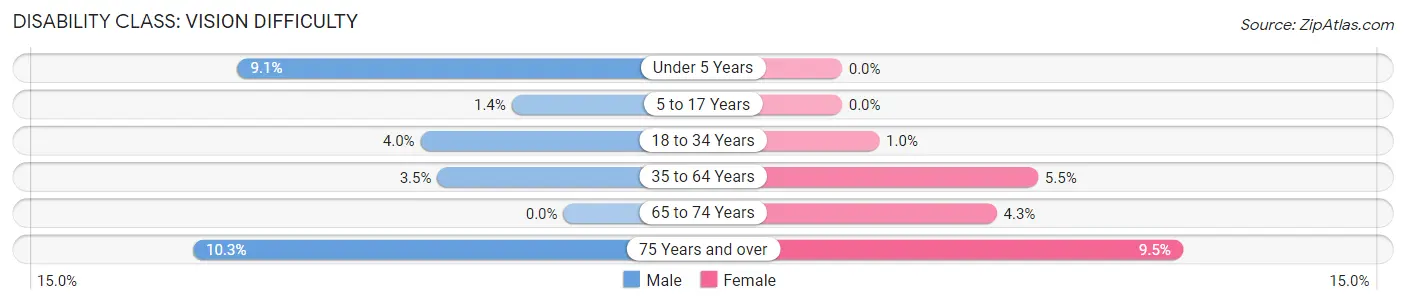
| Age Bracket | Male | Female |
| Under 5 Years | 42 (9.1%) | 0 (0.0%) |
| 5 to 17 Years | 22 (1.4%) | 0 (0.0%) |
| 18 to 34 Years | 69 (4.0%) | 21 (1.0%) |
| 35 to 64 Years | 109 (3.5%) | 193 (5.5%) |
| 65 to 74 Years | 0 (0.0%) | 43 (4.3%) |
| 75 Years and over | 64 (10.3%) | 87 (9.5%) |
Disability Class: Cognitive Difficulty
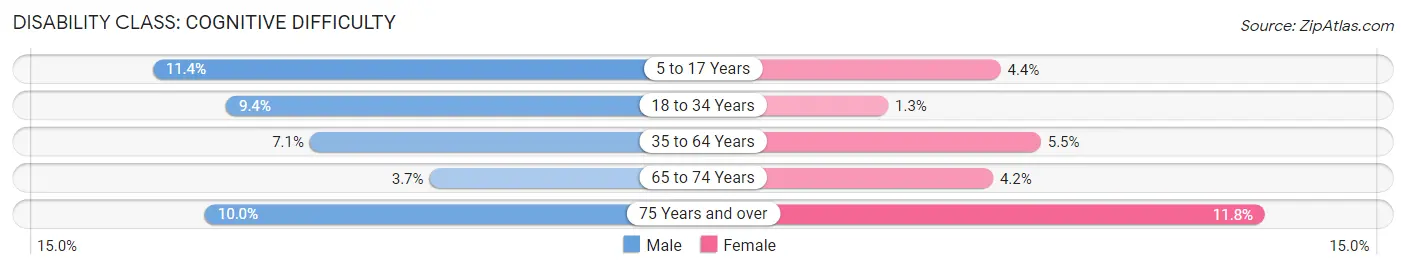
| Age Bracket | Male | Female |
| 5 to 17 Years | 175 (11.4%) | 68 (4.4%) |
| 18 to 34 Years | 163 (9.4%) | 26 (1.3%) |
| 35 to 64 Years | 219 (7.1%) | 196 (5.5%) |
| 65 to 74 Years | 27 (3.7%) | 42 (4.2%) |
| 75 Years and over | 62 (10.0%) | 108 (11.8%) |
Disability Class: Ambulatory Difficulty
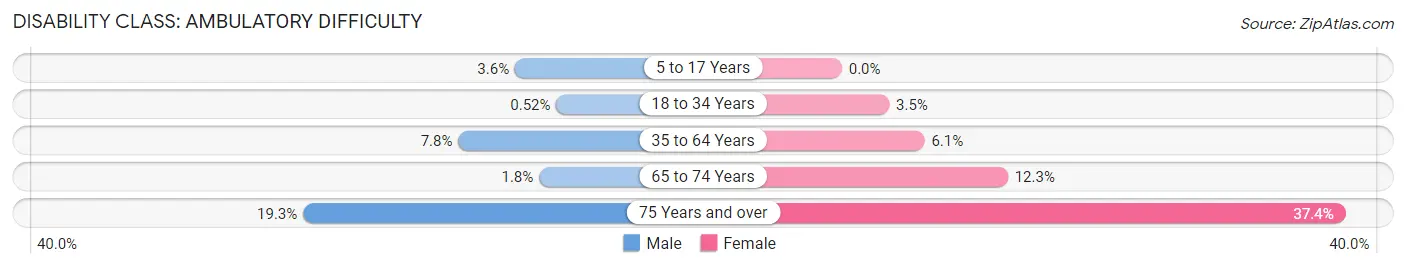
| Age Bracket | Male | Female |
| 5 to 17 Years | 55 (3.6%) | 0 (0.0%) |
| 18 to 34 Years | 9 (0.5%) | 71 (3.5%) |
| 35 to 64 Years | 242 (7.8%) | 217 (6.1%) |
| 65 to 74 Years | 13 (1.8%) | 123 (12.3%) |
| 75 Years and over | 120 (19.3%) | 343 (37.4%) |
Disability Class: Self-Care Difficulty
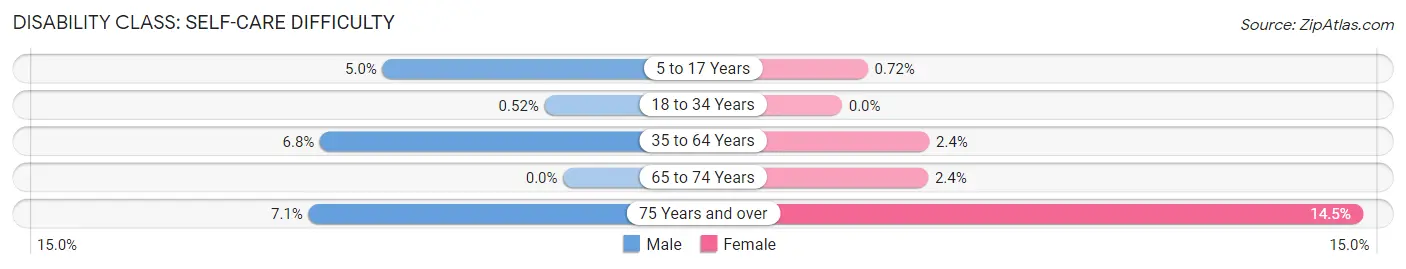
| Age Bracket | Male | Female |
| 5 to 17 Years | 77 (5.0%) | 11 (0.7%) |
| 18 to 34 Years | 9 (0.5%) | 0 (0.0%) |
| 35 to 64 Years | 210 (6.8%) | 86 (2.4%) |
| 65 to 74 Years | 0 (0.0%) | 24 (2.4%) |
| 75 Years and over | 44 (7.1%) | 133 (14.5%) |
Technology Access in Colonial Heights
Computing Device Access in Colonial Heights
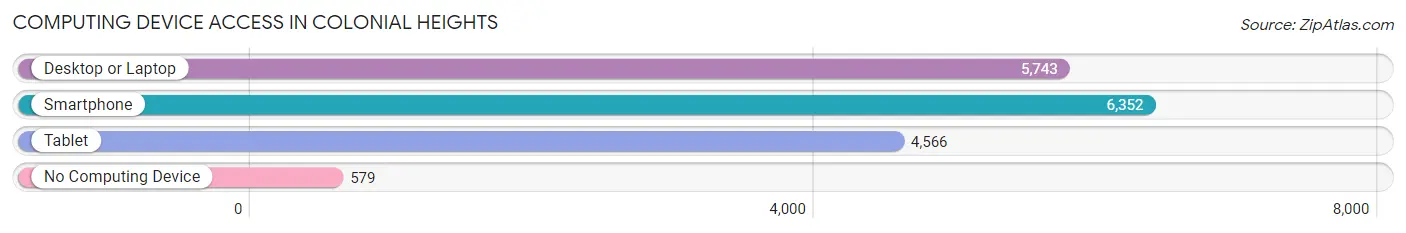
| Device Type | # Households | % Households |
| Desktop or Laptop | 5,743 | 75.4% |
| Smartphone | 6,352 | 83.5% |
| Tablet | 4,566 | 60.0% |
| No Computing Device | 579 | 7.6% |
| Total | 7,612 | 100.0% |
Internet Access in Colonial Heights
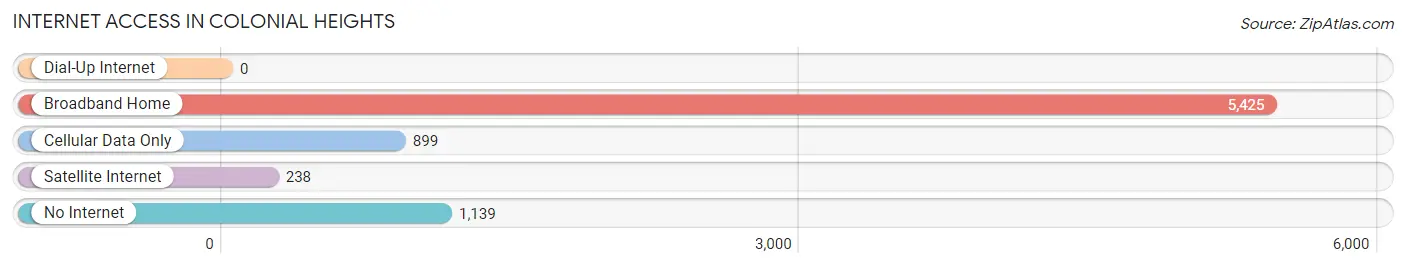
| Internet Type | # Households | % Households |
| Dial-Up Internet | 0 | 0.0% |
| Broadband Home | 5,425 | 71.3% |
| Cellular Data Only | 899 | 11.8% |
| Satellite Internet | 238 | 3.1% |
| No Internet | 1,139 | 15.0% |
| Total | 7,612 | 100.0% |
Colonial Heights Summary
Colonial Heights is an independent city located in the Commonwealth of Virginia. It is located in the Richmond-Petersburg region of the state, just south of the city of Richmond. The city is bordered by the counties of Chesterfield and Dinwiddie, and is part of the Greater Richmond Region. As of the 2010 census, the population of Colonial Heights was 17,411.
History
Colonial Heights was originally part of Chesterfield County, and was known as "The Village of Water View" until the early 20th century. The area was first settled in the early 1700s by English colonists, and was part of the original land grant given to William Byrd II. The area was known for its rich soil and abundant wildlife, and was a popular hunting ground for the colonists.
In the late 19th century, the area began to develop as a residential suburb of Richmond. The area was incorporated as the Town of Colonial Heights in 1948, and was later reincorporated as an independent city in 1952.
Geography
Colonial Heights is located in the Richmond-Petersburg region of Virginia, just south of the city of Richmond. The city is bordered by the counties of Chesterfield and Dinwiddie. The city has a total area of 8.3 square miles, all of which is land.
The city is located in the Coastal Plain region of Virginia, and is characterized by rolling hills and flat terrain. The city is located on the Appomattox River, and is part of the James River watershed.
Economy
The economy of Colonial Heights is largely based on retail and services. The city is home to several large retail stores, including Walmart, Target, and Lowe's. The city is also home to several restaurants, banks, and other businesses.
The city is also home to several industrial and manufacturing companies, including the Colonial Heights Foundry and the Colonial Heights Machine Shop. The city is also home to several government offices, including the Colonial Heights Police Department and the Colonial Heights Fire Department.
Demographics
As of the 2010 census, the population of Colonial Heights was 17,411. The racial makeup of the city was 79.2% White, 15.2% African American, 0.5% Native American, 1.7% Asian, 0.1% Pacific Islander, 1.2% from other races, and 2.2% from two or more races. Hispanic or Latino of any race were 3.7% of the population.
The median income for a household in the city was $45,945, and the median income for a family was $54,945. The per capita income for the city was $22,845. About 8.3% of families and 10.2% of the population were below the poverty line, including 14.2% of those under age 18 and 8.2% of those age 65 or over.
Common Questions
What is Per Capita Income in Colonial Heights?
Per Capita income in Colonial Heights is $37,039.
What is the Median Family Income in Colonial Heights?
Median Family Income in Colonial Heights is $90,408.
What is the Median Household income in Colonial Heights?
Median Household Income in Colonial Heights is $72,216.
What is Income or Wage Gap in Colonial Heights?
Income or Wage Gap in Colonial Heights is 27.0%.
Women in Colonial Heights earn 73.0 cents for every dollar earned by a man.
What is Inequality or Gini Index in Colonial Heights?
Inequality or Gini Index in Colonial Heights is 0.41.
What is the Total Population of Colonial Heights?
Total Population of Colonial Heights is 18,158.
What is the Total Male Population of Colonial Heights?
Total Male Population of Colonial Heights is 8,304.
What is the Total Female Population of Colonial Heights?
Total Female Population of Colonial Heights is 9,854.
What is the Ratio of Males per 100 Females in Colonial Heights?
There are 84.27 Males per 100 Females in Colonial Heights.
What is the Ratio of Females per 100 Males in Colonial Heights?
There are 118.67 Females per 100 Males in Colonial Heights.
What is the Median Population Age in Colonial Heights?
Median Population Age in Colonial Heights is 38.4 Years.
What is the Average Family Size in Colonial Heights
Average Family Size in Colonial Heights is 2.9 People.
What is the Average Household Size in Colonial Heights
Average Household Size in Colonial Heights is 2.4 People.
How Large is the Labor Force in Colonial Heights?
There are 9,348 People in the Labor Forcein in Colonial Heights.
What is the Percentage of People in the Labor Force in Colonial Heights?
65.0% of People are in the Labor Force in Colonial Heights.
What is the Unemployment Rate in Colonial Heights?
Unemployment Rate in Colonial Heights is 6.1%.