Independent Hill, VA Map & Demographics
Independent Hill Map
Independent Hill Overview
$69,063
PER CAPITA INCOME
$211,222
AVG FAMILY INCOME
$201,310
AVG HOUSEHOLD INCOME
53.8%
WAGE / INCOME GAP [ % ]
46.2¢/ $1
WAGE / INCOME GAP [ $ ]
$2,081
FAMILY INCOME DEFICIT
0.34
INEQUALITY / GINI INDEX
9,858
TOTAL POPULATION
4,861
MALE POPULATION
4,997
FEMALE POPULATION
97.28
MALES / 100 FEMALES
102.80
FEMALES / 100 MALES
38.5
MEDIAN AGE
3.5
AVG FAMILY SIZE
3.3
AVG HOUSEHOLD SIZE
5,560
LABOR FORCE [ PEOPLE ]
72.3%
PERCENT IN LABOR FORCE
3.6%
UNEMPLOYMENT RATE
Income in Independent Hill
Income Overview in Independent Hill
Per Capita Income in Independent Hill is $69,063, while median incomes of families and households are $211,222 and $201,310 respectively.
| Characteristic | Number | Measure |
| Per Capita Income | 9,858 | $69,063 |
| Median Family Income | 2,687 | $211,222 |
| Mean Family Income | 2,687 | $232,244 |
| Median Household Income | 3,003 | $201,310 |
| Mean Household Income | 3,003 | $220,198 |
| Income Deficit | 2,687 | $2,081 |
| Wage / Income Gap (%) | 9,858 | 53.77% |
| Wage / Income Gap ($) | 9,858 | 46.23¢ per $1 |
| Gini / Inequality Index | 9,858 | 0.34 |
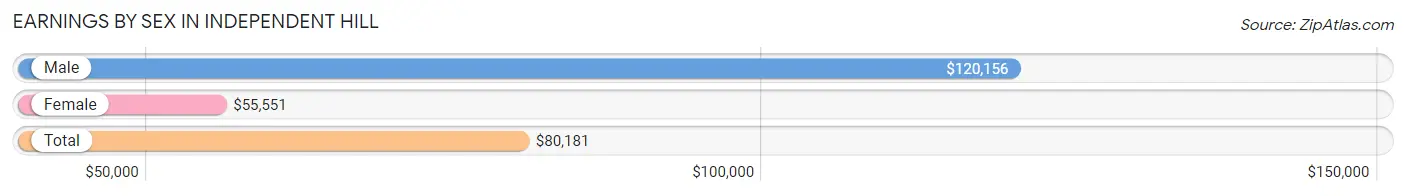
Earnings by Sex in Independent Hill
Average Earnings in Independent Hill are $80,181, $120,156 for men and $55,551 for women, a difference of 53.8%.
| Sex | Number | Average Earnings |
| Male | 2,971 (51.5%) | $120,156 |
| Female | 2,795 (48.5%) | $55,551 |
| Total | 5,766 (100.0%) | $80,181 |
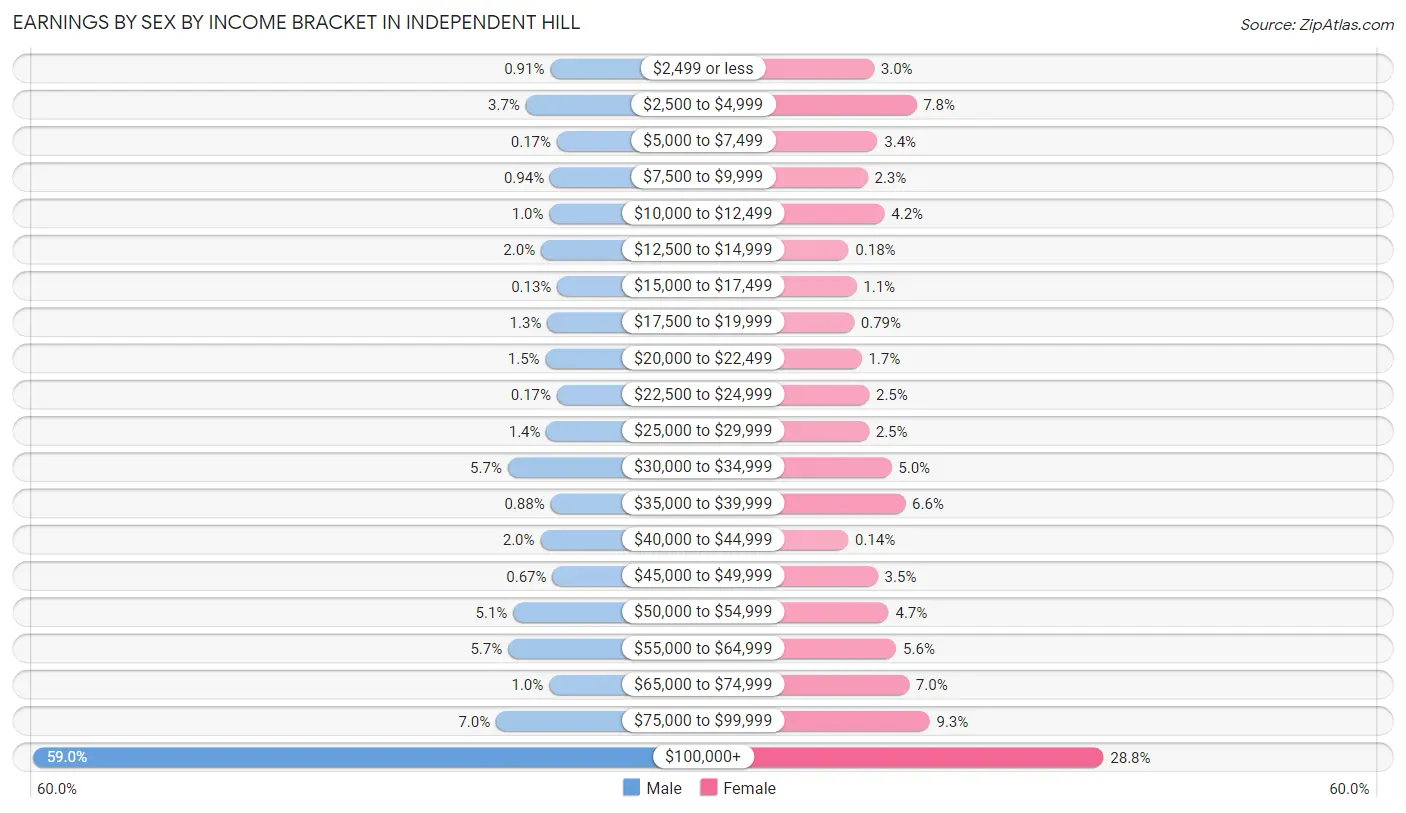
Earnings by Sex by Income Bracket in Independent Hill
The most common earnings brackets in Independent Hill are $100,000+ for men (1,752 | 59.0%) and $100,000+ for women (806 | 28.8%).
| Income | Male | Female |
| $2,499 or less | 27 (0.9%) | 85 (3.0%) |
| $2,500 to $4,999 | 109 (3.7%) | 218 (7.8%) |
| $5,000 to $7,499 | 5 (0.2%) | 96 (3.4%) |
| $7,500 to $9,999 | 28 (0.9%) | 65 (2.3%) |
| $10,000 to $12,499 | 30 (1.0%) | 118 (4.2%) |
| $12,500 to $14,999 | 58 (1.9%) | 5 (0.2%) |
| $15,000 to $17,499 | 4 (0.1%) | 30 (1.1%) |
| $17,500 to $19,999 | 37 (1.3%) | 22 (0.8%) |
| $20,000 to $22,499 | 43 (1.5%) | 46 (1.7%) |
| $22,500 to $24,999 | 5 (0.2%) | 70 (2.5%) |
| $25,000 to $29,999 | 40 (1.3%) | 69 (2.5%) |
| $30,000 to $34,999 | 169 (5.7%) | 140 (5.0%) |
| $35,000 to $39,999 | 26 (0.9%) | 183 (6.6%) |
| $40,000 to $44,999 | 60 (2.0%) | 4 (0.1%) |
| $45,000 to $49,999 | 20 (0.7%) | 97 (3.5%) |
| $50,000 to $54,999 | 151 (5.1%) | 131 (4.7%) |
| $55,000 to $64,999 | 168 (5.7%) | 155 (5.6%) |
| $65,000 to $74,999 | 31 (1.0%) | 195 (7.0%) |
| $75,000 to $99,999 | 208 (7.0%) | 260 (9.3%) |
| $100,000+ | 1,752 (59.0%) | 806 (28.8%) |
| Total | 2,971 (100.0%) | 2,795 (100.0%) |
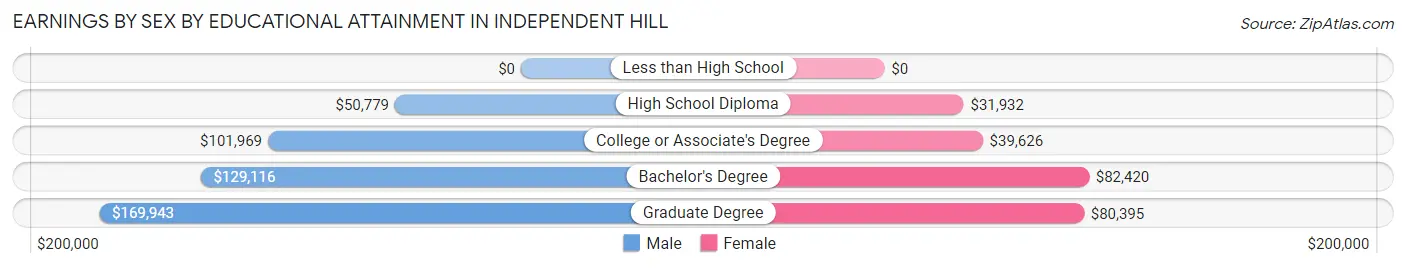
Earnings by Sex by Educational Attainment in Independent Hill
Average earnings in Independent Hill are $127,688 for men and $65,500 for women, a difference of 48.7%. Men with an educational attainment of graduate degree enjoy the highest average annual earnings of $169,943, while those with high school diploma education earn the least with $50,779. Women with an educational attainment of bachelor's degree earn the most with the average annual earnings of $82,420, while those with high school diploma education have the smallest earnings of $31,932.
| Educational Attainment | Male Income | Female Income |
| Less than High School | - | - |
| High School Diploma | $50,779 | $31,932 |
| College or Associate's Degree | $101,969 | $39,626 |
| Bachelor's Degree | $129,116 | $82,420 |
| Graduate Degree | $169,943 | $80,395 |
| Total | $127,688 | $65,500 |
Family Income in Independent Hill
Family Income Brackets in Independent Hill
According to the Independent Hill family income data, there are 1,494 families falling into the $200,000+ income range, which is the most common income bracket and makes up 55.6% of all families.
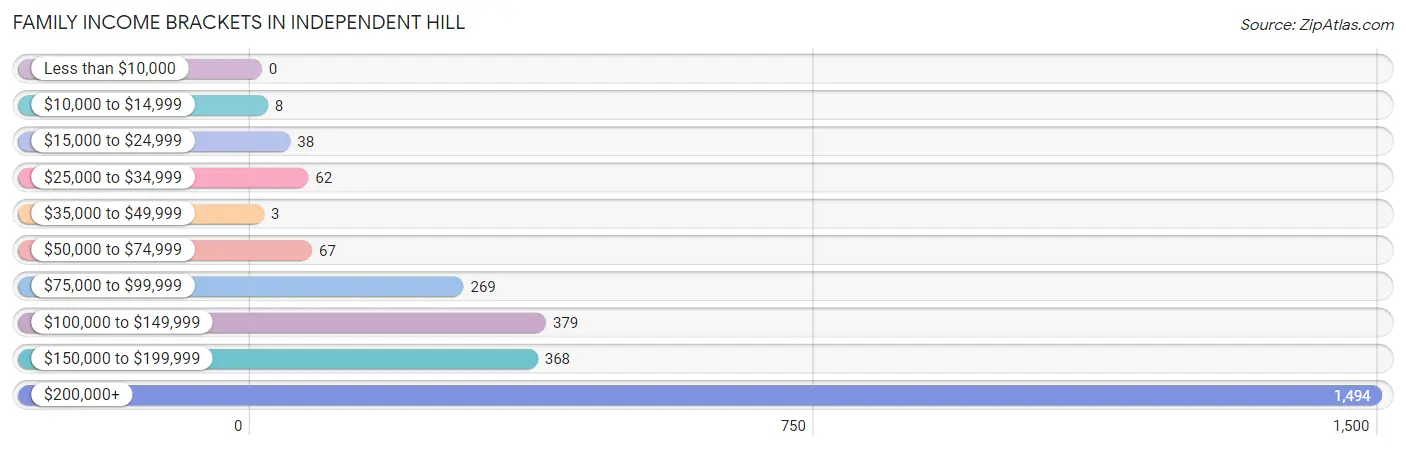
| Income Bracket | # Families | % Families |
| Less than $10,000 | 0 | 0.0% |
| $10,000 to $14,999 | 8 | 0.3% |
| $15,000 to $24,999 | 38 | 1.4% |
| $25,000 to $34,999 | 62 | 2.3% |
| $35,000 to $49,999 | 3 | 0.1% |
| $50,000 to $74,999 | 67 | 2.5% |
| $75,000 to $99,999 | 269 | 10.0% |
| $100,000 to $149,999 | 379 | 14.1% |
| $150,000 to $199,999 | 368 | 13.7% |
| $200,000+ | 1,494 | 55.6% |
Family Income by Famaliy Size in Independent Hill
4-person families (706 | 26.3%) account for the highest median family income in Independent Hill with $250,001 per family, while 2-person families (925 | 34.4%) have the highest median income of $89,032 per family member.
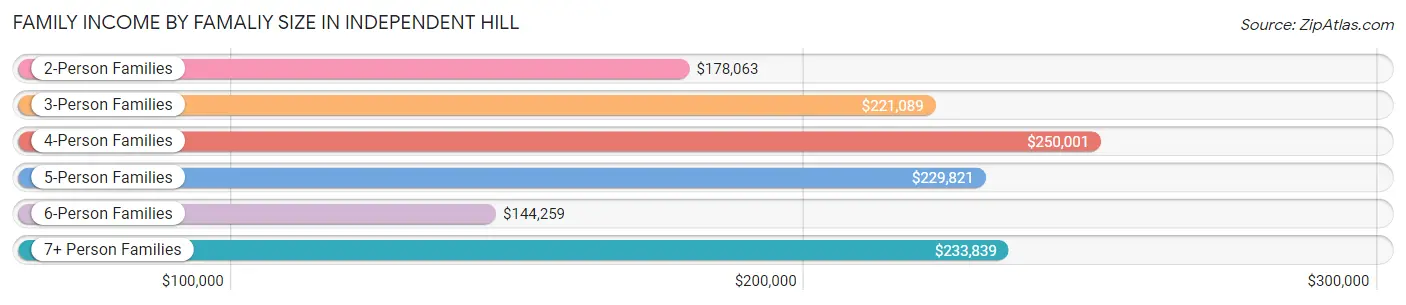
| Income Bracket | # Families | Median Income |
| 2-Person Families | 925 (34.4%) | $178,063 |
| 3-Person Families | 645 (24.0%) | $221,089 |
| 4-Person Families | 706 (26.3%) | $250,001 |
| 5-Person Families | 304 (11.3%) | $229,821 |
| 6-Person Families | 72 (2.7%) | $144,259 |
| 7+ Person Families | 35 (1.3%) | $233,839 |
| Total | 2,687 (100.0%) | $211,222 |
Family Income by Number of Earners in Independent Hill
The median family income in Independent Hill is $211,222, with families comprising 3+ earners (418) having the highest median family income of $250,001, while families with no earners (116) have the lowest median family income of $33,857, accounting for 15.6% and 4.3% of families, respectively.
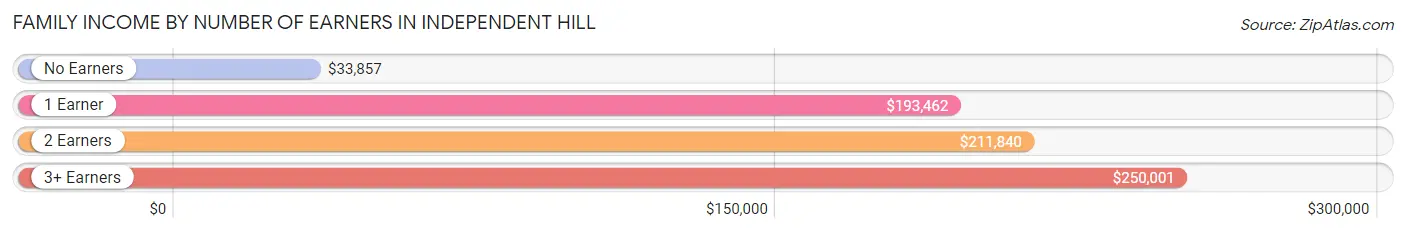
| Number of Earners | # Families | Median Income |
| No Earners | 116 (4.3%) | $33,857 |
| 1 Earner | 642 (23.9%) | $193,462 |
| 2 Earners | 1,511 (56.2%) | $211,840 |
| 3+ Earners | 418 (15.6%) | $250,001 |
| Total | 2,687 (100.0%) | $211,222 |
Household Income in Independent Hill
Household Income Brackets in Independent Hill
With 1,535 households falling in the category, the $200,000+ income range is the most frequent in Independent Hill, accounting for 51.1% of all households. In contrast, only 6 households (0.2%) fall into the less than $10,000 income bracket, making it the least populous group.
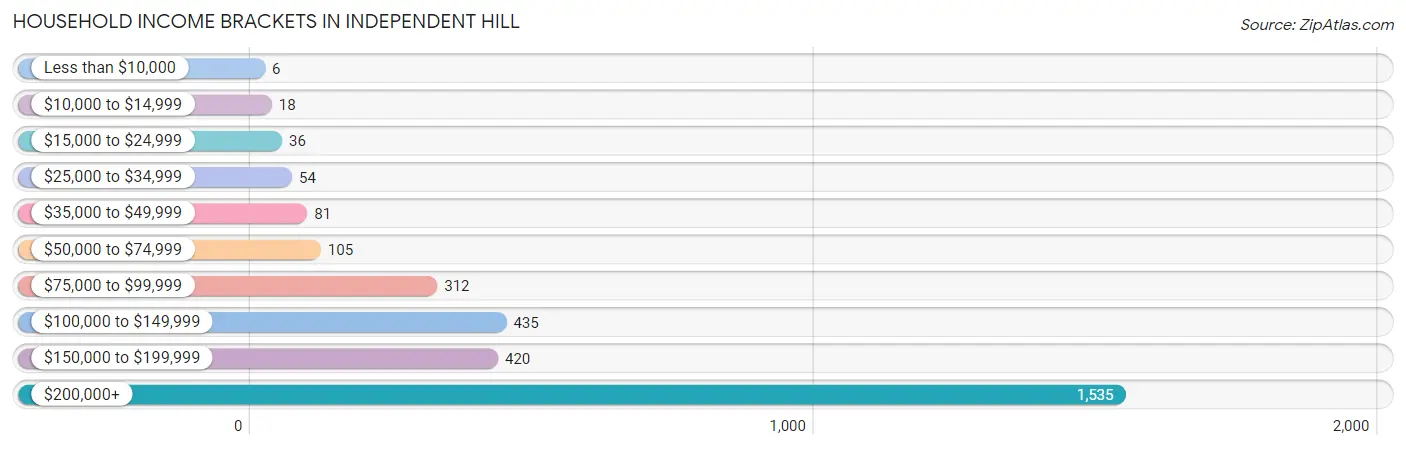
| Income Bracket | # Households | % Households |
| Less than $10,000 | 6 | 0.2% |
| $10,000 to $14,999 | 18 | 0.6% |
| $15,000 to $24,999 | 36 | 1.2% |
| $25,000 to $34,999 | 54 | 1.8% |
| $35,000 to $49,999 | 81 | 2.7% |
| $50,000 to $74,999 | 105 | 3.5% |
| $75,000 to $99,999 | 312 | 10.4% |
| $100,000 to $149,999 | 435 | 14.5% |
| $150,000 to $199,999 | 420 | 14.0% |
| $200,000+ | 1,535 | 51.1% |
Household Income by Householder Age in Independent Hill
The median household income in Independent Hill is $201,310, with the highest median household income of $229,958 found in the 45 to 64 years age bracket for the primary householder. A total of 1,773 households (59.0%) fall into this category.
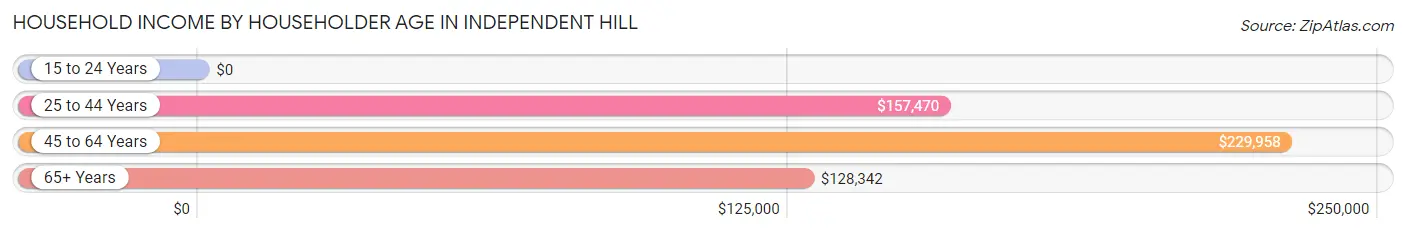
| Income Bracket | # Households | Median Income |
| 15 to 24 Years | 0 (0.0%) | $0 |
| 25 to 44 Years | 849 (28.3%) | $157,470 |
| 45 to 64 Years | 1,773 (59.0%) | $229,958 |
| 65+ Years | 381 (12.7%) | $128,342 |
| Total | 3,003 (100.0%) | $201,310 |
Poverty in Independent Hill
Income Below Poverty by Sex and Age in Independent Hill
With 1.2% poverty level for males and 2.1% for females among the residents of Independent Hill, 65 to 74 year old males and 75 year old and over females are the most vulnerable to poverty, with 14 males (5.4%) and 10 females (12.0%) in their respective age groups living below the poverty level.
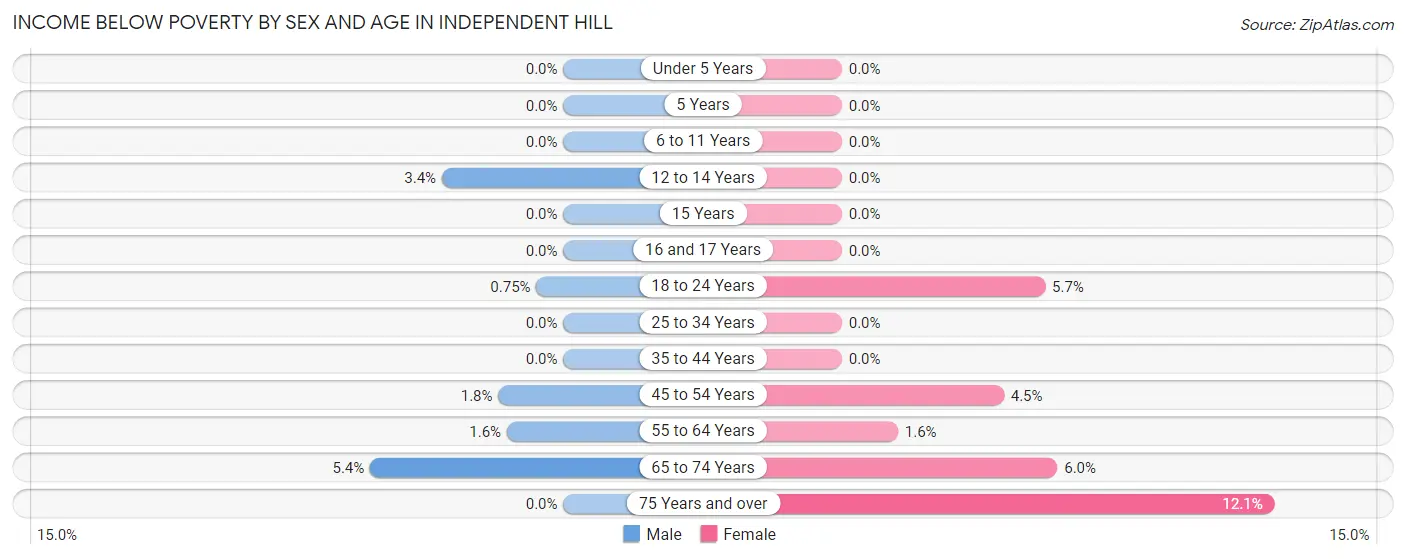
| Age Bracket | Male | Female |
| Under 5 Years | 0 (0.0%) | 0 (0.0%) |
| 5 Years | 0 (0.0%) | 0 (0.0%) |
| 6 to 11 Years | 0 (0.0%) | 0 (0.0%) |
| 12 to 14 Years | 13 (3.4%) | 0 (0.0%) |
| 15 Years | 0 (0.0%) | 0 (0.0%) |
| 16 and 17 Years | 0 (0.0%) | 0 (0.0%) |
| 18 to 24 Years | 2 (0.7%) | 22 (5.7%) |
| 25 to 34 Years | 0 (0.0%) | 0 (0.0%) |
| 35 to 44 Years | 0 (0.0%) | 0 (0.0%) |
| 45 to 54 Years | 17 (1.8%) | 48 (4.5%) |
| 55 to 64 Years | 12 (1.6%) | 11 (1.6%) |
| 65 to 74 Years | 14 (5.4%) | 15 (6.0%) |
| 75 Years and over | 0 (0.0%) | 10 (12.0%) |
| Total | 58 (1.2%) | 106 (2.1%) |
Income Above Poverty by Sex and Age in Independent Hill
According to the poverty statistics in Independent Hill, males aged under 5 years and females aged under 5 years are the age groups that are most secure financially, with 100.0% of males and 100.0% of females in these age groups living above the poverty line.
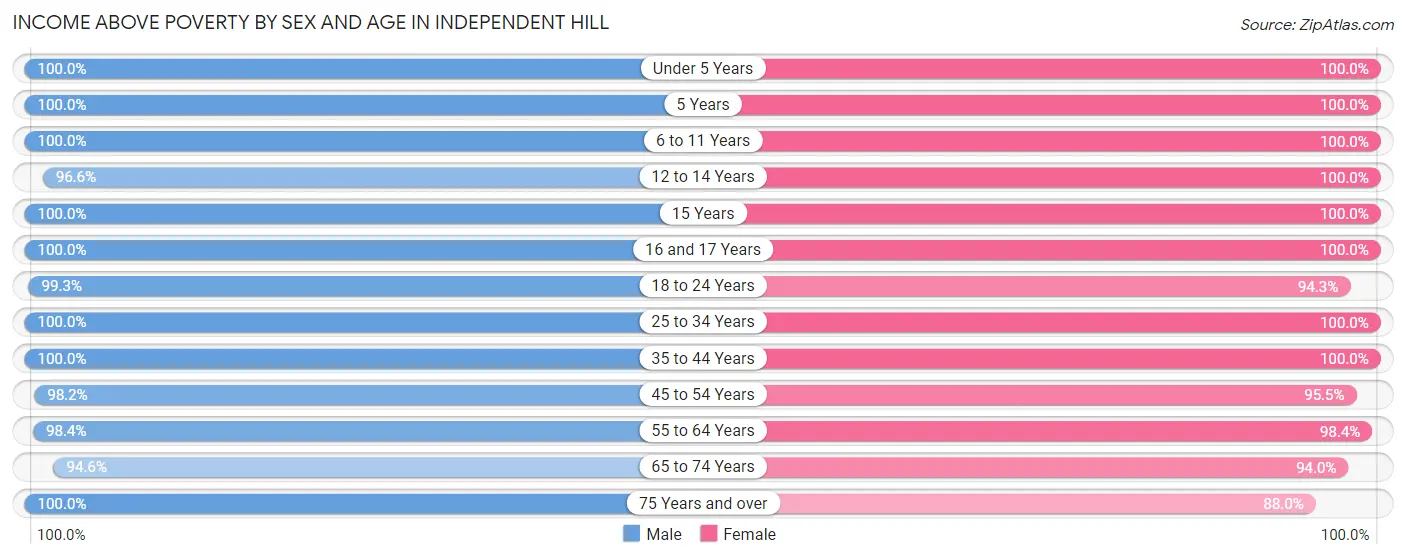
| Age Bracket | Male | Female |
| Under 5 Years | 296 (100.0%) | 205 (100.0%) |
| 5 Years | 31 (100.0%) | 36 (100.0%) |
| 6 to 11 Years | 404 (100.0%) | 498 (100.0%) |
| 12 to 14 Years | 372 (96.6%) | 170 (100.0%) |
| 15 Years | 65 (100.0%) | 67 (100.0%) |
| 16 and 17 Years | 224 (100.0%) | 191 (100.0%) |
| 18 to 24 Years | 264 (99.3%) | 367 (94.3%) |
| 25 to 34 Years | 553 (100.0%) | 735 (100.0%) |
| 35 to 44 Years | 512 (100.0%) | 595 (100.0%) |
| 45 to 54 Years | 920 (98.2%) | 1,016 (95.5%) |
| 55 to 64 Years | 754 (98.4%) | 695 (98.4%) |
| 65 to 74 Years | 246 (94.6%) | 235 (94.0%) |
| 75 Years and over | 139 (100.0%) | 73 (87.9%) |
| Total | 4,780 (98.8%) | 4,883 (97.9%) |
Income Below Poverty Among Married-Couple Families in Independent Hill
The poverty statistics for married-couple families in Independent Hill show that 1.4% or 36 of the total 2,505 families live below the poverty line. Families with 1 or 2 children have the highest poverty rate of 1.7%, comprising of 17 families. On the other hand, families with 3 or 4 children have the lowest poverty rate of 0.0%, which includes 0 families.
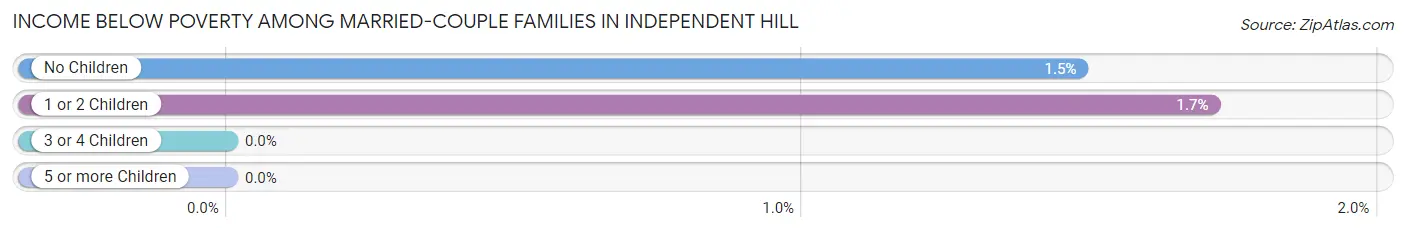
| Children | Above Poverty | Below Poverty |
| No Children | 1,269 (98.5%) | 19 (1.5%) |
| 1 or 2 Children | 975 (98.3%) | 17 (1.7%) |
| 3 or 4 Children | 225 (100.0%) | 0 (0.0%) |
| 5 or more Children | 0 (0.0%) | 0 (0.0%) |
| Total | 2,469 (98.6%) | 36 (1.4%) |
Income Below Poverty Among Single-Parent Households in Independent Hill
| Children | Single Father | Single Mother |
| No Children | 0 (0.0%) | 0 (0.0%) |
| 1 or 2 Children | 0 (0.0%) | 0 (0.0%) |
| 3 or 4 Children | 0 (0.0%) | 0 (0.0%) |
| 5 or more Children | 0 (0.0%) | 0 (0.0%) |
| Total | 0 (0.0%) | 0 (0.0%) |
Income Below Poverty Among Married-Couple vs Single-Parent Households in Independent Hill
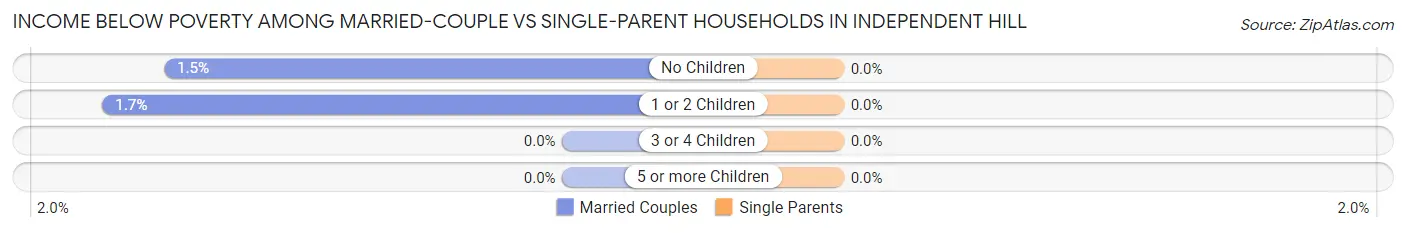
| Children | Married-Couple Families | Single-Parent Households |
| No Children | 19 (1.5%) | 0 (0.0%) |
| 1 or 2 Children | 17 (1.7%) | 0 (0.0%) |
| 3 or 4 Children | 0 (0.0%) | 0 (0.0%) |
| 5 or more Children | 0 (0.0%) | 0 (0.0%) |
| Total | 36 (1.4%) | 0 (0.0%) |
Race in Independent Hill
The most populous races in Independent Hill are White / Caucasian (6,120 | 62.1%), Hispanic or Latino (1,597 | 16.2%), and Black / African American (1,399 | 14.2%).
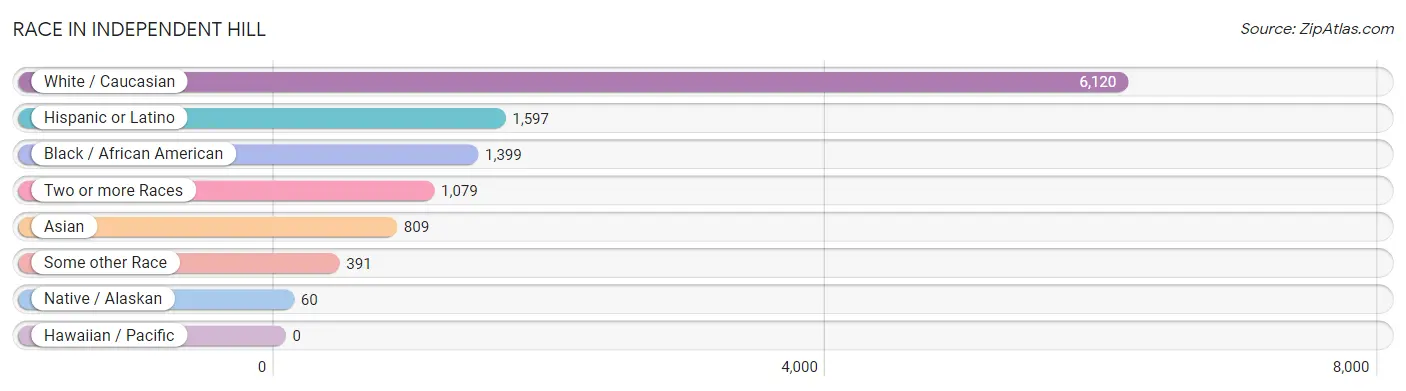
| Race | # Population | % Population |
| Asian | 809 | 8.2% |
| Black / African American | 1,399 | 14.2% |
| Hawaiian / Pacific | 0 | 0.0% |
| Hispanic or Latino | 1,597 | 16.2% |
| Native / Alaskan | 60 | 0.6% |
| White / Caucasian | 6,120 | 62.1% |
| Two or more Races | 1,079 | 11.0% |
| Some other Race | 391 | 4.0% |
| Total | 9,858 | 100.0% |
Ancestry in Independent Hill
The most populous ancestries reported in Independent Hill are German (1,673 | 17.0%), English (1,620 | 16.4%), Irish (1,333 | 13.5%), Mexican (670 | 6.8%), and Italian (521 | 5.3%), together accounting for 59.0% of all Independent Hill residents.
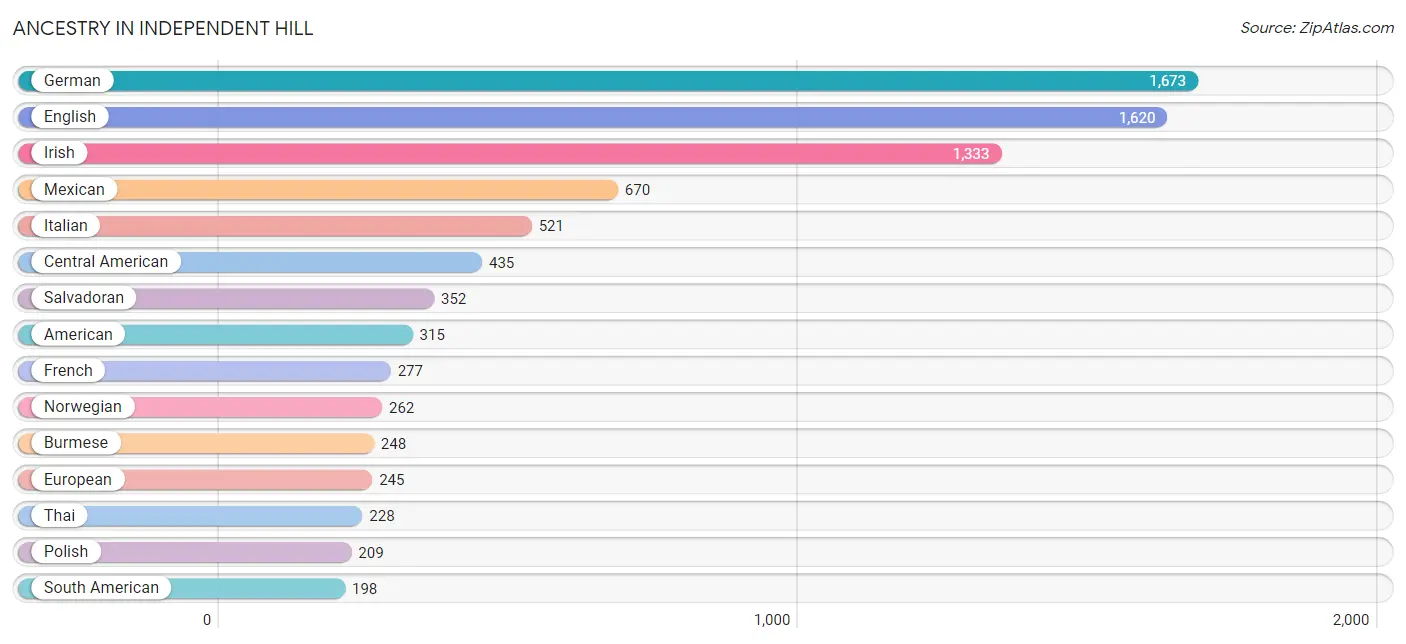
| Ancestry | # Population | % Population |
| Afghan | 104 | 1.1% |
| African | 51 | 0.5% |
| American | 315 | 3.2% |
| Arab | 29 | 0.3% |
| Austrian | 20 | 0.2% |
| Bhutanese | 80 | 0.8% |
| Bolivian | 124 | 1.3% |
| Brazilian | 16 | 0.2% |
| British | 84 | 0.9% |
| Burmese | 248 | 2.5% |
| Canadian | 36 | 0.4% |
| Central American | 435 | 4.4% |
| Central American Indian | 77 | 0.8% |
| Colombian | 18 | 0.2% |
| Croatian | 10 | 0.1% |
| Cuban | 4 | 0.0% |
| Czech | 76 | 0.8% |
| Danish | 6 | 0.1% |
| Dominican | 32 | 0.3% |
| Eastern European | 18 | 0.2% |
| English | 1,620 | 16.4% |
| European | 245 | 2.5% |
| Finnish | 17 | 0.2% |
| French | 277 | 2.8% |
| French Canadian | 8 | 0.1% |
| German | 1,673 | 17.0% |
| Ghanaian | 40 | 0.4% |
| Greek | 158 | 1.6% |
| Guatemalan | 21 | 0.2% |
| Honduran | 31 | 0.3% |
| Hungarian | 23 | 0.2% |
| Indian (Asian) | 104 | 1.1% |
| Irish | 1,333 | 13.5% |
| Italian | 521 | 5.3% |
| Korean | 150 | 1.5% |
| Lebanese | 19 | 0.2% |
| Lithuanian | 10 | 0.1% |
| Lumbee | 11 | 0.1% |
| Maltese | 19 | 0.2% |
| Mexican | 670 | 6.8% |
| Nicaraguan | 25 | 0.3% |
| Northern European | 79 | 0.8% |
| Norwegian | 262 | 2.7% |
| Pakistani | 17 | 0.2% |
| Palestinian | 8 | 0.1% |
| Panamanian | 6 | 0.1% |
| Peruvian | 56 | 0.6% |
| Polish | 209 | 2.1% |
| Portuguese | 96 | 1.0% |
| Puerto Rican | 180 | 1.8% |
| Russian | 27 | 0.3% |
| Salvadoran | 352 | 3.6% |
| Scandinavian | 56 | 0.6% |
| Scotch-Irish | 37 | 0.4% |
| Scottish | 56 | 0.6% |
| Slavic | 8 | 0.1% |
| Slovak | 80 | 0.8% |
| South American | 198 | 2.0% |
| Spaniard | 41 | 0.4% |
| Sri Lankan | 7 | 0.1% |
| Subsaharan African | 137 | 1.4% |
| Swedish | 130 | 1.3% |
| Thai | 228 | 2.3% |
| Ukrainian | 26 | 0.3% |
| Welsh | 7 | 0.1% |
| Yugoslavian | 6 | 0.1% | View All 66 Rows |
Immigrants in Independent Hill
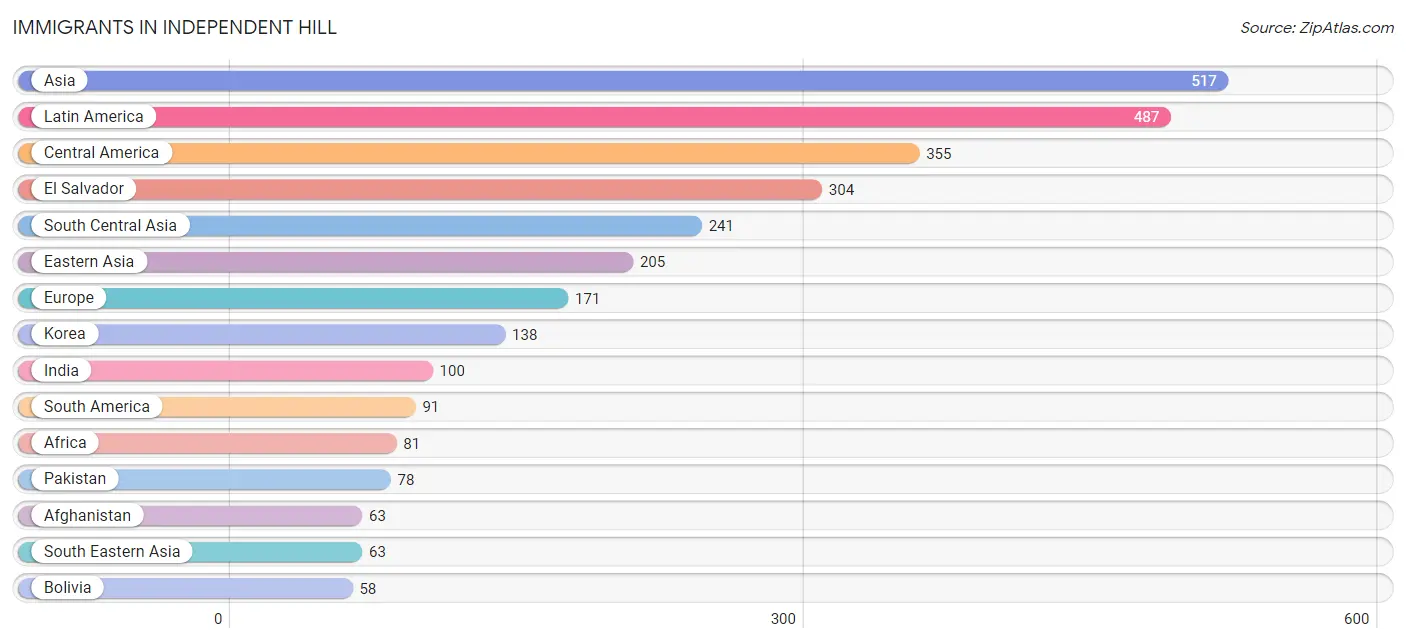
The most numerous immigrant groups reported in Independent Hill came from Asia (517 | 5.2%), Latin America (487 | 4.9%), Central America (355 | 3.6%), El Salvador (304 | 3.1%), and South Central Asia (241 | 2.4%), together accounting for 19.3% of all Independent Hill residents.
| Immigration Origin | # Population | % Population |
| Afghanistan | 63 | 0.6% |
| Africa | 81 | 0.8% |
| Asia | 517 | 5.2% |
| Austria | 10 | 0.1% |
| Barbados | 10 | 0.1% |
| Bolivia | 58 | 0.6% |
| Brazil | 15 | 0.2% |
| Canada | 24 | 0.2% |
| Caribbean | 41 | 0.4% |
| Central America | 355 | 3.6% |
| China | 51 | 0.5% |
| Colombia | 18 | 0.2% |
| Czechoslovakia | 3 | 0.0% |
| Eastern Africa | 35 | 0.4% |
| Eastern Asia | 205 | 2.1% |
| Eastern Europe | 36 | 0.4% |
| El Salvador | 304 | 3.1% |
| England | 38 | 0.4% |
| Europe | 171 | 1.7% |
| Germany | 44 | 0.4% |
| Ghana | 27 | 0.3% |
| Greece | 26 | 0.3% |
| Honduras | 1 | 0.0% |
| India | 100 | 1.0% |
| Japan | 16 | 0.2% |
| Jordan | 4 | 0.0% |
| Korea | 138 | 1.4% |
| Kuwait | 4 | 0.0% |
| Latin America | 487 | 4.9% |
| Mexico | 44 | 0.4% |
| Northern Africa | 2 | 0.0% |
| Northern Europe | 38 | 0.4% |
| Pakistan | 78 | 0.8% |
| Panama | 6 | 0.1% |
| Philippines | 39 | 0.4% |
| Poland | 18 | 0.2% |
| Russia | 15 | 0.2% |
| South America | 91 | 0.9% |
| South Central Asia | 241 | 2.4% |
| South Eastern Asia | 63 | 0.6% |
| Southern Europe | 43 | 0.4% |
| Spain | 17 | 0.2% |
| Thailand | 17 | 0.2% |
| Trinidad and Tobago | 31 | 0.3% |
| Uganda | 21 | 0.2% |
| Vietnam | 7 | 0.1% |
| Western Africa | 41 | 0.4% |
| Western Asia | 8 | 0.1% |
| Western Europe | 54 | 0.5% | View All 49 Rows |
Sex and Age in Independent Hill
Sex and Age in Independent Hill
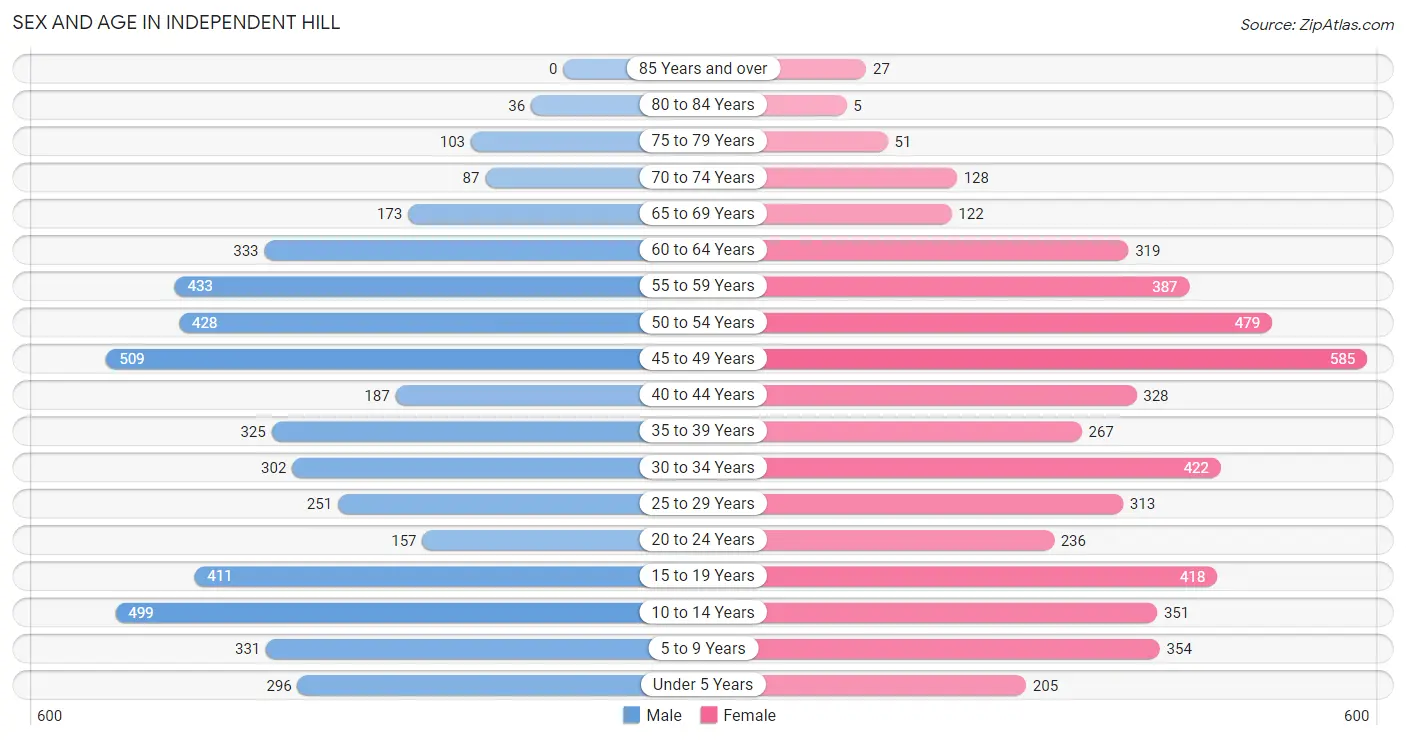
The most populous age groups in Independent Hill are 45 to 49 Years (509 | 10.5%) for men and 45 to 49 Years (585 | 11.7%) for women.
| Age Bracket | Male | Female |
| Under 5 Years | 296 (6.1%) | 205 (4.1%) |
| 5 to 9 Years | 331 (6.8%) | 354 (7.1%) |
| 10 to 14 Years | 499 (10.3%) | 351 (7.0%) |
| 15 to 19 Years | 411 (8.5%) | 418 (8.4%) |
| 20 to 24 Years | 157 (3.2%) | 236 (4.7%) |
| 25 to 29 Years | 251 (5.2%) | 313 (6.3%) |
| 30 to 34 Years | 302 (6.2%) | 422 (8.5%) |
| 35 to 39 Years | 325 (6.7%) | 267 (5.3%) |
| 40 to 44 Years | 187 (3.8%) | 328 (6.6%) |
| 45 to 49 Years | 509 (10.5%) | 585 (11.7%) |
| 50 to 54 Years | 428 (8.8%) | 479 (9.6%) |
| 55 to 59 Years | 433 (8.9%) | 387 (7.7%) |
| 60 to 64 Years | 333 (6.9%) | 319 (6.4%) |
| 65 to 69 Years | 173 (3.6%) | 122 (2.4%) |
| 70 to 74 Years | 87 (1.8%) | 128 (2.6%) |
| 75 to 79 Years | 103 (2.1%) | 51 (1.0%) |
| 80 to 84 Years | 36 (0.7%) | 5 (0.1%) |
| 85 Years and over | 0 (0.0%) | 27 (0.5%) |
| Total | 4,861 (100.0%) | 4,997 (100.0%) |
Families and Households in Independent Hill
Median Family Size in Independent Hill
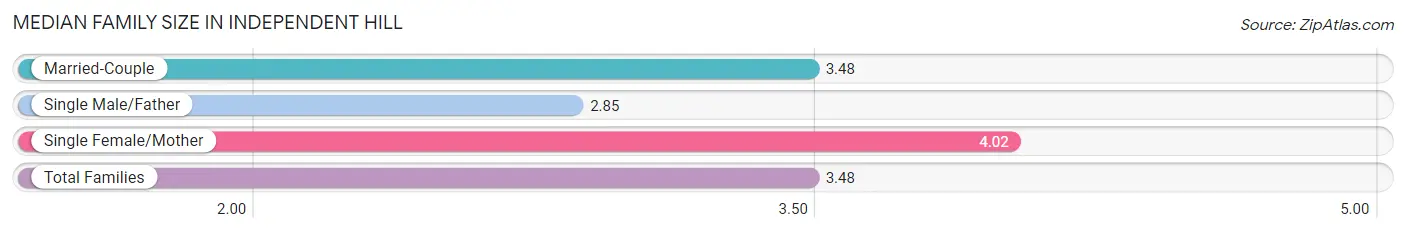
The median family size in Independent Hill is 3.48 persons per family, with single female/mother families (107 | 4.0%) accounting for the largest median family size of 4.02 persons per family. On the other hand, single male/father families (75 | 2.8%) represent the smallest median family size with 2.85 persons per family.
| Family Type | # Families | Family Size |
| Married-Couple | 2,505 (93.2%) | 3.48 |
| Single Male/Father | 75 (2.8%) | 2.85 |
| Single Female/Mother | 107 (4.0%) | 4.02 |
| Total Families | 2,687 (100.0%) | 3.48 |
Median Household Size in Independent Hill
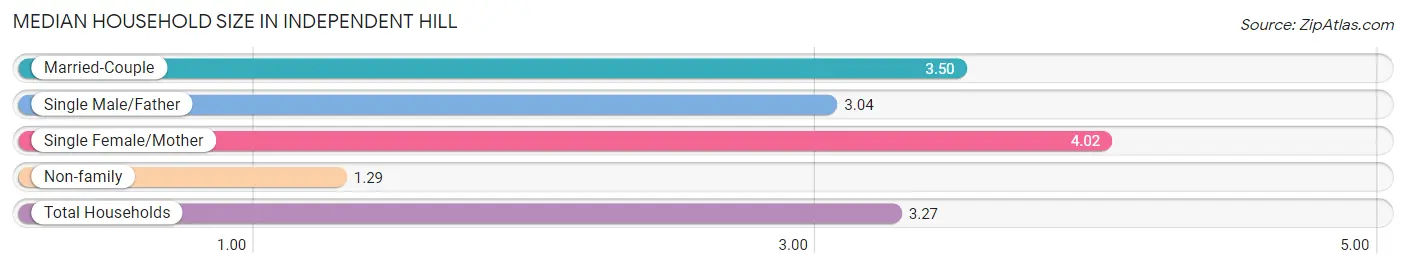
The median household size in Independent Hill is 3.27 persons per household, with single female/mother households (107 | 3.6%) accounting for the largest median household size of 4.02 persons per household. non-family households (316 | 10.5%) represent the smallest median household size with 1.29 persons per household.
| Household Type | # Households | Household Size |
| Married-Couple | 2,505 (83.4%) | 3.50 |
| Single Male/Father | 75 (2.5%) | 3.04 |
| Single Female/Mother | 107 (3.6%) | 4.02 |
| Non-family | 316 (10.5%) | 1.29 |
| Total Households | 3,003 (100.0%) | 3.27 |
Household Size by Marriage Status in Independent Hill
Out of a total of 3,003 households in Independent Hill, 2,687 (89.5%) are family households, while 316 (10.5%) are nonfamily households. The most numerous type of family households are 2-person households, comprising 925, and the most common type of nonfamily households are 1-person households, comprising 259.
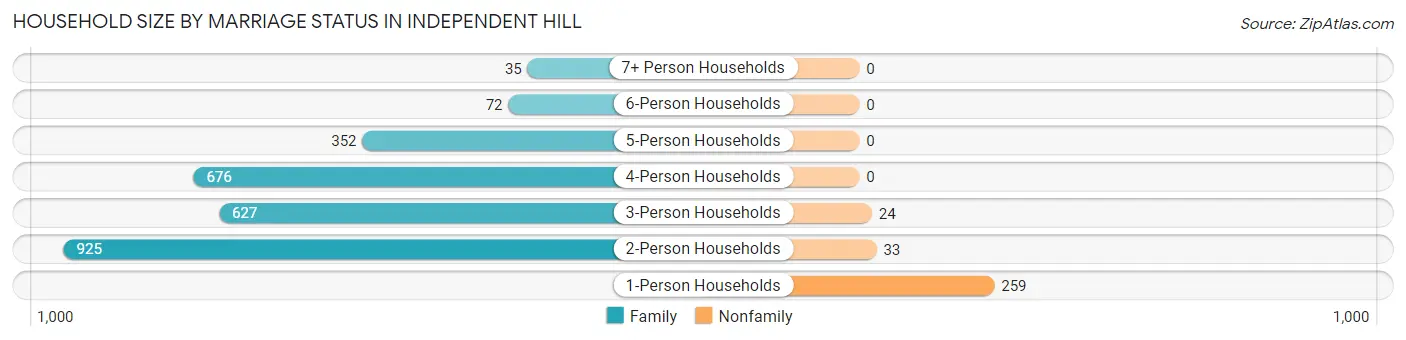
| Household Size | Family Households | Nonfamily Households |
| 1-Person Households | - | 259 (8.6%) |
| 2-Person Households | 925 (30.8%) | 33 (1.1%) |
| 3-Person Households | 627 (20.9%) | 24 (0.8%) |
| 4-Person Households | 676 (22.5%) | 0 (0.0%) |
| 5-Person Households | 352 (11.7%) | 0 (0.0%) |
| 6-Person Households | 72 (2.4%) | 0 (0.0%) |
| 7+ Person Households | 35 (1.2%) | 0 (0.0%) |
| Total | 2,687 (89.5%) | 316 (10.5%) |
Female Fertility in Independent Hill
Fertility by Age in Independent Hill
Average fertility rate in Independent Hill is 30.0 births per 1,000 women. Women in the age bracket of 20 to 34 years have the highest fertility rate with 47.0 births per 1,000 women. Women in the age bracket of 20 to 34 years acount for 57.5% of all women with births.
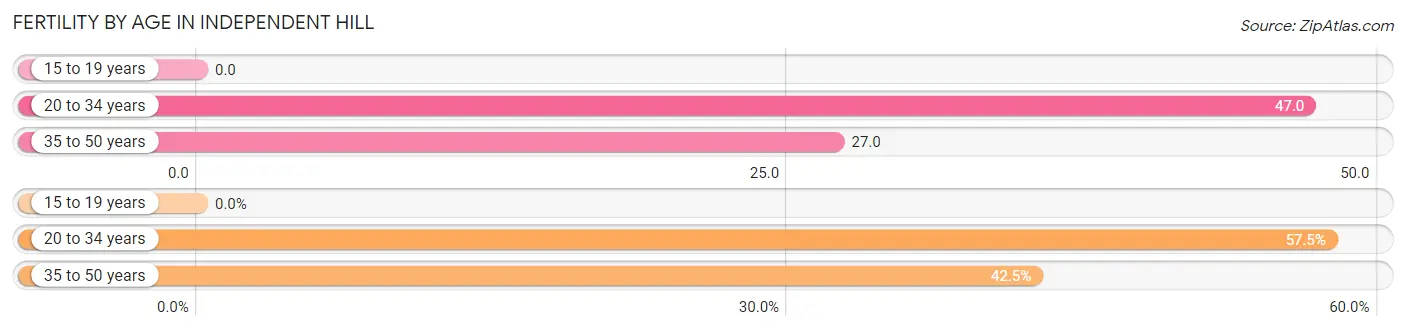
| Age Bracket | Women with Births | Births / 1,000 Women |
| 15 to 19 years | 0 (0.0%) | 0.0 |
| 20 to 34 years | 46 (57.5%) | 47.0 |
| 35 to 50 years | 34 (42.5%) | 27.0 |
| Total | 80 (100.0%) | 30.0 |
Fertility by Age by Marriage Status in Independent Hill
56.2% of women with births (80) in Independent Hill are married. The highest percentage of unmarried women with births falls into 20 to 34 years age bracket with 76.1% of them unmarried at the time of birth, while the lowest percentage of unmarried women with births belong to 35 to 50 years age bracket with 0.0% of them unmarried.
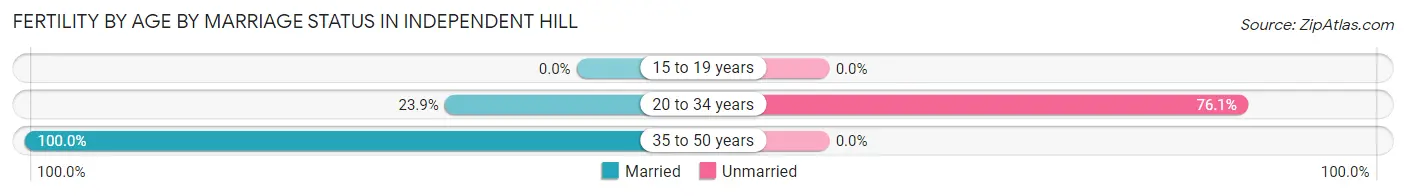
| Age Bracket | Married | Unmarried |
| 15 to 19 years | 0 (0.0%) | 0 (0.0%) |
| 20 to 34 years | 11 (23.9%) | 35 (76.1%) |
| 35 to 50 years | 34 (100.0%) | 0 (0.0%) |
| Total | 45 (56.2%) | 35 (43.8%) |
Fertility by Education in Independent Hill
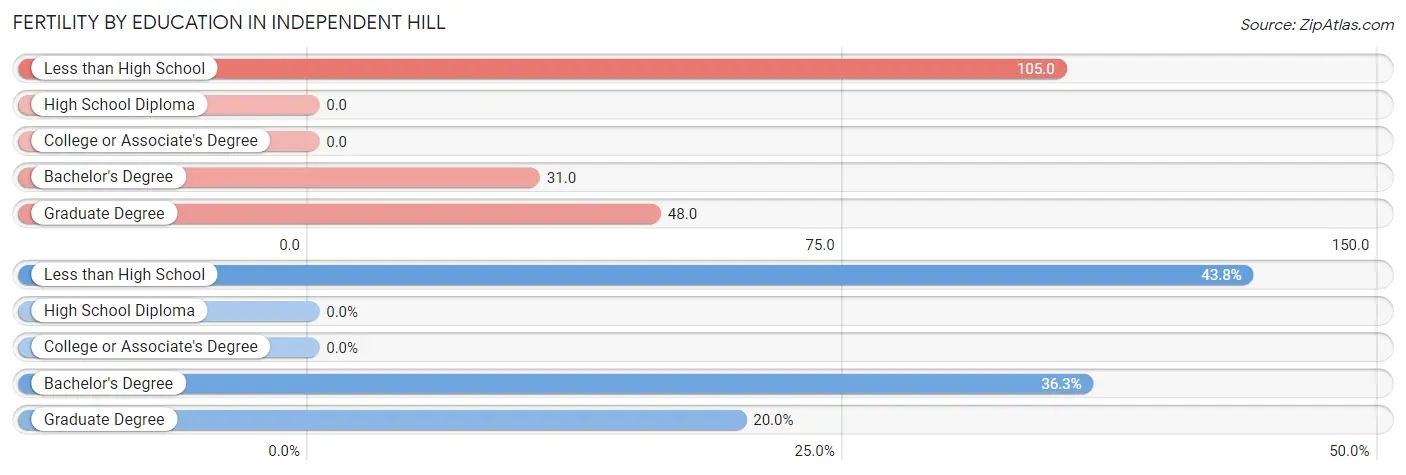
| Educational Attainment | Women with Births | Births / 1,000 Women |
| Less than High School | 35 (43.8%) | 105.0 |
| High School Diploma | 0 (0.0%) | 0.0 |
| College or Associate's Degree | 0 (0.0%) | 0.0 |
| Bachelor's Degree | 29 (36.2%) | 31.0 |
| Graduate Degree | 16 (20.0%) | 48.0 |
| Total | 80 (100.0%) | 30.0 |
Fertility by Education by Marriage Status in Independent Hill
43.8% of women with births in Independent Hill are unmarried. Women with the educational attainment of bachelor's degree are most likely to be married with 100.0% of them married at childbirth, while women with the educational attainment of less than high school are least likely to be married with 100.0% of them unmarried at childbirth.
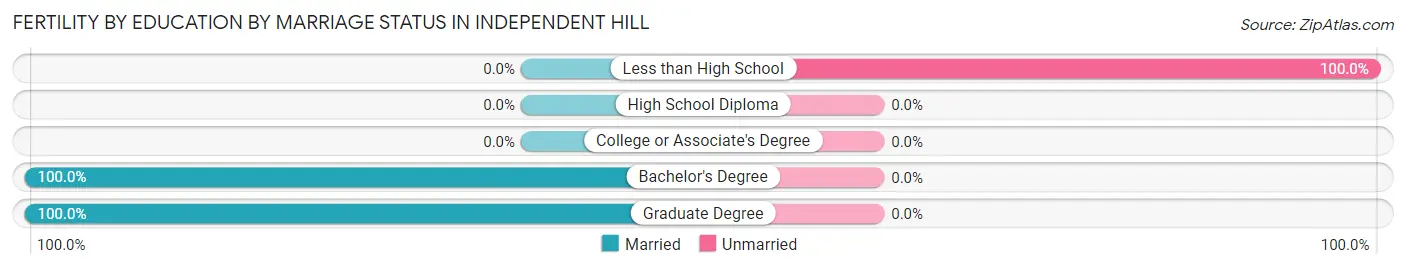
| Educational Attainment | Married | Unmarried |
| Less than High School | 0 (0.0%) | 35 (100.0%) |
| High School Diploma | 0 (0.0%) | 0 (0.0%) |
| College or Associate's Degree | 0 (0.0%) | 0 (0.0%) |
| Bachelor's Degree | 29 (100.0%) | 0 (0.0%) |
| Graduate Degree | 16 (100.0%) | 0 (0.0%) |
| Total | 45 (56.2%) | 35 (43.8%) |
Employment Characteristics in Independent Hill
Employment by Class of Employer in Independent Hill
Among the 5,350 employed individuals in Independent Hill, private company employees (2,703 | 50.5%), federal government employees (1,182 | 22.1%), and local government employees (520 | 9.7%) make up the most common classes of employment.
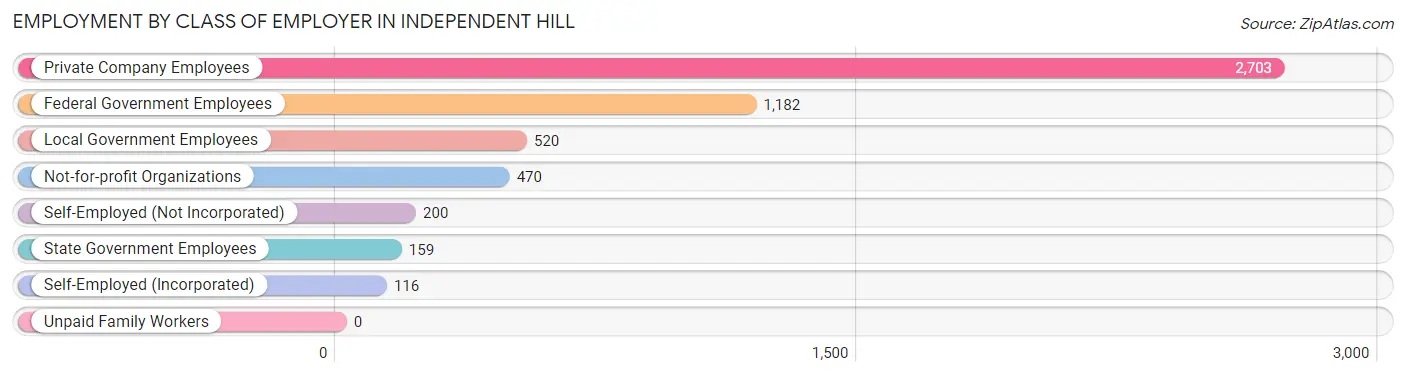
| Employer Class | # Employees | % Employees |
| Private Company Employees | 2,703 | 50.5% |
| Self-Employed (Incorporated) | 116 | 2.2% |
| Self-Employed (Not Incorporated) | 200 | 3.7% |
| Not-for-profit Organizations | 470 | 8.8% |
| Local Government Employees | 520 | 9.7% |
| State Government Employees | 159 | 3.0% |
| Federal Government Employees | 1,182 | 22.1% |
| Unpaid Family Workers | 0 | 0.0% |
| Total | 5,350 | 100.0% |
Employment Status by Age in Independent Hill
According to the labor force statistics for Independent Hill, out of the total population over 16 years of age (7,690), 72.3% or 5,560 individuals are in the labor force, with 3.6% or 200 of them unemployed. The age group with the highest labor force participation rate is 25 to 29 years, with 92.7% or 523 individuals in the labor force. Within the labor force, the 16 to 19 years age range has the highest percentage of unemployed individuals, with 21.8% or 41 of them being unemployed.
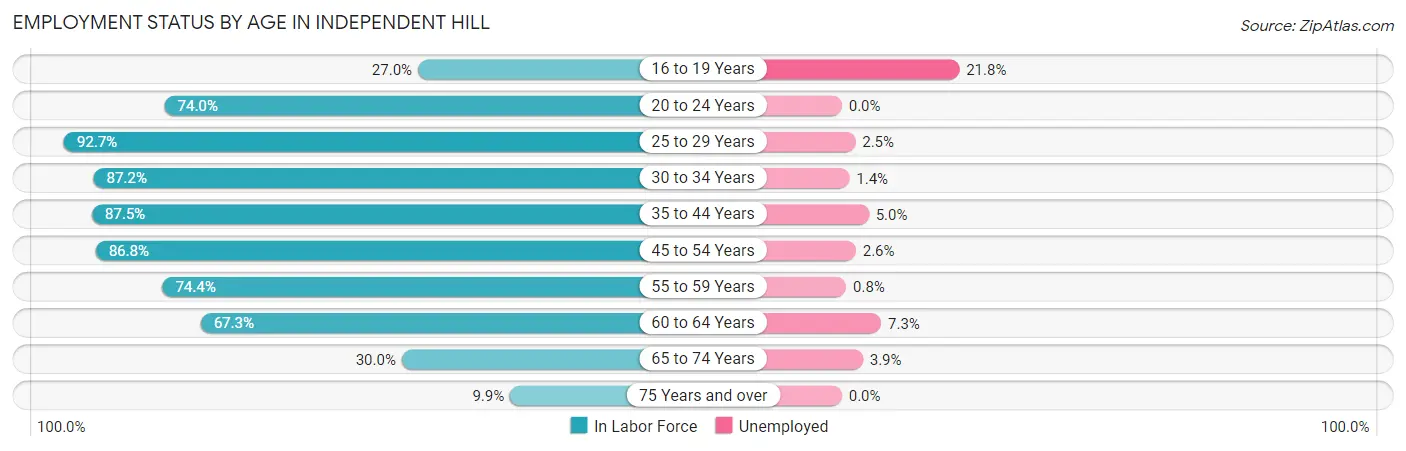
| Age Bracket | In Labor Force | Unemployed |
| 16 to 19 Years | 188 (27.0%) | 41 (21.8%) |
| 20 to 24 Years | 291 (74.0%) | 0 (0.0%) |
| 25 to 29 Years | 523 (92.7%) | 13 (2.5%) |
| 30 to 34 Years | 631 (87.2%) | 9 (1.4%) |
| 35 to 44 Years | 969 (87.5%) | 48 (5.0%) |
| 45 to 54 Years | 1,737 (86.8%) | 45 (2.6%) |
| 55 to 59 Years | 610 (74.4%) | 5 (0.8%) |
| 60 to 64 Years | 439 (67.3%) | 32 (7.3%) |
| 65 to 74 Years | 153 (30.0%) | 6 (3.9%) |
| 75 Years and over | 22 (9.9%) | 0 (0.0%) |
| Total | 5,560 (72.3%) | 200 (3.6%) |
Employment Status by Educational Attainment in Independent Hill
According to labor force statistics for Independent Hill, 83.6% of individuals (4,906) out of the total population between 25 and 64 years of age (5,868) are in the labor force, with 3.1% or 152 of them being unemployed. The group with the highest labor force participation rate are those with the educational attainment of bachelor's degree or higher, with 87.3% or 2,927 individuals in the labor force. Within the labor force, individuals with less than high school education have the highest percentage of unemployment, with 59.2% or 42 of them being unemployed.
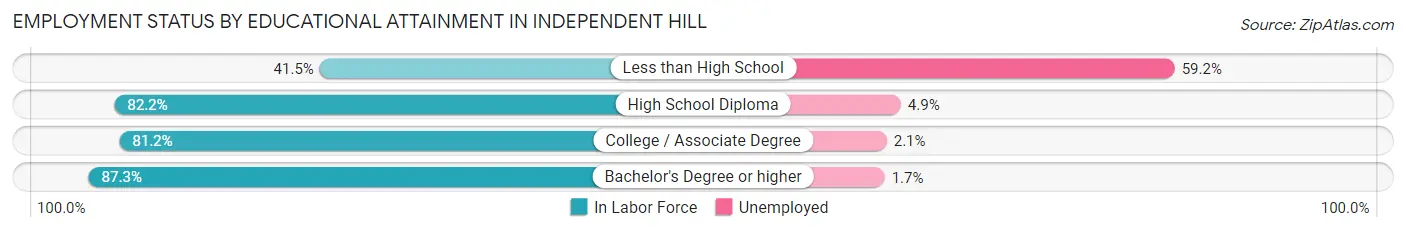
| Educational Attainment | In Labor Force | Unemployed |
| Less than High School | 71 (41.5%) | 101 (59.2%) |
| High School Diploma | 655 (82.2%) | 39 (4.9%) |
| College / Associate Degree | 1,256 (81.2%) | 32 (2.1%) |
| Bachelor's Degree or higher | 2,927 (87.3%) | 57 (1.7%) |
| Total | 4,906 (83.6%) | 182 (3.1%) |
Employment Occupations by Sex in Independent Hill
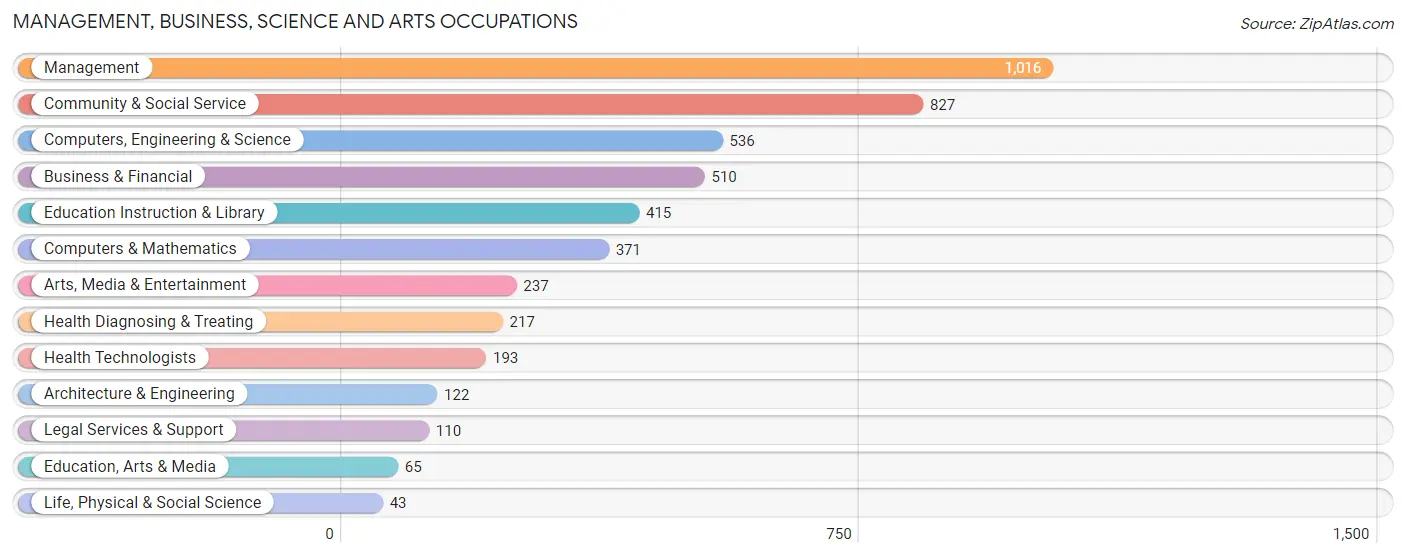
Management, Business, Science and Arts Occupations
The most common Management, Business, Science and Arts occupations in Independent Hill are Management (1,016 | 19.3%), Community & Social Service (827 | 15.7%), Computers, Engineering & Science (536 | 10.2%), Business & Financial (510 | 9.7%), and Education Instruction & Library (415 | 7.9%).
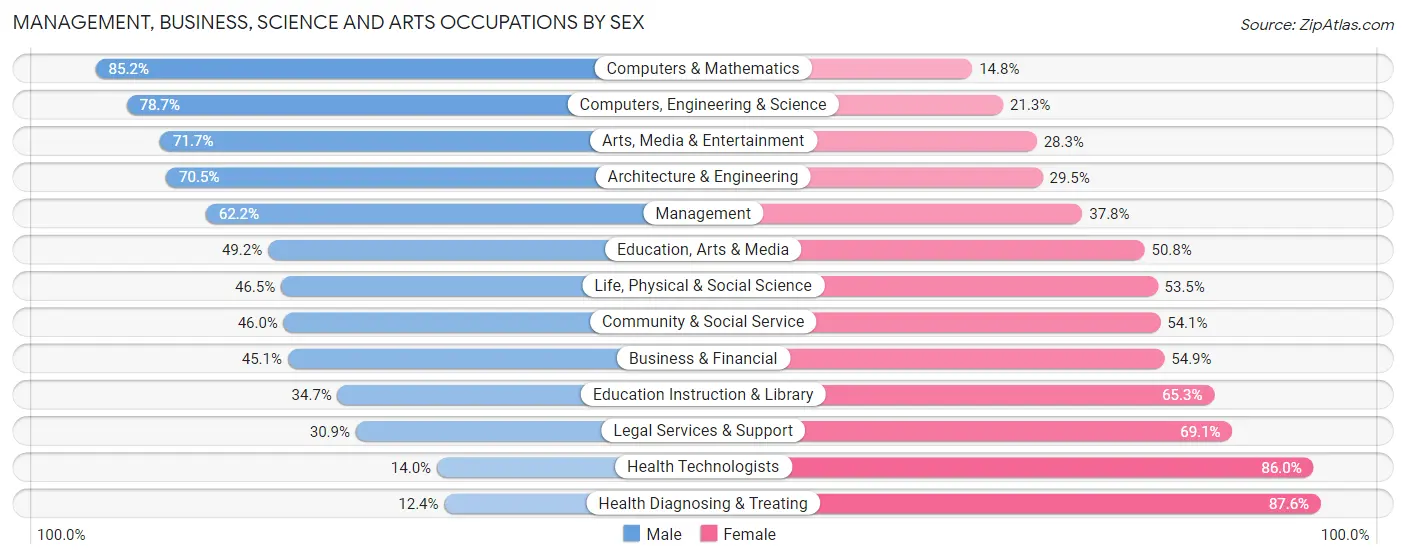
Management, Business, Science and Arts Occupations by Sex
Within the Management, Business, Science and Arts occupations in Independent Hill, the most male-oriented occupations are Computers & Mathematics (85.2%), Computers, Engineering & Science (78.7%), and Arts, Media & Entertainment (71.7%), while the most female-oriented occupations are Health Diagnosing & Treating (87.6%), Health Technologists (86.0%), and Legal Services & Support (69.1%).
| Occupation | Male | Female |
| Management | 632 (62.2%) | 384 (37.8%) |
| Business & Financial | 230 (45.1%) | 280 (54.9%) |
| Computers, Engineering & Science | 422 (78.7%) | 114 (21.3%) |
| Computers & Mathematics | 316 (85.2%) | 55 (14.8%) |
| Architecture & Engineering | 86 (70.5%) | 36 (29.5%) |
| Life, Physical & Social Science | 20 (46.5%) | 23 (53.5%) |
| Community & Social Service | 380 (46.0%) | 447 (54.0%) |
| Education, Arts & Media | 32 (49.2%) | 33 (50.8%) |
| Legal Services & Support | 34 (30.9%) | 76 (69.1%) |
| Education Instruction & Library | 144 (34.7%) | 271 (65.3%) |
| Arts, Media & Entertainment | 170 (71.7%) | 67 (28.3%) |
| Health Diagnosing & Treating | 27 (12.4%) | 190 (87.6%) |
| Health Technologists | 27 (14.0%) | 166 (86.0%) |
| Total (Category) | 1,691 (54.4%) | 1,415 (45.6%) |
| Total (Overall) | 2,742 (52.1%) | 2,520 (47.9%) |
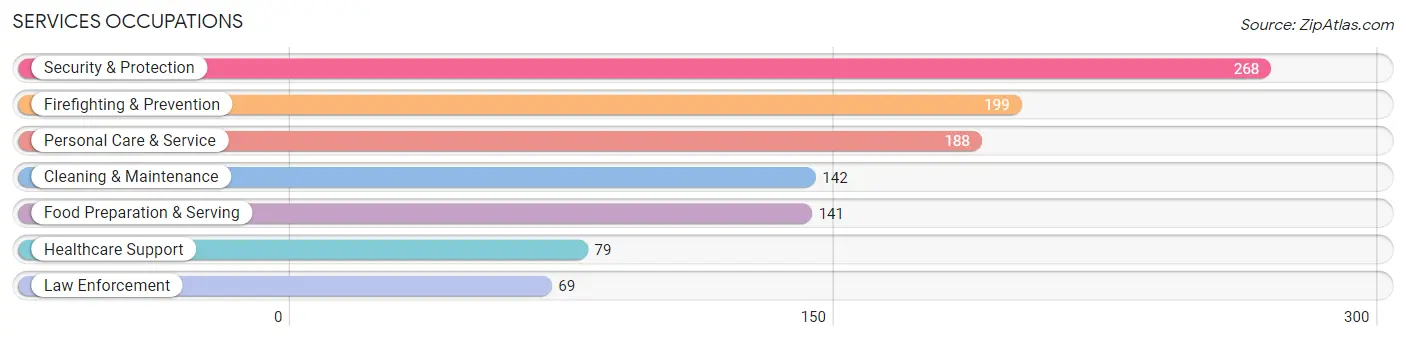
Services Occupations
The most common Services occupations in Independent Hill are Security & Protection (268 | 5.1%), Firefighting & Prevention (199 | 3.8%), Personal Care & Service (188 | 3.6%), Cleaning & Maintenance (142 | 2.7%), and Food Preparation & Serving (141 | 2.7%).
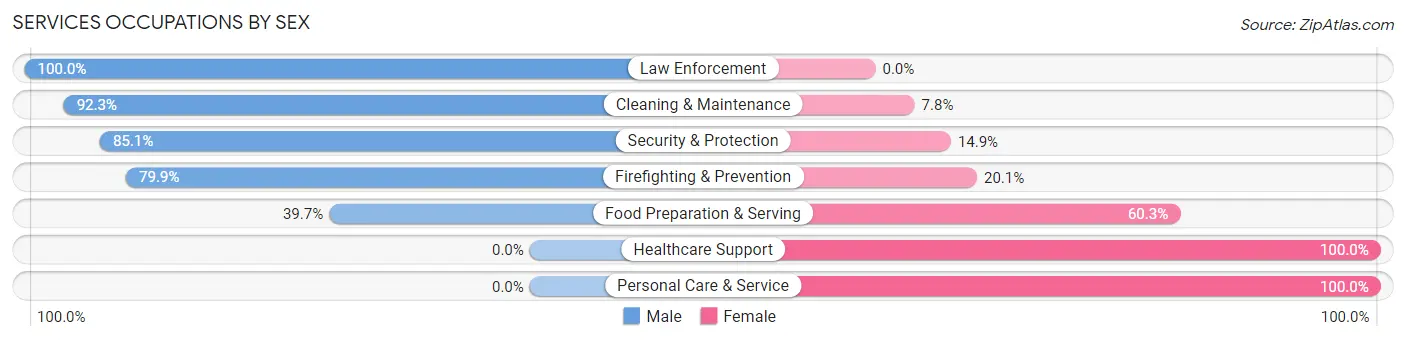
Services Occupations by Sex
Within the Services occupations in Independent Hill, the most male-oriented occupations are Law Enforcement (100.0%), Cleaning & Maintenance (92.2%), and Security & Protection (85.1%), while the most female-oriented occupations are Healthcare Support (100.0%), Personal Care & Service (100.0%), and Food Preparation & Serving (60.3%).
| Occupation | Male | Female |
| Healthcare Support | 0 (0.0%) | 79 (100.0%) |
| Security & Protection | 228 (85.1%) | 40 (14.9%) |
| Firefighting & Prevention | 159 (79.9%) | 40 (20.1%) |
| Law Enforcement | 69 (100.0%) | 0 (0.0%) |
| Food Preparation & Serving | 56 (39.7%) | 85 (60.3%) |
| Cleaning & Maintenance | 131 (92.2%) | 11 (7.7%) |
| Personal Care & Service | 0 (0.0%) | 188 (100.0%) |
| Total (Category) | 415 (50.7%) | 403 (49.3%) |
| Total (Overall) | 2,742 (52.1%) | 2,520 (47.9%) |
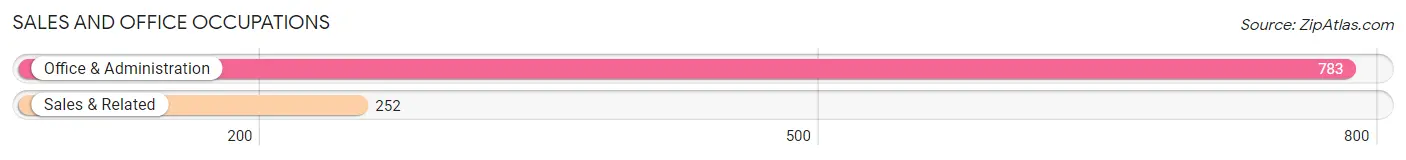
Sales and Office Occupations
The most common Sales and Office occupations in Independent Hill are Office & Administration (783 | 14.9%), and Sales & Related (252 | 4.8%).
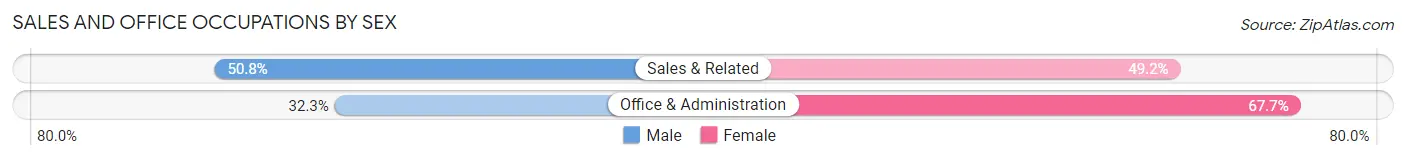
Sales and Office Occupations by Sex
| Occupation | Male | Female |
| Sales & Related | 128 (50.8%) | 124 (49.2%) |
| Office & Administration | 253 (32.3%) | 530 (67.7%) |
| Total (Category) | 381 (36.8%) | 654 (63.2%) |
| Total (Overall) | 2,742 (52.1%) | 2,520 (47.9%) |
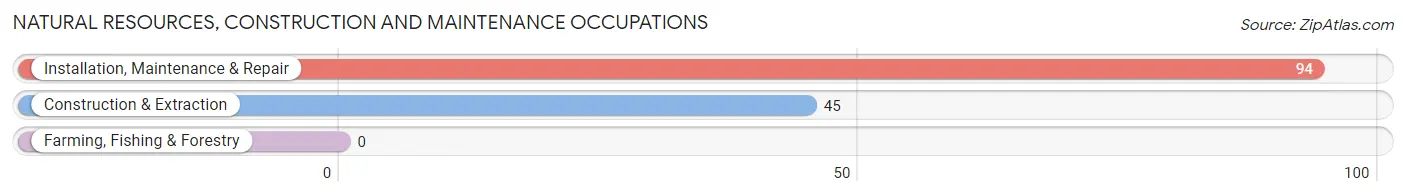
Natural Resources, Construction and Maintenance Occupations
The most common Natural Resources, Construction and Maintenance occupations in Independent Hill are Installation, Maintenance & Repair (94 | 1.8%), and Construction & Extraction (45 | 0.9%).
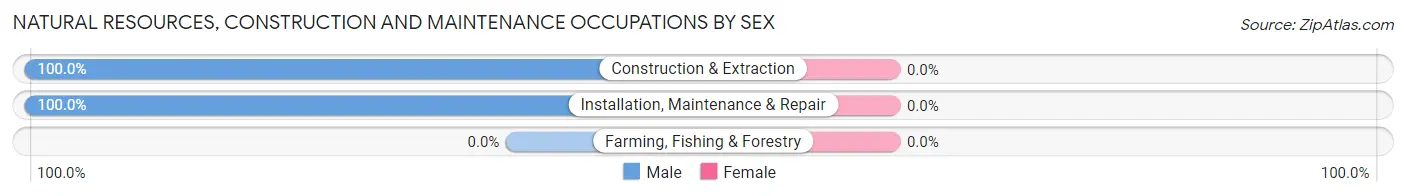
Natural Resources, Construction and Maintenance Occupations by Sex
| Occupation | Male | Female |
| Farming, Fishing & Forestry | 0 (0.0%) | 0 (0.0%) |
| Construction & Extraction | 45 (100.0%) | 0 (0.0%) |
| Installation, Maintenance & Repair | 94 (100.0%) | 0 (0.0%) |
| Total (Category) | 139 (100.0%) | 0 (0.0%) |
| Total (Overall) | 2,742 (52.1%) | 2,520 (47.9%) |
Production, Transportation and Moving Occupations
The most common Production, Transportation and Moving occupations in Independent Hill are Transportation (89 | 1.7%), Production (60 | 1.1%), and Material Moving (15 | 0.3%).
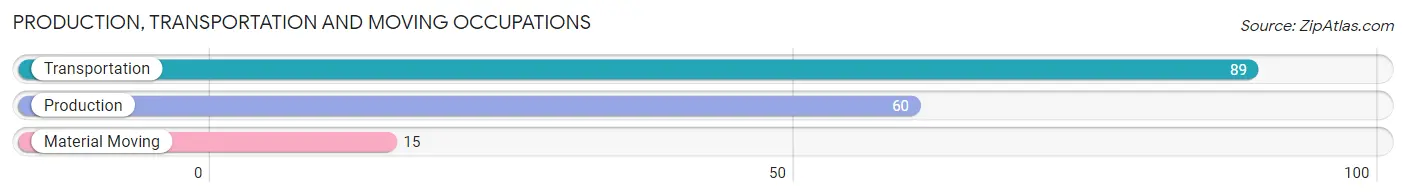
Production, Transportation and Moving Occupations by Sex
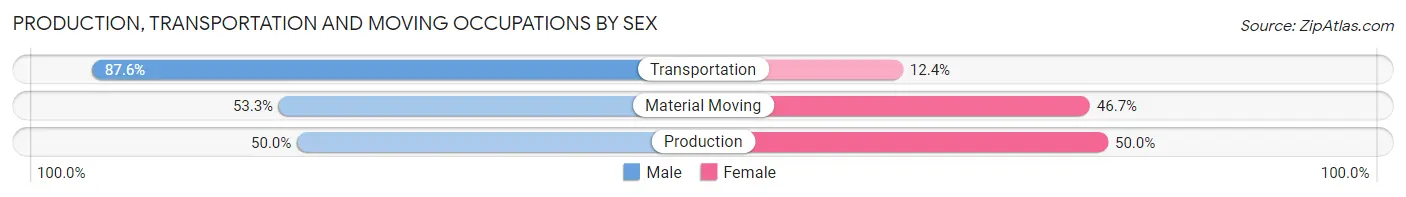
| Occupation | Male | Female |
| Production | 30 (50.0%) | 30 (50.0%) |
| Transportation | 78 (87.6%) | 11 (12.4%) |
| Material Moving | 8 (53.3%) | 7 (46.7%) |
| Total (Category) | 116 (70.7%) | 48 (29.3%) |
| Total (Overall) | 2,742 (52.1%) | 2,520 (47.9%) |
Employment Industries by Sex in Independent Hill
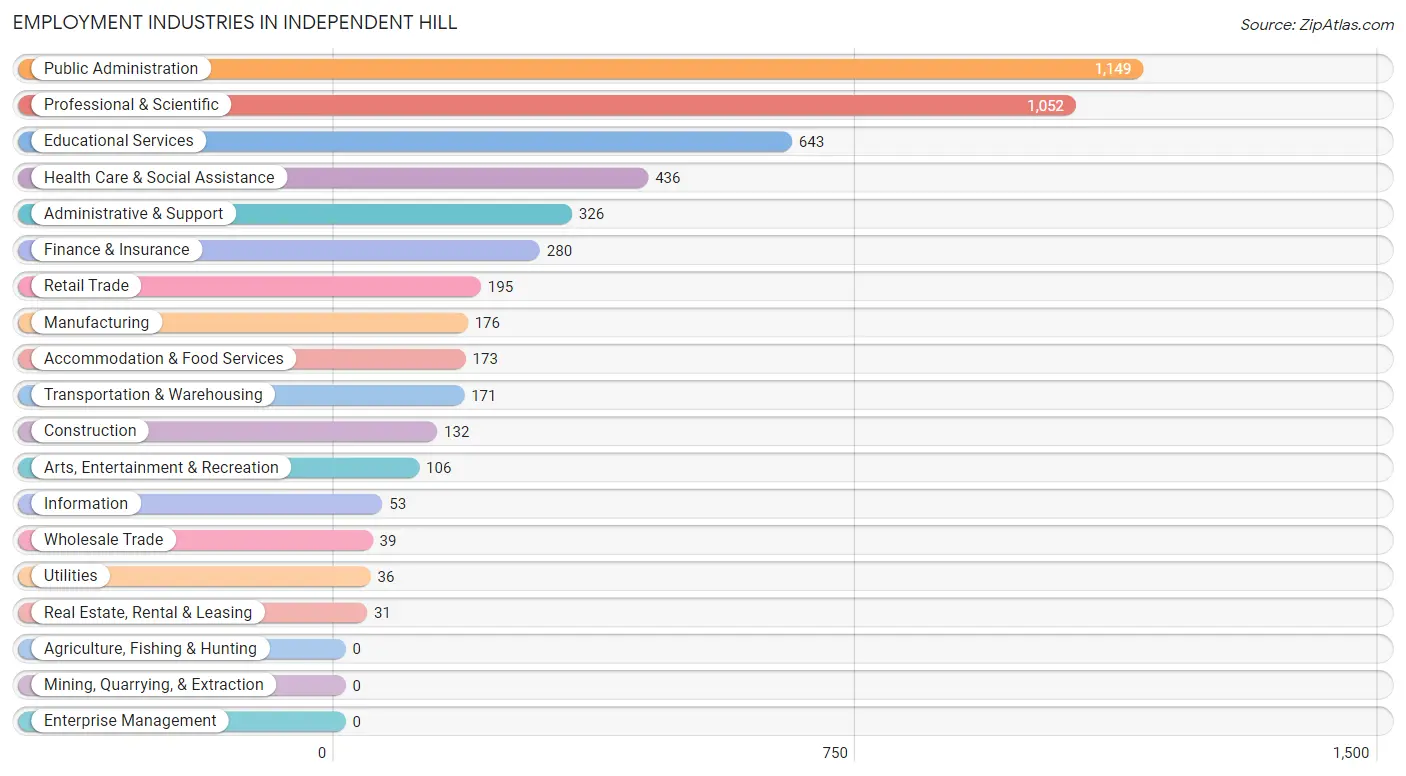
Employment Industries in Independent Hill
The major employment industries in Independent Hill include Public Administration (1,149 | 21.8%), Professional & Scientific (1,052 | 20.0%), Educational Services (643 | 12.2%), Health Care & Social Assistance (436 | 8.3%), and Administrative & Support (326 | 6.2%).
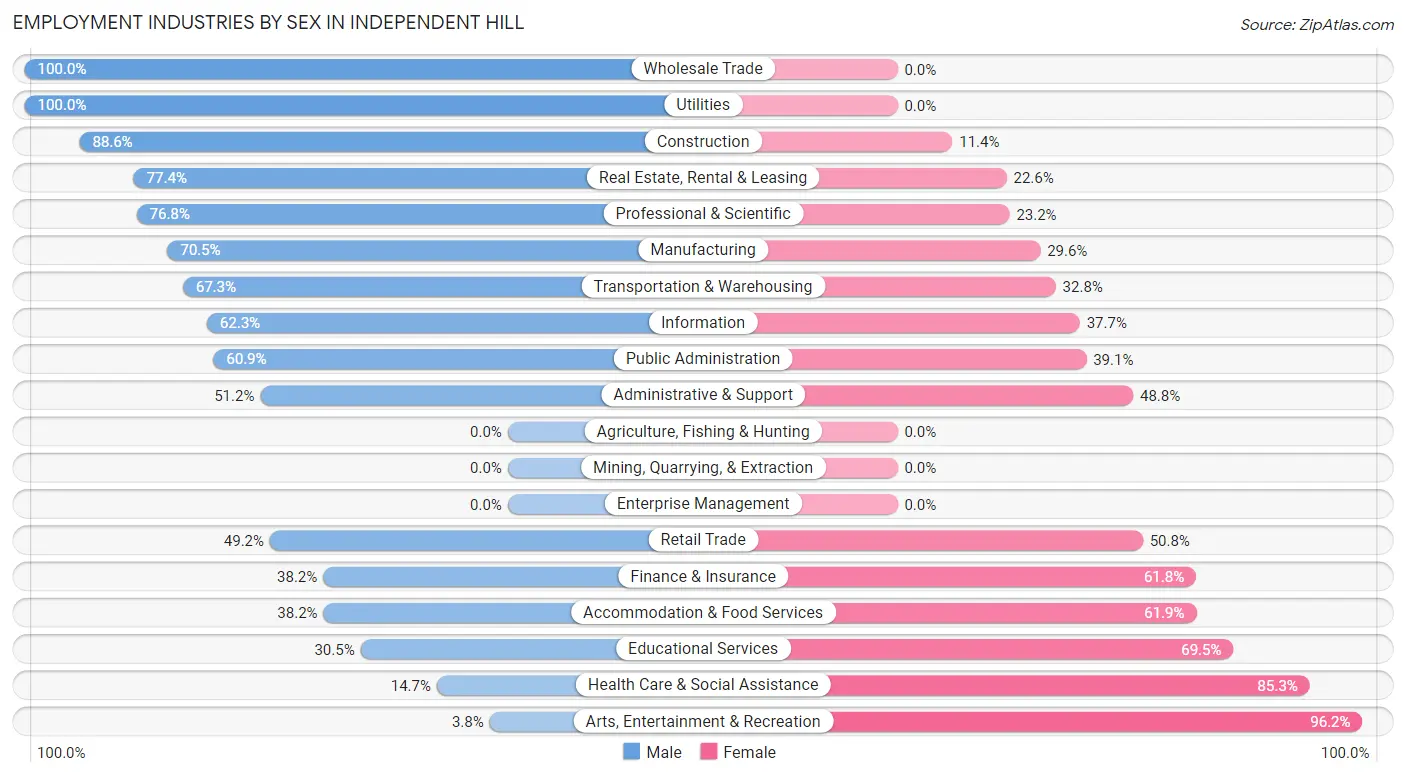
Employment Industries by Sex in Independent Hill
The Independent Hill industries that see more men than women are Wholesale Trade (100.0%), Utilities (100.0%), and Construction (88.6%), whereas the industries that tend to have a higher number of women are Arts, Entertainment & Recreation (96.2%), Health Care & Social Assistance (85.3%), and Educational Services (69.5%).
| Industry | Male | Female |
| Agriculture, Fishing & Hunting | 0 (0.0%) | 0 (0.0%) |
| Mining, Quarrying, & Extraction | 0 (0.0%) | 0 (0.0%) |
| Construction | 117 (88.6%) | 15 (11.4%) |
| Manufacturing | 124 (70.5%) | 52 (29.5%) |
| Wholesale Trade | 39 (100.0%) | 0 (0.0%) |
| Retail Trade | 96 (49.2%) | 99 (50.8%) |
| Transportation & Warehousing | 115 (67.2%) | 56 (32.8%) |
| Utilities | 36 (100.0%) | 0 (0.0%) |
| Information | 33 (62.3%) | 20 (37.7%) |
| Finance & Insurance | 107 (38.2%) | 173 (61.8%) |
| Real Estate, Rental & Leasing | 24 (77.4%) | 7 (22.6%) |
| Professional & Scientific | 808 (76.8%) | 244 (23.2%) |
| Enterprise Management | 0 (0.0%) | 0 (0.0%) |
| Administrative & Support | 167 (51.2%) | 159 (48.8%) |
| Educational Services | 196 (30.5%) | 447 (69.5%) |
| Health Care & Social Assistance | 64 (14.7%) | 372 (85.3%) |
| Arts, Entertainment & Recreation | 4 (3.8%) | 102 (96.2%) |
| Accommodation & Food Services | 66 (38.2%) | 107 (61.9%) |
| Public Administration | 700 (60.9%) | 449 (39.1%) |
| Total | 2,742 (52.1%) | 2,520 (47.9%) |
Education in Independent Hill
School Enrollment in Independent Hill
The most common levels of schooling among the 2,757 students in Independent Hill are middle school (741 | 26.9%), high school (627 | 22.7%), and elementary school (595 | 21.6%).
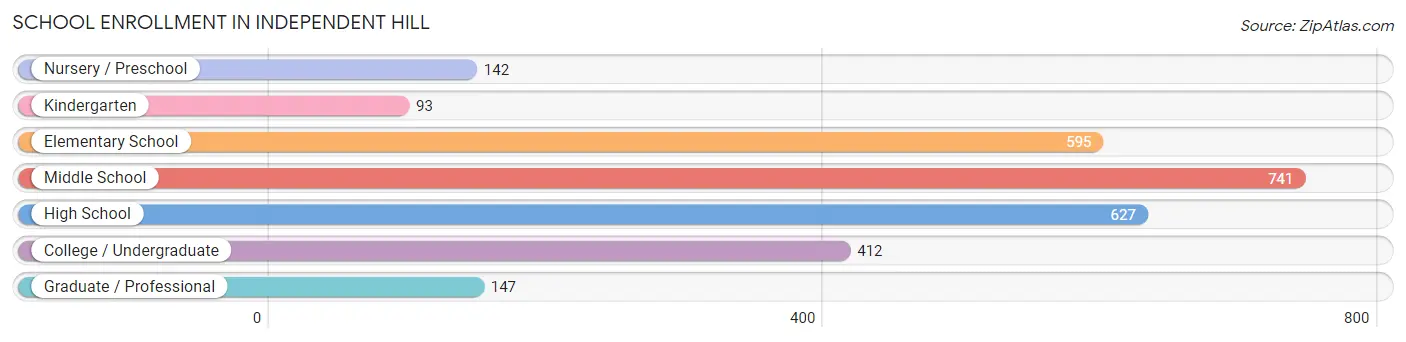
| School Level | # Students | % Students |
| Nursery / Preschool | 142 | 5.1% |
| Kindergarten | 93 | 3.4% |
| Elementary School | 595 | 21.6% |
| Middle School | 741 | 26.9% |
| High School | 627 | 22.7% |
| College / Undergraduate | 412 | 14.9% |
| Graduate / Professional | 147 | 5.3% |
| Total | 2,757 | 100.0% |
School Enrollment by Age by Funding Source in Independent Hill
Out of a total of 2,757 students who are enrolled in schools in Independent Hill, 777 (28.2%) attend a private institution, while the remaining 1,980 (71.8%) are enrolled in public schools. The age group of 3 to 4 year olds has the highest likelihood of being enrolled in private schools, with 96 (67.6% in the age bracket) enrolled. Conversely, the age group of 25 to 34 year olds has the lowest likelihood of being enrolled in a private school, with 47 (90.4% in the age bracket) attending a public institution.
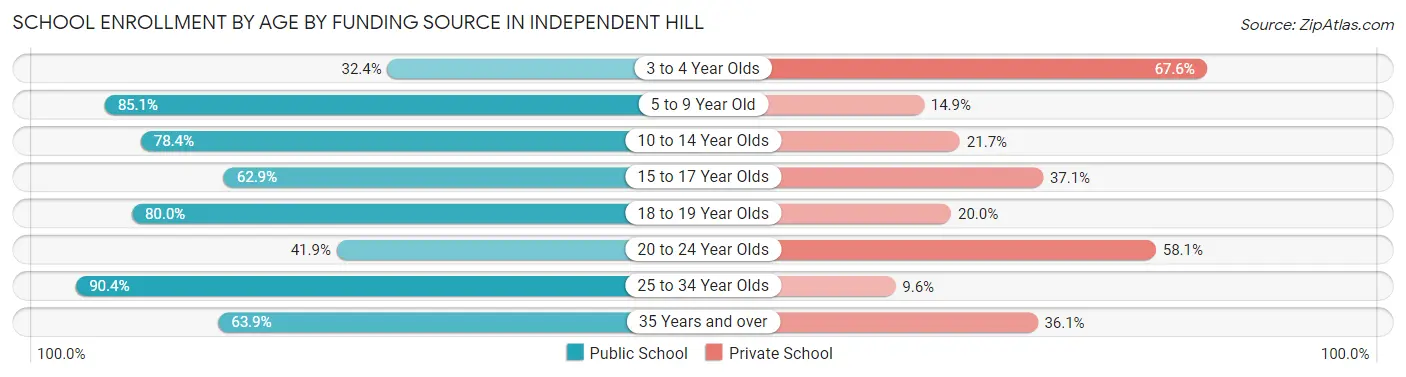
| Age Bracket | Public School | Private School |
| 3 to 4 Year Olds | 46 (32.4%) | 96 (67.6%) |
| 5 to 9 Year Old | 547 (85.1%) | 96 (14.9%) |
| 10 to 14 Year Olds | 666 (78.3%) | 184 (21.6%) |
| 15 to 17 Year Olds | 349 (62.9%) | 206 (37.1%) |
| 18 to 19 Year Olds | 168 (80.0%) | 42 (20.0%) |
| 20 to 24 Year Olds | 72 (41.9%) | 100 (58.1%) |
| 25 to 34 Year Olds | 47 (90.4%) | 5 (9.6%) |
| 35 Years and over | 85 (63.9%) | 48 (36.1%) |
| Total | 1,980 (71.8%) | 777 (28.2%) |
Educational Attainment by Field of Study in Independent Hill
Business (947 | 23.8%), arts & humanities (403 | 10.1%), education (365 | 9.2%), social sciences (301 | 7.6%), and visual & performing arts (268 | 6.7%) are the most common fields of study among 3,979 individuals in Independent Hill who have obtained a bachelor's degree or higher.
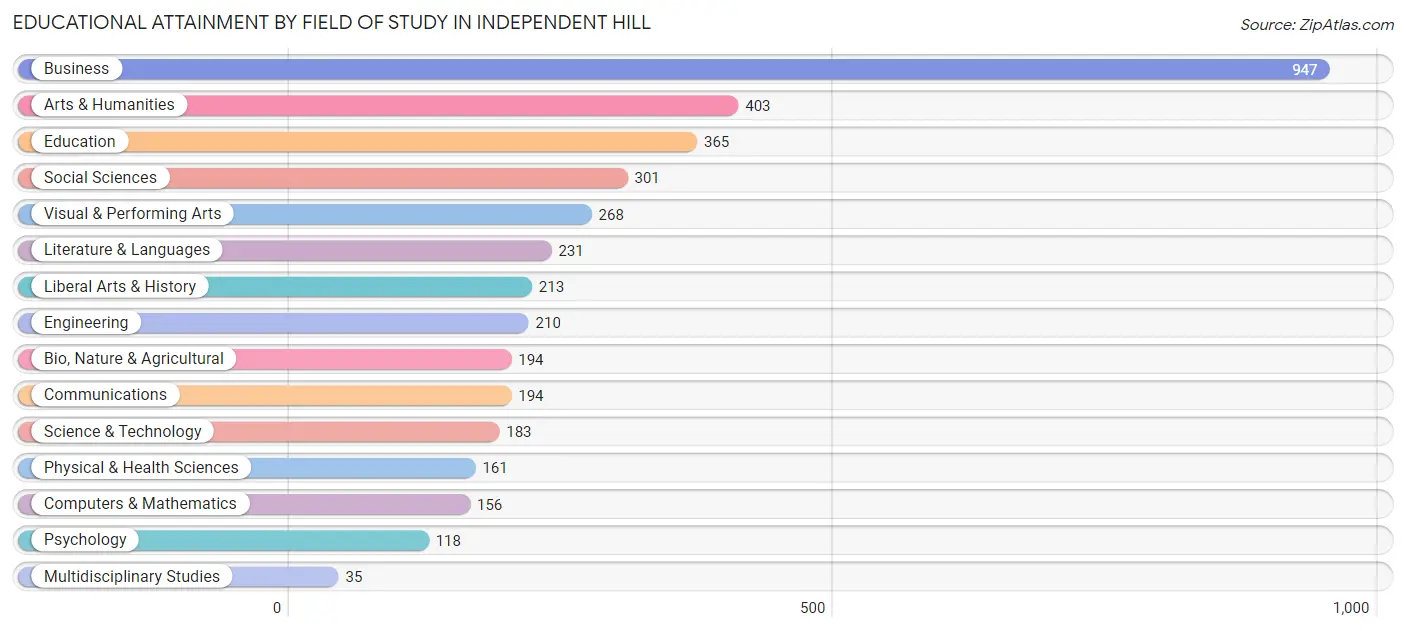
| Field of Study | # Graduates | % Graduates |
| Computers & Mathematics | 156 | 3.9% |
| Bio, Nature & Agricultural | 194 | 4.9% |
| Physical & Health Sciences | 161 | 4.1% |
| Psychology | 118 | 3.0% |
| Social Sciences | 301 | 7.6% |
| Engineering | 210 | 5.3% |
| Multidisciplinary Studies | 35 | 0.9% |
| Science & Technology | 183 | 4.6% |
| Business | 947 | 23.8% |
| Education | 365 | 9.2% |
| Literature & Languages | 231 | 5.8% |
| Liberal Arts & History | 213 | 5.3% |
| Visual & Performing Arts | 268 | 6.7% |
| Communications | 194 | 4.9% |
| Arts & Humanities | 403 | 10.1% |
| Total | 3,979 | 100.0% |
Transportation & Commute in Independent Hill
Vehicle Availability by Sex in Independent Hill
The most prevalent vehicle ownership categories in Independent Hill are males with 3 vehicles (1,134, accounting for 40.1%) and females with 3 vehicles (1,100, making up 45.0%).
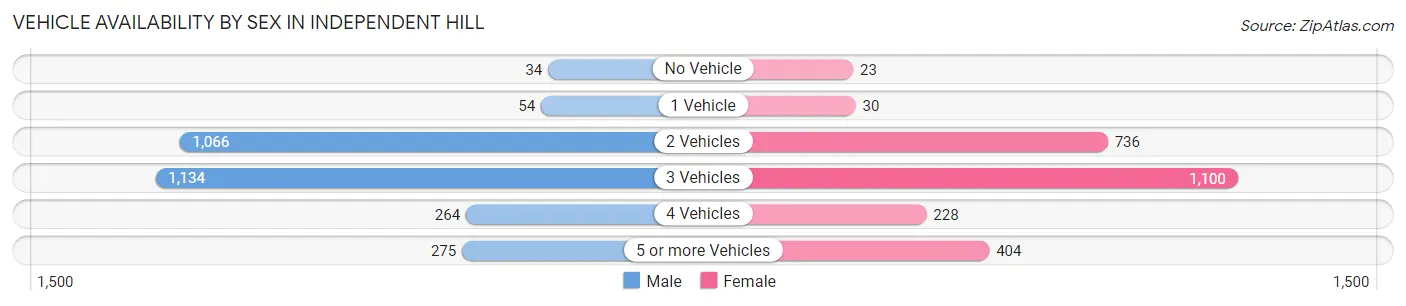
| Vehicles Available | Male | Female |
| No Vehicle | 34 (1.2%) | 23 (0.9%) |
| 1 Vehicle | 54 (1.9%) | 30 (1.2%) |
| 2 Vehicles | 1,066 (37.7%) | 736 (29.2%) |
| 3 Vehicles | 1,134 (40.1%) | 1,100 (43.6%) |
| 4 Vehicles | 264 (9.3%) | 228 (9.0%) |
| 5 or more Vehicles | 275 (9.7%) | 404 (16.0%) |
| Total | 2,827 (100.0%) | 2,521 (100.0%) |
Commute Time in Independent Hill
The most frequently occuring commute durations in Independent Hill are 60 to 89 minutes (993 commuters, 23.0%), 45 to 59 minutes (945 commuters, 21.9%), and 30 to 34 minutes (596 commuters, 13.8%).
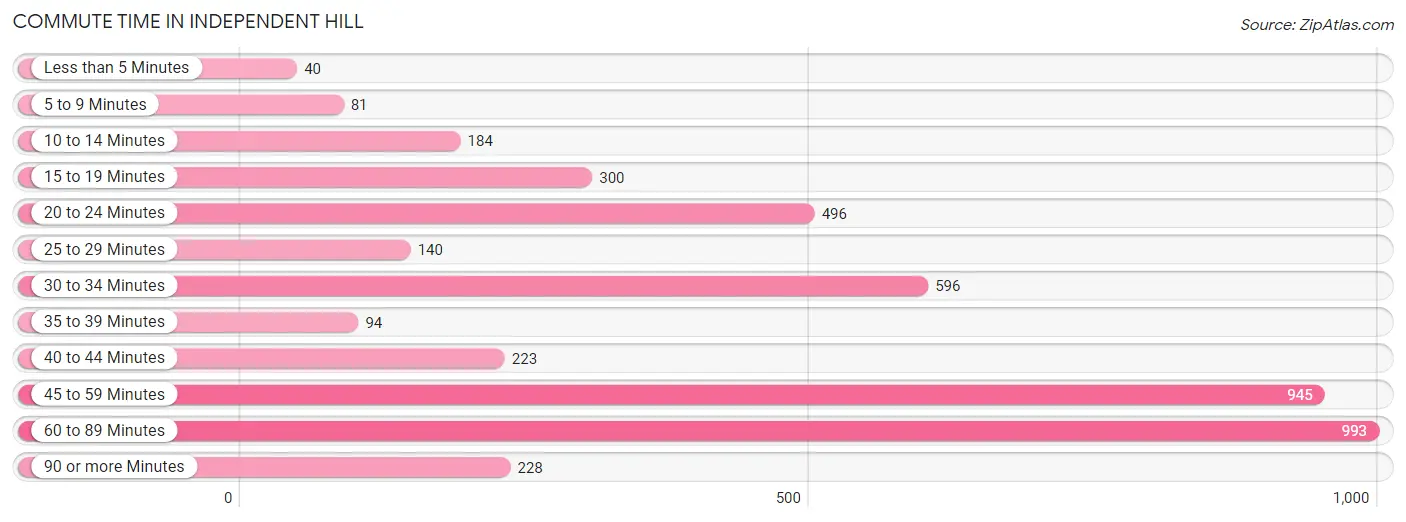
| Commute Time | # Commuters | % Commuters |
| Less than 5 Minutes | 40 | 0.9% |
| 5 to 9 Minutes | 81 | 1.9% |
| 10 to 14 Minutes | 184 | 4.3% |
| 15 to 19 Minutes | 300 | 6.9% |
| 20 to 24 Minutes | 496 | 11.5% |
| 25 to 29 Minutes | 140 | 3.2% |
| 30 to 34 Minutes | 596 | 13.8% |
| 35 to 39 Minutes | 94 | 2.2% |
| 40 to 44 Minutes | 223 | 5.2% |
| 45 to 59 Minutes | 945 | 21.9% |
| 60 to 89 Minutes | 993 | 23.0% |
| 90 or more Minutes | 228 | 5.3% |
Commute Time by Sex in Independent Hill
The most common commute times in Independent Hill are 45 to 59 minutes (667 commuters, 28.6%) for males and 60 to 89 minutes (480 commuters, 24.1%) for females.
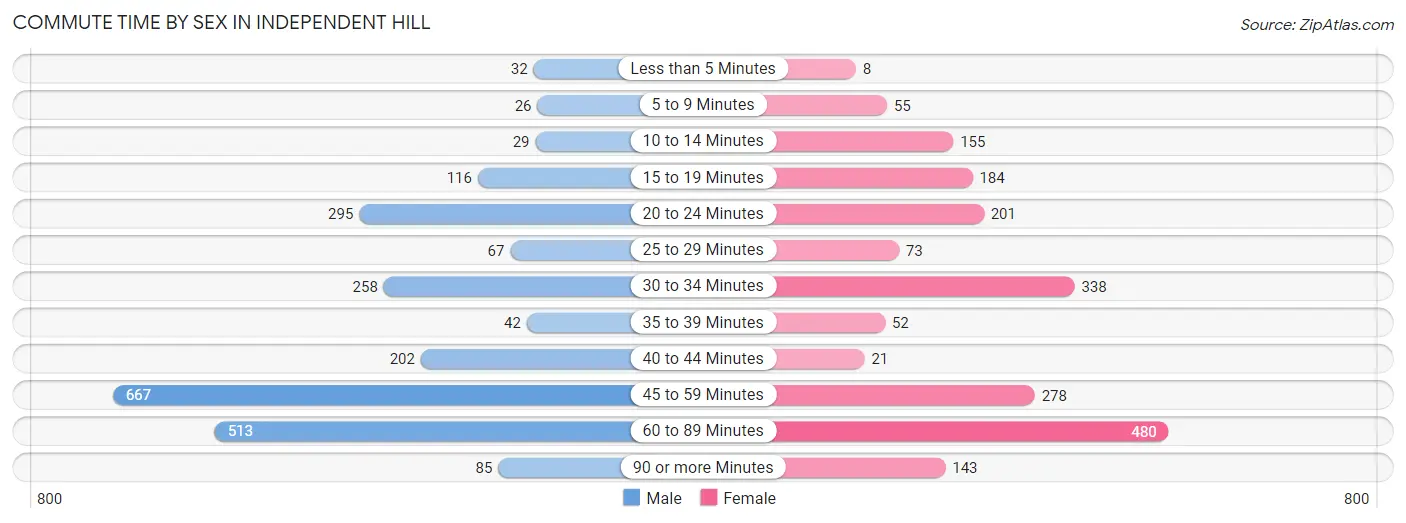
| Commute Time | Male | Female |
| Less than 5 Minutes | 32 (1.4%) | 8 (0.4%) |
| 5 to 9 Minutes | 26 (1.1%) | 55 (2.8%) |
| 10 to 14 Minutes | 29 (1.2%) | 155 (7.8%) |
| 15 to 19 Minutes | 116 (5.0%) | 184 (9.3%) |
| 20 to 24 Minutes | 295 (12.7%) | 201 (10.1%) |
| 25 to 29 Minutes | 67 (2.9%) | 73 (3.7%) |
| 30 to 34 Minutes | 258 (11.1%) | 338 (17.0%) |
| 35 to 39 Minutes | 42 (1.8%) | 52 (2.6%) |
| 40 to 44 Minutes | 202 (8.7%) | 21 (1.1%) |
| 45 to 59 Minutes | 667 (28.6%) | 278 (14.0%) |
| 60 to 89 Minutes | 513 (22.0%) | 480 (24.1%) |
| 90 or more Minutes | 85 (3.6%) | 143 (7.2%) |
Time of Departure to Work by Sex in Independent Hill
The most frequent times of departure to work in Independent Hill are 7:30 AM to 7:59 AM (335, 14.4%) for males and 7:00 AM to 7:29 AM (401, 20.2%) for females.
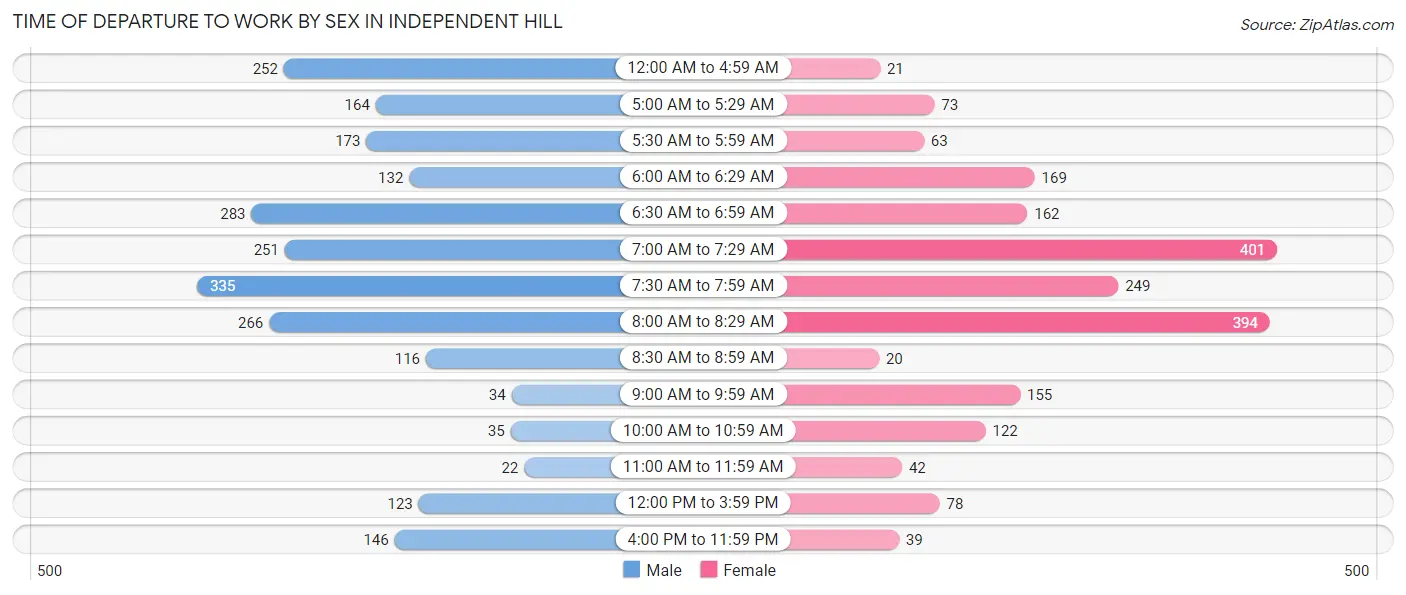
| Time of Departure | Male | Female |
| 12:00 AM to 4:59 AM | 252 (10.8%) | 21 (1.1%) |
| 5:00 AM to 5:29 AM | 164 (7.0%) | 73 (3.7%) |
| 5:30 AM to 5:59 AM | 173 (7.4%) | 63 (3.2%) |
| 6:00 AM to 6:29 AM | 132 (5.7%) | 169 (8.5%) |
| 6:30 AM to 6:59 AM | 283 (12.1%) | 162 (8.2%) |
| 7:00 AM to 7:29 AM | 251 (10.8%) | 401 (20.2%) |
| 7:30 AM to 7:59 AM | 335 (14.4%) | 249 (12.5%) |
| 8:00 AM to 8:29 AM | 266 (11.4%) | 394 (19.8%) |
| 8:30 AM to 8:59 AM | 116 (5.0%) | 20 (1.0%) |
| 9:00 AM to 9:59 AM | 34 (1.5%) | 155 (7.8%) |
| 10:00 AM to 10:59 AM | 35 (1.5%) | 122 (6.1%) |
| 11:00 AM to 11:59 AM | 22 (0.9%) | 42 (2.1%) |
| 12:00 PM to 3:59 PM | 123 (5.3%) | 78 (3.9%) |
| 4:00 PM to 11:59 PM | 146 (6.3%) | 39 (2.0%) |
| Total | 2,332 (100.0%) | 1,988 (100.0%) |
Housing Occupancy in Independent Hill
Occupancy by Ownership in Independent Hill
Of the total 3,003 dwellings in Independent Hill, owner-occupied units account for 2,893 (96.3%), while renter-occupied units make up 110 (3.7%).
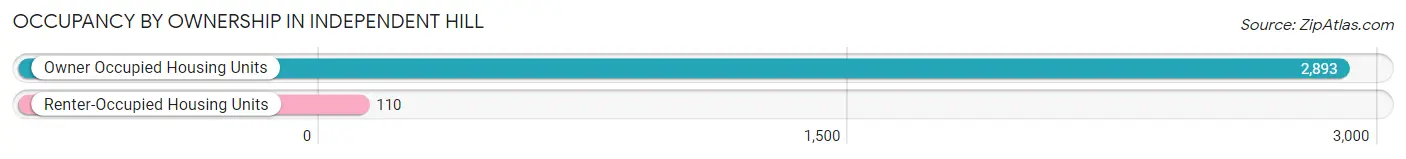
| Occupancy | # Housing Units | % Housing Units |
| Owner Occupied Housing Units | 2,893 | 96.3% |
| Renter-Occupied Housing Units | 110 | 3.7% |
| Total Occupied Housing Units | 3,003 | 100.0% |
Occupancy by Household Size in Independent Hill
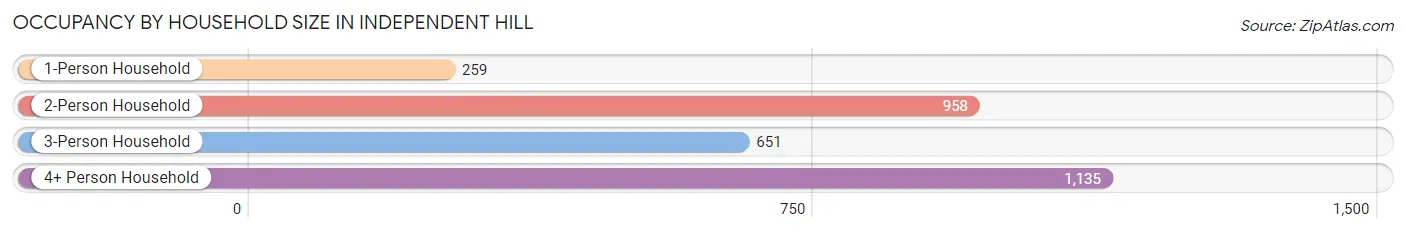
| Household Size | # Housing Units | % Housing Units |
| 1-Person Household | 259 | 8.6% |
| 2-Person Household | 958 | 31.9% |
| 3-Person Household | 651 | 21.7% |
| 4+ Person Household | 1,135 | 37.8% |
| Total Housing Units | 3,003 | 100.0% |
Occupancy by Ownership by Household Size in Independent Hill
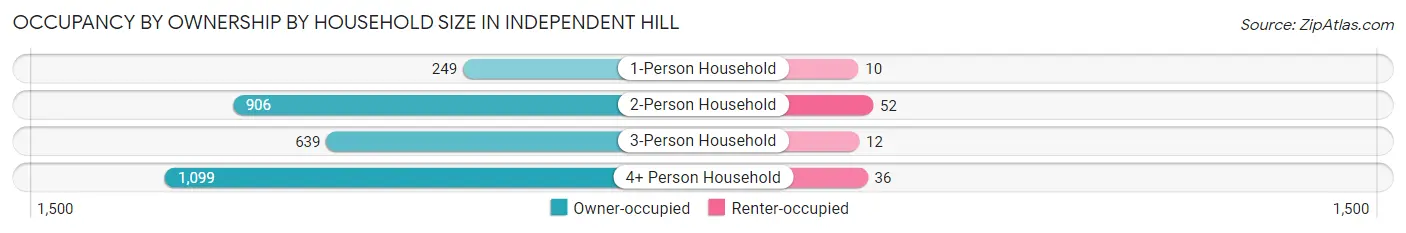
| Household Size | Owner-occupied | Renter-occupied |
| 1-Person Household | 249 (96.1%) | 10 (3.9%) |
| 2-Person Household | 906 (94.6%) | 52 (5.4%) |
| 3-Person Household | 639 (98.2%) | 12 (1.8%) |
| 4+ Person Household | 1,099 (96.8%) | 36 (3.2%) |
| Total Housing Units | 2,893 (96.3%) | 110 (3.7%) |
Occupancy by Educational Attainment in Independent Hill
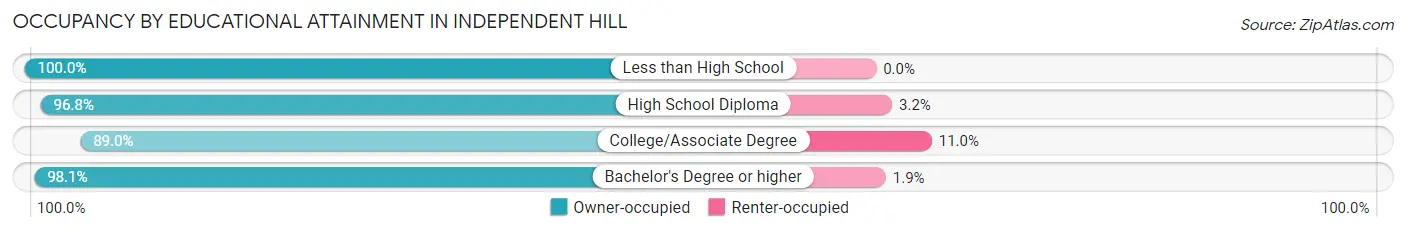
| Household Size | Owner-occupied | Renter-occupied |
| Less than High School | 101 (100.0%) | 0 (0.0%) |
| High School Diploma | 306 (96.8%) | 10 (3.2%) |
| College/Associate Degree | 492 (89.0%) | 61 (11.0%) |
| Bachelor's Degree or higher | 1,994 (98.1%) | 39 (1.9%) |
Occupancy by Age of Householder in Independent Hill
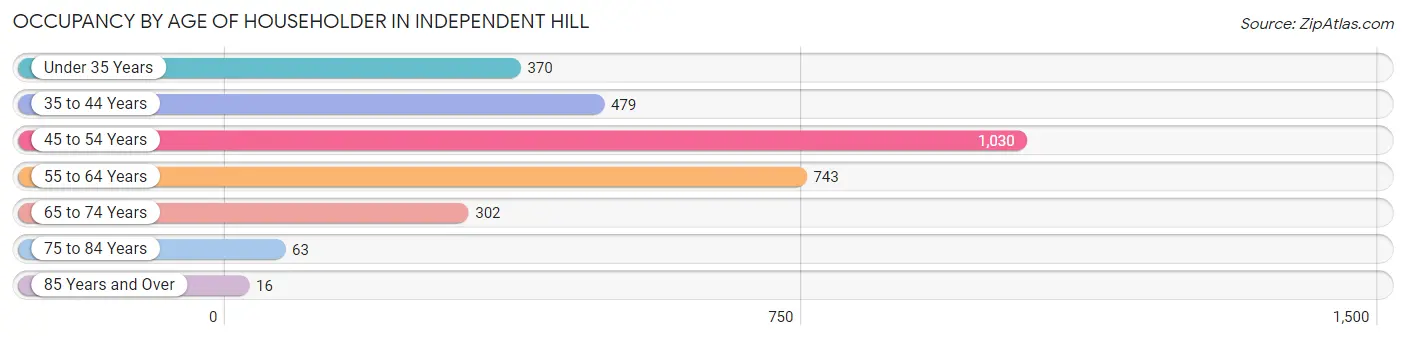
| Age Bracket | # Households | % Households |
| Under 35 Years | 370 | 12.3% |
| 35 to 44 Years | 479 | 16.0% |
| 45 to 54 Years | 1,030 | 34.3% |
| 55 to 64 Years | 743 | 24.7% |
| 65 to 74 Years | 302 | 10.1% |
| 75 to 84 Years | 63 | 2.1% |
| 85 Years and Over | 16 | 0.5% |
| Total | 3,003 | 100.0% |
Housing Finances in Independent Hill
Median Income by Occupancy in Independent Hill
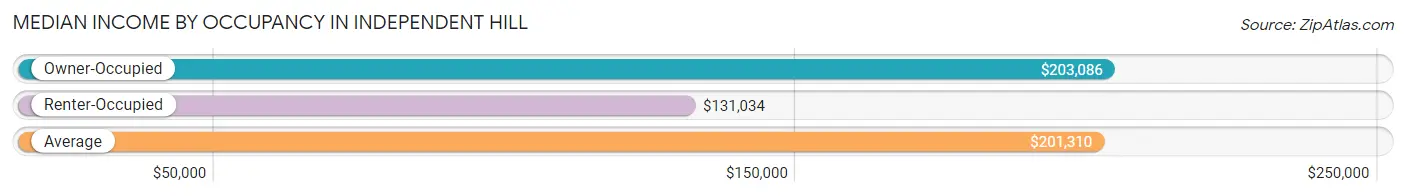
| Occupancy Type | # Households | Median Income |
| Owner-Occupied | 2,893 (96.3%) | $203,086 |
| Renter-Occupied | 110 (3.7%) | $131,034 |
| Average | 3,003 (100.0%) | $201,310 |
Occupancy by Householder Income Bracket in Independent Hill
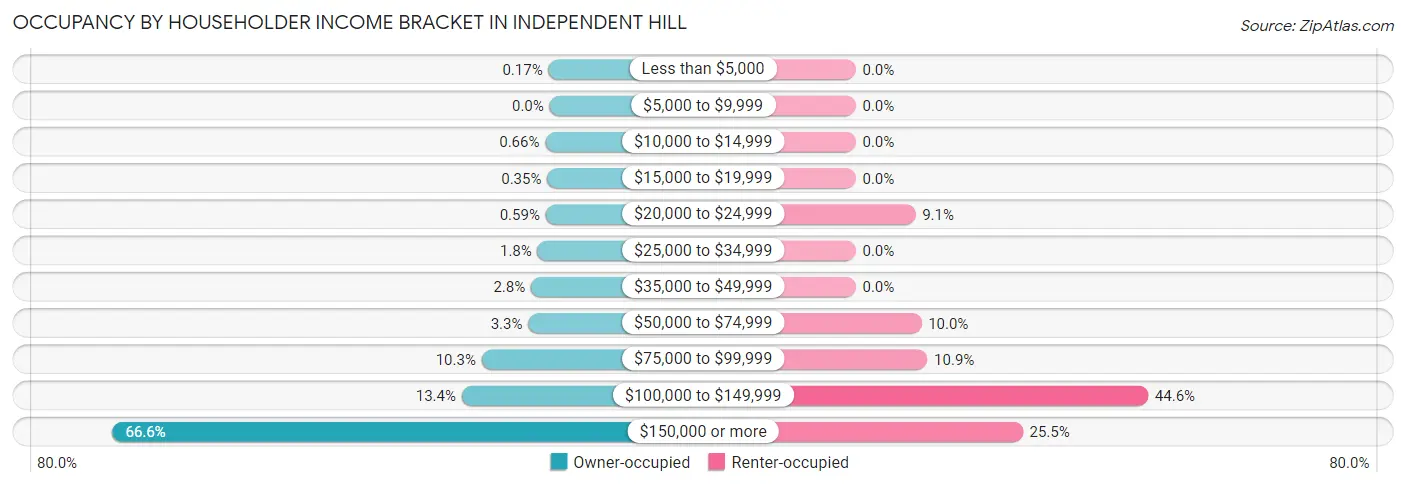
| Income Bracket | Owner-occupied | Renter-occupied |
| Less than $5,000 | 5 (0.2%) | 0 (0.0%) |
| $5,000 to $9,999 | 0 (0.0%) | 0 (0.0%) |
| $10,000 to $14,999 | 19 (0.7%) | 0 (0.0%) |
| $15,000 to $19,999 | 10 (0.4%) | 0 (0.0%) |
| $20,000 to $24,999 | 17 (0.6%) | 10 (9.1%) |
| $25,000 to $34,999 | 53 (1.8%) | 0 (0.0%) |
| $35,000 to $49,999 | 82 (2.8%) | 0 (0.0%) |
| $50,000 to $74,999 | 94 (3.3%) | 11 (10.0%) |
| $75,000 to $99,999 | 299 (10.3%) | 12 (10.9%) |
| $100,000 to $149,999 | 387 (13.4%) | 49 (44.6%) |
| $150,000 or more | 1,927 (66.6%) | 28 (25.5%) |
| Total | 2,893 (100.0%) | 110 (100.0%) |
Monthly Housing Cost Tiers in Independent Hill
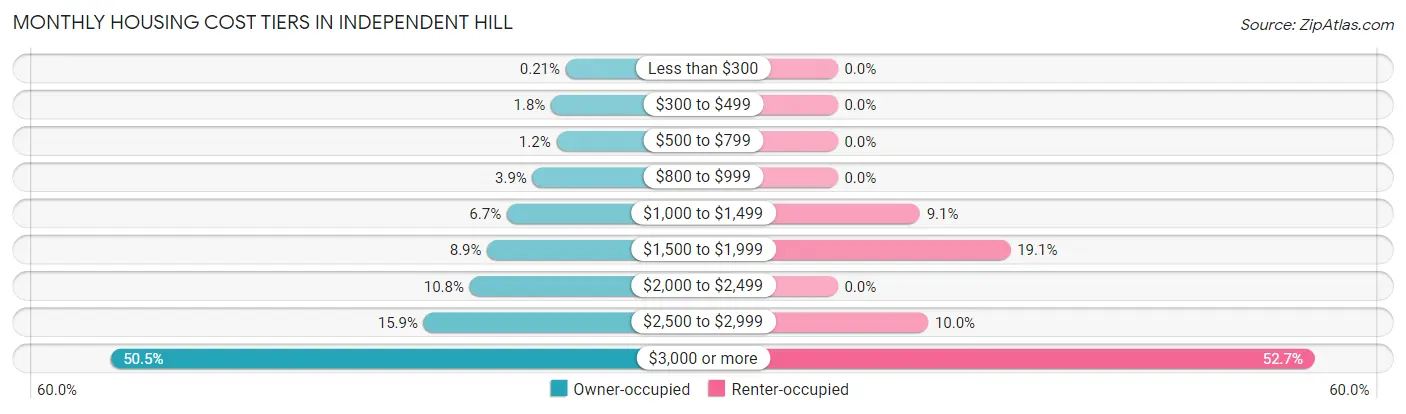
| Monthly Cost | Owner-occupied | Renter-occupied |
| Less than $300 | 6 (0.2%) | 0 (0.0%) |
| $300 to $499 | 53 (1.8%) | 0 (0.0%) |
| $500 to $799 | 36 (1.2%) | 0 (0.0%) |
| $800 to $999 | 112 (3.9%) | 0 (0.0%) |
| $1,000 to $1,499 | 194 (6.7%) | 10 (9.1%) |
| $1,500 to $1,999 | 257 (8.9%) | 21 (19.1%) |
| $2,000 to $2,499 | 313 (10.8%) | 0 (0.0%) |
| $2,500 to $2,999 | 460 (15.9%) | 11 (10.0%) |
| $3,000 or more | 1,462 (50.5%) | 58 (52.7%) |
| Total | 2,893 (100.0%) | 110 (100.0%) |
Physical Housing Characteristics in Independent Hill
Housing Structures in Independent Hill
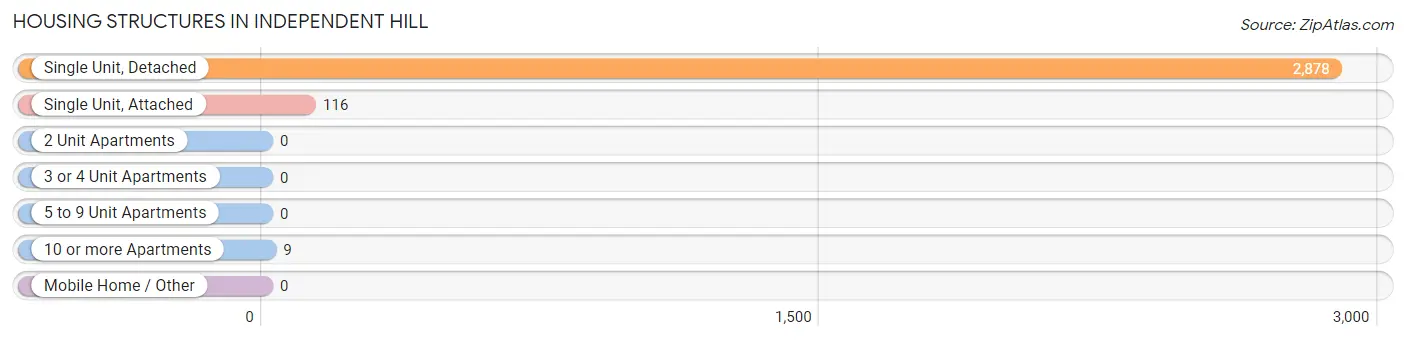
| Structure Type | # Housing Units | % Housing Units |
| Single Unit, Detached | 2,878 | 95.8% |
| Single Unit, Attached | 116 | 3.9% |
| 2 Unit Apartments | 0 | 0.0% |
| 3 or 4 Unit Apartments | 0 | 0.0% |
| 5 to 9 Unit Apartments | 0 | 0.0% |
| 10 or more Apartments | 9 | 0.3% |
| Mobile Home / Other | 0 | 0.0% |
| Total | 3,003 | 100.0% |
Housing Structures by Occupancy in Independent Hill
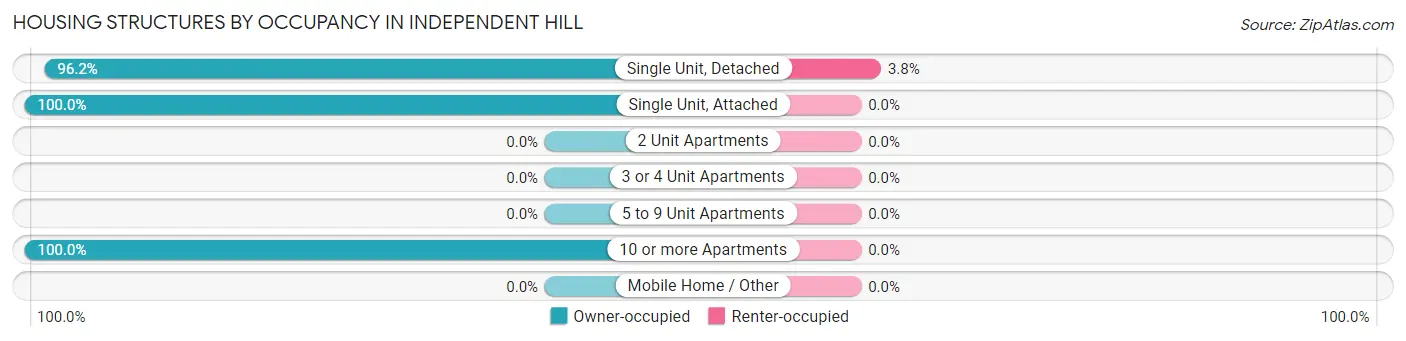
| Structure Type | Owner-occupied | Renter-occupied |
| Single Unit, Detached | 2,768 (96.2%) | 110 (3.8%) |
| Single Unit, Attached | 116 (100.0%) | 0 (0.0%) |
| 2 Unit Apartments | 0 (0.0%) | 0 (0.0%) |
| 3 or 4 Unit Apartments | 0 (0.0%) | 0 (0.0%) |
| 5 to 9 Unit Apartments | 0 (0.0%) | 0 (0.0%) |
| 10 or more Apartments | 9 (100.0%) | 0 (0.0%) |
| Mobile Home / Other | 0 (0.0%) | 0 (0.0%) |
| Total | 2,893 (96.3%) | 110 (3.7%) |
Housing Structures by Number of Rooms in Independent Hill
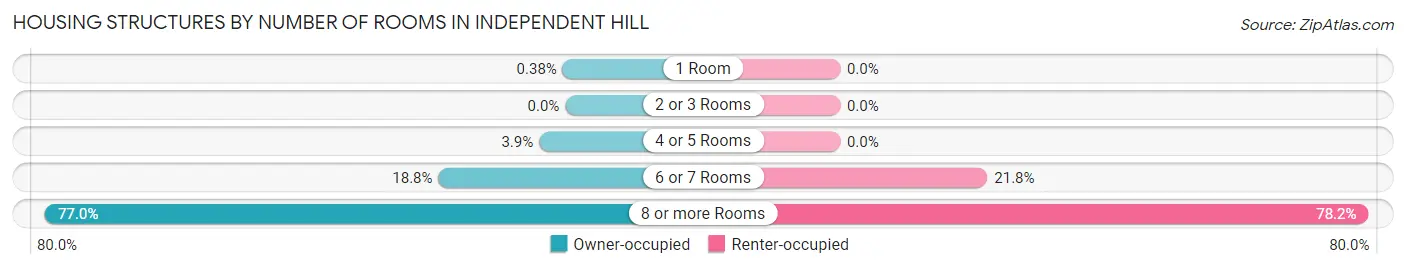
| Number of Rooms | Owner-occupied | Renter-occupied |
| 1 Room | 11 (0.4%) | 0 (0.0%) |
| 2 or 3 Rooms | 0 (0.0%) | 0 (0.0%) |
| 4 or 5 Rooms | 112 (3.9%) | 0 (0.0%) |
| 6 or 7 Rooms | 543 (18.8%) | 24 (21.8%) |
| 8 or more Rooms | 2,227 (77.0%) | 86 (78.2%) |
| Total | 2,893 (100.0%) | 110 (100.0%) |
Housing Structure by Heating Type in Independent Hill
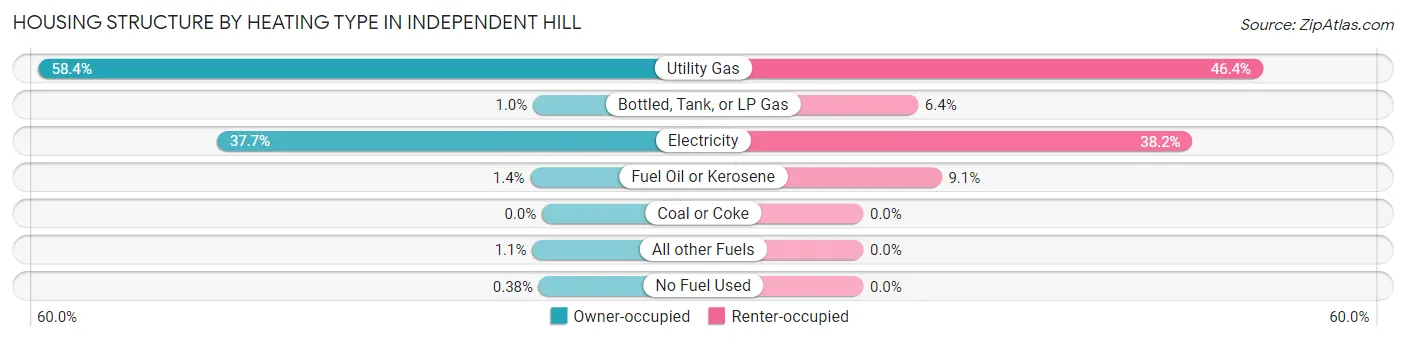
| Heating Type | Owner-occupied | Renter-occupied |
| Utility Gas | 1,689 (58.4%) | 51 (46.4%) |
| Bottled, Tank, or LP Gas | 30 (1.0%) | 7 (6.4%) |
| Electricity | 1,091 (37.7%) | 42 (38.2%) |
| Fuel Oil or Kerosene | 39 (1.3%) | 10 (9.1%) |
| Coal or Coke | 0 (0.0%) | 0 (0.0%) |
| All other Fuels | 33 (1.1%) | 0 (0.0%) |
| No Fuel Used | 11 (0.4%) | 0 (0.0%) |
| Total | 2,893 (100.0%) | 110 (100.0%) |
Household Vehicle Usage in Independent Hill
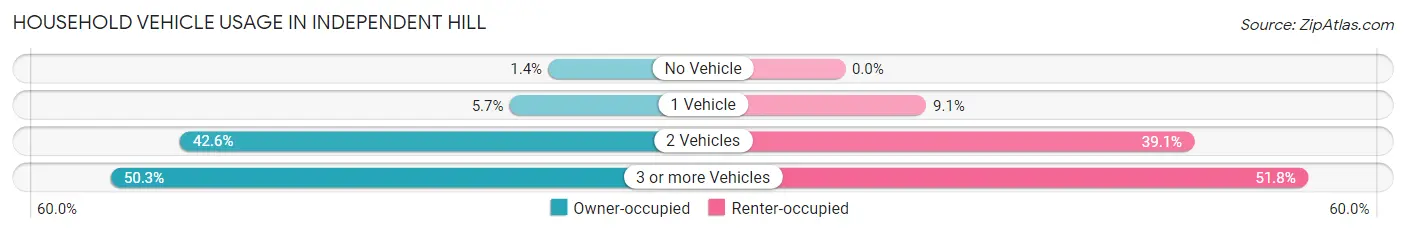
| Vehicles per Household | Owner-occupied | Renter-occupied |
| No Vehicle | 40 (1.4%) | 0 (0.0%) |
| 1 Vehicle | 165 (5.7%) | 10 (9.1%) |
| 2 Vehicles | 1,232 (42.6%) | 43 (39.1%) |
| 3 or more Vehicles | 1,456 (50.3%) | 57 (51.8%) |
| Total | 2,893 (100.0%) | 110 (100.0%) |
Real Estate & Mortgages in Independent Hill
Real Estate and Mortgage Overview in Independent Hill
| Characteristic | Without Mortgage | With Mortgage |
| Housing Units | 333 | 2,560 |
| Median Property Value | $615,000 | $618,800 |
| Median Household Income | $238,365 | $1,723 |
| Monthly Housing Costs | $1,001 | $1,462 |
| Real Estate Taxes | $6,187 | $57 |
Property Value by Mortgage Status in Independent Hill
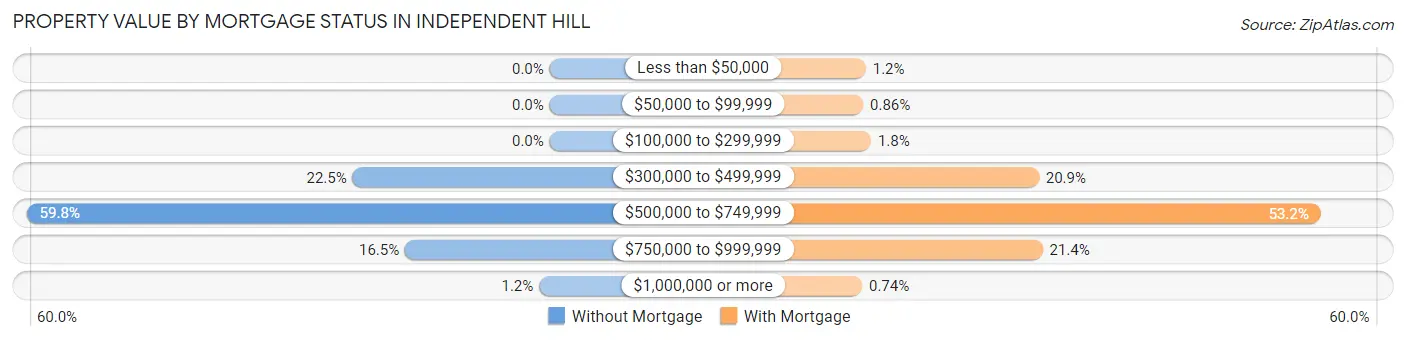
| Property Value | Without Mortgage | With Mortgage |
| Less than $50,000 | 0 (0.0%) | 30 (1.2%) |
| $50,000 to $99,999 | 0 (0.0%) | 22 (0.9%) |
| $100,000 to $299,999 | 0 (0.0%) | 45 (1.8%) |
| $300,000 to $499,999 | 75 (22.5%) | 536 (20.9%) |
| $500,000 to $749,999 | 199 (59.8%) | 1,361 (53.2%) |
| $750,000 to $999,999 | 55 (16.5%) | 547 (21.4%) |
| $1,000,000 or more | 4 (1.2%) | 19 (0.7%) |
| Total | 333 (100.0%) | 2,560 (100.0%) |
Household Income by Mortgage Status in Independent Hill
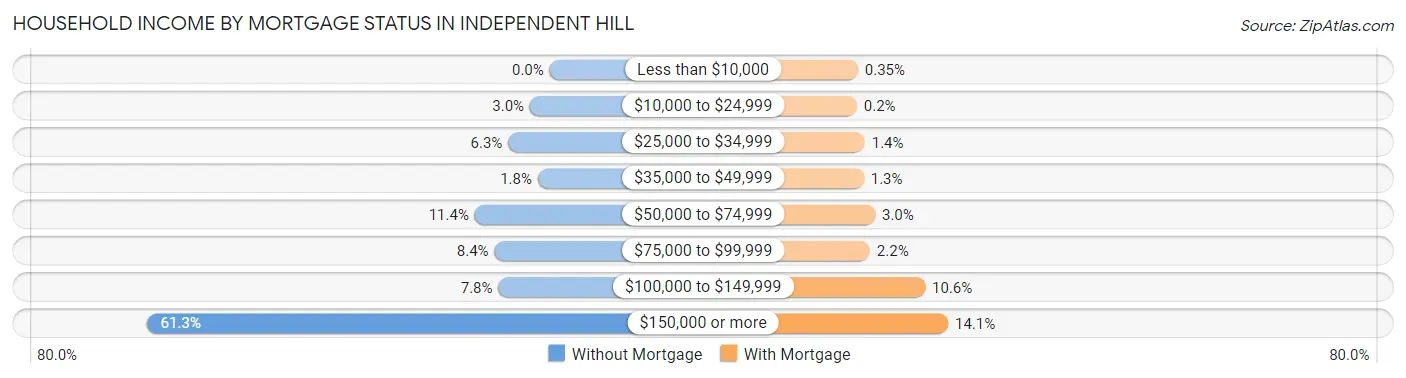
| Household Income | Without Mortgage | With Mortgage |
| Less than $10,000 | 0 (0.0%) | 9 (0.4%) |
| $10,000 to $24,999 | 10 (3.0%) | 5 (0.2%) |
| $25,000 to $34,999 | 21 (6.3%) | 36 (1.4%) |
| $35,000 to $49,999 | 6 (1.8%) | 32 (1.3%) |
| $50,000 to $74,999 | 38 (11.4%) | 76 (3.0%) |
| $75,000 to $99,999 | 28 (8.4%) | 56 (2.2%) |
| $100,000 to $149,999 | 26 (7.8%) | 271 (10.6%) |
| $150,000 or more | 204 (61.3%) | 361 (14.1%) |
| Total | 333 (100.0%) | 2,560 (100.0%) |
Property Value to Household Income Ratio in Independent Hill
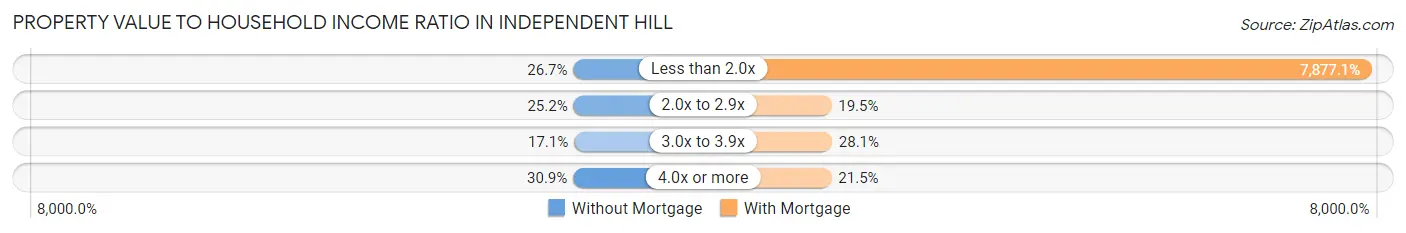
| Value-to-Income Ratio | Without Mortgage | With Mortgage |
| Less than 2.0x | 89 (26.7%) | 201,653 (7,877.1%) |
| 2.0x to 2.9x | 84 (25.2%) | 499 (19.5%) |
| 3.0x to 3.9x | 57 (17.1%) | 719 (28.1%) |
| 4.0x or more | 103 (30.9%) | 551 (21.5%) |
| Total | 333 (100.0%) | 2,560 (100.0%) |
Real Estate Taxes by Mortgage Status in Independent Hill
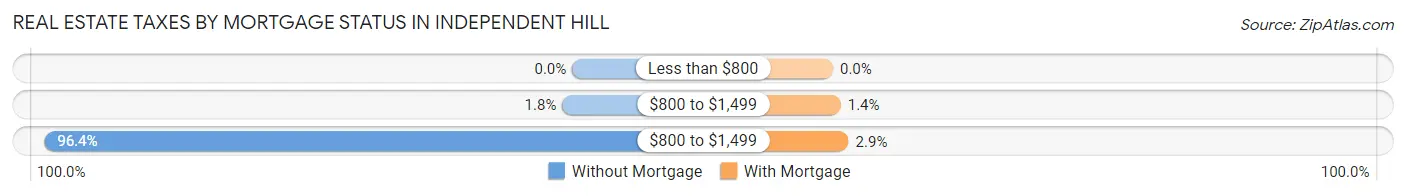
| Property Taxes | Without Mortgage | With Mortgage |
| Less than $800 | 0 (0.0%) | 0 (0.0%) |
| $800 to $1,499 | 6 (1.8%) | 36 (1.4%) |
| $800 to $1,499 | 321 (96.4%) | 73 (2.9%) |
| Total | 333 (100.0%) | 2,560 (100.0%) |
Health & Disability in Independent Hill
Health Insurance Coverage by Age in Independent Hill
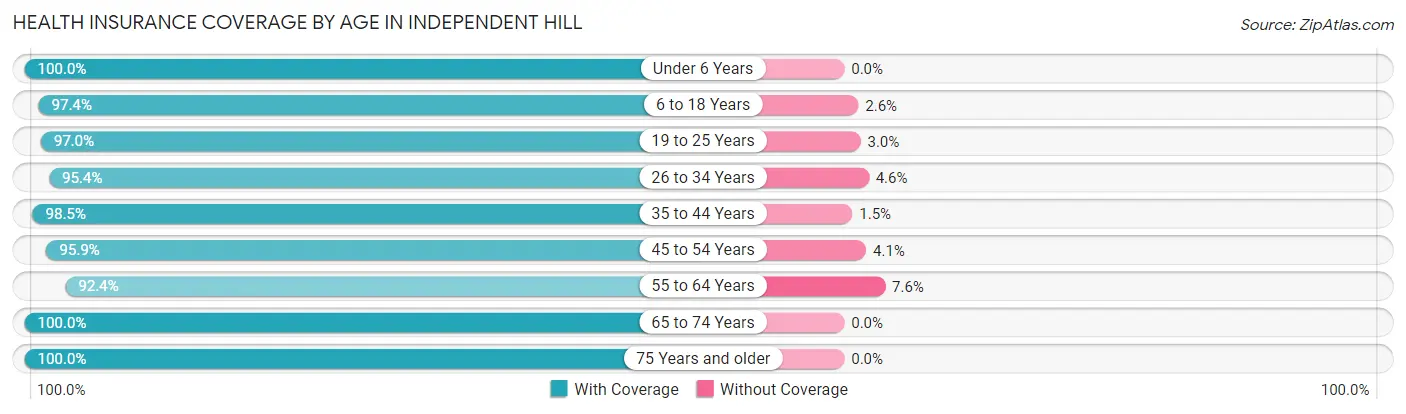
| Age Bracket | With Coverage | Without Coverage |
| Under 6 Years | 568 (100.0%) | 0 (0.0%) |
| 6 to 18 Years | 2,046 (97.4%) | 55 (2.6%) |
| 19 to 25 Years | 609 (97.0%) | 19 (3.0%) |
| 26 to 34 Years | 1,172 (95.4%) | 56 (4.6%) |
| 35 to 44 Years | 1,049 (98.5%) | 16 (1.5%) |
| 45 to 54 Years | 1,860 (95.9%) | 79 (4.1%) |
| 55 to 64 Years | 1,360 (92.4%) | 112 (7.6%) |
| 65 to 74 Years | 510 (100.0%) | 0 (0.0%) |
| 75 Years and older | 222 (100.0%) | 0 (0.0%) |
| Total | 9,396 (96.5%) | 337 (3.5%) |
Health Insurance Coverage by Citizenship Status in Independent Hill
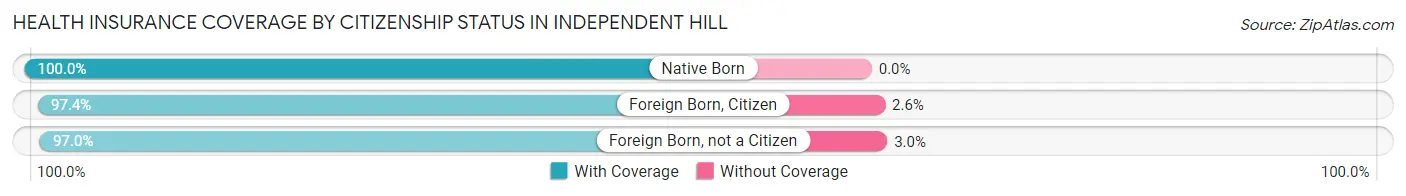
| Citizenship Status | With Coverage | Without Coverage |
| Native Born | 568 (100.0%) | 0 (0.0%) |
| Foreign Born, Citizen | 2,046 (97.4%) | 55 (2.6%) |
| Foreign Born, not a Citizen | 609 (97.0%) | 19 (3.0%) |
Health Insurance Coverage by Household Income in Independent Hill
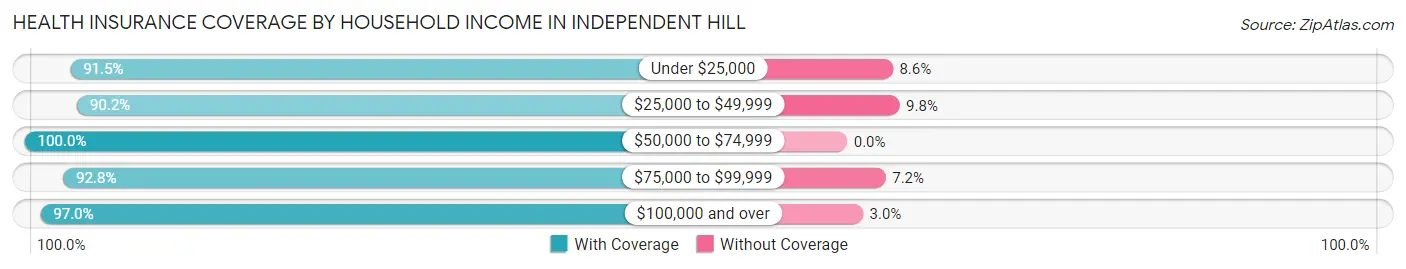
| Household Income | With Coverage | Without Coverage |
| Under $25,000 | 107 (91.4%) | 10 (8.6%) |
| $25,000 to $49,999 | 193 (90.2%) | 21 (9.8%) |
| $50,000 to $74,999 | 230 (100.0%) | 0 (0.0%) |
| $75,000 to $99,999 | 708 (92.8%) | 55 (7.2%) |
| $100,000 and over | 8,154 (97.0%) | 249 (3.0%) |
Public vs Private Health Insurance Coverage by Age in Independent Hill
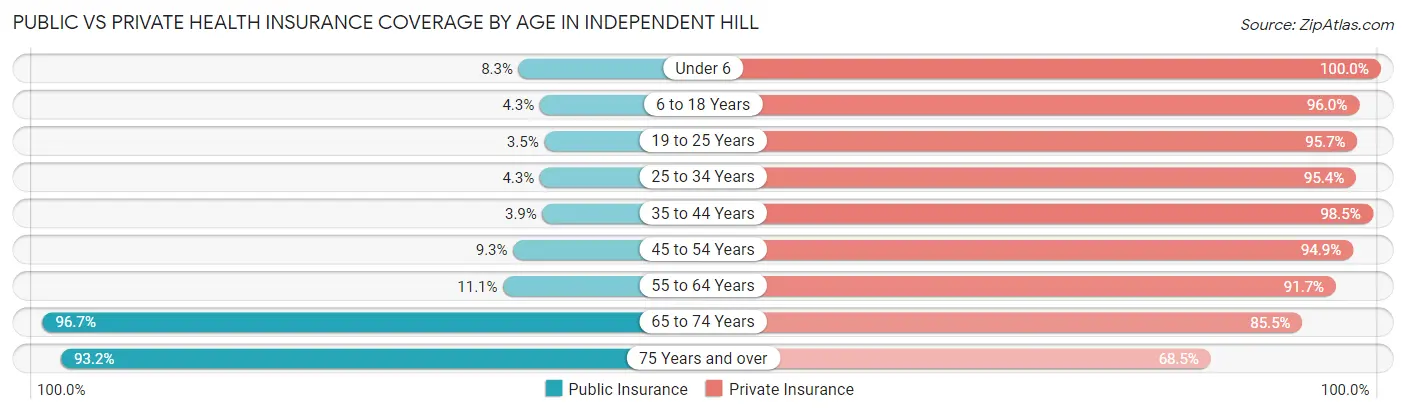
| Age Bracket | Public Insurance | Private Insurance |
| Under 6 | 47 (8.3%) | 568 (100.0%) |
| 6 to 18 Years | 91 (4.3%) | 2,017 (96.0%) |
| 19 to 25 Years | 22 (3.5%) | 601 (95.7%) |
| 25 to 34 Years | 53 (4.3%) | 1,172 (95.4%) |
| 35 to 44 Years | 41 (3.8%) | 1,049 (98.5%) |
| 45 to 54 Years | 180 (9.3%) | 1,840 (94.9%) |
| 55 to 64 Years | 164 (11.1%) | 1,350 (91.7%) |
| 65 to 74 Years | 493 (96.7%) | 436 (85.5%) |
| 75 Years and over | 207 (93.2%) | 152 (68.5%) |
| Total | 1,298 (13.3%) | 9,185 (94.4%) |
Disability Status by Sex by Age in Independent Hill
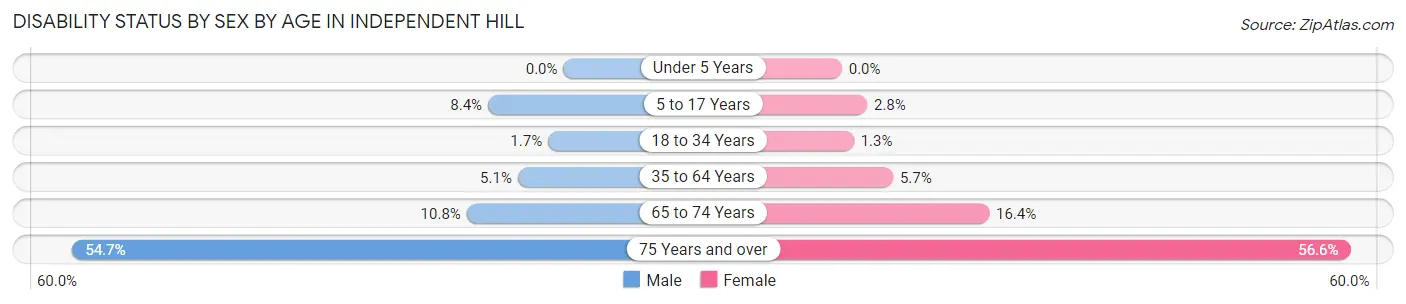
| Age Bracket | Male | Female |
| Under 5 Years | 0 (0.0%) | 0 (0.0%) |
| 5 to 17 Years | 94 (8.4%) | 27 (2.8%) |
| 18 to 34 Years | 14 (1.7%) | 15 (1.3%) |
| 35 to 64 Years | 108 (5.1%) | 134 (5.7%) |
| 65 to 74 Years | 28 (10.8%) | 41 (16.4%) |
| 75 Years and over | 76 (54.7%) | 47 (56.6%) |
Disability Class by Sex by Age in Independent Hill
Disability Class: Hearing Difficulty
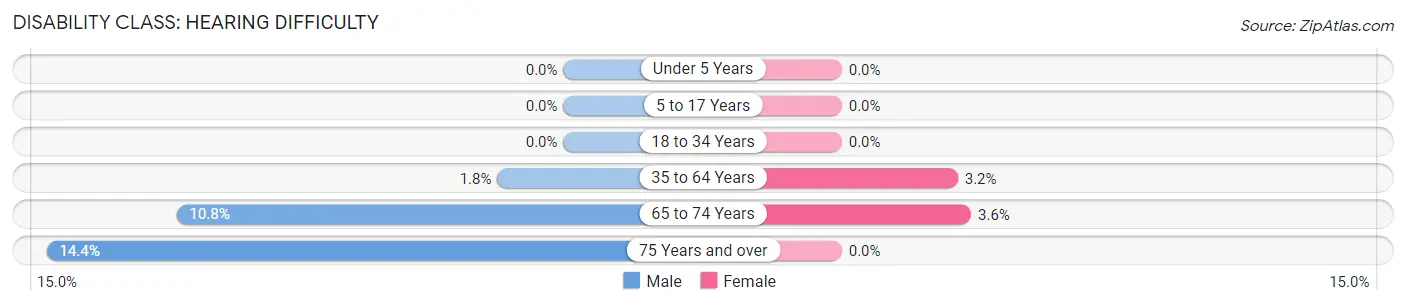
| Age Bracket | Male | Female |
| Under 5 Years | 0 (0.0%) | 0 (0.0%) |
| 5 to 17 Years | 0 (0.0%) | 0 (0.0%) |
| 18 to 34 Years | 0 (0.0%) | 0 (0.0%) |
| 35 to 64 Years | 39 (1.8%) | 76 (3.2%) |
| 65 to 74 Years | 28 (10.8%) | 9 (3.6%) |
| 75 Years and over | 20 (14.4%) | 0 (0.0%) |
Disability Class: Vision Difficulty
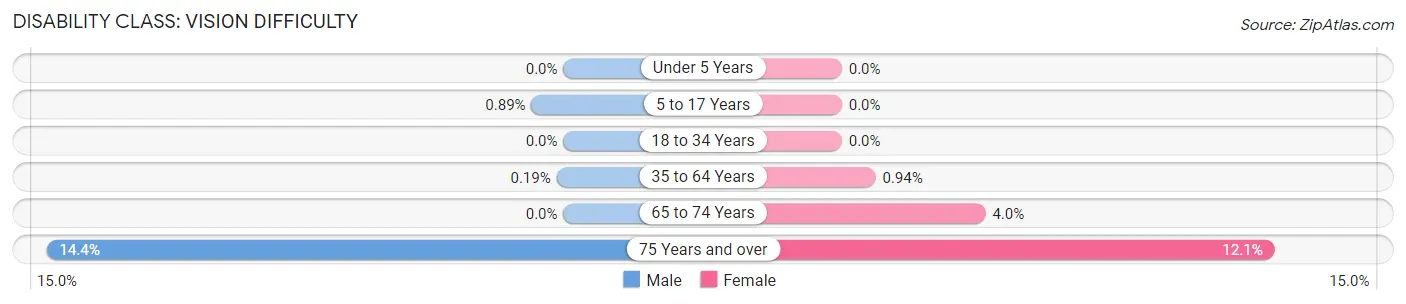
| Age Bracket | Male | Female |
| Under 5 Years | 0 (0.0%) | 0 (0.0%) |
| 5 to 17 Years | 10 (0.9%) | 0 (0.0%) |
| 18 to 34 Years | 0 (0.0%) | 0 (0.0%) |
| 35 to 64 Years | 4 (0.2%) | 22 (0.9%) |
| 65 to 74 Years | 0 (0.0%) | 10 (4.0%) |
| 75 Years and over | 20 (14.4%) | 10 (12.0%) |
Disability Class: Cognitive Difficulty
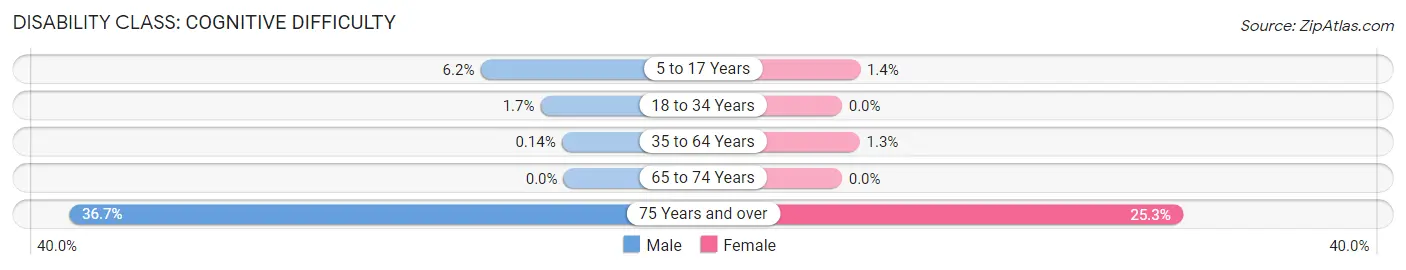
| Age Bracket | Male | Female |
| 5 to 17 Years | 69 (6.2%) | 13 (1.3%) |
| 18 to 34 Years | 14 (1.7%) | 0 (0.0%) |
| 35 to 64 Years | 3 (0.1%) | 31 (1.3%) |
| 65 to 74 Years | 0 (0.0%) | 0 (0.0%) |
| 75 Years and over | 51 (36.7%) | 21 (25.3%) |
Disability Class: Ambulatory Difficulty
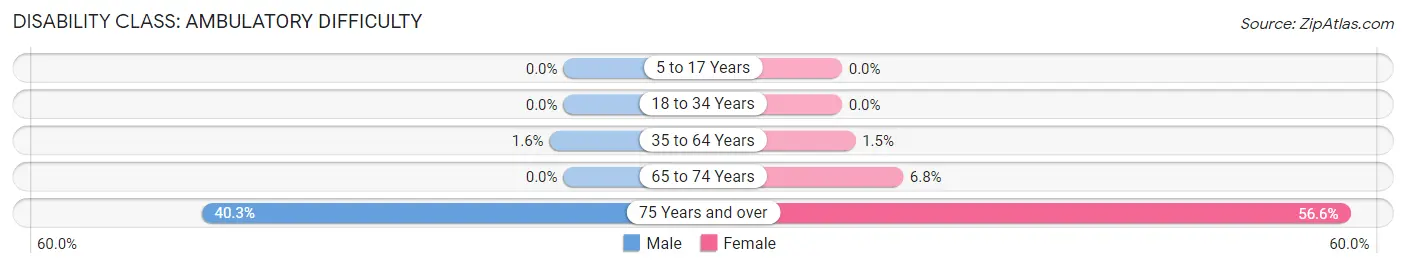
| Age Bracket | Male | Female |
| 5 to 17 Years | 0 (0.0%) | 0 (0.0%) |
| 18 to 34 Years | 0 (0.0%) | 0 (0.0%) |
| 35 to 64 Years | 33 (1.5%) | 35 (1.5%) |
| 65 to 74 Years | 0 (0.0%) | 17 (6.8%) |
| 75 Years and over | 56 (40.3%) | 47 (56.6%) |
Disability Class: Self-Care Difficulty
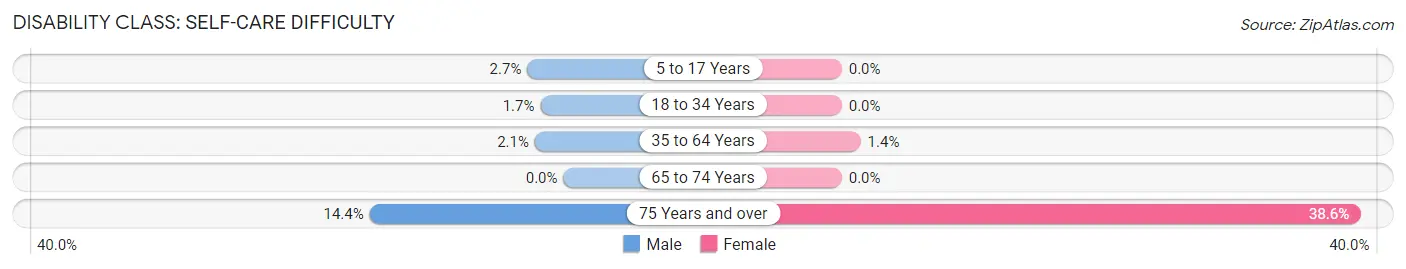
| Age Bracket | Male | Female |
| 5 to 17 Years | 30 (2.7%) | 0 (0.0%) |
| 18 to 34 Years | 14 (1.7%) | 0 (0.0%) |
| 35 to 64 Years | 45 (2.1%) | 33 (1.4%) |
| 65 to 74 Years | 0 (0.0%) | 0 (0.0%) |
| 75 Years and over | 20 (14.4%) | 32 (38.6%) |
Technology Access in Independent Hill
Computing Device Access in Independent Hill
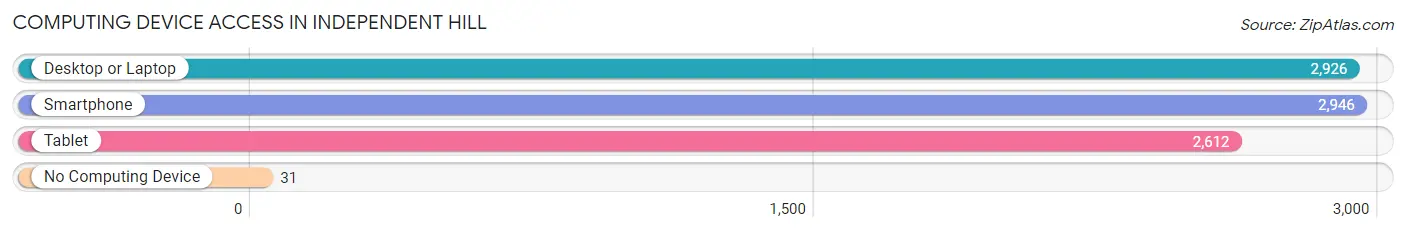
| Device Type | # Households | % Households |
| Desktop or Laptop | 2,926 | 97.4% |
| Smartphone | 2,946 | 98.1% |
| Tablet | 2,612 | 87.0% |
| No Computing Device | 31 | 1.0% |
| Total | 3,003 | 100.0% |
Internet Access in Independent Hill
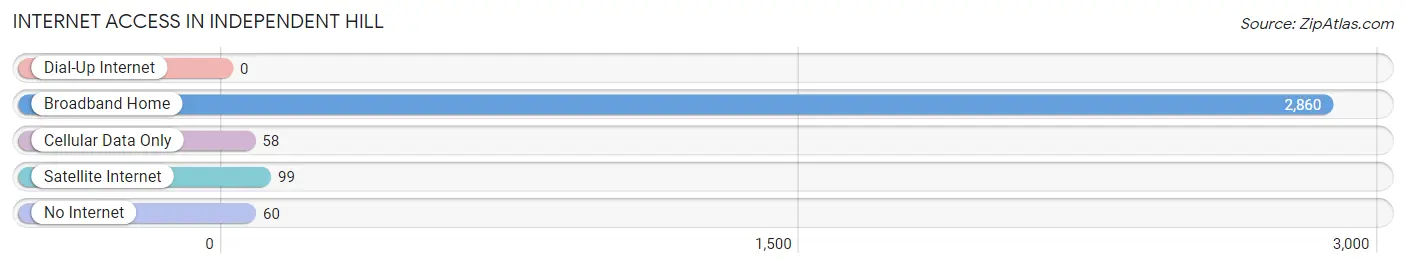
| Internet Type | # Households | % Households |
| Dial-Up Internet | 0 | 0.0% |
| Broadband Home | 2,860 | 95.2% |
| Cellular Data Only | 58 | 1.9% |
| Satellite Internet | 99 | 3.3% |
| No Internet | 60 | 2.0% |
| Total | 3,003 | 100.0% |
Independent Hill Summary
History
Independent Hill is an unincorporated community located in Prince William County, Virginia. It is situated in the eastern part of the county, approximately 25 miles southwest of Washington, D.C. The community was first settled in the late 1700s by a group of Quakers who had migrated from Pennsylvania. The Quakers named the area Independent Hill due to its location on a hill that was independent of the surrounding area.
The area was primarily agricultural until the late 1800s when the Washington and Old Dominion Railroad was built through the area. This allowed for the development of a small commercial district in the area. The railroad also allowed for the development of a small industrial district in the area.
In the early 1900s, the area began to experience a population boom as people moved to the area to take advantage of the new economic opportunities. This population growth continued until the 1950s when the area began to experience a decline in population. This decline was due to the increasing popularity of suburban living and the development of nearby cities such as Manassas and Woodbridge.
Geography
Independent Hill is located in the eastern part of Prince William County, Virginia. It is situated on a hill that is approximately 25 miles southwest of Washington, D.C. The area is primarily rural and is characterized by rolling hills and wooded areas. The area is also home to several small streams and creeks.
The climate in the area is typical of the mid-Atlantic region. Summers are hot and humid with temperatures reaching into the 90s. Winters are cold and wet with temperatures dropping into the 20s.
Economy
The economy of Independent Hill is primarily based on agriculture and light industry. The area is home to several small farms that produce a variety of crops including corn, soybeans, and hay. The area is also home to several small industrial businesses that produce a variety of products including furniture, textiles, and electronics.
The area is also home to several small businesses that provide services to the local community. These businesses include restaurants, grocery stores, and auto repair shops.
Demographics
As of the 2010 census, the population of Independent Hill was 2,845. The population is primarily white (90.2%) with a small African American (4.3%) and Hispanic (3.2%) population. The median household income in the area is $68,944. The median age in the area is 38.7 years.
Common Questions
What is Per Capita Income in Independent Hill?
Per Capita income in Independent Hill is $69,063.
What is the Median Family Income in Independent Hill?
Median Family Income in Independent Hill is $211,222.
What is the Median Household income in Independent Hill?
Median Household Income in Independent Hill is $201,310.
What is Income or Wage Gap in Independent Hill?
Income or Wage Gap in Independent Hill is 53.8%.
Women in Independent Hill earn 46.2 cents for every dollar earned by a man.
What is Family Income Deficit in Independent Hill?
Family Income Deficit in Independent Hill is $2,081.
Families that are below poverty line in Independent Hill earn $2,081 less on average than the poverty threshold level.
What is Inequality or Gini Index in Independent Hill?
Inequality or Gini Index in Independent Hill is 0.34.
What is the Total Population of Independent Hill?
Total Population of Independent Hill is 9,858.
What is the Total Male Population of Independent Hill?
Total Male Population of Independent Hill is 4,861.
What is the Total Female Population of Independent Hill?
Total Female Population of Independent Hill is 4,997.
What is the Ratio of Males per 100 Females in Independent Hill?
There are 97.28 Males per 100 Females in Independent Hill.
What is the Ratio of Females per 100 Males in Independent Hill?
There are 102.80 Females per 100 Males in Independent Hill.
What is the Median Population Age in Independent Hill?
Median Population Age in Independent Hill is 38.5 Years.
What is the Average Family Size in Independent Hill
Average Family Size in Independent Hill is 3.5 People.
What is the Average Household Size in Independent Hill
Average Household Size in Independent Hill is 3.3 People.
How Large is the Labor Force in Independent Hill?
There are 5,560 People in the Labor Forcein in Independent Hill.
What is the Percentage of People in the Labor Force in Independent Hill?
72.3% of People are in the Labor Force in Independent Hill.
What is the Unemployment Rate in Independent Hill?
Unemployment Rate in Independent Hill is 3.6%.