Zip Codes with the Highest Percentage of Population Taking Taxi / Cab to Work in Scranton, PA
RELATED REPORTS & OPTIONS
Taxi / Cab
Scranton
Compare Zip Codes
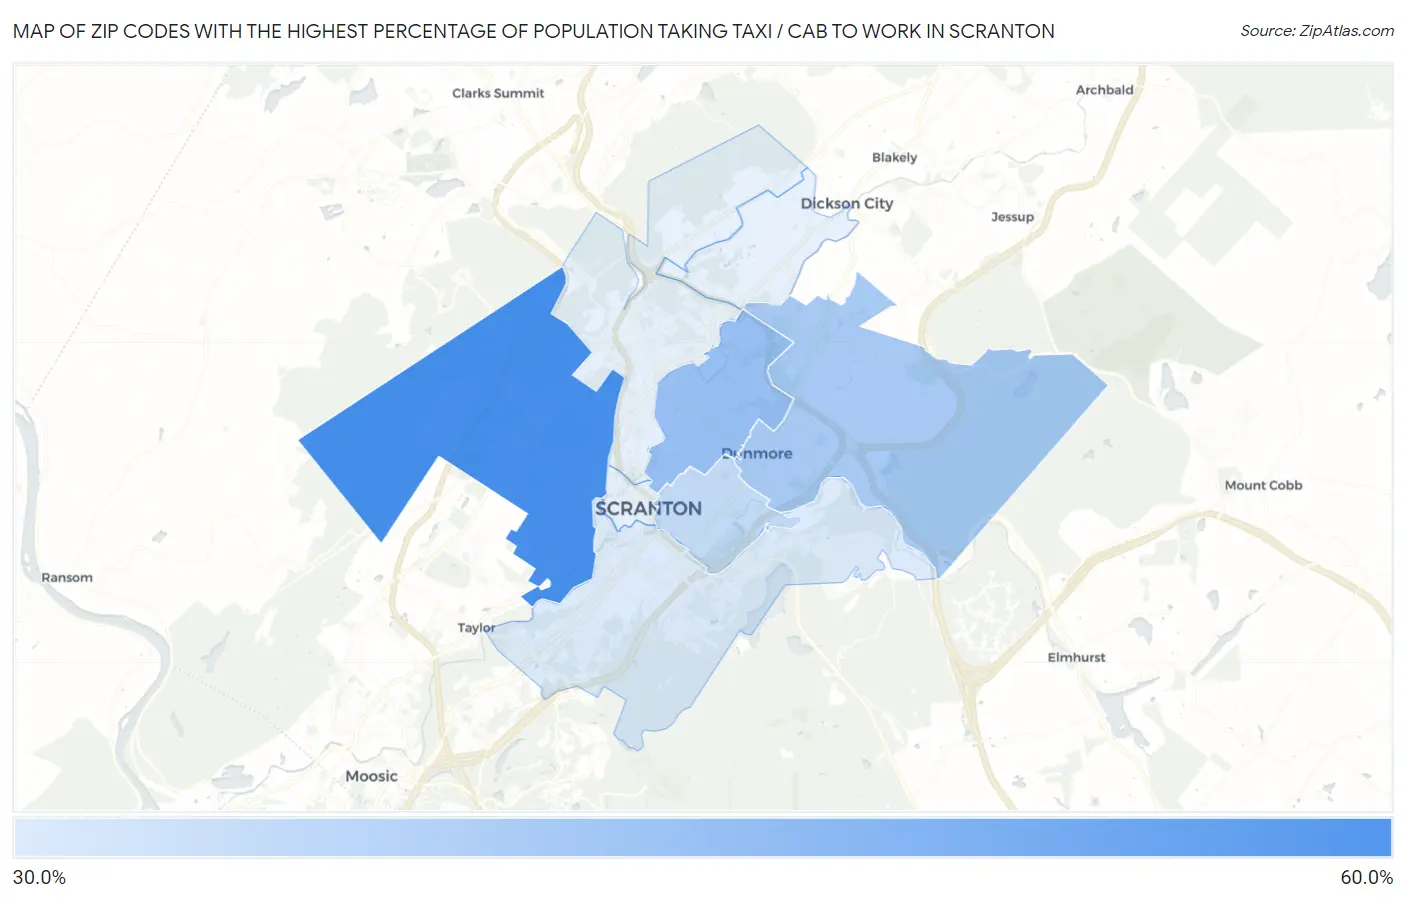
Map of Zip Codes with the Highest Percentage of Population Taking Taxi / Cab to Work in Scranton
31.4%
59.3%
Zip Codes with the Highest Percentage of Population Taking Taxi / Cab to Work in Scranton, PA
| Zip Code | % Take Taxi / Cab | vs State | vs National | |
| 1. | 18504 | 59.3% | 37.5%(+21.8)#33 | 38.2%(+21.1)#770 |
| 2. | 18509 | 43.4% | 37.5%(+5.90)#259 | 38.2%(+5.20)#5,237 |
| 3. | 18512 | 40.7% | 37.5%(+3.20)#311 | 38.2%(+2.50)#6,300 |
| 4. | 18510 | 35.8% | 37.5%(-1.70)#436 | 38.2%(-2.40)#8,526 |
| 5. | 18505 | 31.4% | 37.5%(-6.10)#523 | 38.2%(-6.80)#10,403 |
1
Common Questions
What are the Top 5 Zip Codes with the Highest Percentage of Population Taking Taxi / Cab to Work in Scranton, PA?
Top 5 Zip Codes with the Highest Percentage of Population Taking Taxi / Cab to Work in Scranton, PA are:
What zip code has the Highest Percentage of Population Taking Taxi / Cab to Work in Scranton, PA?
18504 has the Highest Percentage of Population Taking Taxi / Cab to Work in Scranton, PA with 59.3%.
What is the Percentage of Population Taking Taxi / Cab to Work in Scranton, PA?
Percentage of Population Taking Taxi / Cab to Work in Scranton is 36.4%.
What is the Percentage of Population Taking Taxi / Cab to Work in Pennsylvania?
Percentage of Population Taking Taxi / Cab to Work in Pennsylvania is 37.5%.
What is the Percentage of Population Taking Taxi / Cab to Work in the United States?
Percentage of Population Taking Taxi / Cab to Work in the United States is 38.2%.