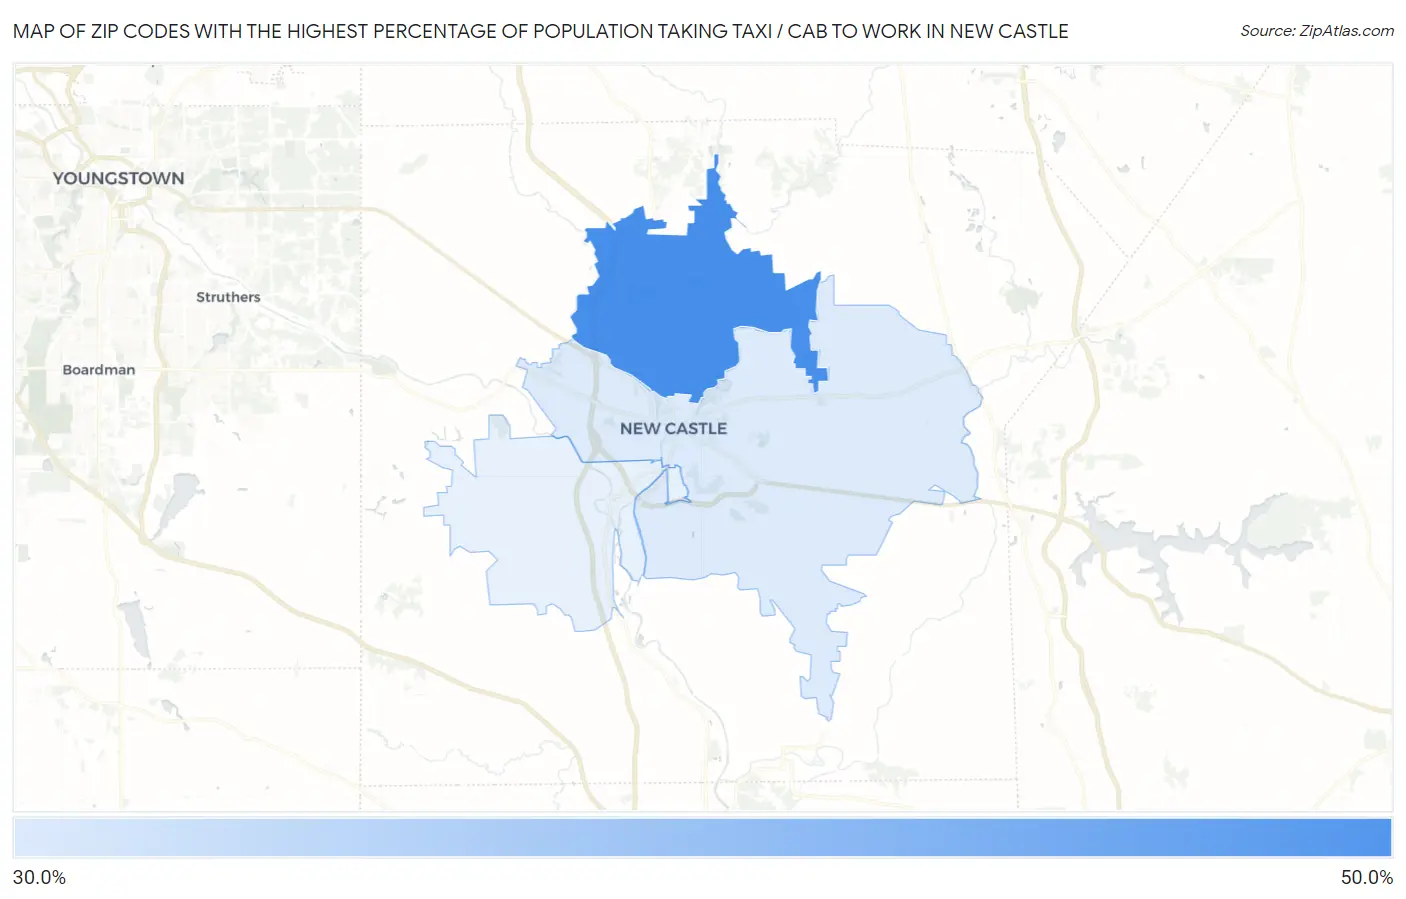
Zip Codes with the Highest Percentage of Population Taking Taxi / Cab to Work in New Castle, PA
RELATED REPORTS & OPTIONS
Taxi / Cab
New Castle
Compare Zip Codes
Map of Zip Codes with the Highest Percentage of Population Taking Taxi / Cab to Work in New Castle
36.4%
46.5%
Zip Codes with the Highest Percentage of Population Taking Taxi / Cab to Work in New Castle, PA
| Zip Code | % Take Taxi / Cab | vs State | vs National | |
| 1. | 16105 | 46.5% | 37.5%(+9.00)#211 | 38.2%(+8.30)#4,124 |
| 2. | 16101 | 36.4% | 37.5%(-1.10)#418 | 38.2%(-1.80)#8,257 |
1
Common Questions
What are the Top Zip Codes with the Highest Percentage of Population Taking Taxi / Cab to Work in New Castle, PA?
Top Zip Codes with the Highest Percentage of Population Taking Taxi / Cab to Work in New Castle, PA are:
What zip code has the Highest Percentage of Population Taking Taxi / Cab to Work in New Castle, PA?
16105 has the Highest Percentage of Population Taking Taxi / Cab to Work in New Castle, PA with 46.5%.
What is the Percentage of Population Taking Taxi / Cab to Work in New Castle, PA?
Percentage of Population Taking Taxi / Cab to Work in New Castle is 46.9%.
What is the Percentage of Population Taking Taxi / Cab to Work in Pennsylvania?
Percentage of Population Taking Taxi / Cab to Work in Pennsylvania is 37.5%.
What is the Percentage of Population Taking Taxi / Cab to Work in the United States?
Percentage of Population Taking Taxi / Cab to Work in the United States is 38.2%.