Dry Tavern, PA Map & Demographics
Dry Tavern Map
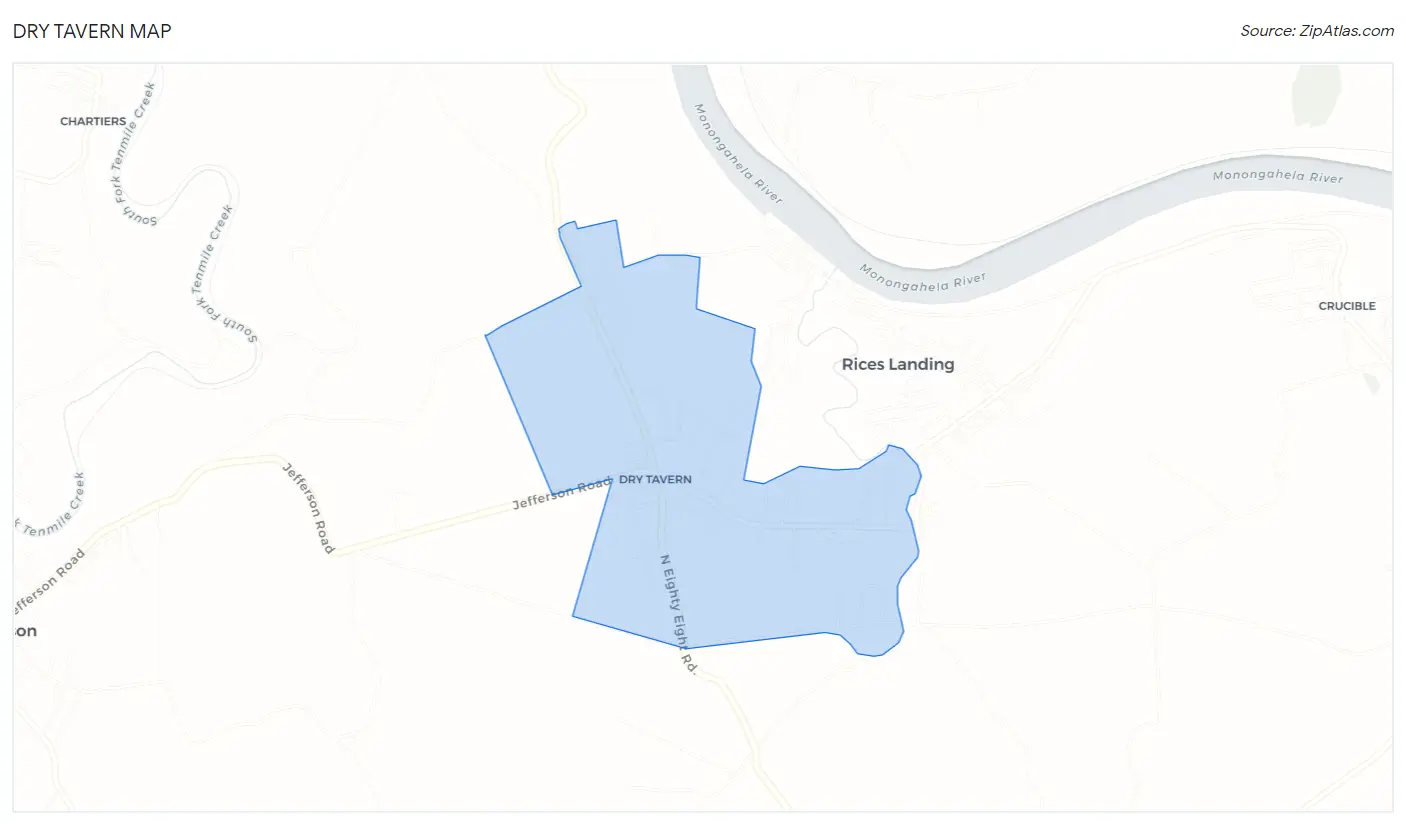
Dry Tavern Overview
$35,082
PER CAPITA INCOME
$82,857
AVG FAMILY INCOME
$68,750
AVG HOUSEHOLD INCOME
26.9%
WAGE / INCOME GAP [ % ]
73.1¢/ $1
WAGE / INCOME GAP [ $ ]
0.31
INEQUALITY / GINI INDEX
627
TOTAL POPULATION
332
MALE POPULATION
295
FEMALE POPULATION
112.54
MALES / 100 FEMALES
88.86
FEMALES / 100 MALES
47.9
MEDIAN AGE
3.1
AVG FAMILY SIZE
2.4
AVG HOUSEHOLD SIZE
325
LABOR FORCE [ PEOPLE ]
58.2%
PERCENT IN LABOR FORCE
12.9%
UNEMPLOYMENT RATE
Income in Dry Tavern
Income Overview in Dry Tavern
Per Capita Income in Dry Tavern is $35,082, while median incomes of families and households are $82,857 and $68,750 respectively.
| Characteristic | Number | Measure |
| Per Capita Income | 627 | $35,082 |
| Median Family Income | 160 | $82,857 |
| Mean Family Income | 160 | $85,676 |
| Median Household Income | 260 | $68,750 |
| Mean Household Income | 260 | $74,387 |
| Income Deficit | 160 | $0 |
| Wage / Income Gap (%) | 627 | 26.86% |
| Wage / Income Gap ($) | 627 | 73.14¢ per $1 |
| Gini / Inequality Index | 627 | 0.31 |
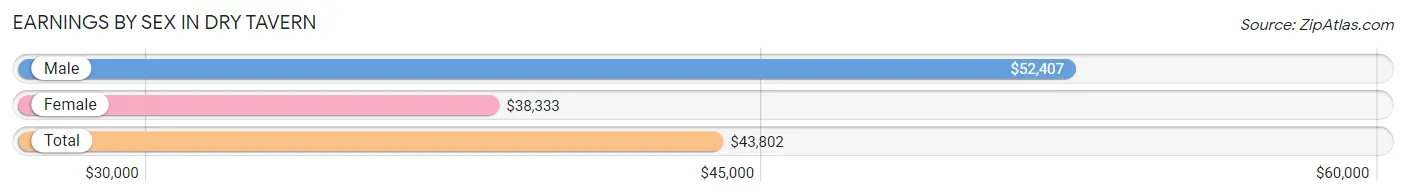
Earnings by Sex in Dry Tavern
Average Earnings in Dry Tavern are $43,802, $52,407 for men and $38,333 for women, a difference of 26.9%.
| Sex | Number | Average Earnings |
| Male | 164 (50.3%) | $52,407 |
| Female | 162 (49.7%) | $38,333 |
| Total | 326 (100.0%) | $43,802 |
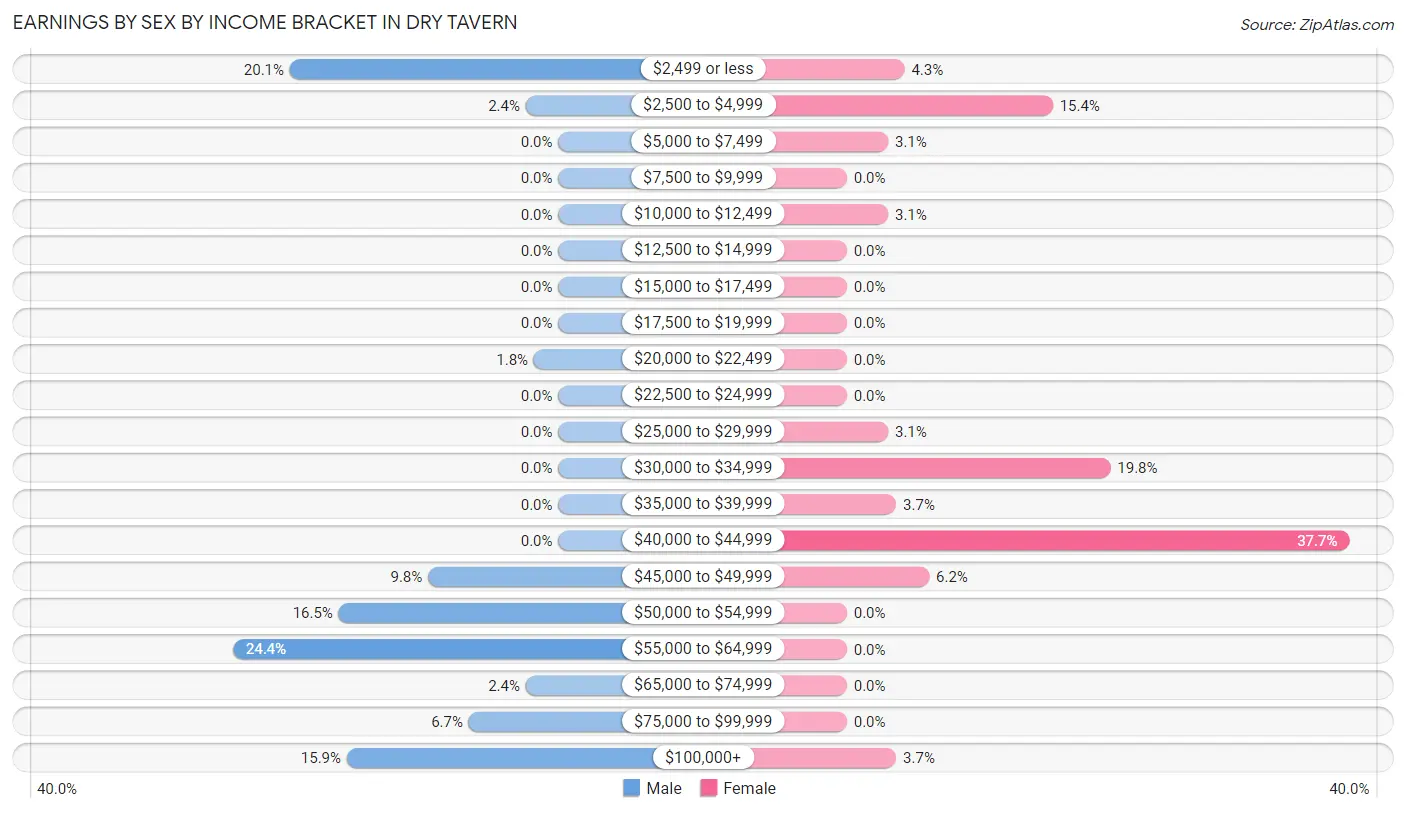
Earnings by Sex by Income Bracket in Dry Tavern
The most common earnings brackets in Dry Tavern are $55,000 to $64,999 for men (40 | 24.4%) and $40,000 to $44,999 for women (61 | 37.7%).
| Income | Male | Female |
| $2,499 or less | 33 (20.1%) | 7 (4.3%) |
| $2,500 to $4,999 | 4 (2.4%) | 25 (15.4%) |
| $5,000 to $7,499 | 0 (0.0%) | 5 (3.1%) |
| $7,500 to $9,999 | 0 (0.0%) | 0 (0.0%) |
| $10,000 to $12,499 | 0 (0.0%) | 5 (3.1%) |
| $12,500 to $14,999 | 0 (0.0%) | 0 (0.0%) |
| $15,000 to $17,499 | 0 (0.0%) | 0 (0.0%) |
| $17,500 to $19,999 | 0 (0.0%) | 0 (0.0%) |
| $20,000 to $22,499 | 3 (1.8%) | 0 (0.0%) |
| $22,500 to $24,999 | 0 (0.0%) | 0 (0.0%) |
| $25,000 to $29,999 | 0 (0.0%) | 5 (3.1%) |
| $30,000 to $34,999 | 0 (0.0%) | 32 (19.8%) |
| $35,000 to $39,999 | 0 (0.0%) | 6 (3.7%) |
| $40,000 to $44,999 | 0 (0.0%) | 61 (37.7%) |
| $45,000 to $49,999 | 16 (9.8%) | 10 (6.2%) |
| $50,000 to $54,999 | 27 (16.5%) | 0 (0.0%) |
| $55,000 to $64,999 | 40 (24.4%) | 0 (0.0%) |
| $65,000 to $74,999 | 4 (2.4%) | 0 (0.0%) |
| $75,000 to $99,999 | 11 (6.7%) | 0 (0.0%) |
| $100,000+ | 26 (15.9%) | 6 (3.7%) |
| Total | 164 (100.0%) | 162 (100.0%) |
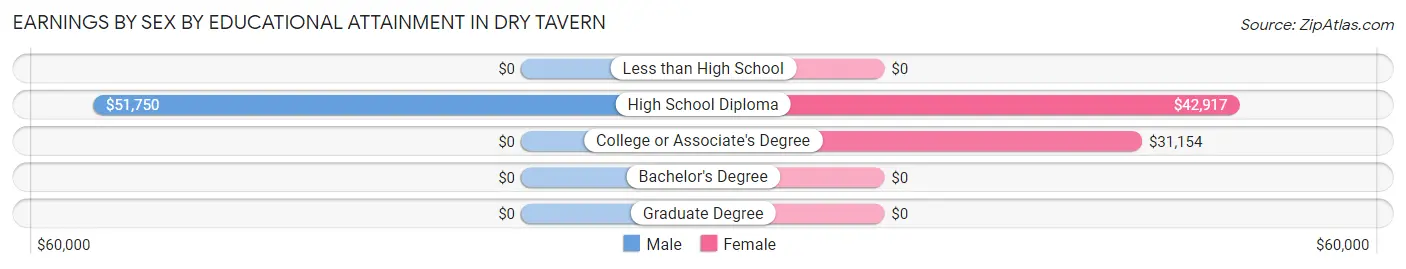
Earnings by Sex by Educational Attainment in Dry Tavern
Average earnings in Dry Tavern are $56,042 for men and $34,803 for women, a difference of 37.9%. Men with an educational attainment of high school diploma enjoy the highest average annual earnings of $51,750, while those with high school diploma education earn the least with $51,750. Women with an educational attainment of high school diploma earn the most with the average annual earnings of $42,917, while those with college or associate's degree education have the smallest earnings of $31,154.
| Educational Attainment | Male Income | Female Income |
| Less than High School | - | - |
| High School Diploma | $51,750 | $42,917 |
| College or Associate's Degree | - | - |
| Bachelor's Degree | - | - |
| Graduate Degree | - | - |
| Total | $56,042 | $34,803 |
Family Income in Dry Tavern
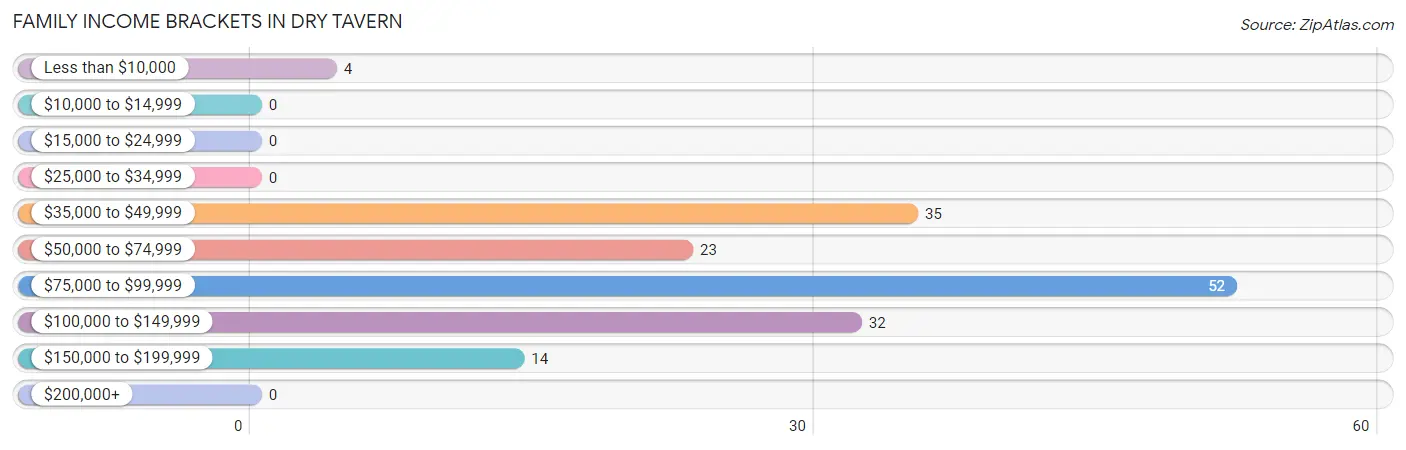
Family Income Brackets in Dry Tavern
According to the Dry Tavern family income data, there are 52 families falling into the $75,000 to $99,999 income range, which is the most common income bracket and makes up 32.5% of all families.
| Income Bracket | # Families | % Families |
| Less than $10,000 | 4 | 2.5% |
| $10,000 to $14,999 | 0 | 0.0% |
| $15,000 to $24,999 | 0 | 0.0% |
| $25,000 to $34,999 | 0 | 0.0% |
| $35,000 to $49,999 | 35 | 21.9% |
| $50,000 to $74,999 | 23 | 14.4% |
| $75,000 to $99,999 | 52 | 32.5% |
| $100,000 to $149,999 | 32 | 20.0% |
| $150,000 to $199,999 | 14 | 8.8% |
| $200,000+ | 0 | 0.0% |
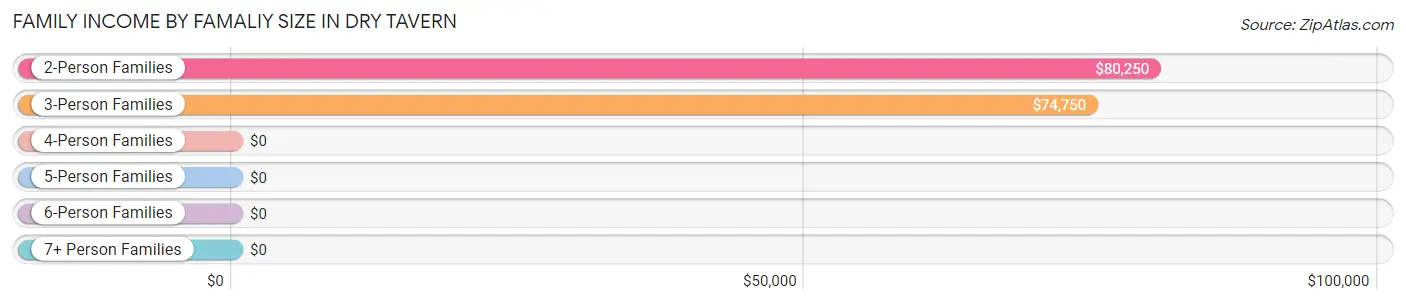
Family Income by Famaliy Size in Dry Tavern
2-person families (115 | 71.9%) account for the highest median family income in Dry Tavern with $80,250 per family, while 2-person families (115 | 71.9%) have the highest median income of $40,125 per family member.
| Income Bracket | # Families | Median Income |
| 2-Person Families | 115 (71.9%) | $80,250 |
| 3-Person Families | 19 (11.9%) | $74,750 |
| 4-Person Families | 3 (1.9%) | $0 |
| 5-Person Families | 9 (5.6%) | $0 |
| 6-Person Families | 0 (0.0%) | $0 |
| 7+ Person Families | 14 (8.7%) | $0 |
| Total | 160 (100.0%) | $82,857 |
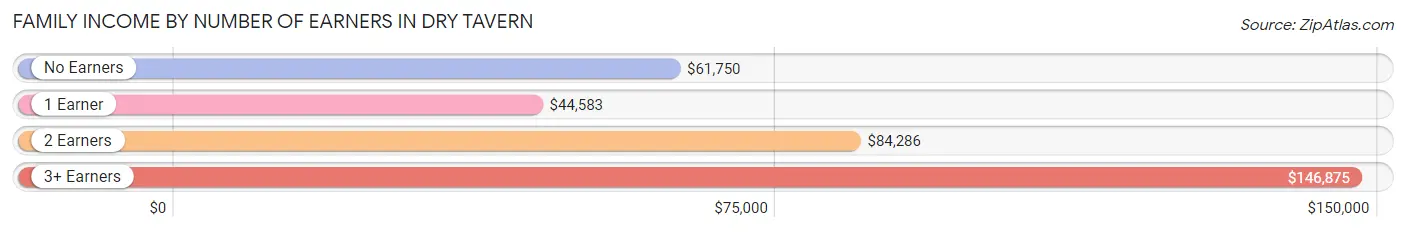
Family Income by Number of Earners in Dry Tavern
The median family income in Dry Tavern is $82,857, with families comprising 3+ earners (30) having the highest median family income of $146,875, while families with 1 earner (33) have the lowest median family income of $44,583, accounting for 18.8% and 20.6% of families, respectively.
| Number of Earners | # Families | Median Income |
| No Earners | 47 (29.4%) | $61,750 |
| 1 Earner | 33 (20.6%) | $44,583 |
| 2 Earners | 50 (31.2%) | $84,286 |
| 3+ Earners | 30 (18.8%) | $146,875 |
| Total | 160 (100.0%) | $82,857 |
Household Income in Dry Tavern
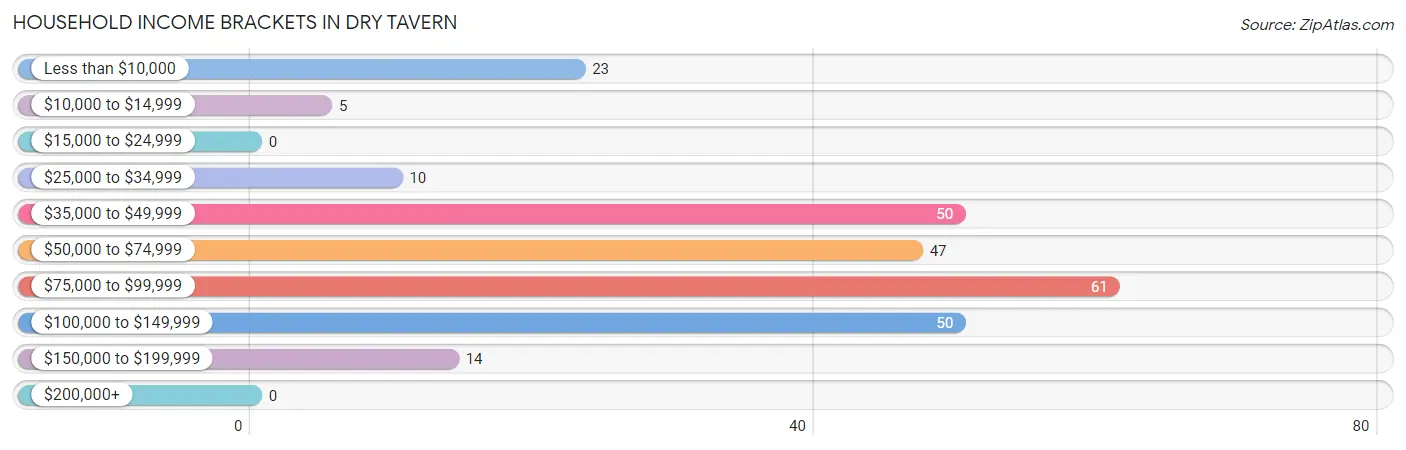
Household Income Brackets in Dry Tavern
With 61 households falling in the category, the $75,000 to $99,999 income range is the most frequent in Dry Tavern, accounting for 23.5% of all households.
| Income Bracket | # Households | % Households |
| Less than $10,000 | 23 | 8.8% |
| $10,000 to $14,999 | 5 | 1.9% |
| $15,000 to $24,999 | 0 | 0.0% |
| $25,000 to $34,999 | 10 | 3.8% |
| $35,000 to $49,999 | 50 | 19.2% |
| $50,000 to $74,999 | 47 | 18.1% |
| $75,000 to $99,999 | 61 | 23.5% |
| $100,000 to $149,999 | 50 | 19.2% |
| $150,000 to $199,999 | 14 | 5.4% |
| $200,000+ | 0 | 0.0% |
Household Income by Householder Age in Dry Tavern
The median household income in Dry Tavern is $68,750, with the highest median household income of $110,125 found in the 25 to 44 years age bracket for the primary householder. A total of 61 households (23.5%) fall into this category.
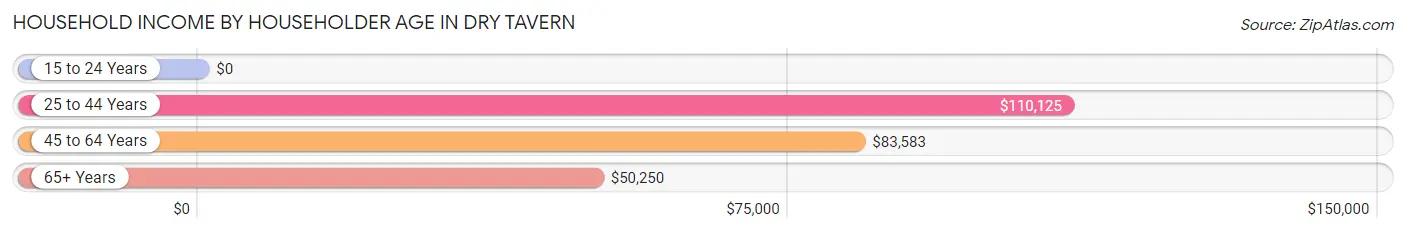
| Income Bracket | # Households | Median Income |
| 15 to 24 Years | 0 (0.0%) | $0 |
| 25 to 44 Years | 61 (23.5%) | $110,125 |
| 45 to 64 Years | 90 (34.6%) | $83,583 |
| 65+ Years | 109 (41.9%) | $50,250 |
| Total | 260 (100.0%) | $68,750 |
Poverty in Dry Tavern
Income Below Poverty by Sex and Age in Dry Tavern
With 12.1% poverty level for males and 1.4% for females among the residents of Dry Tavern, 35 to 44 year old males and 55 to 64 year old females are the most vulnerable to poverty, with 25 males (34.3%) and 4 females (6.9%) in their respective age groups living below the poverty level.
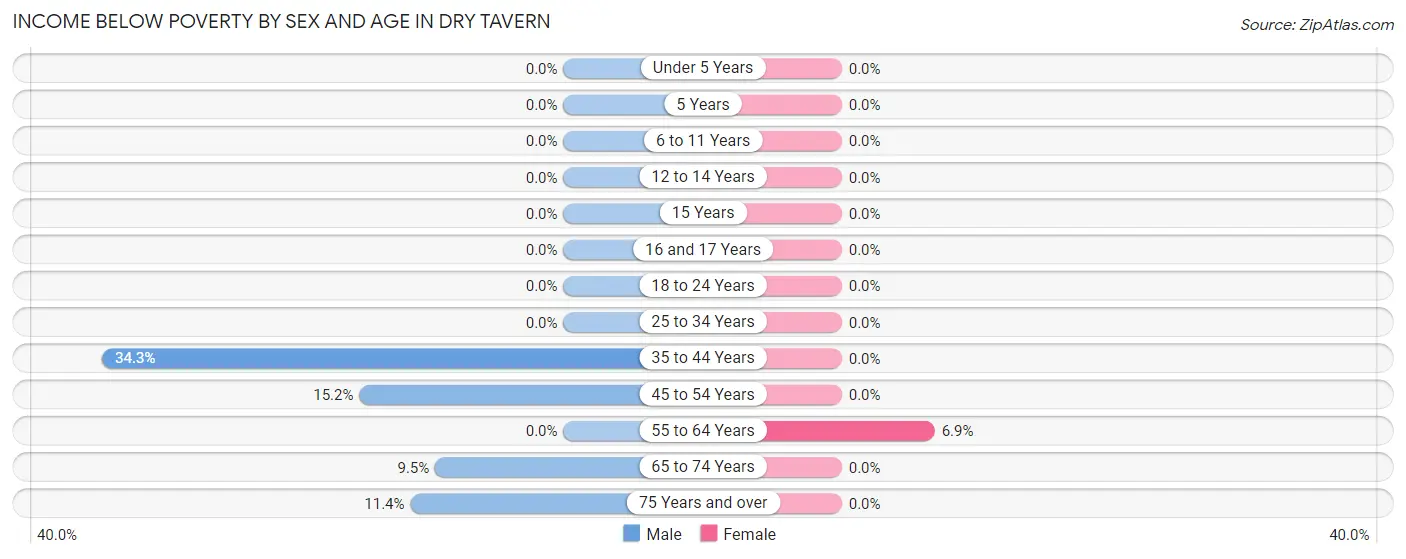
| Age Bracket | Male | Female |
| Under 5 Years | 0 (0.0%) | 0 (0.0%) |
| 5 Years | 0 (0.0%) | 0 (0.0%) |
| 6 to 11 Years | 0 (0.0%) | 0 (0.0%) |
| 12 to 14 Years | 0 (0.0%) | 0 (0.0%) |
| 15 Years | 0 (0.0%) | 0 (0.0%) |
| 16 and 17 Years | 0 (0.0%) | 0 (0.0%) |
| 18 to 24 Years | 0 (0.0%) | 0 (0.0%) |
| 25 to 34 Years | 0 (0.0%) | 0 (0.0%) |
| 35 to 44 Years | 25 (34.3%) | 0 (0.0%) |
| 45 to 54 Years | 5 (15.1%) | 0 (0.0%) |
| 55 to 64 Years | 0 (0.0%) | 4 (6.9%) |
| 65 to 74 Years | 4 (9.5%) | 0 (0.0%) |
| 75 Years and over | 5 (11.4%) | 0 (0.0%) |
| Total | 39 (12.1%) | 4 (1.4%) |
Income Above Poverty by Sex and Age in Dry Tavern
According to the poverty statistics in Dry Tavern, males aged 6 to 11 years and females aged 12 to 14 years are the age groups that are most secure financially, with 100.0% of males and 100.0% of females in these age groups living above the poverty line.
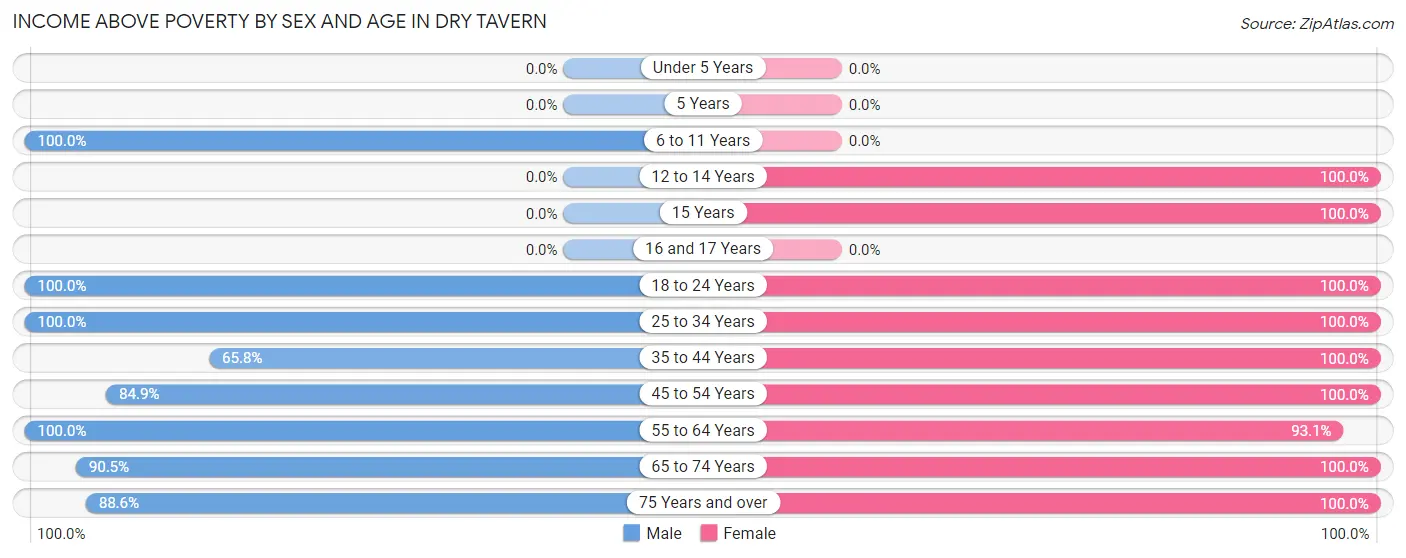
| Age Bracket | Male | Female |
| Under 5 Years | 0 (0.0%) | 0 (0.0%) |
| 5 Years | 0 (0.0%) | 0 (0.0%) |
| 6 to 11 Years | 35 (100.0%) | 0 (0.0%) |
| 12 to 14 Years | 0 (0.0%) | 17 (100.0%) |
| 15 Years | 0 (0.0%) | 8 (100.0%) |
| 16 and 17 Years | 0 (0.0%) | 0 (0.0%) |
| 18 to 24 Years | 52 (100.0%) | 10 (100.0%) |
| 25 to 34 Years | 20 (100.0%) | 23 (100.0%) |
| 35 to 44 Years | 48 (65.7%) | 24 (100.0%) |
| 45 to 54 Years | 28 (84.9%) | 66 (100.0%) |
| 55 to 64 Years | 24 (100.0%) | 54 (93.1%) |
| 65 to 74 Years | 38 (90.5%) | 49 (100.0%) |
| 75 Years and over | 39 (88.6%) | 40 (100.0%) |
| Total | 284 (87.9%) | 291 (98.6%) |
Income Below Poverty Among Married-Couple Families in Dry Tavern
The poverty statistics for married-couple families in Dry Tavern show that 3.0% or 4 of the total 131 families live below the poverty line. Families with no children have the highest poverty rate of 3.6%, comprising of 4 families. On the other hand, families with 1 or 2 children have the lowest poverty rate of 0.0%, which includes 0 families.
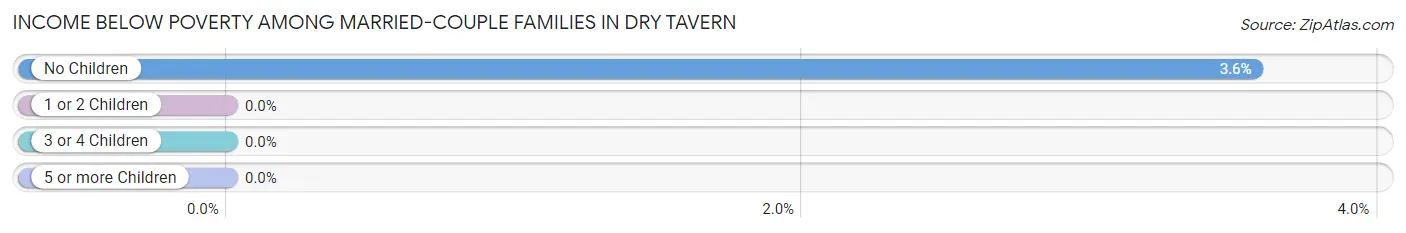
| Children | Above Poverty | Below Poverty |
| No Children | 108 (96.4%) | 4 (3.6%) |
| 1 or 2 Children | 5 (100.0%) | 0 (0.0%) |
| 3 or 4 Children | 14 (100.0%) | 0 (0.0%) |
| 5 or more Children | 0 (0.0%) | 0 (0.0%) |
| Total | 127 (97.0%) | 4 (3.0%) |
Income Below Poverty Among Single-Parent Households in Dry Tavern
| Children | Single Father | Single Mother |
| No Children | 0 (0.0%) | 0 (0.0%) |
| 1 or 2 Children | 0 (0.0%) | 0 (0.0%) |
| 3 or 4 Children | 0 (0.0%) | 0 (0.0%) |
| 5 or more Children | 0 (0.0%) | 0 (0.0%) |
| Total | 0 (0.0%) | 0 (0.0%) |
Income Below Poverty Among Married-Couple vs Single-Parent Households in Dry Tavern
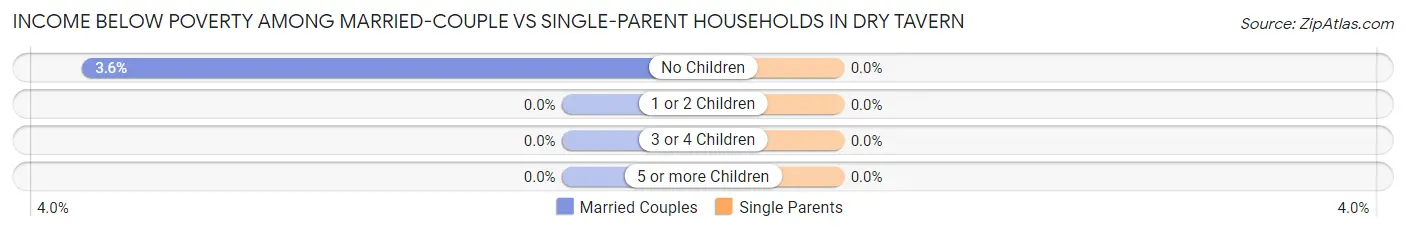
| Children | Married-Couple Families | Single-Parent Households |
| No Children | 4 (3.6%) | 0 (0.0%) |
| 1 or 2 Children | 0 (0.0%) | 0 (0.0%) |
| 3 or 4 Children | 0 (0.0%) | 0 (0.0%) |
| 5 or more Children | 0 (0.0%) | 0 (0.0%) |
| Total | 4 (3.0%) | 0 (0.0%) |
Race in Dry Tavern
The most populous races in Dry Tavern are White / Caucasian (627 | 100.0%), and Hispanic or Latino (7 | 1.1%).
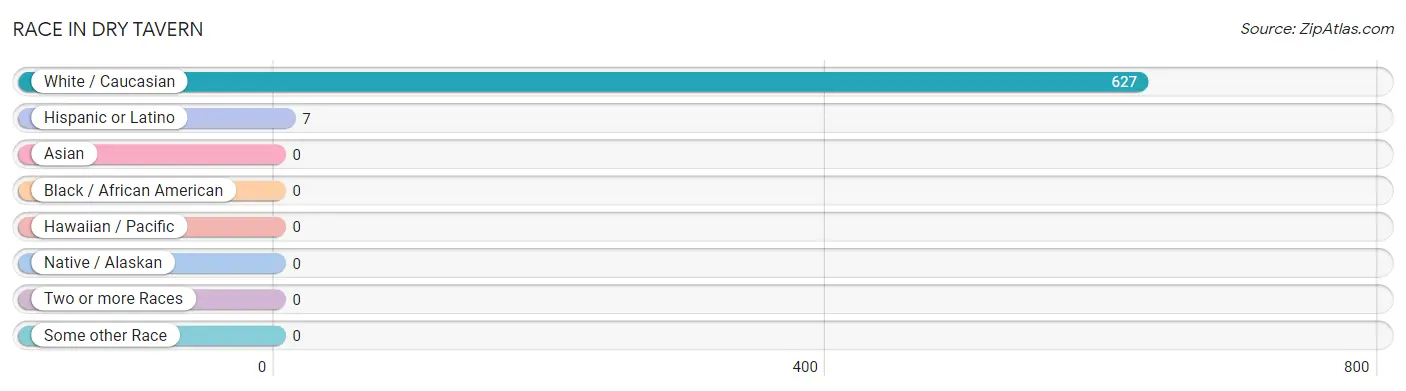
| Race | # Population | % Population |
| Asian | 0 | 0.0% |
| Black / African American | 0 | 0.0% |
| Hawaiian / Pacific | 0 | 0.0% |
| Hispanic or Latino | 7 | 1.1% |
| Native / Alaskan | 0 | 0.0% |
| White / Caucasian | 627 | 100.0% |
| Two or more Races | 0 | 0.0% |
| Some other Race | 0 | 0.0% |
| Total | 627 | 100.0% |
Ancestry in Dry Tavern
The most populous ancestries reported in Dry Tavern are English (104 | 16.6%), Irish (85 | 13.6%), Polish (70 | 11.2%), Italian (53 | 8.5%), and German (51 | 8.1%), together accounting for 57.9% of all Dry Tavern residents.
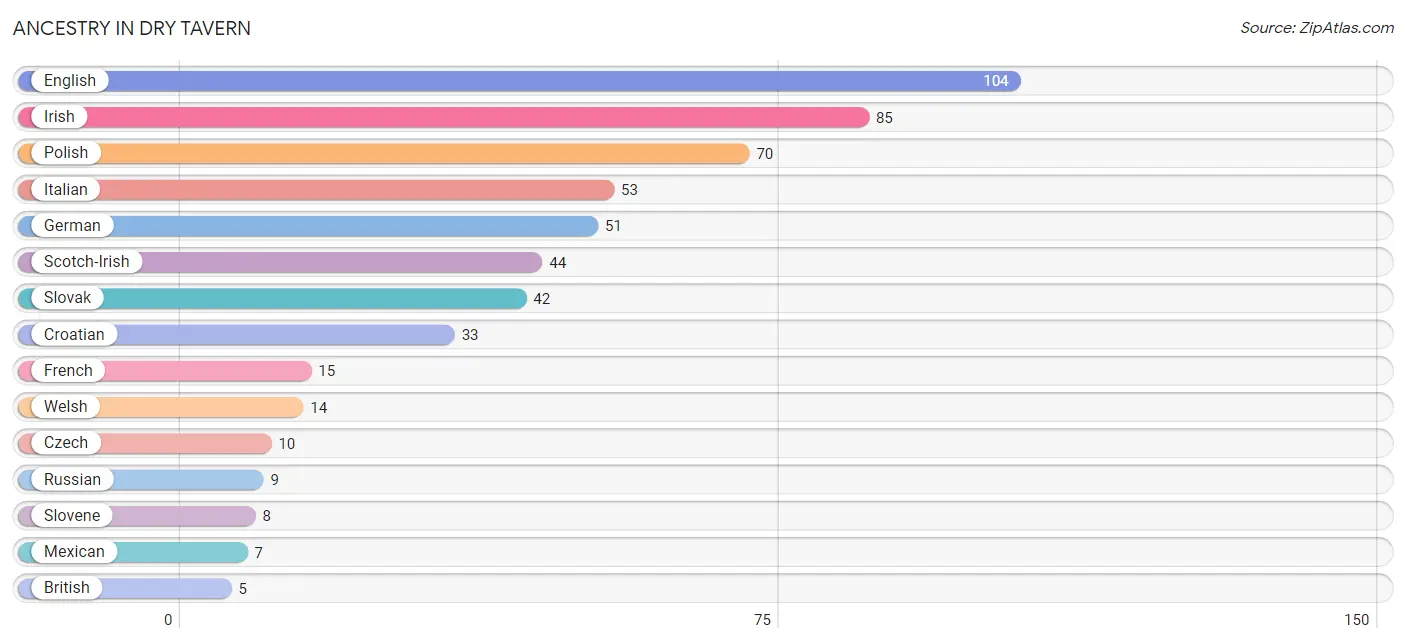
| Ancestry | # Population | % Population |
| British | 5 | 0.8% |
| Croatian | 33 | 5.3% |
| Czech | 10 | 1.6% |
| Eastern European | 3 | 0.5% |
| English | 104 | 16.6% |
| French | 15 | 2.4% |
| German | 51 | 8.1% |
| Hungarian | 4 | 0.6% |
| Irish | 85 | 13.6% |
| Italian | 53 | 8.5% |
| Mexican | 7 | 1.1% |
| Polish | 70 | 11.2% |
| Russian | 9 | 1.4% |
| Scotch-Irish | 44 | 7.0% |
| Slovak | 42 | 6.7% |
| Slovene | 8 | 1.3% |
| Welsh | 14 | 2.2% | View All 17 Rows |
Immigrants in Dry Tavern

| Immigration Origin | # Population | % Population | View All 0 Rows |
Sex and Age in Dry Tavern
Sex and Age in Dry Tavern
The most populous age groups in Dry Tavern are 40 to 44 Years (53 | 16.0%) for men and 45 to 49 Years (48 | 16.3%) for women.
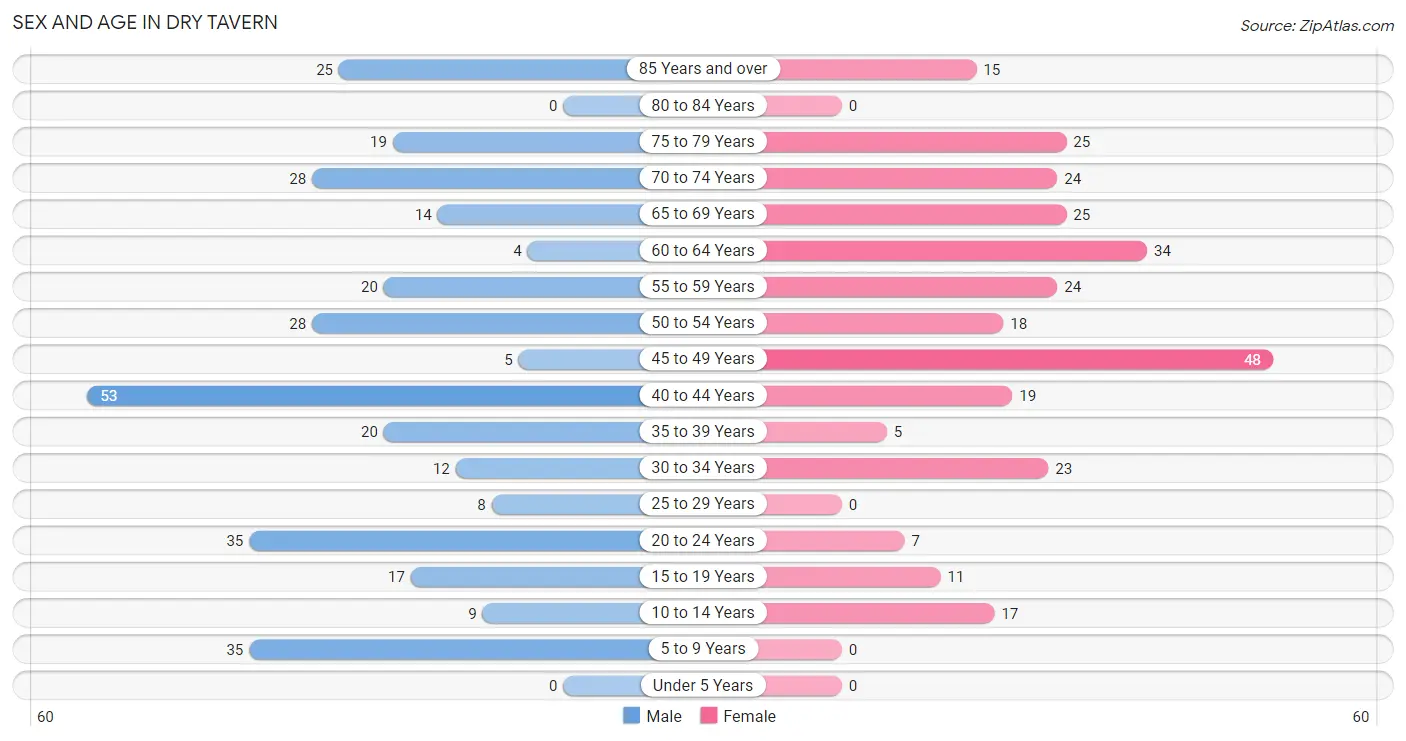
| Age Bracket | Male | Female |
| Under 5 Years | 0 (0.0%) | 0 (0.0%) |
| 5 to 9 Years | 35 (10.5%) | 0 (0.0%) |
| 10 to 14 Years | 9 (2.7%) | 17 (5.8%) |
| 15 to 19 Years | 17 (5.1%) | 11 (3.7%) |
| 20 to 24 Years | 35 (10.5%) | 7 (2.4%) |
| 25 to 29 Years | 8 (2.4%) | 0 (0.0%) |
| 30 to 34 Years | 12 (3.6%) | 23 (7.8%) |
| 35 to 39 Years | 20 (6.0%) | 5 (1.7%) |
| 40 to 44 Years | 53 (16.0%) | 19 (6.4%) |
| 45 to 49 Years | 5 (1.5%) | 48 (16.3%) |
| 50 to 54 Years | 28 (8.4%) | 18 (6.1%) |
| 55 to 59 Years | 20 (6.0%) | 24 (8.1%) |
| 60 to 64 Years | 4 (1.2%) | 34 (11.5%) |
| 65 to 69 Years | 14 (4.2%) | 25 (8.5%) |
| 70 to 74 Years | 28 (8.4%) | 24 (8.1%) |
| 75 to 79 Years | 19 (5.7%) | 25 (8.5%) |
| 80 to 84 Years | 0 (0.0%) | 0 (0.0%) |
| 85 Years and over | 25 (7.5%) | 15 (5.1%) |
| Total | 332 (100.0%) | 295 (100.0%) |
Families and Households in Dry Tavern
Median Family Size in Dry Tavern
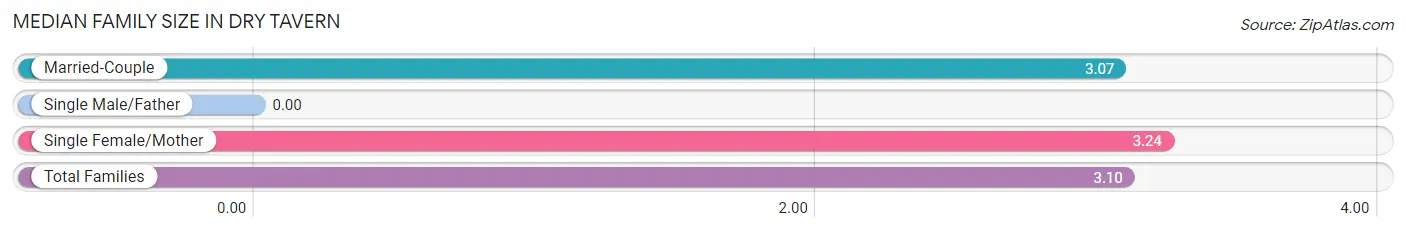
| Family Type | # Families | Family Size |
| Married-Couple | 131 (81.9%) | 3.07 |
| Single Male/Father | 0 (0.0%) | - |
| Single Female/Mother | 29 (18.1%) | 3.24 |
| Total Families | 160 (100.0%) | 3.10 |
Median Household Size in Dry Tavern
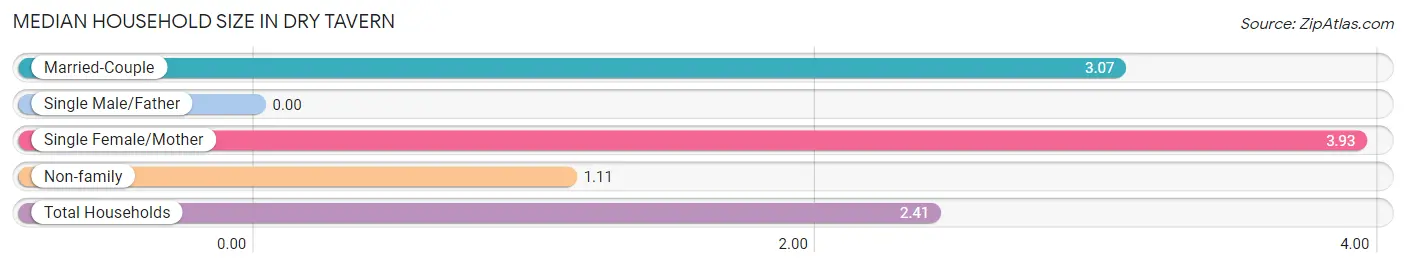
| Household Type | # Households | Household Size |
| Married-Couple | 131 (50.4%) | 3.07 |
| Single Male/Father | 0 (0.0%) | - |
| Single Female/Mother | 29 (11.2%) | 3.93 |
| Non-family | 100 (38.5%) | 1.11 |
| Total Households | 260 (100.0%) | 2.41 |
Household Size by Marriage Status in Dry Tavern
Out of a total of 260 households in Dry Tavern, 160 (61.5%) are family households, while 100 (38.5%) are nonfamily households. The most numerous type of family households are 2-person households, comprising 115, and the most common type of nonfamily households are 1-person households, comprising 87.
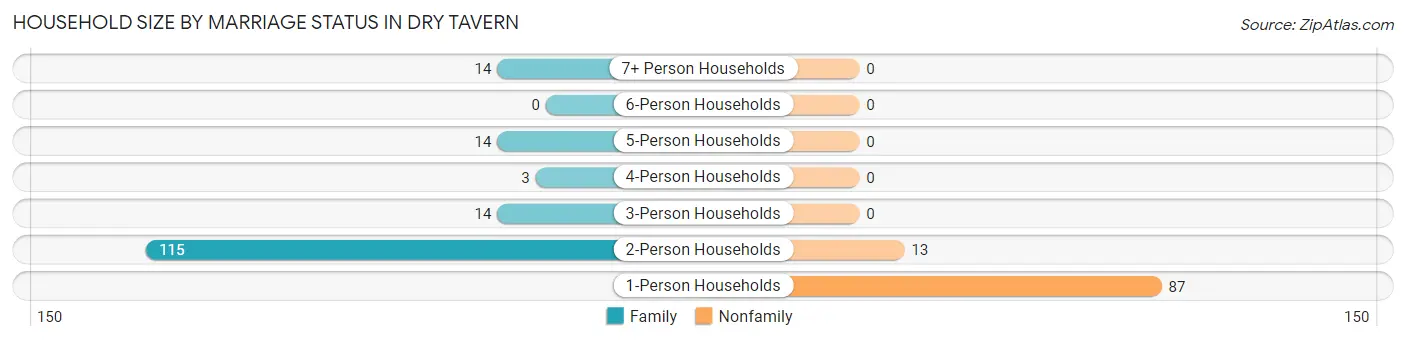
| Household Size | Family Households | Nonfamily Households |
| 1-Person Households | - | 87 (33.5%) |
| 2-Person Households | 115 (44.2%) | 13 (5.0%) |
| 3-Person Households | 14 (5.4%) | 0 (0.0%) |
| 4-Person Households | 3 (1.1%) | 0 (0.0%) |
| 5-Person Households | 14 (5.4%) | 0 (0.0%) |
| 6-Person Households | 0 (0.0%) | 0 (0.0%) |
| 7+ Person Households | 14 (5.4%) | 0 (0.0%) |
| Total | 160 (61.5%) | 100 (38.5%) |
Female Fertility in Dry Tavern
Fertility by Age in Dry Tavern
| Age Bracket | Women with Births | Births / 1,000 Women |
| 15 to 19 years | 0 (0.0%) | 0.0 |
| 20 to 34 years | 0 (0.0%) | 0.0 |
| 35 to 50 years | 0 (0.0%) | 0.0 |
| Total | 0 (0.0%) | 0.0 |
Fertility by Age by Marriage Status in Dry Tavern
| Age Bracket | Married | Unmarried |
| 15 to 19 years | 0 (0.0%) | 0 (0.0%) |
| 20 to 34 years | 0 (0.0%) | 0 (0.0%) |
| 35 to 50 years | 0 (0.0%) | 0 (0.0%) |
| Total | 0 (0.0%) | 0 (0.0%) |
Fertility by Education in Dry Tavern
| Educational Attainment | Women with Births | Births / 1,000 Women |
| Less than High School | 0 (0.0%) | 0.0 |
| High School Diploma | 0 (0.0%) | 0.0 |
| College or Associate's Degree | 0 (0.0%) | 0.0 |
| Bachelor's Degree | 0 (0.0%) | 0.0 |
| Graduate Degree | 0 (0.0%) | 0.0 |
| Total | 0 (0.0%) | 0.0 |
Fertility by Education by Marriage Status in Dry Tavern
| Educational Attainment | Married | Unmarried |
| Less than High School | 0 (0.0%) | 0 (0.0%) |
| High School Diploma | 0 (0.0%) | 0 (0.0%) |
| College or Associate's Degree | 0 (0.0%) | 0 (0.0%) |
| Bachelor's Degree | 0 (0.0%) | 0 (0.0%) |
| Graduate Degree | 0 (0.0%) | 0 (0.0%) |
| Total | 0 (0.0%) | 0 (0.0%) |
Employment Characteristics in Dry Tavern
Employment by Class of Employer in Dry Tavern
Among the 278 employed individuals in Dry Tavern, private company employees (148 | 53.2%), not-for-profit organizations (55 | 19.8%), and local government employees (49 | 17.6%) make up the most common classes of employment.
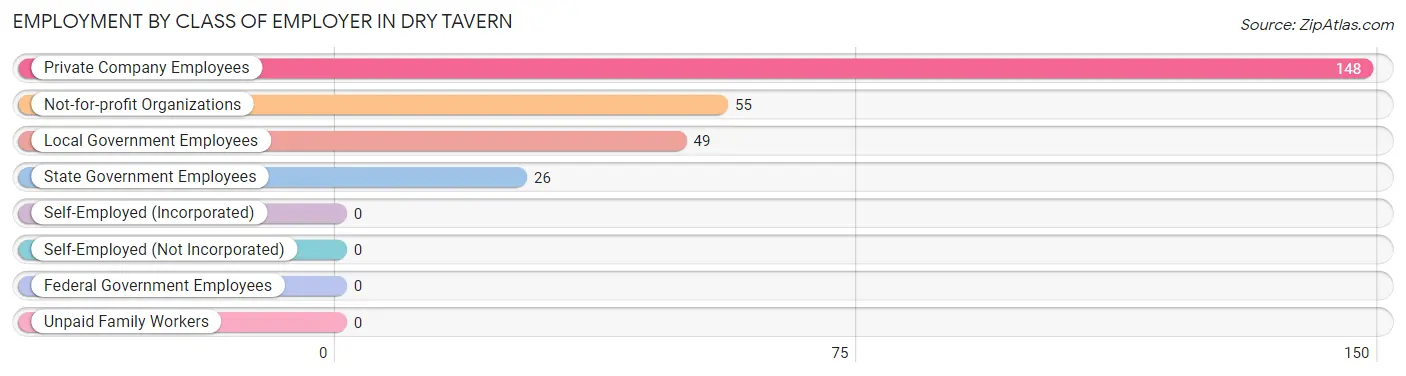
| Employer Class | # Employees | % Employees |
| Private Company Employees | 148 | 53.2% |
| Self-Employed (Incorporated) | 0 | 0.0% |
| Self-Employed (Not Incorporated) | 0 | 0.0% |
| Not-for-profit Organizations | 55 | 19.8% |
| Local Government Employees | 49 | 17.6% |
| State Government Employees | 26 | 9.3% |
| Federal Government Employees | 0 | 0.0% |
| Unpaid Family Workers | 0 | 0.0% |
| Total | 278 | 100.0% |
Employment Status by Age in Dry Tavern
According to the labor force statistics for Dry Tavern, out of the total population over 16 years of age (558), 58.2% or 325 individuals are in the labor force, with 12.9% or 42 of them unemployed. The age group with the highest labor force participation rate is 20 to 24 years, with 100.0% or 42 individuals in the labor force. Within the labor force, the 35 to 44 years age range has the highest percentage of unemployed individuals, with 37.7% or 20 of them being unemployed.
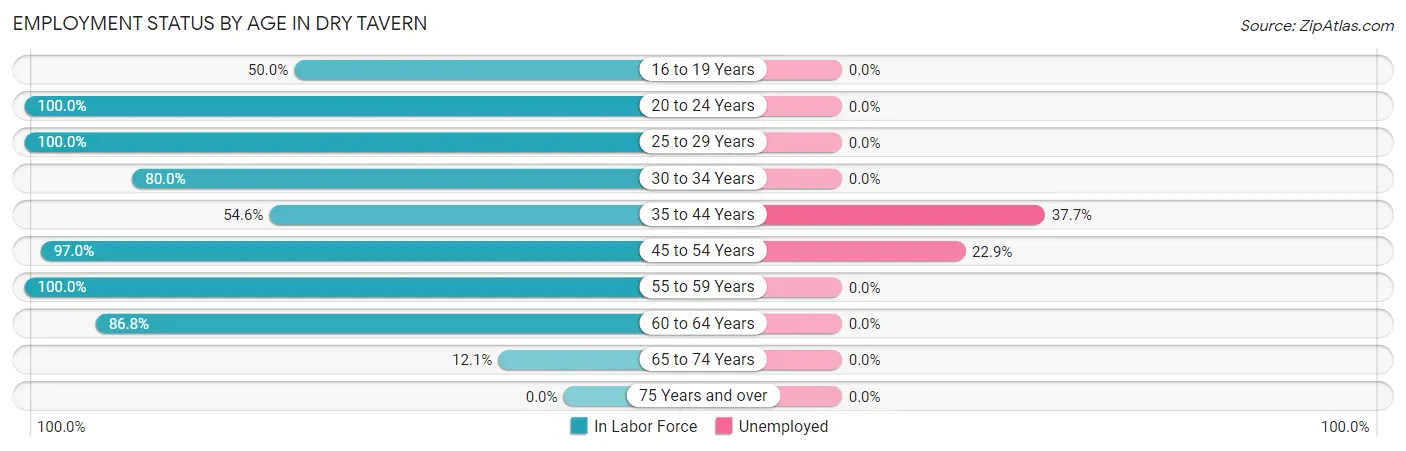
| Age Bracket | In Labor Force | Unemployed |
| 16 to 19 Years | 10 (50.0%) | 0 (0.0%) |
| 20 to 24 Years | 42 (100.0%) | 0 (0.0%) |
| 25 to 29 Years | 8 (100.0%) | 0 (0.0%) |
| 30 to 34 Years | 28 (80.0%) | 0 (0.0%) |
| 35 to 44 Years | 53 (54.6%) | 20 (37.7%) |
| 45 to 54 Years | 96 (97.0%) | 22 (22.9%) |
| 55 to 59 Years | 44 (100.0%) | 0 (0.0%) |
| 60 to 64 Years | 33 (86.8%) | 0 (0.0%) |
| 65 to 74 Years | 11 (12.1%) | 0 (0.0%) |
| 75 Years and over | 0 (0.0%) | 0 (0.0%) |
| Total | 325 (58.2%) | 42 (12.9%) |
Employment Status by Educational Attainment in Dry Tavern
According to labor force statistics for Dry Tavern, 81.6% of individuals (262) out of the total population between 25 and 64 years of age (321) are in the labor force, with 16.0% or 42 of them being unemployed. The group with the highest labor force participation rate are those with the educational attainment of less than high school, with 100.0% or 11 individuals in the labor force. Within the labor force, individuals with high school diploma education have the highest percentage of unemployment, with 24.8% or 37 of them being unemployed.
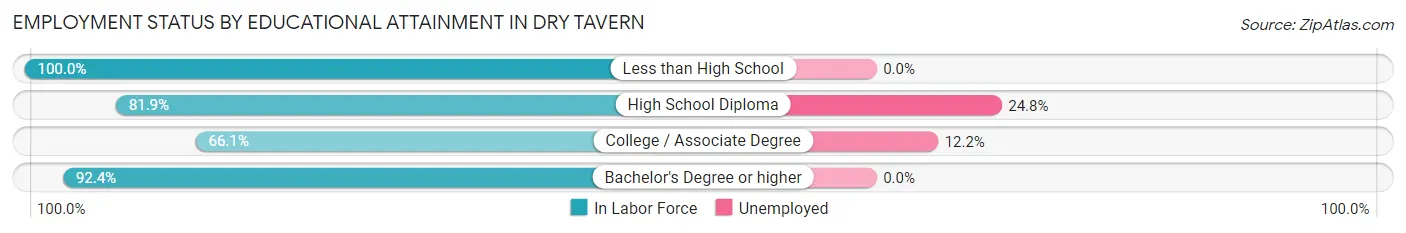
| Educational Attainment | In Labor Force | Unemployed |
| Less than High School | 11 (100.0%) | 0 (0.0%) |
| High School Diploma | 149 (81.9%) | 45 (24.8%) |
| College / Associate Degree | 41 (66.1%) | 8 (12.2%) |
| Bachelor's Degree or higher | 61 (92.4%) | 0 (0.0%) |
| Total | 262 (81.6%) | 51 (16.0%) |
Employment Occupations by Sex in Dry Tavern
Management, Business, Science and Arts Occupations
The most common Management, Business, Science and Arts occupations in Dry Tavern are Community & Social Service (23 | 8.1%), Education Instruction & Library (23 | 8.1%), Health Diagnosing & Treating (18 | 6.4%), Management (10 | 3.5%), and Computers, Engineering & Science (5 | 1.8%).
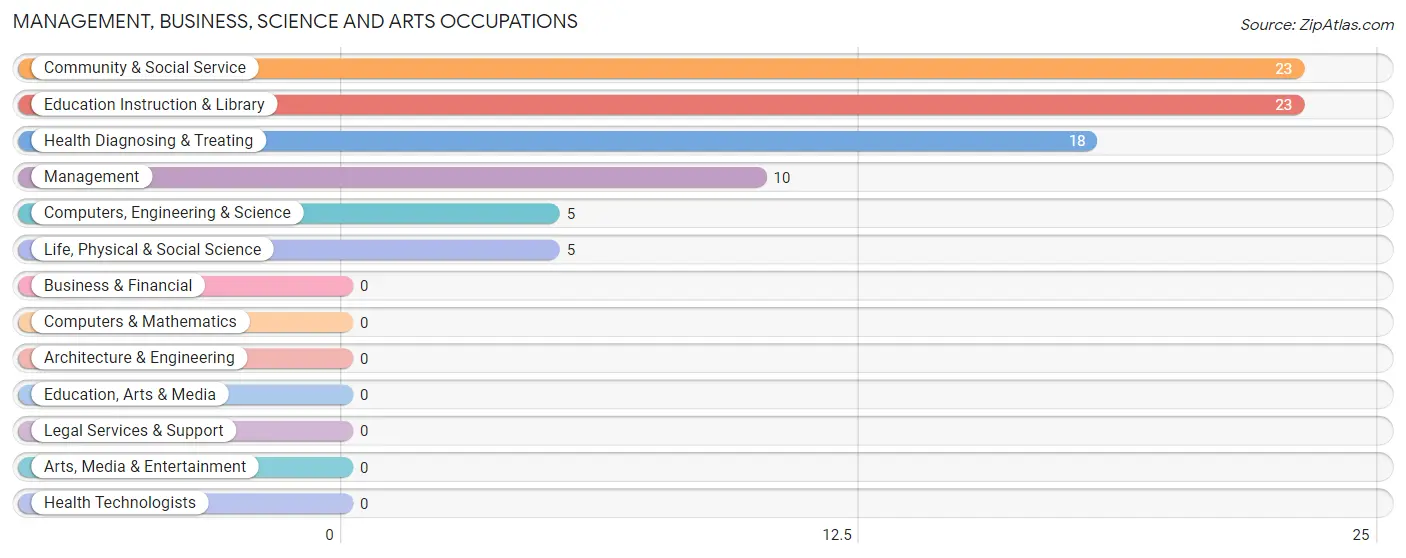
Management, Business, Science and Arts Occupations by Sex
Within the Management, Business, Science and Arts occupations in Dry Tavern, the most male-oriented occupations are Management (100.0%), Computers, Engineering & Science (100.0%), and Life, Physical & Social Science (100.0%), while the most female-oriented occupations are Community & Social Service (100.0%), Education Instruction & Library (100.0%), and Health Diagnosing & Treating (83.3%).
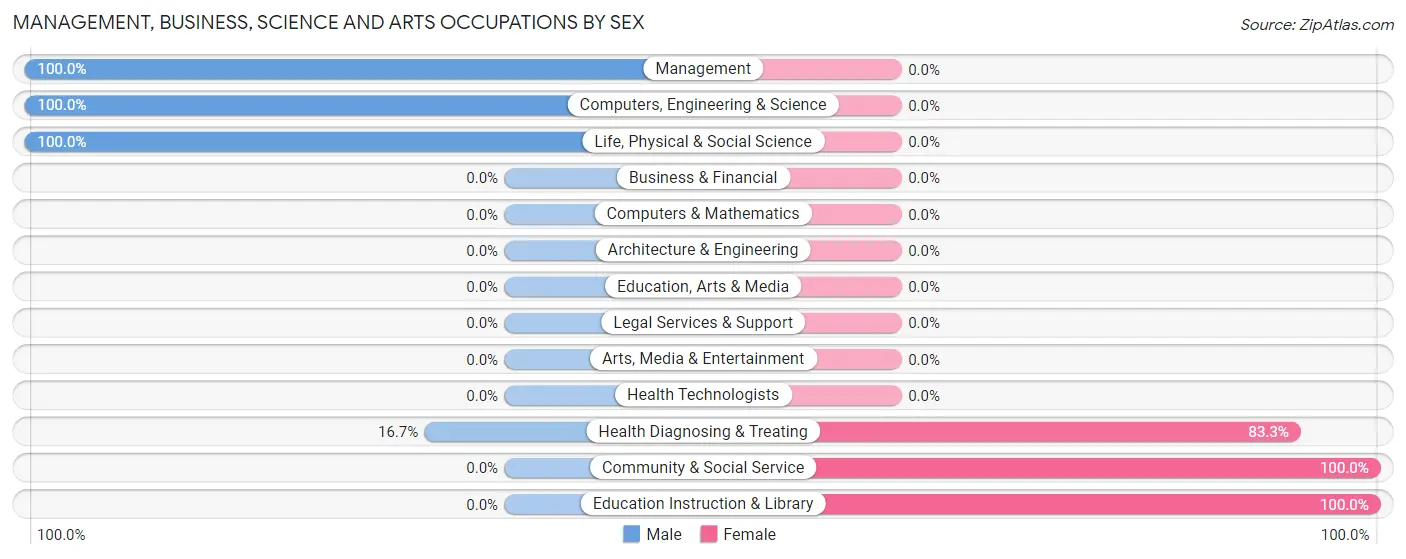
| Occupation | Male | Female |
| Management | 10 (100.0%) | 0 (0.0%) |
| Business & Financial | 0 (0.0%) | 0 (0.0%) |
| Computers, Engineering & Science | 5 (100.0%) | 0 (0.0%) |
| Computers & Mathematics | 0 (0.0%) | 0 (0.0%) |
| Architecture & Engineering | 0 (0.0%) | 0 (0.0%) |
| Life, Physical & Social Science | 5 (100.0%) | 0 (0.0%) |
| Community & Social Service | 0 (0.0%) | 23 (100.0%) |
| Education, Arts & Media | 0 (0.0%) | 0 (0.0%) |
| Legal Services & Support | 0 (0.0%) | 0 (0.0%) |
| Education Instruction & Library | 0 (0.0%) | 23 (100.0%) |
| Arts, Media & Entertainment | 0 (0.0%) | 0 (0.0%) |
| Health Diagnosing & Treating | 3 (16.7%) | 15 (83.3%) |
| Health Technologists | 0 (0.0%) | 0 (0.0%) |
| Total (Category) | 18 (32.1%) | 38 (67.9%) |
| Total (Overall) | 138 (48.8%) | 145 (51.2%) |
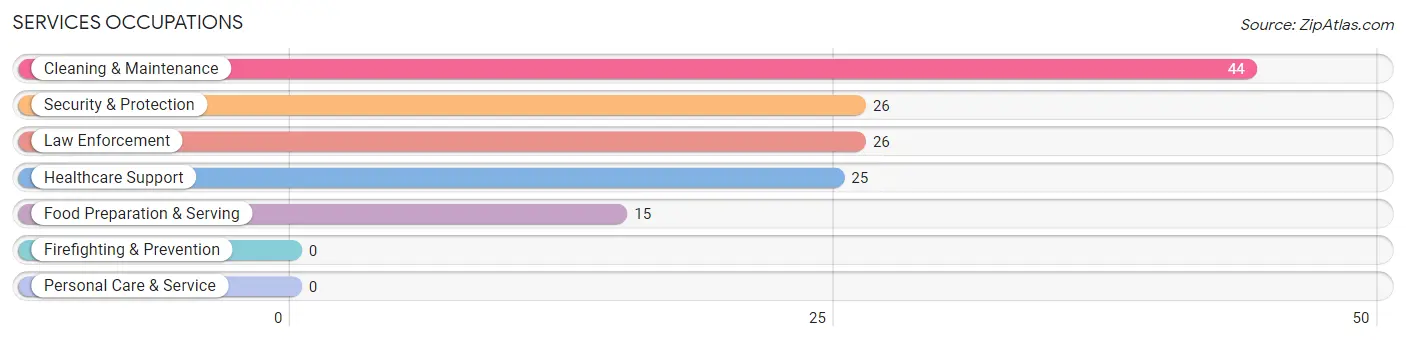
Services Occupations
The most common Services occupations in Dry Tavern are Cleaning & Maintenance (44 | 15.5%), Security & Protection (26 | 9.2%), Law Enforcement (26 | 9.2%), Healthcare Support (25 | 8.8%), and Food Preparation & Serving (15 | 5.3%).
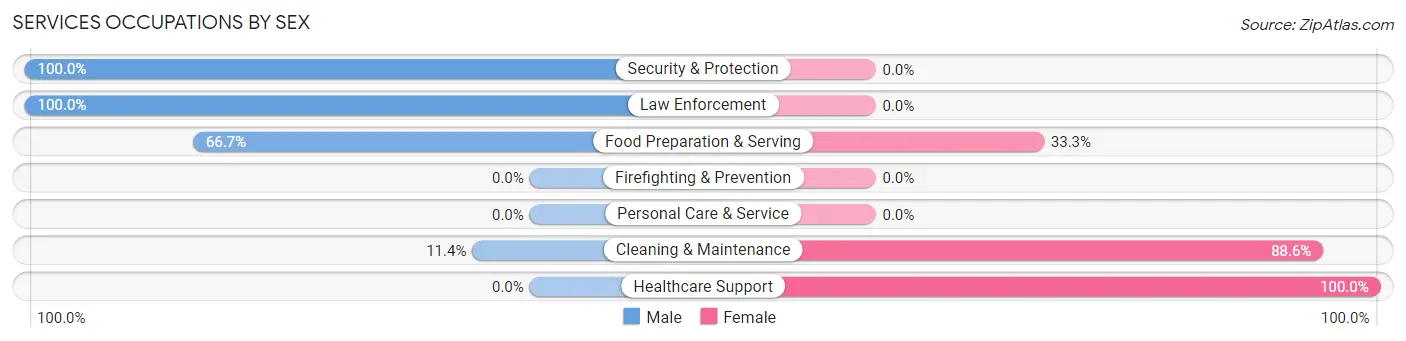
Services Occupations by Sex
Within the Services occupations in Dry Tavern, the most male-oriented occupations are Security & Protection (100.0%), Law Enforcement (100.0%), and Food Preparation & Serving (66.7%), while the most female-oriented occupations are Healthcare Support (100.0%), Cleaning & Maintenance (88.6%), and Food Preparation & Serving (33.3%).
| Occupation | Male | Female |
| Healthcare Support | 0 (0.0%) | 25 (100.0%) |
| Security & Protection | 26 (100.0%) | 0 (0.0%) |
| Firefighting & Prevention | 0 (0.0%) | 0 (0.0%) |
| Law Enforcement | 26 (100.0%) | 0 (0.0%) |
| Food Preparation & Serving | 10 (66.7%) | 5 (33.3%) |
| Cleaning & Maintenance | 5 (11.4%) | 39 (88.6%) |
| Personal Care & Service | 0 (0.0%) | 0 (0.0%) |
| Total (Category) | 41 (37.3%) | 69 (62.7%) |
| Total (Overall) | 138 (48.8%) | 145 (51.2%) |
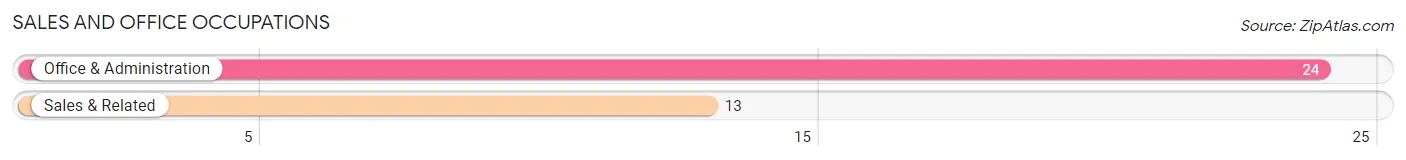
Sales and Office Occupations
The most common Sales and Office occupations in Dry Tavern are Office & Administration (24 | 8.5%), and Sales & Related (13 | 4.6%).
Sales and Office Occupations by Sex
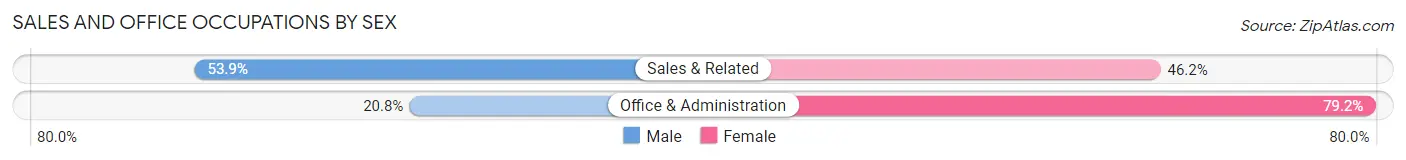
| Occupation | Male | Female |
| Sales & Related | 7 (53.8%) | 6 (46.2%) |
| Office & Administration | 5 (20.8%) | 19 (79.2%) |
| Total (Category) | 12 (32.4%) | 25 (67.6%) |
| Total (Overall) | 138 (48.8%) | 145 (51.2%) |
Natural Resources, Construction and Maintenance Occupations
Natural Resources, Construction and Maintenance Occupations by Sex
| Occupation | Male | Female |
| Farming, Fishing & Forestry | 0 (0.0%) | 0 (0.0%) |
| Construction & Extraction | 0 (0.0%) | 0 (0.0%) |
| Installation, Maintenance & Repair | 0 (0.0%) | 0 (0.0%) |
| Total (Category) | 0 (0.0%) | 0 (0.0%) |
| Total (Overall) | 138 (48.8%) | 145 (51.2%) |
Production, Transportation and Moving Occupations
The most common Production, Transportation and Moving occupations in Dry Tavern are Production (41 | 14.5%), Transportation (32 | 11.3%), and Material Moving (7 | 2.5%).
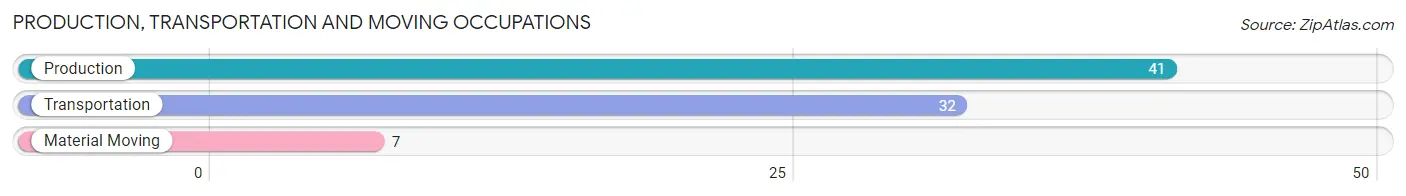
Production, Transportation and Moving Occupations by Sex
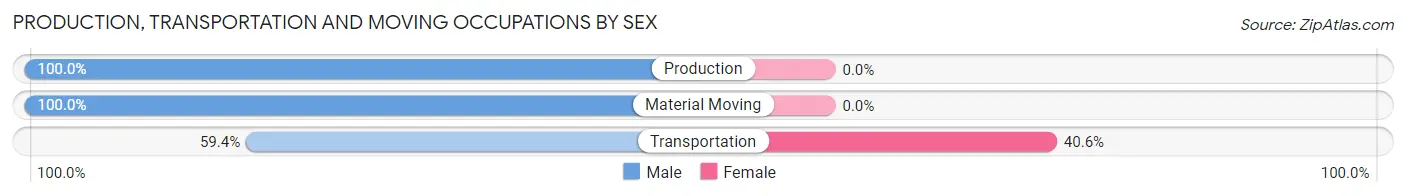
| Occupation | Male | Female |
| Production | 41 (100.0%) | 0 (0.0%) |
| Transportation | 19 (59.4%) | 13 (40.6%) |
| Material Moving | 7 (100.0%) | 0 (0.0%) |
| Total (Category) | 67 (83.8%) | 13 (16.3%) |
| Total (Overall) | 138 (48.8%) | 145 (51.2%) |
Employment Industries by Sex in Dry Tavern
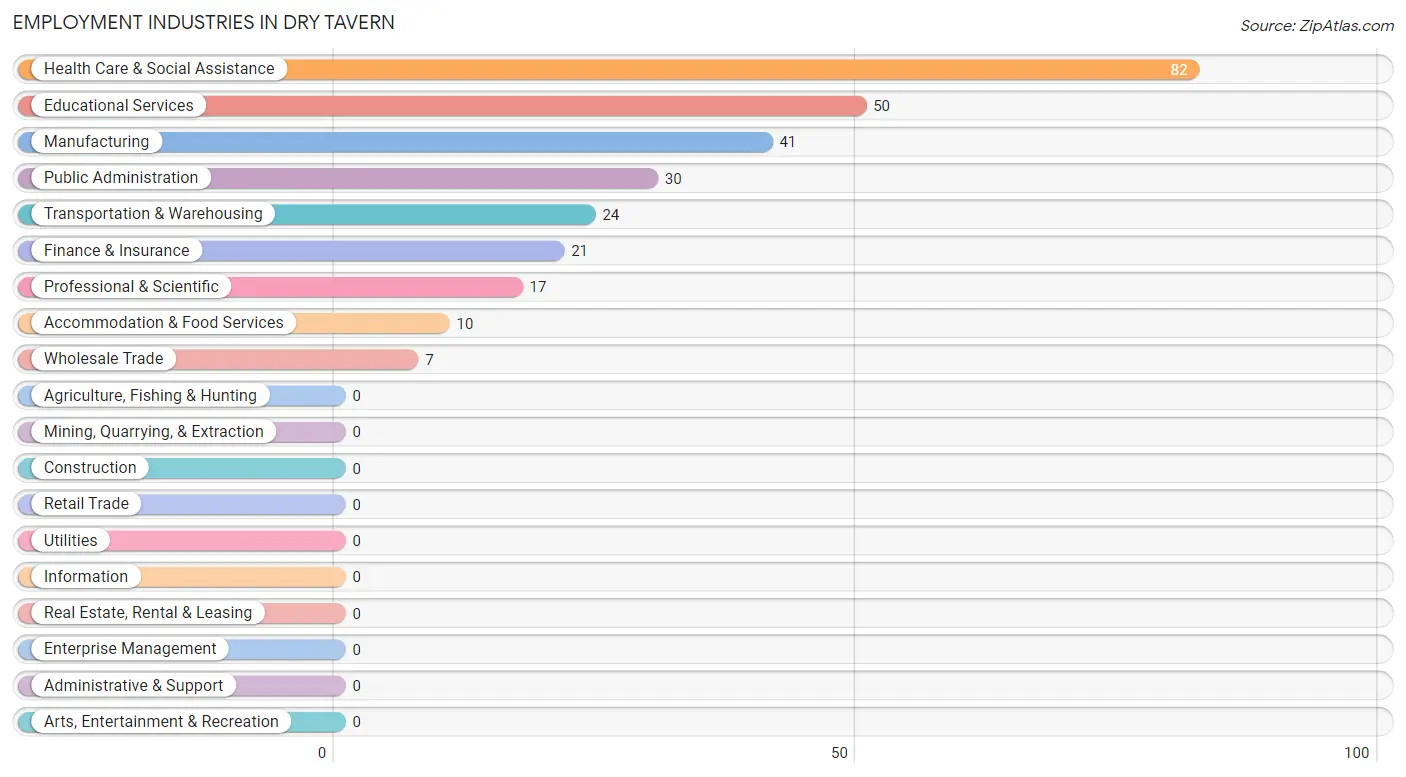
Employment Industries in Dry Tavern
The major employment industries in Dry Tavern include Health Care & Social Assistance (82 | 29.0%), Educational Services (50 | 17.7%), Manufacturing (41 | 14.5%), Public Administration (30 | 10.6%), and Transportation & Warehousing (24 | 8.5%).
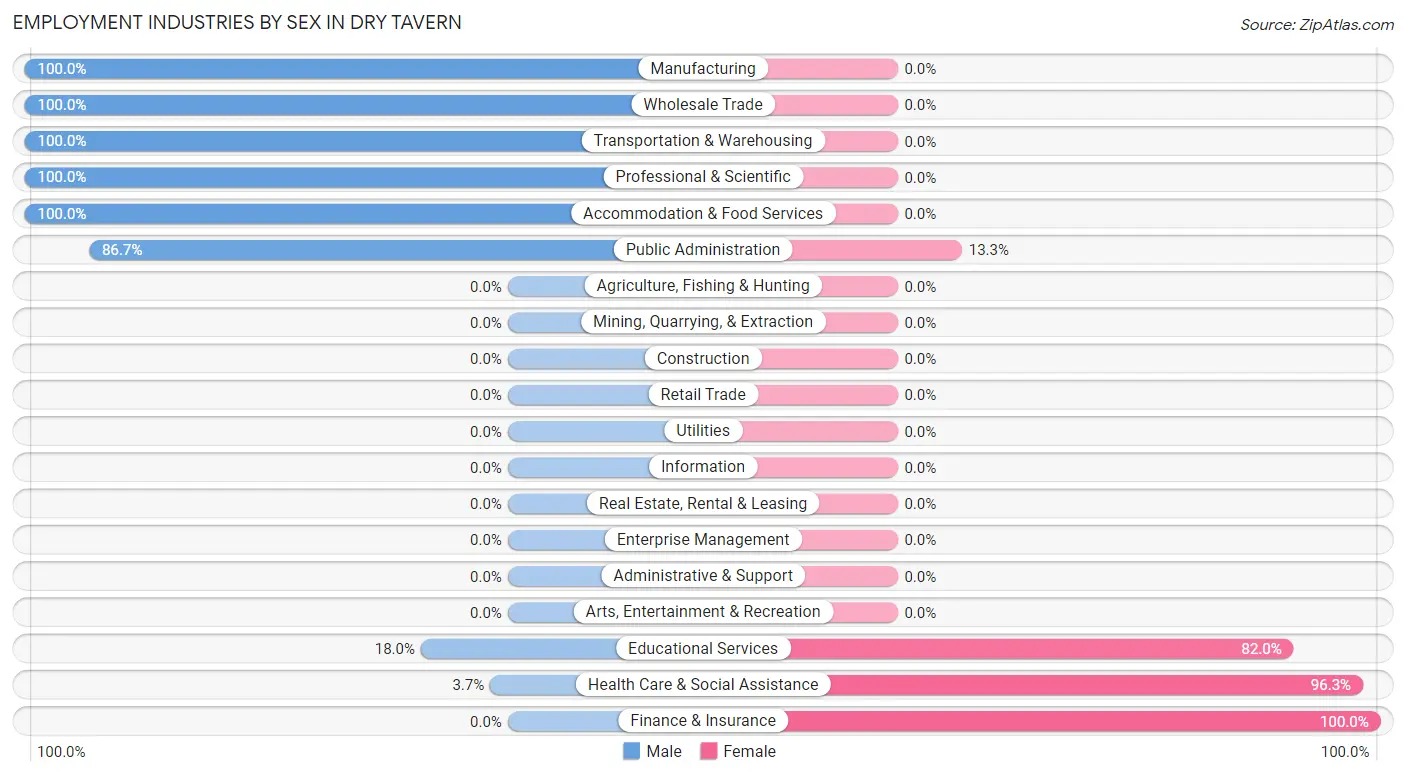
Employment Industries by Sex in Dry Tavern
The Dry Tavern industries that see more men than women are Manufacturing (100.0%), Wholesale Trade (100.0%), and Transportation & Warehousing (100.0%), whereas the industries that tend to have a higher number of women are Finance & Insurance (100.0%), Health Care & Social Assistance (96.3%), and Educational Services (82.0%).
| Industry | Male | Female |
| Agriculture, Fishing & Hunting | 0 (0.0%) | 0 (0.0%) |
| Mining, Quarrying, & Extraction | 0 (0.0%) | 0 (0.0%) |
| Construction | 0 (0.0%) | 0 (0.0%) |
| Manufacturing | 41 (100.0%) | 0 (0.0%) |
| Wholesale Trade | 7 (100.0%) | 0 (0.0%) |
| Retail Trade | 0 (0.0%) | 0 (0.0%) |
| Transportation & Warehousing | 24 (100.0%) | 0 (0.0%) |
| Utilities | 0 (0.0%) | 0 (0.0%) |
| Information | 0 (0.0%) | 0 (0.0%) |
| Finance & Insurance | 0 (0.0%) | 21 (100.0%) |
| Real Estate, Rental & Leasing | 0 (0.0%) | 0 (0.0%) |
| Professional & Scientific | 17 (100.0%) | 0 (0.0%) |
| Enterprise Management | 0 (0.0%) | 0 (0.0%) |
| Administrative & Support | 0 (0.0%) | 0 (0.0%) |
| Educational Services | 9 (18.0%) | 41 (82.0%) |
| Health Care & Social Assistance | 3 (3.7%) | 79 (96.3%) |
| Arts, Entertainment & Recreation | 0 (0.0%) | 0 (0.0%) |
| Accommodation & Food Services | 10 (100.0%) | 0 (0.0%) |
| Public Administration | 26 (86.7%) | 4 (13.3%) |
| Total | 138 (48.8%) | 145 (51.2%) |
Education in Dry Tavern
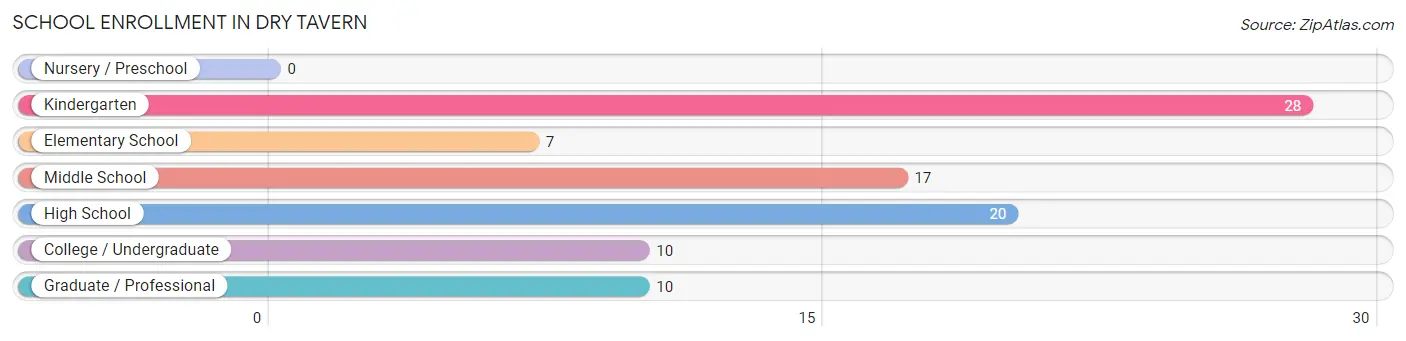
School Enrollment in Dry Tavern
The most common levels of schooling among the 92 students in Dry Tavern are kindergarten (28 | 30.4%), high school (20 | 21.7%), and middle school (17 | 18.5%).
| School Level | # Students | % Students |
| Nursery / Preschool | 0 | 0.0% |
| Kindergarten | 28 | 30.4% |
| Elementary School | 7 | 7.6% |
| Middle School | 17 | 18.5% |
| High School | 20 | 21.7% |
| College / Undergraduate | 10 | 10.9% |
| Graduate / Professional | 10 | 10.9% |
| Total | 92 | 100.0% |
School Enrollment by Age by Funding Source in Dry Tavern
Out of a total of 92 students who are enrolled in schools in Dry Tavern, 17 (18.5%) attend a private institution, while the remaining 75 (81.5%) are enrolled in public schools. The age group of 15 to 17 year olds has the highest likelihood of being enrolled in private schools, with 8 (100.0% in the age bracket) enrolled. Conversely, the age group of 5 to 9 year old has the lowest likelihood of being enrolled in a private school, with 35 (100.0% in the age bracket) attending a public institution.
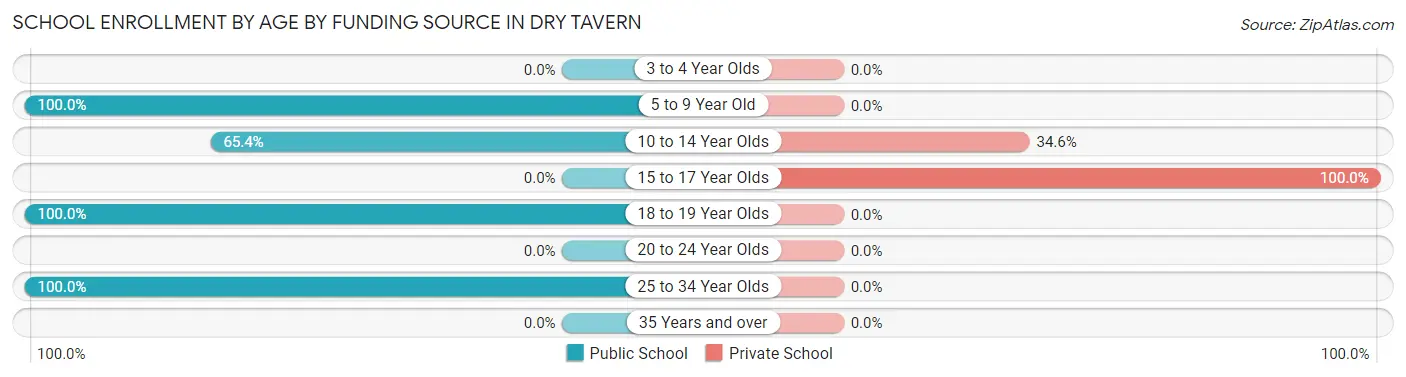
| Age Bracket | Public School | Private School |
| 3 to 4 Year Olds | 0 (0.0%) | 0 (0.0%) |
| 5 to 9 Year Old | 35 (100.0%) | 0 (0.0%) |
| 10 to 14 Year Olds | 17 (65.4%) | 9 (34.6%) |
| 15 to 17 Year Olds | 0 (0.0%) | 8 (100.0%) |
| 18 to 19 Year Olds | 13 (100.0%) | 0 (0.0%) |
| 20 to 24 Year Olds | 0 (0.0%) | 0 (0.0%) |
| 25 to 34 Year Olds | 10 (100.0%) | 0 (0.0%) |
| 35 Years and over | 0 (0.0%) | 0 (0.0%) |
| Total | 75 (81.5%) | 17 (18.5%) |
Educational Attainment by Field of Study in Dry Tavern
Education (59 | 45.7%), business (25 | 19.4%), science & technology (21 | 16.3%), multidisciplinary studies (15 | 11.6%), and psychology (5 | 3.9%) are the most common fields of study among 129 individuals in Dry Tavern who have obtained a bachelor's degree or higher.
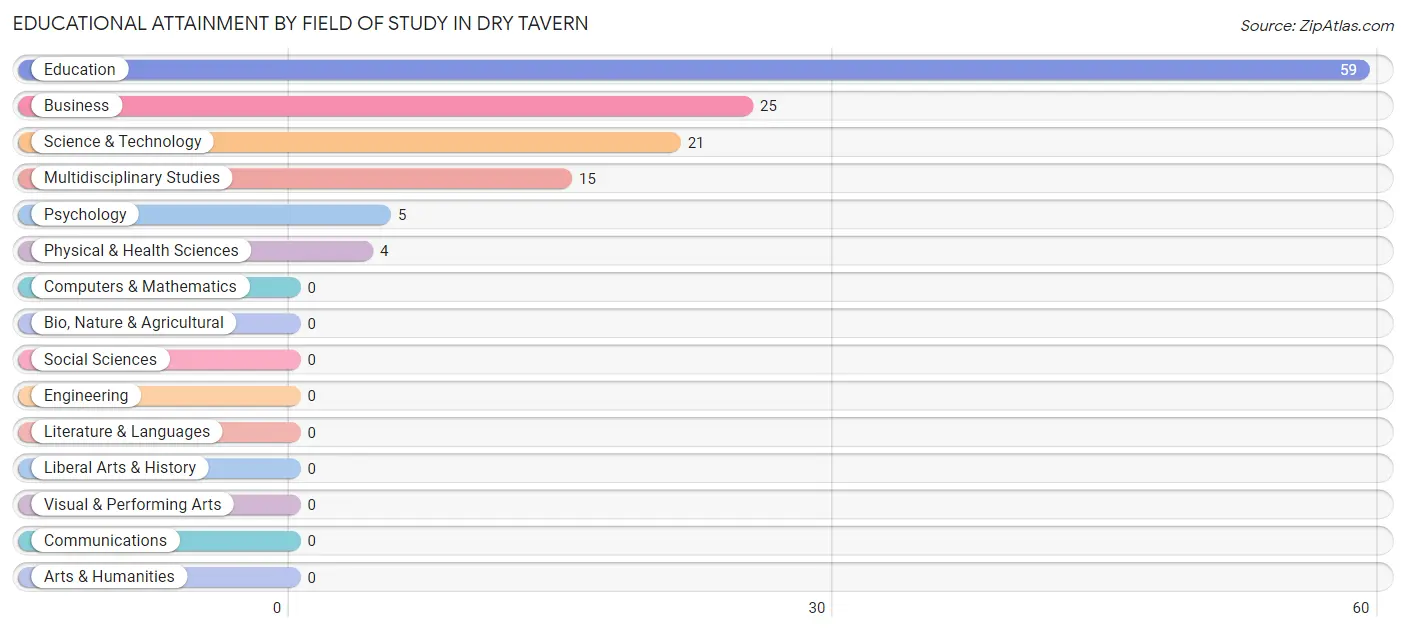
| Field of Study | # Graduates | % Graduates |
| Computers & Mathematics | 0 | 0.0% |
| Bio, Nature & Agricultural | 0 | 0.0% |
| Physical & Health Sciences | 4 | 3.1% |
| Psychology | 5 | 3.9% |
| Social Sciences | 0 | 0.0% |
| Engineering | 0 | 0.0% |
| Multidisciplinary Studies | 15 | 11.6% |
| Science & Technology | 21 | 16.3% |
| Business | 25 | 19.4% |
| Education | 59 | 45.7% |
| Literature & Languages | 0 | 0.0% |
| Liberal Arts & History | 0 | 0.0% |
| Visual & Performing Arts | 0 | 0.0% |
| Communications | 0 | 0.0% |
| Arts & Humanities | 0 | 0.0% |
| Total | 129 | 100.0% |
Transportation & Commute in Dry Tavern
Vehicle Availability by Sex in Dry Tavern
The most prevalent vehicle ownership categories in Dry Tavern are males with 4 vehicles (58, accounting for 43.6%) and females with 4 vehicles (20, making up 40.0%).
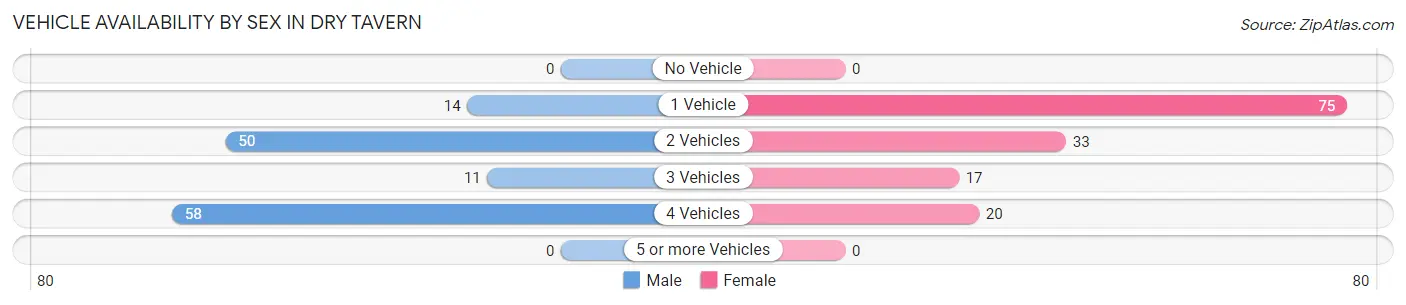
| Vehicles Available | Male | Female |
| No Vehicle | 0 (0.0%) | 0 (0.0%) |
| 1 Vehicle | 14 (10.5%) | 75 (51.7%) |
| 2 Vehicles | 50 (37.6%) | 33 (22.8%) |
| 3 Vehicles | 11 (8.3%) | 17 (11.7%) |
| 4 Vehicles | 58 (43.6%) | 20 (13.8%) |
| 5 or more Vehicles | 0 (0.0%) | 0 (0.0%) |
| Total | 133 (100.0%) | 145 (100.0%) |
Commute Time in Dry Tavern
The most frequently occuring commute durations in Dry Tavern are 15 to 19 minutes (75 commuters, 28.5%), 35 to 39 minutes (71 commuters, 27.0%), and 45 to 59 minutes (33 commuters, 12.6%).
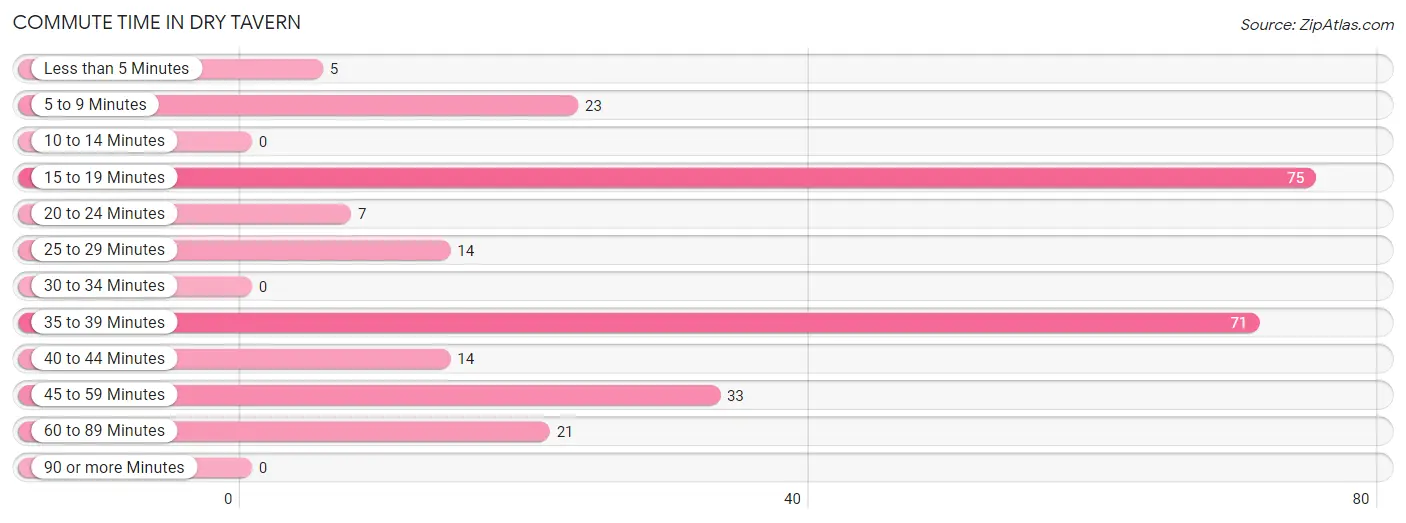
| Commute Time | # Commuters | % Commuters |
| Less than 5 Minutes | 5 | 1.9% |
| 5 to 9 Minutes | 23 | 8.7% |
| 10 to 14 Minutes | 0 | 0.0% |
| 15 to 19 Minutes | 75 | 28.5% |
| 20 to 24 Minutes | 7 | 2.7% |
| 25 to 29 Minutes | 14 | 5.3% |
| 30 to 34 Minutes | 0 | 0.0% |
| 35 to 39 Minutes | 71 | 27.0% |
| 40 to 44 Minutes | 14 | 5.3% |
| 45 to 59 Minutes | 33 | 12.6% |
| 60 to 89 Minutes | 21 | 8.0% |
| 90 or more Minutes | 0 | 0.0% |
Commute Time by Sex in Dry Tavern
The most common commute times in Dry Tavern are 15 to 19 minutes (50 commuters, 37.6%) for males and 35 to 39 minutes (54 commuters, 41.5%) for females.
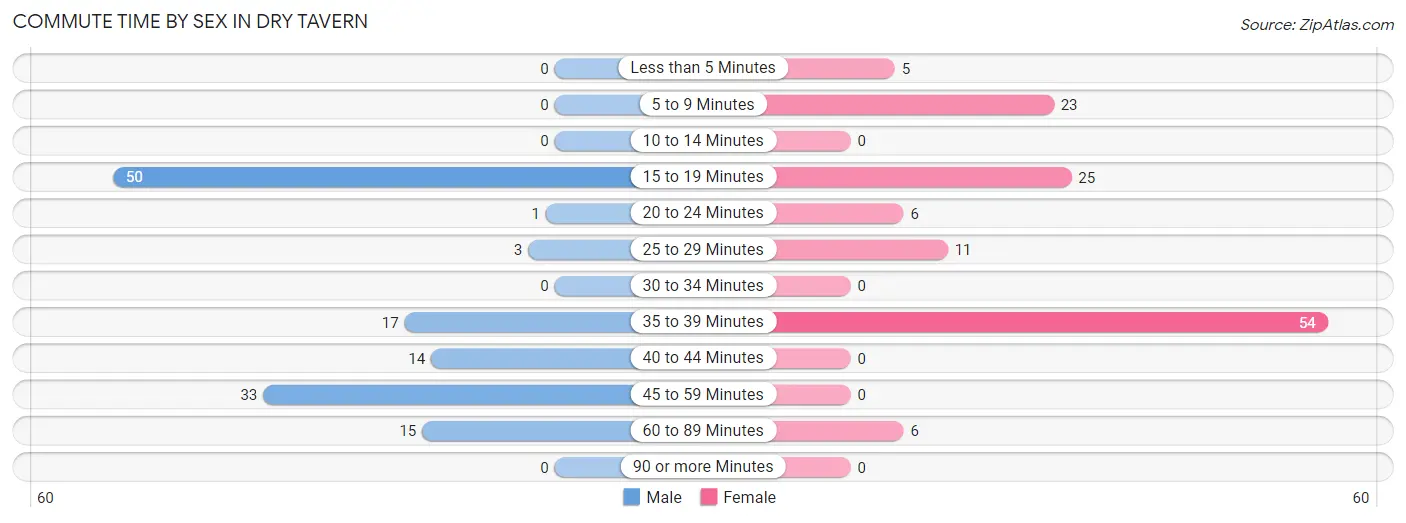
| Commute Time | Male | Female |
| Less than 5 Minutes | 0 (0.0%) | 5 (3.8%) |
| 5 to 9 Minutes | 0 (0.0%) | 23 (17.7%) |
| 10 to 14 Minutes | 0 (0.0%) | 0 (0.0%) |
| 15 to 19 Minutes | 50 (37.6%) | 25 (19.2%) |
| 20 to 24 Minutes | 1 (0.7%) | 6 (4.6%) |
| 25 to 29 Minutes | 3 (2.3%) | 11 (8.5%) |
| 30 to 34 Minutes | 0 (0.0%) | 0 (0.0%) |
| 35 to 39 Minutes | 17 (12.8%) | 54 (41.5%) |
| 40 to 44 Minutes | 14 (10.5%) | 0 (0.0%) |
| 45 to 59 Minutes | 33 (24.8%) | 0 (0.0%) |
| 60 to 89 Minutes | 15 (11.3%) | 6 (4.6%) |
| 90 or more Minutes | 0 (0.0%) | 0 (0.0%) |
Time of Departure to Work by Sex in Dry Tavern
The most frequent times of departure to work in Dry Tavern are 7:00 AM to 7:29 AM (32, 24.1%) for males and 4:00 PM to 11:59 PM (39, 30.0%) for females.
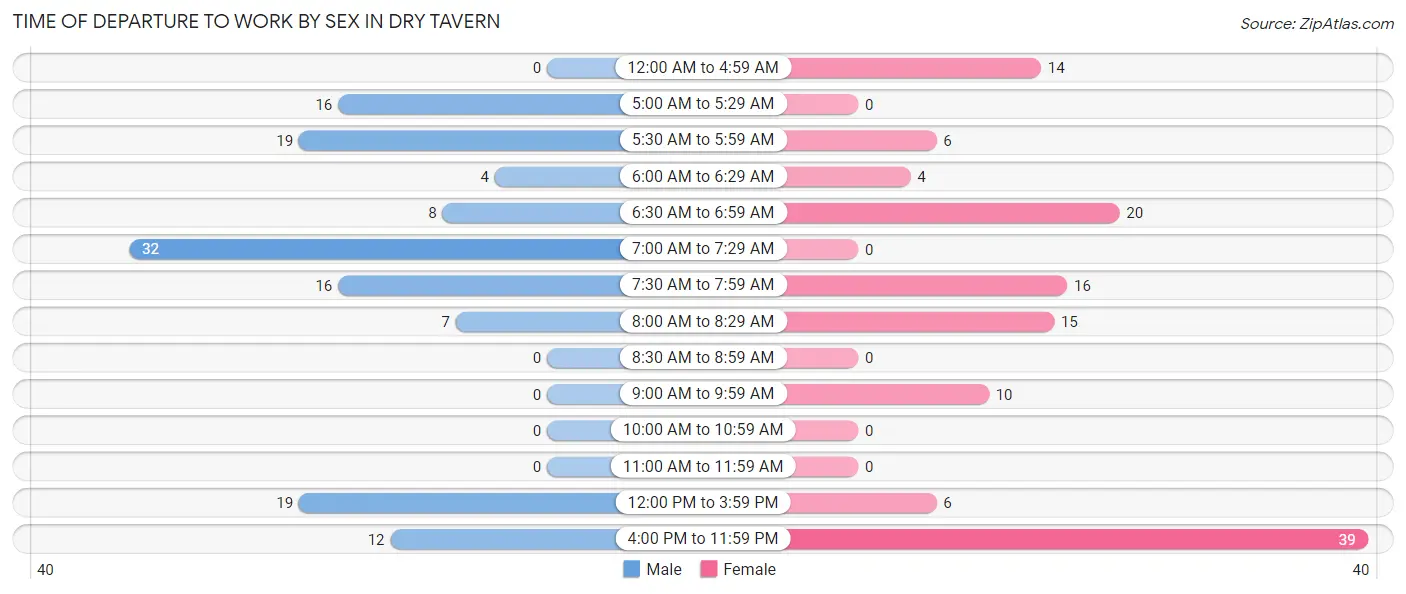
| Time of Departure | Male | Female |
| 12:00 AM to 4:59 AM | 0 (0.0%) | 14 (10.8%) |
| 5:00 AM to 5:29 AM | 16 (12.0%) | 0 (0.0%) |
| 5:30 AM to 5:59 AM | 19 (14.3%) | 6 (4.6%) |
| 6:00 AM to 6:29 AM | 4 (3.0%) | 4 (3.1%) |
| 6:30 AM to 6:59 AM | 8 (6.0%) | 20 (15.4%) |
| 7:00 AM to 7:29 AM | 32 (24.1%) | 0 (0.0%) |
| 7:30 AM to 7:59 AM | 16 (12.0%) | 16 (12.3%) |
| 8:00 AM to 8:29 AM | 7 (5.3%) | 15 (11.5%) |
| 8:30 AM to 8:59 AM | 0 (0.0%) | 0 (0.0%) |
| 9:00 AM to 9:59 AM | 0 (0.0%) | 10 (7.7%) |
| 10:00 AM to 10:59 AM | 0 (0.0%) | 0 (0.0%) |
| 11:00 AM to 11:59 AM | 0 (0.0%) | 0 (0.0%) |
| 12:00 PM to 3:59 PM | 19 (14.3%) | 6 (4.6%) |
| 4:00 PM to 11:59 PM | 12 (9.0%) | 39 (30.0%) |
| Total | 133 (100.0%) | 130 (100.0%) |
Housing Occupancy in Dry Tavern
Occupancy by Ownership in Dry Tavern
Of the total 260 dwellings in Dry Tavern, owner-occupied units account for 240 (92.3%), while renter-occupied units make up 20 (7.7%).
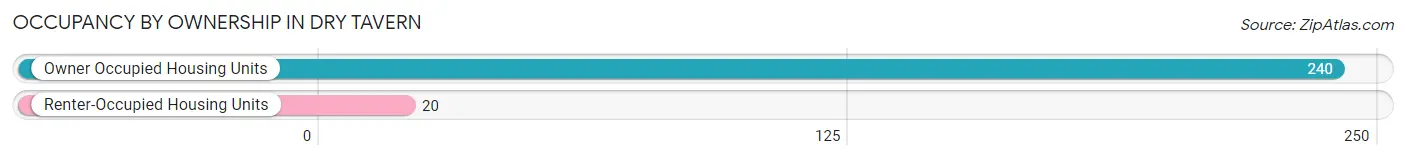
| Occupancy | # Housing Units | % Housing Units |
| Owner Occupied Housing Units | 240 | 92.3% |
| Renter-Occupied Housing Units | 20 | 7.7% |
| Total Occupied Housing Units | 260 | 100.0% |
Occupancy by Household Size in Dry Tavern
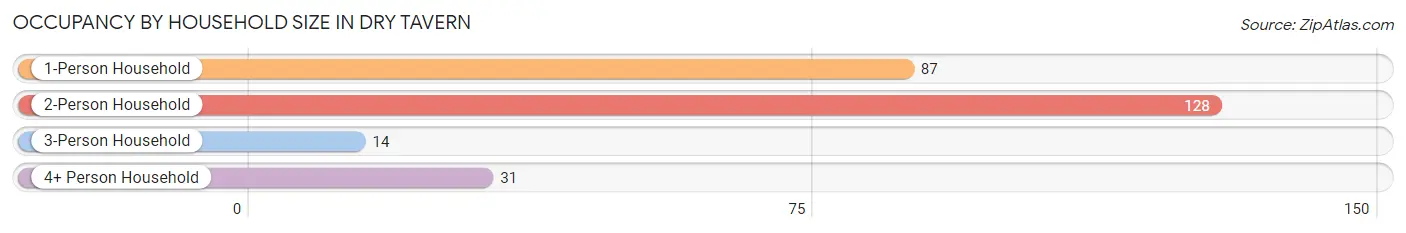
| Household Size | # Housing Units | % Housing Units |
| 1-Person Household | 87 | 33.5% |
| 2-Person Household | 128 | 49.2% |
| 3-Person Household | 14 | 5.4% |
| 4+ Person Household | 31 | 11.9% |
| Total Housing Units | 260 | 100.0% |
Occupancy by Ownership by Household Size in Dry Tavern
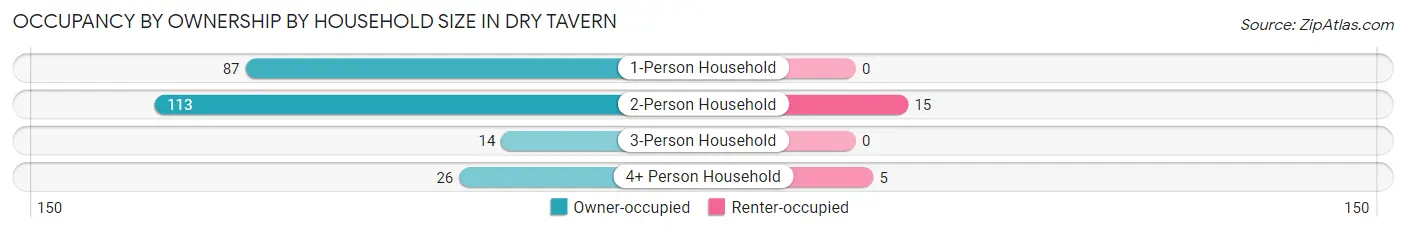
| Household Size | Owner-occupied | Renter-occupied |
| 1-Person Household | 87 (100.0%) | 0 (0.0%) |
| 2-Person Household | 113 (88.3%) | 15 (11.7%) |
| 3-Person Household | 14 (100.0%) | 0 (0.0%) |
| 4+ Person Household | 26 (83.9%) | 5 (16.1%) |
| Total Housing Units | 240 (92.3%) | 20 (7.7%) |
Occupancy by Educational Attainment in Dry Tavern
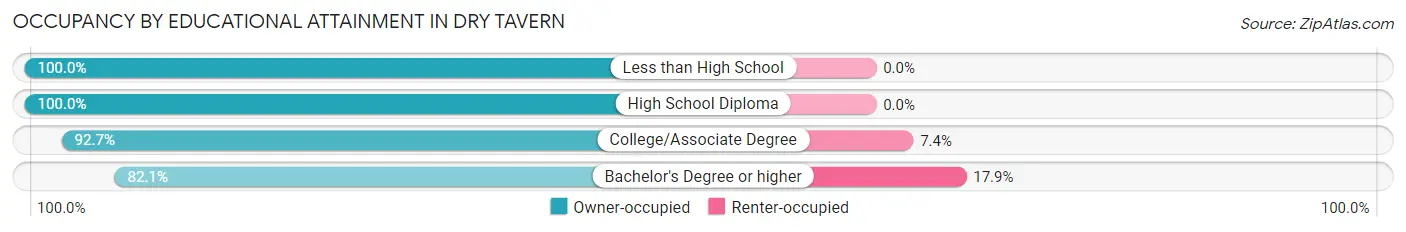
| Household Size | Owner-occupied | Renter-occupied |
| Less than High School | 9 (100.0%) | 0 (0.0%) |
| High School Diploma | 99 (100.0%) | 0 (0.0%) |
| College/Associate Degree | 63 (92.6%) | 5 (7.3%) |
| Bachelor's Degree or higher | 69 (82.1%) | 15 (17.9%) |
Occupancy by Age of Householder in Dry Tavern
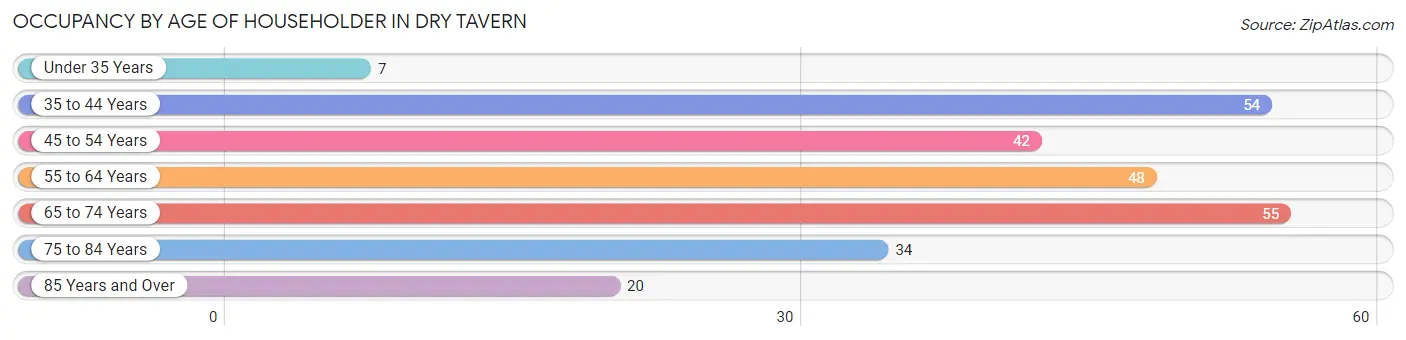
| Age Bracket | # Households | % Households |
| Under 35 Years | 7 | 2.7% |
| 35 to 44 Years | 54 | 20.8% |
| 45 to 54 Years | 42 | 16.2% |
| 55 to 64 Years | 48 | 18.5% |
| 65 to 74 Years | 55 | 21.1% |
| 75 to 84 Years | 34 | 13.1% |
| 85 Years and Over | 20 | 7.7% |
| Total | 260 | 100.0% |
Housing Finances in Dry Tavern
Median Income by Occupancy in Dry Tavern
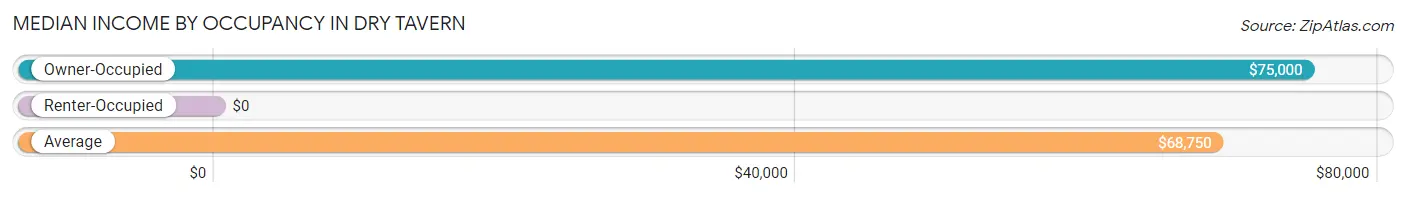
| Occupancy Type | # Households | Median Income |
| Owner-Occupied | 240 (92.3%) | $75,000 |
| Renter-Occupied | 20 (7.7%) | $0 |
| Average | 260 (100.0%) | $68,750 |
Occupancy by Householder Income Bracket in Dry Tavern
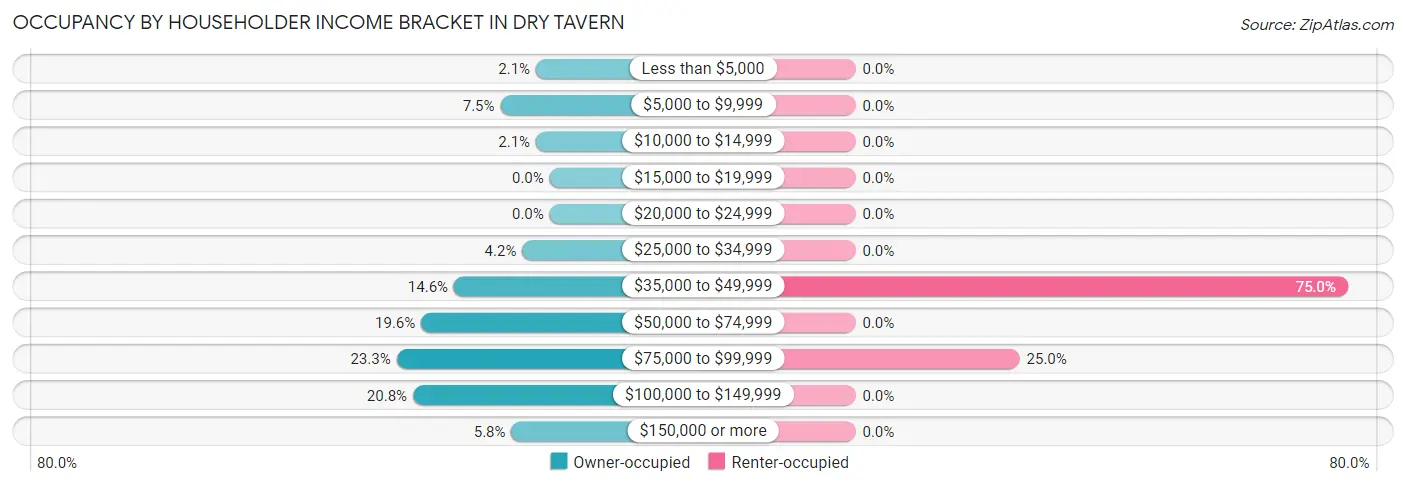
| Income Bracket | Owner-occupied | Renter-occupied |
| Less than $5,000 | 5 (2.1%) | 0 (0.0%) |
| $5,000 to $9,999 | 18 (7.5%) | 0 (0.0%) |
| $10,000 to $14,999 | 5 (2.1%) | 0 (0.0%) |
| $15,000 to $19,999 | 0 (0.0%) | 0 (0.0%) |
| $20,000 to $24,999 | 0 (0.0%) | 0 (0.0%) |
| $25,000 to $34,999 | 10 (4.2%) | 0 (0.0%) |
| $35,000 to $49,999 | 35 (14.6%) | 15 (75.0%) |
| $50,000 to $74,999 | 47 (19.6%) | 0 (0.0%) |
| $75,000 to $99,999 | 56 (23.3%) | 5 (25.0%) |
| $100,000 to $149,999 | 50 (20.8%) | 0 (0.0%) |
| $150,000 or more | 14 (5.8%) | 0 (0.0%) |
| Total | 240 (100.0%) | 20 (100.0%) |
Monthly Housing Cost Tiers in Dry Tavern
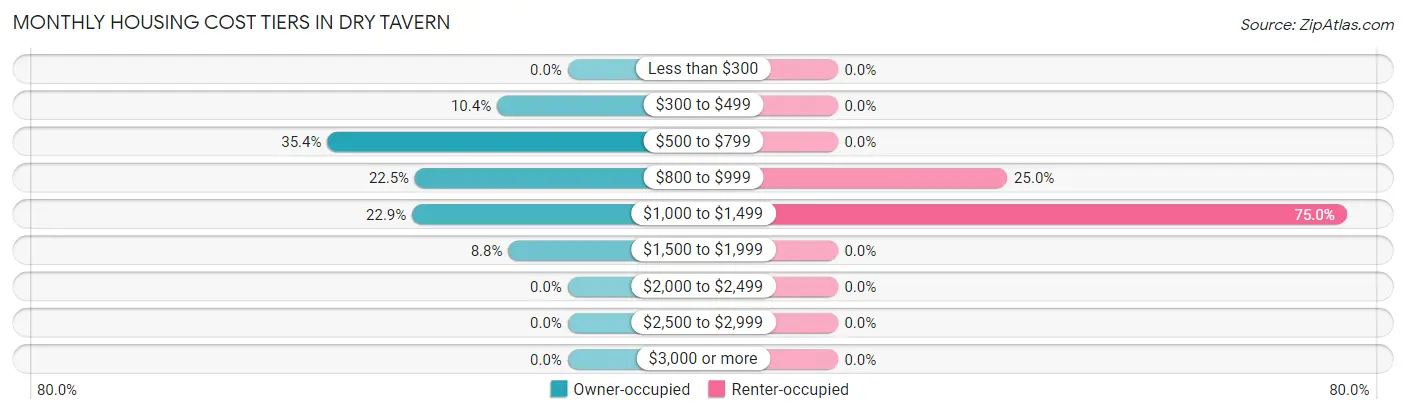
| Monthly Cost | Owner-occupied | Renter-occupied |
| Less than $300 | 0 (0.0%) | 0 (0.0%) |
| $300 to $499 | 25 (10.4%) | 0 (0.0%) |
| $500 to $799 | 85 (35.4%) | 0 (0.0%) |
| $800 to $999 | 54 (22.5%) | 5 (25.0%) |
| $1,000 to $1,499 | 55 (22.9%) | 15 (75.0%) |
| $1,500 to $1,999 | 21 (8.7%) | 0 (0.0%) |
| $2,000 to $2,499 | 0 (0.0%) | 0 (0.0%) |
| $2,500 to $2,999 | 0 (0.0%) | 0 (0.0%) |
| $3,000 or more | 0 (0.0%) | 0 (0.0%) |
| Total | 240 (100.0%) | 20 (100.0%) |
Physical Housing Characteristics in Dry Tavern
Housing Structures in Dry Tavern
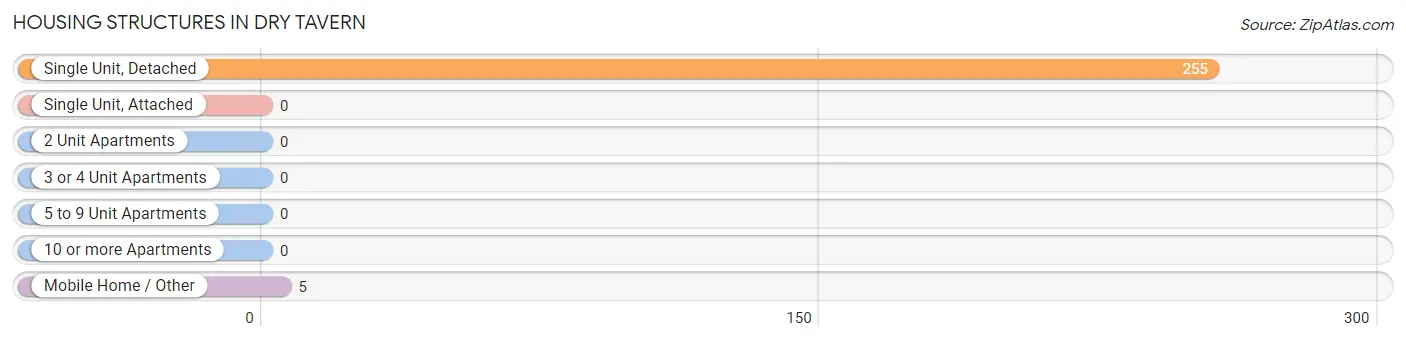
| Structure Type | # Housing Units | % Housing Units |
| Single Unit, Detached | 255 | 98.1% |
| Single Unit, Attached | 0 | 0.0% |
| 2 Unit Apartments | 0 | 0.0% |
| 3 or 4 Unit Apartments | 0 | 0.0% |
| 5 to 9 Unit Apartments | 0 | 0.0% |
| 10 or more Apartments | 0 | 0.0% |
| Mobile Home / Other | 5 | 1.9% |
| Total | 260 | 100.0% |
Housing Structures by Occupancy in Dry Tavern
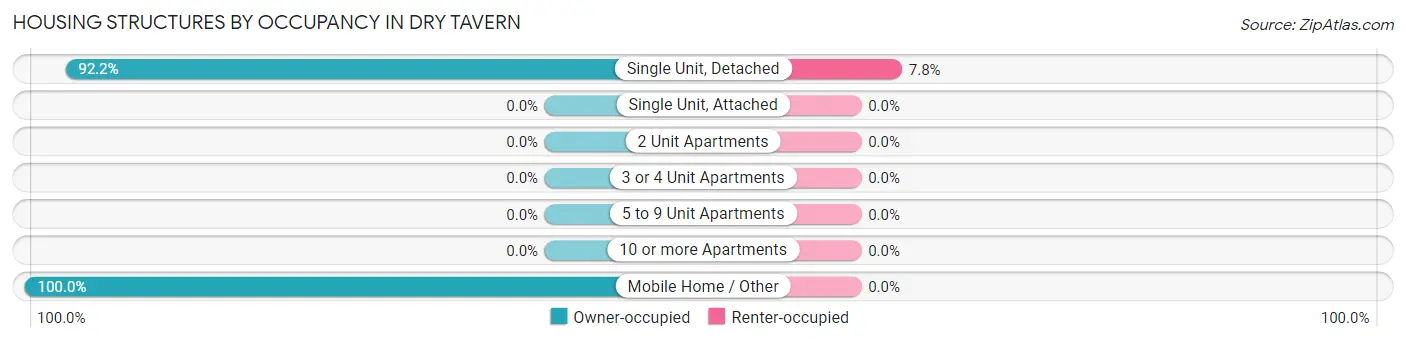
| Structure Type | Owner-occupied | Renter-occupied |
| Single Unit, Detached | 235 (92.2%) | 20 (7.8%) |
| Single Unit, Attached | 0 (0.0%) | 0 (0.0%) |
| 2 Unit Apartments | 0 (0.0%) | 0 (0.0%) |
| 3 or 4 Unit Apartments | 0 (0.0%) | 0 (0.0%) |
| 5 to 9 Unit Apartments | 0 (0.0%) | 0 (0.0%) |
| 10 or more Apartments | 0 (0.0%) | 0 (0.0%) |
| Mobile Home / Other | 5 (100.0%) | 0 (0.0%) |
| Total | 240 (92.3%) | 20 (7.7%) |
Housing Structures by Number of Rooms in Dry Tavern
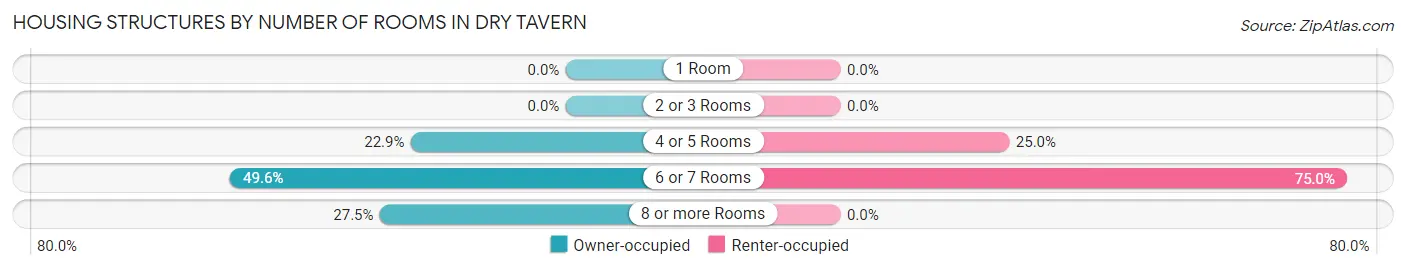
| Number of Rooms | Owner-occupied | Renter-occupied |
| 1 Room | 0 (0.0%) | 0 (0.0%) |
| 2 or 3 Rooms | 0 (0.0%) | 0 (0.0%) |
| 4 or 5 Rooms | 55 (22.9%) | 5 (25.0%) |
| 6 or 7 Rooms | 119 (49.6%) | 15 (75.0%) |
| 8 or more Rooms | 66 (27.5%) | 0 (0.0%) |
| Total | 240 (100.0%) | 20 (100.0%) |
Housing Structure by Heating Type in Dry Tavern
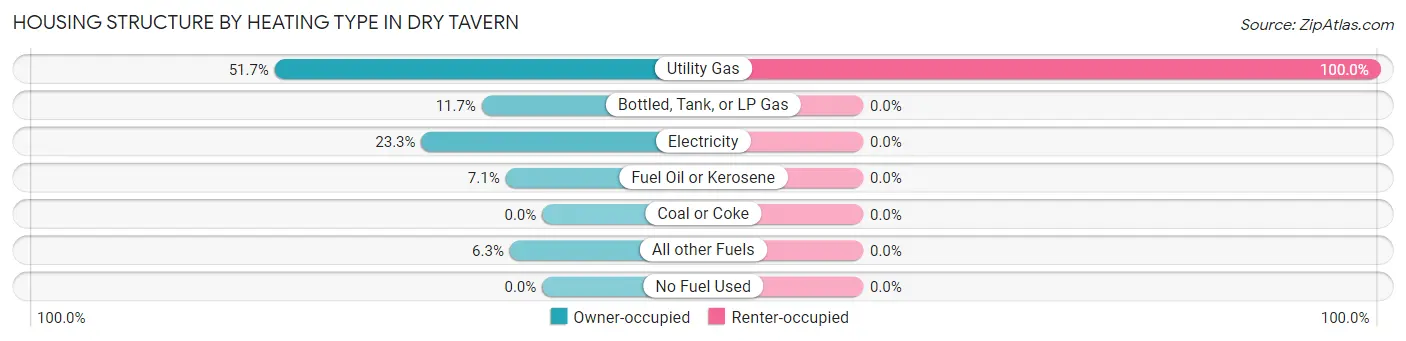
| Heating Type | Owner-occupied | Renter-occupied |
| Utility Gas | 124 (51.7%) | 20 (100.0%) |
| Bottled, Tank, or LP Gas | 28 (11.7%) | 0 (0.0%) |
| Electricity | 56 (23.3%) | 0 (0.0%) |
| Fuel Oil or Kerosene | 17 (7.1%) | 0 (0.0%) |
| Coal or Coke | 0 (0.0%) | 0 (0.0%) |
| All other Fuels | 15 (6.2%) | 0 (0.0%) |
| No Fuel Used | 0 (0.0%) | 0 (0.0%) |
| Total | 240 (100.0%) | 20 (100.0%) |
Household Vehicle Usage in Dry Tavern
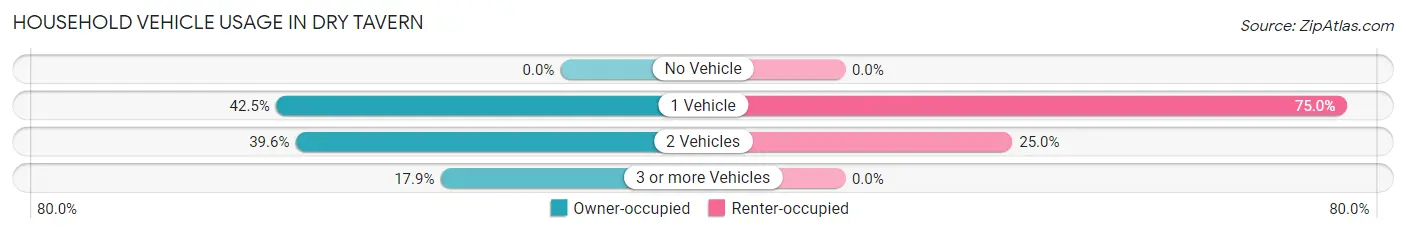
| Vehicles per Household | Owner-occupied | Renter-occupied |
| No Vehicle | 0 (0.0%) | 0 (0.0%) |
| 1 Vehicle | 102 (42.5%) | 15 (75.0%) |
| 2 Vehicles | 95 (39.6%) | 5 (25.0%) |
| 3 or more Vehicles | 43 (17.9%) | 0 (0.0%) |
| Total | 240 (100.0%) | 20 (100.0%) |
Real Estate & Mortgages in Dry Tavern
Real Estate and Mortgage Overview in Dry Tavern
| Characteristic | Without Mortgage | With Mortgage |
| Housing Units | 128 | 112 |
| Median Property Value | $168,800 | $187,500 |
| Median Household Income | $63,000 | $14 |
| Monthly Housing Costs | $694 | $0 |
| Real Estate Taxes | $3,567 | $0 |
Property Value by Mortgage Status in Dry Tavern
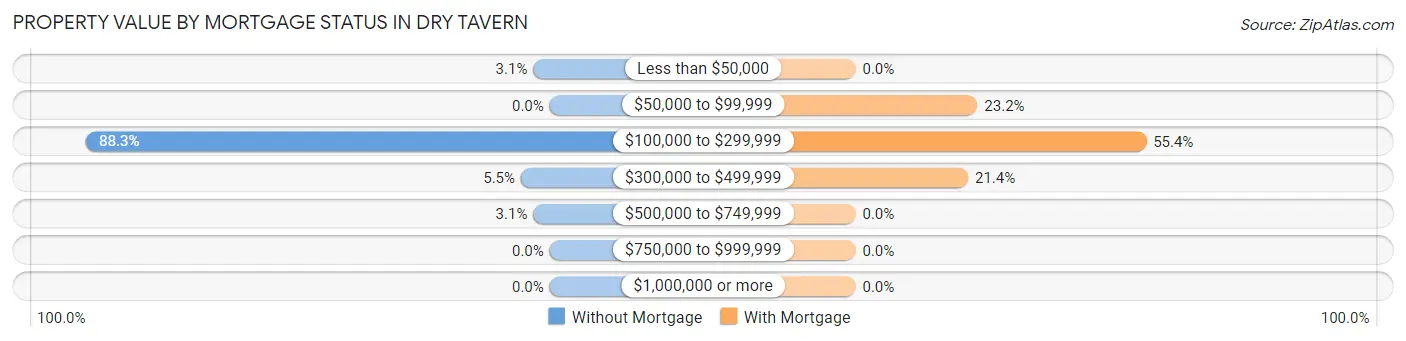
| Property Value | Without Mortgage | With Mortgage |
| Less than $50,000 | 4 (3.1%) | 0 (0.0%) |
| $50,000 to $99,999 | 0 (0.0%) | 26 (23.2%) |
| $100,000 to $299,999 | 113 (88.3%) | 62 (55.4%) |
| $300,000 to $499,999 | 7 (5.5%) | 24 (21.4%) |
| $500,000 to $749,999 | 4 (3.1%) | 0 (0.0%) |
| $750,000 to $999,999 | 0 (0.0%) | 0 (0.0%) |
| $1,000,000 or more | 0 (0.0%) | 0 (0.0%) |
| Total | 128 (100.0%) | 112 (100.0%) |
Household Income by Mortgage Status in Dry Tavern
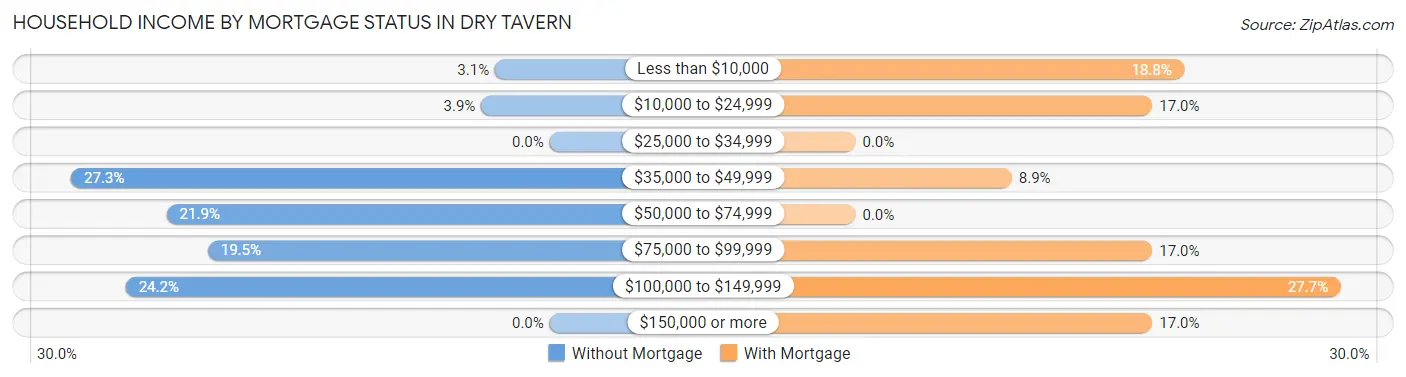
| Household Income | Without Mortgage | With Mortgage |
| Less than $10,000 | 4 (3.1%) | 21 (18.8%) |
| $10,000 to $24,999 | 5 (3.9%) | 19 (17.0%) |
| $25,000 to $34,999 | 0 (0.0%) | 0 (0.0%) |
| $35,000 to $49,999 | 35 (27.3%) | 10 (8.9%) |
| $50,000 to $74,999 | 28 (21.9%) | 0 (0.0%) |
| $75,000 to $99,999 | 25 (19.5%) | 19 (17.0%) |
| $100,000 to $149,999 | 31 (24.2%) | 31 (27.7%) |
| $150,000 or more | 0 (0.0%) | 19 (17.0%) |
| Total | 128 (100.0%) | 112 (100.0%) |
Property Value to Household Income Ratio in Dry Tavern
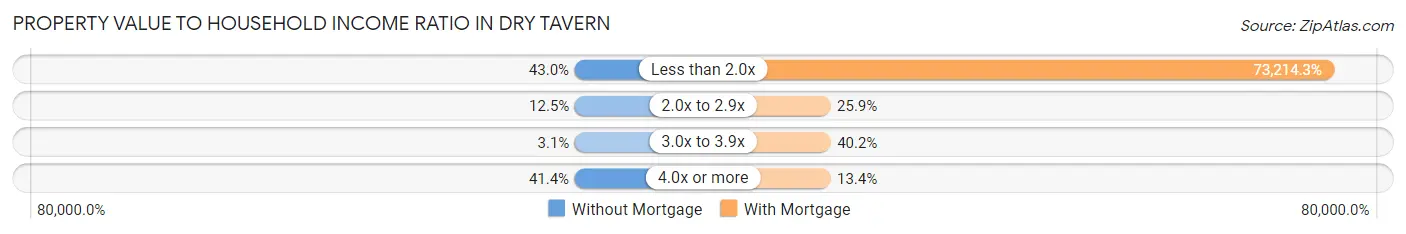
| Value-to-Income Ratio | Without Mortgage | With Mortgage |
| Less than 2.0x | 55 (43.0%) | 82,000 (73,214.3%) |
| 2.0x to 2.9x | 16 (12.5%) | 29 (25.9%) |
| 3.0x to 3.9x | 4 (3.1%) | 45 (40.2%) |
| 4.0x or more | 53 (41.4%) | 15 (13.4%) |
| Total | 128 (100.0%) | 112 (100.0%) |
Real Estate Taxes by Mortgage Status in Dry Tavern
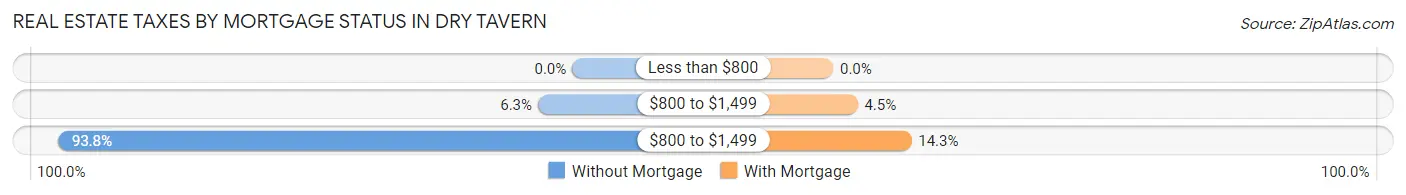
| Property Taxes | Without Mortgage | With Mortgage |
| Less than $800 | 0 (0.0%) | 0 (0.0%) |
| $800 to $1,499 | 8 (6.2%) | 5 (4.5%) |
| $800 to $1,499 | 120 (93.8%) | 16 (14.3%) |
| Total | 128 (100.0%) | 112 (100.0%) |
Health & Disability in Dry Tavern
Health Insurance Coverage by Age in Dry Tavern
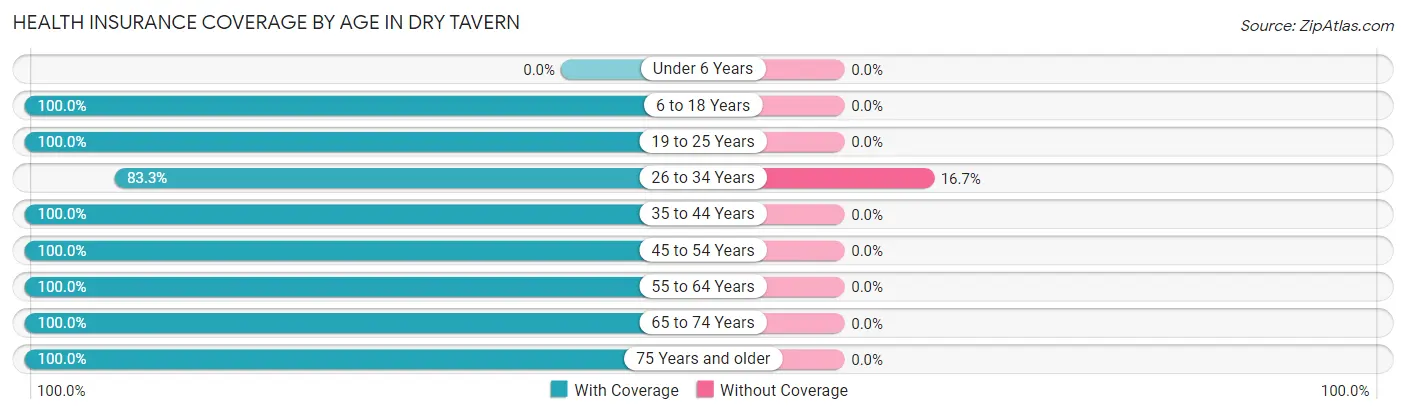
| Age Bracket | With Coverage | Without Coverage |
| Under 6 Years | 0 (0.0%) | 0 (0.0%) |
| 6 to 18 Years | 82 (100.0%) | 0 (0.0%) |
| 19 to 25 Years | 50 (100.0%) | 0 (0.0%) |
| 26 to 34 Years | 35 (83.3%) | 7 (16.7%) |
| 35 to 44 Years | 97 (100.0%) | 0 (0.0%) |
| 45 to 54 Years | 99 (100.0%) | 0 (0.0%) |
| 55 to 64 Years | 82 (100.0%) | 0 (0.0%) |
| 65 to 74 Years | 91 (100.0%) | 0 (0.0%) |
| 75 Years and older | 84 (100.0%) | 0 (0.0%) |
| Total | 620 (98.9%) | 7 (1.1%) |
Health Insurance Coverage by Citizenship Status in Dry Tavern
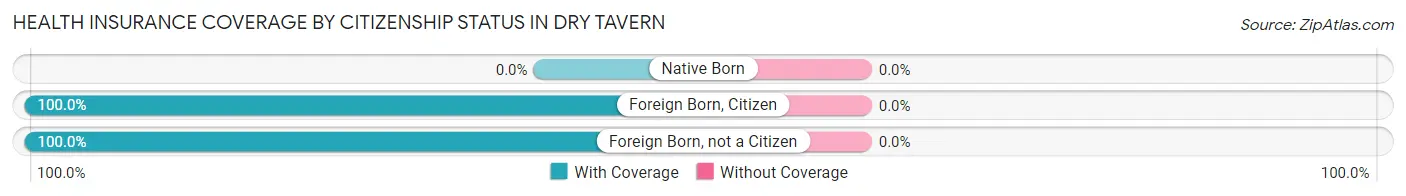
| Citizenship Status | With Coverage | Without Coverage |
| Native Born | 0 (0.0%) | 0 (0.0%) |
| Foreign Born, Citizen | 82 (100.0%) | 0 (0.0%) |
| Foreign Born, not a Citizen | 50 (100.0%) | 0 (0.0%) |
Health Insurance Coverage by Household Income in Dry Tavern
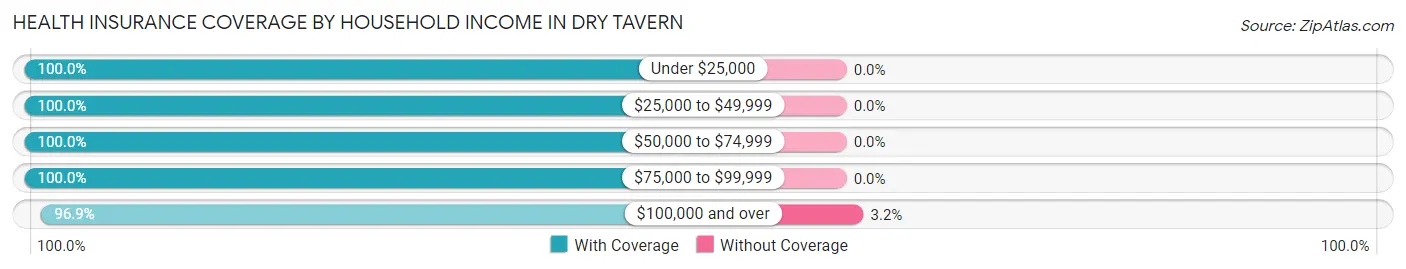
| Household Income | With Coverage | Without Coverage |
| Under $25,000 | 32 (100.0%) | 0 (0.0%) |
| $25,000 to $49,999 | 95 (100.0%) | 0 (0.0%) |
| $50,000 to $74,999 | 125 (100.0%) | 0 (0.0%) |
| $75,000 to $99,999 | 153 (100.0%) | 0 (0.0%) |
| $100,000 and over | 215 (96.9%) | 7 (3.2%) |
Public vs Private Health Insurance Coverage by Age in Dry Tavern
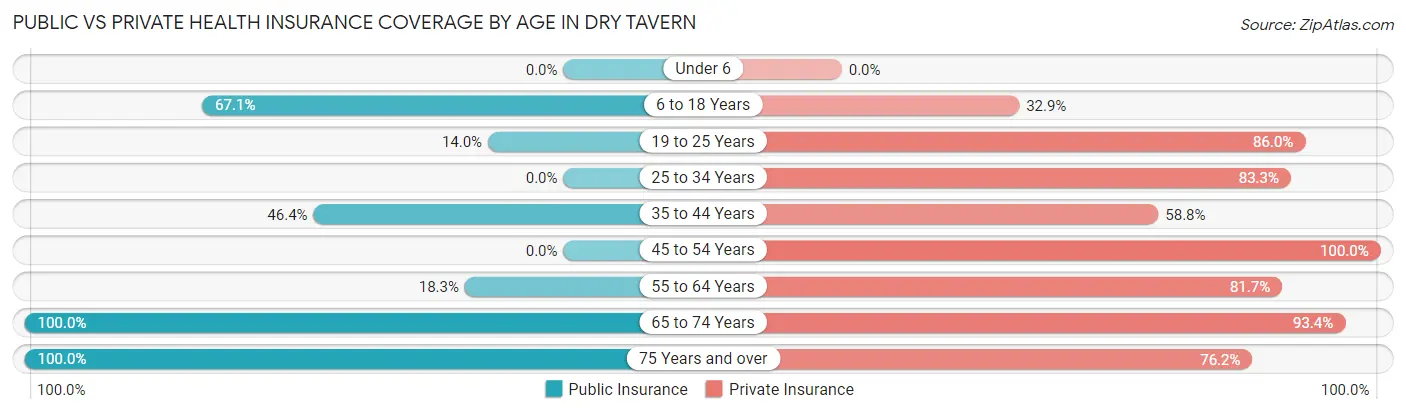
| Age Bracket | Public Insurance | Private Insurance |
| Under 6 | 0 (0.0%) | 0 (0.0%) |
| 6 to 18 Years | 55 (67.1%) | 27 (32.9%) |
| 19 to 25 Years | 7 (14.0%) | 43 (86.0%) |
| 25 to 34 Years | 0 (0.0%) | 35 (83.3%) |
| 35 to 44 Years | 45 (46.4%) | 57 (58.8%) |
| 45 to 54 Years | 0 (0.0%) | 99 (100.0%) |
| 55 to 64 Years | 15 (18.3%) | 67 (81.7%) |
| 65 to 74 Years | 91 (100.0%) | 85 (93.4%) |
| 75 Years and over | 84 (100.0%) | 64 (76.2%) |
| Total | 297 (47.4%) | 477 (76.1%) |
Disability Status by Sex by Age in Dry Tavern
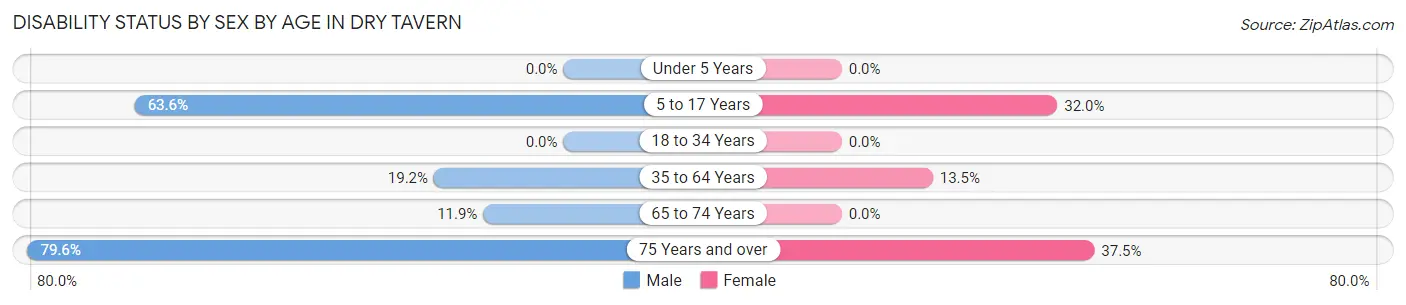
| Age Bracket | Male | Female |
| Under 5 Years | 0 (0.0%) | 0 (0.0%) |
| 5 to 17 Years | 28 (63.6%) | 8 (32.0%) |
| 18 to 34 Years | 0 (0.0%) | 0 (0.0%) |
| 35 to 64 Years | 25 (19.2%) | 20 (13.5%) |
| 65 to 74 Years | 5 (11.9%) | 0 (0.0%) |
| 75 Years and over | 35 (79.5%) | 15 (37.5%) |
Disability Class by Sex by Age in Dry Tavern
Disability Class: Hearing Difficulty
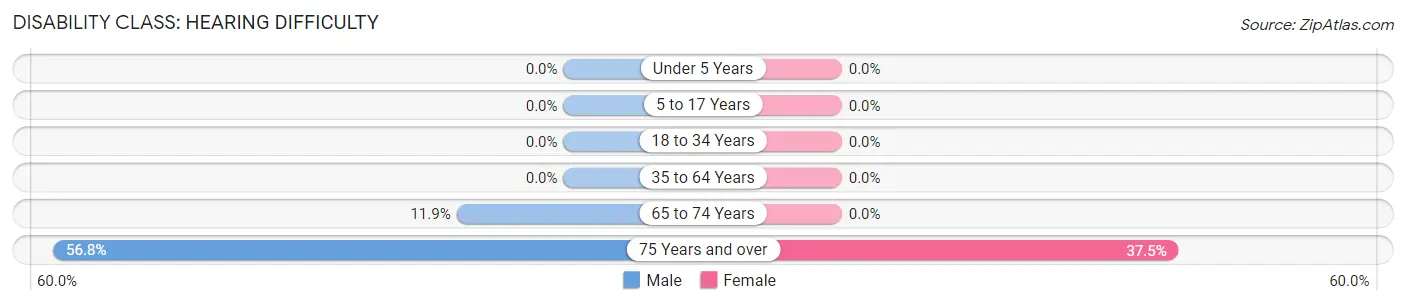
| Age Bracket | Male | Female |
| Under 5 Years | 0 (0.0%) | 0 (0.0%) |
| 5 to 17 Years | 0 (0.0%) | 0 (0.0%) |
| 18 to 34 Years | 0 (0.0%) | 0 (0.0%) |
| 35 to 64 Years | 0 (0.0%) | 0 (0.0%) |
| 65 to 74 Years | 5 (11.9%) | 0 (0.0%) |
| 75 Years and over | 25 (56.8%) | 15 (37.5%) |
Disability Class: Vision Difficulty
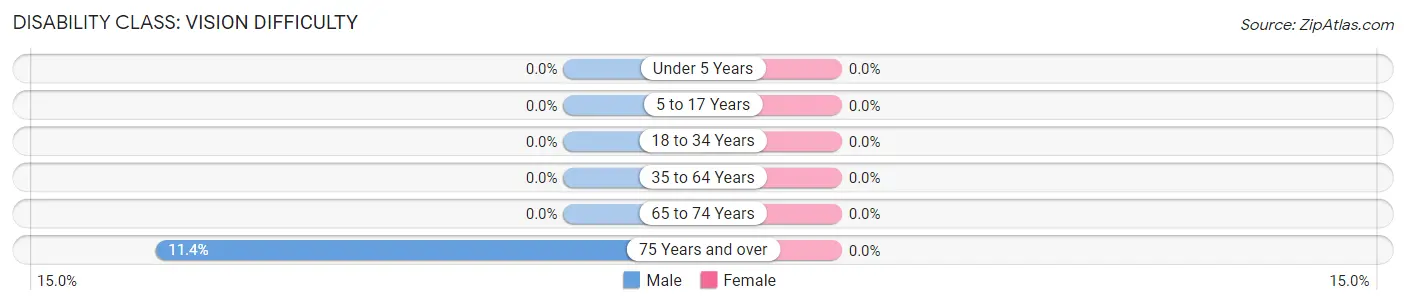
| Age Bracket | Male | Female |
| Under 5 Years | 0 (0.0%) | 0 (0.0%) |
| 5 to 17 Years | 0 (0.0%) | 0 (0.0%) |
| 18 to 34 Years | 0 (0.0%) | 0 (0.0%) |
| 35 to 64 Years | 0 (0.0%) | 0 (0.0%) |
| 65 to 74 Years | 0 (0.0%) | 0 (0.0%) |
| 75 Years and over | 5 (11.4%) | 0 (0.0%) |
Disability Class: Cognitive Difficulty
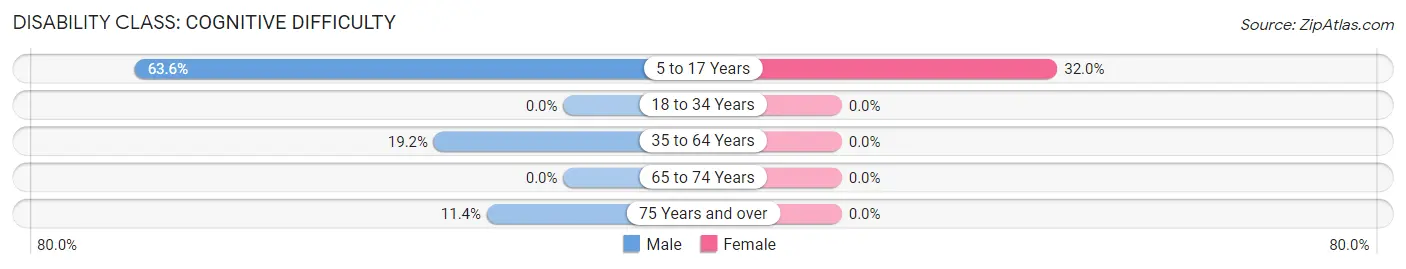
| Age Bracket | Male | Female |
| 5 to 17 Years | 28 (63.6%) | 8 (32.0%) |
| 18 to 34 Years | 0 (0.0%) | 0 (0.0%) |
| 35 to 64 Years | 25 (19.2%) | 0 (0.0%) |
| 65 to 74 Years | 0 (0.0%) | 0 (0.0%) |
| 75 Years and over | 5 (11.4%) | 0 (0.0%) |
Disability Class: Ambulatory Difficulty
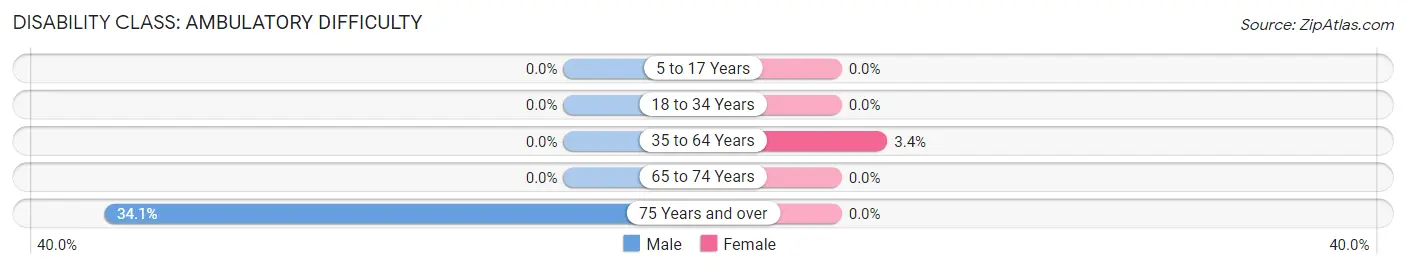
| Age Bracket | Male | Female |
| 5 to 17 Years | 0 (0.0%) | 0 (0.0%) |
| 18 to 34 Years | 0 (0.0%) | 0 (0.0%) |
| 35 to 64 Years | 0 (0.0%) | 5 (3.4%) |
| 65 to 74 Years | 0 (0.0%) | 0 (0.0%) |
| 75 Years and over | 15 (34.1%) | 0 (0.0%) |
Disability Class: Self-Care Difficulty
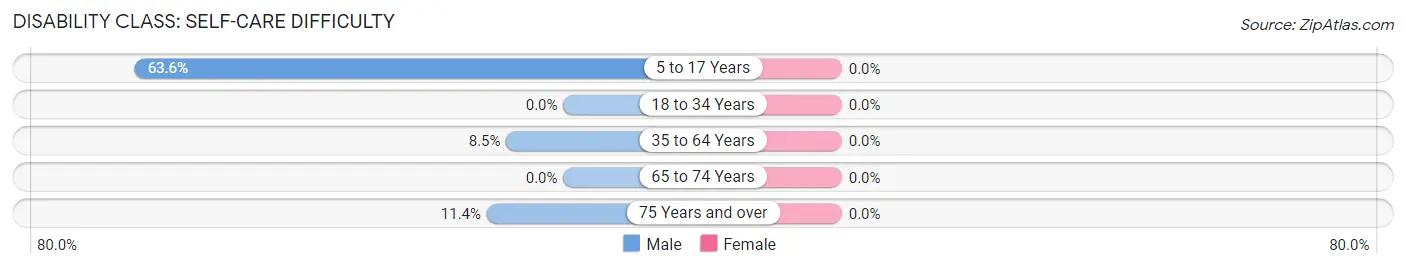
| Age Bracket | Male | Female |
| 5 to 17 Years | 28 (63.6%) | 0 (0.0%) |
| 18 to 34 Years | 0 (0.0%) | 0 (0.0%) |
| 35 to 64 Years | 11 (8.5%) | 0 (0.0%) |
| 65 to 74 Years | 0 (0.0%) | 0 (0.0%) |
| 75 Years and over | 5 (11.4%) | 0 (0.0%) |
Technology Access in Dry Tavern
Computing Device Access in Dry Tavern
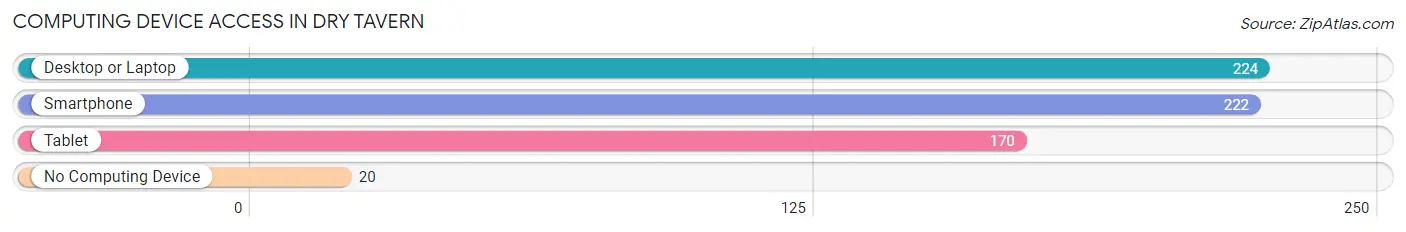
| Device Type | # Households | % Households |
| Desktop or Laptop | 224 | 86.2% |
| Smartphone | 222 | 85.4% |
| Tablet | 170 | 65.4% |
| No Computing Device | 20 | 7.7% |
| Total | 260 | 100.0% |
Internet Access in Dry Tavern
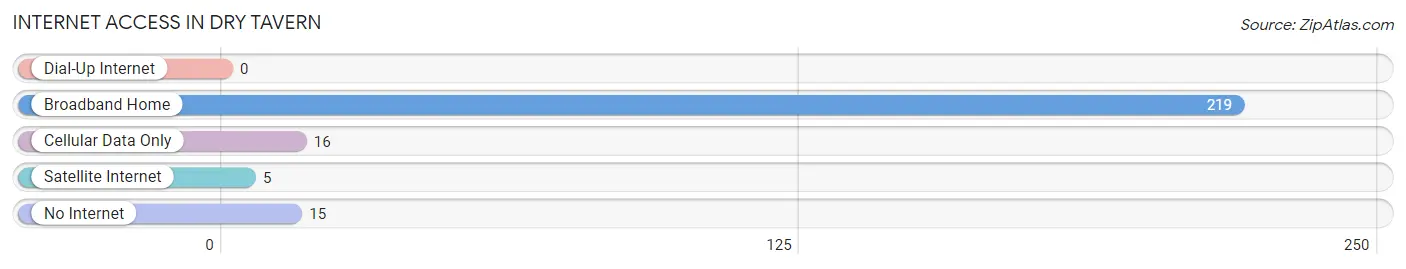
| Internet Type | # Households | % Households |
| Dial-Up Internet | 0 | 0.0% |
| Broadband Home | 219 | 84.2% |
| Cellular Data Only | 16 | 6.1% |
| Satellite Internet | 5 | 1.9% |
| No Internet | 15 | 5.8% |
| Total | 260 | 100.0% |
Dry Tavern Summary
Dry Tavern is an unincorporated community located in the western part of Schuylkill County, Pennsylvania. It is situated in the Mahanoy Township, and is located along the Mahanoy Creek. The community is located approximately 8 miles south of the borough of Mahanoy City, and is approximately 10 miles north of the borough of Pottsville.
History
The area that is now known as Dry Tavern was first settled in the late 1700s by German immigrants. The community was originally known as “Drytown”, and was named after the dry goods store that was located in the area. The store was owned by a man named John Dry, and the name of the community was eventually changed to “Dry Tavern” in his honor.
The community was primarily an agricultural area, and the main crops grown in the area were wheat, oats, and corn. The area was also known for its coal mining industry, and the first coal mine in the area was opened in 1845. The coal mines in the area were some of the most productive in the region, and the coal industry was a major source of employment for the residents of Dry Tavern.
The community was also home to a number of other businesses, including a general store, a blacksmith shop, a sawmill, and a gristmill. The community also had a post office, which was established in 1851.
Geography
Dry Tavern is located in the western part of Schuylkill County, Pennsylvania. It is situated in the Mahanoy Township, and is located along the Mahanoy Creek. The community is located approximately 8 miles south of the borough of Mahanoy City, and is approximately 10 miles north of the borough of Pottsville.
The terrain in the area is mostly hilly, and the area is covered with forests and fields. The climate in the area is humid continental, and the average temperature in the summer is around 75 degrees Fahrenheit, and the average temperature in the winter is around 30 degrees Fahrenheit.
Economy
The economy of Dry Tavern is primarily based on agriculture and coal mining. The main crops grown in the area are wheat, oats, and corn. The coal mines in the area are some of the most productive in the region, and the coal industry is a major source of employment for the residents of Dry Tavern.
The community is also home to a number of other businesses, including a general store, a blacksmith shop, a sawmill, and a gristmill. The community also has a post office, which was established in 1851.
Demographics
As of the 2010 census, the population of Dry Tavern was 545. The racial makeup of the community was 97.3% White, 0.7% African American, 0.2% Native American, 0.2% Asian, and 1.6% from other races. The median household income in the community was $41,250, and the median family income was $50,000. The per capita income in the community was $20,000.
Common Questions
What is Per Capita Income in Dry Tavern?
Per Capita income in Dry Tavern is $35,082.
What is the Median Family Income in Dry Tavern?
Median Family Income in Dry Tavern is $82,857.
What is the Median Household income in Dry Tavern?
Median Household Income in Dry Tavern is $68,750.
What is Income or Wage Gap in Dry Tavern?
Income or Wage Gap in Dry Tavern is 26.9%.
Women in Dry Tavern earn 73.1 cents for every dollar earned by a man.
What is Inequality or Gini Index in Dry Tavern?
Inequality or Gini Index in Dry Tavern is 0.31.
What is the Total Population of Dry Tavern?
Total Population of Dry Tavern is 627.
What is the Total Male Population of Dry Tavern?
Total Male Population of Dry Tavern is 332.
What is the Total Female Population of Dry Tavern?
Total Female Population of Dry Tavern is 295.
What is the Ratio of Males per 100 Females in Dry Tavern?
There are 112.54 Males per 100 Females in Dry Tavern.
What is the Ratio of Females per 100 Males in Dry Tavern?
There are 88.86 Females per 100 Males in Dry Tavern.
What is the Median Population Age in Dry Tavern?
Median Population Age in Dry Tavern is 47.9 Years.
What is the Average Family Size in Dry Tavern
Average Family Size in Dry Tavern is 3.1 People.
What is the Average Household Size in Dry Tavern
Average Household Size in Dry Tavern is 2.4 People.
How Large is the Labor Force in Dry Tavern?
There are 325 People in the Labor Forcein in Dry Tavern.
What is the Percentage of People in the Labor Force in Dry Tavern?
58.2% of People are in the Labor Force in Dry Tavern.
What is the Unemployment Rate in Dry Tavern?
Unemployment Rate in Dry Tavern is 12.9%.