Marblehead, OH Map & Demographics
Marblehead Map
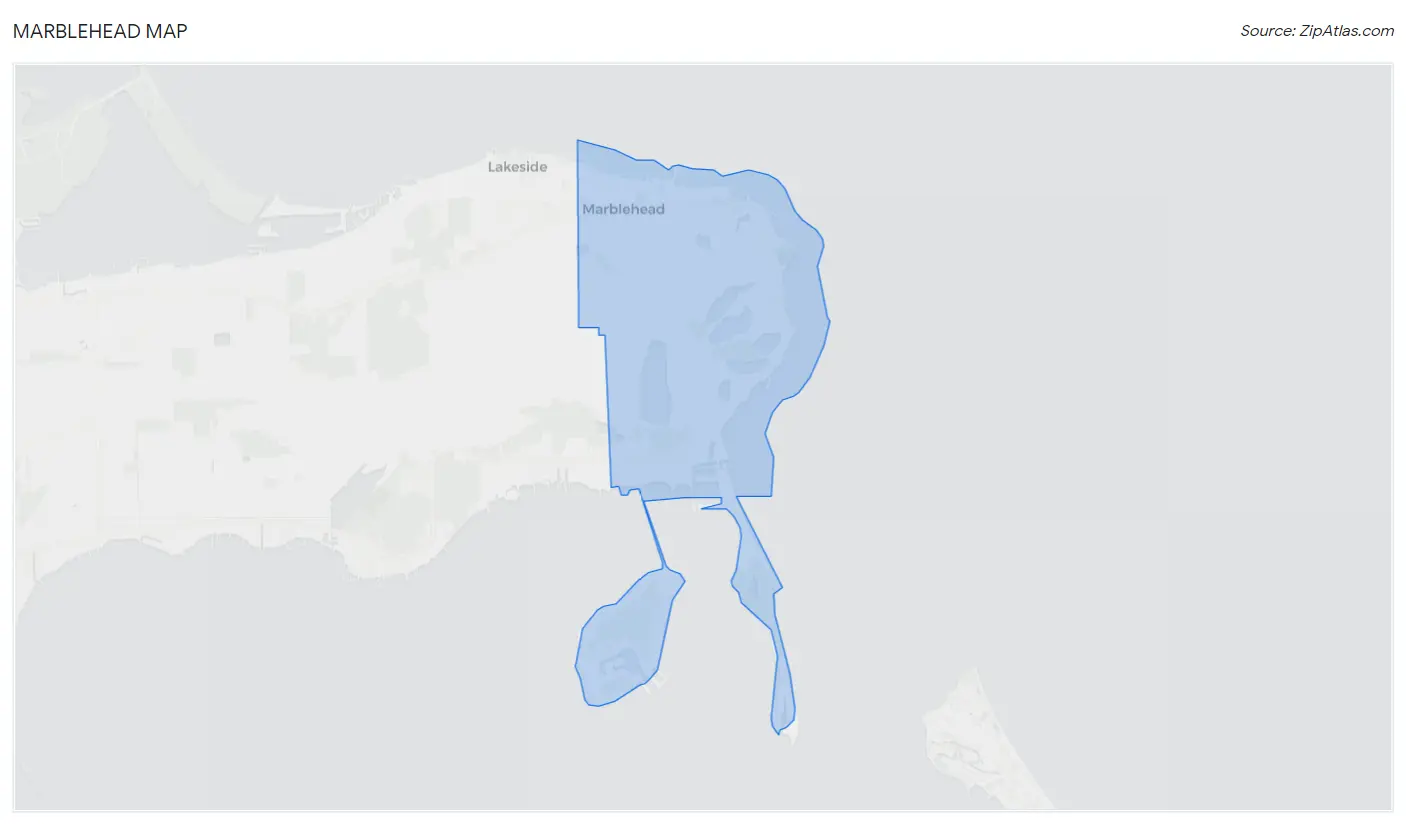
Marblehead Overview
$51,372
PER CAPITA INCOME
$100,000
AVG FAMILY INCOME
$97,019
AVG HOUSEHOLD INCOME
3.0%
WAGE / INCOME GAP [ % ]
97.0¢/ $1
WAGE / INCOME GAP [ $ ]
0.39
INEQUALITY / GINI INDEX
962
TOTAL POPULATION
502
MALE POPULATION
460
FEMALE POPULATION
109.13
MALES / 100 FEMALES
91.63
FEMALES / 100 MALES
57.3
MEDIAN AGE
2.5
AVG FAMILY SIZE
2.3
AVG HOUSEHOLD SIZE
393
LABOR FORCE [ PEOPLE ]
48.3%
PERCENT IN LABOR FORCE
0.8%
UNEMPLOYMENT RATE
Income in Marblehead
Income Overview in Marblehead
Per Capita Income in Marblehead is $51,372, while median incomes of families and households are $100,000 and $97,019 respectively.
| Characteristic | Number | Measure |
| Per Capita Income | 962 | $51,372 |
| Median Family Income | 298 | $100,000 |
| Mean Family Income | 298 | $116,823 |
| Median Household Income | 421 | $97,019 |
| Mean Household Income | 421 | $114,161 |
| Income Deficit | 298 | $0 |
| Wage / Income Gap (%) | 962 | 2.99% |
| Wage / Income Gap ($) | 962 | 97.01¢ per $1 |
| Gini / Inequality Index | 962 | 0.39 |
Earnings by Sex in Marblehead
Average Earnings in Marblehead are $46,429, $47,031 for men and $45,625 for women, a difference of 3.0%.
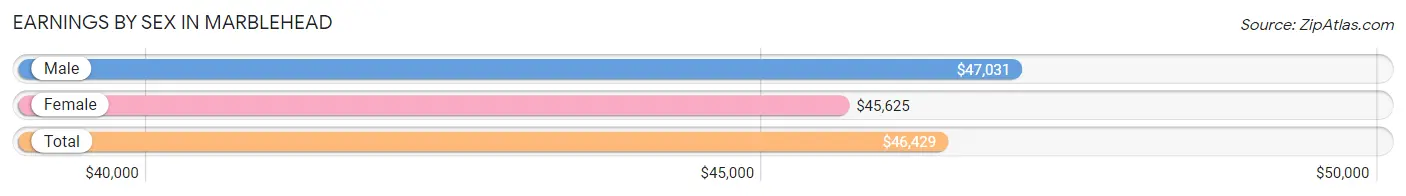
| Sex | Number | Average Earnings |
| Male | 273 (55.9%) | $47,031 |
| Female | 215 (44.1%) | $45,625 |
| Total | 488 (100.0%) | $46,429 |
Earnings by Sex by Income Bracket in Marblehead
The most common earnings brackets in Marblehead are $25,000 to $29,999 for men (58 | 21.2%) and $65,000 to $74,999 for women (26 | 12.1%).
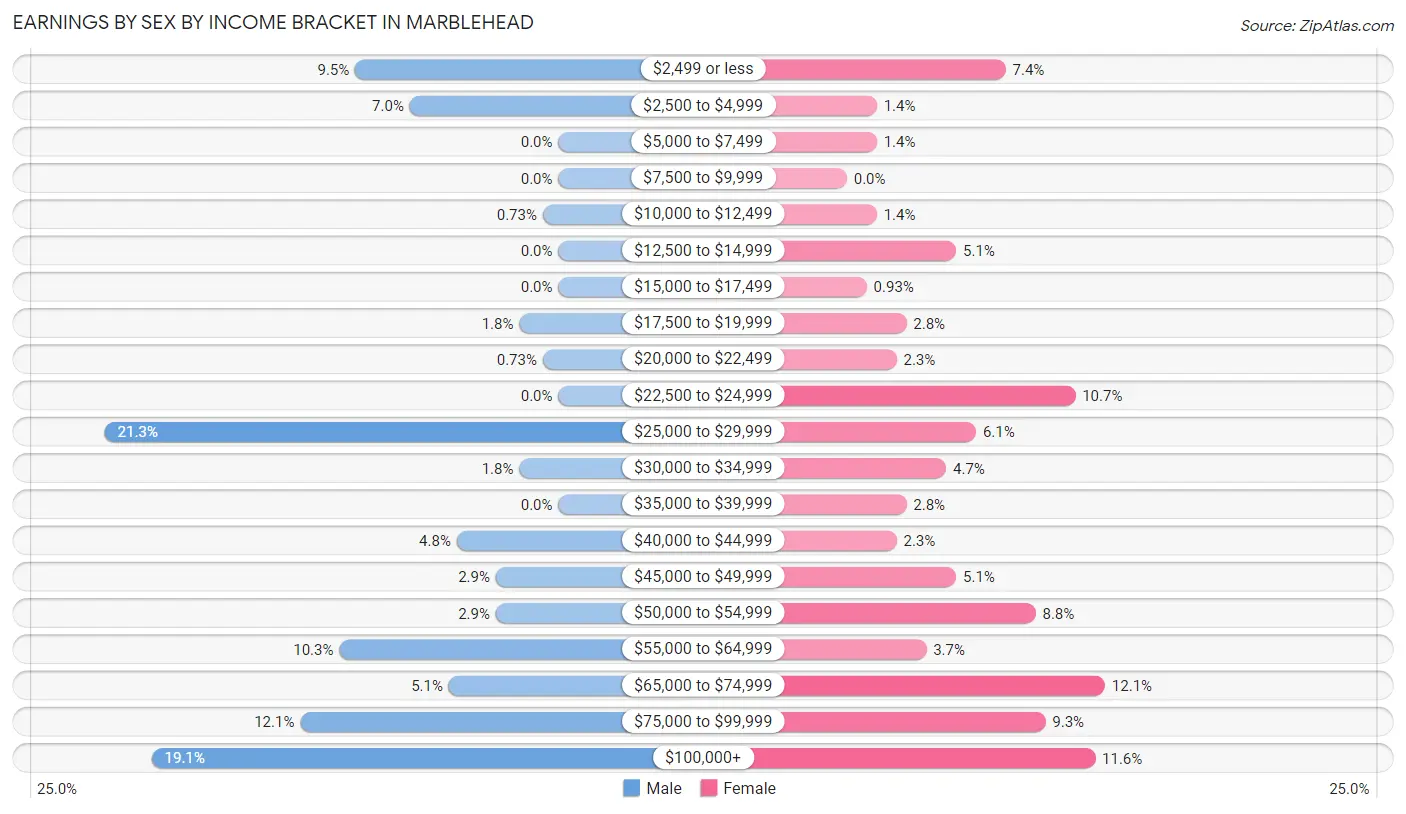
| Income | Male | Female |
| $2,499 or less | 26 (9.5%) | 16 (7.4%) |
| $2,500 to $4,999 | 19 (7.0%) | 3 (1.4%) |
| $5,000 to $7,499 | 0 (0.0%) | 3 (1.4%) |
| $7,500 to $9,999 | 0 (0.0%) | 0 (0.0%) |
| $10,000 to $12,499 | 2 (0.7%) | 3 (1.4%) |
| $12,500 to $14,999 | 0 (0.0%) | 11 (5.1%) |
| $15,000 to $17,499 | 0 (0.0%) | 2 (0.9%) |
| $17,500 to $19,999 | 5 (1.8%) | 6 (2.8%) |
| $20,000 to $22,499 | 2 (0.7%) | 5 (2.3%) |
| $22,500 to $24,999 | 0 (0.0%) | 23 (10.7%) |
| $25,000 to $29,999 | 58 (21.2%) | 13 (6.0%) |
| $30,000 to $34,999 | 5 (1.8%) | 10 (4.6%) |
| $35,000 to $39,999 | 0 (0.0%) | 6 (2.8%) |
| $40,000 to $44,999 | 13 (4.8%) | 5 (2.3%) |
| $45,000 to $49,999 | 8 (2.9%) | 11 (5.1%) |
| $50,000 to $54,999 | 8 (2.9%) | 19 (8.8%) |
| $55,000 to $64,999 | 28 (10.3%) | 8 (3.7%) |
| $65,000 to $74,999 | 14 (5.1%) | 26 (12.1%) |
| $75,000 to $99,999 | 33 (12.1%) | 20 (9.3%) |
| $100,000+ | 52 (19.1%) | 25 (11.6%) |
| Total | 273 (100.0%) | 215 (100.0%) |
Earnings by Sex by Educational Attainment in Marblehead
Average earnings in Marblehead are $56,250 for men and $45,625 for women, a difference of 18.9%. Men with an educational attainment of bachelor's degree enjoy the highest average annual earnings of $90,625, while those with college or associate's degree education earn the least with $46,563. Women with an educational attainment of graduate degree earn the most with the average annual earnings of $68,875, while those with high school diploma education have the smallest earnings of $24,063.
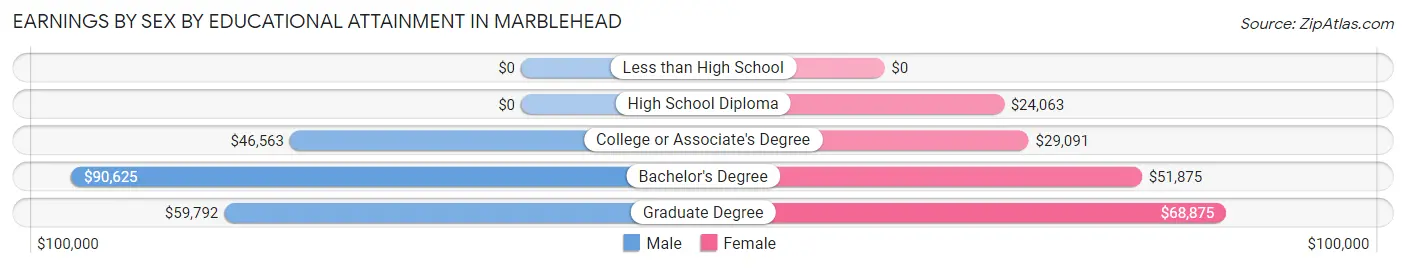
| Educational Attainment | Male Income | Female Income |
| Less than High School | - | - |
| High School Diploma | - | - |
| College or Associate's Degree | $46,563 | $29,091 |
| Bachelor's Degree | $90,625 | $51,875 |
| Graduate Degree | $59,792 | $68,875 |
| Total | $56,250 | $45,625 |
Family Income in Marblehead
Family Income Brackets in Marblehead
According to the Marblehead family income data, there are 77 families falling into the $100,000 to $149,999 income range, which is the most common income bracket and makes up 25.8% of all families.
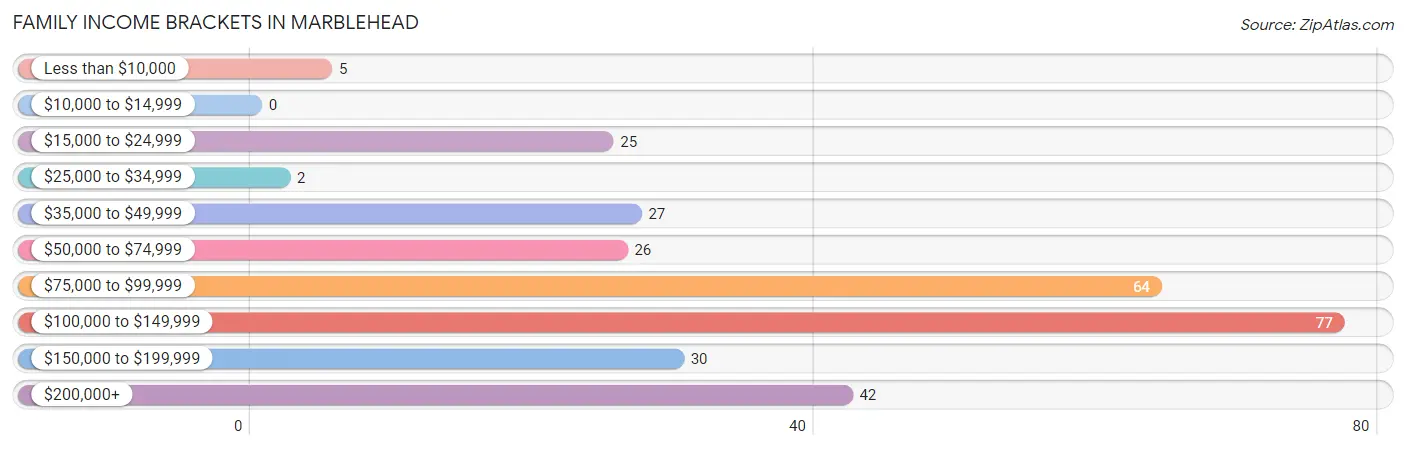
| Income Bracket | # Families | % Families |
| Less than $10,000 | 5 | 1.7% |
| $10,000 to $14,999 | 0 | 0.0% |
| $15,000 to $24,999 | 25 | 8.4% |
| $25,000 to $34,999 | 2 | 0.7% |
| $35,000 to $49,999 | 27 | 9.1% |
| $50,000 to $74,999 | 26 | 8.7% |
| $75,000 to $99,999 | 64 | 21.5% |
| $100,000 to $149,999 | 77 | 25.8% |
| $150,000 to $199,999 | 30 | 10.1% |
| $200,000+ | 42 | 14.1% |
Family Income by Famaliy Size in Marblehead
5-person families (8 | 2.7%) account for the highest median family income in Marblehead with $136,250 per family, while 2-person families (232 | 77.8%) have the highest median income of $50,000 per family member.
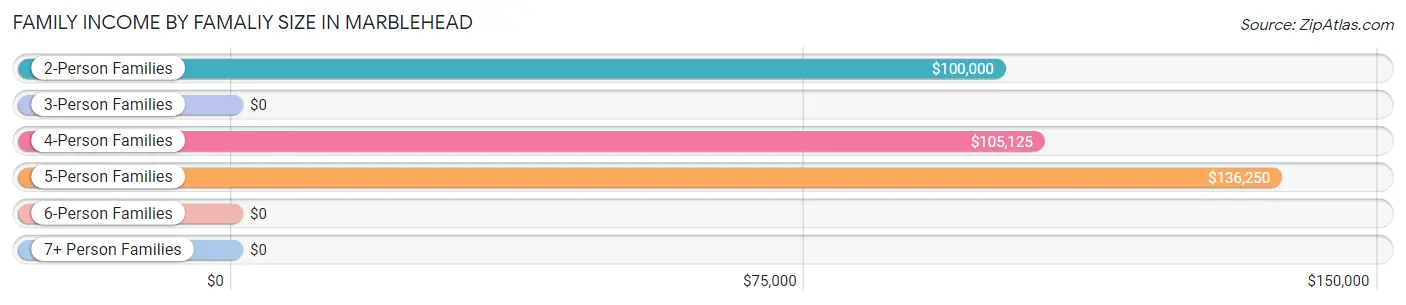
| Income Bracket | # Families | Median Income |
| 2-Person Families | 232 (77.8%) | $100,000 |
| 3-Person Families | 29 (9.7%) | $0 |
| 4-Person Families | 29 (9.7%) | $105,125 |
| 5-Person Families | 8 (2.7%) | $136,250 |
| 6-Person Families | 0 (0.0%) | $0 |
| 7+ Person Families | 0 (0.0%) | $0 |
| Total | 298 (100.0%) | $100,000 |
Family Income by Number of Earners in Marblehead
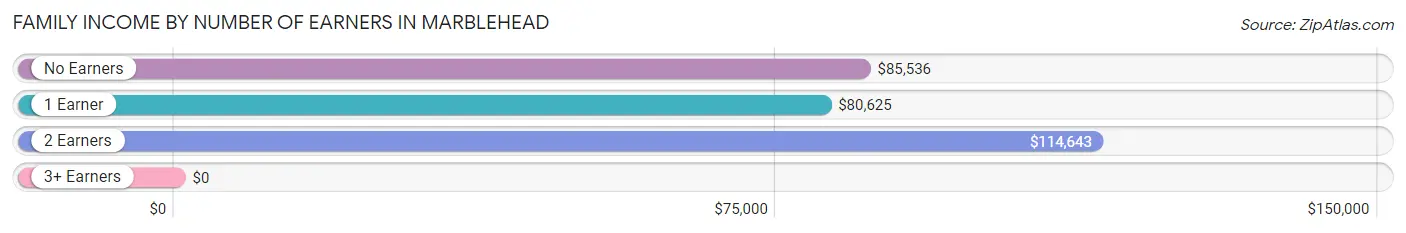
| Number of Earners | # Families | Median Income |
| No Earners | 93 (31.2%) | $85,536 |
| 1 Earner | 77 (25.8%) | $80,625 |
| 2 Earners | 120 (40.3%) | $114,643 |
| 3+ Earners | 8 (2.7%) | $0 |
| Total | 298 (100.0%) | $100,000 |
Household Income in Marblehead
Household Income Brackets in Marblehead
With 93 households falling in the category, the $100,000 to $149,999 income range is the most frequent in Marblehead, accounting for 22.1% of all households.

| Income Bracket | # Households | % Households |
| Less than $10,000 | 16 | 3.8% |
| $10,000 to $14,999 | 0 | 0.0% |
| $15,000 to $24,999 | 30 | 7.1% |
| $25,000 to $34,999 | 12 | 2.9% |
| $35,000 to $49,999 | 45 | 10.7% |
| $50,000 to $74,999 | 41 | 9.7% |
| $75,000 to $99,999 | 82 | 19.5% |
| $100,000 to $149,999 | 93 | 22.1% |
| $150,000 to $199,999 | 50 | 11.9% |
| $200,000+ | 52 | 12.4% |
Household Income by Householder Age in Marblehead
The median household income in Marblehead is $97,019, with the highest median household income of $151,667 found in the 45 to 64 years age bracket for the primary householder. A total of 142 households (33.7%) fall into this category.
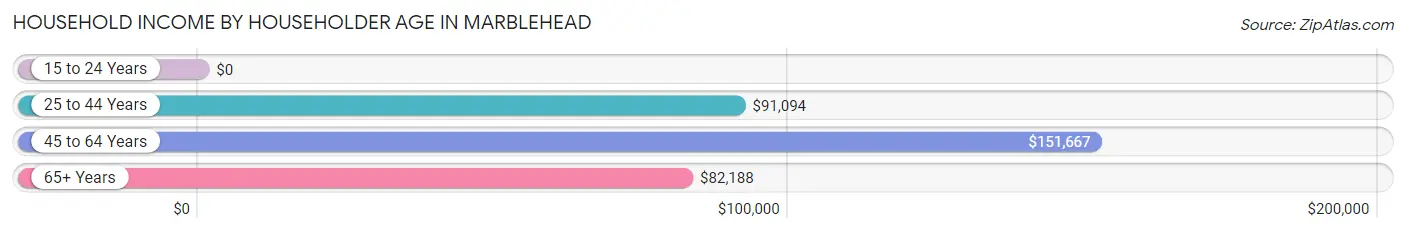
| Income Bracket | # Households | Median Income |
| 15 to 24 Years | 0 (0.0%) | $0 |
| 25 to 44 Years | 52 (12.3%) | $91,094 |
| 45 to 64 Years | 142 (33.7%) | $151,667 |
| 65+ Years | 227 (53.9%) | $82,188 |
| Total | 421 (100.0%) | $97,019 |
Poverty in Marblehead
Income Below Poverty by Sex and Age in Marblehead
With 4.0% poverty level for males and 5.0% for females among the residents of Marblehead, 65 to 74 year old males and 45 to 54 year old females are the most vulnerable to poverty, with 11 males (10.1%) and 16 females (42.1%) in their respective age groups living below the poverty level.
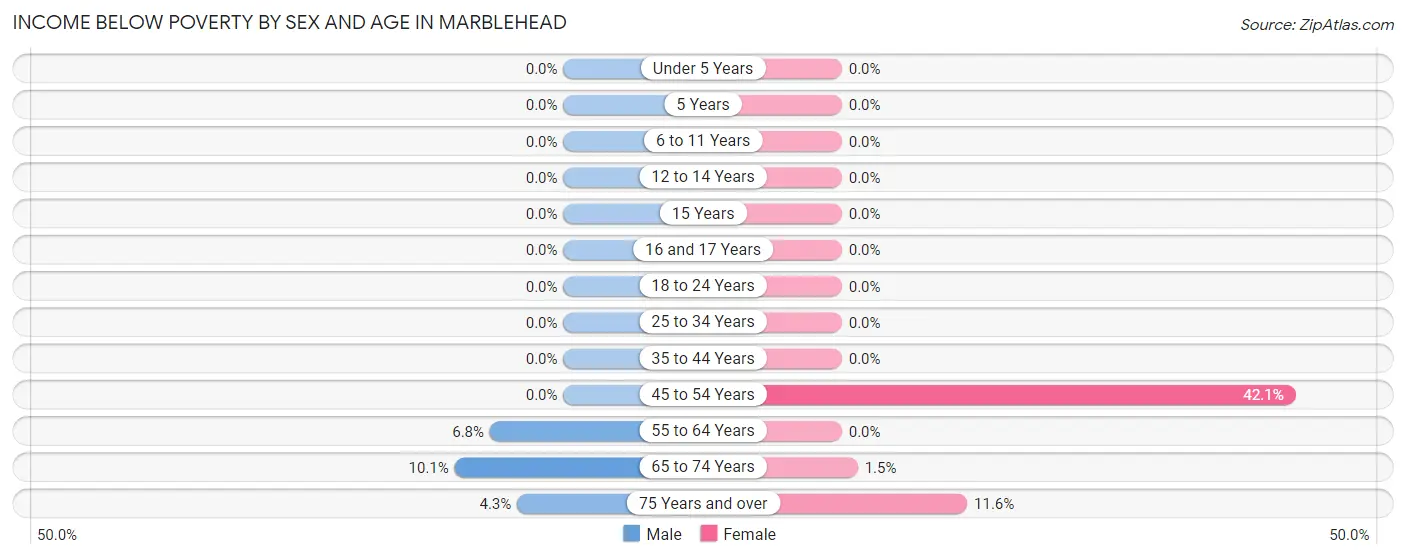
| Age Bracket | Male | Female |
| Under 5 Years | 0 (0.0%) | 0 (0.0%) |
| 5 Years | 0 (0.0%) | 0 (0.0%) |
| 6 to 11 Years | 0 (0.0%) | 0 (0.0%) |
| 12 to 14 Years | 0 (0.0%) | 0 (0.0%) |
| 15 Years | 0 (0.0%) | 0 (0.0%) |
| 16 and 17 Years | 0 (0.0%) | 0 (0.0%) |
| 18 to 24 Years | 0 (0.0%) | 0 (0.0%) |
| 25 to 34 Years | 0 (0.0%) | 0 (0.0%) |
| 35 to 44 Years | 0 (0.0%) | 0 (0.0%) |
| 45 to 54 Years | 0 (0.0%) | 16 (42.1%) |
| 55 to 64 Years | 6 (6.8%) | 0 (0.0%) |
| 65 to 74 Years | 11 (10.1%) | 2 (1.5%) |
| 75 Years and over | 3 (4.3%) | 5 (11.6%) |
| Total | 20 (4.0%) | 23 (5.0%) |
Income Above Poverty by Sex and Age in Marblehead
According to the poverty statistics in Marblehead, males aged under 5 years and females aged under 5 years are the age groups that are most secure financially, with 100.0% of males and 100.0% of females in these age groups living above the poverty line.
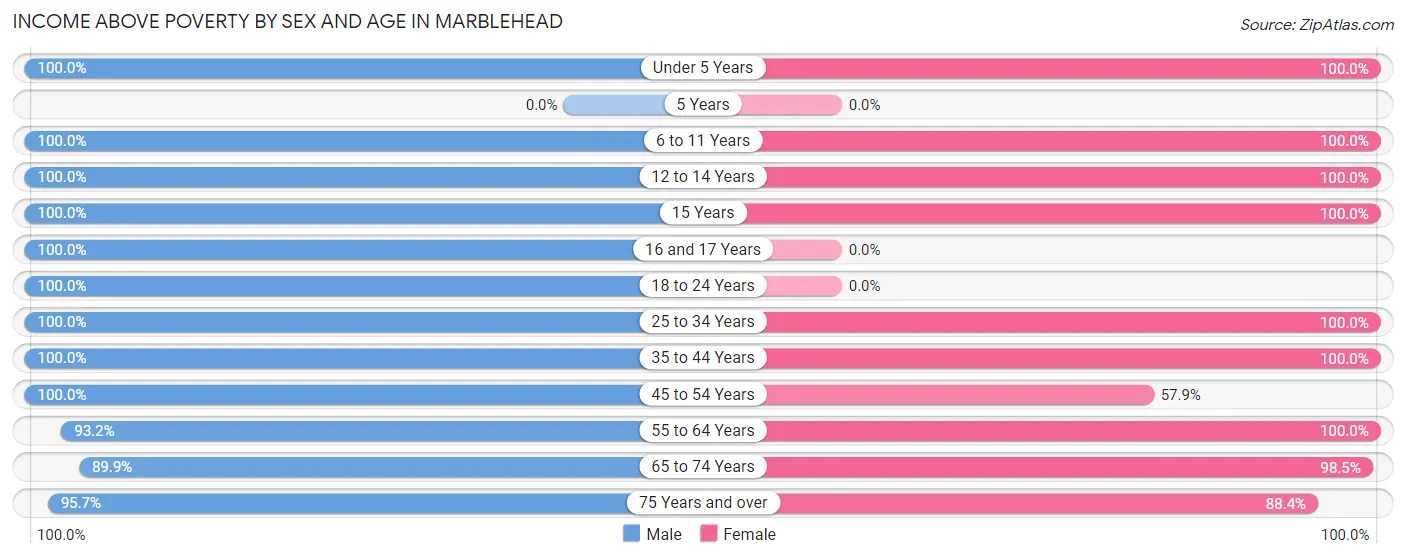
| Age Bracket | Male | Female |
| Under 5 Years | 23 (100.0%) | 3 (100.0%) |
| 5 Years | 0 (0.0%) | 0 (0.0%) |
| 6 to 11 Years | 29 (100.0%) | 42 (100.0%) |
| 12 to 14 Years | 4 (100.0%) | 15 (100.0%) |
| 15 Years | 14 (100.0%) | 18 (100.0%) |
| 16 and 17 Years | 11 (100.0%) | 0 (0.0%) |
| 18 to 24 Years | 23 (100.0%) | 0 (0.0%) |
| 25 to 34 Years | 12 (100.0%) | 30 (100.0%) |
| 35 to 44 Years | 85 (100.0%) | 42 (100.0%) |
| 45 to 54 Years | 34 (100.0%) | 22 (57.9%) |
| 55 to 64 Years | 82 (93.2%) | 93 (100.0%) |
| 65 to 74 Years | 98 (89.9%) | 133 (98.5%) |
| 75 Years and over | 67 (95.7%) | 38 (88.4%) |
| Total | 482 (96.0%) | 436 (95.0%) |
Income Below Poverty Among Married-Couple Families in Marblehead
The poverty statistics for married-couple families in Marblehead show that 1.3% or 3 of the total 232 families live below the poverty line. Families with no children have the highest poverty rate of 1.7%, comprising of 3 families. On the other hand, families with 1 or 2 children have the lowest poverty rate of 0.0%, which includes 0 families.
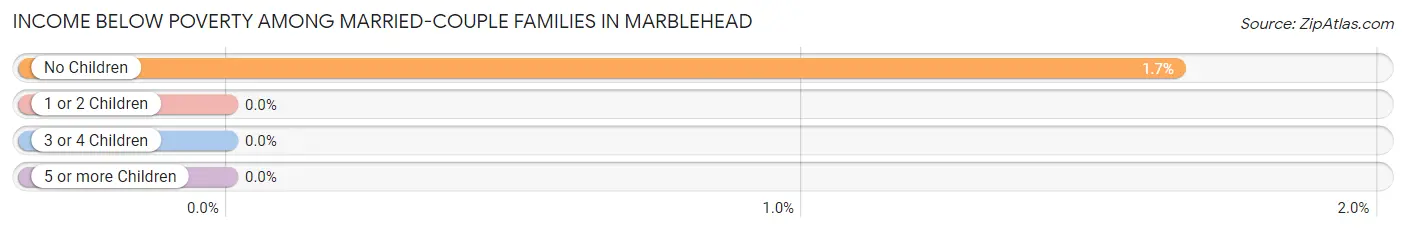
| Children | Above Poverty | Below Poverty |
| No Children | 179 (98.4%) | 3 (1.7%) |
| 1 or 2 Children | 45 (100.0%) | 0 (0.0%) |
| 3 or 4 Children | 5 (100.0%) | 0 (0.0%) |
| 5 or more Children | 0 (0.0%) | 0 (0.0%) |
| Total | 229 (98.7%) | 3 (1.3%) |
Income Below Poverty Among Single-Parent Households in Marblehead
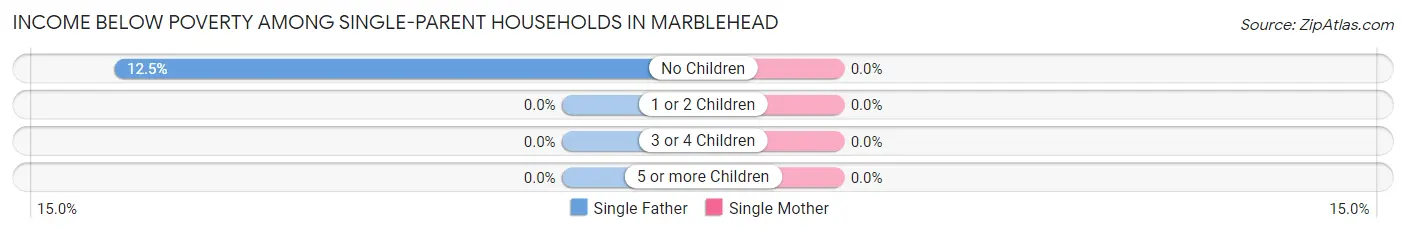
| Children | Single Father | Single Mother |
| No Children | 2 (12.5%) | 0 (0.0%) |
| 1 or 2 Children | 0 (0.0%) | 0 (0.0%) |
| 3 or 4 Children | 0 (0.0%) | 0 (0.0%) |
| 5 or more Children | 0 (0.0%) | 0 (0.0%) |
| Total | 2 (7.7%) | 0 (0.0%) |
Income Below Poverty Among Married-Couple vs Single-Parent Households in Marblehead
The poverty data for Marblehead shows that 3 of the married-couple family households (1.3%) and 2 of the single-parent households (3.0%) are living below the poverty level. Within the married-couple family households, those with no children have the highest poverty rate, with 3 households (1.7%) falling below the poverty line. Among the single-parent households, those with no children have the highest poverty rate, with 2 household (4.6%) living below poverty.
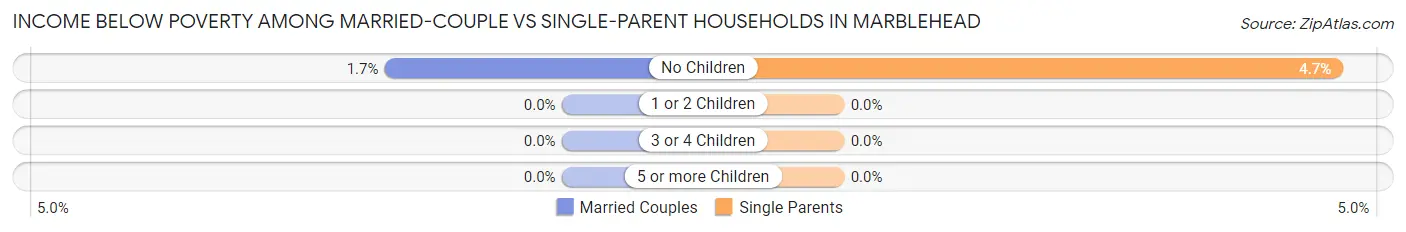
| Children | Married-Couple Families | Single-Parent Households |
| No Children | 3 (1.7%) | 2 (4.6%) |
| 1 or 2 Children | 0 (0.0%) | 0 (0.0%) |
| 3 or 4 Children | 0 (0.0%) | 0 (0.0%) |
| 5 or more Children | 0 (0.0%) | 0 (0.0%) |
| Total | 3 (1.3%) | 2 (3.0%) |
Race in Marblehead
The most populous races in Marblehead are White / Caucasian (902 | 93.8%), Two or more Races (56 | 5.8%), and Hispanic or Latino (48 | 5.0%).
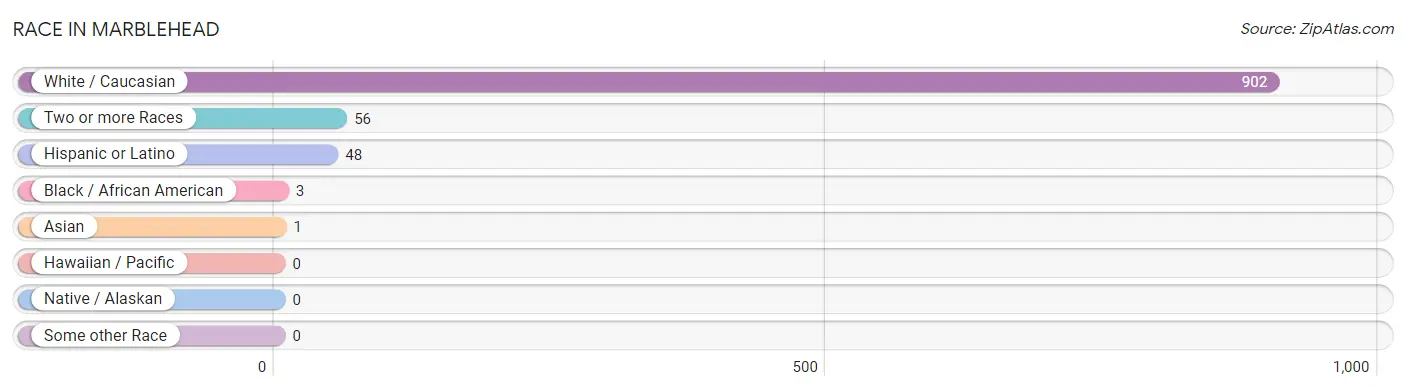
| Race | # Population | % Population |
| Asian | 1 | 0.1% |
| Black / African American | 3 | 0.3% |
| Hawaiian / Pacific | 0 | 0.0% |
| Hispanic or Latino | 48 | 5.0% |
| Native / Alaskan | 0 | 0.0% |
| White / Caucasian | 902 | 93.8% |
| Two or more Races | 56 | 5.8% |
| Some other Race | 0 | 0.0% |
| Total | 962 | 100.0% |
Ancestry in Marblehead
The most populous ancestries reported in Marblehead are German (336 | 34.9%), Irish (174 | 18.1%), English (128 | 13.3%), Slovak (91 | 9.5%), and Polish (84 | 8.7%), together accounting for 84.5% of all Marblehead residents.
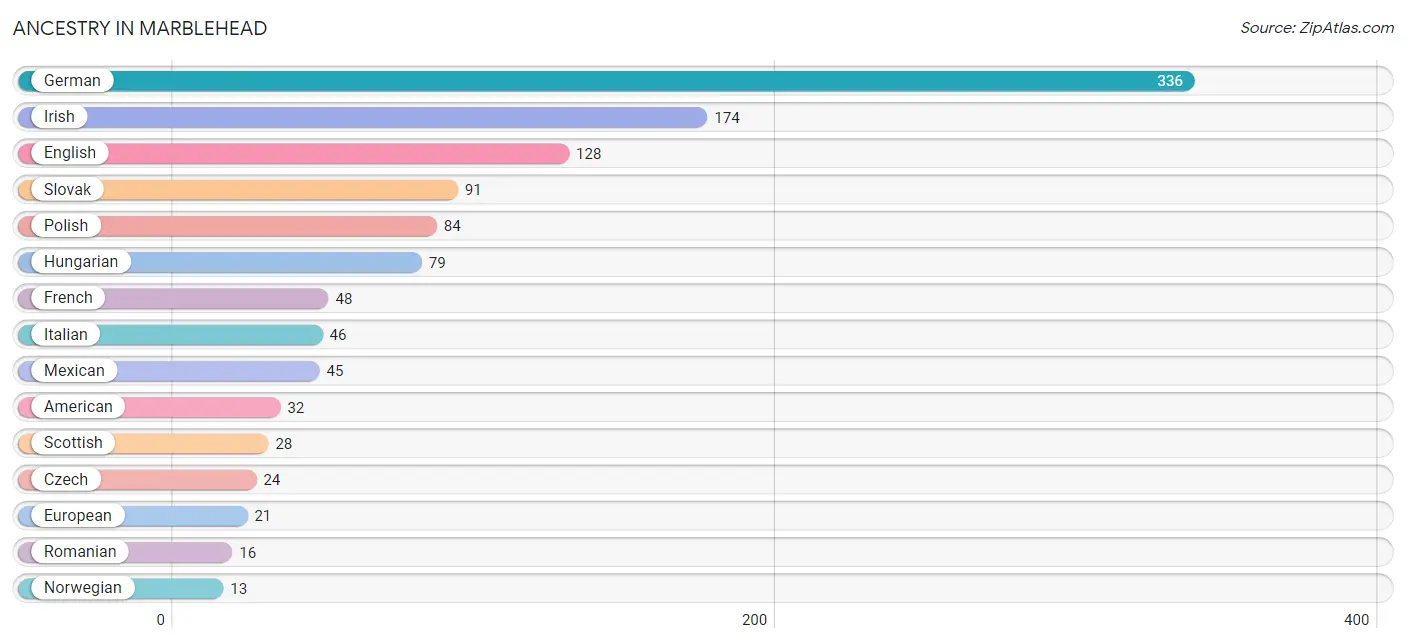
| Ancestry | # Population | % Population |
| American | 32 | 3.3% |
| Arab | 2 | 0.2% |
| Bhutanese | 12 | 1.3% |
| British | 8 | 0.8% |
| Croatian | 5 | 0.5% |
| Czech | 24 | 2.5% |
| Czechoslovakian | 11 | 1.1% |
| Eastern European | 5 | 0.5% |
| English | 128 | 13.3% |
| European | 21 | 2.2% |
| French | 48 | 5.0% |
| French Canadian | 2 | 0.2% |
| German | 336 | 34.9% |
| Hungarian | 79 | 8.2% |
| Irish | 174 | 18.1% |
| Italian | 46 | 4.8% |
| Korean | 1 | 0.1% |
| Latvian | 2 | 0.2% |
| Lebanese | 2 | 0.2% |
| Mexican | 45 | 4.7% |
| Norwegian | 13 | 1.3% |
| Polish | 84 | 8.7% |
| Puerto Rican | 3 | 0.3% |
| Romanian | 16 | 1.7% |
| Scotch-Irish | 3 | 0.3% |
| Scottish | 28 | 2.9% |
| Slavic | 3 | 0.3% |
| Slovak | 91 | 9.5% |
| Slovene | 6 | 0.6% |
| Swedish | 6 | 0.6% |
| Ukrainian | 3 | 0.3% |
| Welsh | 9 | 0.9% |
| Yugoslavian | 2 | 0.2% | View All 33 Rows |
Immigrants in Marblehead
The most numerous immigrant groups reported in Marblehead came from Eastern Europe (4 | 0.4%), Europe (4 | 0.4%), Poland (4 | 0.4%), Asia (1 | 0.1%), and Philippines (1 | 0.1%), together accounting for 1.5% of all Marblehead residents.
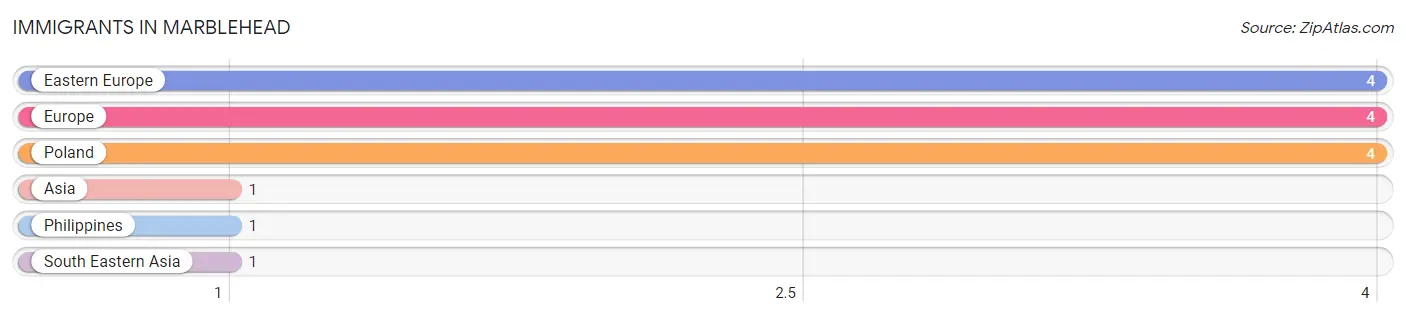
| Immigration Origin | # Population | % Population |
| Asia | 1 | 0.1% |
| Eastern Europe | 4 | 0.4% |
| Europe | 4 | 0.4% |
| Philippines | 1 | 0.1% |
| Poland | 4 | 0.4% |
| South Eastern Asia | 1 | 0.1% | View All 6 Rows |
Sex and Age in Marblehead
Sex and Age in Marblehead
The most populous age groups in Marblehead are 55 to 59 Years (68 | 13.6%) for men and 70 to 74 Years (71 | 15.4%) for women.
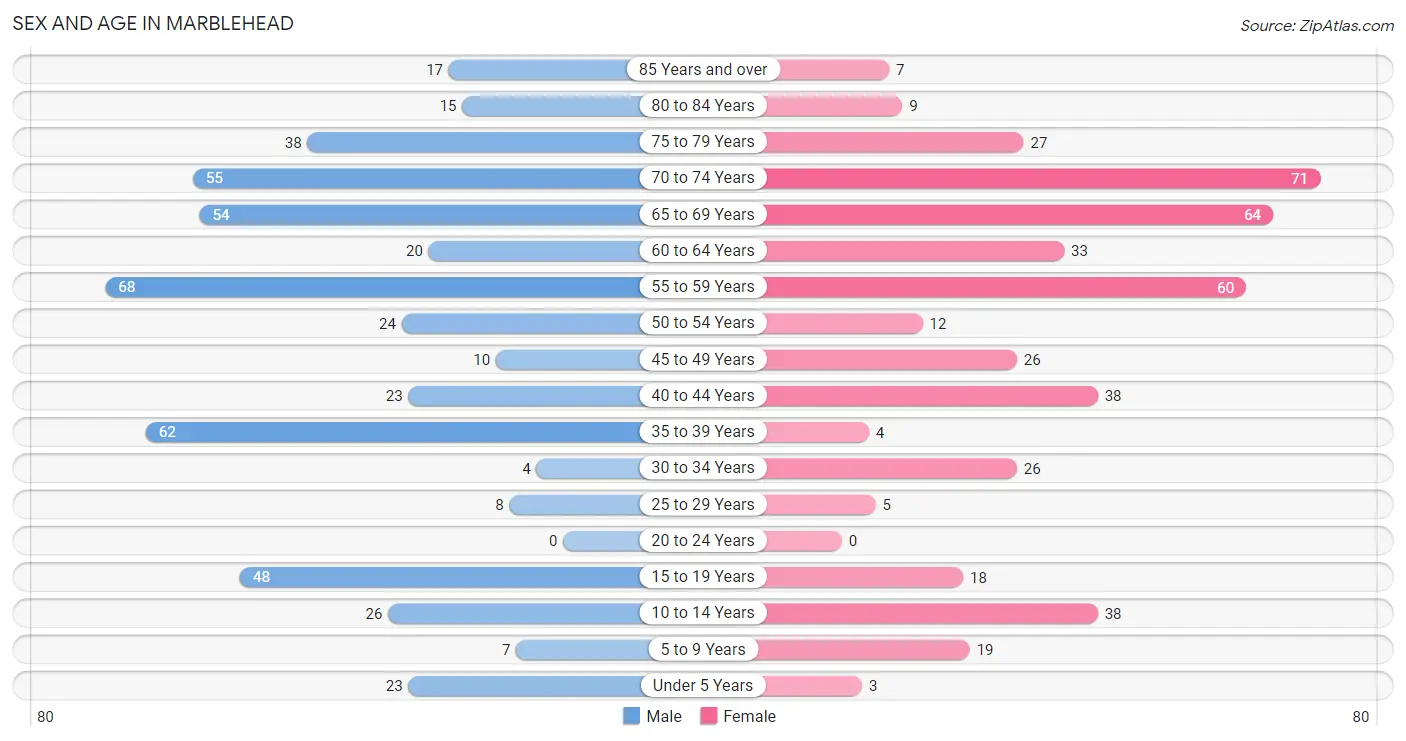
| Age Bracket | Male | Female |
| Under 5 Years | 23 (4.6%) | 3 (0.6%) |
| 5 to 9 Years | 7 (1.4%) | 19 (4.1%) |
| 10 to 14 Years | 26 (5.2%) | 38 (8.3%) |
| 15 to 19 Years | 48 (9.6%) | 18 (3.9%) |
| 20 to 24 Years | 0 (0.0%) | 0 (0.0%) |
| 25 to 29 Years | 8 (1.6%) | 5 (1.1%) |
| 30 to 34 Years | 4 (0.8%) | 26 (5.7%) |
| 35 to 39 Years | 62 (12.3%) | 4 (0.9%) |
| 40 to 44 Years | 23 (4.6%) | 38 (8.3%) |
| 45 to 49 Years | 10 (2.0%) | 26 (5.7%) |
| 50 to 54 Years | 24 (4.8%) | 12 (2.6%) |
| 55 to 59 Years | 68 (13.6%) | 60 (13.0%) |
| 60 to 64 Years | 20 (4.0%) | 33 (7.2%) |
| 65 to 69 Years | 54 (10.8%) | 64 (13.9%) |
| 70 to 74 Years | 55 (11.0%) | 71 (15.4%) |
| 75 to 79 Years | 38 (7.6%) | 27 (5.9%) |
| 80 to 84 Years | 15 (3.0%) | 9 (2.0%) |
| 85 Years and over | 17 (3.4%) | 7 (1.5%) |
| Total | 502 (100.0%) | 460 (100.0%) |
Families and Households in Marblehead
Median Family Size in Marblehead
The median family size in Marblehead is 2.55 persons per family, with single male/father families (26 | 8.7%) accounting for the largest median family size of 2.77 persons per family. On the other hand, married-couple families (232 | 77.8%) represent the smallest median family size with 2.51 persons per family.
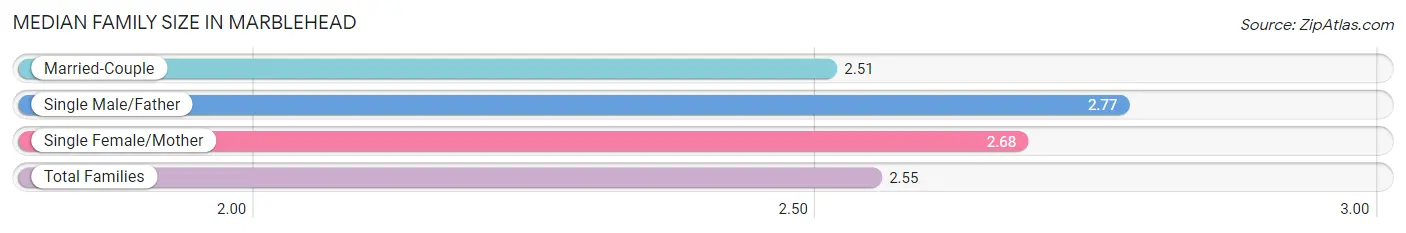
| Family Type | # Families | Family Size |
| Married-Couple | 232 (77.8%) | 2.51 |
| Single Male/Father | 26 (8.7%) | 2.77 |
| Single Female/Mother | 40 (13.4%) | 2.68 |
| Total Families | 298 (100.0%) | 2.55 |
Median Household Size in Marblehead
The median household size in Marblehead is 2.28 persons per household, with single female/mother households (40 | 9.5%) accounting for the largest median household size of 3.93 persons per household. non-family households (123 | 29.2%) represent the smallest median household size with 1.09 persons per household.
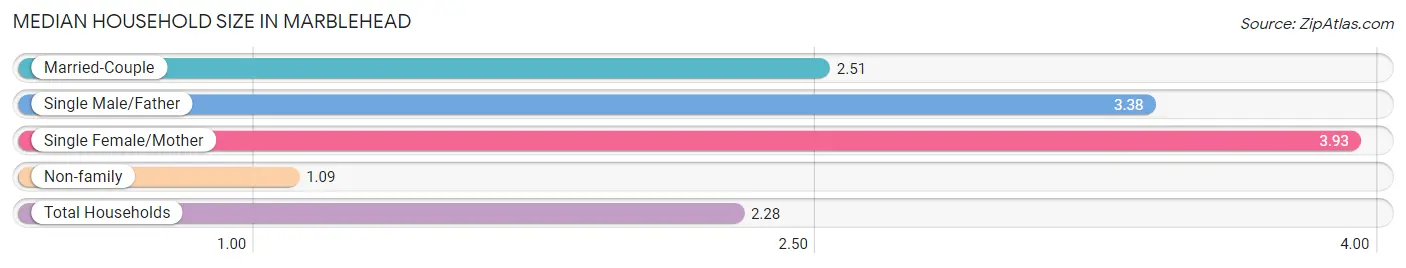
| Household Type | # Households | Household Size |
| Married-Couple | 232 (55.1%) | 2.51 |
| Single Male/Father | 26 (6.2%) | 3.38 |
| Single Female/Mother | 40 (9.5%) | 3.93 |
| Non-family | 123 (29.2%) | 1.09 |
| Total Households | 421 (100.0%) | 2.28 |
Household Size by Marriage Status in Marblehead
Out of a total of 421 households in Marblehead, 298 (70.8%) are family households, while 123 (29.2%) are nonfamily households. The most numerous type of family households are 2-person households, comprising 222, and the most common type of nonfamily households are 1-person households, comprising 112.
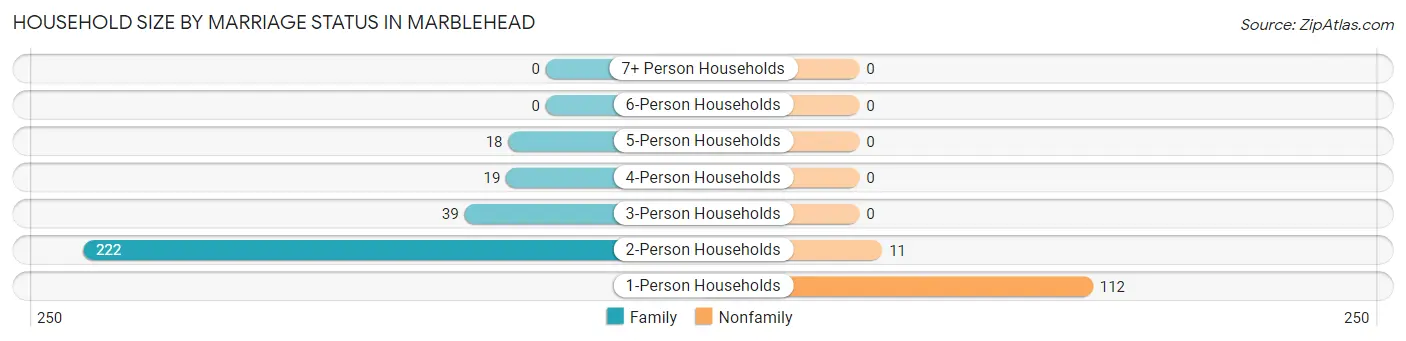
| Household Size | Family Households | Nonfamily Households |
| 1-Person Households | - | 112 (26.6%) |
| 2-Person Households | 222 (52.7%) | 11 (2.6%) |
| 3-Person Households | 39 (9.3%) | 0 (0.0%) |
| 4-Person Households | 19 (4.5%) | 0 (0.0%) |
| 5-Person Households | 18 (4.3%) | 0 (0.0%) |
| 6-Person Households | 0 (0.0%) | 0 (0.0%) |
| 7+ Person Households | 0 (0.0%) | 0 (0.0%) |
| Total | 298 (70.8%) | 123 (29.2%) |
Female Fertility in Marblehead
Fertility by Age in Marblehead
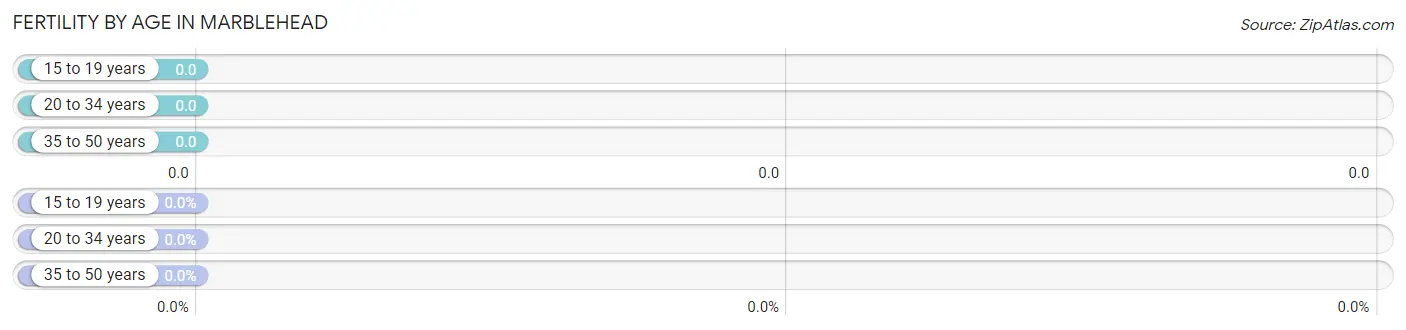
| Age Bracket | Women with Births | Births / 1,000 Women |
| 15 to 19 years | 0 (0.0%) | 0.0 |
| 20 to 34 years | 0 (0.0%) | 0.0 |
| 35 to 50 years | 0 (0.0%) | 0.0 |
| Total | 0 (0.0%) | 0.0 |
Fertility by Age by Marriage Status in Marblehead
| Age Bracket | Married | Unmarried |
| 15 to 19 years | 0 (0.0%) | 0 (0.0%) |
| 20 to 34 years | 0 (0.0%) | 0 (0.0%) |
| 35 to 50 years | 0 (0.0%) | 0 (0.0%) |
| Total | 0 (0.0%) | 0 (0.0%) |
Fertility by Education in Marblehead
| Educational Attainment | Women with Births | Births / 1,000 Women |
| Less than High School | 0 (0.0%) | 0.0 |
| High School Diploma | 0 (0.0%) | 0.0 |
| College or Associate's Degree | 0 (0.0%) | 0.0 |
| Bachelor's Degree | 0 (0.0%) | 0.0 |
| Graduate Degree | 0 (0.0%) | 0.0 |
| Total | 0 (0.0%) | 0.0 |
Fertility by Education by Marriage Status in Marblehead
| Educational Attainment | Married | Unmarried |
| Less than High School | 0 (0.0%) | 0 (0.0%) |
| High School Diploma | 0 (0.0%) | 0 (0.0%) |
| College or Associate's Degree | 0 (0.0%) | 0 (0.0%) |
| Bachelor's Degree | 0 (0.0%) | 0 (0.0%) |
| Graduate Degree | 0 (0.0%) | 0 (0.0%) |
| Total | 0 (0.0%) | 0 (0.0%) |
Employment Characteristics in Marblehead
Employment by Class of Employer in Marblehead
Among the 365 employed individuals in Marblehead, private company employees (185 | 50.7%), local government employees (53 | 14.5%), and self-employed (not incorporated) (38 | 10.4%) make up the most common classes of employment.
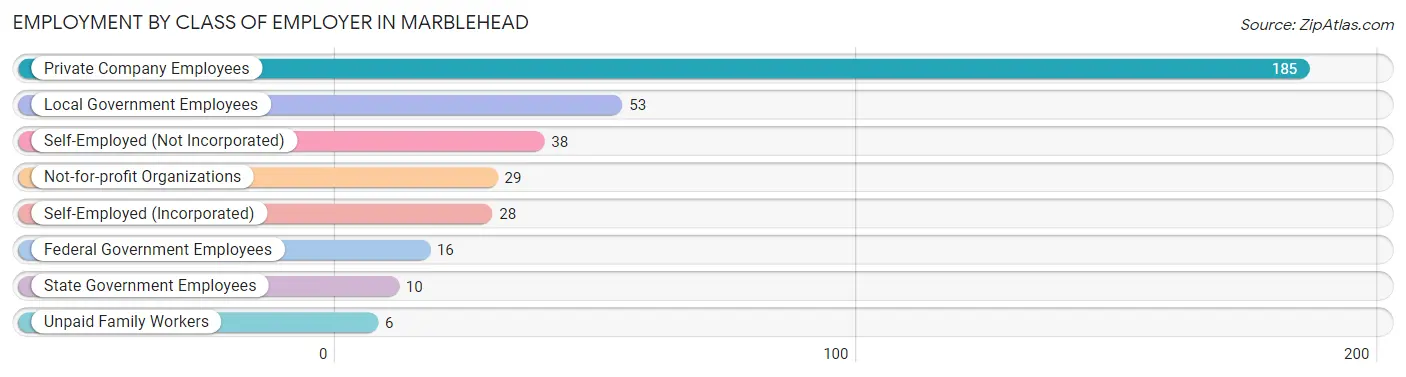
| Employer Class | # Employees | % Employees |
| Private Company Employees | 185 | 50.7% |
| Self-Employed (Incorporated) | 28 | 7.7% |
| Self-Employed (Not Incorporated) | 38 | 10.4% |
| Not-for-profit Organizations | 29 | 8.0% |
| Local Government Employees | 53 | 14.5% |
| State Government Employees | 10 | 2.7% |
| Federal Government Employees | 16 | 4.4% |
| Unpaid Family Workers | 6 | 1.6% |
| Total | 365 | 100.0% |
Employment Status by Age in Marblehead
According to the labor force statistics for Marblehead, out of the total population over 16 years of age (814), 48.3% or 393 individuals are in the labor force, with 0.8% or 3 of them unemployed. The age group with the highest labor force participation rate is 30 to 34 years, with 90.0% or 27 individuals in the labor force. Within the labor force, the 65 to 74 years age range has the highest percentage of unemployed individuals, with 4.3% or 3 of them being unemployed.
| Age Bracket | In Labor Force | Unemployed |
| 16 to 19 Years | 8 (23.5%) | 0 (0.0%) |
| 20 to 24 Years | 0 (0.0%) | 0 (0.0%) |
| 25 to 29 Years | 11 (84.6%) | 0 (0.0%) |
| 30 to 34 Years | 27 (90.0%) | 0 (0.0%) |
| 35 to 44 Years | 80 (63.0%) | 0 (0.0%) |
| 45 to 54 Years | 52 (72.2%) | 0 (0.0%) |
| 55 to 59 Years | 105 (82.0%) | 0 (0.0%) |
| 60 to 64 Years | 35 (66.0%) | 0 (0.0%) |
| 65 to 74 Years | 70 (28.7%) | 3 (4.3%) |
| 75 Years and over | 5 (4.4%) | 0 (0.0%) |
| Total | 393 (48.3%) | 3 (0.8%) |
Employment Status by Educational Attainment in Marblehead
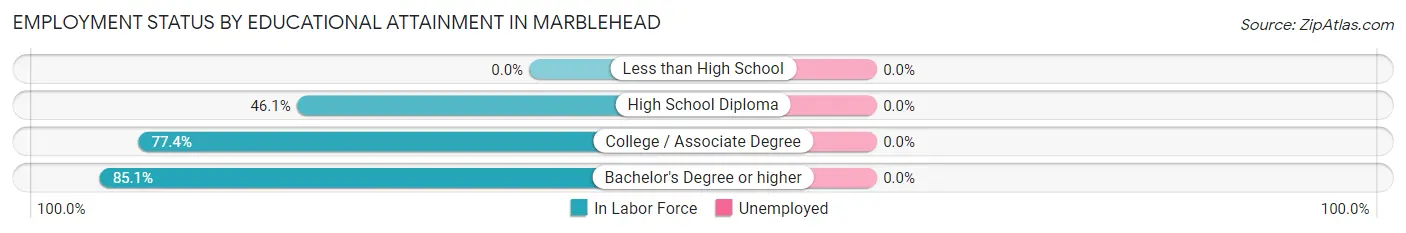
| Educational Attainment | In Labor Force | Unemployed |
| Less than High School | 0 (0.0%) | 0 (0.0%) |
| High School Diploma | 47 (46.1%) | 0 (0.0%) |
| College / Associate Degree | 103 (77.4%) | 0 (0.0%) |
| Bachelor's Degree or higher | 160 (85.1%) | 0 (0.0%) |
| Total | 310 (73.3%) | 0 (0.0%) |
Employment Occupations by Sex in Marblehead
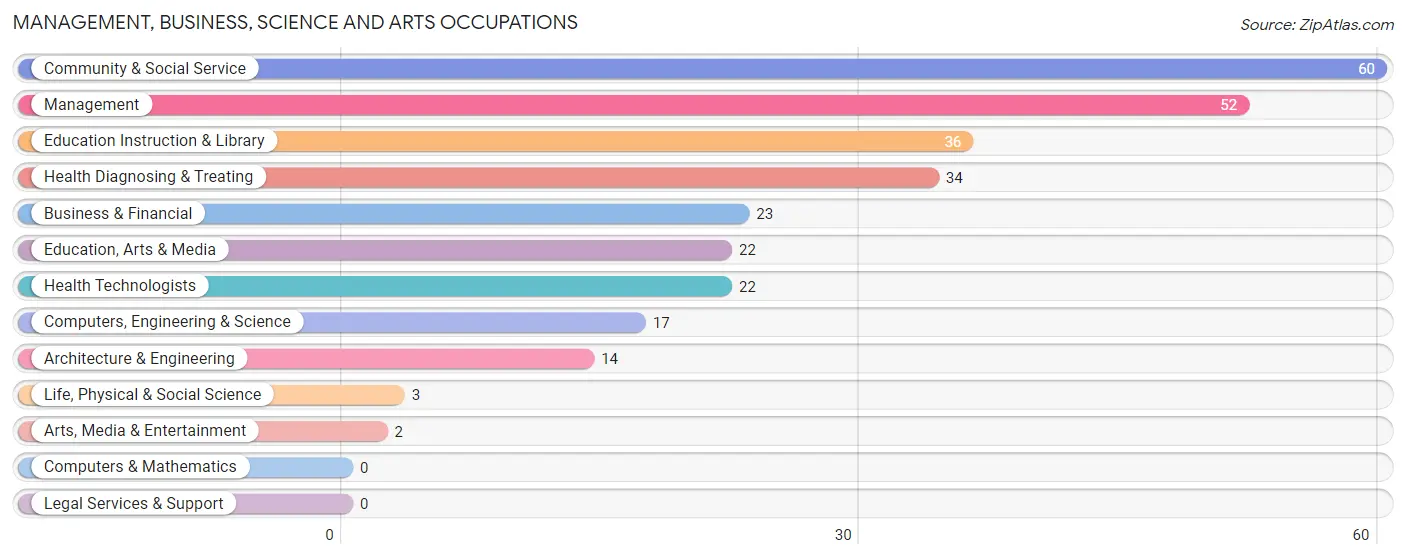
Management, Business, Science and Arts Occupations
The most common Management, Business, Science and Arts occupations in Marblehead are Community & Social Service (60 | 15.4%), Management (52 | 13.4%), Education Instruction & Library (36 | 9.2%), Health Diagnosing & Treating (34 | 8.7%), and Business & Financial (23 | 5.9%).
Management, Business, Science and Arts Occupations by Sex
Within the Management, Business, Science and Arts occupations in Marblehead, the most male-oriented occupations are Management (73.1%), Architecture & Engineering (64.3%), and Business & Financial (56.5%), while the most female-oriented occupations are Life, Physical & Social Science (100.0%), Arts, Media & Entertainment (100.0%), and Health Technologists (90.9%).
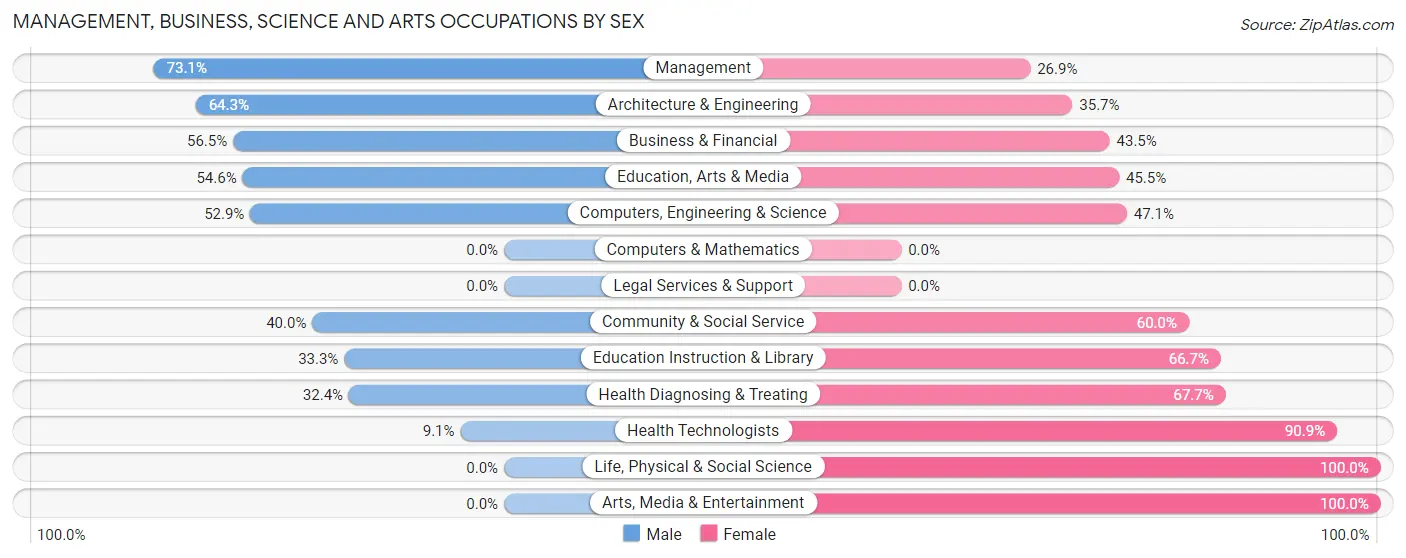
| Occupation | Male | Female |
| Management | 38 (73.1%) | 14 (26.9%) |
| Business & Financial | 13 (56.5%) | 10 (43.5%) |
| Computers, Engineering & Science | 9 (52.9%) | 8 (47.1%) |
| Computers & Mathematics | 0 (0.0%) | 0 (0.0%) |
| Architecture & Engineering | 9 (64.3%) | 5 (35.7%) |
| Life, Physical & Social Science | 0 (0.0%) | 3 (100.0%) |
| Community & Social Service | 24 (40.0%) | 36 (60.0%) |
| Education, Arts & Media | 12 (54.5%) | 10 (45.5%) |
| Legal Services & Support | 0 (0.0%) | 0 (0.0%) |
| Education Instruction & Library | 12 (33.3%) | 24 (66.7%) |
| Arts, Media & Entertainment | 0 (0.0%) | 2 (100.0%) |
| Health Diagnosing & Treating | 11 (32.4%) | 23 (67.6%) |
| Health Technologists | 2 (9.1%) | 20 (90.9%) |
| Total (Category) | 95 (51.1%) | 91 (48.9%) |
| Total (Overall) | 195 (50.1%) | 194 (49.9%) |
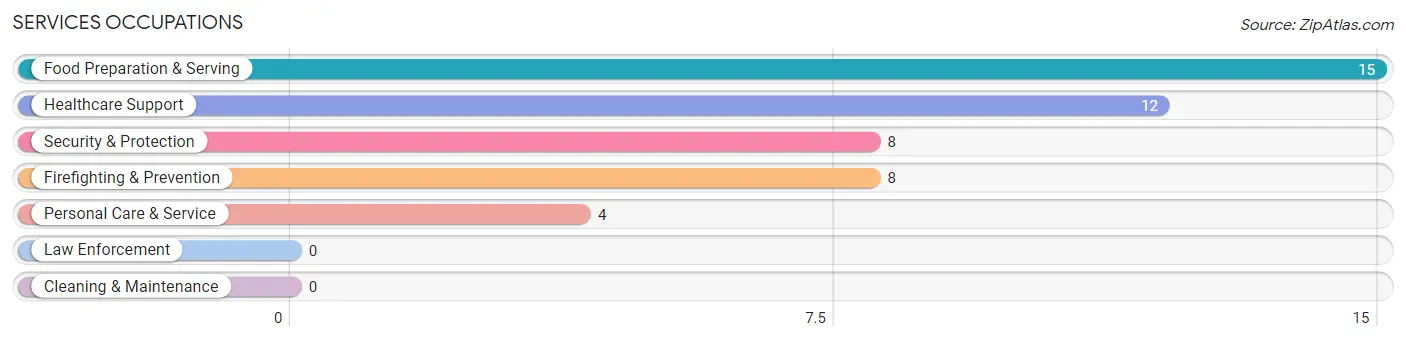
Services Occupations
The most common Services occupations in Marblehead are Food Preparation & Serving (15 | 3.9%), Healthcare Support (12 | 3.1%), Security & Protection (8 | 2.1%), Firefighting & Prevention (8 | 2.1%), and Personal Care & Service (4 | 1.0%).
Services Occupations by Sex
Within the Services occupations in Marblehead, the most male-oriented occupations are Security & Protection (100.0%), Firefighting & Prevention (100.0%), and Food Preparation & Serving (13.3%), while the most female-oriented occupations are Healthcare Support (100.0%), Personal Care & Service (100.0%), and Food Preparation & Serving (86.7%).
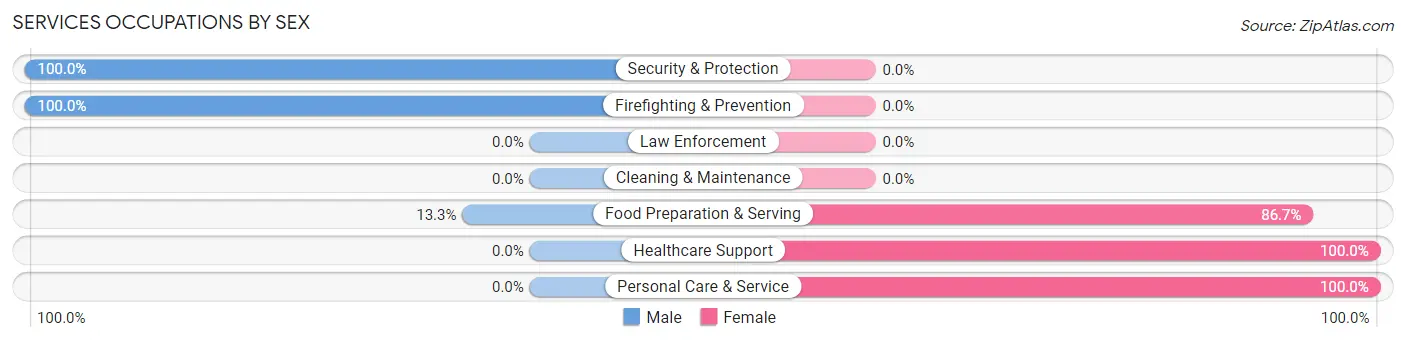
| Occupation | Male | Female |
| Healthcare Support | 0 (0.0%) | 12 (100.0%) |
| Security & Protection | 8 (100.0%) | 0 (0.0%) |
| Firefighting & Prevention | 8 (100.0%) | 0 (0.0%) |
| Law Enforcement | 0 (0.0%) | 0 (0.0%) |
| Food Preparation & Serving | 2 (13.3%) | 13 (86.7%) |
| Cleaning & Maintenance | 0 (0.0%) | 0 (0.0%) |
| Personal Care & Service | 0 (0.0%) | 4 (100.0%) |
| Total (Category) | 10 (25.6%) | 29 (74.4%) |
| Total (Overall) | 195 (50.1%) | 194 (49.9%) |
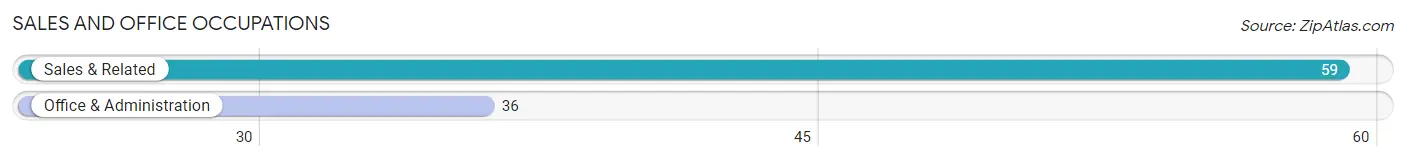
Sales and Office Occupations
The most common Sales and Office occupations in Marblehead are Sales & Related (59 | 15.2%), and Office & Administration (36 | 9.2%).
Sales and Office Occupations by Sex
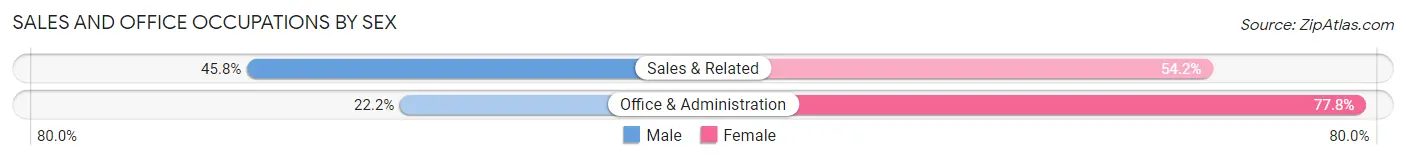
| Occupation | Male | Female |
| Sales & Related | 27 (45.8%) | 32 (54.2%) |
| Office & Administration | 8 (22.2%) | 28 (77.8%) |
| Total (Category) | 35 (36.8%) | 60 (63.2%) |
| Total (Overall) | 195 (50.1%) | 194 (49.9%) |
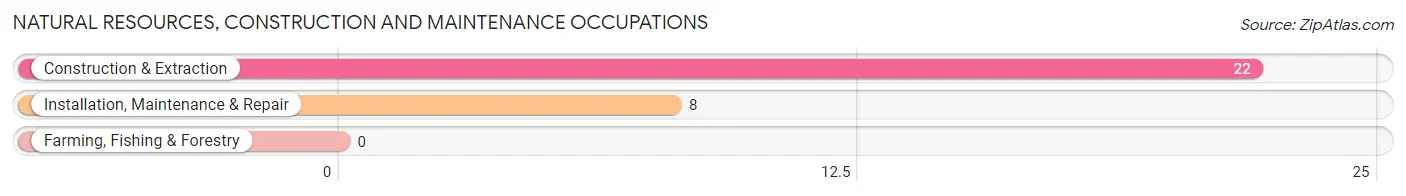
Natural Resources, Construction and Maintenance Occupations
The most common Natural Resources, Construction and Maintenance occupations in Marblehead are Construction & Extraction (22 | 5.7%), and Installation, Maintenance & Repair (8 | 2.1%).
Natural Resources, Construction and Maintenance Occupations by Sex
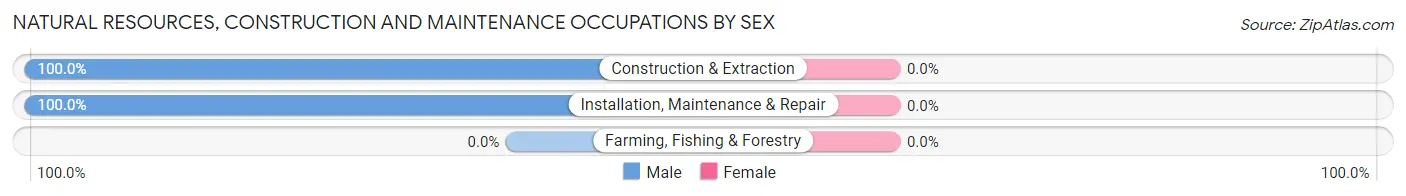
| Occupation | Male | Female |
| Farming, Fishing & Forestry | 0 (0.0%) | 0 (0.0%) |
| Construction & Extraction | 22 (100.0%) | 0 (0.0%) |
| Installation, Maintenance & Repair | 8 (100.0%) | 0 (0.0%) |
| Total (Category) | 30 (100.0%) | 0 (0.0%) |
| Total (Overall) | 195 (50.1%) | 194 (49.9%) |
Production, Transportation and Moving Occupations
The most common Production, Transportation and Moving occupations in Marblehead are Production (22 | 5.7%), and Transportation (17 | 4.4%).
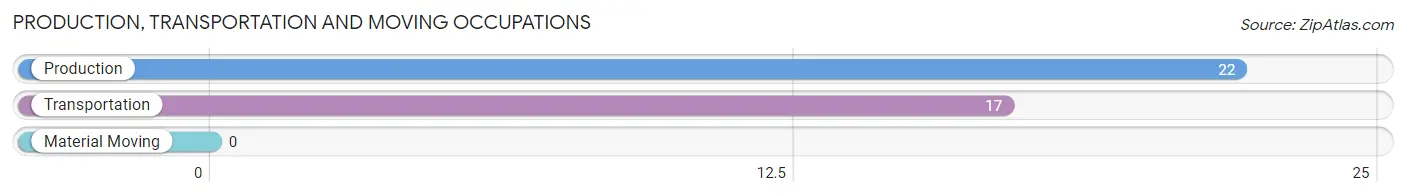
Production, Transportation and Moving Occupations by Sex
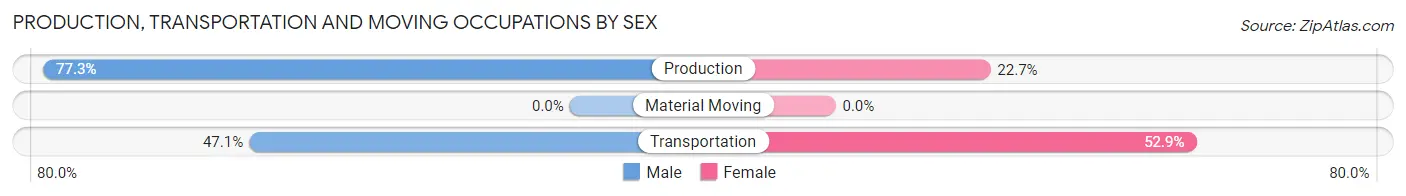
| Occupation | Male | Female |
| Production | 17 (77.3%) | 5 (22.7%) |
| Transportation | 8 (47.1%) | 9 (52.9%) |
| Material Moving | 0 (0.0%) | 0 (0.0%) |
| Total (Category) | 25 (64.1%) | 14 (35.9%) |
| Total (Overall) | 195 (50.1%) | 194 (49.9%) |
Employment Industries by Sex in Marblehead
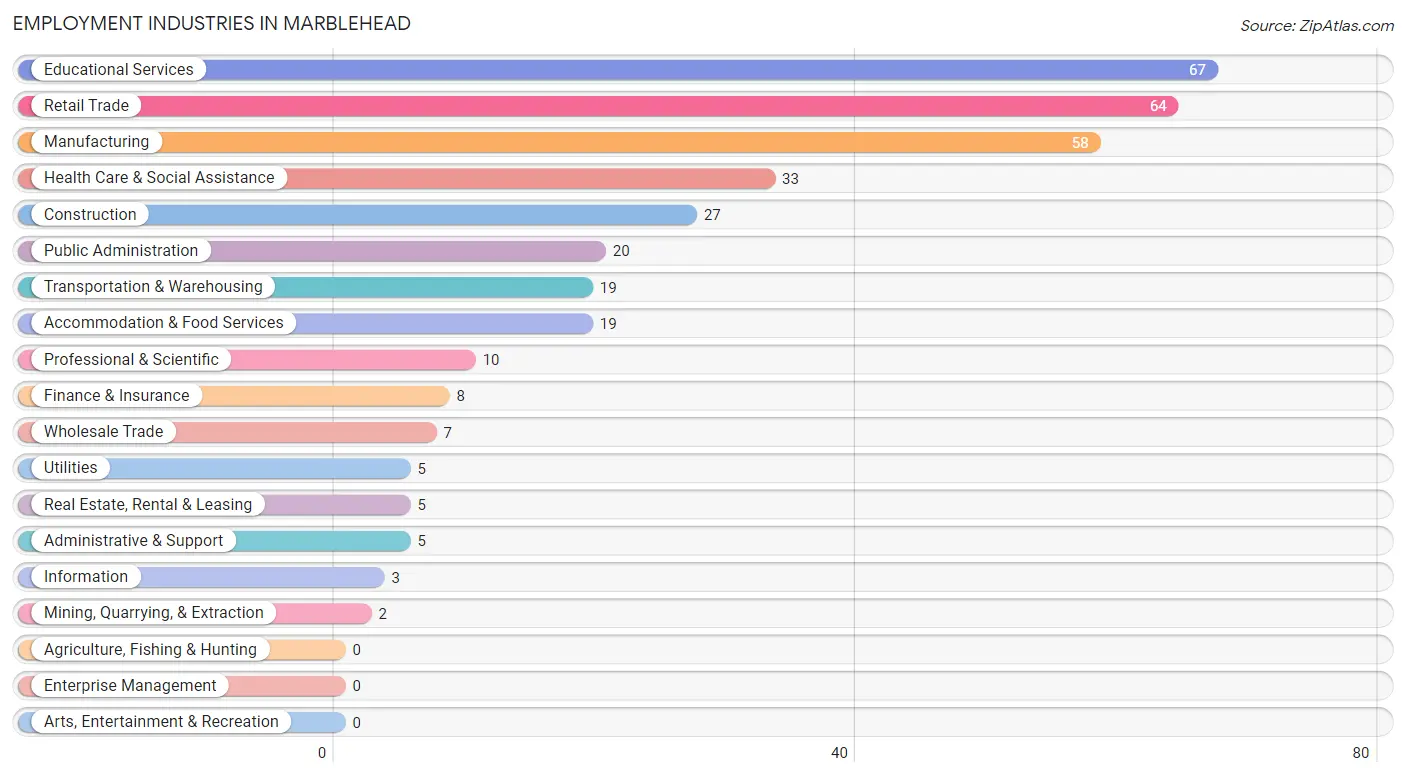
Employment Industries in Marblehead
The major employment industries in Marblehead include Educational Services (67 | 17.2%), Retail Trade (64 | 16.5%), Manufacturing (58 | 14.9%), Health Care & Social Assistance (33 | 8.5%), and Construction (27 | 6.9%).
Employment Industries by Sex in Marblehead
The Marblehead industries that see more men than women are Mining, Quarrying, & Extraction (100.0%), Construction (100.0%), and Utilities (100.0%), whereas the industries that tend to have a higher number of women are Information (100.0%), Real Estate, Rental & Leasing (100.0%), and Health Care & Social Assistance (75.8%).
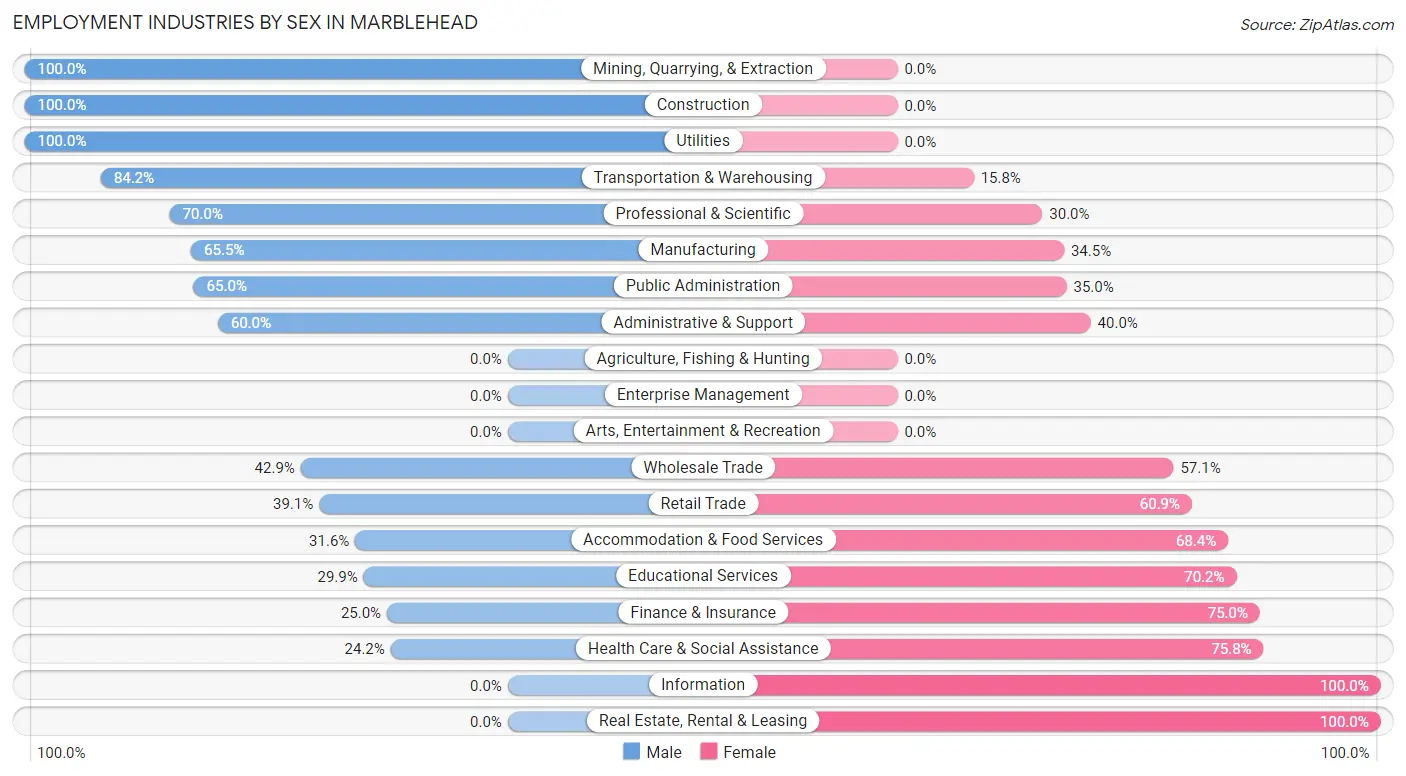
| Industry | Male | Female |
| Agriculture, Fishing & Hunting | 0 (0.0%) | 0 (0.0%) |
| Mining, Quarrying, & Extraction | 2 (100.0%) | 0 (0.0%) |
| Construction | 27 (100.0%) | 0 (0.0%) |
| Manufacturing | 38 (65.5%) | 20 (34.5%) |
| Wholesale Trade | 3 (42.9%) | 4 (57.1%) |
| Retail Trade | 25 (39.1%) | 39 (60.9%) |
| Transportation & Warehousing | 16 (84.2%) | 3 (15.8%) |
| Utilities | 5 (100.0%) | 0 (0.0%) |
| Information | 0 (0.0%) | 3 (100.0%) |
| Finance & Insurance | 2 (25.0%) | 6 (75.0%) |
| Real Estate, Rental & Leasing | 0 (0.0%) | 5 (100.0%) |
| Professional & Scientific | 7 (70.0%) | 3 (30.0%) |
| Enterprise Management | 0 (0.0%) | 0 (0.0%) |
| Administrative & Support | 3 (60.0%) | 2 (40.0%) |
| Educational Services | 20 (29.8%) | 47 (70.2%) |
| Health Care & Social Assistance | 8 (24.2%) | 25 (75.8%) |
| Arts, Entertainment & Recreation | 0 (0.0%) | 0 (0.0%) |
| Accommodation & Food Services | 6 (31.6%) | 13 (68.4%) |
| Public Administration | 13 (65.0%) | 7 (35.0%) |
| Total | 195 (50.1%) | 194 (49.9%) |
Education in Marblehead
School Enrollment in Marblehead
The most common levels of schooling among the 175 students in Marblehead are high school (78 | 44.6%), middle school (47 | 26.9%), and elementary school (31 | 17.7%).
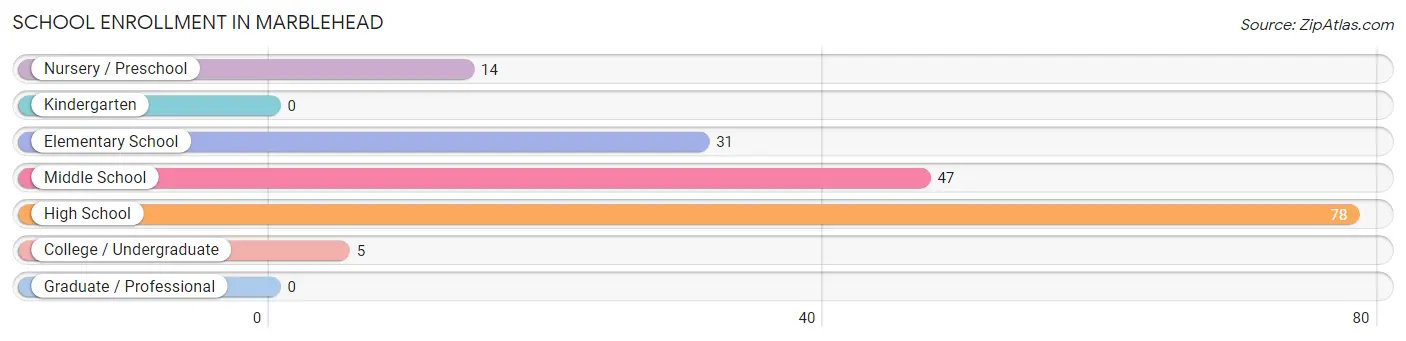
| School Level | # Students | % Students |
| Nursery / Preschool | 14 | 8.0% |
| Kindergarten | 0 | 0.0% |
| Elementary School | 31 | 17.7% |
| Middle School | 47 | 26.9% |
| High School | 78 | 44.6% |
| College / Undergraduate | 5 | 2.9% |
| Graduate / Professional | 0 | 0.0% |
| Total | 175 | 100.0% |
School Enrollment by Age by Funding Source in Marblehead
Out of a total of 175 students who are enrolled in schools in Marblehead, 18 (10.3%) attend a private institution, while the remaining 157 (89.7%) are enrolled in public schools. The age group of 10 to 14 year olds has the highest likelihood of being enrolled in private schools, with 18 (28.1% in the age bracket) enrolled. Conversely, the age group of 3 to 4 year olds has the lowest likelihood of being enrolled in a private school, with 14 (100.0% in the age bracket) attending a public institution.
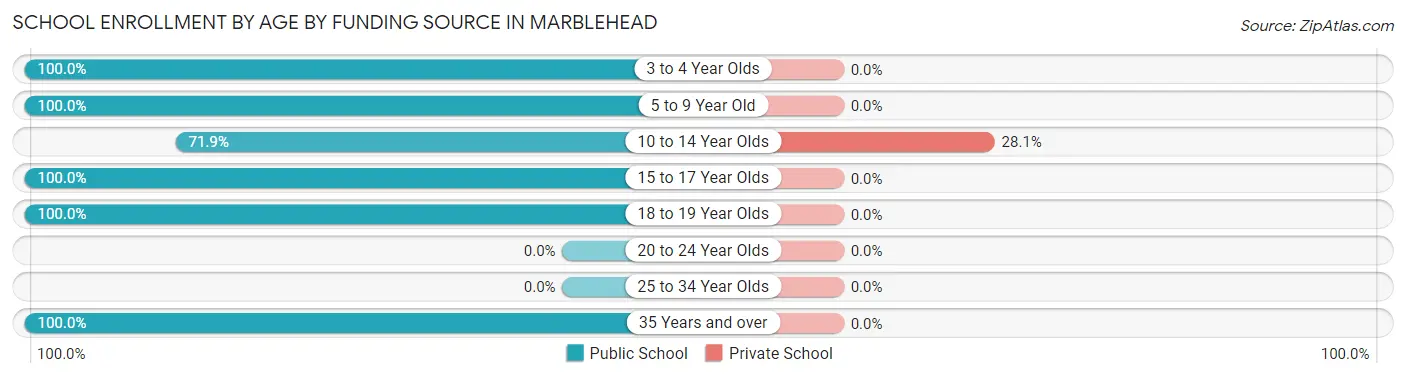
| Age Bracket | Public School | Private School |
| 3 to 4 Year Olds | 14 (100.0%) | 0 (0.0%) |
| 5 to 9 Year Old | 26 (100.0%) | 0 (0.0%) |
| 10 to 14 Year Olds | 46 (71.9%) | 18 (28.1%) |
| 15 to 17 Year Olds | 43 (100.0%) | 0 (0.0%) |
| 18 to 19 Year Olds | 23 (100.0%) | 0 (0.0%) |
| 20 to 24 Year Olds | 0 (0.0%) | 0 (0.0%) |
| 25 to 34 Year Olds | 0 (0.0%) | 0 (0.0%) |
| 35 Years and over | 5 (100.0%) | 0 (0.0%) |
| Total | 157 (89.7%) | 18 (10.3%) |
Educational Attainment by Field of Study in Marblehead
Business (87 | 26.2%), education (79 | 23.8%), engineering (40 | 12.0%), science & technology (32 | 9.6%), and bio, nature & agricultural (15 | 4.5%) are the most common fields of study among 332 individuals in Marblehead who have obtained a bachelor's degree or higher.
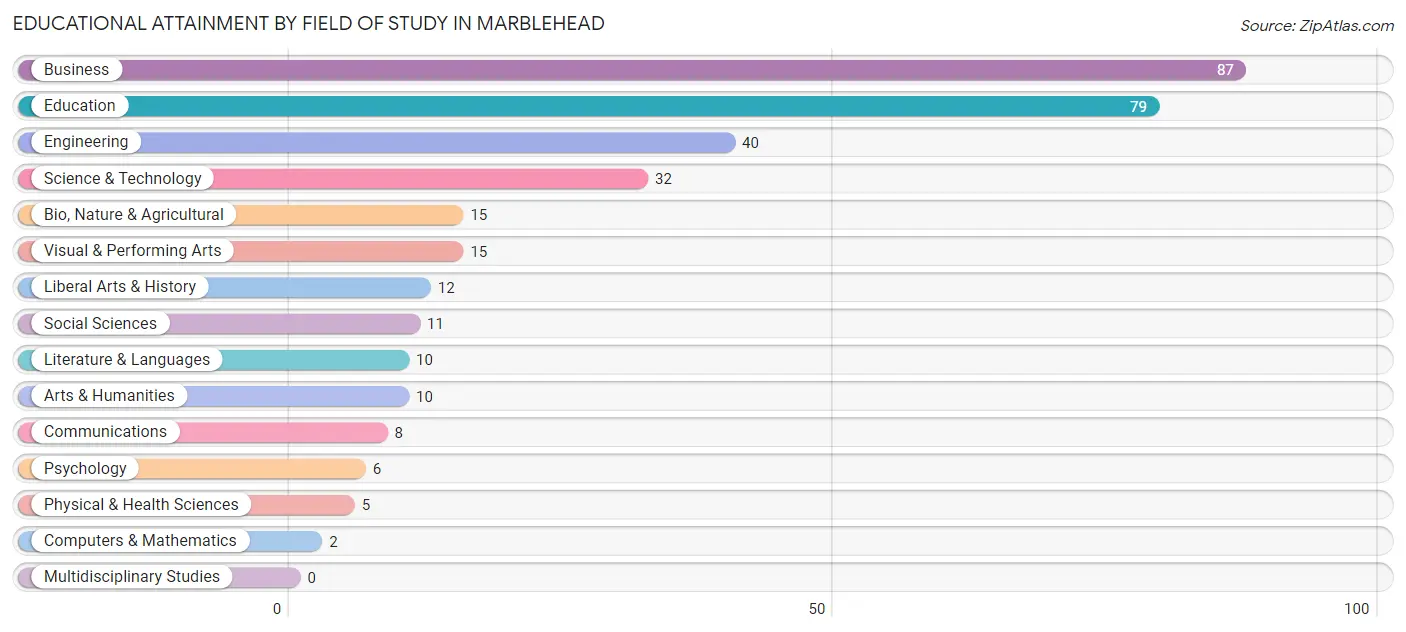
| Field of Study | # Graduates | % Graduates |
| Computers & Mathematics | 2 | 0.6% |
| Bio, Nature & Agricultural | 15 | 4.5% |
| Physical & Health Sciences | 5 | 1.5% |
| Psychology | 6 | 1.8% |
| Social Sciences | 11 | 3.3% |
| Engineering | 40 | 12.0% |
| Multidisciplinary Studies | 0 | 0.0% |
| Science & Technology | 32 | 9.6% |
| Business | 87 | 26.2% |
| Education | 79 | 23.8% |
| Literature & Languages | 10 | 3.0% |
| Liberal Arts & History | 12 | 3.6% |
| Visual & Performing Arts | 15 | 4.5% |
| Communications | 8 | 2.4% |
| Arts & Humanities | 10 | 3.0% |
| Total | 332 | 100.0% |
Transportation & Commute in Marblehead
Vehicle Availability by Sex in Marblehead
The most prevalent vehicle ownership categories in Marblehead are males with 2 vehicles (92, accounting for 50.3%) and females with 2 vehicles (107, making up 50.8%).
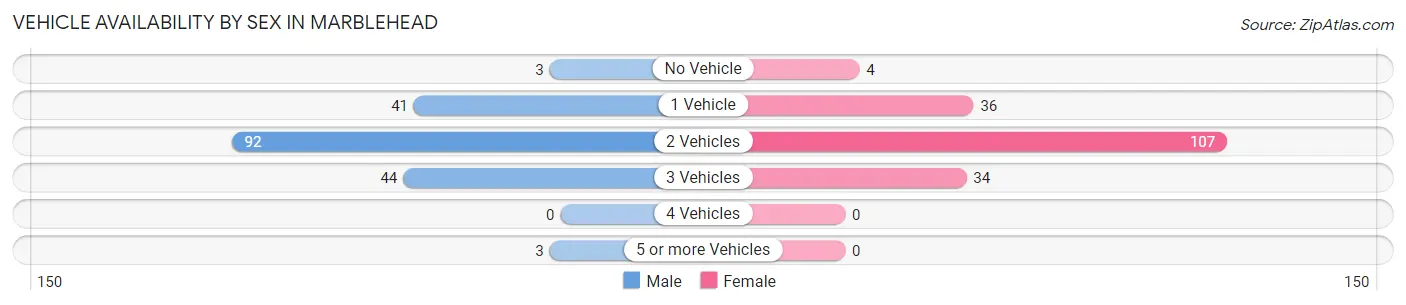
| Vehicles Available | Male | Female |
| No Vehicle | 3 (1.6%) | 4 (2.2%) |
| 1 Vehicle | 41 (22.4%) | 36 (19.9%) |
| 2 Vehicles | 92 (50.3%) | 107 (59.1%) |
| 3 Vehicles | 44 (24.0%) | 34 (18.8%) |
| 4 Vehicles | 0 (0.0%) | 0 (0.0%) |
| 5 or more Vehicles | 3 (1.6%) | 0 (0.0%) |
| Total | 183 (100.0%) | 181 (100.0%) |
Commute Time in Marblehead
The most frequently occuring commute durations in Marblehead are less than 5 minutes (44 commuters, 13.2%), 15 to 19 minutes (42 commuters, 12.6%), and 60 to 89 minutes (42 commuters, 12.6%).
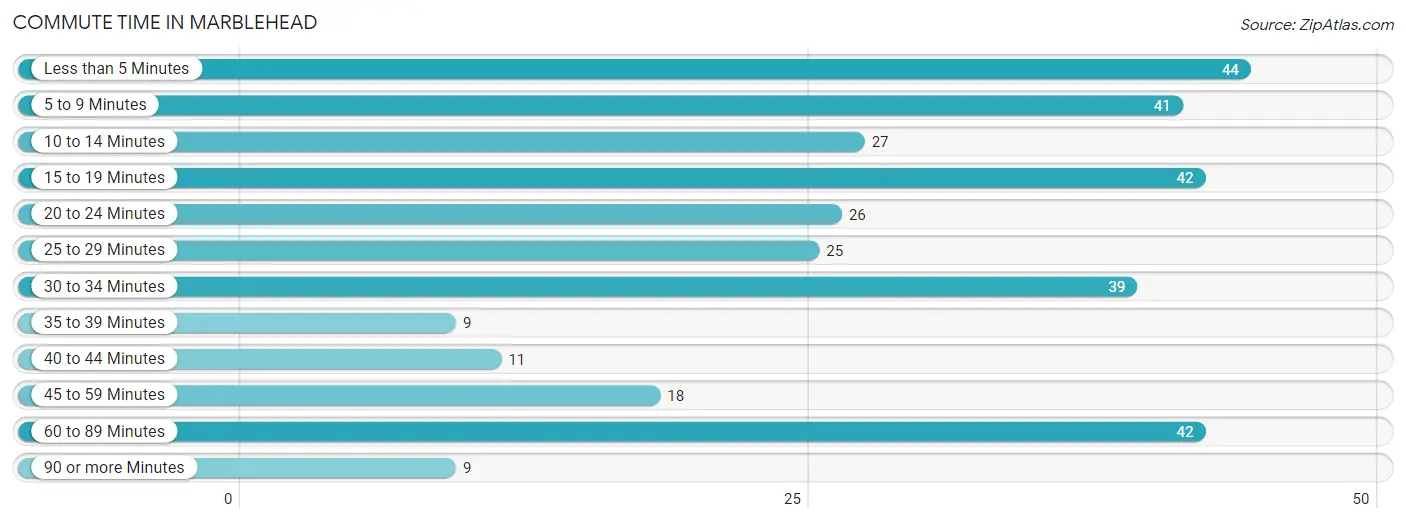
| Commute Time | # Commuters | % Commuters |
| Less than 5 Minutes | 44 | 13.2% |
| 5 to 9 Minutes | 41 | 12.3% |
| 10 to 14 Minutes | 27 | 8.1% |
| 15 to 19 Minutes | 42 | 12.6% |
| 20 to 24 Minutes | 26 | 7.8% |
| 25 to 29 Minutes | 25 | 7.5% |
| 30 to 34 Minutes | 39 | 11.7% |
| 35 to 39 Minutes | 9 | 2.7% |
| 40 to 44 Minutes | 11 | 3.3% |
| 45 to 59 Minutes | 18 | 5.4% |
| 60 to 89 Minutes | 42 | 12.6% |
| 90 or more Minutes | 9 | 2.7% |
Commute Time by Sex in Marblehead
The most common commute times in Marblehead are 15 to 19 minutes (31 commuters, 18.1%) for males and less than 5 minutes (22 commuters, 13.6%) for females.
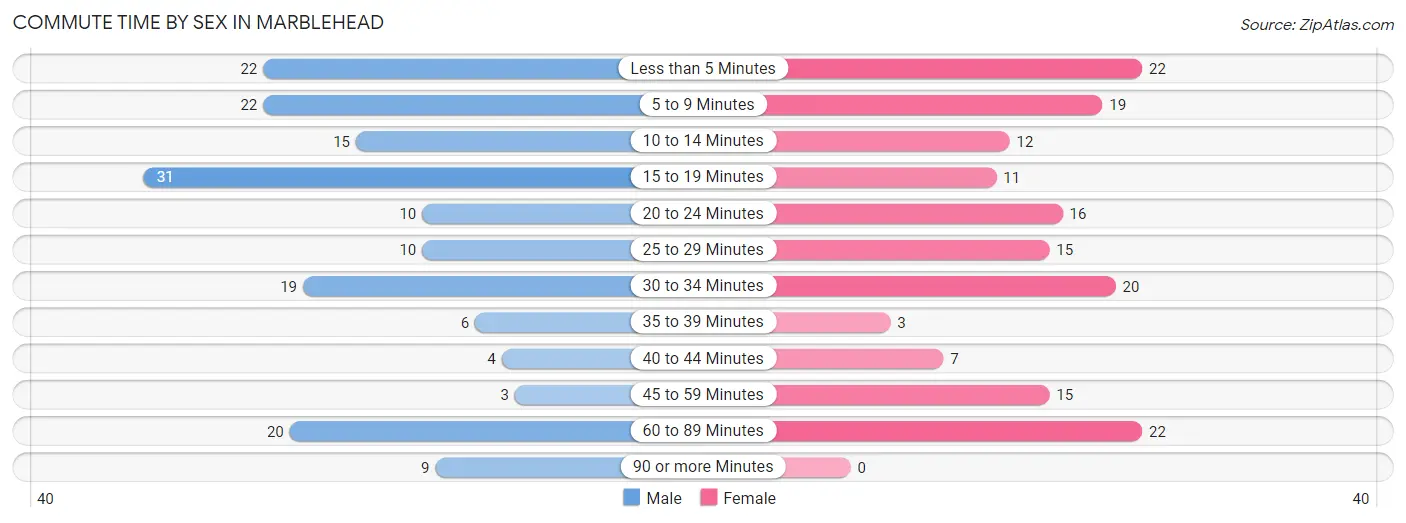
| Commute Time | Male | Female |
| Less than 5 Minutes | 22 (12.9%) | 22 (13.6%) |
| 5 to 9 Minutes | 22 (12.9%) | 19 (11.7%) |
| 10 to 14 Minutes | 15 (8.8%) | 12 (7.4%) |
| 15 to 19 Minutes | 31 (18.1%) | 11 (6.8%) |
| 20 to 24 Minutes | 10 (5.9%) | 16 (9.9%) |
| 25 to 29 Minutes | 10 (5.9%) | 15 (9.3%) |
| 30 to 34 Minutes | 19 (11.1%) | 20 (12.3%) |
| 35 to 39 Minutes | 6 (3.5%) | 3 (1.8%) |
| 40 to 44 Minutes | 4 (2.3%) | 7 (4.3%) |
| 45 to 59 Minutes | 3 (1.8%) | 15 (9.3%) |
| 60 to 89 Minutes | 20 (11.7%) | 22 (13.6%) |
| 90 or more Minutes | 9 (5.3%) | 0 (0.0%) |
Time of Departure to Work by Sex in Marblehead
The most frequent times of departure to work in Marblehead are 7:00 AM to 7:29 AM (33, 19.3%) for males and 7:00 AM to 7:29 AM (46, 28.4%) for females.
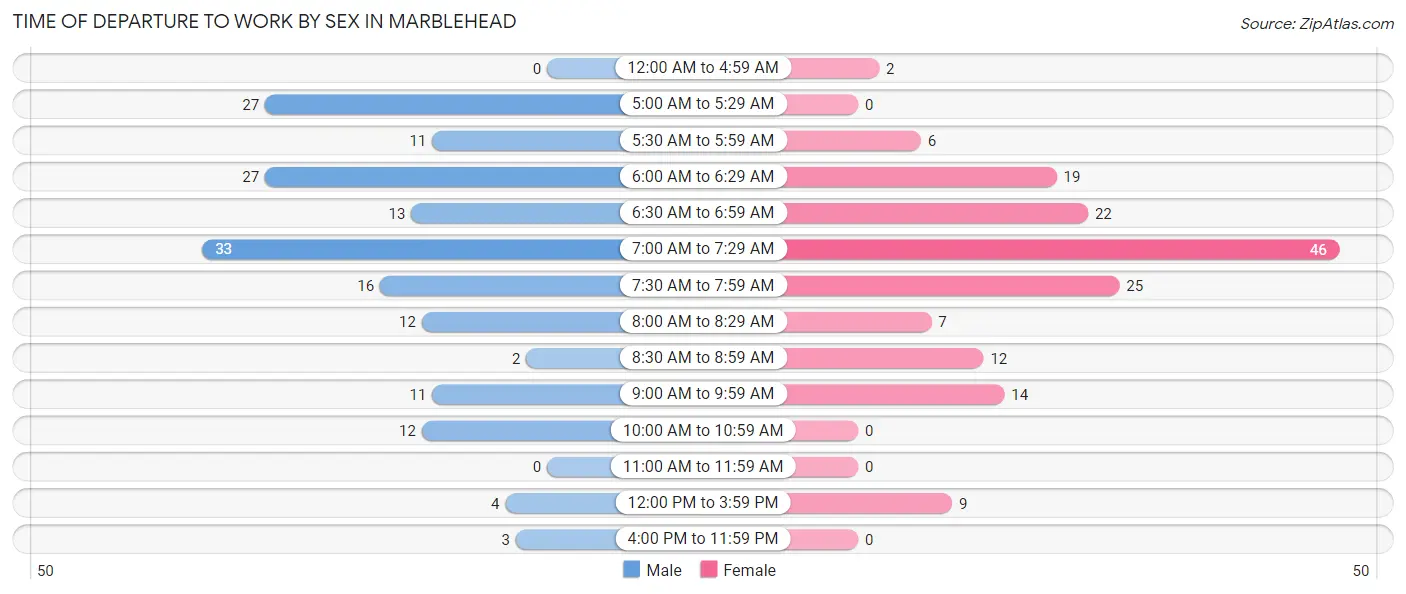
| Time of Departure | Male | Female |
| 12:00 AM to 4:59 AM | 0 (0.0%) | 2 (1.2%) |
| 5:00 AM to 5:29 AM | 27 (15.8%) | 0 (0.0%) |
| 5:30 AM to 5:59 AM | 11 (6.4%) | 6 (3.7%) |
| 6:00 AM to 6:29 AM | 27 (15.8%) | 19 (11.7%) |
| 6:30 AM to 6:59 AM | 13 (7.6%) | 22 (13.6%) |
| 7:00 AM to 7:29 AM | 33 (19.3%) | 46 (28.4%) |
| 7:30 AM to 7:59 AM | 16 (9.4%) | 25 (15.4%) |
| 8:00 AM to 8:29 AM | 12 (7.0%) | 7 (4.3%) |
| 8:30 AM to 8:59 AM | 2 (1.2%) | 12 (7.4%) |
| 9:00 AM to 9:59 AM | 11 (6.4%) | 14 (8.6%) |
| 10:00 AM to 10:59 AM | 12 (7.0%) | 0 (0.0%) |
| 11:00 AM to 11:59 AM | 0 (0.0%) | 0 (0.0%) |
| 12:00 PM to 3:59 PM | 4 (2.3%) | 9 (5.6%) |
| 4:00 PM to 11:59 PM | 3 (1.8%) | 0 (0.0%) |
| Total | 171 (100.0%) | 162 (100.0%) |
Housing Occupancy in Marblehead
Occupancy by Ownership in Marblehead
Of the total 421 dwellings in Marblehead, owner-occupied units account for 364 (86.5%), while renter-occupied units make up 57 (13.5%).
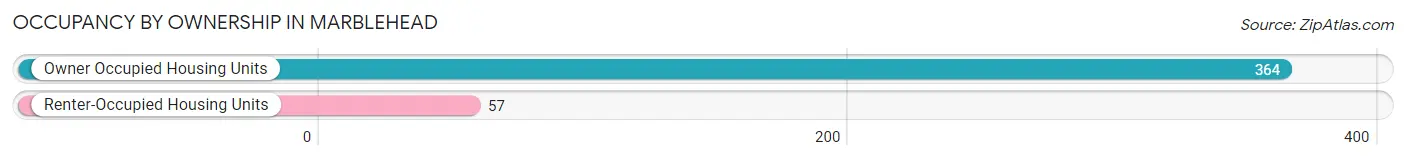
| Occupancy | # Housing Units | % Housing Units |
| Owner Occupied Housing Units | 364 | 86.5% |
| Renter-Occupied Housing Units | 57 | 13.5% |
| Total Occupied Housing Units | 421 | 100.0% |
Occupancy by Household Size in Marblehead
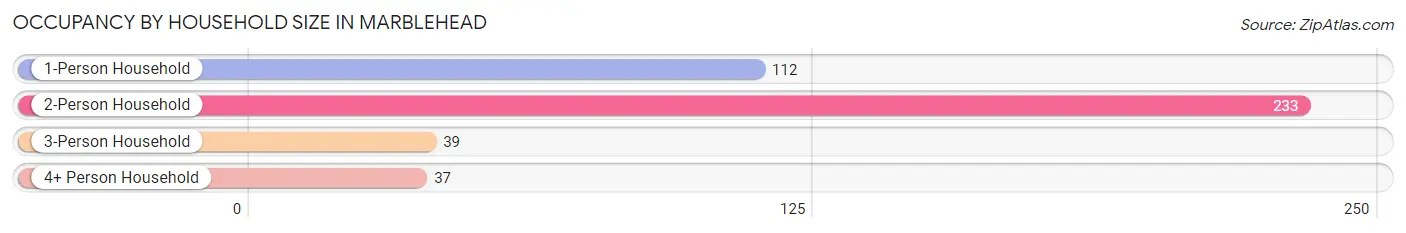
| Household Size | # Housing Units | % Housing Units |
| 1-Person Household | 112 | 26.6% |
| 2-Person Household | 233 | 55.3% |
| 3-Person Household | 39 | 9.3% |
| 4+ Person Household | 37 | 8.8% |
| Total Housing Units | 421 | 100.0% |
Occupancy by Ownership by Household Size in Marblehead
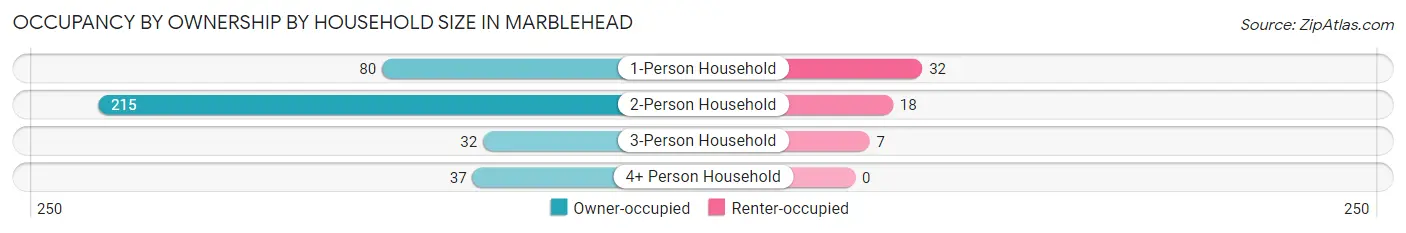
| Household Size | Owner-occupied | Renter-occupied |
| 1-Person Household | 80 (71.4%) | 32 (28.6%) |
| 2-Person Household | 215 (92.3%) | 18 (7.7%) |
| 3-Person Household | 32 (82.1%) | 7 (17.9%) |
| 4+ Person Household | 37 (100.0%) | 0 (0.0%) |
| Total Housing Units | 364 (86.5%) | 57 (13.5%) |
Occupancy by Educational Attainment in Marblehead
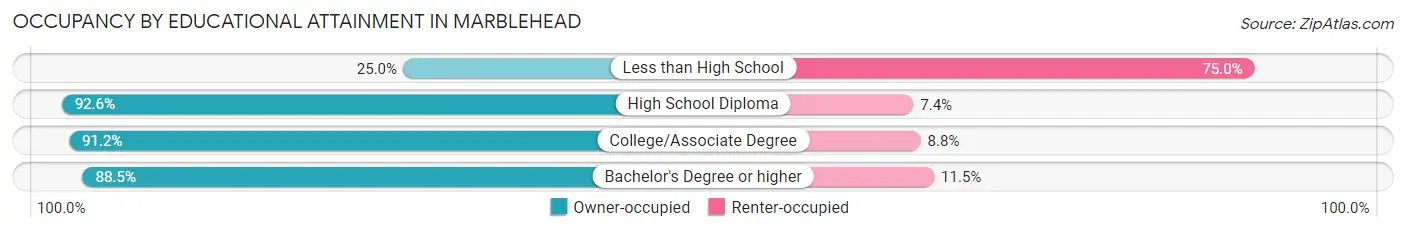
| Household Size | Owner-occupied | Renter-occupied |
| Less than High School | 6 (25.0%) | 18 (75.0%) |
| High School Diploma | 88 (92.6%) | 7 (7.4%) |
| College/Associate Degree | 93 (91.2%) | 9 (8.8%) |
| Bachelor's Degree or higher | 177 (88.5%) | 23 (11.5%) |
Occupancy by Age of Householder in Marblehead
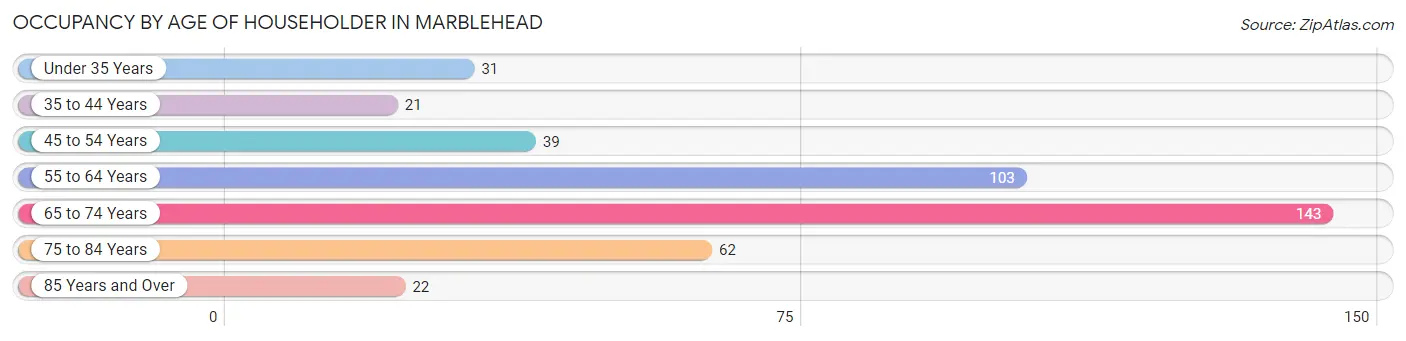
| Age Bracket | # Households | % Households |
| Under 35 Years | 31 | 7.4% |
| 35 to 44 Years | 21 | 5.0% |
| 45 to 54 Years | 39 | 9.3% |
| 55 to 64 Years | 103 | 24.5% |
| 65 to 74 Years | 143 | 34.0% |
| 75 to 84 Years | 62 | 14.7% |
| 85 Years and Over | 22 | 5.2% |
| Total | 421 | 100.0% |
Housing Finances in Marblehead
Median Income by Occupancy in Marblehead
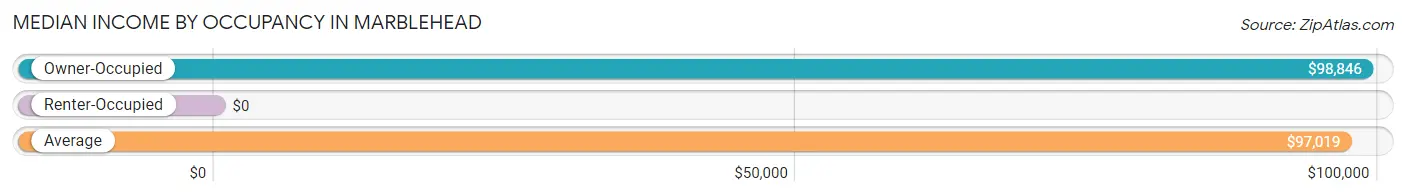
| Occupancy Type | # Households | Median Income |
| Owner-Occupied | 364 (86.5%) | $98,846 |
| Renter-Occupied | 57 (13.5%) | $0 |
| Average | 421 (100.0%) | $97,019 |
Occupancy by Householder Income Bracket in Marblehead
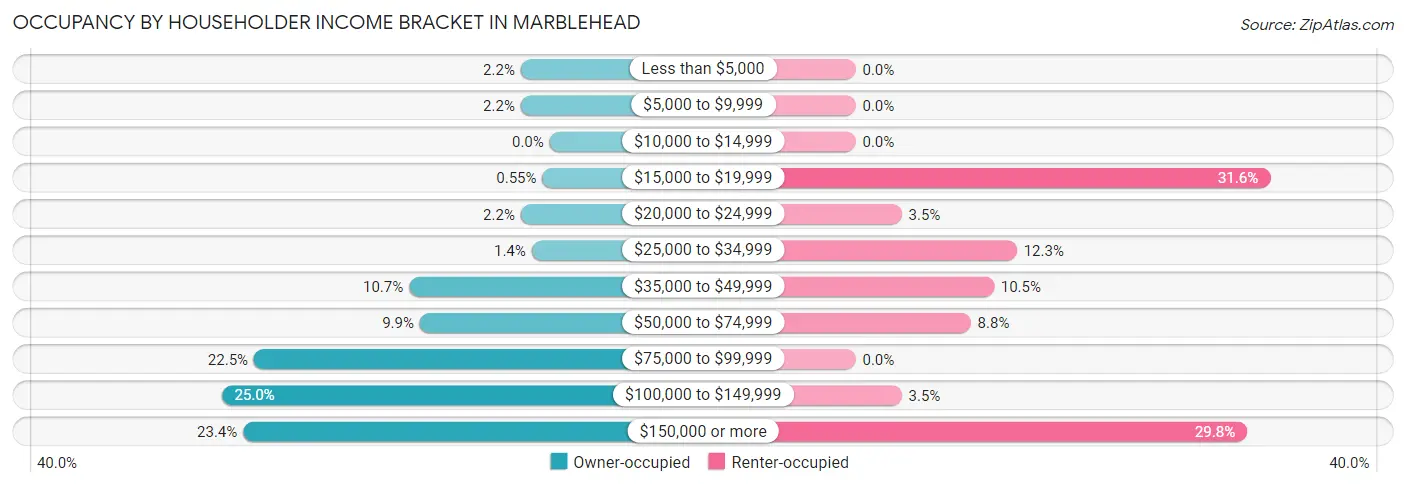
| Income Bracket | Owner-occupied | Renter-occupied |
| Less than $5,000 | 8 (2.2%) | 0 (0.0%) |
| $5,000 to $9,999 | 8 (2.2%) | 0 (0.0%) |
| $10,000 to $14,999 | 0 (0.0%) | 0 (0.0%) |
| $15,000 to $19,999 | 2 (0.5%) | 18 (31.6%) |
| $20,000 to $24,999 | 8 (2.2%) | 2 (3.5%) |
| $25,000 to $34,999 | 5 (1.4%) | 7 (12.3%) |
| $35,000 to $49,999 | 39 (10.7%) | 6 (10.5%) |
| $50,000 to $74,999 | 36 (9.9%) | 5 (8.8%) |
| $75,000 to $99,999 | 82 (22.5%) | 0 (0.0%) |
| $100,000 to $149,999 | 91 (25.0%) | 2 (3.5%) |
| $150,000 or more | 85 (23.4%) | 17 (29.8%) |
| Total | 364 (100.0%) | 57 (100.0%) |
Monthly Housing Cost Tiers in Marblehead
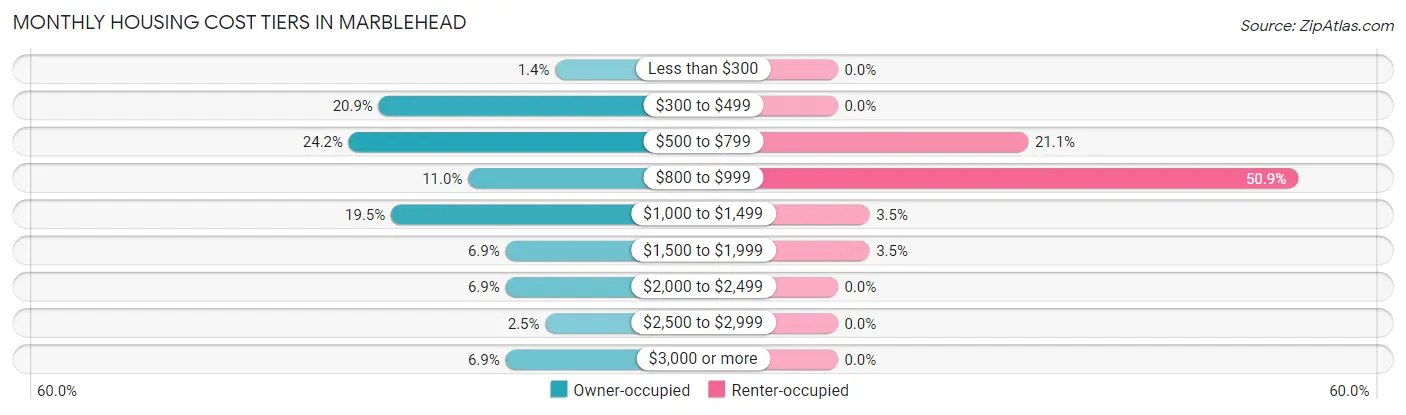
| Monthly Cost | Owner-occupied | Renter-occupied |
| Less than $300 | 5 (1.4%) | 0 (0.0%) |
| $300 to $499 | 76 (20.9%) | 0 (0.0%) |
| $500 to $799 | 88 (24.2%) | 12 (21.0%) |
| $800 to $999 | 40 (11.0%) | 29 (50.9%) |
| $1,000 to $1,499 | 71 (19.5%) | 2 (3.5%) |
| $1,500 to $1,999 | 25 (6.9%) | 2 (3.5%) |
| $2,000 to $2,499 | 25 (6.9%) | 0 (0.0%) |
| $2,500 to $2,999 | 9 (2.5%) | 0 (0.0%) |
| $3,000 or more | 25 (6.9%) | 0 (0.0%) |
| Total | 364 (100.0%) | 57 (100.0%) |
Physical Housing Characteristics in Marblehead
Housing Structures in Marblehead
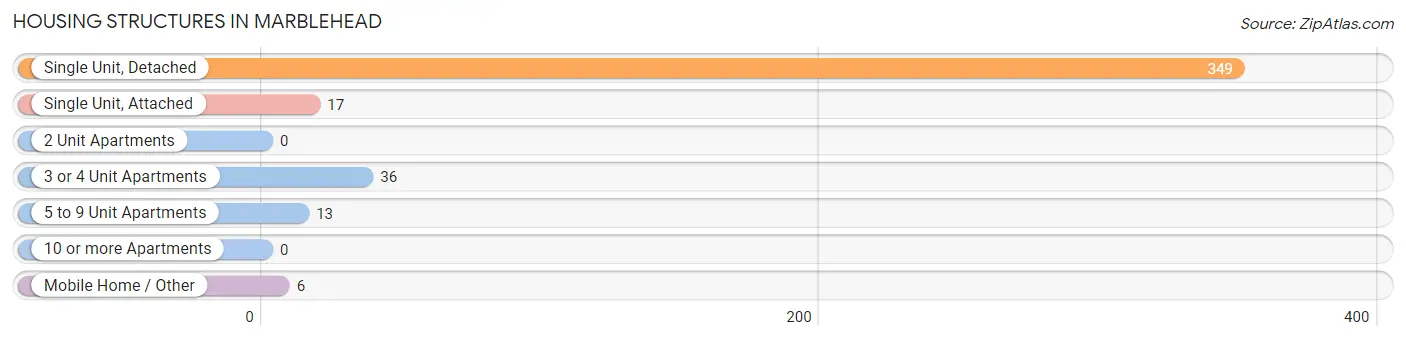
| Structure Type | # Housing Units | % Housing Units |
| Single Unit, Detached | 349 | 82.9% |
| Single Unit, Attached | 17 | 4.0% |
| 2 Unit Apartments | 0 | 0.0% |
| 3 or 4 Unit Apartments | 36 | 8.6% |
| 5 to 9 Unit Apartments | 13 | 3.1% |
| 10 or more Apartments | 0 | 0.0% |
| Mobile Home / Other | 6 | 1.4% |
| Total | 421 | 100.0% |
Housing Structures by Occupancy in Marblehead
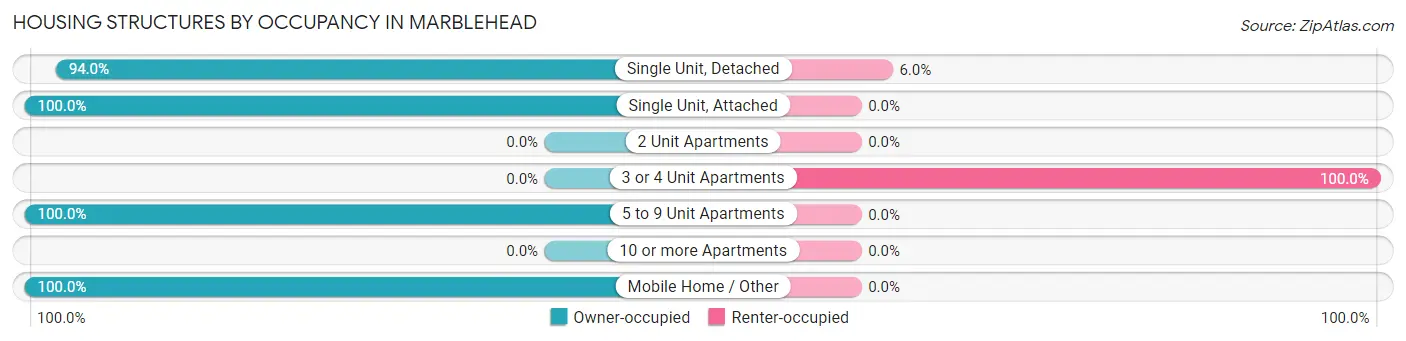
| Structure Type | Owner-occupied | Renter-occupied |
| Single Unit, Detached | 328 (94.0%) | 21 (6.0%) |
| Single Unit, Attached | 17 (100.0%) | 0 (0.0%) |
| 2 Unit Apartments | 0 (0.0%) | 0 (0.0%) |
| 3 or 4 Unit Apartments | 0 (0.0%) | 36 (100.0%) |
| 5 to 9 Unit Apartments | 13 (100.0%) | 0 (0.0%) |
| 10 or more Apartments | 0 (0.0%) | 0 (0.0%) |
| Mobile Home / Other | 6 (100.0%) | 0 (0.0%) |
| Total | 364 (86.5%) | 57 (13.5%) |
Housing Structures by Number of Rooms in Marblehead
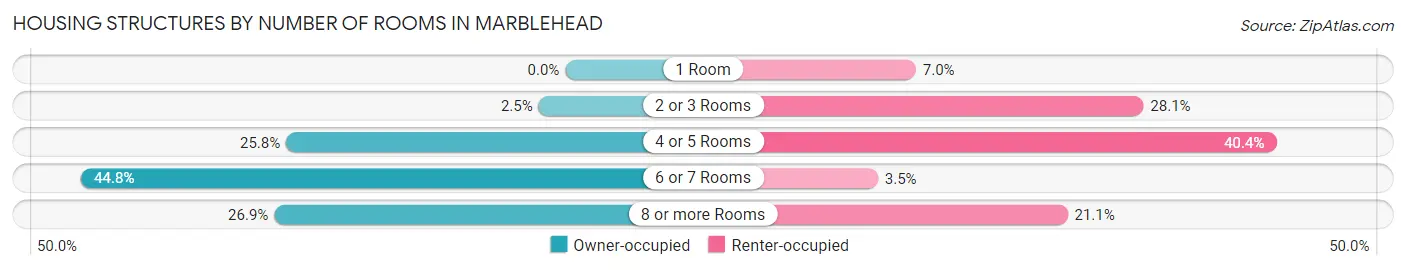
| Number of Rooms | Owner-occupied | Renter-occupied |
| 1 Room | 0 (0.0%) | 4 (7.0%) |
| 2 or 3 Rooms | 9 (2.5%) | 16 (28.1%) |
| 4 or 5 Rooms | 94 (25.8%) | 23 (40.4%) |
| 6 or 7 Rooms | 163 (44.8%) | 2 (3.5%) |
| 8 or more Rooms | 98 (26.9%) | 12 (21.0%) |
| Total | 364 (100.0%) | 57 (100.0%) |
Housing Structure by Heating Type in Marblehead
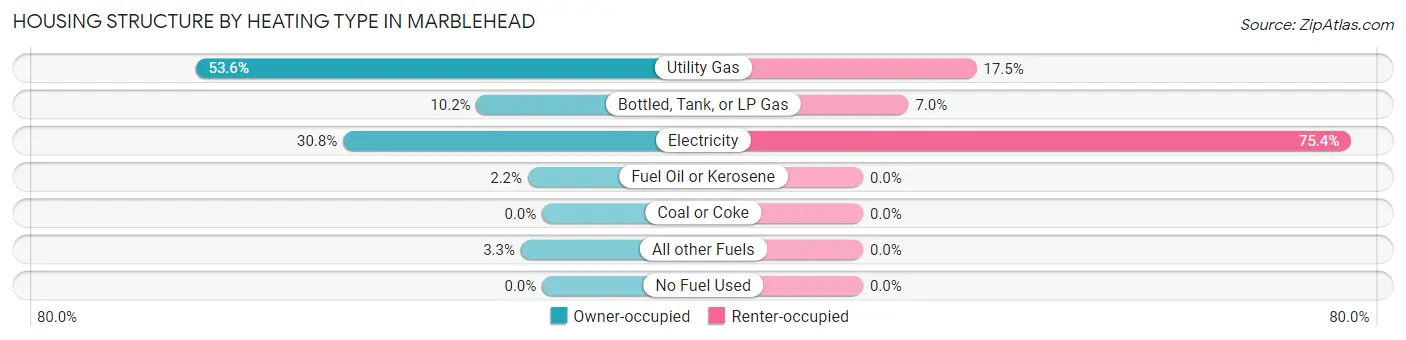
| Heating Type | Owner-occupied | Renter-occupied |
| Utility Gas | 195 (53.6%) | 10 (17.5%) |
| Bottled, Tank, or LP Gas | 37 (10.2%) | 4 (7.0%) |
| Electricity | 112 (30.8%) | 43 (75.4%) |
| Fuel Oil or Kerosene | 8 (2.2%) | 0 (0.0%) |
| Coal or Coke | 0 (0.0%) | 0 (0.0%) |
| All other Fuels | 12 (3.3%) | 0 (0.0%) |
| No Fuel Used | 0 (0.0%) | 0 (0.0%) |
| Total | 364 (100.0%) | 57 (100.0%) |
Household Vehicle Usage in Marblehead
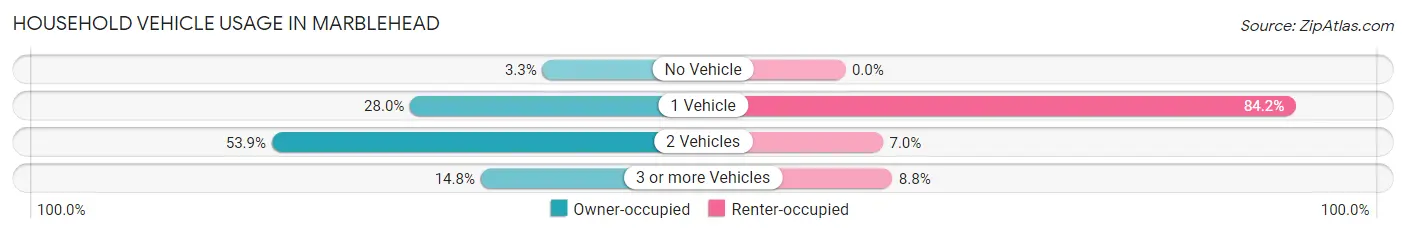
| Vehicles per Household | Owner-occupied | Renter-occupied |
| No Vehicle | 12 (3.3%) | 0 (0.0%) |
| 1 Vehicle | 102 (28.0%) | 48 (84.2%) |
| 2 Vehicles | 196 (53.8%) | 4 (7.0%) |
| 3 or more Vehicles | 54 (14.8%) | 5 (8.8%) |
| Total | 364 (100.0%) | 57 (100.0%) |
Real Estate & Mortgages in Marblehead
Real Estate and Mortgage Overview in Marblehead
| Characteristic | Without Mortgage | With Mortgage |
| Housing Units | 213 | 151 |
| Median Property Value | $290,900 | $313,500 |
| Median Household Income | $90,197 | $58 |
| Monthly Housing Costs | $569 | $25 |
| Real Estate Taxes | $2,652 | $0 |
Property Value by Mortgage Status in Marblehead
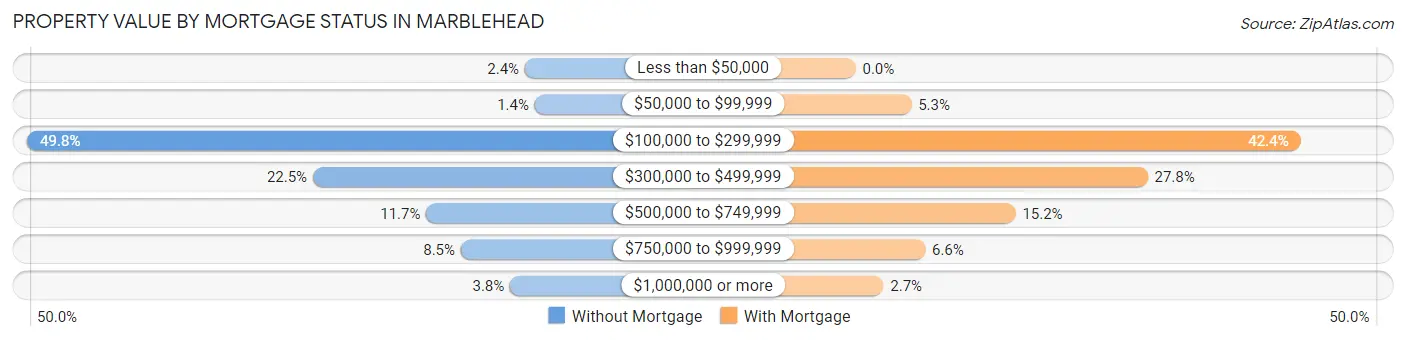
| Property Value | Without Mortgage | With Mortgage |
| Less than $50,000 | 5 (2.4%) | 0 (0.0%) |
| $50,000 to $99,999 | 3 (1.4%) | 8 (5.3%) |
| $100,000 to $299,999 | 106 (49.8%) | 64 (42.4%) |
| $300,000 to $499,999 | 48 (22.5%) | 42 (27.8%) |
| $500,000 to $749,999 | 25 (11.7%) | 23 (15.2%) |
| $750,000 to $999,999 | 18 (8.5%) | 10 (6.6%) |
| $1,000,000 or more | 8 (3.8%) | 4 (2.6%) |
| Total | 213 (100.0%) | 151 (100.0%) |
Household Income by Mortgage Status in Marblehead
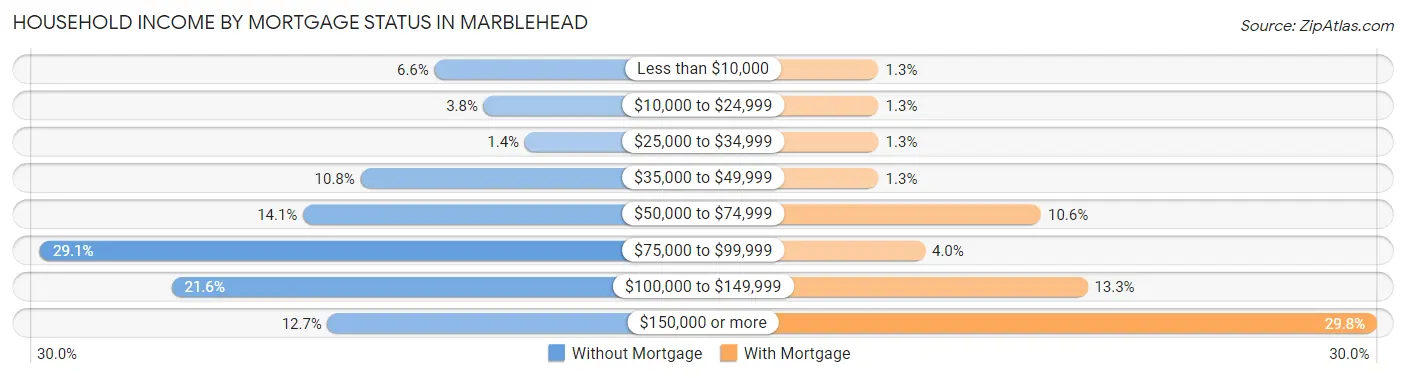
| Household Income | Without Mortgage | With Mortgage |
| Less than $10,000 | 14 (6.6%) | 2 (1.3%) |
| $10,000 to $24,999 | 8 (3.8%) | 2 (1.3%) |
| $25,000 to $34,999 | 3 (1.4%) | 2 (1.3%) |
| $35,000 to $49,999 | 23 (10.8%) | 2 (1.3%) |
| $50,000 to $74,999 | 30 (14.1%) | 16 (10.6%) |
| $75,000 to $99,999 | 62 (29.1%) | 6 (4.0%) |
| $100,000 to $149,999 | 46 (21.6%) | 20 (13.3%) |
| $150,000 or more | 27 (12.7%) | 45 (29.8%) |
| Total | 213 (100.0%) | 151 (100.0%) |
Property Value to Household Income Ratio in Marblehead
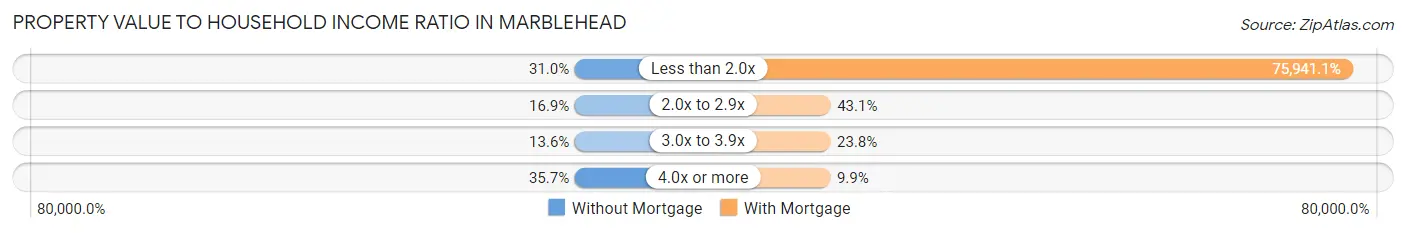
| Value-to-Income Ratio | Without Mortgage | With Mortgage |
| Less than 2.0x | 66 (31.0%) | 114,671 (75,941.1%) |
| 2.0x to 2.9x | 36 (16.9%) | 65 (43.0%) |
| 3.0x to 3.9x | 29 (13.6%) | 36 (23.8%) |
| 4.0x or more | 76 (35.7%) | 15 (9.9%) |
| Total | 213 (100.0%) | 151 (100.0%) |
Real Estate Taxes by Mortgage Status in Marblehead
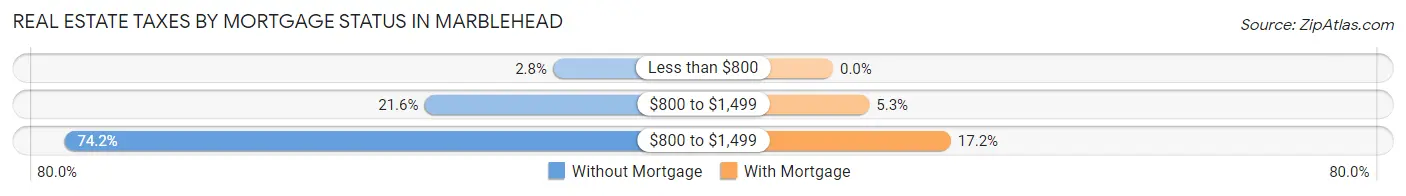
| Property Taxes | Without Mortgage | With Mortgage |
| Less than $800 | 6 (2.8%) | 0 (0.0%) |
| $800 to $1,499 | 46 (21.6%) | 8 (5.3%) |
| $800 to $1,499 | 158 (74.2%) | 26 (17.2%) |
| Total | 213 (100.0%) | 151 (100.0%) |
Health & Disability in Marblehead
Health Insurance Coverage by Age in Marblehead
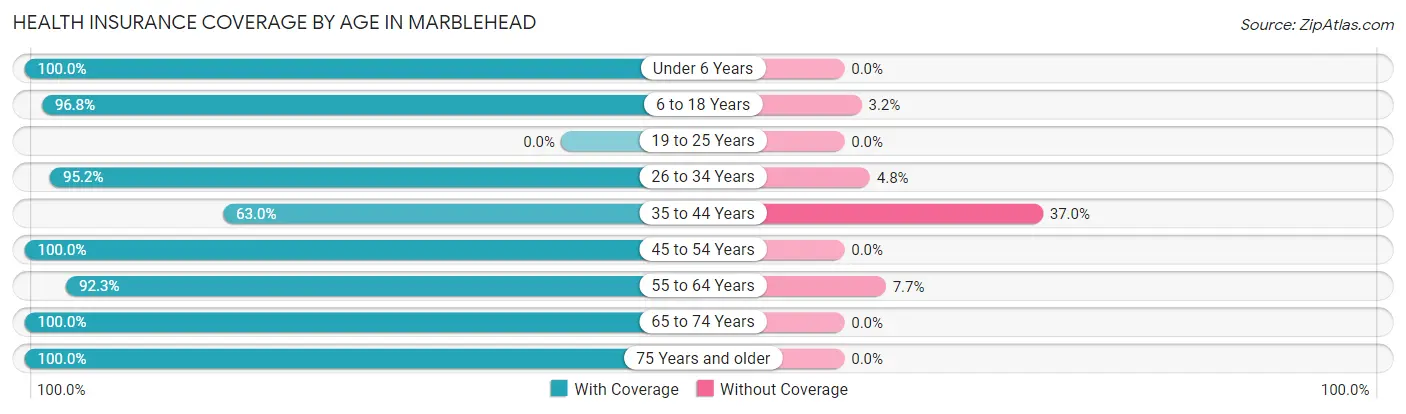
| Age Bracket | With Coverage | Without Coverage |
| Under 6 Years | 26 (100.0%) | 0 (0.0%) |
| 6 to 18 Years | 151 (96.8%) | 5 (3.2%) |
| 19 to 25 Years | 0 (0.0%) | 0 (0.0%) |
| 26 to 34 Years | 40 (95.2%) | 2 (4.8%) |
| 35 to 44 Years | 80 (63.0%) | 47 (37.0%) |
| 45 to 54 Years | 72 (100.0%) | 0 (0.0%) |
| 55 to 64 Years | 167 (92.3%) | 14 (7.7%) |
| 65 to 74 Years | 244 (100.0%) | 0 (0.0%) |
| 75 Years and older | 113 (100.0%) | 0 (0.0%) |
| Total | 893 (92.9%) | 68 (7.1%) |
Health Insurance Coverage by Citizenship Status in Marblehead
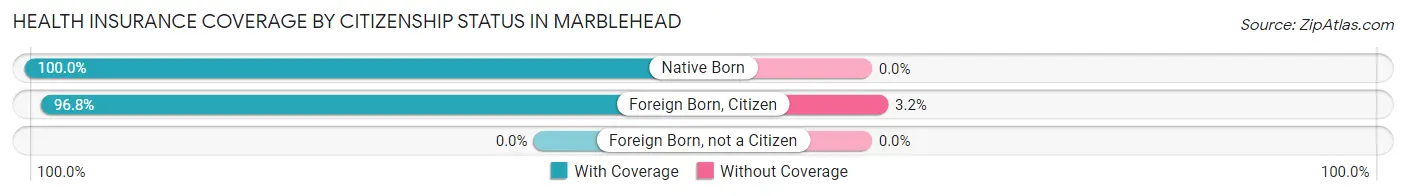
| Citizenship Status | With Coverage | Without Coverage |
| Native Born | 26 (100.0%) | 0 (0.0%) |
| Foreign Born, Citizen | 151 (96.8%) | 5 (3.2%) |
| Foreign Born, not a Citizen | 0 (0.0%) | 0 (0.0%) |
Health Insurance Coverage by Household Income in Marblehead
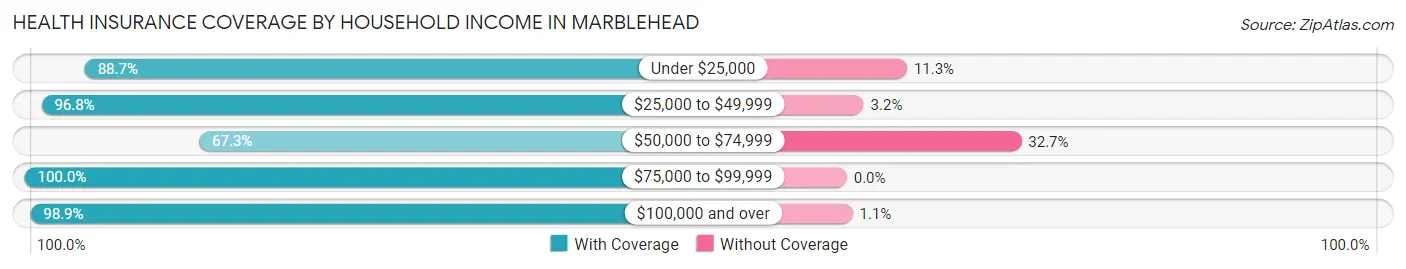
| Household Income | With Coverage | Without Coverage |
| Under $25,000 | 63 (88.7%) | 8 (11.3%) |
| $25,000 to $49,999 | 92 (96.8%) | 3 (3.2%) |
| $50,000 to $74,999 | 107 (67.3%) | 52 (32.7%) |
| $75,000 to $99,999 | 179 (100.0%) | 0 (0.0%) |
| $100,000 and over | 452 (98.9%) | 5 (1.1%) |
Public vs Private Health Insurance Coverage by Age in Marblehead
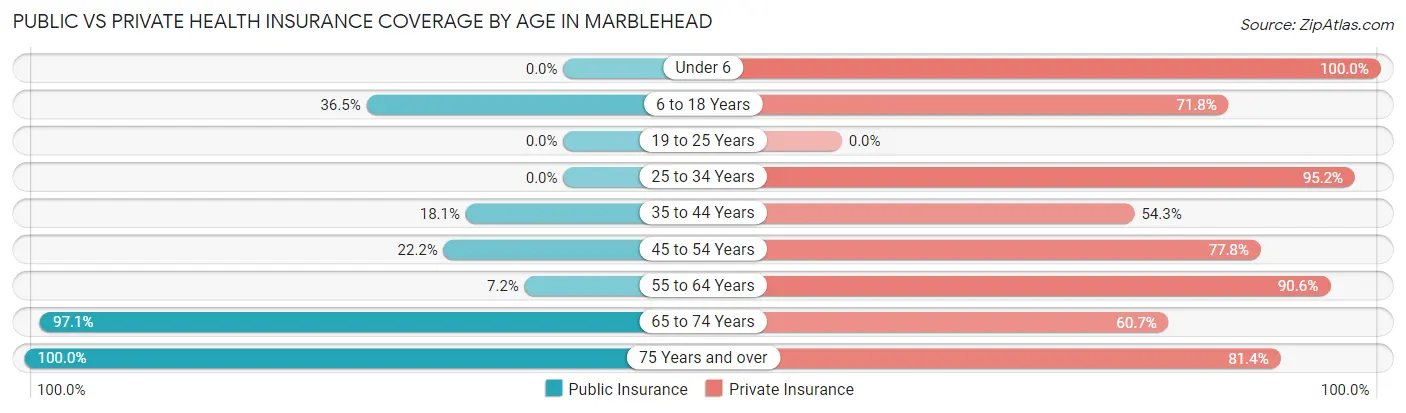
| Age Bracket | Public Insurance | Private Insurance |
| Under 6 | 0 (0.0%) | 26 (100.0%) |
| 6 to 18 Years | 57 (36.5%) | 112 (71.8%) |
| 19 to 25 Years | 0 (0.0%) | 0 (0.0%) |
| 25 to 34 Years | 0 (0.0%) | 40 (95.2%) |
| 35 to 44 Years | 23 (18.1%) | 69 (54.3%) |
| 45 to 54 Years | 16 (22.2%) | 56 (77.8%) |
| 55 to 64 Years | 13 (7.2%) | 164 (90.6%) |
| 65 to 74 Years | 237 (97.1%) | 148 (60.7%) |
| 75 Years and over | 113 (100.0%) | 92 (81.4%) |
| Total | 459 (47.8%) | 707 (73.6%) |
Disability Status by Sex by Age in Marblehead
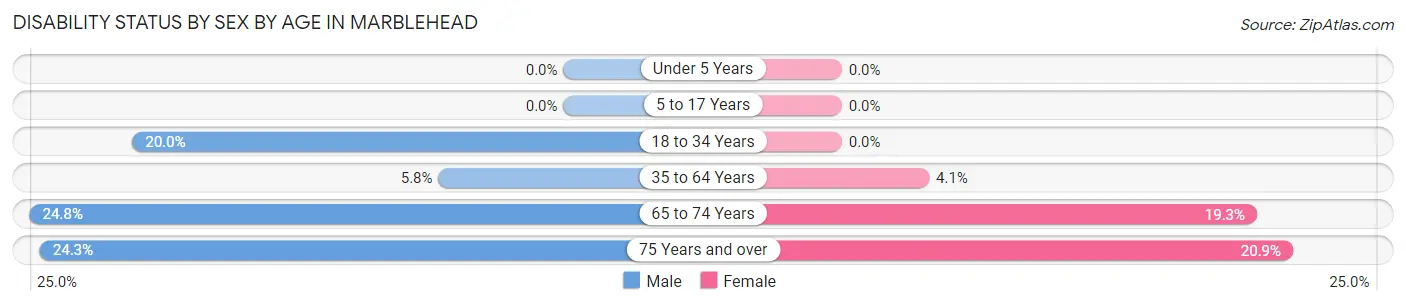
| Age Bracket | Male | Female |
| Under 5 Years | 0 (0.0%) | 0 (0.0%) |
| 5 to 17 Years | 0 (0.0%) | 0 (0.0%) |
| 18 to 34 Years | 7 (20.0%) | 0 (0.0%) |
| 35 to 64 Years | 12 (5.8%) | 7 (4.1%) |
| 65 to 74 Years | 27 (24.8%) | 26 (19.3%) |
| 75 Years and over | 17 (24.3%) | 9 (20.9%) |
Disability Class by Sex by Age in Marblehead
Disability Class: Hearing Difficulty
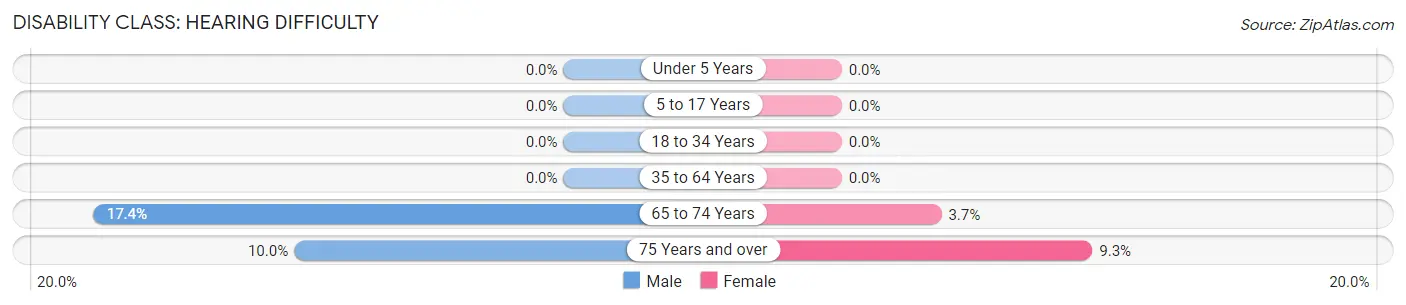
| Age Bracket | Male | Female |
| Under 5 Years | 0 (0.0%) | 0 (0.0%) |
| 5 to 17 Years | 0 (0.0%) | 0 (0.0%) |
| 18 to 34 Years | 0 (0.0%) | 0 (0.0%) |
| 35 to 64 Years | 0 (0.0%) | 0 (0.0%) |
| 65 to 74 Years | 19 (17.4%) | 5 (3.7%) |
| 75 Years and over | 7 (10.0%) | 4 (9.3%) |
Disability Class: Vision Difficulty
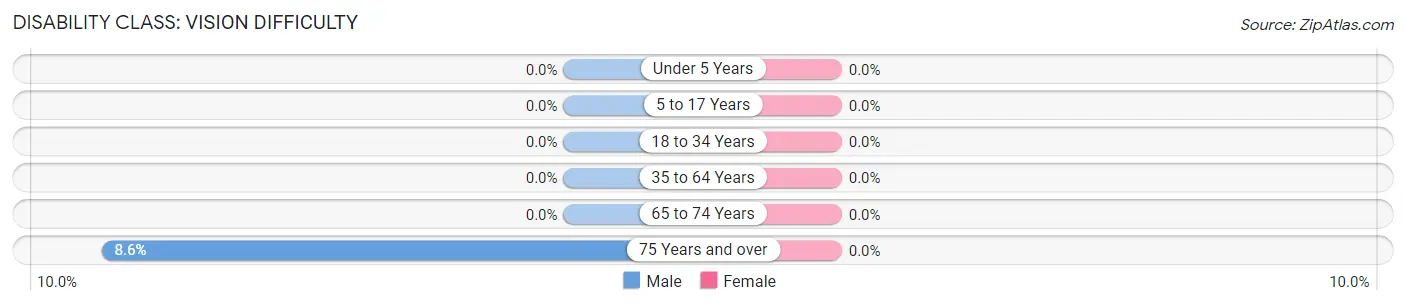
| Age Bracket | Male | Female |
| Under 5 Years | 0 (0.0%) | 0 (0.0%) |
| 5 to 17 Years | 0 (0.0%) | 0 (0.0%) |
| 18 to 34 Years | 0 (0.0%) | 0 (0.0%) |
| 35 to 64 Years | 0 (0.0%) | 0 (0.0%) |
| 65 to 74 Years | 0 (0.0%) | 0 (0.0%) |
| 75 Years and over | 6 (8.6%) | 0 (0.0%) |
Disability Class: Cognitive Difficulty
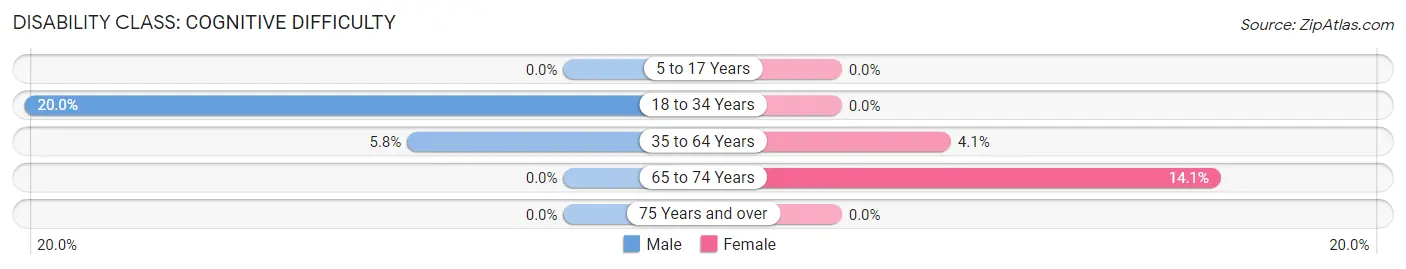
| Age Bracket | Male | Female |
| 5 to 17 Years | 0 (0.0%) | 0 (0.0%) |
| 18 to 34 Years | 7 (20.0%) | 0 (0.0%) |
| 35 to 64 Years | 12 (5.8%) | 7 (4.1%) |
| 65 to 74 Years | 0 (0.0%) | 19 (14.1%) |
| 75 Years and over | 0 (0.0%) | 0 (0.0%) |
Disability Class: Ambulatory Difficulty
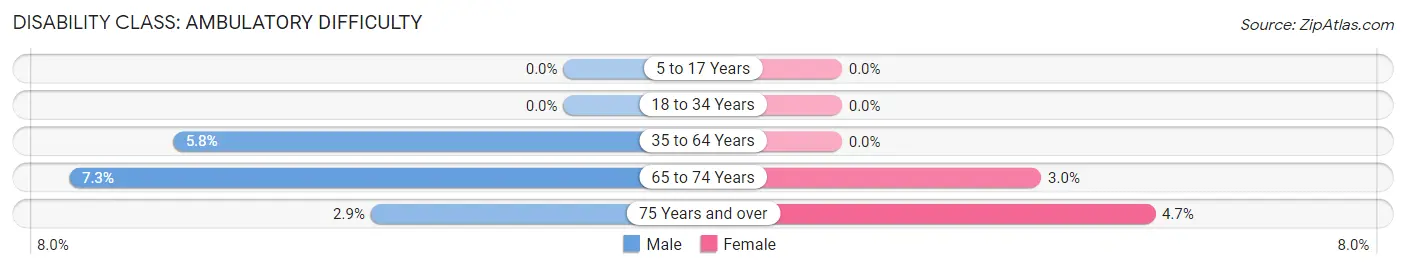
| Age Bracket | Male | Female |
| 5 to 17 Years | 0 (0.0%) | 0 (0.0%) |
| 18 to 34 Years | 0 (0.0%) | 0 (0.0%) |
| 35 to 64 Years | 12 (5.8%) | 0 (0.0%) |
| 65 to 74 Years | 8 (7.3%) | 4 (3.0%) |
| 75 Years and over | 2 (2.9%) | 2 (4.6%) |
Disability Class: Self-Care Difficulty
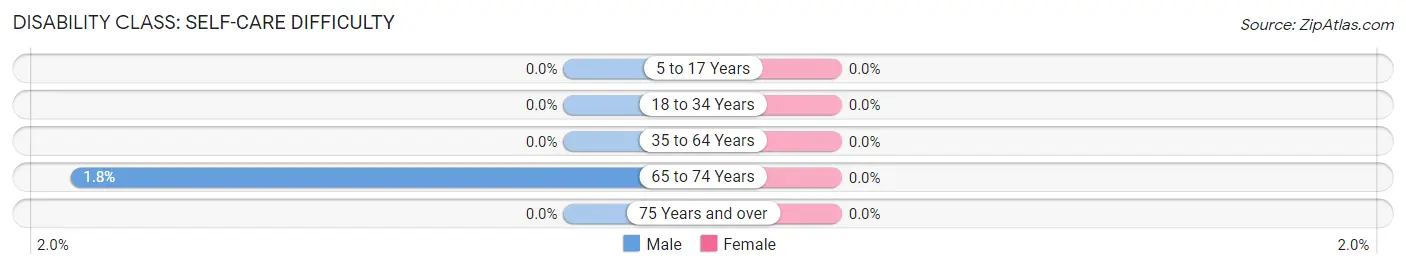
| Age Bracket | Male | Female |
| 5 to 17 Years | 0 (0.0%) | 0 (0.0%) |
| 18 to 34 Years | 0 (0.0%) | 0 (0.0%) |
| 35 to 64 Years | 0 (0.0%) | 0 (0.0%) |
| 65 to 74 Years | 2 (1.8%) | 0 (0.0%) |
| 75 Years and over | 0 (0.0%) | 0 (0.0%) |
Technology Access in Marblehead
Computing Device Access in Marblehead
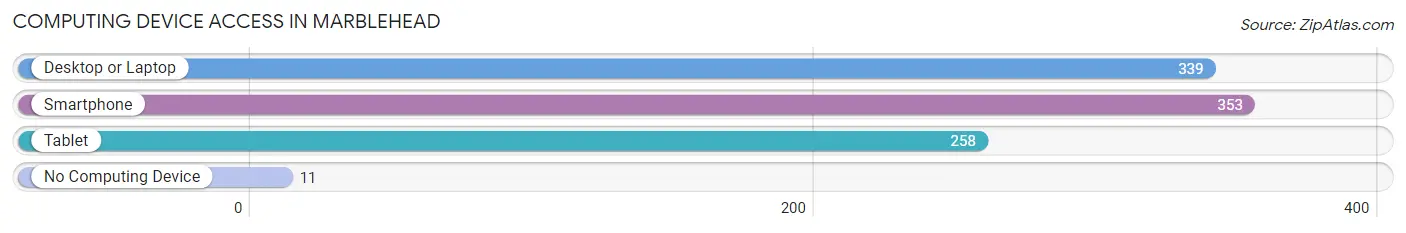
| Device Type | # Households | % Households |
| Desktop or Laptop | 339 | 80.5% |
| Smartphone | 353 | 83.9% |
| Tablet | 258 | 61.3% |
| No Computing Device | 11 | 2.6% |
| Total | 421 | 100.0% |
Internet Access in Marblehead
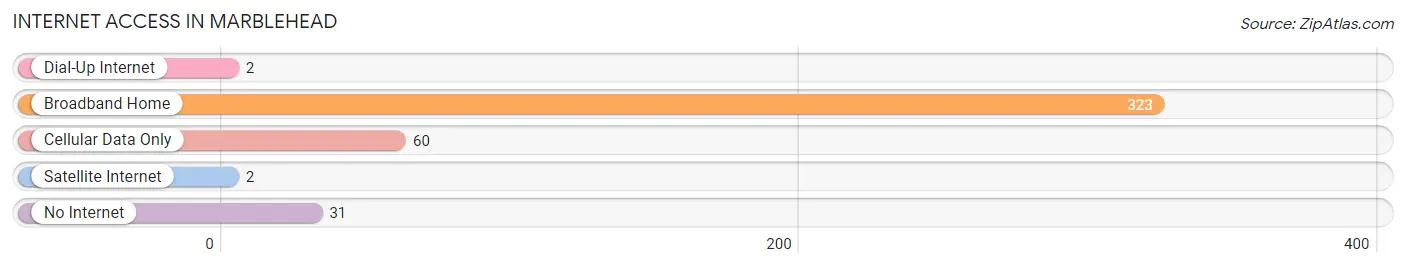
| Internet Type | # Households | % Households |
| Dial-Up Internet | 2 | 0.5% |
| Broadband Home | 323 | 76.7% |
| Cellular Data Only | 60 | 14.2% |
| Satellite Internet | 2 | 0.5% |
| No Internet | 31 | 7.4% |
| Total | 421 | 100.0% |
Marblehead Summary
Marblehead, Ohio is a small village located in Ottawa County, Ohio, United States. The village is situated on the Marblehead Peninsula, which is a part of the Lake Erie Islands. The village is located on the northern shore of Lake Erie, and is bordered by the towns of Port Clinton and Catawba Island. The village has a population of approximately 1,500 people, and is a popular tourist destination due to its proximity to the lake and its many attractions.
Geography
Marblehead is located at 41°30'N, 82°48'W (41.50, -82.80). The village is situated on the Marblehead Peninsula, which is a part of the Lake Erie Islands. The peninsula is bordered by the towns of Port Clinton and Catawba Island. The village is located on the northern shore of Lake Erie, and is approximately 25 miles east of Toledo, Ohio. The village is surrounded by water on three sides, and is connected to the mainland by a causeway. The village is located in a temperate climate, with hot summers and cold winters.
Economy
Marblehead’s economy is largely based on tourism. The village is a popular destination for boaters, fishermen, and beachgoers. The village is home to several marinas, which provide boat rentals and other services. The village also has several restaurants, bars, and shops, which cater to tourists. The village is also home to several small businesses, including a grocery store, a hardware store, and a pharmacy.
Demographics
As of the 2010 census, the village had a population of 1,541. The racial makeup of the village was 97.2% White, 0.7% African American, 0.3% Native American, 0.3% Asian, 0.1% Pacific Islander, 0.2% from other races, and 1.3% from two or more races. Hispanic or Latino of any race were 1.3% of the population.
The median income for a household in the village was $45,938, and the median income for a family was $51,250. Males had a median income of $37,500 versus $25,000 for females. The per capita income for the village was $20,945. About 5.2% of families and 6.7% of the population were below the poverty line, including 8.3% of those under age 18 and 4.2% of those age 65 or over.
History
Marblehead was first settled in 1820 by a group of settlers from Marblehead, Massachusetts. The village was originally known as Marblehead Township, and was incorporated as a village in 1867. The village was named after the Massachusetts town, and was originally a fishing and farming community. In the late 19th century, the village became a popular tourist destination, and several hotels and resorts were built in the area. The village was also home to several limestone quarries, which provided the stone for many of the buildings in the village. In the early 20th century, the village became a popular destination for boaters and fishermen, and several marinas were built in the area. The village has remained a popular tourist destination, and continues to attract visitors from all over the world.
Common Questions
What is Per Capita Income in Marblehead?
Per Capita income in Marblehead is $51,372.
What is the Median Family Income in Marblehead?
Median Family Income in Marblehead is $100,000.
What is the Median Household income in Marblehead?
Median Household Income in Marblehead is $97,019.
What is Income or Wage Gap in Marblehead?
Income or Wage Gap in Marblehead is 3.0%.
Women in Marblehead earn 97.0 cents for every dollar earned by a man.
What is Inequality or Gini Index in Marblehead?
Inequality or Gini Index in Marblehead is 0.39.
What is the Total Population of Marblehead?
Total Population of Marblehead is 962.
What is the Total Male Population of Marblehead?
Total Male Population of Marblehead is 502.
What is the Total Female Population of Marblehead?
Total Female Population of Marblehead is 460.
What is the Ratio of Males per 100 Females in Marblehead?
There are 109.13 Males per 100 Females in Marblehead.
What is the Ratio of Females per 100 Males in Marblehead?
There are 91.63 Females per 100 Males in Marblehead.
What is the Median Population Age in Marblehead?
Median Population Age in Marblehead is 57.3 Years.
What is the Average Family Size in Marblehead
Average Family Size in Marblehead is 2.5 People.
What is the Average Household Size in Marblehead
Average Household Size in Marblehead is 2.3 People.
How Large is the Labor Force in Marblehead?
There are 393 People in the Labor Forcein in Marblehead.
What is the Percentage of People in the Labor Force in Marblehead?
48.3% of People are in the Labor Force in Marblehead.
What is the Unemployment Rate in Marblehead?
Unemployment Rate in Marblehead is 0.8%.