The Plains, OH Map & Demographics
The Plains Map
The Plains Overview
$35,124
PER CAPITA INCOME
$58,419
AVG FAMILY INCOME
$52,794
AVG HOUSEHOLD INCOME
27.4%
WAGE / INCOME GAP [ % ]
72.6¢/ $1
WAGE / INCOME GAP [ $ ]
0.40
INEQUALITY / GINI INDEX
2,724
TOTAL POPULATION
1,186
MALE POPULATION
1,538
FEMALE POPULATION
77.11
MALES / 100 FEMALES
129.68
FEMALES / 100 MALES
59.1
MEDIAN AGE
2.4
AVG FAMILY SIZE
1.7
AVG HOUSEHOLD SIZE
1,090
LABOR FORCE [ PEOPLE ]
43.3%
PERCENT IN LABOR FORCE
5.3%
UNEMPLOYMENT RATE
The Plains Zip Codes
The Plains Area Codes
Income in The Plains
Income Overview in The Plains
Per Capita Income in The Plains is $35,124, while median incomes of families and households are $58,419 and $52,794 respectively.
| Characteristic | Number | Measure |
| Per Capita Income | 2,724 | $35,124 |
| Median Family Income | 648 | $58,419 |
| Mean Family Income | 648 | $70,108 |
| Median Household Income | 1,554 | $52,794 |
| Mean Household Income | 1,554 | $60,268 |
| Income Deficit | 648 | $0 |
| Wage / Income Gap (%) | 2,724 | 27.45% |
| Wage / Income Gap ($) | 2,724 | 72.55¢ per $1 |
| Gini / Inequality Index | 2,724 | 0.40 |
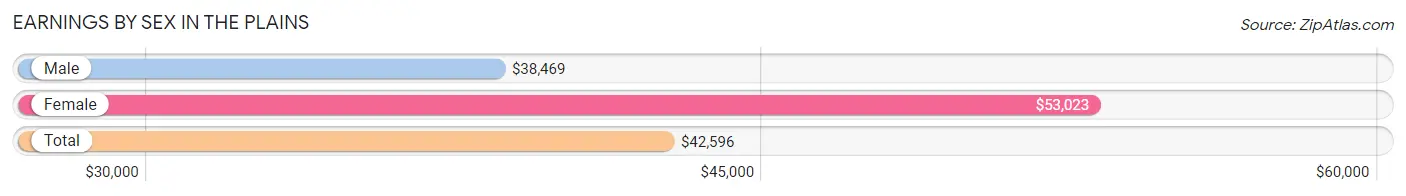
Earnings by Sex in The Plains
Average Earnings in The Plains are $42,596, $38,469 for men and $53,023 for women, a difference of 27.5%.
| Sex | Number | Average Earnings |
| Male | 611 (47.1%) | $38,469 |
| Female | 686 (52.9%) | $53,023 |
| Total | 1,297 (100.0%) | $42,596 |
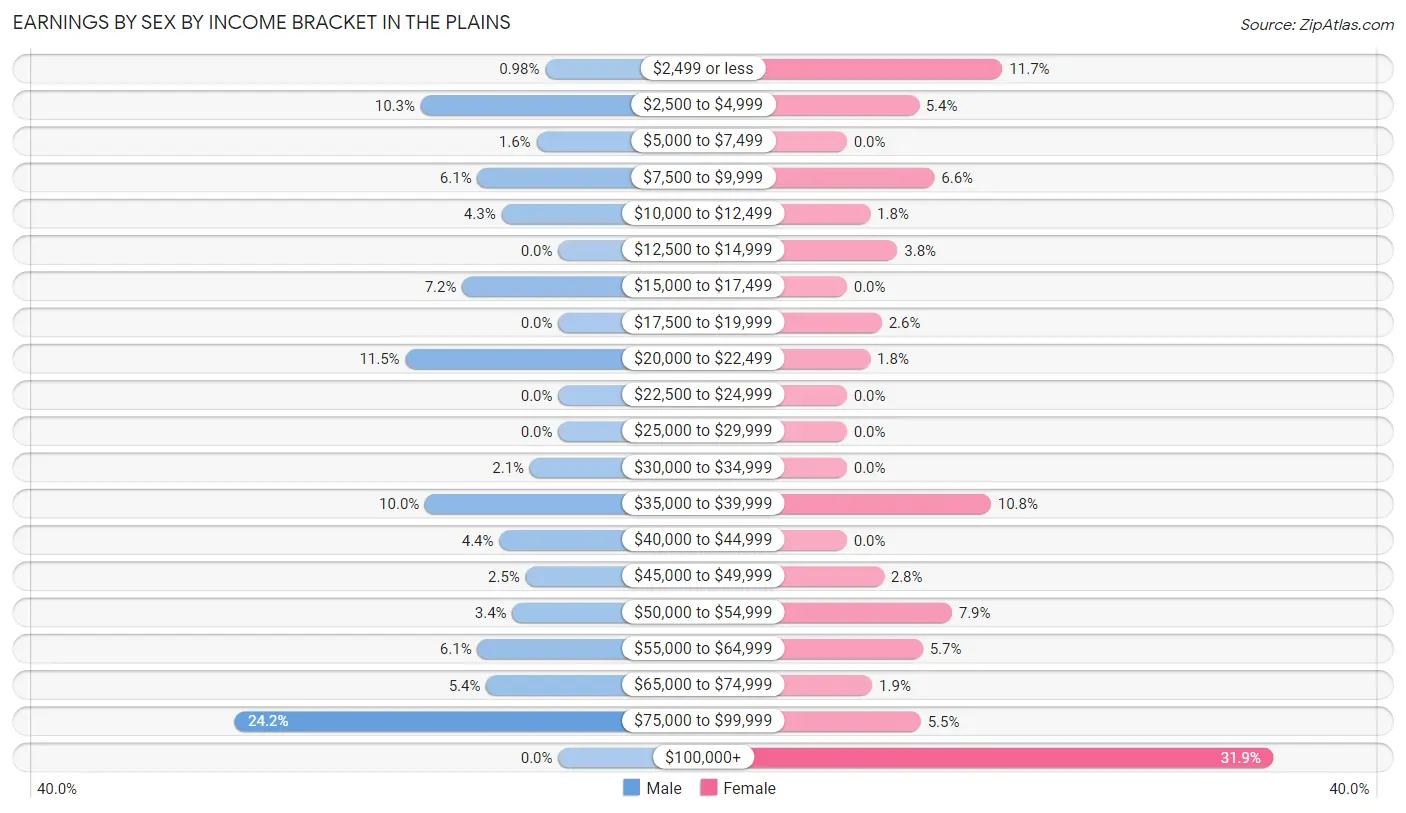
Earnings by Sex by Income Bracket in The Plains
The most common earnings brackets in The Plains are $75,000 to $99,999 for men (148 | 24.2%) and $100,000+ for women (219 | 31.9%).
| Income | Male | Female |
| $2,499 or less | 6 (1.0%) | 80 (11.7%) |
| $2,500 to $4,999 | 63 (10.3%) | 37 (5.4%) |
| $5,000 to $7,499 | 10 (1.6%) | 0 (0.0%) |
| $7,500 to $9,999 | 37 (6.1%) | 45 (6.6%) |
| $10,000 to $12,499 | 26 (4.3%) | 12 (1.8%) |
| $12,500 to $14,999 | 0 (0.0%) | 26 (3.8%) |
| $15,000 to $17,499 | 44 (7.2%) | 0 (0.0%) |
| $17,500 to $19,999 | 0 (0.0%) | 18 (2.6%) |
| $20,000 to $22,499 | 70 (11.5%) | 12 (1.8%) |
| $22,500 to $24,999 | 0 (0.0%) | 0 (0.0%) |
| $25,000 to $29,999 | 0 (0.0%) | 0 (0.0%) |
| $30,000 to $34,999 | 13 (2.1%) | 0 (0.0%) |
| $35,000 to $39,999 | 61 (10.0%) | 74 (10.8%) |
| $40,000 to $44,999 | 27 (4.4%) | 0 (0.0%) |
| $45,000 to $49,999 | 15 (2.5%) | 19 (2.8%) |
| $50,000 to $54,999 | 21 (3.4%) | 54 (7.9%) |
| $55,000 to $64,999 | 37 (6.1%) | 39 (5.7%) |
| $65,000 to $74,999 | 33 (5.4%) | 13 (1.9%) |
| $75,000 to $99,999 | 148 (24.2%) | 38 (5.5%) |
| $100,000+ | 0 (0.0%) | 219 (31.9%) |
| Total | 611 (100.0%) | 686 (100.0%) |
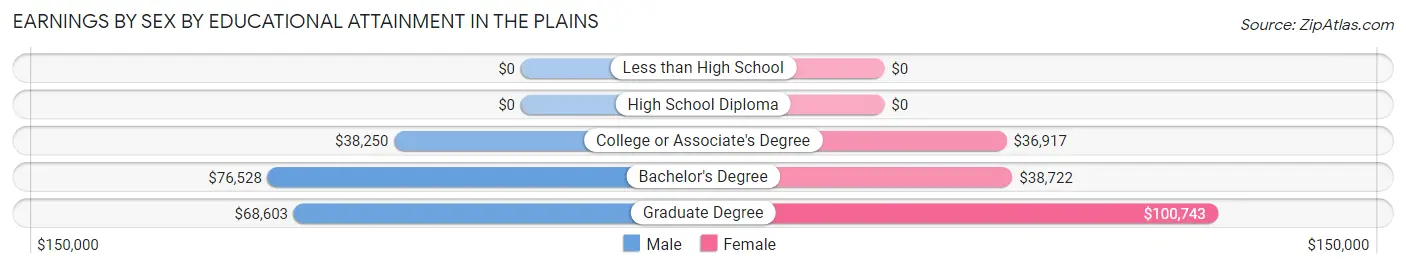
Earnings by Sex by Educational Attainment in The Plains
Average earnings in The Plains are $42,692 for men and $54,971 for women, a difference of 22.3%. Men with an educational attainment of bachelor's degree enjoy the highest average annual earnings of $76,528, while those with college or associate's degree education earn the least with $38,250. Women with an educational attainment of graduate degree earn the most with the average annual earnings of $100,743, while those with college or associate's degree education have the smallest earnings of $36,917.
| Educational Attainment | Male Income | Female Income |
| Less than High School | - | - |
| High School Diploma | - | - |
| College or Associate's Degree | $38,250 | $36,917 |
| Bachelor's Degree | $76,528 | $38,722 |
| Graduate Degree | $68,603 | $100,743 |
| Total | $42,692 | $54,971 |
Family Income in The Plains
Family Income Brackets in The Plains
According to the The Plains family income data, there are 141 families falling into the $50,000 to $74,999 income range, which is the most common income bracket and makes up 21.8% of all families. Conversely, the $200,000+ income bracket is the least frequent group with only 18 families (2.8%) belonging to this category.
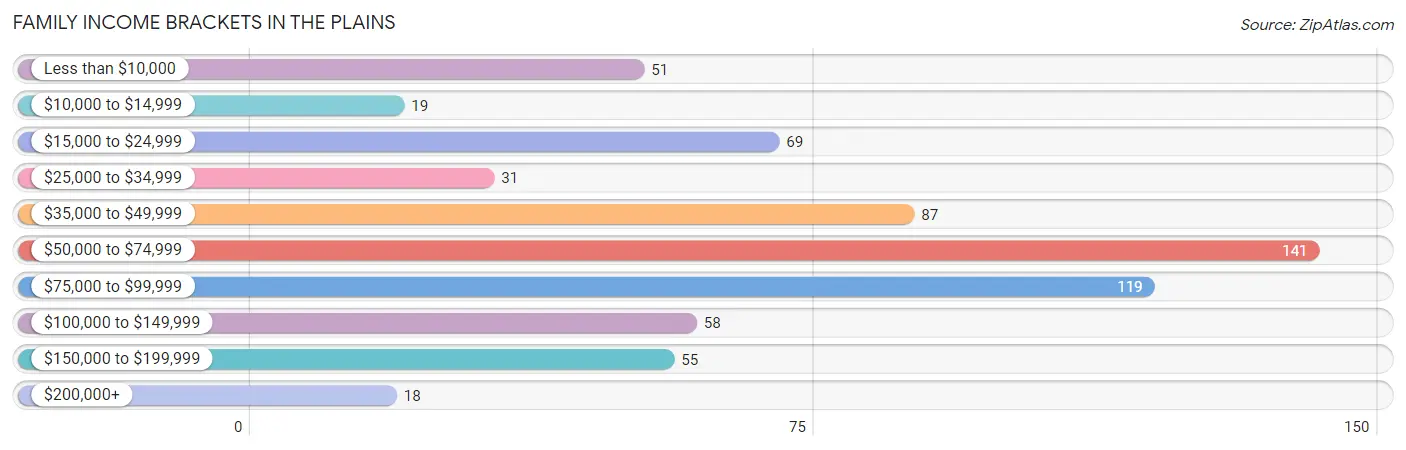
| Income Bracket | # Families | % Families |
| Less than $10,000 | 51 | 7.9% |
| $10,000 to $14,999 | 19 | 2.9% |
| $15,000 to $24,999 | 69 | 10.6% |
| $25,000 to $34,999 | 31 | 4.8% |
| $35,000 to $49,999 | 87 | 13.4% |
| $50,000 to $74,999 | 141 | 21.8% |
| $75,000 to $99,999 | 119 | 18.4% |
| $100,000 to $149,999 | 58 | 9.0% |
| $150,000 to $199,999 | 55 | 8.5% |
| $200,000+ | 18 | 2.8% |
Family Income by Famaliy Size in The Plains
4-person families (67 | 10.3%) account for the highest median family income in The Plains with $93,566 per family, while 2-person families (499 | 77.0%) have the highest median income of $29,065 per family member.
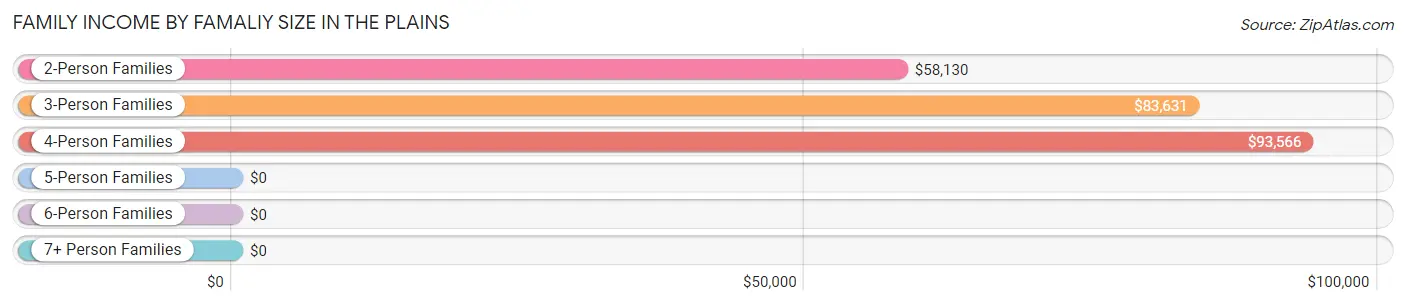
| Income Bracket | # Families | Median Income |
| 2-Person Families | 499 (77.0%) | $58,130 |
| 3-Person Families | 61 (9.4%) | $83,631 |
| 4-Person Families | 67 (10.3%) | $93,566 |
| 5-Person Families | 21 (3.2%) | $0 |
| 6-Person Families | 0 (0.0%) | $0 |
| 7+ Person Families | 0 (0.0%) | $0 |
| Total | 648 (100.0%) | $58,419 |
Family Income by Number of Earners in The Plains
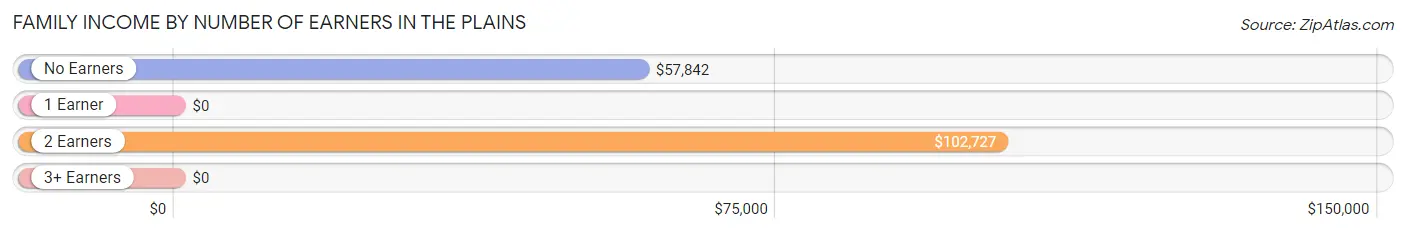
| Number of Earners | # Families | Median Income |
| No Earners | 266 (41.0%) | $57,842 |
| 1 Earner | 241 (37.2%) | $0 |
| 2 Earners | 114 (17.6%) | $102,727 |
| 3+ Earners | 27 (4.2%) | $0 |
| Total | 648 (100.0%) | $58,419 |
Household Income in The Plains
Household Income Brackets in The Plains
With 284 households falling in the category, the $35,000 to $49,999 income range is the most frequent in The Plains, accounting for 18.3% of all households. In contrast, only 19 households (1.2%) fall into the $200,000+ income bracket, making it the least populous group.
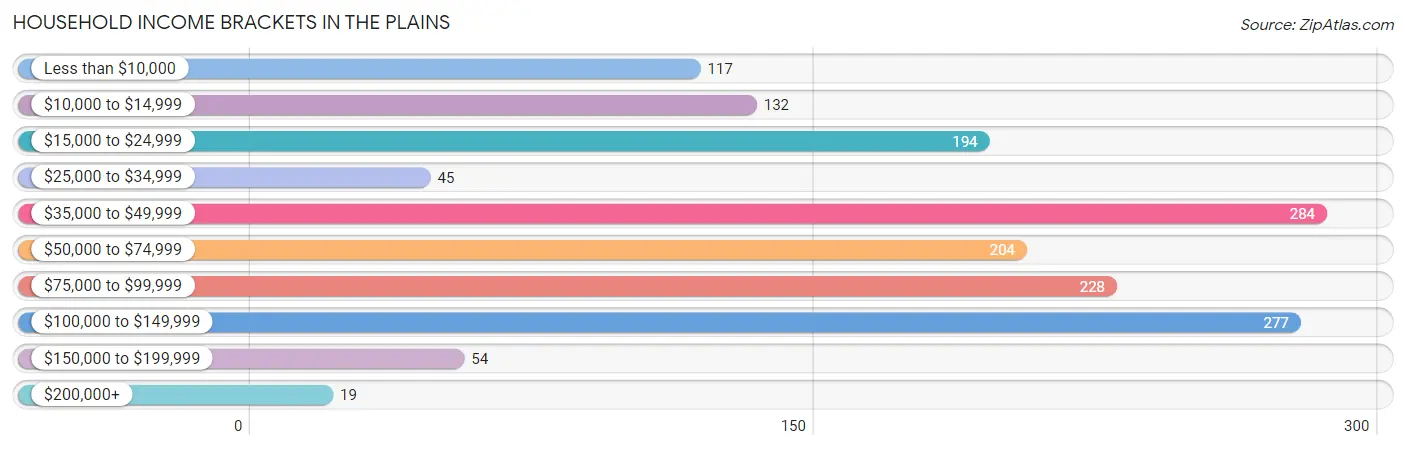
| Income Bracket | # Households | % Households |
| Less than $10,000 | 117 | 7.5% |
| $10,000 to $14,999 | 132 | 8.5% |
| $15,000 to $24,999 | 194 | 12.5% |
| $25,000 to $34,999 | 45 | 2.9% |
| $35,000 to $49,999 | 284 | 18.3% |
| $50,000 to $74,999 | 204 | 13.1% |
| $75,000 to $99,999 | 228 | 14.7% |
| $100,000 to $149,999 | 277 | 17.8% |
| $150,000 to $199,999 | 54 | 3.5% |
| $200,000+ | 19 | 1.2% |
Household Income by Householder Age in The Plains
The median household income in The Plains is $52,794, with the highest median household income of $58,977 found in the 25 to 44 years age bracket for the primary householder. A total of 378 households (24.3%) fall into this category. Meanwhile, the 45 to 64 years age bracket for the primary householder has the lowest median household income of $0, with 433 households (27.9%) in this group.
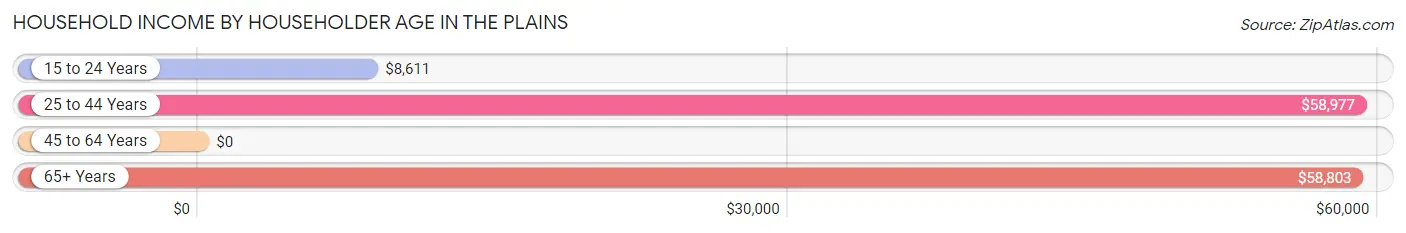
| Income Bracket | # Households | Median Income |
| 15 to 24 Years | 58 (3.7%) | $8,611 |
| 25 to 44 Years | 378 (24.3%) | $58,977 |
| 45 to 64 Years | 433 (27.9%) | $0 |
| 65+ Years | 685 (44.1%) | $58,803 |
| Total | 1,554 (100.0%) | $52,794 |
Poverty in The Plains
Income Below Poverty by Sex and Age in The Plains
With 20.7% poverty level for males and 20.5% for females among the residents of The Plains, 18 to 24 year old males and 18 to 24 year old females are the most vulnerable to poverty, with 79 males (70.5%) and 73 females (100.0%) in their respective age groups living below the poverty level.
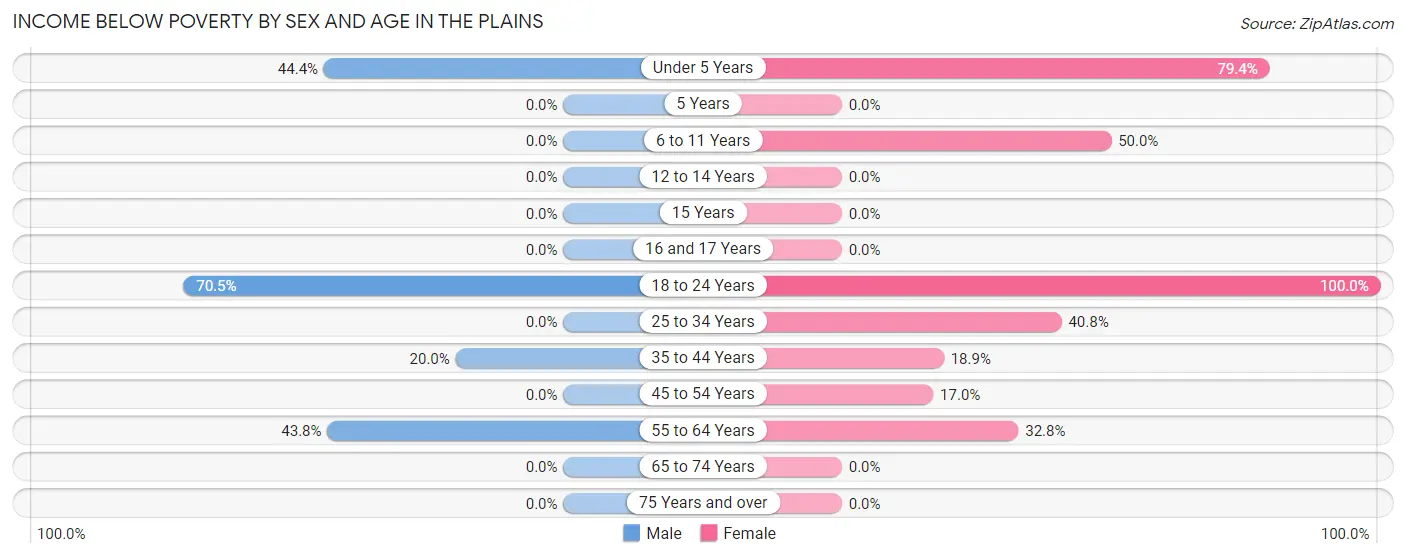
| Age Bracket | Male | Female |
| Under 5 Years | 12 (44.4%) | 54 (79.4%) |
| 5 Years | 0 (0.0%) | 0 (0.0%) |
| 6 to 11 Years | 0 (0.0%) | 16 (50.0%) |
| 12 to 14 Years | 0 (0.0%) | 0 (0.0%) |
| 15 Years | 0 (0.0%) | 0 (0.0%) |
| 16 and 17 Years | 0 (0.0%) | 0 (0.0%) |
| 18 to 24 Years | 79 (70.5%) | 73 (100.0%) |
| 25 to 34 Years | 0 (0.0%) | 42 (40.8%) |
| 35 to 44 Years | 34 (20.0%) | 28 (18.9%) |
| 45 to 54 Years | 0 (0.0%) | 19 (17.0%) |
| 55 to 64 Years | 113 (43.8%) | 76 (32.8%) |
| 65 to 74 Years | 0 (0.0%) | 0 (0.0%) |
| 75 Years and over | 0 (0.0%) | 0 (0.0%) |
| Total | 238 (20.7%) | 308 (20.5%) |
Income Above Poverty by Sex and Age in The Plains
According to the poverty statistics in The Plains, males aged 6 to 11 years and females aged 12 to 14 years are the age groups that are most secure financially, with 100.0% of males and 100.0% of females in these age groups living above the poverty line.

| Age Bracket | Male | Female |
| Under 5 Years | 15 (55.6%) | 14 (20.6%) |
| 5 Years | 0 (0.0%) | 0 (0.0%) |
| 6 to 11 Years | 47 (100.0%) | 16 (50.0%) |
| 12 to 14 Years | 0 (0.0%) | 33 (100.0%) |
| 15 Years | 0 (0.0%) | 0 (0.0%) |
| 16 and 17 Years | 0 (0.0%) | 14 (100.0%) |
| 18 to 24 Years | 33 (29.5%) | 0 (0.0%) |
| 25 to 34 Years | 168 (100.0%) | 61 (59.2%) |
| 35 to 44 Years | 136 (80.0%) | 120 (81.1%) |
| 45 to 54 Years | 98 (100.0%) | 93 (83.0%) |
| 55 to 64 Years | 145 (56.2%) | 156 (67.2%) |
| 65 to 74 Years | 204 (100.0%) | 509 (100.0%) |
| 75 Years and over | 65 (100.0%) | 175 (100.0%) |
| Total | 911 (79.3%) | 1,191 (79.4%) |
Income Below Poverty Among Married-Couple Families in The Plains
The poverty statistics for married-couple families in The Plains show that 5.4% or 25 of the total 462 families live below the poverty line. Families with 1 or 2 children have the highest poverty rate of 8.0%, comprising of 6 families. On the other hand, families with no children have the lowest poverty rate of 4.9%, which includes 19 families.
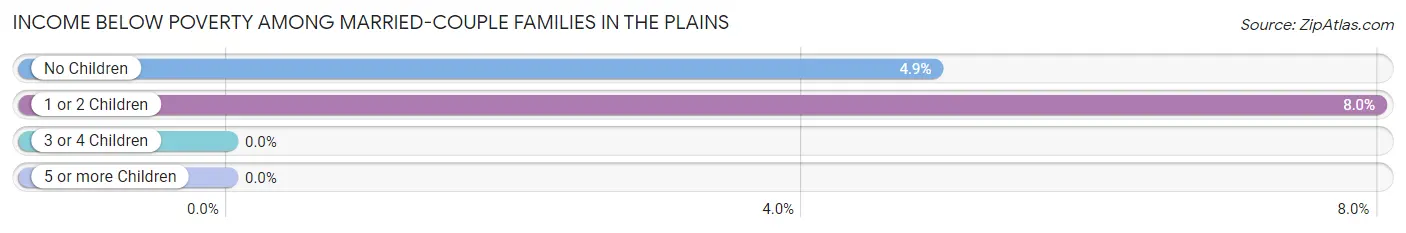
| Children | Above Poverty | Below Poverty |
| No Children | 368 (95.1%) | 19 (4.9%) |
| 1 or 2 Children | 69 (92.0%) | 6 (8.0%) |
| 3 or 4 Children | 0 (0.0%) | 0 (0.0%) |
| 5 or more Children | 0 (0.0%) | 0 (0.0%) |
| Total | 437 (94.6%) | 25 (5.4%) |
Income Below Poverty Among Single-Parent Households in The Plains
According to the poverty data in The Plains, 100.0% or 15 single-father households and 37.4% or 64 single-mother households are living below the poverty line. Among single-father households, those with no children have the highest poverty rate, with 15 households (100.0%) experiencing poverty. Likewise, among single-mother households, those with 1 or 2 children have the highest poverty rate, with 42 households (56.8%) falling below the poverty line.
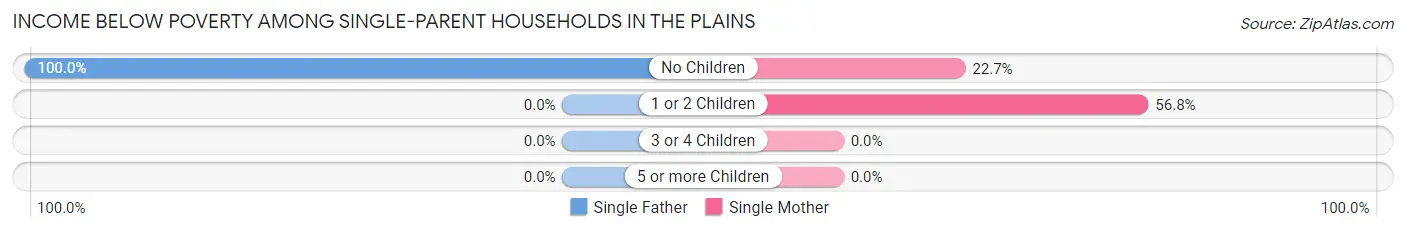
| Children | Single Father | Single Mother |
| No Children | 15 (100.0%) | 22 (22.7%) |
| 1 or 2 Children | 0 (0.0%) | 42 (56.8%) |
| 3 or 4 Children | 0 (0.0%) | 0 (0.0%) |
| 5 or more Children | 0 (0.0%) | 0 (0.0%) |
| Total | 15 (100.0%) | 64 (37.4%) |
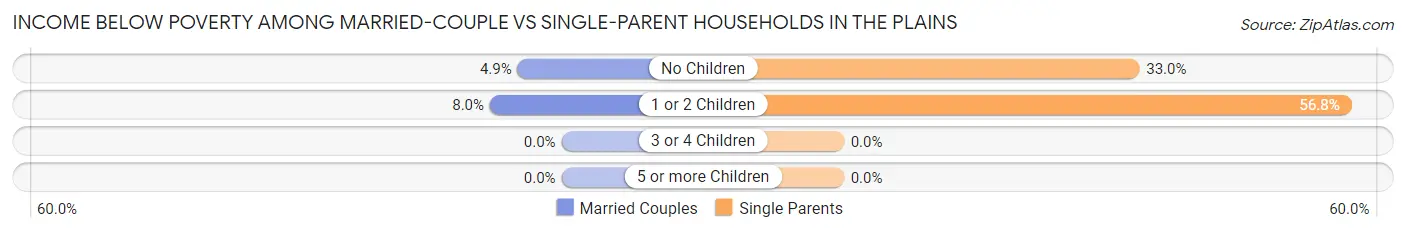
Income Below Poverty Among Married-Couple vs Single-Parent Households in The Plains
The poverty data for The Plains shows that 25 of the married-couple family households (5.4%) and 79 of the single-parent households (42.5%) are living below the poverty level. Within the married-couple family households, those with 1 or 2 children have the highest poverty rate, with 6 households (8.0%) falling below the poverty line. Among the single-parent households, those with 1 or 2 children have the highest poverty rate, with 42 household (56.8%) living below poverty.
| Children | Married-Couple Families | Single-Parent Households |
| No Children | 19 (4.9%) | 37 (33.0%) |
| 1 or 2 Children | 6 (8.0%) | 42 (56.8%) |
| 3 or 4 Children | 0 (0.0%) | 0 (0.0%) |
| 5 or more Children | 0 (0.0%) | 0 (0.0%) |
| Total | 25 (5.4%) | 79 (42.5%) |
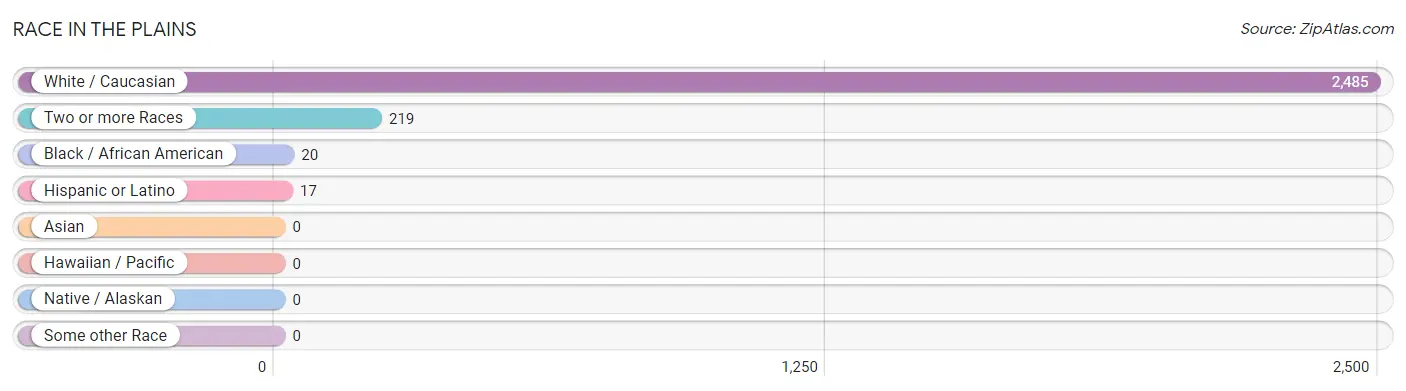
Race in The Plains
The most populous races in The Plains are White / Caucasian (2,485 | 91.2%), Two or more Races (219 | 8.0%), and Black / African American (20 | 0.7%).
| Race | # Population | % Population |
| Asian | 0 | 0.0% |
| Black / African American | 20 | 0.7% |
| Hawaiian / Pacific | 0 | 0.0% |
| Hispanic or Latino | 17 | 0.6% |
| Native / Alaskan | 0 | 0.0% |
| White / Caucasian | 2,485 | 91.2% |
| Two or more Races | 219 | 8.0% |
| Some other Race | 0 | 0.0% |
| Total | 2,724 | 100.0% |
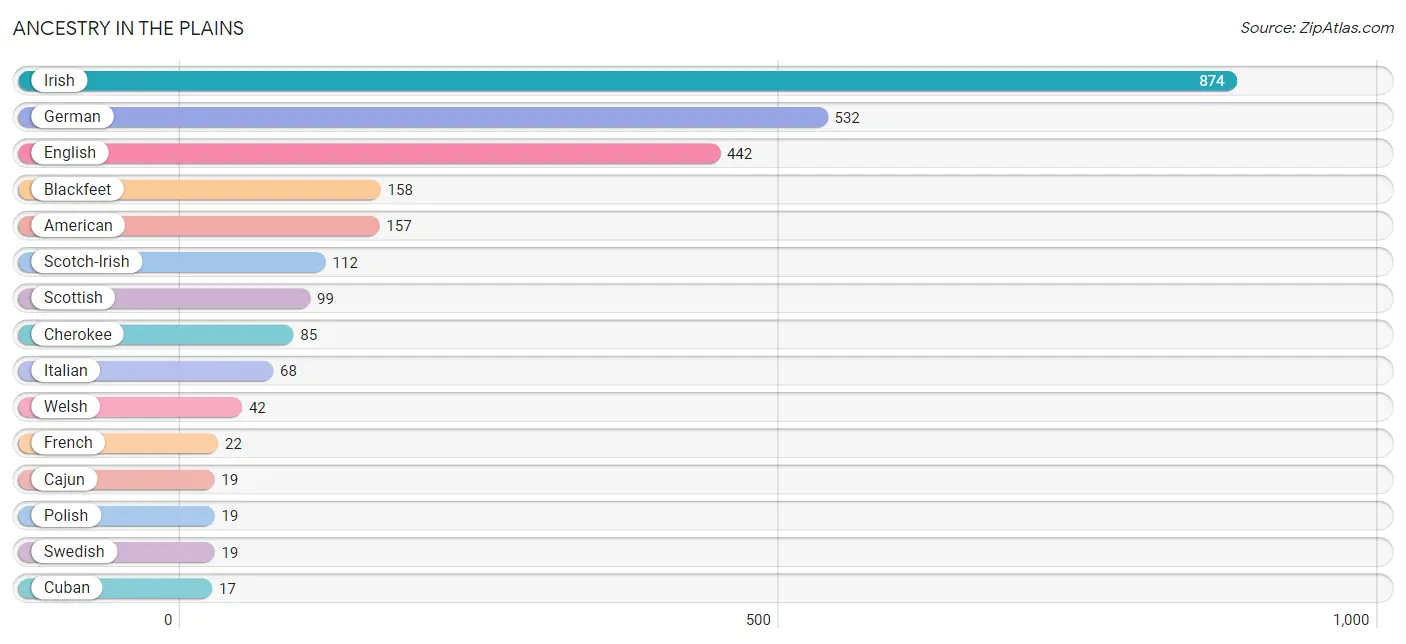
Ancestry in The Plains
The most populous ancestries reported in The Plains are Irish (874 | 32.1%), German (532 | 19.5%), English (442 | 16.2%), Blackfeet (158 | 5.8%), and American (157 | 5.8%), together accounting for 79.4% of all The Plains residents.
| Ancestry | # Population | % Population |
| American | 157 | 5.8% |
| Blackfeet | 158 | 5.8% |
| Cajun | 19 | 0.7% |
| Cherokee | 85 | 3.1% |
| Cuban | 17 | 0.6% |
| Czechoslovakian | 10 | 0.4% |
| Dutch | 2 | 0.1% |
| English | 442 | 16.2% |
| French | 22 | 0.8% |
| German | 532 | 19.5% |
| Irish | 874 | 32.1% |
| Italian | 68 | 2.5% |
| Polish | 19 | 0.7% |
| Scandinavian | 13 | 0.5% |
| Scotch-Irish | 112 | 4.1% |
| Scottish | 99 | 3.6% |
| Slovak | 9 | 0.3% |
| Swedish | 19 | 0.7% |
| Welsh | 42 | 1.5% | View All 19 Rows |
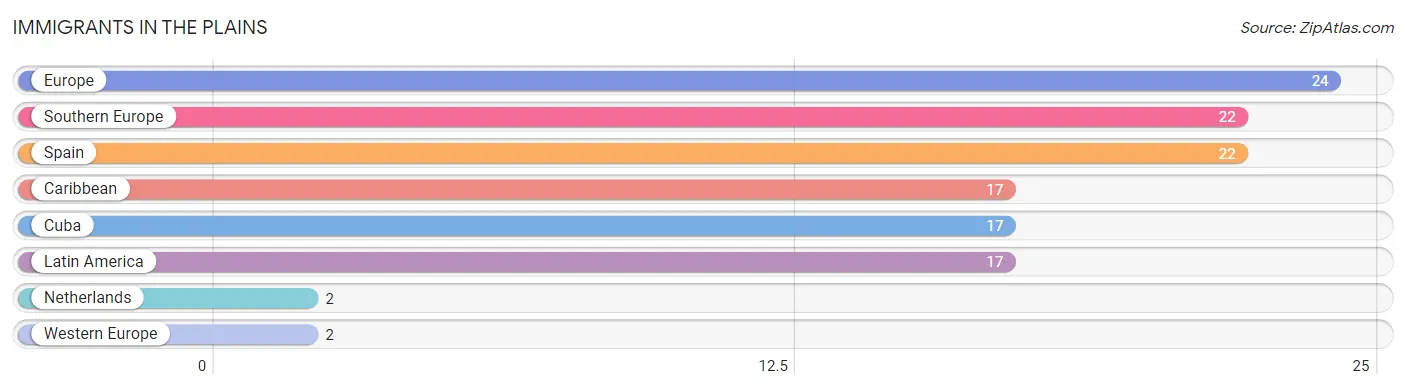
Immigrants in The Plains
The most numerous immigrant groups reported in The Plains came from Europe (24 | 0.9%), Southern Europe (22 | 0.8%), Spain (22 | 0.8%), Caribbean (17 | 0.6%), and Cuba (17 | 0.6%), together accounting for 3.7% of all The Plains residents.
| Immigration Origin | # Population | % Population |
| Caribbean | 17 | 0.6% |
| Cuba | 17 | 0.6% |
| Europe | 24 | 0.9% |
| Latin America | 17 | 0.6% |
| Netherlands | 2 | 0.1% |
| Southern Europe | 22 | 0.8% |
| Spain | 22 | 0.8% |
| Western Europe | 2 | 0.1% | View All 8 Rows |
Sex and Age in The Plains
Sex and Age in The Plains
The most populous age groups in The Plains are 60 to 64 Years (201 | 17.0%) for men and 70 to 74 Years (322 | 20.9%) for women.
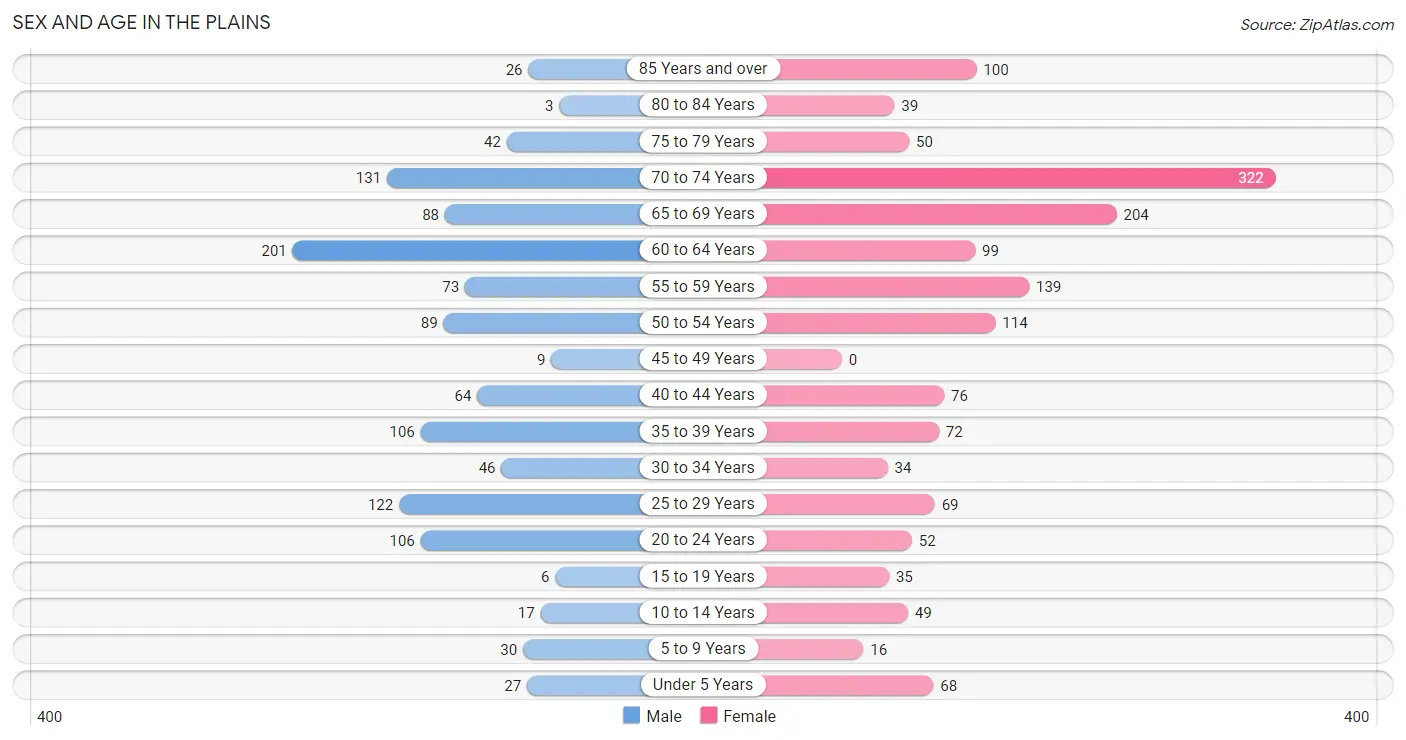
| Age Bracket | Male | Female |
| Under 5 Years | 27 (2.3%) | 68 (4.4%) |
| 5 to 9 Years | 30 (2.5%) | 16 (1.0%) |
| 10 to 14 Years | 17 (1.4%) | 49 (3.2%) |
| 15 to 19 Years | 6 (0.5%) | 35 (2.3%) |
| 20 to 24 Years | 106 (8.9%) | 52 (3.4%) |
| 25 to 29 Years | 122 (10.3%) | 69 (4.5%) |
| 30 to 34 Years | 46 (3.9%) | 34 (2.2%) |
| 35 to 39 Years | 106 (8.9%) | 72 (4.7%) |
| 40 to 44 Years | 64 (5.4%) | 76 (4.9%) |
| 45 to 49 Years | 9 (0.8%) | 0 (0.0%) |
| 50 to 54 Years | 89 (7.5%) | 114 (7.4%) |
| 55 to 59 Years | 73 (6.2%) | 139 (9.0%) |
| 60 to 64 Years | 201 (17.0%) | 99 (6.4%) |
| 65 to 69 Years | 88 (7.4%) | 204 (13.3%) |
| 70 to 74 Years | 131 (11.1%) | 322 (20.9%) |
| 75 to 79 Years | 42 (3.5%) | 50 (3.3%) |
| 80 to 84 Years | 3 (0.3%) | 39 (2.5%) |
| 85 Years and over | 26 (2.2%) | 100 (6.5%) |
| Total | 1,186 (100.0%) | 1,538 (100.0%) |
Families and Households in The Plains
Median Family Size in The Plains
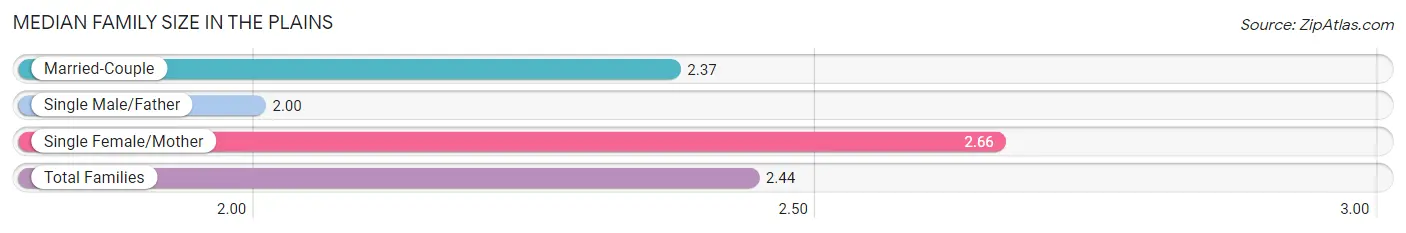
The median family size in The Plains is 2.44 persons per family, with single female/mother families (171 | 26.4%) accounting for the largest median family size of 2.66 persons per family. On the other hand, single male/father families (15 | 2.3%) represent the smallest median family size with 2.00 persons per family.
| Family Type | # Families | Family Size |
| Married-Couple | 462 (71.3%) | 2.37 |
| Single Male/Father | 15 (2.3%) | 2.00 |
| Single Female/Mother | 171 (26.4%) | 2.66 |
| Total Families | 648 (100.0%) | 2.44 |
Median Household Size in The Plains
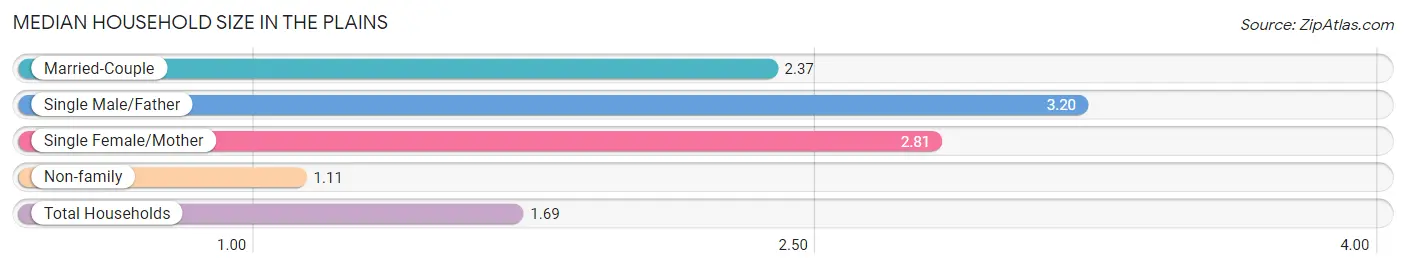
The median household size in The Plains is 1.69 persons per household, with single male/father households (15 | 1.0%) accounting for the largest median household size of 3.2 persons per household. non-family households (906 | 58.3%) represent the smallest median household size with 1.11 persons per household.
| Household Type | # Households | Household Size |
| Married-Couple | 462 (29.7%) | 2.37 |
| Single Male/Father | 15 (1.0%) | 3.20 |
| Single Female/Mother | 171 (11.0%) | 2.81 |
| Non-family | 906 (58.3%) | 1.11 |
| Total Households | 1,554 (100.0%) | 1.69 |
Household Size by Marriage Status in The Plains
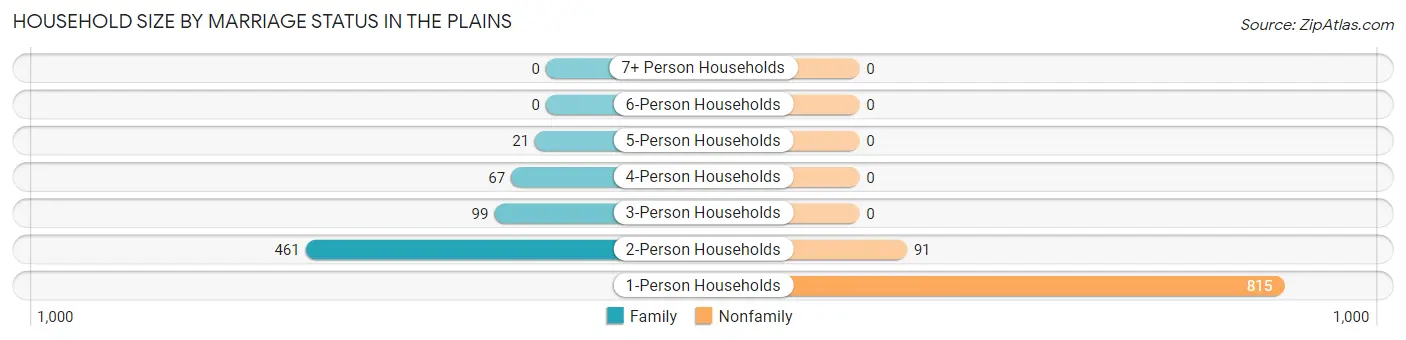
Out of a total of 1,554 households in The Plains, 648 (41.7%) are family households, while 906 (58.3%) are nonfamily households. The most numerous type of family households are 2-person households, comprising 461, and the most common type of nonfamily households are 1-person households, comprising 815.
| Household Size | Family Households | Nonfamily Households |
| 1-Person Households | - | 815 (52.4%) |
| 2-Person Households | 461 (29.7%) | 91 (5.9%) |
| 3-Person Households | 99 (6.4%) | 0 (0.0%) |
| 4-Person Households | 67 (4.3%) | 0 (0.0%) |
| 5-Person Households | 21 (1.3%) | 0 (0.0%) |
| 6-Person Households | 0 (0.0%) | 0 (0.0%) |
| 7+ Person Households | 0 (0.0%) | 0 (0.0%) |
| Total | 648 (41.7%) | 906 (58.3%) |
Female Fertility in The Plains
Fertility by Age in The Plains
| Age Bracket | Women with Births | Births / 1,000 Women |
| 15 to 19 years | 0 (0.0%) | 0.0 |
| 20 to 34 years | 0 (0.0%) | 0.0 |
| 35 to 50 years | 0 (0.0%) | 0.0 |
| Total | 0 (0.0%) | 0.0 |
Fertility by Age by Marriage Status in The Plains
| Age Bracket | Married | Unmarried |
| 15 to 19 years | 0 (0.0%) | 0 (0.0%) |
| 20 to 34 years | 0 (0.0%) | 0 (0.0%) |
| 35 to 50 years | 0 (0.0%) | 0 (0.0%) |
| Total | 0 (0.0%) | 0 (0.0%) |
Fertility by Education in The Plains
| Educational Attainment | Women with Births | Births / 1,000 Women |
| Less than High School | 0 (0.0%) | 0.0 |
| High School Diploma | 0 (0.0%) | 0.0 |
| College or Associate's Degree | 0 (0.0%) | 0.0 |
| Bachelor's Degree | 0 (0.0%) | 0.0 |
| Graduate Degree | 0 (0.0%) | 0.0 |
| Total | 0 (0.0%) | 0.0 |
Fertility by Education by Marriage Status in The Plains
| Educational Attainment | Married | Unmarried |
| Less than High School | 0 (0.0%) | 0 (0.0%) |
| High School Diploma | 0 (0.0%) | 0 (0.0%) |
| College or Associate's Degree | 0 (0.0%) | 0 (0.0%) |
| Bachelor's Degree | 0 (0.0%) | 0 (0.0%) |
| Graduate Degree | 0 (0.0%) | 0 (0.0%) |
| Total | 0 (0.0%) | 0 (0.0%) |
Employment Characteristics in The Plains
Employment by Class of Employer in The Plains
Among the 1,033 employed individuals in The Plains, private company employees (407 | 39.4%), local government employees (205 | 19.9%), and not-for-profit organizations (157 | 15.2%) make up the most common classes of employment.
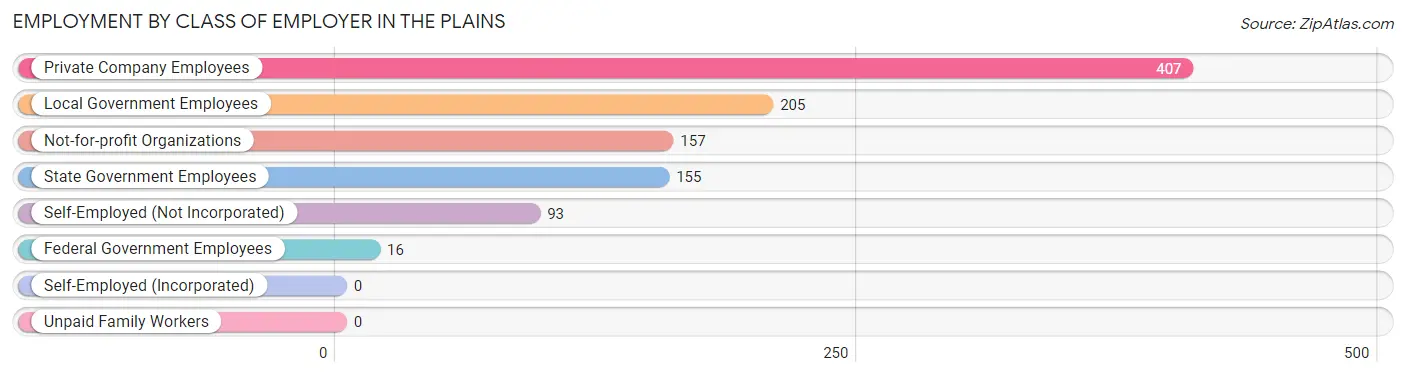
| Employer Class | # Employees | % Employees |
| Private Company Employees | 407 | 39.4% |
| Self-Employed (Incorporated) | 0 | 0.0% |
| Self-Employed (Not Incorporated) | 93 | 9.0% |
| Not-for-profit Organizations | 157 | 15.2% |
| Local Government Employees | 205 | 19.9% |
| State Government Employees | 155 | 15.0% |
| Federal Government Employees | 16 | 1.5% |
| Unpaid Family Workers | 0 | 0.0% |
| Total | 1,033 | 100.0% |
Employment Status by Age in The Plains
According to the labor force statistics for The Plains, out of the total population over 16 years of age (2,517), 43.3% or 1,090 individuals are in the labor force, with 5.3% or 58 of them unemployed. The age group with the highest labor force participation rate is 25 to 29 years, with 93.2% or 178 individuals in the labor force. Within the labor force, the 16 to 19 years age range has the highest percentage of unemployed individuals, with 44.4% or 12 of them being unemployed.
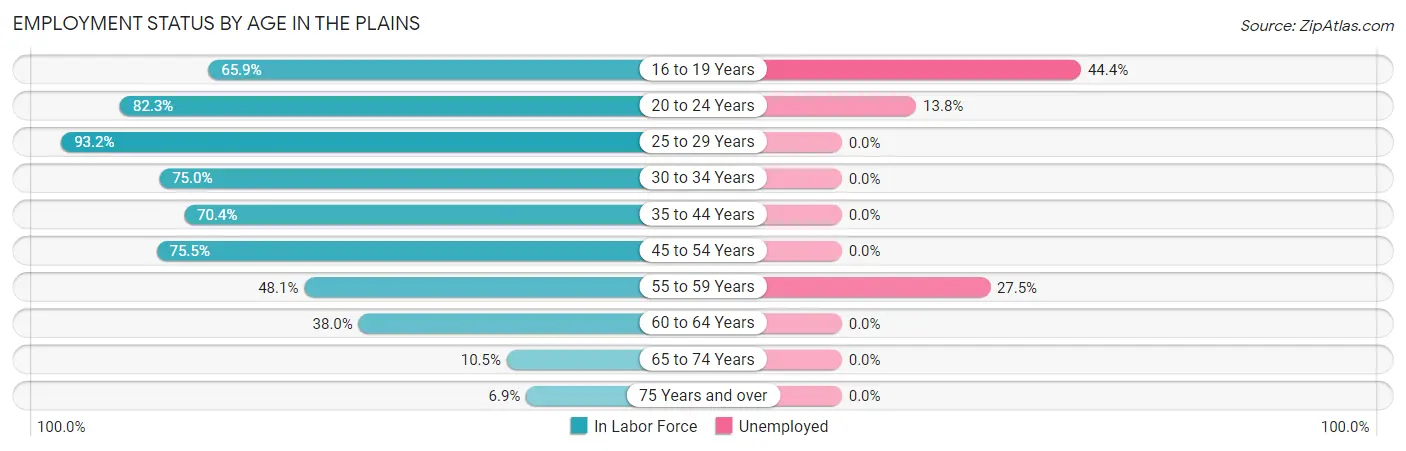
| Age Bracket | In Labor Force | Unemployed |
| 16 to 19 Years | 27 (65.9%) | 12 (44.4%) |
| 20 to 24 Years | 130 (82.3%) | 18 (13.8%) |
| 25 to 29 Years | 178 (93.2%) | 0 (0.0%) |
| 30 to 34 Years | 60 (75.0%) | 0 (0.0%) |
| 35 to 44 Years | 224 (70.4%) | 0 (0.0%) |
| 45 to 54 Years | 160 (75.5%) | 0 (0.0%) |
| 55 to 59 Years | 102 (48.1%) | 28 (27.5%) |
| 60 to 64 Years | 114 (38.0%) | 0 (0.0%) |
| 65 to 74 Years | 78 (10.5%) | 0 (0.0%) |
| 75 Years and over | 18 (6.9%) | 0 (0.0%) |
| Total | 1,090 (43.3%) | 58 (5.3%) |
Employment Status by Educational Attainment in The Plains
According to labor force statistics for The Plains, 63.8% of individuals (838) out of the total population between 25 and 64 years of age (1,313) are in the labor force, with 3.3% or 28 of them being unemployed. The group with the highest labor force participation rate are those with the educational attainment of bachelor's degree or higher, with 85.8% or 393 individuals in the labor force. Within the labor force, individuals with less than high school education have the highest percentage of unemployment, with 32.6% or 15 of them being unemployed.
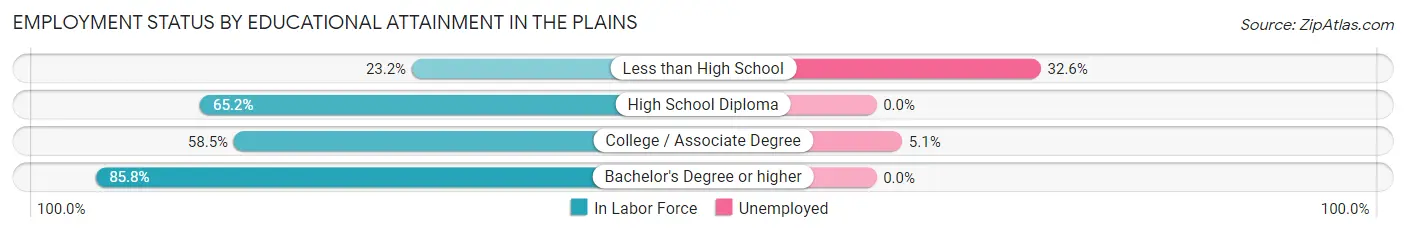
| Educational Attainment | In Labor Force | Unemployed |
| Less than High School | 46 (23.2%) | 65 (32.6%) |
| High School Diploma | 144 (65.2%) | 0 (0.0%) |
| College / Associate Degree | 255 (58.5%) | 22 (5.1%) |
| Bachelor's Degree or higher | 393 (85.8%) | 0 (0.0%) |
| Total | 838 (63.8%) | 43 (3.3%) |
Employment Occupations by Sex in The Plains
Management, Business, Science and Arts Occupations
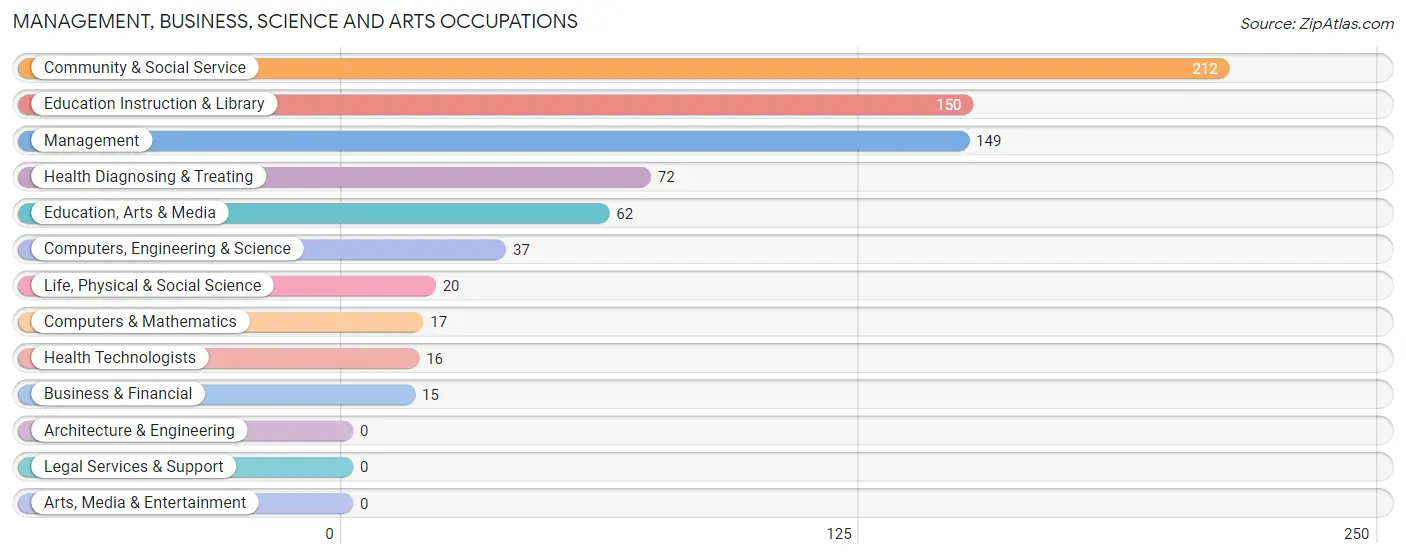
The most common Management, Business, Science and Arts occupations in The Plains are Community & Social Service (212 | 20.5%), Education Instruction & Library (150 | 14.5%), Management (149 | 14.4%), Health Diagnosing & Treating (72 | 7.0%), and Education, Arts & Media (62 | 6.0%).
Management, Business, Science and Arts Occupations by Sex
Within the Management, Business, Science and Arts occupations in The Plains, the most male-oriented occupations are Management (100.0%), Business & Financial (100.0%), and Life, Physical & Social Science (100.0%), while the most female-oriented occupations are Computers & Mathematics (100.0%), Health Diagnosing & Treating (77.8%), and Computers, Engineering & Science (46.0%).
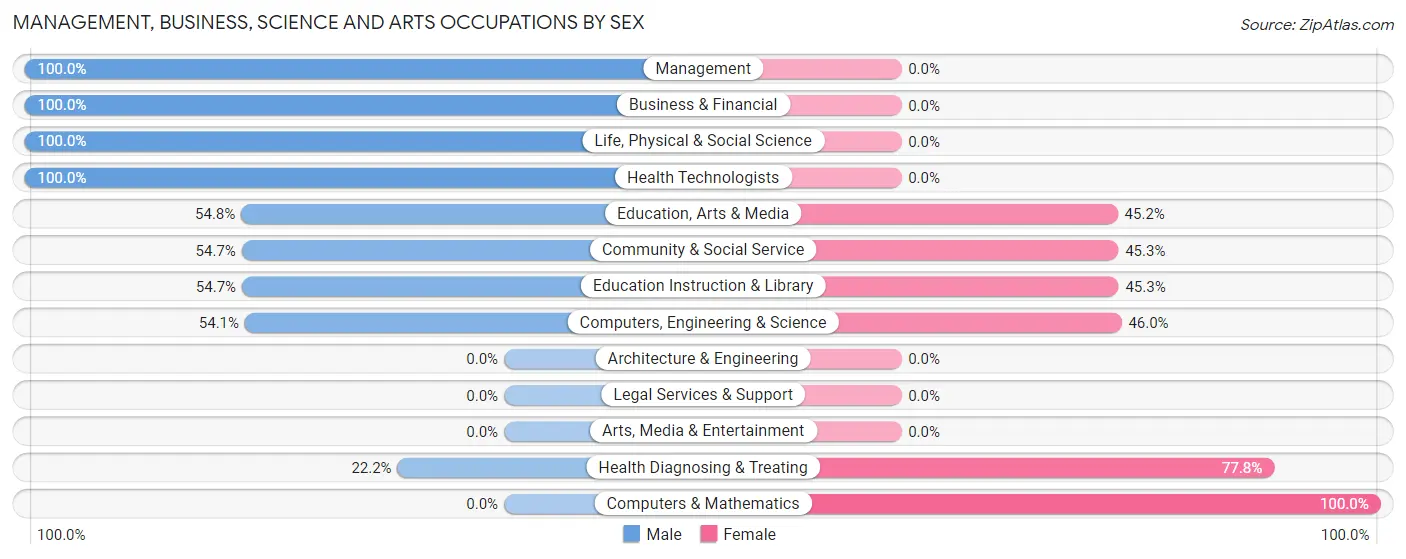
| Occupation | Male | Female |
| Management | 149 (100.0%) | 0 (0.0%) |
| Business & Financial | 15 (100.0%) | 0 (0.0%) |
| Computers, Engineering & Science | 20 (54.0%) | 17 (46.0%) |
| Computers & Mathematics | 0 (0.0%) | 17 (100.0%) |
| Architecture & Engineering | 0 (0.0%) | 0 (0.0%) |
| Life, Physical & Social Science | 20 (100.0%) | 0 (0.0%) |
| Community & Social Service | 116 (54.7%) | 96 (45.3%) |
| Education, Arts & Media | 34 (54.8%) | 28 (45.2%) |
| Legal Services & Support | 0 (0.0%) | 0 (0.0%) |
| Education Instruction & Library | 82 (54.7%) | 68 (45.3%) |
| Arts, Media & Entertainment | 0 (0.0%) | 0 (0.0%) |
| Health Diagnosing & Treating | 16 (22.2%) | 56 (77.8%) |
| Health Technologists | 16 (100.0%) | 0 (0.0%) |
| Total (Category) | 316 (65.1%) | 169 (34.8%) |
| Total (Overall) | 590 (57.1%) | 443 (42.9%) |
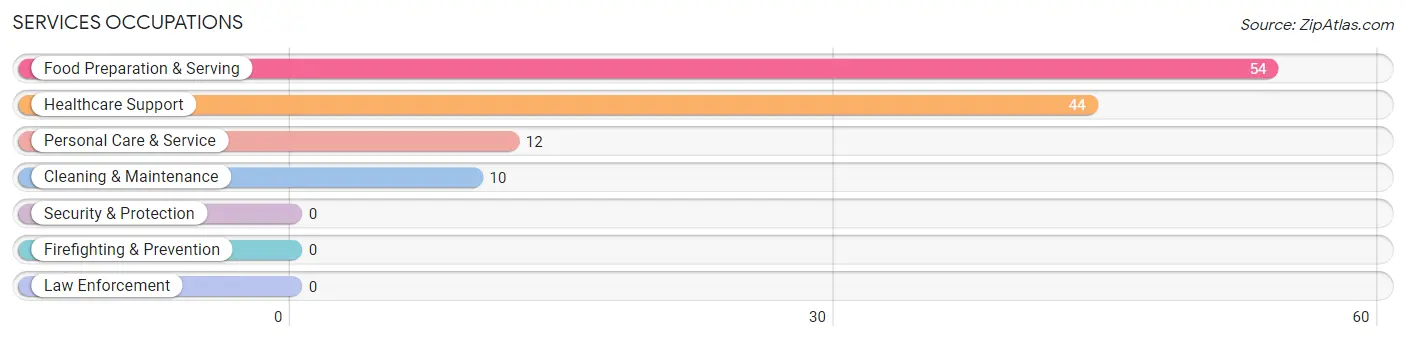
Services Occupations
The most common Services occupations in The Plains are Food Preparation & Serving (54 | 5.2%), Healthcare Support (44 | 4.3%), Personal Care & Service (12 | 1.2%), and Cleaning & Maintenance (10 | 1.0%).
Services Occupations by Sex
Within the Services occupations in The Plains, the most male-oriented occupations are Healthcare Support (100.0%), and Cleaning & Maintenance (100.0%), while the most female-oriented occupations are Food Preparation & Serving (100.0%), and Personal Care & Service (100.0%).
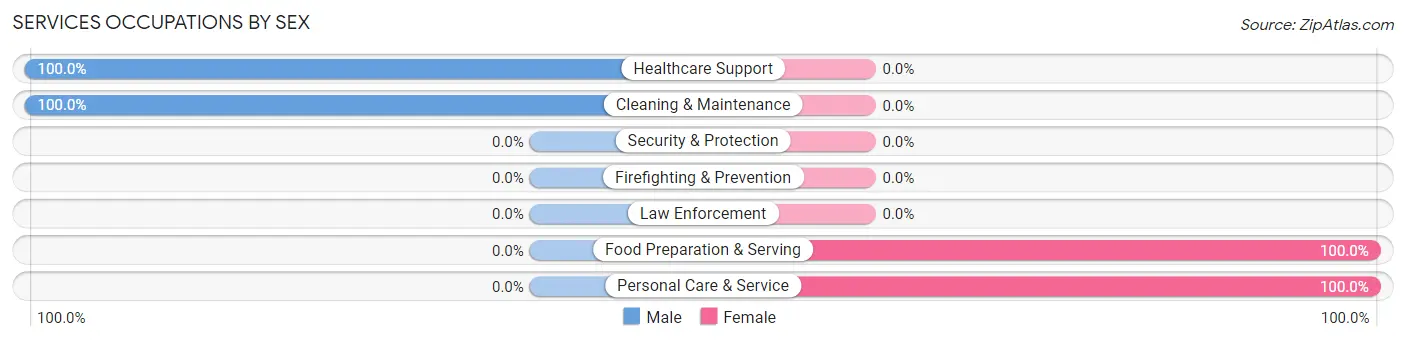
| Occupation | Male | Female |
| Healthcare Support | 44 (100.0%) | 0 (0.0%) |
| Security & Protection | 0 (0.0%) | 0 (0.0%) |
| Firefighting & Prevention | 0 (0.0%) | 0 (0.0%) |
| Law Enforcement | 0 (0.0%) | 0 (0.0%) |
| Food Preparation & Serving | 0 (0.0%) | 54 (100.0%) |
| Cleaning & Maintenance | 10 (100.0%) | 0 (0.0%) |
| Personal Care & Service | 0 (0.0%) | 12 (100.0%) |
| Total (Category) | 54 (45.0%) | 66 (55.0%) |
| Total (Overall) | 590 (57.1%) | 443 (42.9%) |
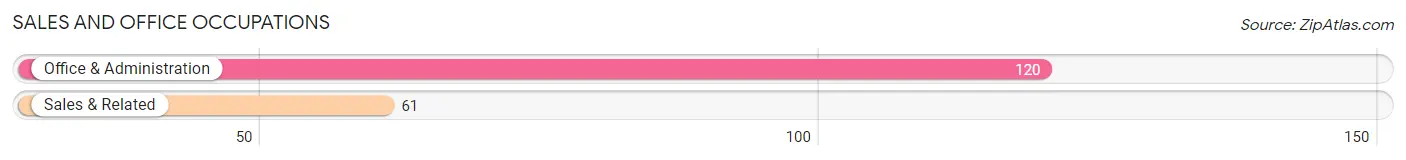
Sales and Office Occupations
The most common Sales and Office occupations in The Plains are Office & Administration (120 | 11.6%), and Sales & Related (61 | 5.9%).
Sales and Office Occupations by Sex
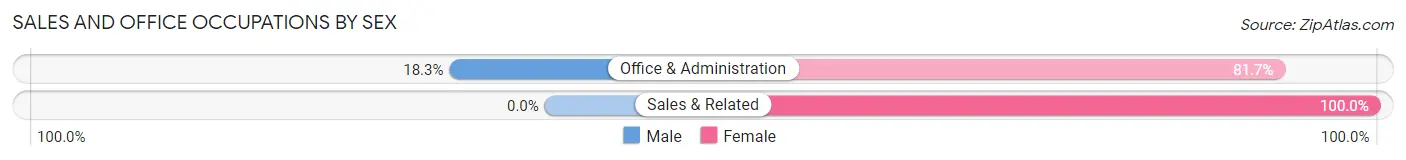
| Occupation | Male | Female |
| Sales & Related | 0 (0.0%) | 61 (100.0%) |
| Office & Administration | 22 (18.3%) | 98 (81.7%) |
| Total (Category) | 22 (12.1%) | 159 (87.8%) |
| Total (Overall) | 590 (57.1%) | 443 (42.9%) |
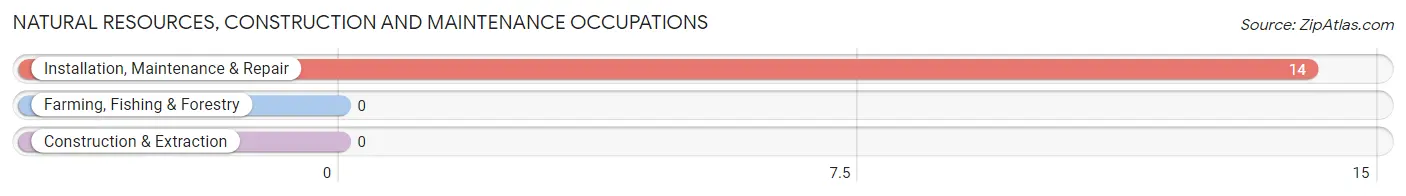
Natural Resources, Construction and Maintenance Occupations
The most common Natural Resources, Construction and Maintenance occupations in The Plains are , and Installation, Maintenance & Repair (14 | 1.4%).
Natural Resources, Construction and Maintenance Occupations by Sex
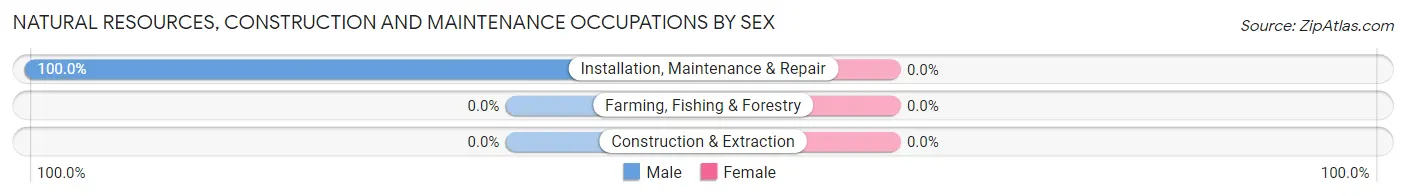
| Occupation | Male | Female |
| Farming, Fishing & Forestry | 0 (0.0%) | 0 (0.0%) |
| Construction & Extraction | 0 (0.0%) | 0 (0.0%) |
| Installation, Maintenance & Repair | 14 (100.0%) | 0 (0.0%) |
| Total (Category) | 14 (100.0%) | 0 (0.0%) |
| Total (Overall) | 590 (57.1%) | 443 (42.9%) |
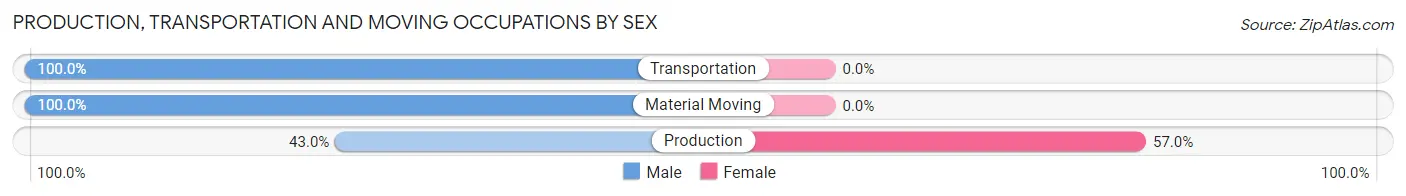
Production, Transportation and Moving Occupations
The most common Production, Transportation and Moving occupations in The Plains are Production (86 | 8.3%), Material Moving (78 | 7.5%), and Transportation (69 | 6.7%).
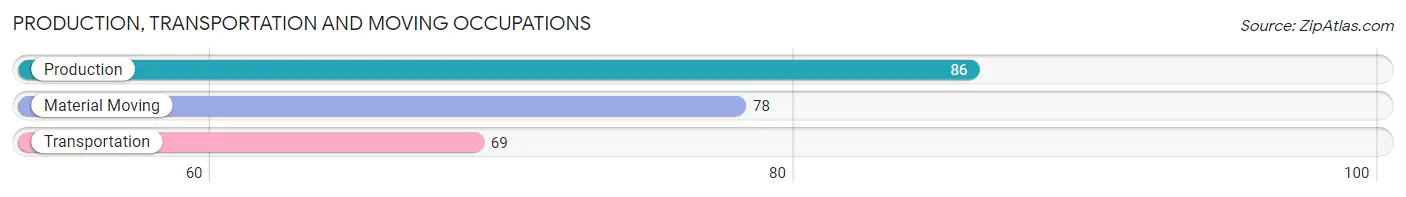
Production, Transportation and Moving Occupations by Sex
| Occupation | Male | Female |
| Production | 37 (43.0%) | 49 (57.0%) |
| Transportation | 69 (100.0%) | 0 (0.0%) |
| Material Moving | 78 (100.0%) | 0 (0.0%) |
| Total (Category) | 184 (79.0%) | 49 (21.0%) |
| Total (Overall) | 590 (57.1%) | 443 (42.9%) |
Employment Industries by Sex in The Plains
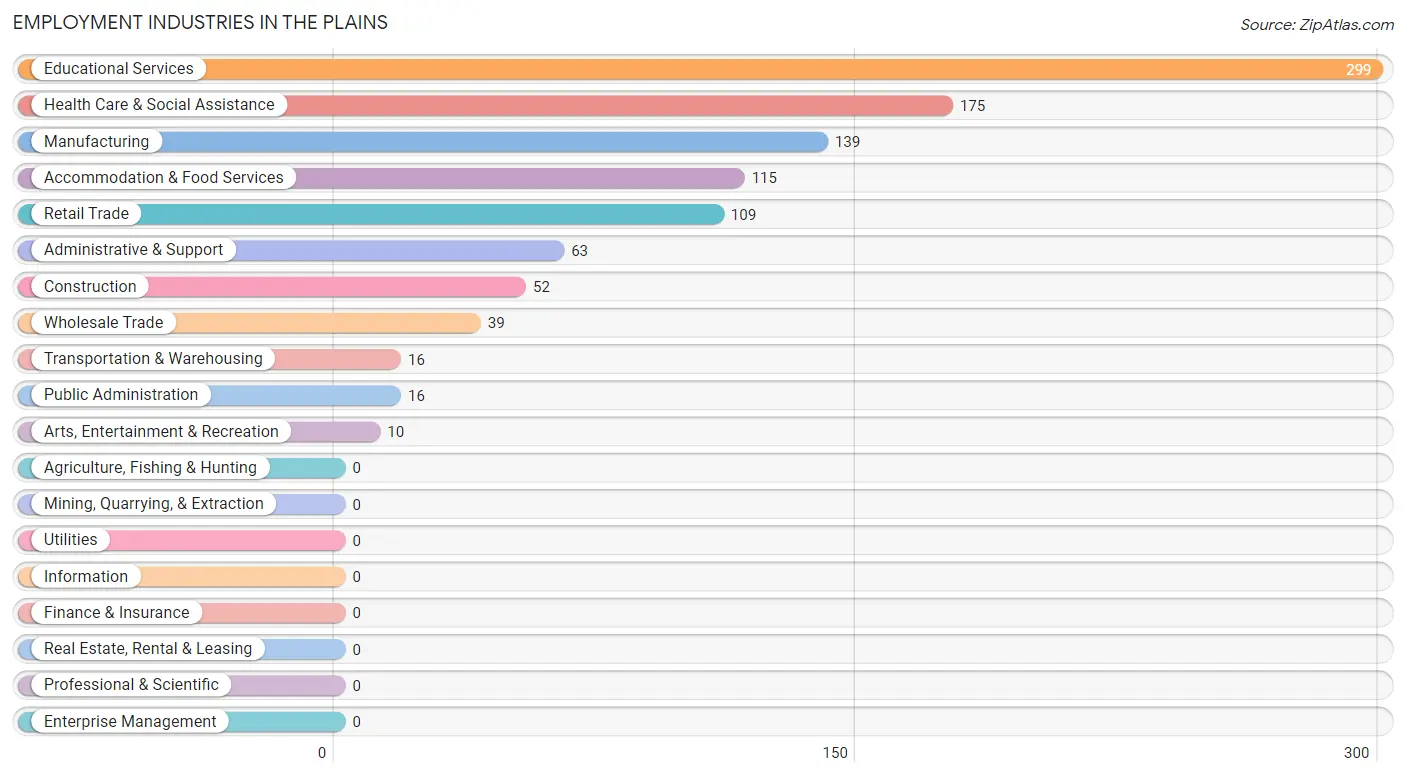
Employment Industries in The Plains
The major employment industries in The Plains include Educational Services (299 | 28.9%), Health Care & Social Assistance (175 | 16.9%), Manufacturing (139 | 13.5%), Accommodation & Food Services (115 | 11.1%), and Retail Trade (109 | 10.5%).
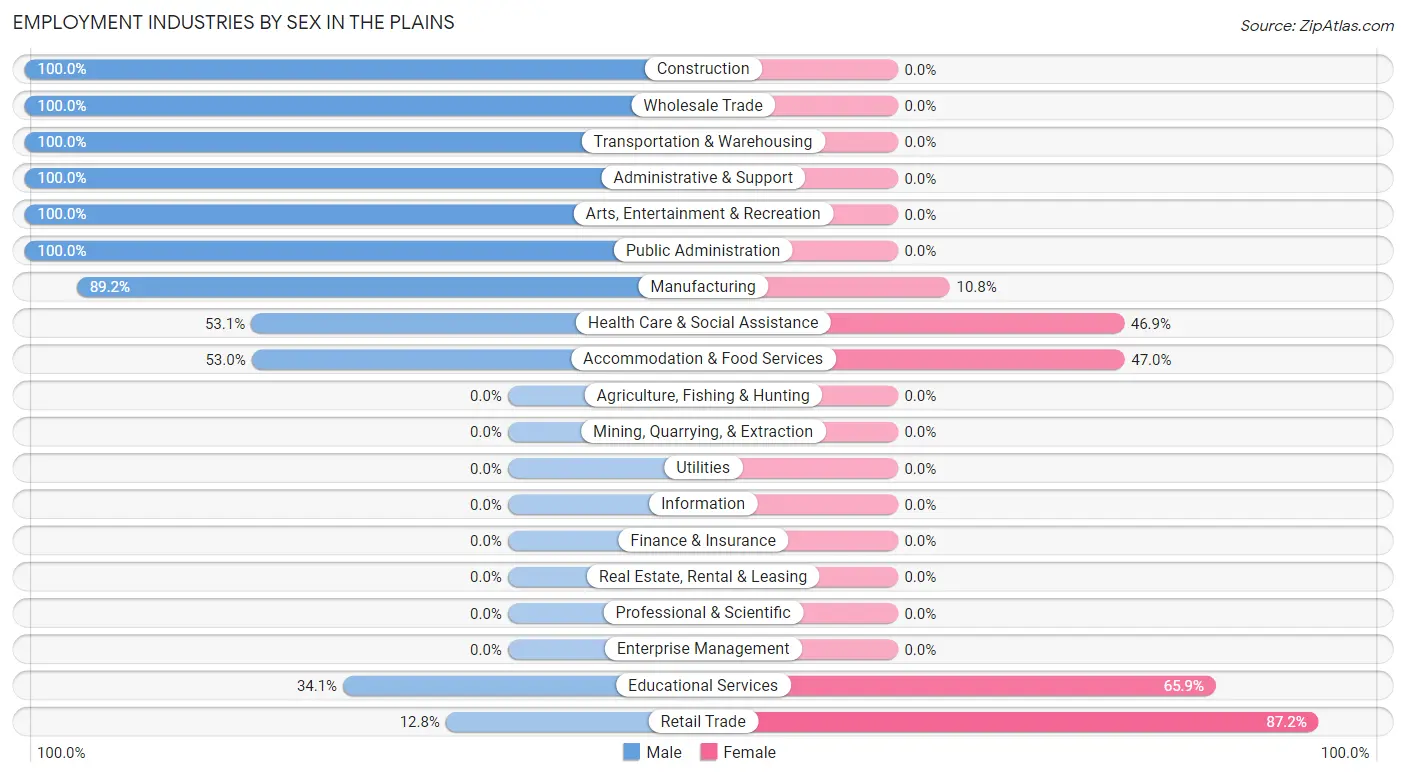
Employment Industries by Sex in The Plains
The The Plains industries that see more men than women are Construction (100.0%), Wholesale Trade (100.0%), and Transportation & Warehousing (100.0%), whereas the industries that tend to have a higher number of women are Retail Trade (87.2%), Educational Services (65.9%), and Accommodation & Food Services (47.0%).
| Industry | Male | Female |
| Agriculture, Fishing & Hunting | 0 (0.0%) | 0 (0.0%) |
| Mining, Quarrying, & Extraction | 0 (0.0%) | 0 (0.0%) |
| Construction | 52 (100.0%) | 0 (0.0%) |
| Manufacturing | 124 (89.2%) | 15 (10.8%) |
| Wholesale Trade | 39 (100.0%) | 0 (0.0%) |
| Retail Trade | 14 (12.8%) | 95 (87.2%) |
| Transportation & Warehousing | 16 (100.0%) | 0 (0.0%) |
| Utilities | 0 (0.0%) | 0 (0.0%) |
| Information | 0 (0.0%) | 0 (0.0%) |
| Finance & Insurance | 0 (0.0%) | 0 (0.0%) |
| Real Estate, Rental & Leasing | 0 (0.0%) | 0 (0.0%) |
| Professional & Scientific | 0 (0.0%) | 0 (0.0%) |
| Enterprise Management | 0 (0.0%) | 0 (0.0%) |
| Administrative & Support | 63 (100.0%) | 0 (0.0%) |
| Educational Services | 102 (34.1%) | 197 (65.9%) |
| Health Care & Social Assistance | 93 (53.1%) | 82 (46.9%) |
| Arts, Entertainment & Recreation | 10 (100.0%) | 0 (0.0%) |
| Accommodation & Food Services | 61 (53.0%) | 54 (47.0%) |
| Public Administration | 16 (100.0%) | 0 (0.0%) |
| Total | 590 (57.1%) | 443 (42.9%) |
Education in The Plains
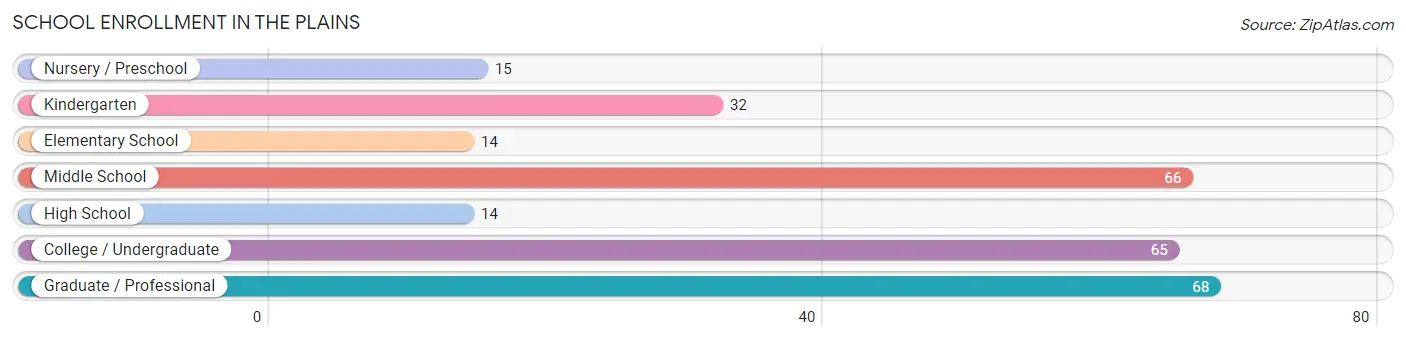
School Enrollment in The Plains
The most common levels of schooling among the 274 students in The Plains are graduate / professional (68 | 24.8%), middle school (66 | 24.1%), and college / undergraduate (65 | 23.7%).
| School Level | # Students | % Students |
| Nursery / Preschool | 15 | 5.5% |
| Kindergarten | 32 | 11.7% |
| Elementary School | 14 | 5.1% |
| Middle School | 66 | 24.1% |
| High School | 14 | 5.1% |
| College / Undergraduate | 65 | 23.7% |
| Graduate / Professional | 68 | 24.8% |
| Total | 274 | 100.0% |
School Enrollment by Age by Funding Source in The Plains
Out of a total of 274 students who are enrolled in schools in The Plains, 38 (13.9%) attend a private institution, while the remaining 236 (86.1%) are enrolled in public schools. The age group of 25 to 34 year olds has the highest likelihood of being enrolled in private schools, with 20 (57.1% in the age bracket) enrolled. Conversely, the age group of 3 to 4 year olds has the lowest likelihood of being enrolled in a private school, with 15 (100.0% in the age bracket) attending a public institution.
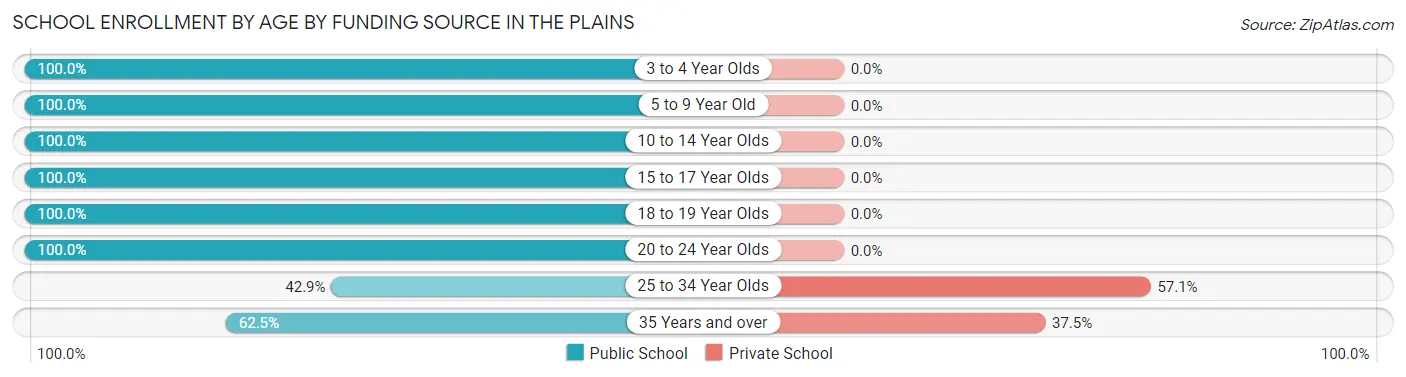
| Age Bracket | Public School | Private School |
| 3 to 4 Year Olds | 15 (100.0%) | 0 (0.0%) |
| 5 to 9 Year Old | 46 (100.0%) | 0 (0.0%) |
| 10 to 14 Year Olds | 66 (100.0%) | 0 (0.0%) |
| 15 to 17 Year Olds | 14 (100.0%) | 0 (0.0%) |
| 18 to 19 Year Olds | 12 (100.0%) | 0 (0.0%) |
| 20 to 24 Year Olds | 38 (100.0%) | 0 (0.0%) |
| 25 to 34 Year Olds | 15 (42.9%) | 20 (57.1%) |
| 35 Years and over | 30 (62.5%) | 18 (37.5%) |
| Total | 236 (86.1%) | 38 (13.9%) |
Educational Attainment by Field of Study in The Plains
Education (374 | 44.3%), business (91 | 10.8%), psychology (87 | 10.3%), engineering (79 | 9.4%), and literature & languages (54 | 6.4%) are the most common fields of study among 844 individuals in The Plains who have obtained a bachelor's degree or higher.
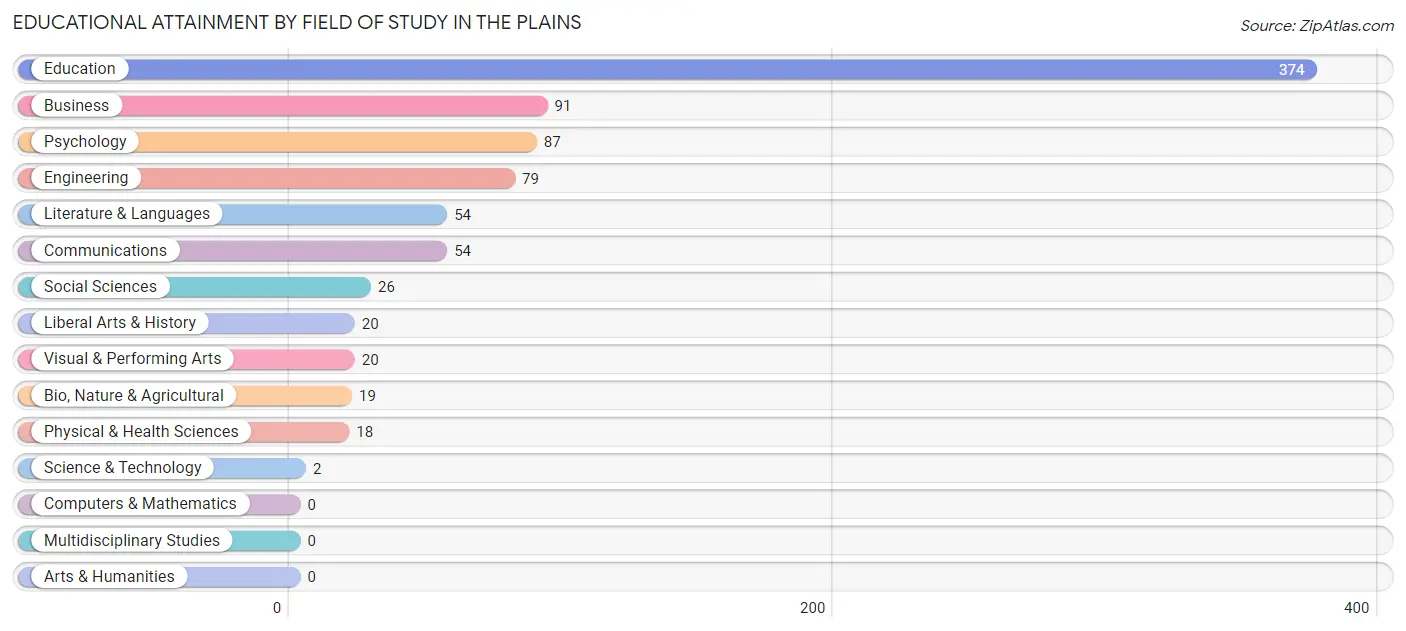
| Field of Study | # Graduates | % Graduates |
| Computers & Mathematics | 0 | 0.0% |
| Bio, Nature & Agricultural | 19 | 2.2% |
| Physical & Health Sciences | 18 | 2.1% |
| Psychology | 87 | 10.3% |
| Social Sciences | 26 | 3.1% |
| Engineering | 79 | 9.4% |
| Multidisciplinary Studies | 0 | 0.0% |
| Science & Technology | 2 | 0.2% |
| Business | 91 | 10.8% |
| Education | 374 | 44.3% |
| Literature & Languages | 54 | 6.4% |
| Liberal Arts & History | 20 | 2.4% |
| Visual & Performing Arts | 20 | 2.4% |
| Communications | 54 | 6.4% |
| Arts & Humanities | 0 | 0.0% |
| Total | 844 | 100.0% |
Transportation & Commute in The Plains
Vehicle Availability by Sex in The Plains
The most prevalent vehicle ownership categories in The Plains are males with 2 vehicles (238, accounting for 40.7%) and females with 2 vehicles (147, making up 53.7%).
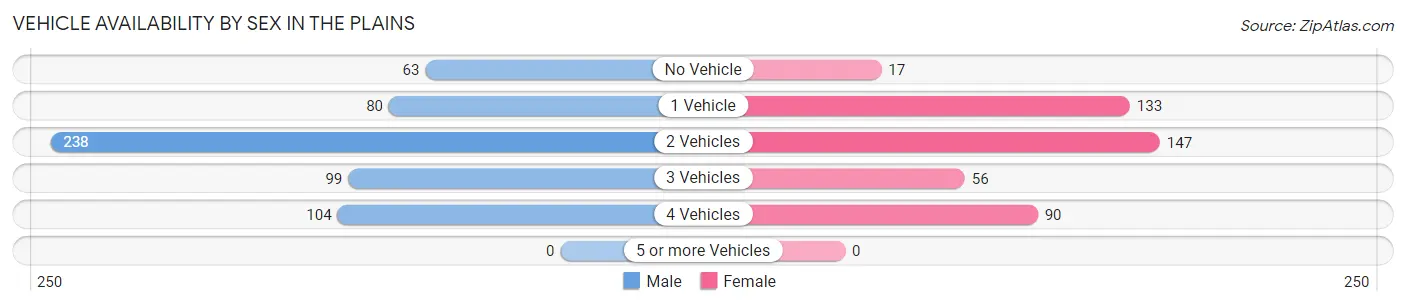
| Vehicles Available | Male | Female |
| No Vehicle | 63 (10.8%) | 17 (3.8%) |
| 1 Vehicle | 80 (13.7%) | 133 (30.0%) |
| 2 Vehicles | 238 (40.7%) | 147 (33.2%) |
| 3 Vehicles | 99 (17.0%) | 56 (12.6%) |
| 4 Vehicles | 104 (17.8%) | 90 (20.3%) |
| 5 or more Vehicles | 0 (0.0%) | 0 (0.0%) |
| Total | 584 (100.0%) | 443 (100.0%) |
Commute Time in The Plains
The most frequently occuring commute durations in The Plains are 10 to 14 minutes (292 commuters, 28.9%), 5 to 9 minutes (141 commuters, 14.0%), and 15 to 19 minutes (137 commuters, 13.6%).
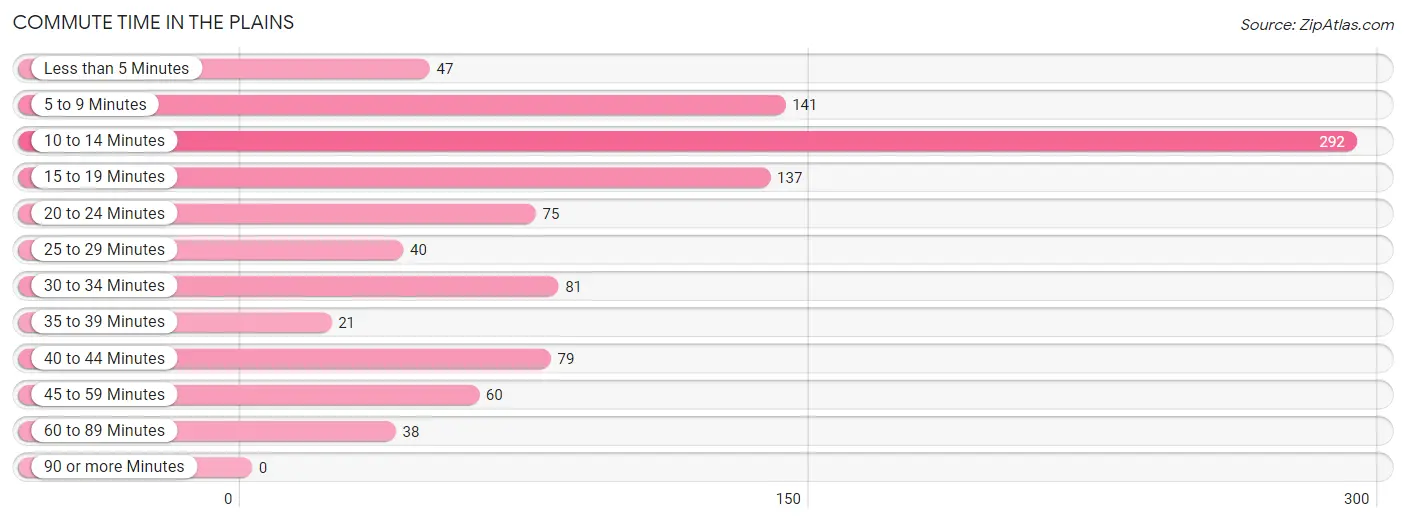
| Commute Time | # Commuters | % Commuters |
| Less than 5 Minutes | 47 | 4.6% |
| 5 to 9 Minutes | 141 | 14.0% |
| 10 to 14 Minutes | 292 | 28.9% |
| 15 to 19 Minutes | 137 | 13.6% |
| 20 to 24 Minutes | 75 | 7.4% |
| 25 to 29 Minutes | 40 | 4.0% |
| 30 to 34 Minutes | 81 | 8.0% |
| 35 to 39 Minutes | 21 | 2.1% |
| 40 to 44 Minutes | 79 | 7.8% |
| 45 to 59 Minutes | 60 | 5.9% |
| 60 to 89 Minutes | 38 | 3.8% |
| 90 or more Minutes | 0 | 0.0% |
Commute Time by Sex in The Plains
The most common commute times in The Plains are 10 to 14 minutes (189 commuters, 33.3%) for males and 10 to 14 minutes (103 commuters, 23.3%) for females.
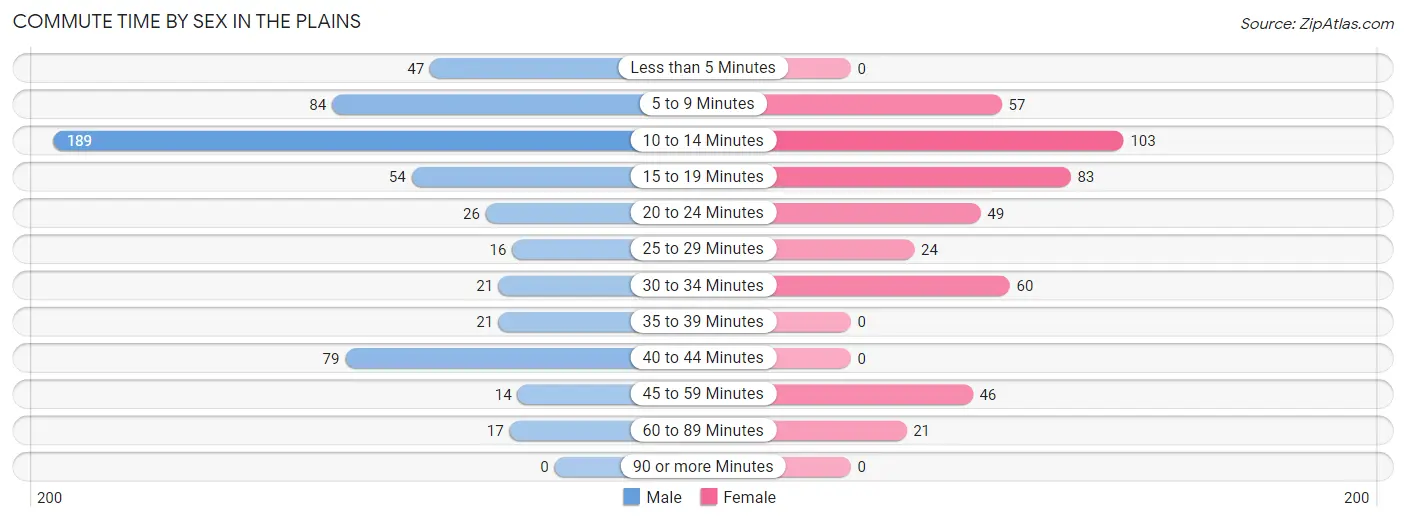
| Commute Time | Male | Female |
| Less than 5 Minutes | 47 (8.3%) | 0 (0.0%) |
| 5 to 9 Minutes | 84 (14.8%) | 57 (12.9%) |
| 10 to 14 Minutes | 189 (33.3%) | 103 (23.3%) |
| 15 to 19 Minutes | 54 (9.5%) | 83 (18.7%) |
| 20 to 24 Minutes | 26 (4.6%) | 49 (11.1%) |
| 25 to 29 Minutes | 16 (2.8%) | 24 (5.4%) |
| 30 to 34 Minutes | 21 (3.7%) | 60 (13.5%) |
| 35 to 39 Minutes | 21 (3.7%) | 0 (0.0%) |
| 40 to 44 Minutes | 79 (13.9%) | 0 (0.0%) |
| 45 to 59 Minutes | 14 (2.5%) | 46 (10.4%) |
| 60 to 89 Minutes | 17 (3.0%) | 21 (4.7%) |
| 90 or more Minutes | 0 (0.0%) | 0 (0.0%) |
Time of Departure to Work by Sex in The Plains
The most frequent times of departure to work in The Plains are 7:30 AM to 7:59 AM (147, 25.9%) for males and 8:00 AM to 8:29 AM (124, 28.0%) for females.
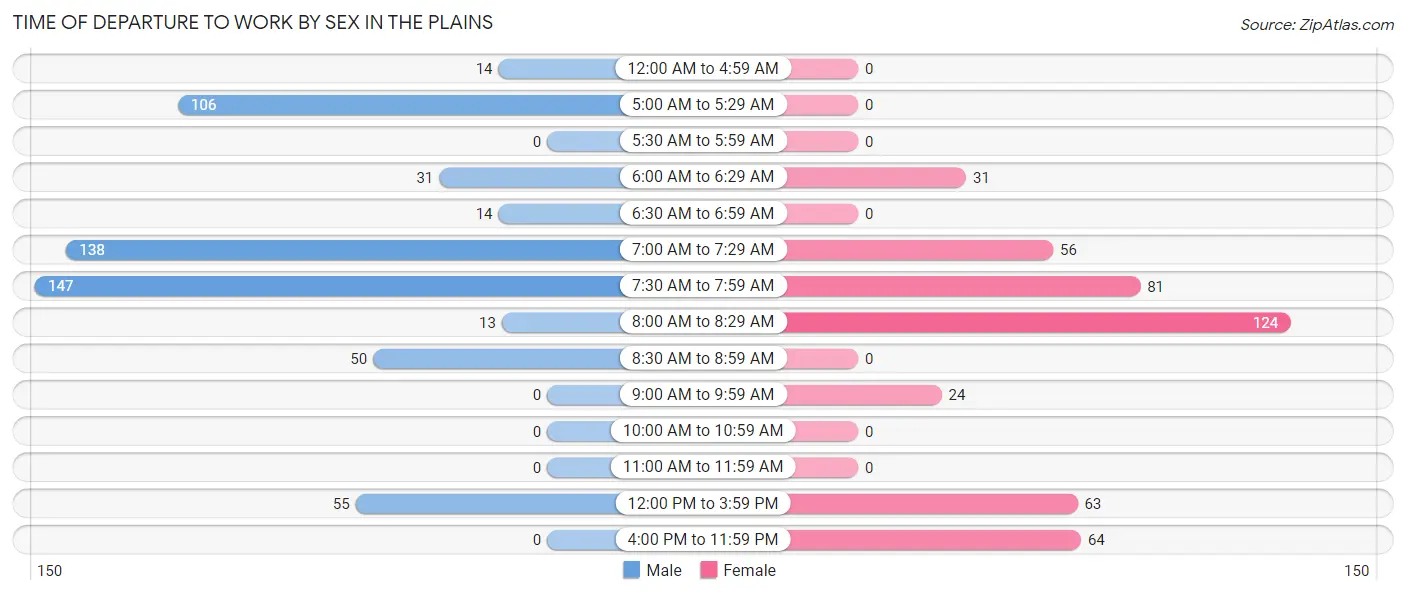
| Time of Departure | Male | Female |
| 12:00 AM to 4:59 AM | 14 (2.5%) | 0 (0.0%) |
| 5:00 AM to 5:29 AM | 106 (18.7%) | 0 (0.0%) |
| 5:30 AM to 5:59 AM | 0 (0.0%) | 0 (0.0%) |
| 6:00 AM to 6:29 AM | 31 (5.5%) | 31 (7.0%) |
| 6:30 AM to 6:59 AM | 14 (2.5%) | 0 (0.0%) |
| 7:00 AM to 7:29 AM | 138 (24.3%) | 56 (12.6%) |
| 7:30 AM to 7:59 AM | 147 (25.9%) | 81 (18.3%) |
| 8:00 AM to 8:29 AM | 13 (2.3%) | 124 (28.0%) |
| 8:30 AM to 8:59 AM | 50 (8.8%) | 0 (0.0%) |
| 9:00 AM to 9:59 AM | 0 (0.0%) | 24 (5.4%) |
| 10:00 AM to 10:59 AM | 0 (0.0%) | 0 (0.0%) |
| 11:00 AM to 11:59 AM | 0 (0.0%) | 0 (0.0%) |
| 12:00 PM to 3:59 PM | 55 (9.7%) | 63 (14.2%) |
| 4:00 PM to 11:59 PM | 0 (0.0%) | 64 (14.4%) |
| Total | 568 (100.0%) | 443 (100.0%) |
Housing Occupancy in The Plains
Occupancy by Ownership in The Plains
Of the total 1,554 dwellings in The Plains, owner-occupied units account for 823 (53.0%), while renter-occupied units make up 731 (47.0%).
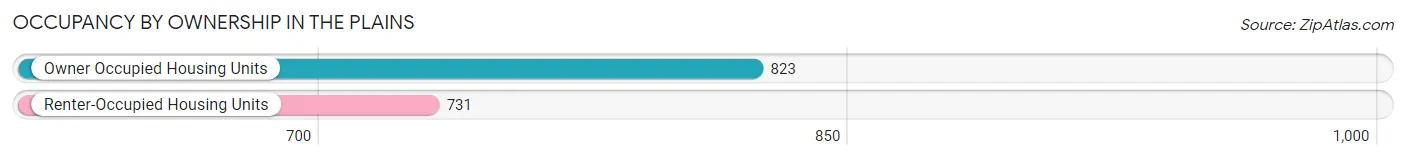
| Occupancy | # Housing Units | % Housing Units |
| Owner Occupied Housing Units | 823 | 53.0% |
| Renter-Occupied Housing Units | 731 | 47.0% |
| Total Occupied Housing Units | 1,554 | 100.0% |
Occupancy by Household Size in The Plains
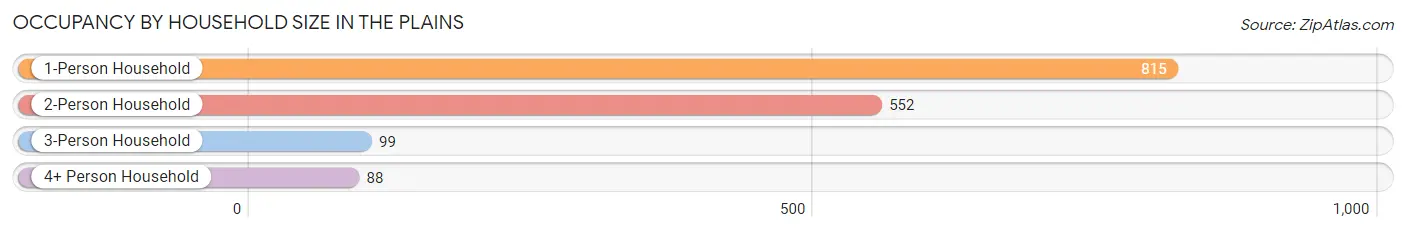
| Household Size | # Housing Units | % Housing Units |
| 1-Person Household | 815 | 52.4% |
| 2-Person Household | 552 | 35.5% |
| 3-Person Household | 99 | 6.4% |
| 4+ Person Household | 88 | 5.7% |
| Total Housing Units | 1,554 | 100.0% |
Occupancy by Ownership by Household Size in The Plains
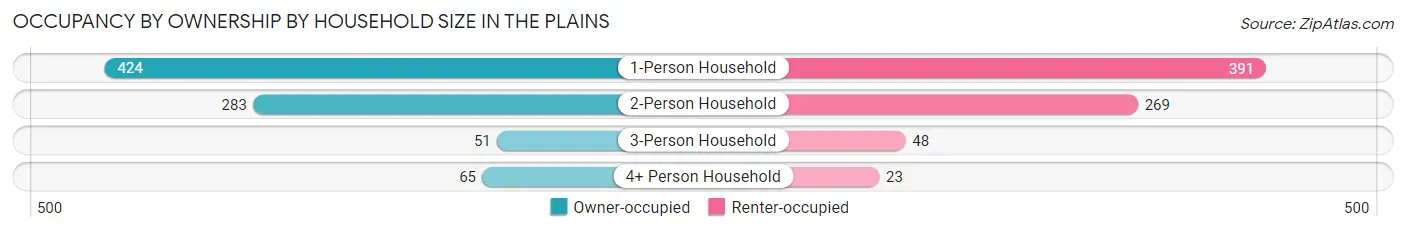
| Household Size | Owner-occupied | Renter-occupied |
| 1-Person Household | 424 (52.0%) | 391 (48.0%) |
| 2-Person Household | 283 (51.3%) | 269 (48.7%) |
| 3-Person Household | 51 (51.5%) | 48 (48.5%) |
| 4+ Person Household | 65 (73.9%) | 23 (26.1%) |
| Total Housing Units | 823 (53.0%) | 731 (47.0%) |
Occupancy by Educational Attainment in The Plains
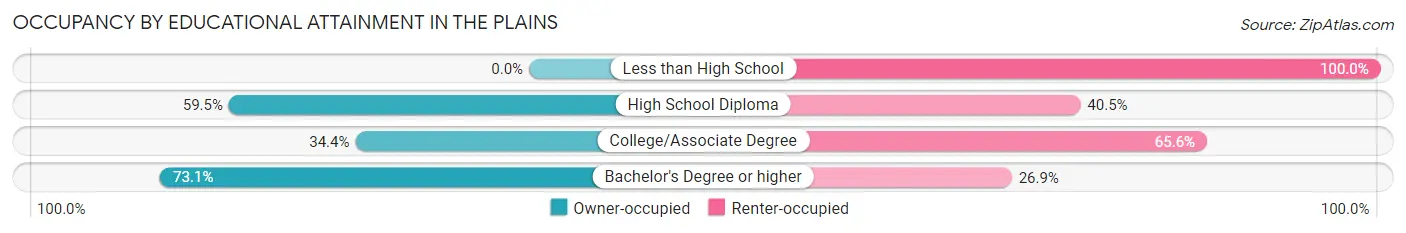
| Household Size | Owner-occupied | Renter-occupied |
| Less than High School | 0 (0.0%) | 94 (100.0%) |
| High School Diploma | 244 (59.5%) | 166 (40.5%) |
| College/Associate Degree | 168 (34.4%) | 320 (65.6%) |
| Bachelor's Degree or higher | 411 (73.1%) | 151 (26.9%) |
Occupancy by Age of Householder in The Plains
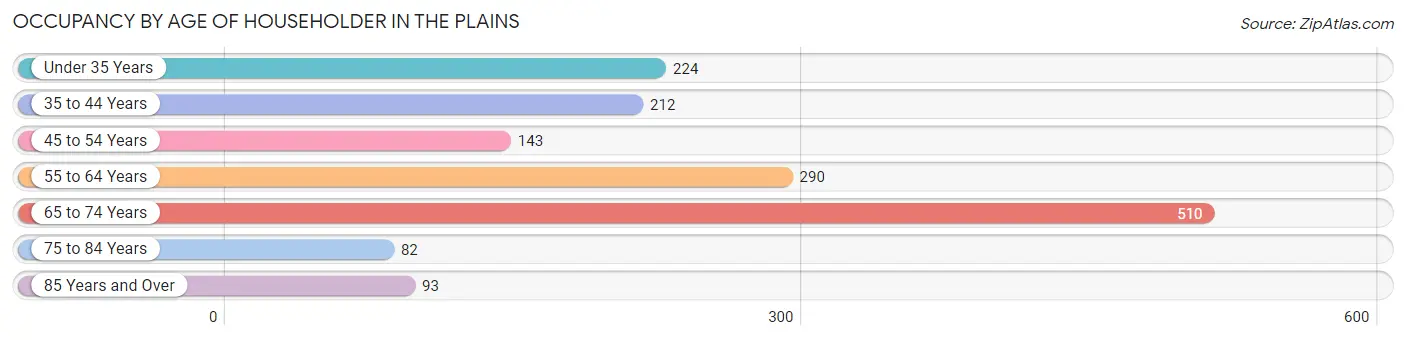
| Age Bracket | # Households | % Households |
| Under 35 Years | 224 | 14.4% |
| 35 to 44 Years | 212 | 13.6% |
| 45 to 54 Years | 143 | 9.2% |
| 55 to 64 Years | 290 | 18.7% |
| 65 to 74 Years | 510 | 32.8% |
| 75 to 84 Years | 82 | 5.3% |
| 85 Years and Over | 93 | 6.0% |
| Total | 1,554 | 100.0% |
Housing Finances in The Plains
Median Income by Occupancy in The Plains
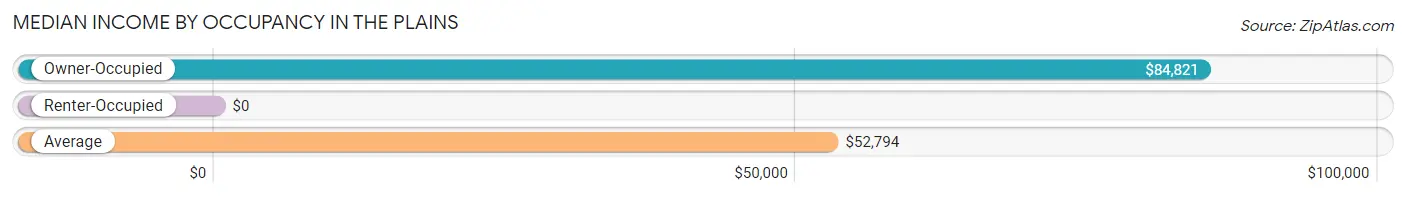
| Occupancy Type | # Households | Median Income |
| Owner-Occupied | 823 (53.0%) | $84,821 |
| Renter-Occupied | 731 (47.0%) | $0 |
| Average | 1,554 (100.0%) | $52,794 |
Occupancy by Householder Income Bracket in The Plains
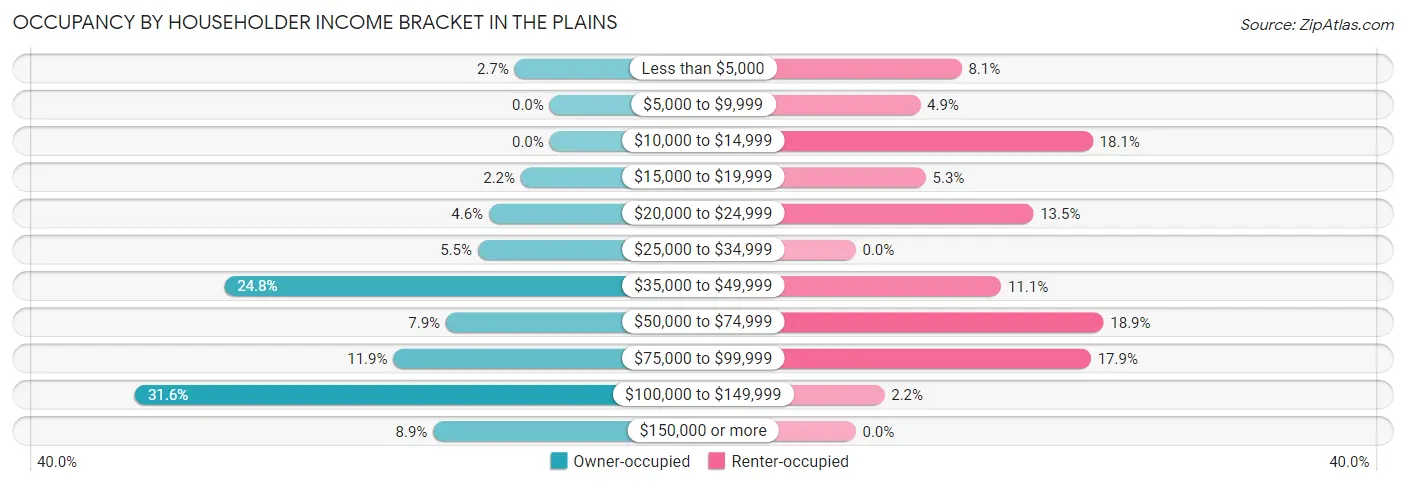
| Income Bracket | Owner-occupied | Renter-occupied |
| Less than $5,000 | 22 (2.7%) | 59 (8.1%) |
| $5,000 to $9,999 | 0 (0.0%) | 36 (4.9%) |
| $10,000 to $14,999 | 0 (0.0%) | 132 (18.1%) |
| $15,000 to $19,999 | 18 (2.2%) | 39 (5.3%) |
| $20,000 to $24,999 | 38 (4.6%) | 99 (13.5%) |
| $25,000 to $34,999 | 45 (5.5%) | 0 (0.0%) |
| $35,000 to $49,999 | 204 (24.8%) | 81 (11.1%) |
| $50,000 to $74,999 | 65 (7.9%) | 138 (18.9%) |
| $75,000 to $99,999 | 98 (11.9%) | 131 (17.9%) |
| $100,000 to $149,999 | 260 (31.6%) | 16 (2.2%) |
| $150,000 or more | 73 (8.9%) | 0 (0.0%) |
| Total | 823 (100.0%) | 731 (100.0%) |
Monthly Housing Cost Tiers in The Plains
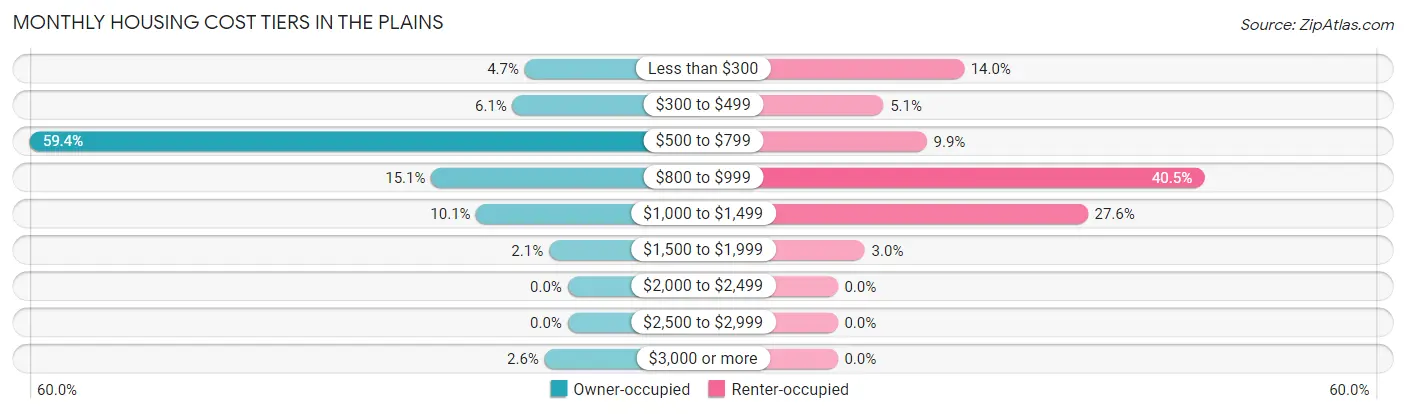
| Monthly Cost | Owner-occupied | Renter-occupied |
| Less than $300 | 39 (4.7%) | 102 (14.0%) |
| $300 to $499 | 50 (6.1%) | 37 (5.1%) |
| $500 to $799 | 489 (59.4%) | 72 (9.9%) |
| $800 to $999 | 124 (15.1%) | 296 (40.5%) |
| $1,000 to $1,499 | 83 (10.1%) | 202 (27.6%) |
| $1,500 to $1,999 | 17 (2.1%) | 22 (3.0%) |
| $2,000 to $2,499 | 0 (0.0%) | 0 (0.0%) |
| $2,500 to $2,999 | 0 (0.0%) | 0 (0.0%) |
| $3,000 or more | 21 (2.5%) | 0 (0.0%) |
| Total | 823 (100.0%) | 731 (100.0%) |
Physical Housing Characteristics in The Plains
Housing Structures in The Plains
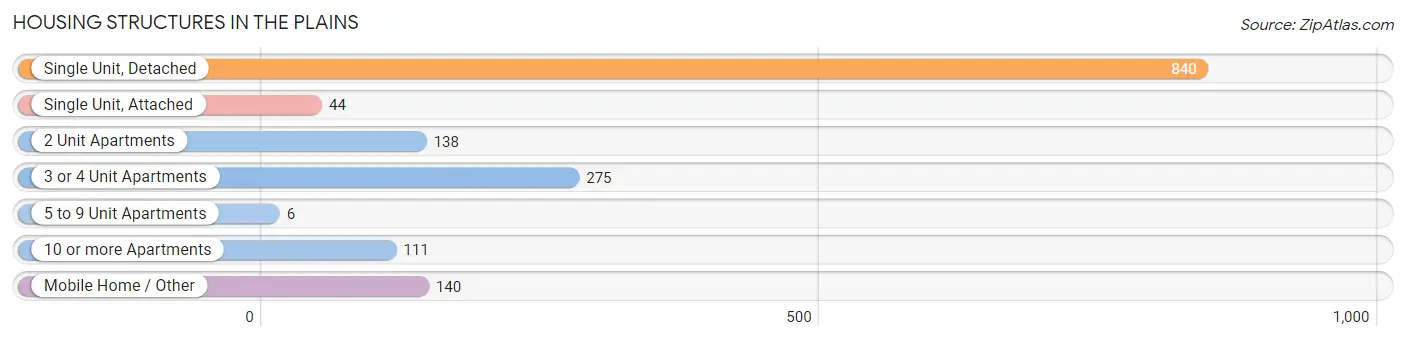
| Structure Type | # Housing Units | % Housing Units |
| Single Unit, Detached | 840 | 54.0% |
| Single Unit, Attached | 44 | 2.8% |
| 2 Unit Apartments | 138 | 8.9% |
| 3 or 4 Unit Apartments | 275 | 17.7% |
| 5 to 9 Unit Apartments | 6 | 0.4% |
| 10 or more Apartments | 111 | 7.1% |
| Mobile Home / Other | 140 | 9.0% |
| Total | 1,554 | 100.0% |
Housing Structures by Occupancy in The Plains
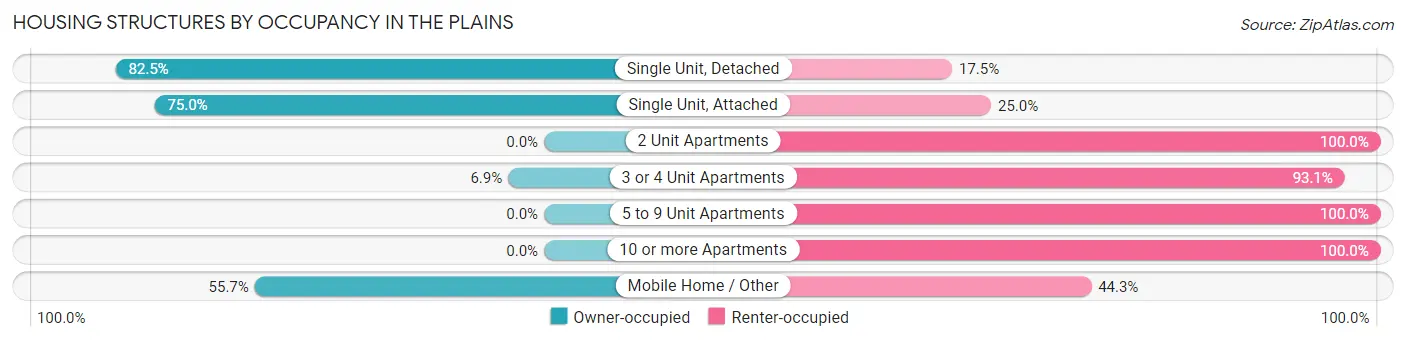
| Structure Type | Owner-occupied | Renter-occupied |
| Single Unit, Detached | 693 (82.5%) | 147 (17.5%) |
| Single Unit, Attached | 33 (75.0%) | 11 (25.0%) |
| 2 Unit Apartments | 0 (0.0%) | 138 (100.0%) |
| 3 or 4 Unit Apartments | 19 (6.9%) | 256 (93.1%) |
| 5 to 9 Unit Apartments | 0 (0.0%) | 6 (100.0%) |
| 10 or more Apartments | 0 (0.0%) | 111 (100.0%) |
| Mobile Home / Other | 78 (55.7%) | 62 (44.3%) |
| Total | 823 (53.0%) | 731 (47.0%) |
Housing Structures by Number of Rooms in The Plains
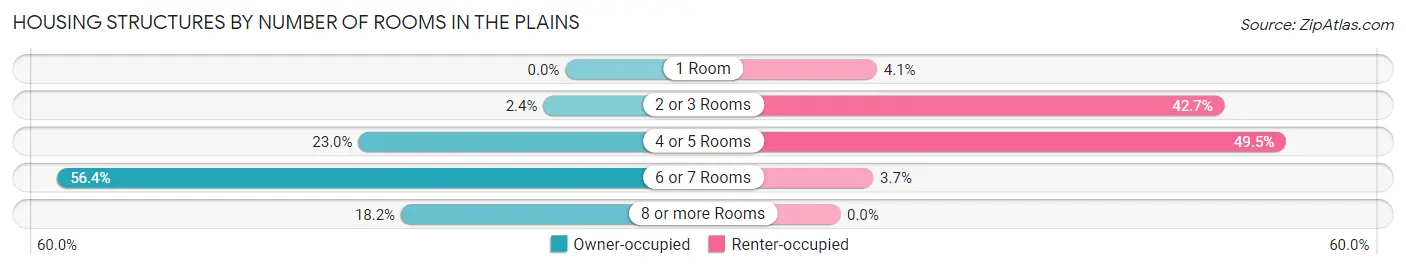
| Number of Rooms | Owner-occupied | Renter-occupied |
| 1 Room | 0 (0.0%) | 30 (4.1%) |
| 2 or 3 Rooms | 20 (2.4%) | 312 (42.7%) |
| 4 or 5 Rooms | 189 (23.0%) | 362 (49.5%) |
| 6 or 7 Rooms | 464 (56.4%) | 27 (3.7%) |
| 8 or more Rooms | 150 (18.2%) | 0 (0.0%) |
| Total | 823 (100.0%) | 731 (100.0%) |
Housing Structure by Heating Type in The Plains
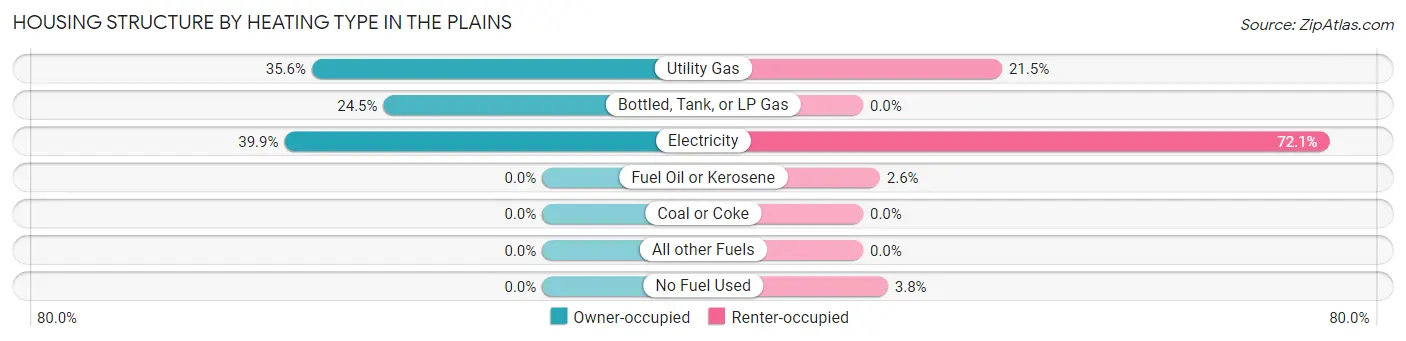
| Heating Type | Owner-occupied | Renter-occupied |
| Utility Gas | 293 (35.6%) | 157 (21.5%) |
| Bottled, Tank, or LP Gas | 202 (24.5%) | 0 (0.0%) |
| Electricity | 328 (39.9%) | 527 (72.1%) |
| Fuel Oil or Kerosene | 0 (0.0%) | 19 (2.6%) |
| Coal or Coke | 0 (0.0%) | 0 (0.0%) |
| All other Fuels | 0 (0.0%) | 0 (0.0%) |
| No Fuel Used | 0 (0.0%) | 28 (3.8%) |
| Total | 823 (100.0%) | 731 (100.0%) |
Household Vehicle Usage in The Plains
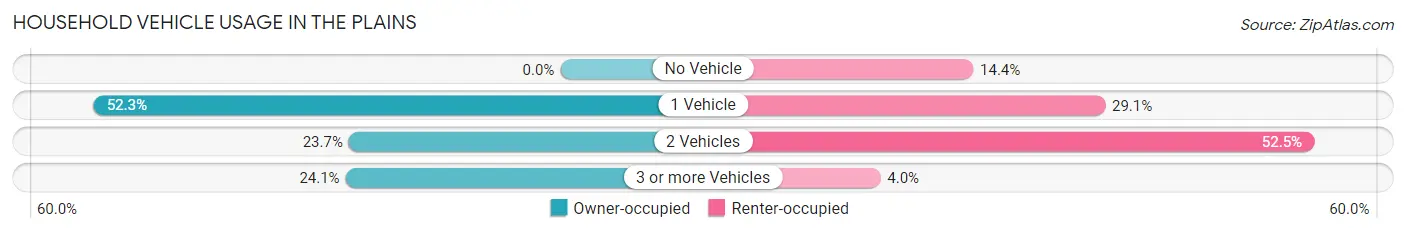
| Vehicles per Household | Owner-occupied | Renter-occupied |
| No Vehicle | 0 (0.0%) | 105 (14.4%) |
| 1 Vehicle | 430 (52.2%) | 213 (29.1%) |
| 2 Vehicles | 195 (23.7%) | 384 (52.5%) |
| 3 or more Vehicles | 198 (24.1%) | 29 (4.0%) |
| Total | 823 (100.0%) | 731 (100.0%) |
Real Estate & Mortgages in The Plains
Real Estate and Mortgage Overview in The Plains
| Characteristic | Without Mortgage | With Mortgage |
| Housing Units | 638 | 185 |
| Median Property Value | $288,700 | $158,900 |
| Median Household Income | $102,642 | $0 |
| Monthly Housing Costs | $727 | $21 |
| Real Estate Taxes | $3,720 | $0 |
Property Value by Mortgage Status in The Plains
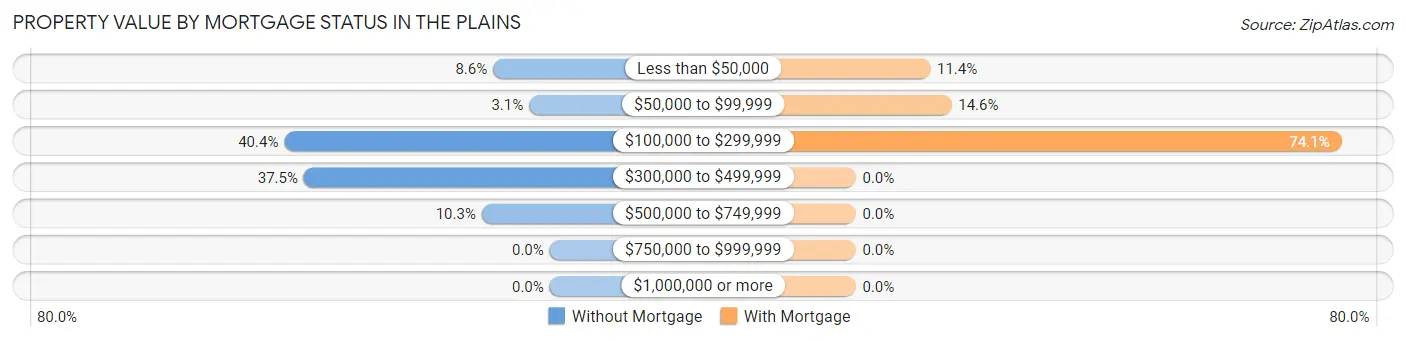
| Property Value | Without Mortgage | With Mortgage |
| Less than $50,000 | 55 (8.6%) | 21 (11.4%) |
| $50,000 to $99,999 | 20 (3.1%) | 27 (14.6%) |
| $100,000 to $299,999 | 258 (40.4%) | 137 (74.1%) |
| $300,000 to $499,999 | 239 (37.5%) | 0 (0.0%) |
| $500,000 to $749,999 | 66 (10.3%) | 0 (0.0%) |
| $750,000 to $999,999 | 0 (0.0%) | 0 (0.0%) |
| $1,000,000 or more | 0 (0.0%) | 0 (0.0%) |
| Total | 638 (100.0%) | 185 (100.0%) |
Household Income by Mortgage Status in The Plains
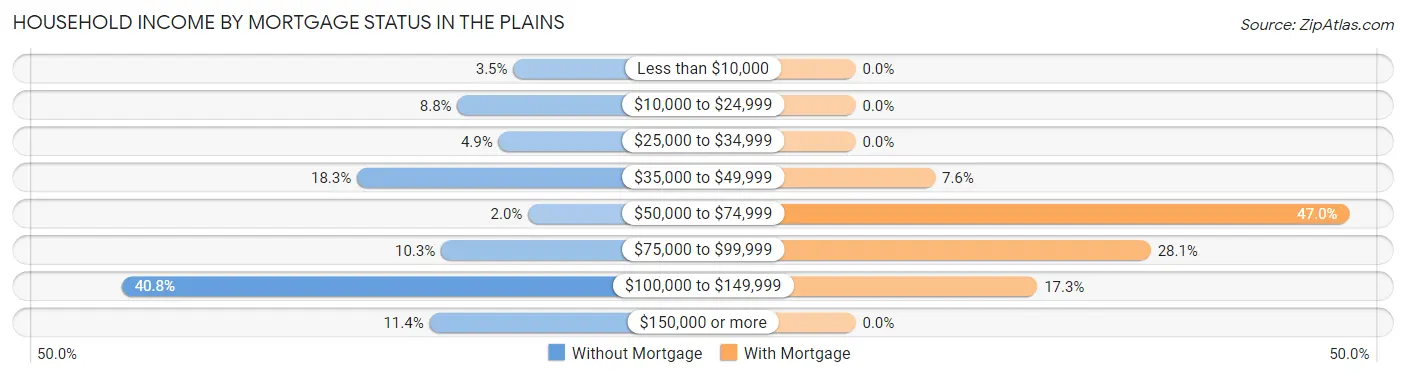
| Household Income | Without Mortgage | With Mortgage |
| Less than $10,000 | 22 (3.5%) | 0 (0.0%) |
| $10,000 to $24,999 | 56 (8.8%) | 0 (0.0%) |
| $25,000 to $34,999 | 31 (4.9%) | 0 (0.0%) |
| $35,000 to $49,999 | 117 (18.3%) | 14 (7.6%) |
| $50,000 to $74,999 | 13 (2.0%) | 87 (47.0%) |
| $75,000 to $99,999 | 66 (10.3%) | 52 (28.1%) |
| $100,000 to $149,999 | 260 (40.7%) | 32 (17.3%) |
| $150,000 or more | 73 (11.4%) | 0 (0.0%) |
| Total | 638 (100.0%) | 185 (100.0%) |
Property Value to Household Income Ratio in The Plains
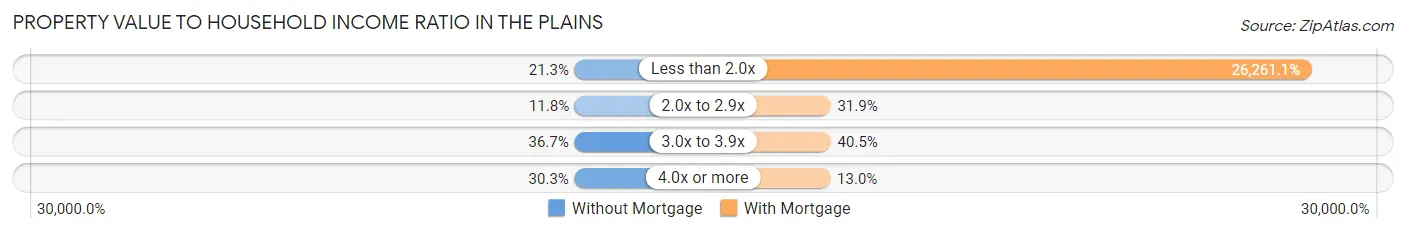
| Value-to-Income Ratio | Without Mortgage | With Mortgage |
| Less than 2.0x | 136 (21.3%) | 48,583 (26,261.1%) |
| 2.0x to 2.9x | 75 (11.8%) | 59 (31.9%) |
| 3.0x to 3.9x | 234 (36.7%) | 75 (40.5%) |
| 4.0x or more | 193 (30.2%) | 24 (13.0%) |
| Total | 638 (100.0%) | 185 (100.0%) |
Real Estate Taxes by Mortgage Status in The Plains
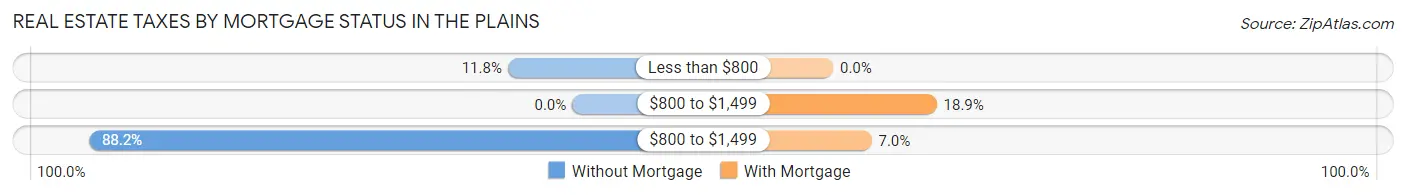
| Property Taxes | Without Mortgage | With Mortgage |
| Less than $800 | 75 (11.8%) | 0 (0.0%) |
| $800 to $1,499 | 0 (0.0%) | 35 (18.9%) |
| $800 to $1,499 | 563 (88.2%) | 13 (7.0%) |
| Total | 638 (100.0%) | 185 (100.0%) |
Health & Disability in The Plains
Health Insurance Coverage by Age in The Plains
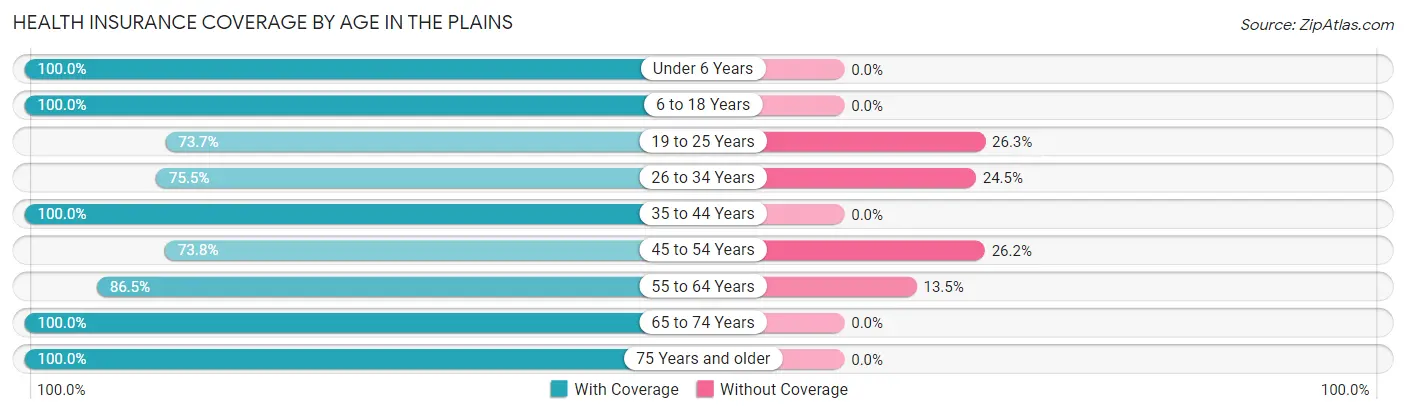
| Age Bracket | With Coverage | Without Coverage |
| Under 6 Years | 95 (100.0%) | 0 (0.0%) |
| 6 to 18 Years | 126 (100.0%) | 0 (0.0%) |
| 19 to 25 Years | 219 (73.7%) | 78 (26.3%) |
| 26 to 34 Years | 120 (75.5%) | 39 (24.5%) |
| 35 to 44 Years | 318 (100.0%) | 0 (0.0%) |
| 45 to 54 Years | 155 (73.8%) | 55 (26.2%) |
| 55 to 64 Years | 424 (86.5%) | 66 (13.5%) |
| 65 to 74 Years | 713 (100.0%) | 0 (0.0%) |
| 75 Years and older | 240 (100.0%) | 0 (0.0%) |
| Total | 2,410 (91.0%) | 238 (9.0%) |
Health Insurance Coverage by Citizenship Status in The Plains
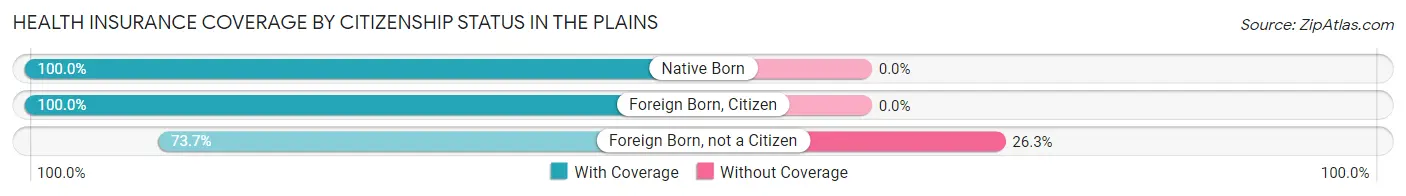
| Citizenship Status | With Coverage | Without Coverage |
| Native Born | 95 (100.0%) | 0 (0.0%) |
| Foreign Born, Citizen | 126 (100.0%) | 0 (0.0%) |
| Foreign Born, not a Citizen | 219 (73.7%) | 78 (26.3%) |
Health Insurance Coverage by Household Income in The Plains
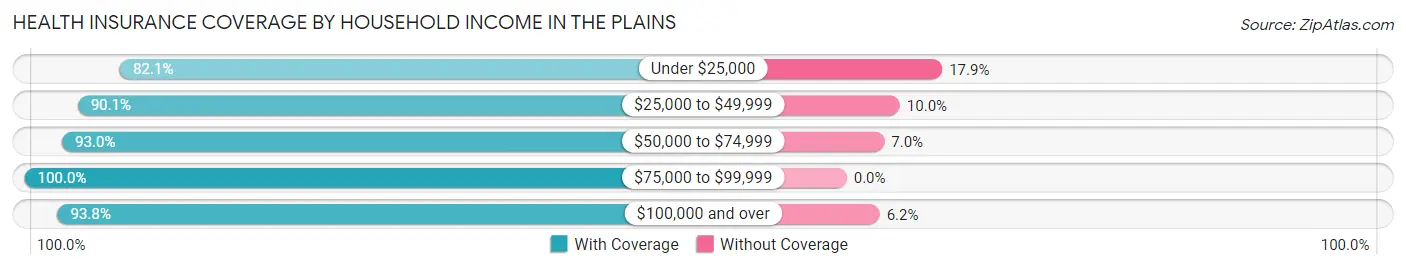
| Household Income | With Coverage | Without Coverage |
| Under $25,000 | 542 (82.1%) | 118 (17.9%) |
| $25,000 to $49,999 | 534 (90.0%) | 59 (10.0%) |
| $50,000 to $74,999 | 344 (93.0%) | 26 (7.0%) |
| $75,000 to $99,999 | 440 (100.0%) | 0 (0.0%) |
| $100,000 and over | 532 (93.8%) | 35 (6.2%) |
Public vs Private Health Insurance Coverage by Age in The Plains
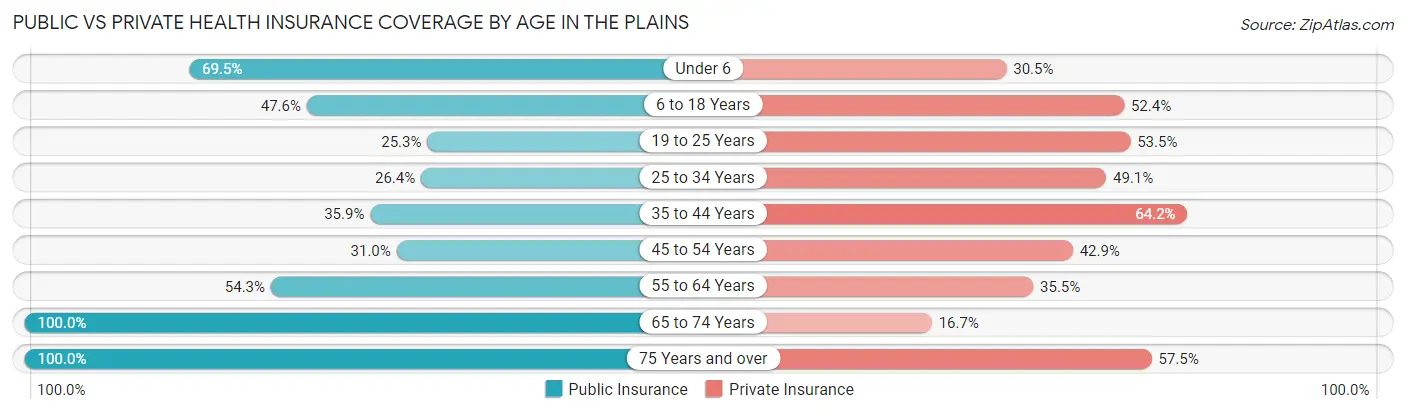
| Age Bracket | Public Insurance | Private Insurance |
| Under 6 | 66 (69.5%) | 29 (30.5%) |
| 6 to 18 Years | 60 (47.6%) | 66 (52.4%) |
| 19 to 25 Years | 75 (25.3%) | 159 (53.5%) |
| 25 to 34 Years | 42 (26.4%) | 78 (49.1%) |
| 35 to 44 Years | 114 (35.8%) | 204 (64.1%) |
| 45 to 54 Years | 65 (30.9%) | 90 (42.9%) |
| 55 to 64 Years | 266 (54.3%) | 174 (35.5%) |
| 65 to 74 Years | 713 (100.0%) | 119 (16.7%) |
| 75 Years and over | 240 (100.0%) | 138 (57.5%) |
| Total | 1,641 (62.0%) | 1,057 (39.9%) |
Disability Status by Sex by Age in The Plains
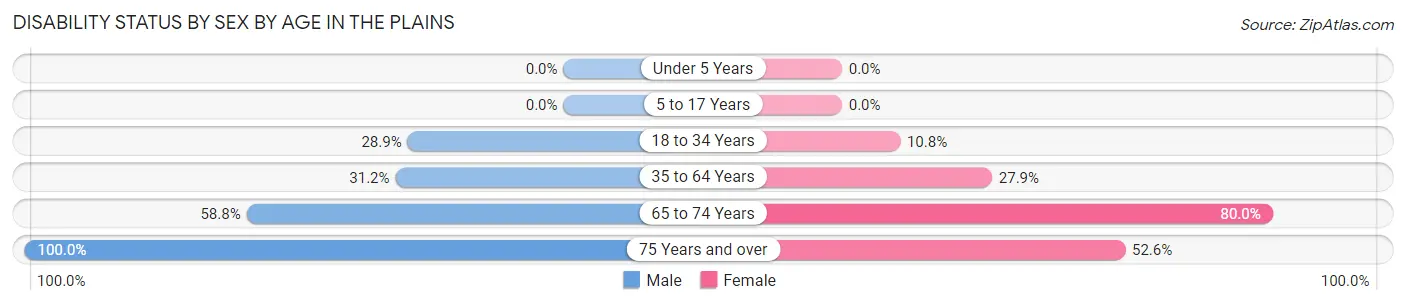
| Age Bracket | Male | Female |
| Under 5 Years | 0 (0.0%) | 0 (0.0%) |
| 5 to 17 Years | 0 (0.0%) | 0 (0.0%) |
| 18 to 34 Years | 81 (28.9%) | 19 (10.8%) |
| 35 to 64 Years | 164 (31.2%) | 137 (27.9%) |
| 65 to 74 Years | 120 (58.8%) | 407 (80.0%) |
| 75 Years and over | 65 (100.0%) | 92 (52.6%) |
Disability Class by Sex by Age in The Plains
Disability Class: Hearing Difficulty
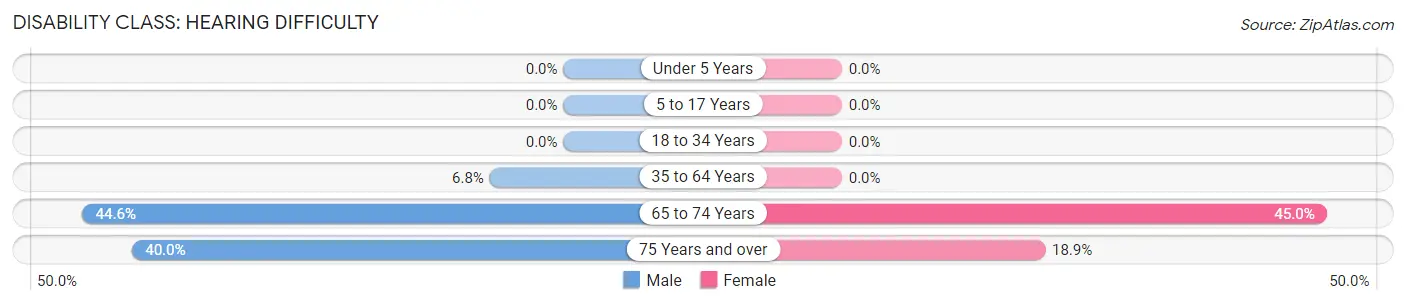
| Age Bracket | Male | Female |
| Under 5 Years | 0 (0.0%) | 0 (0.0%) |
| 5 to 17 Years | 0 (0.0%) | 0 (0.0%) |
| 18 to 34 Years | 0 (0.0%) | 0 (0.0%) |
| 35 to 64 Years | 36 (6.8%) | 0 (0.0%) |
| 65 to 74 Years | 91 (44.6%) | 229 (45.0%) |
| 75 Years and over | 26 (40.0%) | 33 (18.9%) |
Disability Class: Vision Difficulty
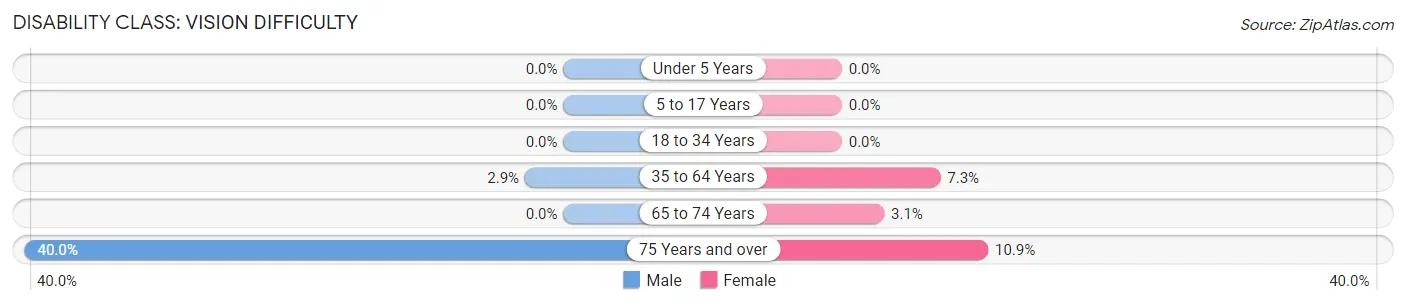
| Age Bracket | Male | Female |
| Under 5 Years | 0 (0.0%) | 0 (0.0%) |
| 5 to 17 Years | 0 (0.0%) | 0 (0.0%) |
| 18 to 34 Years | 0 (0.0%) | 0 (0.0%) |
| 35 to 64 Years | 15 (2.9%) | 36 (7.3%) |
| 65 to 74 Years | 0 (0.0%) | 16 (3.1%) |
| 75 Years and over | 26 (40.0%) | 19 (10.9%) |
Disability Class: Cognitive Difficulty
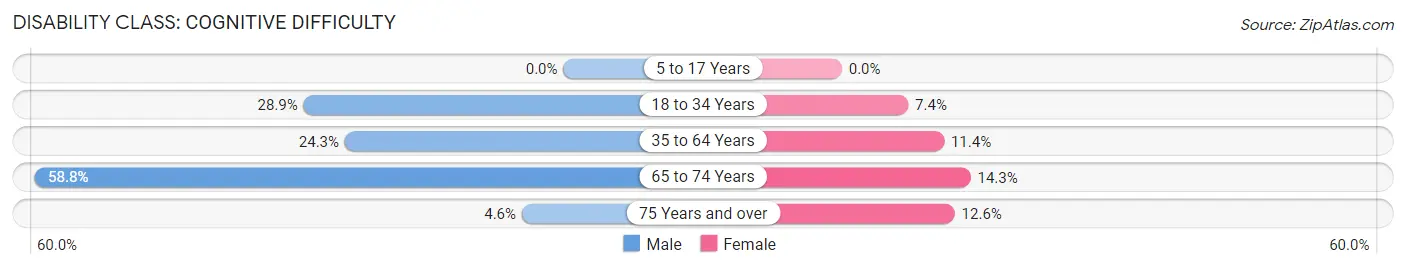
| Age Bracket | Male | Female |
| 5 to 17 Years | 0 (0.0%) | 0 (0.0%) |
| 18 to 34 Years | 81 (28.9%) | 13 (7.4%) |
| 35 to 64 Years | 128 (24.3%) | 56 (11.4%) |
| 65 to 74 Years | 120 (58.8%) | 73 (14.3%) |
| 75 Years and over | 3 (4.6%) | 22 (12.6%) |
Disability Class: Ambulatory Difficulty
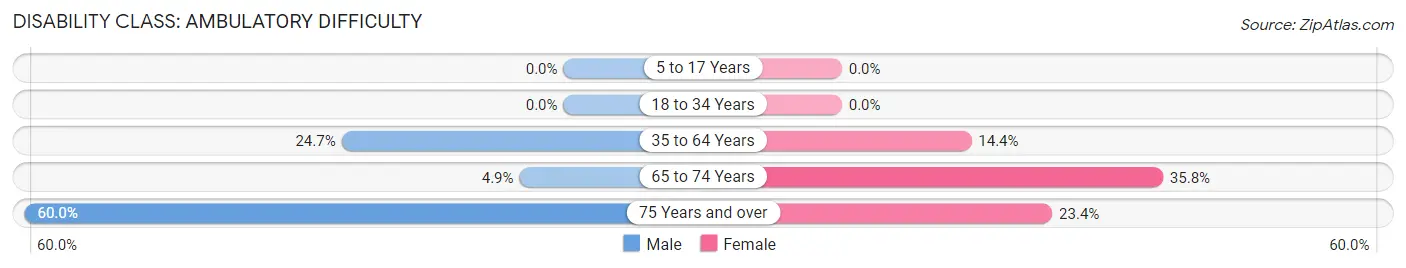
| Age Bracket | Male | Female |
| 5 to 17 Years | 0 (0.0%) | 0 (0.0%) |
| 18 to 34 Years | 0 (0.0%) | 0 (0.0%) |
| 35 to 64 Years | 130 (24.7%) | 71 (14.4%) |
| 65 to 74 Years | 10 (4.9%) | 182 (35.8%) |
| 75 Years and over | 39 (60.0%) | 41 (23.4%) |
Disability Class: Self-Care Difficulty
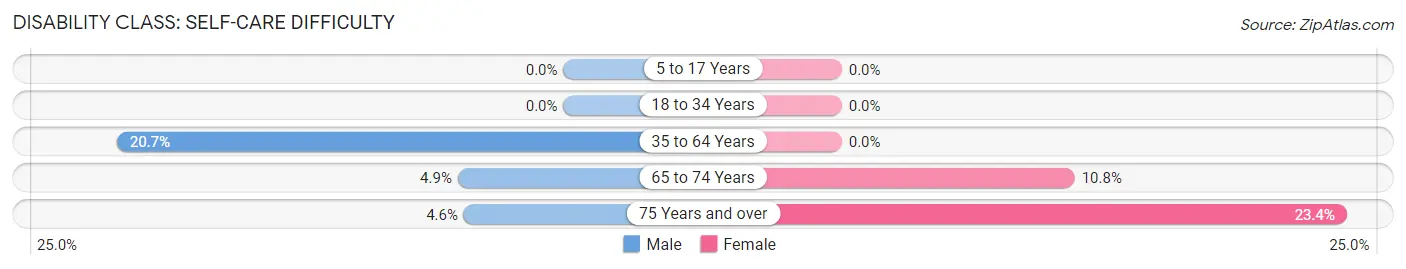
| Age Bracket | Male | Female |
| 5 to 17 Years | 0 (0.0%) | 0 (0.0%) |
| 18 to 34 Years | 0 (0.0%) | 0 (0.0%) |
| 35 to 64 Years | 109 (20.7%) | 0 (0.0%) |
| 65 to 74 Years | 10 (4.9%) | 55 (10.8%) |
| 75 Years and over | 3 (4.6%) | 41 (23.4%) |
Technology Access in The Plains
Computing Device Access in The Plains
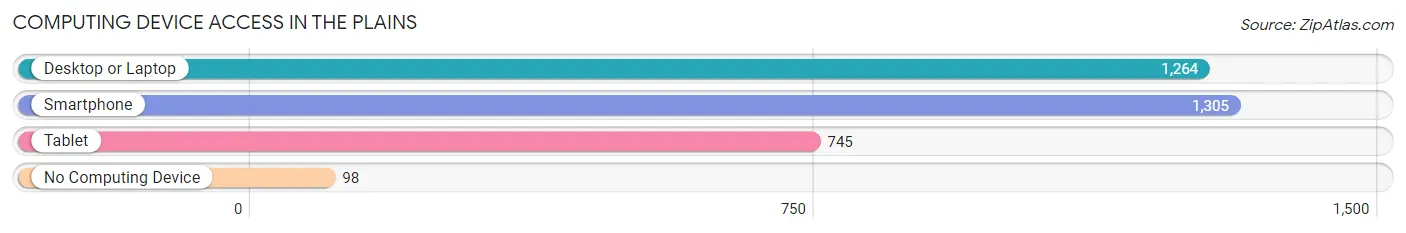
| Device Type | # Households | % Households |
| Desktop or Laptop | 1,264 | 81.3% |
| Smartphone | 1,305 | 84.0% |
| Tablet | 745 | 47.9% |
| No Computing Device | 98 | 6.3% |
| Total | 1,554 | 100.0% |
Internet Access in The Plains
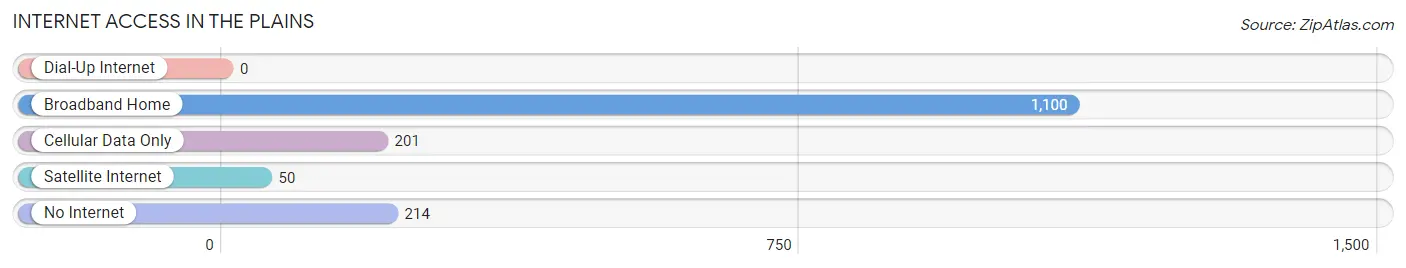
| Internet Type | # Households | % Households |
| Dial-Up Internet | 0 | 0.0% |
| Broadband Home | 1,100 | 70.8% |
| Cellular Data Only | 201 | 12.9% |
| Satellite Internet | 50 | 3.2% |
| No Internet | 214 | 13.8% |
| Total | 1,554 | 100.0% |
The Plains Summary
History
The Plains is a village located in Athens County, Ohio, United States. It is situated along the Hocking River, approximately 10 miles southeast of Athens. The village was founded in 1817 by a group of settlers from the East Coast, led by General William Lytle. The settlers named the village after the nearby plains, which were used for grazing livestock.
The village was originally a farming community, with the main crops being wheat, corn, and oats. The village also had a sawmill, gristmill, and a blacksmith shop. In 1845, the first school was built in The Plains. The village was incorporated in 1854.
In the late 19th century, The Plains began to grow and develop. The railroad was extended to the village in 1881, and the first bank was established in 1883. The village also had a post office, a hotel, and several stores.
The Plains experienced a period of growth and prosperity in the early 20th century. The village was home to several factories, including a brickyard, a canning factory, and a furniture factory. The village also had a movie theater, a bowling alley, and several churches.
The Great Depression had a significant impact on The Plains. Many of the factories closed, and the population declined. The village was able to recover in the post-war years, and the population began to grow again.
Geography
The Plains is located in Athens County, Ohio, approximately 10 miles southeast of Athens. The village is situated along the Hocking River, and is surrounded by rolling hills and farmland. The village is located in the Appalachian Plateau region of Ohio, and is part of the Appalachian Mountains.
The climate in The Plains is humid continental, with hot summers and cold winters. The average annual temperature is around 50 degrees Fahrenheit, and the average annual precipitation is around 40 inches.
Economy
The economy of The Plains is largely based on agriculture and tourism. The village is home to several farms, which produce a variety of crops, including corn, wheat, oats, and hay. The village also has several wineries, which produce a variety of wines.
The village is also home to several small businesses, including restaurants, shops, and galleries. The village is also home to several bed and breakfasts, which attract tourists from all over the country.
Demographics
The population of The Plains was 1,845 in the 2010 census. The population is largely white (94.3%), with small percentages of African American (2.2%), Asian (1.2%), and Hispanic (1.3%) residents. The median household income is $41,250, and the median age is 43.
The village is served by the Athens City School District. The village is also home to several churches, including the First Presbyterian Church, the First United Methodist Church, and the Church of the Nazarene.
Conclusion
The Plains is a small village located in Athens County, Ohio. The village was founded in 1817 by a group of settlers from the East Coast, and has since grown into a thriving community. The village is largely agricultural, with several wineries and small businesses. The population is largely white, with small percentages of African American, Asian, and Hispanic residents. The village is served by the Athens City School District, and is home to several churches. The Plains is a vibrant community with a rich history and a bright future.
Common Questions
What is Per Capita Income in The Plains?
Per Capita income in The Plains is $35,124.
What is the Median Family Income in The Plains?
Median Family Income in The Plains is $58,419.
What is the Median Household income in The Plains?
Median Household Income in The Plains is $52,794.
What is Income or Wage Gap in The Plains?
Income or Wage Gap in The Plains is 27.4%.
Women in The Plains earn 72.6 cents for every dollar earned by a man.
What is Inequality or Gini Index in The Plains?
Inequality or Gini Index in The Plains is 0.40.
What is the Total Population of The Plains?
Total Population of The Plains is 2,724.
What is the Total Male Population of The Plains?
Total Male Population of The Plains is 1,186.
What is the Total Female Population of The Plains?
Total Female Population of The Plains is 1,538.
What is the Ratio of Males per 100 Females in The Plains?
There are 77.11 Males per 100 Females in The Plains.
What is the Ratio of Females per 100 Males in The Plains?
There are 129.68 Females per 100 Males in The Plains.
What is the Median Population Age in The Plains?
Median Population Age in The Plains is 59.1 Years.
What is the Average Family Size in The Plains
Average Family Size in The Plains is 2.4 People.
What is the Average Household Size in The Plains
Average Household Size in The Plains is 1.7 People.
How Large is the Labor Force in The Plains?
There are 1,090 People in the Labor Forcein in The Plains.
What is the Percentage of People in the Labor Force in The Plains?
43.3% of People are in the Labor Force in The Plains.
What is the Unemployment Rate in The Plains?
Unemployment Rate in The Plains is 5.3%.