North Perry, OH Map & Demographics
North Perry Map
North Perry Overview
$47,165
PER CAPITA INCOME
$111,000
AVG FAMILY INCOME
$100,625
AVG HOUSEHOLD INCOME
36.7%
WAGE / INCOME GAP [ % ]
63.3¢/ $1
WAGE / INCOME GAP [ $ ]
0.40
INEQUALITY / GINI INDEX
852
TOTAL POPULATION
458
MALE POPULATION
394
FEMALE POPULATION
116.24
MALES / 100 FEMALES
86.03
FEMALES / 100 MALES
47.3
MEDIAN AGE
3.0
AVG FAMILY SIZE
2.6
AVG HOUSEHOLD SIZE
454
LABOR FORCE [ PEOPLE ]
66.8%
PERCENT IN LABOR FORCE
5.1%
UNEMPLOYMENT RATE
Income in North Perry
Income Overview in North Perry
Per Capita Income in North Perry is $47,165, while median incomes of families and households are $111,000 and $100,625 respectively.
| Characteristic | Number | Measure |
| Per Capita Income | 852 | $47,165 |
| Median Family Income | 252 | $111,000 |
| Mean Family Income | 252 | $131,417 |
| Median Household Income | 323 | $100,625 |
| Mean Household Income | 323 | $119,767 |
| Income Deficit | 252 | $0 |
| Wage / Income Gap (%) | 852 | 36.73% |
| Wage / Income Gap ($) | 852 | 63.27¢ per $1 |
| Gini / Inequality Index | 852 | 0.40 |
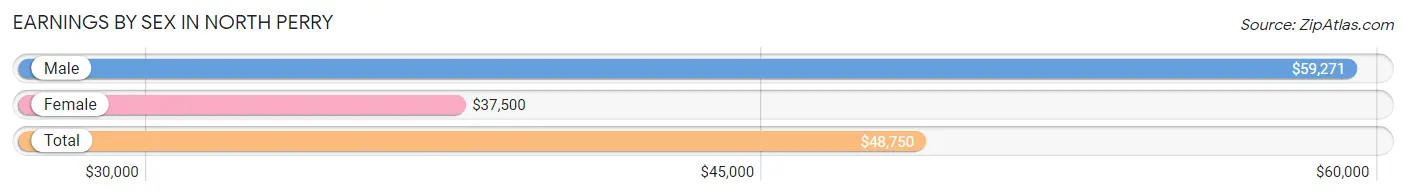
Earnings by Sex in North Perry
Average Earnings in North Perry are $48,750, $59,271 for men and $37,500 for women, a difference of 36.7%.
| Sex | Number | Average Earnings |
| Male | 273 (59.2%) | $59,271 |
| Female | 188 (40.8%) | $37,500 |
| Total | 461 (100.0%) | $48,750 |
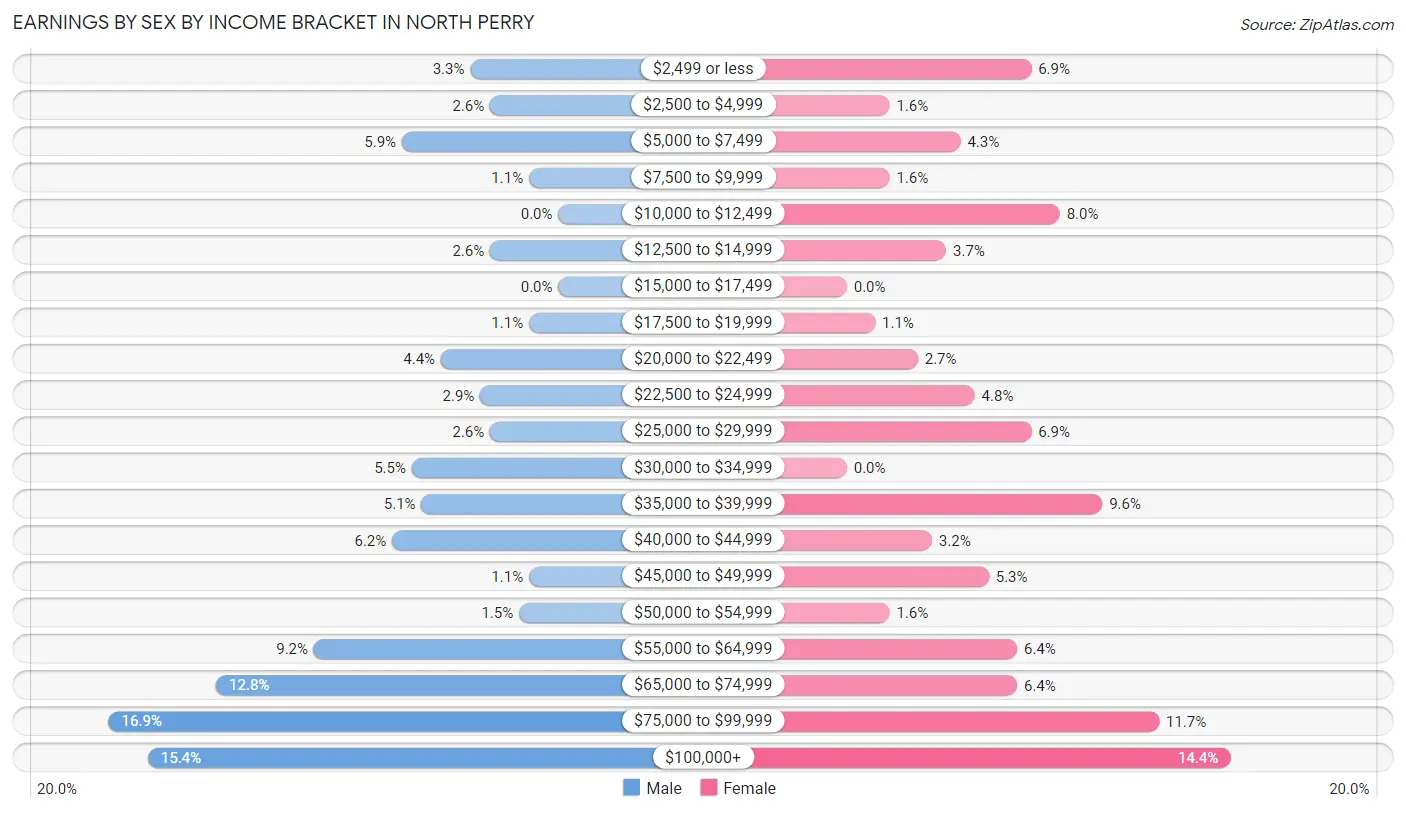
Earnings by Sex by Income Bracket in North Perry
The most common earnings brackets in North Perry are $75,000 to $99,999 for men (46 | 16.9%) and $100,000+ for women (27 | 14.4%).
| Income | Male | Female |
| $2,499 or less | 9 (3.3%) | 13 (6.9%) |
| $2,500 to $4,999 | 7 (2.6%) | 3 (1.6%) |
| $5,000 to $7,499 | 16 (5.9%) | 8 (4.3%) |
| $7,500 to $9,999 | 3 (1.1%) | 3 (1.6%) |
| $10,000 to $12,499 | 0 (0.0%) | 15 (8.0%) |
| $12,500 to $14,999 | 7 (2.6%) | 7 (3.7%) |
| $15,000 to $17,499 | 0 (0.0%) | 0 (0.0%) |
| $17,500 to $19,999 | 3 (1.1%) | 2 (1.1%) |
| $20,000 to $22,499 | 12 (4.4%) | 5 (2.7%) |
| $22,500 to $24,999 | 8 (2.9%) | 9 (4.8%) |
| $25,000 to $29,999 | 7 (2.6%) | 13 (6.9%) |
| $30,000 to $34,999 | 15 (5.5%) | 0 (0.0%) |
| $35,000 to $39,999 | 14 (5.1%) | 18 (9.6%) |
| $40,000 to $44,999 | 17 (6.2%) | 6 (3.2%) |
| $45,000 to $49,999 | 3 (1.1%) | 10 (5.3%) |
| $50,000 to $54,999 | 4 (1.5%) | 3 (1.6%) |
| $55,000 to $64,999 | 25 (9.2%) | 12 (6.4%) |
| $65,000 to $74,999 | 35 (12.8%) | 12 (6.4%) |
| $75,000 to $99,999 | 46 (16.9%) | 22 (11.7%) |
| $100,000+ | 42 (15.4%) | 27 (14.4%) |
| Total | 273 (100.0%) | 188 (100.0%) |
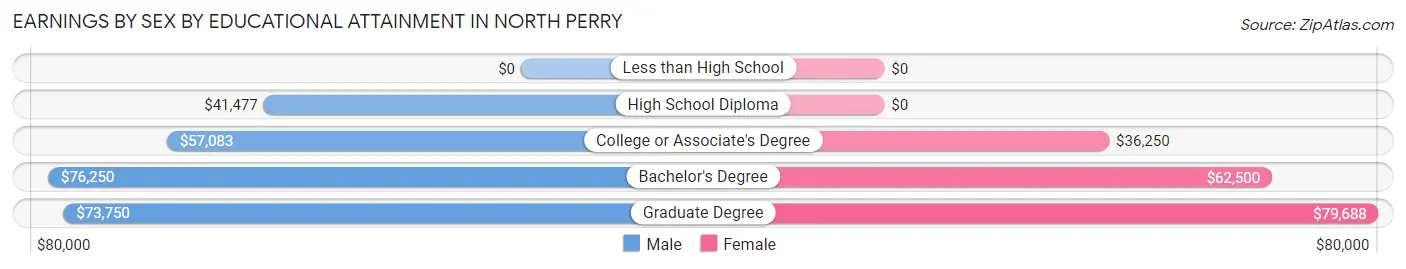
Earnings by Sex by Educational Attainment in North Perry
Average earnings in North Perry are $65,568 for men and $45,781 for women, a difference of 30.2%. Men with an educational attainment of bachelor's degree enjoy the highest average annual earnings of $76,250, while those with high school diploma education earn the least with $41,477. Women with an educational attainment of graduate degree earn the most with the average annual earnings of $79,688, while those with college or associate's degree education have the smallest earnings of $36,250.
| Educational Attainment | Male Income | Female Income |
| Less than High School | - | - |
| High School Diploma | $41,477 | $0 |
| College or Associate's Degree | $57,083 | $36,250 |
| Bachelor's Degree | $76,250 | $62,500 |
| Graduate Degree | $73,750 | $79,688 |
| Total | $65,568 | $45,781 |
Family Income in North Perry
Family Income Brackets in North Perry
According to the North Perry family income data, there are 86 families falling into the $100,000 to $149,999 income range, which is the most common income bracket and makes up 34.1% of all families.
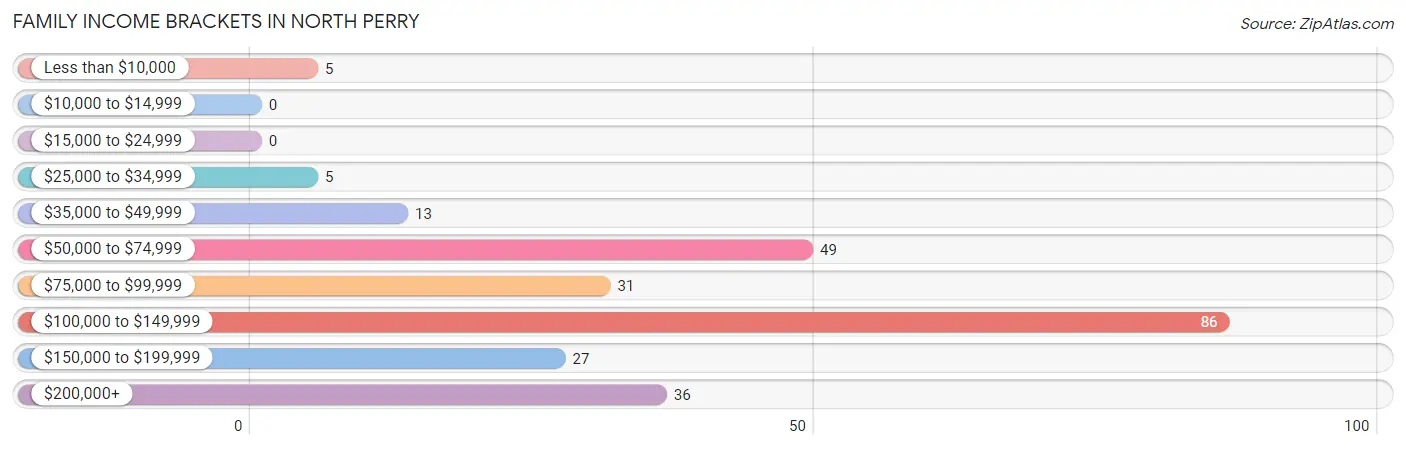
| Income Bracket | # Families | % Families |
| Less than $10,000 | 5 | 2.0% |
| $10,000 to $14,999 | 0 | 0.0% |
| $15,000 to $24,999 | 0 | 0.0% |
| $25,000 to $34,999 | 5 | 2.0% |
| $35,000 to $49,999 | 13 | 5.2% |
| $50,000 to $74,999 | 49 | 19.4% |
| $75,000 to $99,999 | 31 | 12.3% |
| $100,000 to $149,999 | 86 | 34.1% |
| $150,000 to $199,999 | 27 | 10.7% |
| $200,000+ | 36 | 14.3% |
Family Income by Famaliy Size in North Perry
5-person families (25 | 9.9%) account for the highest median family income in North Perry with $165,625 per family, while 2-person families (144 | 57.1%) have the highest median income of $49,584 per family member.
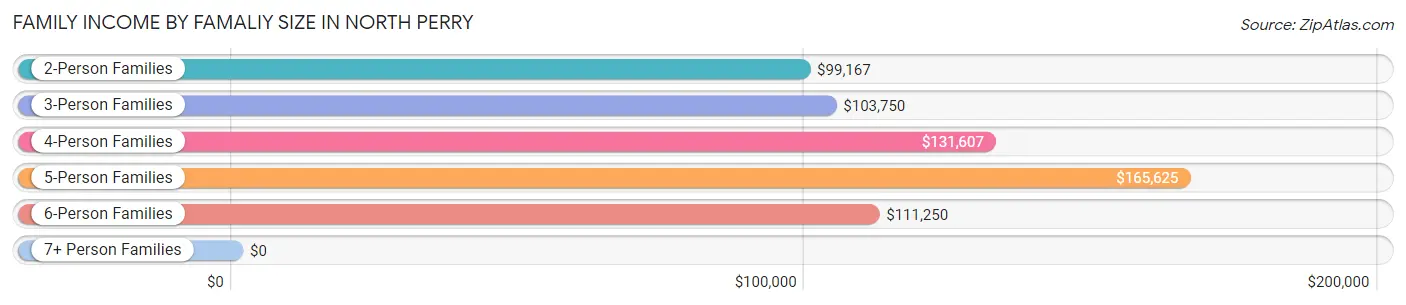
| Income Bracket | # Families | Median Income |
| 2-Person Families | 144 (57.1%) | $99,167 |
| 3-Person Families | 37 (14.7%) | $103,750 |
| 4-Person Families | 35 (13.9%) | $131,607 |
| 5-Person Families | 25 (9.9%) | $165,625 |
| 6-Person Families | 11 (4.4%) | $111,250 |
| 7+ Person Families | 0 (0.0%) | $0 |
| Total | 252 (100.0%) | $111,000 |
Family Income by Number of Earners in North Perry
The median family income in North Perry is $111,000, with families comprising 2 earners (121) having the highest median family income of $130,260, while families with 1 earner (58) have the lowest median family income of $74,167, accounting for 48.0% and 23.0% of families, respectively.
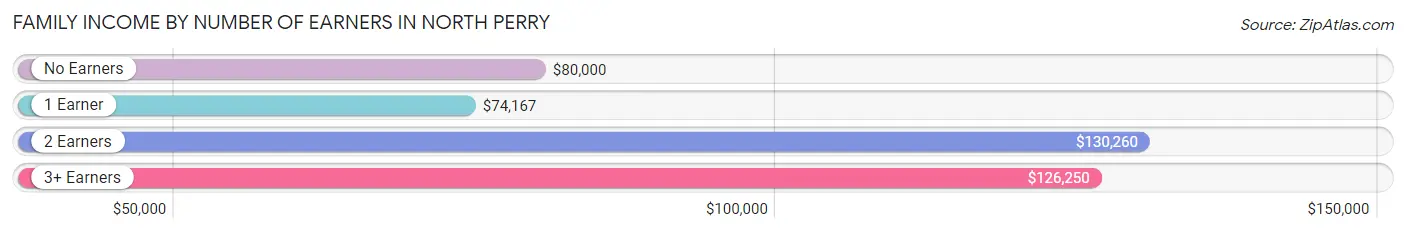
| Number of Earners | # Families | Median Income |
| No Earners | 46 (18.2%) | $80,000 |
| 1 Earner | 58 (23.0%) | $74,167 |
| 2 Earners | 121 (48.0%) | $130,260 |
| 3+ Earners | 27 (10.7%) | $126,250 |
| Total | 252 (100.0%) | $111,000 |
Household Income in North Perry
Household Income Brackets in North Perry
With 97 households falling in the category, the $100,000 to $149,999 income range is the most frequent in North Perry, accounting for 30.0% of all households.
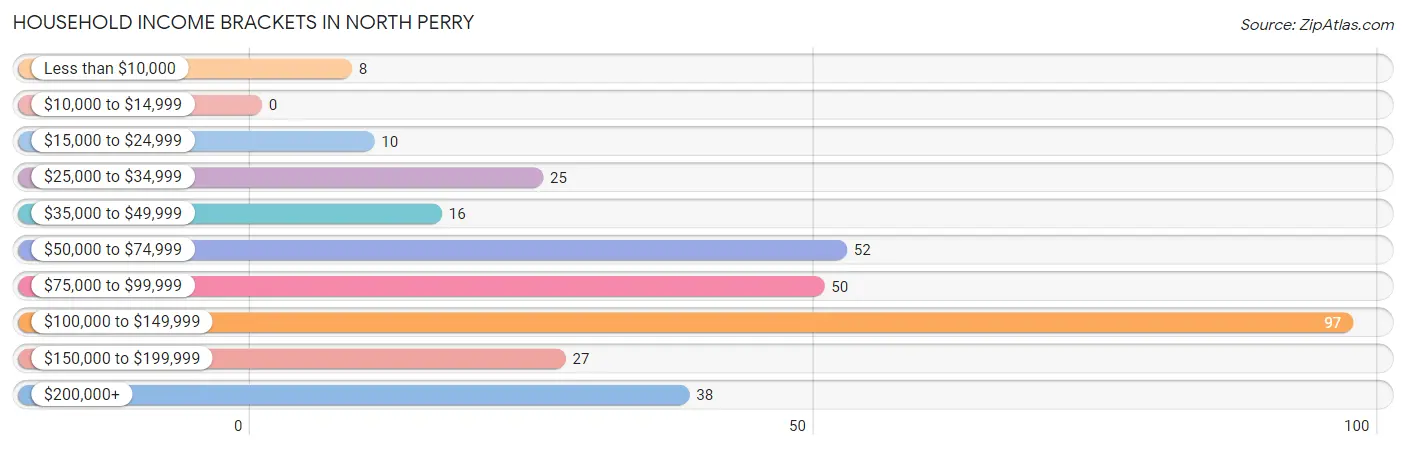
| Income Bracket | # Households | % Households |
| Less than $10,000 | 8 | 2.5% |
| $10,000 to $14,999 | 0 | 0.0% |
| $15,000 to $24,999 | 10 | 3.1% |
| $25,000 to $34,999 | 25 | 7.7% |
| $35,000 to $49,999 | 16 | 5.0% |
| $50,000 to $74,999 | 52 | 16.1% |
| $75,000 to $99,999 | 50 | 15.5% |
| $100,000 to $149,999 | 97 | 30.0% |
| $150,000 to $199,999 | 27 | 8.4% |
| $200,000+ | 38 | 11.8% |
Household Income by Householder Age in North Perry
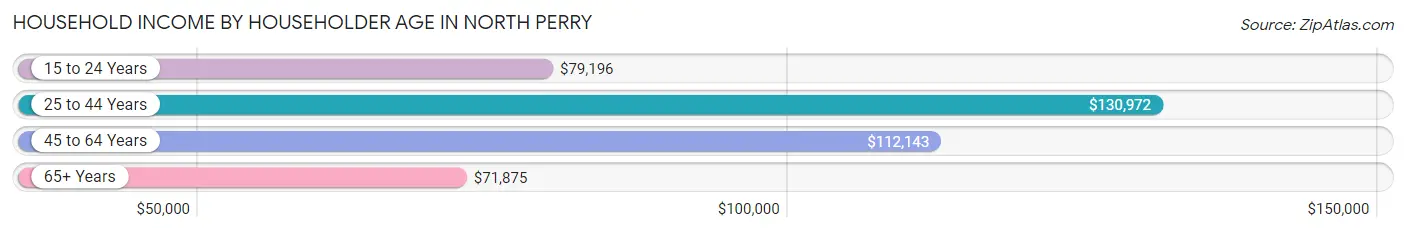
The median household income in North Perry is $100,625, with the highest median household income of $130,972 found in the 25 to 44 years age bracket for the primary householder. A total of 53 households (16.4%) fall into this category. Meanwhile, the 65+ years age bracket for the primary householder has the lowest median household income of $71,875, with 121 households (37.5%) in this group.
| Income Bracket | # Households | Median Income |
| 15 to 24 Years | 19 (5.9%) | $79,196 |
| 25 to 44 Years | 53 (16.4%) | $130,972 |
| 45 to 64 Years | 130 (40.3%) | $112,143 |
| 65+ Years | 121 (37.5%) | $71,875 |
| Total | 323 (100.0%) | $100,625 |
Poverty in North Perry
Income Below Poverty by Sex and Age in North Perry
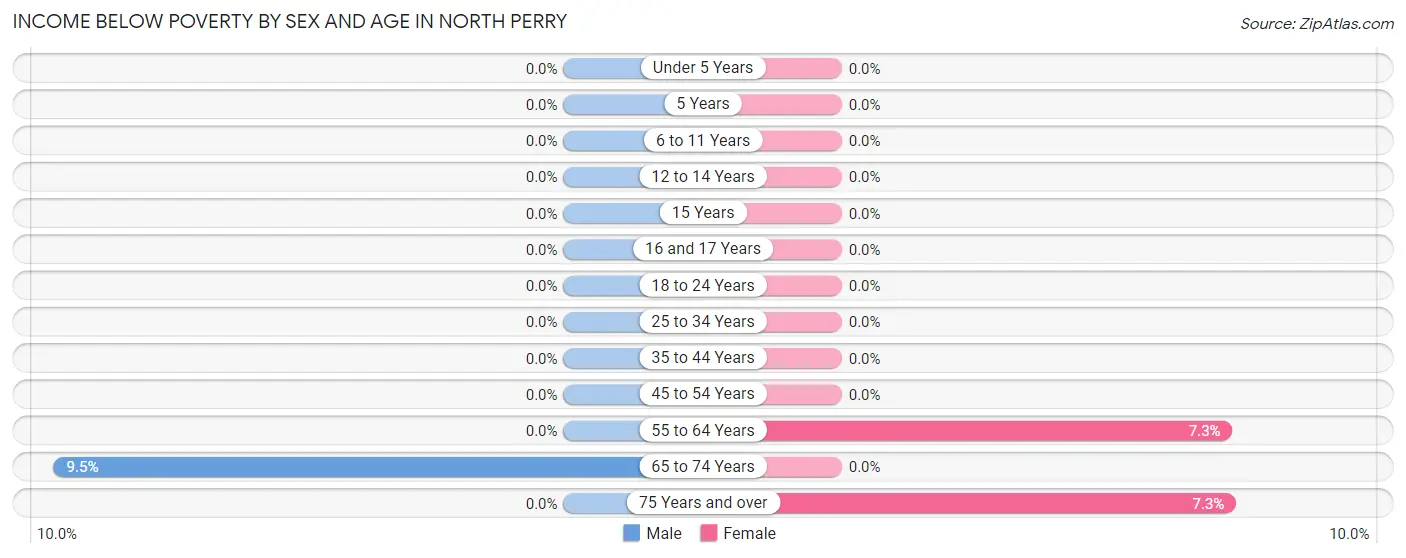
With 1.5% poverty level for males and 2.0% for females among the residents of North Perry, 65 to 74 year old males and 75 year old and over females are the most vulnerable to poverty, with 7 males (9.5%) and 3 females (7.3%) in their respective age groups living below the poverty level.
| Age Bracket | Male | Female |
| Under 5 Years | 0 (0.0%) | 0 (0.0%) |
| 5 Years | 0 (0.0%) | 0 (0.0%) |
| 6 to 11 Years | 0 (0.0%) | 0 (0.0%) |
| 12 to 14 Years | 0 (0.0%) | 0 (0.0%) |
| 15 Years | 0 (0.0%) | 0 (0.0%) |
| 16 and 17 Years | 0 (0.0%) | 0 (0.0%) |
| 18 to 24 Years | 0 (0.0%) | 0 (0.0%) |
| 25 to 34 Years | 0 (0.0%) | 0 (0.0%) |
| 35 to 44 Years | 0 (0.0%) | 0 (0.0%) |
| 45 to 54 Years | 0 (0.0%) | 0 (0.0%) |
| 55 to 64 Years | 0 (0.0%) | 5 (7.2%) |
| 65 to 74 Years | 7 (9.5%) | 0 (0.0%) |
| 75 Years and over | 0 (0.0%) | 3 (7.3%) |
| Total | 7 (1.5%) | 8 (2.0%) |
Income Above Poverty by Sex and Age in North Perry
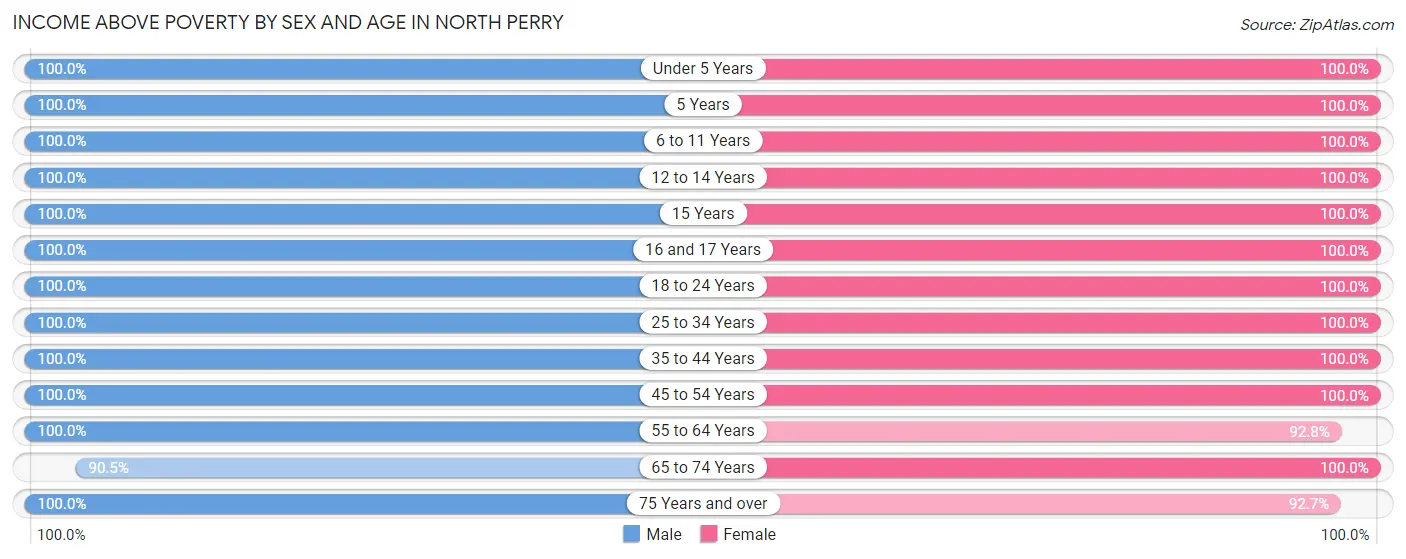
According to the poverty statistics in North Perry, males aged under 5 years and females aged under 5 years are the age groups that are most secure financially, with 100.0% of males and 100.0% of females in these age groups living above the poverty line.
| Age Bracket | Male | Female |
| Under 5 Years | 12 (100.0%) | 14 (100.0%) |
| 5 Years | 2 (100.0%) | 6 (100.0%) |
| 6 to 11 Years | 30 (100.0%) | 32 (100.0%) |
| 12 to 14 Years | 35 (100.0%) | 25 (100.0%) |
| 15 Years | 11 (100.0%) | 5 (100.0%) |
| 16 and 17 Years | 12 (100.0%) | 14 (100.0%) |
| 18 to 24 Years | 58 (100.0%) | 19 (100.0%) |
| 25 to 34 Years | 24 (100.0%) | 16 (100.0%) |
| 35 to 44 Years | 38 (100.0%) | 47 (100.0%) |
| 45 to 54 Years | 65 (100.0%) | 44 (100.0%) |
| 55 to 64 Years | 67 (100.0%) | 64 (92.7%) |
| 65 to 74 Years | 67 (90.5%) | 62 (100.0%) |
| 75 Years and over | 30 (100.0%) | 38 (92.7%) |
| Total | 451 (98.5%) | 386 (98.0%) |
Income Below Poverty Among Married-Couple Families in North Perry
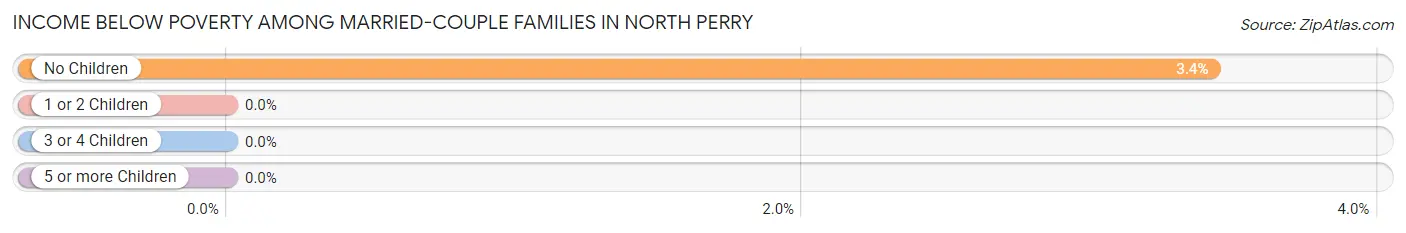
The poverty statistics for married-couple families in North Perry show that 2.3% or 5 of the total 218 families live below the poverty line. Families with no children have the highest poverty rate of 3.4%, comprising of 5 families. On the other hand, families with 1 or 2 children have the lowest poverty rate of 0.0%, which includes 0 families.
| Children | Above Poverty | Below Poverty |
| No Children | 141 (96.6%) | 5 (3.4%) |
| 1 or 2 Children | 47 (100.0%) | 0 (0.0%) |
| 3 or 4 Children | 25 (100.0%) | 0 (0.0%) |
| 5 or more Children | 0 (0.0%) | 0 (0.0%) |
| Total | 213 (97.7%) | 5 (2.3%) |
Income Below Poverty Among Single-Parent Households in North Perry
| Children | Single Father | Single Mother |
| No Children | 0 (0.0%) | 0 (0.0%) |
| 1 or 2 Children | 0 (0.0%) | 0 (0.0%) |
| 3 or 4 Children | 0 (0.0%) | 0 (0.0%) |
| 5 or more Children | 0 (0.0%) | 0 (0.0%) |
| Total | 0 (0.0%) | 0 (0.0%) |
Income Below Poverty Among Married-Couple vs Single-Parent Households in North Perry
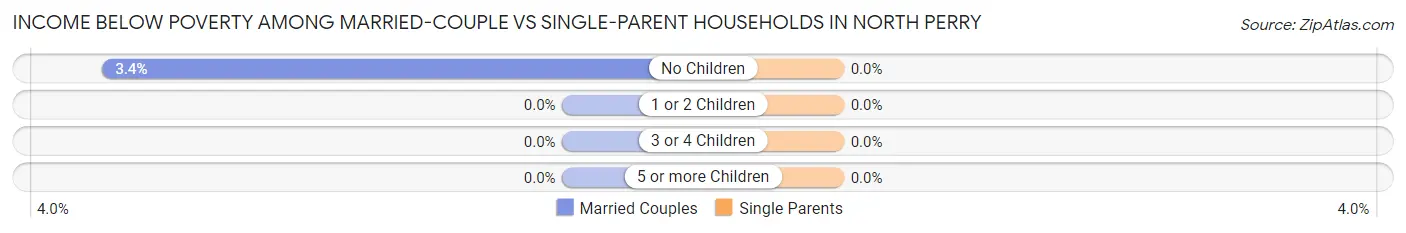
| Children | Married-Couple Families | Single-Parent Households |
| No Children | 5 (3.4%) | 0 (0.0%) |
| 1 or 2 Children | 0 (0.0%) | 0 (0.0%) |
| 3 or 4 Children | 0 (0.0%) | 0 (0.0%) |
| 5 or more Children | 0 (0.0%) | 0 (0.0%) |
| Total | 5 (2.3%) | 0 (0.0%) |
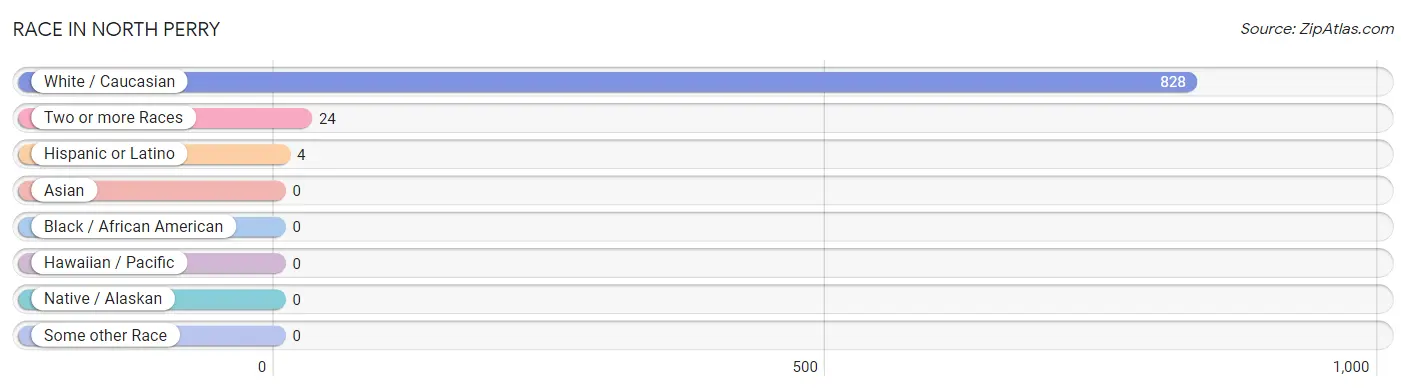
Race in North Perry
The most populous races in North Perry are White / Caucasian (828 | 97.2%), Two or more Races (24 | 2.8%), and Hispanic or Latino (4 | 0.5%).
| Race | # Population | % Population |
| Asian | 0 | 0.0% |
| Black / African American | 0 | 0.0% |
| Hawaiian / Pacific | 0 | 0.0% |
| Hispanic or Latino | 4 | 0.5% |
| Native / Alaskan | 0 | 0.0% |
| White / Caucasian | 828 | 97.2% |
| Two or more Races | 24 | 2.8% |
| Some other Race | 0 | 0.0% |
| Total | 852 | 100.0% |
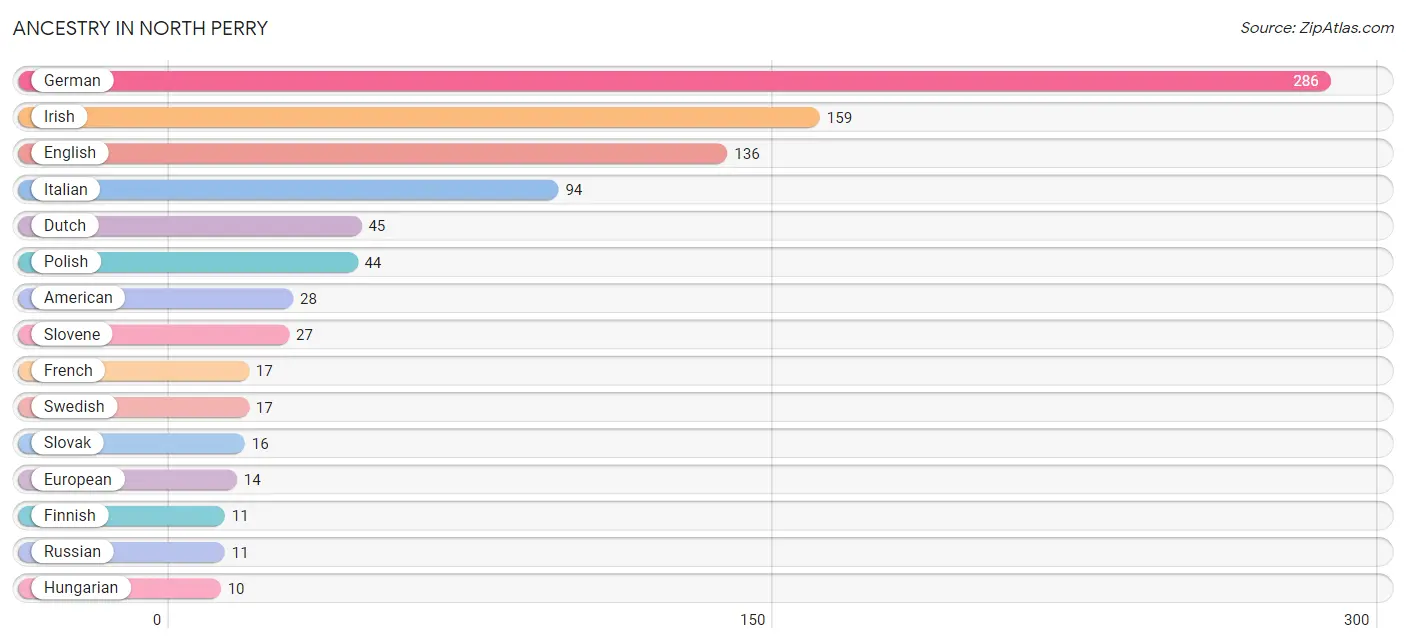
Ancestry in North Perry
The most populous ancestries reported in North Perry are German (286 | 33.6%), Irish (159 | 18.7%), English (136 | 16.0%), Italian (94 | 11.0%), and Dutch (45 | 5.3%), together accounting for 84.5% of all North Perry residents.
| Ancestry | # Population | % Population |
| American | 28 | 3.3% |
| Arab | 3 | 0.4% |
| Austrian | 2 | 0.2% |
| British | 4 | 0.5% |
| Choctaw | 2 | 0.2% |
| Croatian | 9 | 1.1% |
| Czech | 3 | 0.4% |
| Czechoslovakian | 3 | 0.4% |
| Dutch | 45 | 5.3% |
| English | 136 | 16.0% |
| European | 14 | 1.6% |
| Finnish | 11 | 1.3% |
| French | 17 | 2.0% |
| German | 286 | 33.6% |
| Greek | 5 | 0.6% |
| Hungarian | 10 | 1.2% |
| Irish | 159 | 18.7% |
| Italian | 94 | 11.0% |
| Lebanese | 3 | 0.4% |
| Mexican | 4 | 0.5% |
| Norwegian | 2 | 0.2% |
| Polish | 44 | 5.2% |
| Russian | 11 | 1.3% |
| Scandinavian | 1 | 0.1% |
| Scotch-Irish | 6 | 0.7% |
| Scottish | 9 | 1.1% |
| Slovak | 16 | 1.9% |
| Slovene | 27 | 3.2% |
| Swedish | 17 | 2.0% |
| Swiss | 5 | 0.6% |
| Welsh | 8 | 0.9% | View All 31 Rows |
Immigrants in North Perry
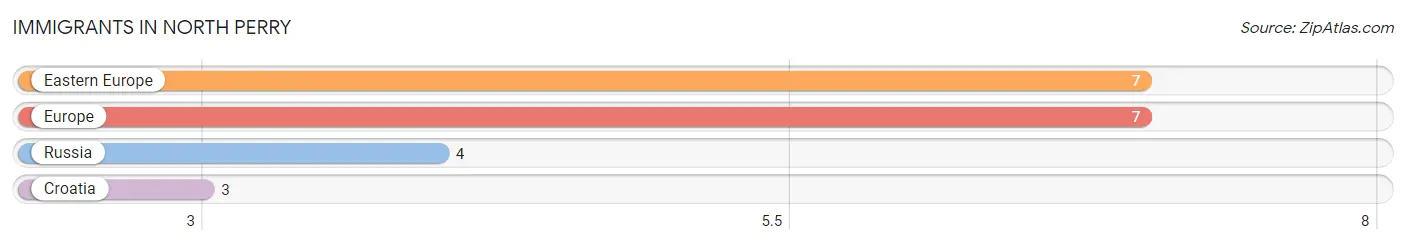
The most numerous immigrant groups reported in North Perry came from Eastern Europe (7 | 0.8%), Europe (7 | 0.8%), Russia (4 | 0.5%), and Croatia (3 | 0.4%), together accounting for 2.5% of all North Perry residents.
| Immigration Origin | # Population | % Population |
| Croatia | 3 | 0.4% |
| Eastern Europe | 7 | 0.8% |
| Europe | 7 | 0.8% |
| Russia | 4 | 0.5% | View All 4 Rows |
Sex and Age in North Perry
Sex and Age in North Perry
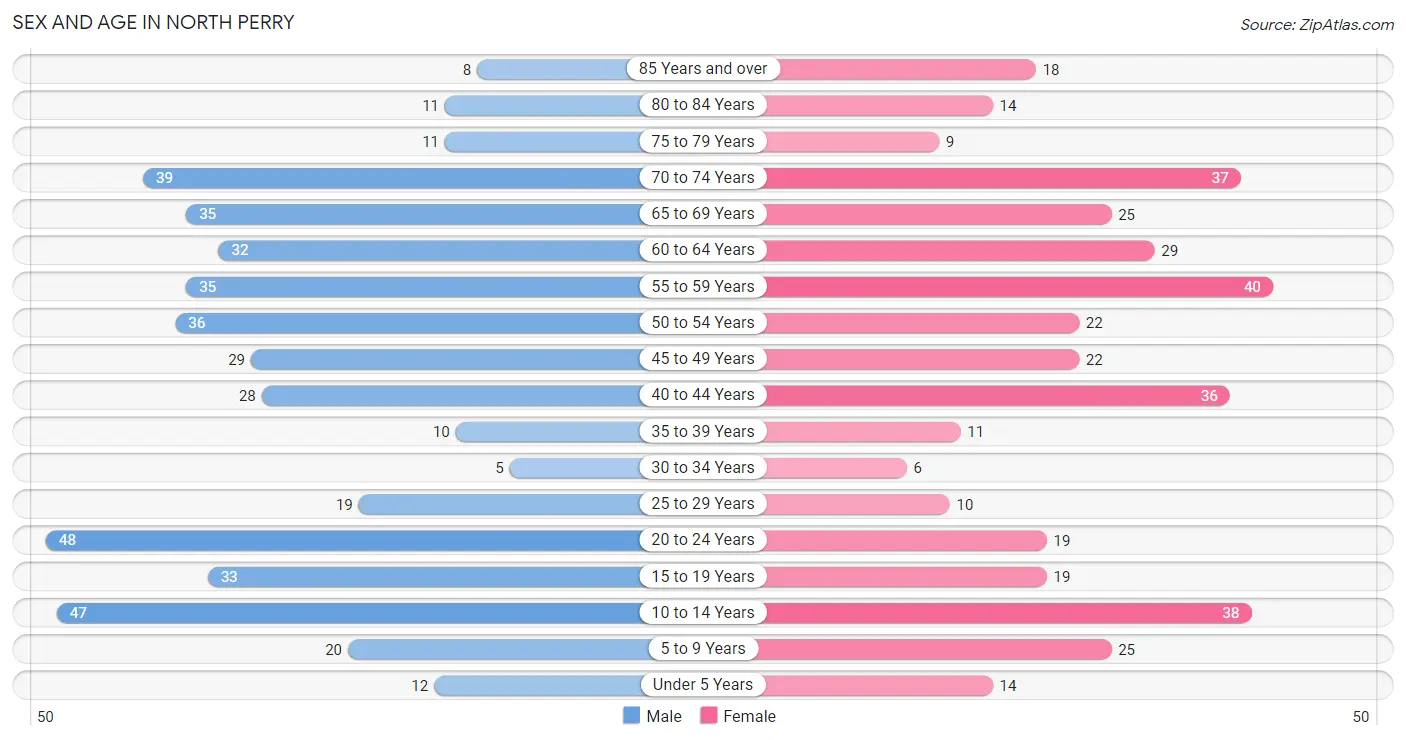
The most populous age groups in North Perry are 20 to 24 Years (48 | 10.5%) for men and 55 to 59 Years (40 | 10.2%) for women.
| Age Bracket | Male | Female |
| Under 5 Years | 12 (2.6%) | 14 (3.5%) |
| 5 to 9 Years | 20 (4.4%) | 25 (6.4%) |
| 10 to 14 Years | 47 (10.3%) | 38 (9.6%) |
| 15 to 19 Years | 33 (7.2%) | 19 (4.8%) |
| 20 to 24 Years | 48 (10.5%) | 19 (4.8%) |
| 25 to 29 Years | 19 (4.2%) | 10 (2.5%) |
| 30 to 34 Years | 5 (1.1%) | 6 (1.5%) |
| 35 to 39 Years | 10 (2.2%) | 11 (2.8%) |
| 40 to 44 Years | 28 (6.1%) | 36 (9.1%) |
| 45 to 49 Years | 29 (6.3%) | 22 (5.6%) |
| 50 to 54 Years | 36 (7.9%) | 22 (5.6%) |
| 55 to 59 Years | 35 (7.6%) | 40 (10.2%) |
| 60 to 64 Years | 32 (7.0%) | 29 (7.4%) |
| 65 to 69 Years | 35 (7.6%) | 25 (6.4%) |
| 70 to 74 Years | 39 (8.5%) | 37 (9.4%) |
| 75 to 79 Years | 11 (2.4%) | 9 (2.3%) |
| 80 to 84 Years | 11 (2.4%) | 14 (3.5%) |
| 85 Years and over | 8 (1.8%) | 18 (4.6%) |
| Total | 458 (100.0%) | 394 (100.0%) |
Families and Households in North Perry
Median Family Size in North Perry
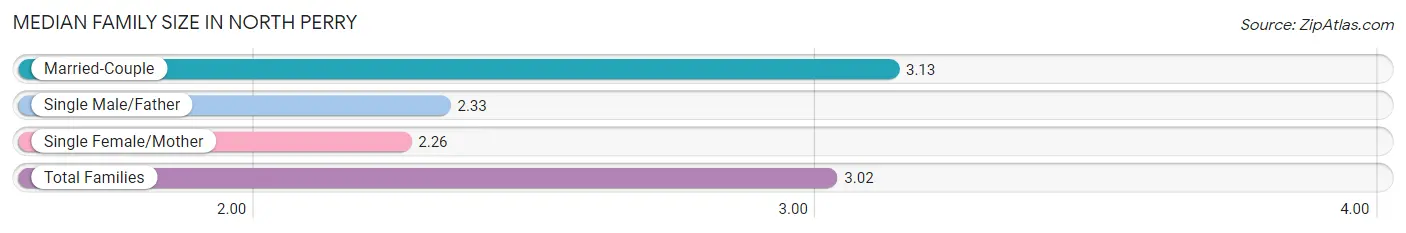
The median family size in North Perry is 3.02 persons per family, with married-couple families (218 | 86.5%) accounting for the largest median family size of 3.13 persons per family. On the other hand, single female/mother families (19 | 7.5%) represent the smallest median family size with 2.26 persons per family.
| Family Type | # Families | Family Size |
| Married-Couple | 218 (86.5%) | 3.13 |
| Single Male/Father | 15 (5.9%) | 2.33 |
| Single Female/Mother | 19 (7.5%) | 2.26 |
| Total Families | 252 (100.0%) | 3.02 |
Median Household Size in North Perry
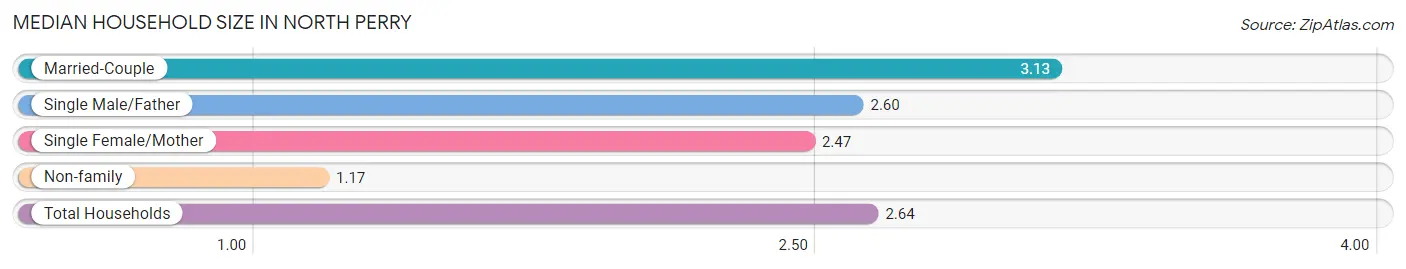
The median household size in North Perry is 2.64 persons per household, with married-couple households (218 | 67.5%) accounting for the largest median household size of 3.13 persons per household. non-family households (71 | 22.0%) represent the smallest median household size with 1.17 persons per household.
| Household Type | # Households | Household Size |
| Married-Couple | 218 (67.5%) | 3.13 |
| Single Male/Father | 15 (4.6%) | 2.60 |
| Single Female/Mother | 19 (5.9%) | 2.47 |
| Non-family | 71 (22.0%) | 1.17 |
| Total Households | 323 (100.0%) | 2.64 |
Household Size by Marriage Status in North Perry
Out of a total of 323 households in North Perry, 252 (78.0%) are family households, while 71 (22.0%) are nonfamily households. The most numerous type of family households are 2-person households, comprising 140, and the most common type of nonfamily households are 1-person households, comprising 66.
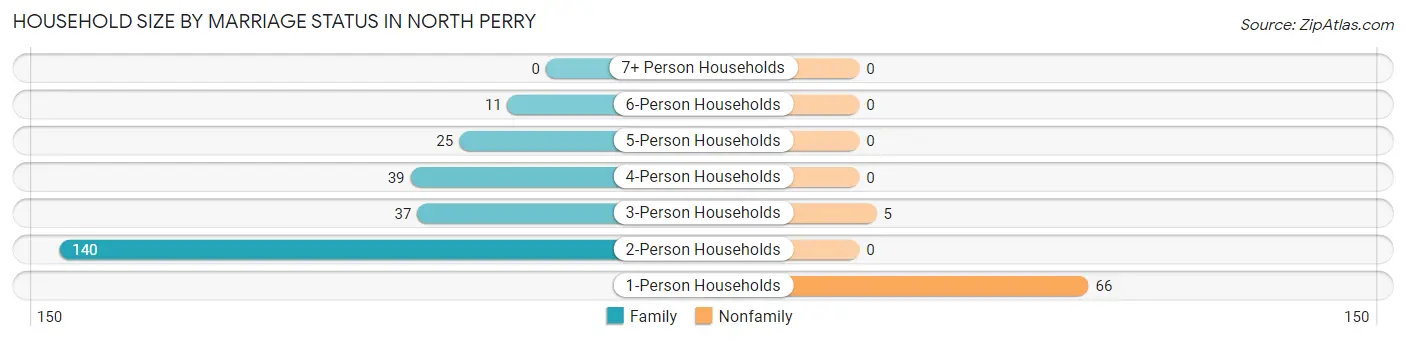
| Household Size | Family Households | Nonfamily Households |
| 1-Person Households | - | 66 (20.4%) |
| 2-Person Households | 140 (43.3%) | 0 (0.0%) |
| 3-Person Households | 37 (11.5%) | 5 (1.5%) |
| 4-Person Households | 39 (12.1%) | 0 (0.0%) |
| 5-Person Households | 25 (7.7%) | 0 (0.0%) |
| 6-Person Households | 11 (3.4%) | 0 (0.0%) |
| 7+ Person Households | 0 (0.0%) | 0 (0.0%) |
| Total | 252 (78.0%) | 71 (22.0%) |
Female Fertility in North Perry
Fertility by Age in North Perry
Average fertility rate in North Perry is 75.0 births per 1,000 women. Women in the age bracket of 20 to 34 years have the highest fertility rate with 229.0 births per 1,000 women. Women in the age bracket of 20 to 34 years acount for 80.0% of all women with births.
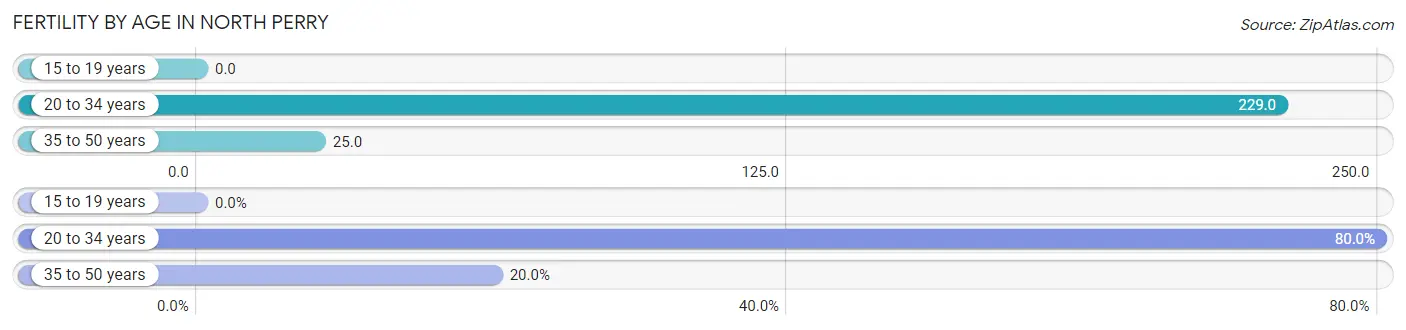
| Age Bracket | Women with Births | Births / 1,000 Women |
| 15 to 19 years | 0 (0.0%) | 0.0 |
| 20 to 34 years | 8 (80.0%) | 229.0 |
| 35 to 50 years | 2 (20.0%) | 25.0 |
| Total | 10 (100.0%) | 75.0 |
Fertility by Age by Marriage Status in North Perry
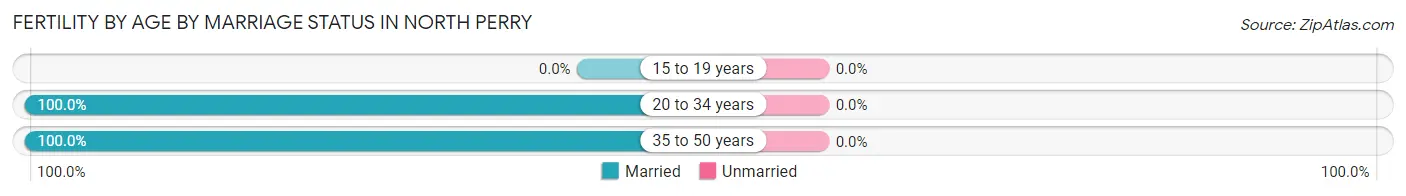
| Age Bracket | Married | Unmarried |
| 15 to 19 years | 0 (0.0%) | 0 (0.0%) |
| 20 to 34 years | 8 (100.0%) | 0 (0.0%) |
| 35 to 50 years | 2 (100.0%) | 0 (0.0%) |
| Total | 10 (100.0%) | 0 (0.0%) |
Fertility by Education in North Perry
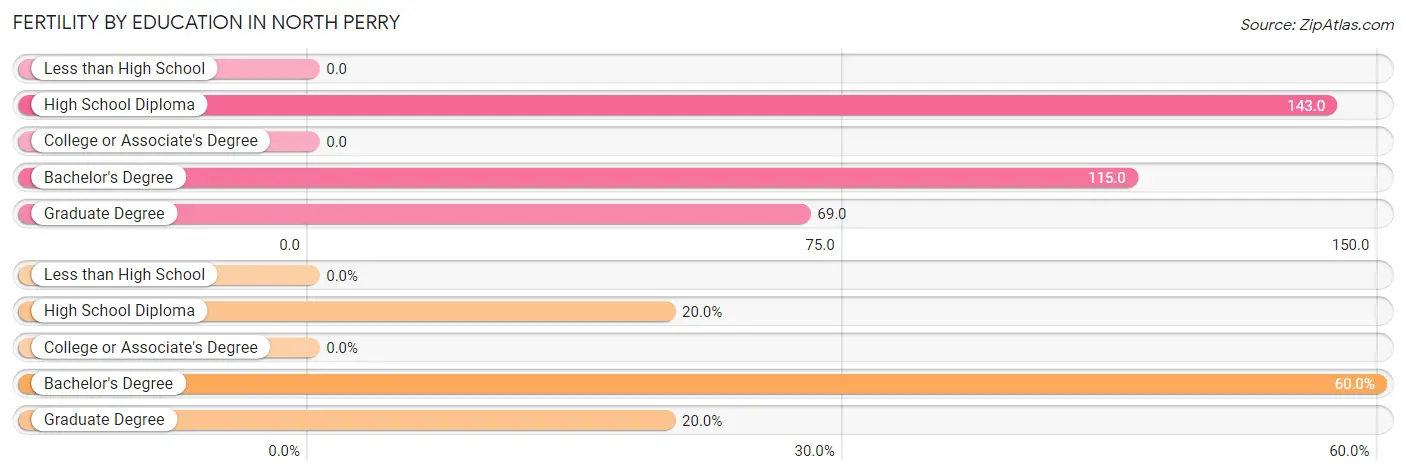
| Educational Attainment | Women with Births | Births / 1,000 Women |
| Less than High School | 0 (0.0%) | 0.0 |
| High School Diploma | 2 (20.0%) | 143.0 |
| College or Associate's Degree | 0 (0.0%) | 0.0 |
| Bachelor's Degree | 6 (60.0%) | 115.0 |
| Graduate Degree | 2 (20.0%) | 69.0 |
| Total | 10 (100.0%) | 75.0 |
Fertility by Education by Marriage Status in North Perry
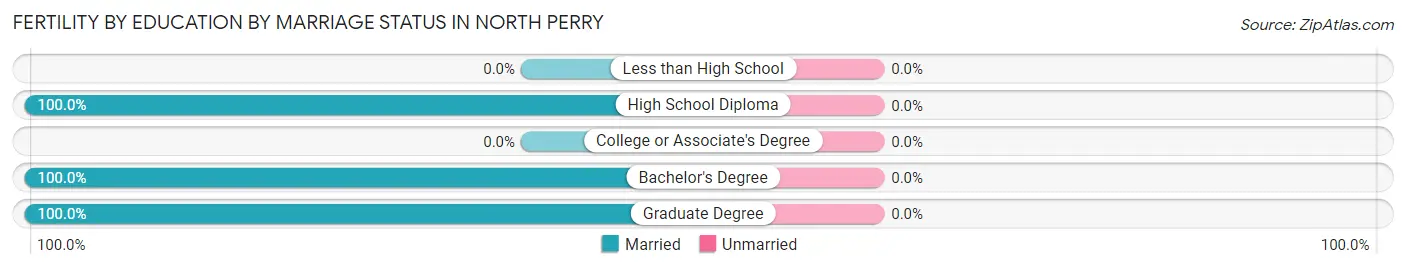
| Educational Attainment | Married | Unmarried |
| Less than High School | 0 (0.0%) | 0 (0.0%) |
| High School Diploma | 2 (100.0%) | 0 (0.0%) |
| College or Associate's Degree | 0 (0.0%) | 0 (0.0%) |
| Bachelor's Degree | 6 (100.0%) | 0 (0.0%) |
| Graduate Degree | 2 (100.0%) | 0 (0.0%) |
| Total | 10 (100.0%) | 0 (0.0%) |
Employment Characteristics in North Perry
Employment by Class of Employer in North Perry
Among the 420 employed individuals in North Perry, private company employees (302 | 71.9%), local government employees (41 | 9.8%), and not-for-profit organizations (31 | 7.4%) make up the most common classes of employment.
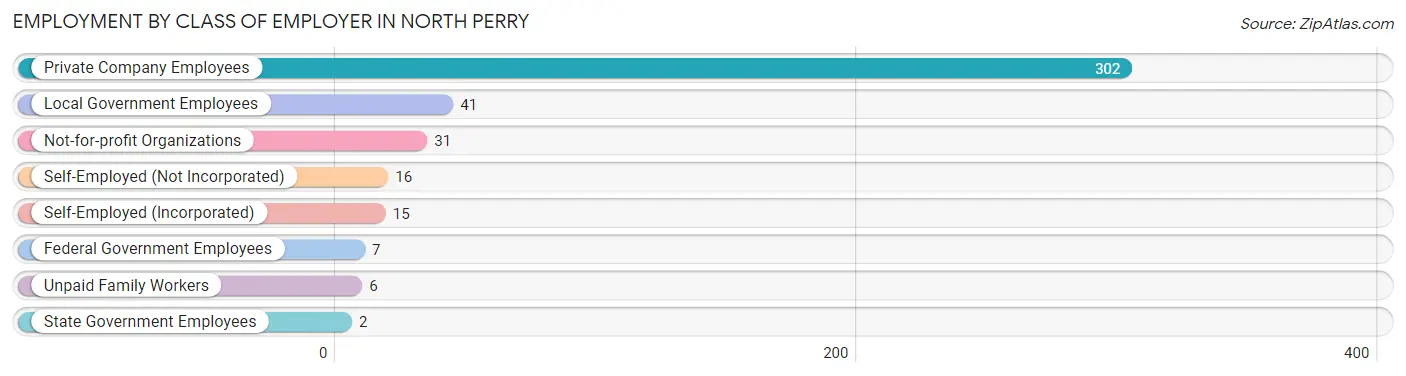
| Employer Class | # Employees | % Employees |
| Private Company Employees | 302 | 71.9% |
| Self-Employed (Incorporated) | 15 | 3.6% |
| Self-Employed (Not Incorporated) | 16 | 3.8% |
| Not-for-profit Organizations | 31 | 7.4% |
| Local Government Employees | 41 | 9.8% |
| State Government Employees | 2 | 0.5% |
| Federal Government Employees | 7 | 1.7% |
| Unpaid Family Workers | 6 | 1.4% |
| Total | 420 | 100.0% |
Employment Status by Age in North Perry
According to the labor force statistics for North Perry, out of the total population over 16 years of age (680), 66.8% or 454 individuals are in the labor force, with 5.1% or 23 of them unemployed. The age group with the highest labor force participation rate is 35 to 44 years, with 100.0% or 85 individuals in the labor force. Within the labor force, the 25 to 29 years age range has the highest percentage of unemployed individuals, with 16.0% or 4 of them being unemployed.
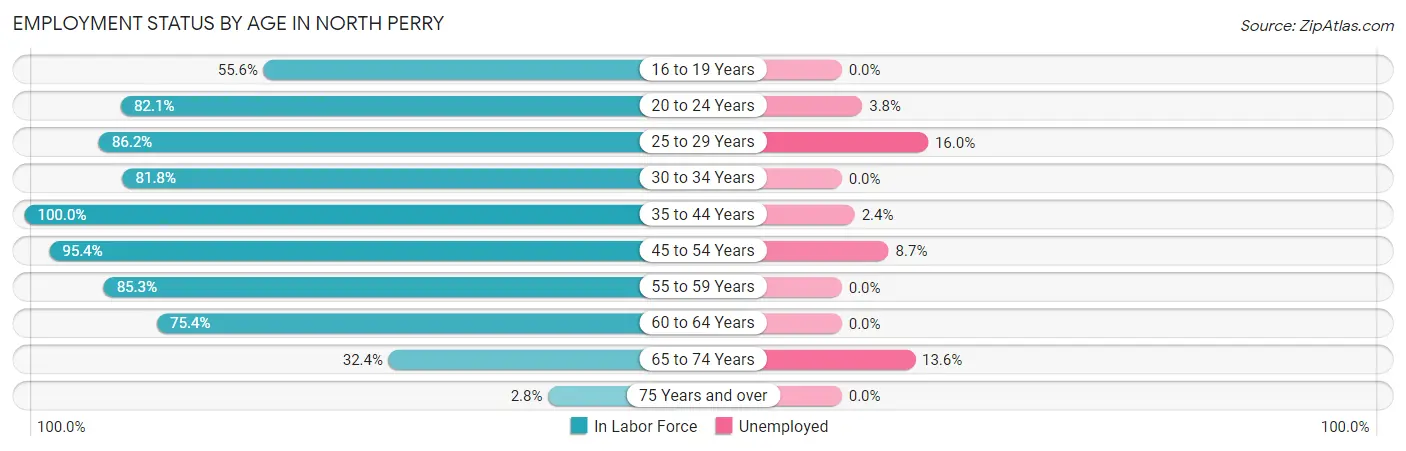
| Age Bracket | In Labor Force | Unemployed |
| 16 to 19 Years | 20 (55.6%) | 0 (0.0%) |
| 20 to 24 Years | 55 (82.1%) | 2 (3.8%) |
| 25 to 29 Years | 25 (86.2%) | 4 (16.0%) |
| 30 to 34 Years | 9 (81.8%) | 0 (0.0%) |
| 35 to 44 Years | 85 (100.0%) | 2 (2.4%) |
| 45 to 54 Years | 104 (95.4%) | 9 (8.7%) |
| 55 to 59 Years | 64 (85.3%) | 0 (0.0%) |
| 60 to 64 Years | 46 (75.4%) | 0 (0.0%) |
| 65 to 74 Years | 44 (32.4%) | 6 (13.6%) |
| 75 Years and over | 2 (2.8%) | 0 (0.0%) |
| Total | 454 (66.8%) | 23 (5.1%) |
Employment Status by Educational Attainment in North Perry
According to labor force statistics for North Perry, 90.0% of individuals (333) out of the total population between 25 and 64 years of age (370) are in the labor force, with 4.5% or 15 of them being unemployed. The group with the highest labor force participation rate are those with the educational attainment of less than high school, with 100.0% or 2 individuals in the labor force. Within the labor force, individuals with high school diploma education have the highest percentage of unemployment, with 7.8% or 6 of them being unemployed.
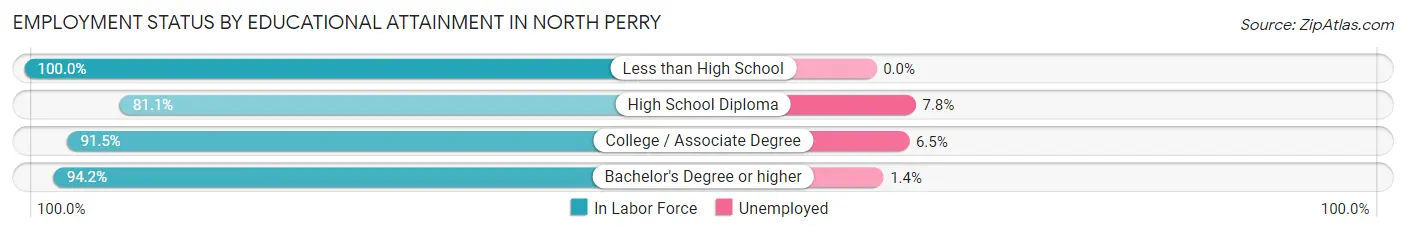
| Educational Attainment | In Labor Force | Unemployed |
| Less than High School | 2 (100.0%) | 0 (0.0%) |
| High School Diploma | 77 (81.1%) | 7 (7.8%) |
| College / Associate Degree | 108 (91.5%) | 8 (6.5%) |
| Bachelor's Degree or higher | 146 (94.2%) | 2 (1.4%) |
| Total | 333 (90.0%) | 17 (4.5%) |
Employment Occupations by Sex in North Perry
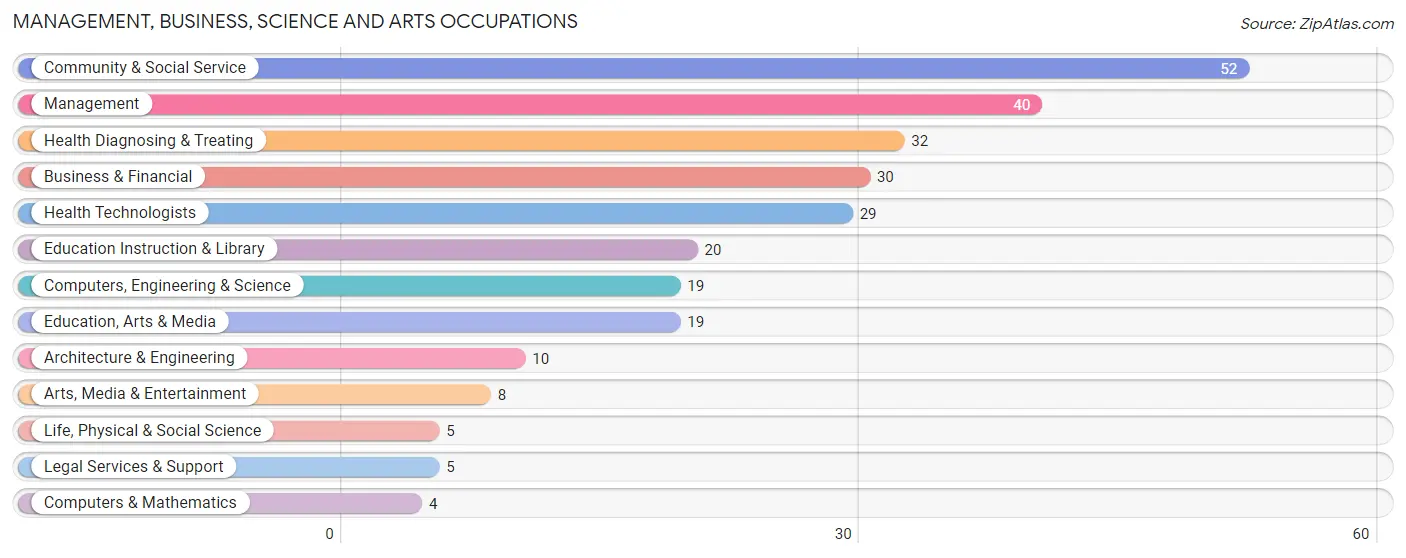
Management, Business, Science and Arts Occupations
The most common Management, Business, Science and Arts occupations in North Perry are Community & Social Service (52 | 12.1%), Management (40 | 9.3%), Health Diagnosing & Treating (32 | 7.5%), Business & Financial (30 | 7.0%), and Health Technologists (29 | 6.8%).
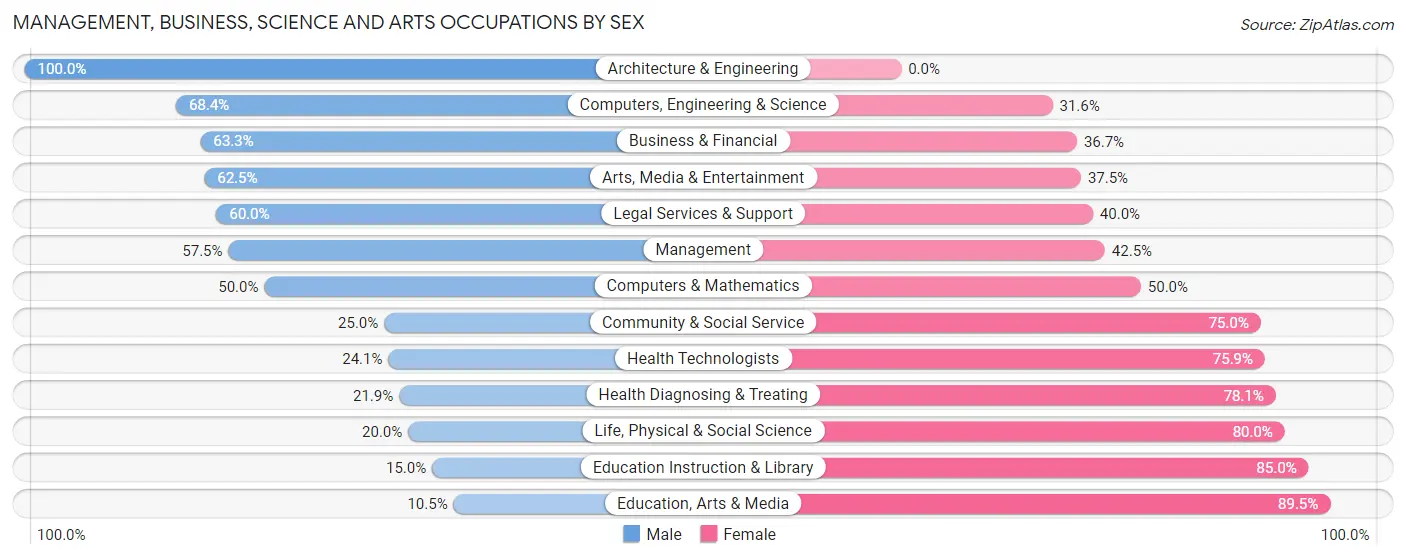
Management, Business, Science and Arts Occupations by Sex
Within the Management, Business, Science and Arts occupations in North Perry, the most male-oriented occupations are Architecture & Engineering (100.0%), Computers, Engineering & Science (68.4%), and Business & Financial (63.3%), while the most female-oriented occupations are Education, Arts & Media (89.5%), Education Instruction & Library (85.0%), and Life, Physical & Social Science (80.0%).
| Occupation | Male | Female |
| Management | 23 (57.5%) | 17 (42.5%) |
| Business & Financial | 19 (63.3%) | 11 (36.7%) |
| Computers, Engineering & Science | 13 (68.4%) | 6 (31.6%) |
| Computers & Mathematics | 2 (50.0%) | 2 (50.0%) |
| Architecture & Engineering | 10 (100.0%) | 0 (0.0%) |
| Life, Physical & Social Science | 1 (20.0%) | 4 (80.0%) |
| Community & Social Service | 13 (25.0%) | 39 (75.0%) |
| Education, Arts & Media | 2 (10.5%) | 17 (89.5%) |
| Legal Services & Support | 3 (60.0%) | 2 (40.0%) |
| Education Instruction & Library | 3 (15.0%) | 17 (85.0%) |
| Arts, Media & Entertainment | 5 (62.5%) | 3 (37.5%) |
| Health Diagnosing & Treating | 7 (21.9%) | 25 (78.1%) |
| Health Technologists | 7 (24.1%) | 22 (75.9%) |
| Total (Category) | 75 (43.3%) | 98 (56.7%) |
| Total (Overall) | 251 (58.5%) | 178 (41.5%) |
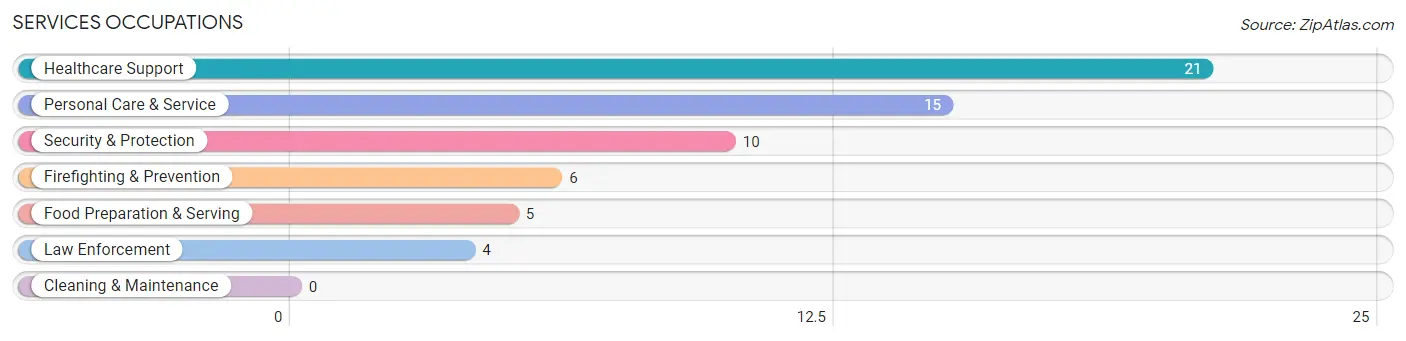
Services Occupations
The most common Services occupations in North Perry are Healthcare Support (21 | 4.9%), Personal Care & Service (15 | 3.5%), Security & Protection (10 | 2.3%), Firefighting & Prevention (6 | 1.4%), and Food Preparation & Serving (5 | 1.2%).
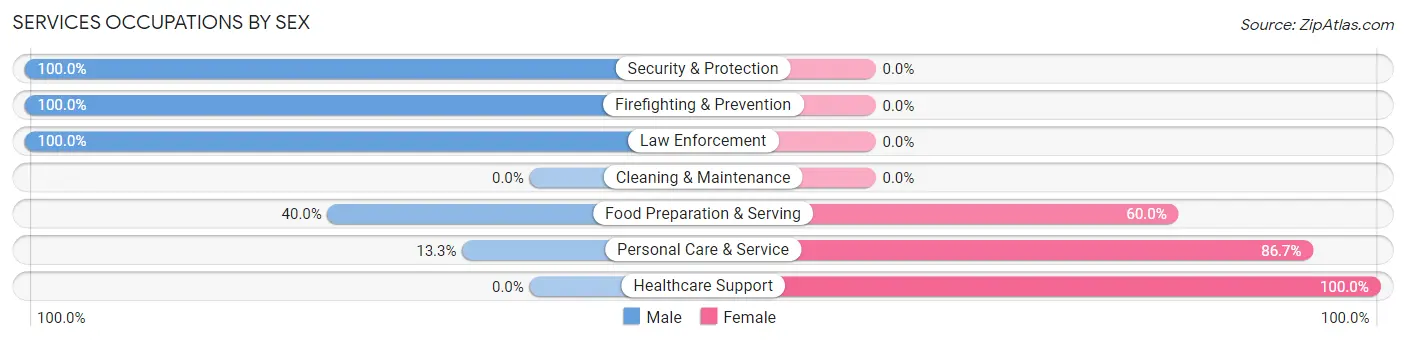
Services Occupations by Sex
Within the Services occupations in North Perry, the most male-oriented occupations are Security & Protection (100.0%), Firefighting & Prevention (100.0%), and Law Enforcement (100.0%), while the most female-oriented occupations are Healthcare Support (100.0%), Personal Care & Service (86.7%), and Food Preparation & Serving (60.0%).
| Occupation | Male | Female |
| Healthcare Support | 0 (0.0%) | 21 (100.0%) |
| Security & Protection | 10 (100.0%) | 0 (0.0%) |
| Firefighting & Prevention | 6 (100.0%) | 0 (0.0%) |
| Law Enforcement | 4 (100.0%) | 0 (0.0%) |
| Food Preparation & Serving | 2 (40.0%) | 3 (60.0%) |
| Cleaning & Maintenance | 0 (0.0%) | 0 (0.0%) |
| Personal Care & Service | 2 (13.3%) | 13 (86.7%) |
| Total (Category) | 14 (27.5%) | 37 (72.6%) |
| Total (Overall) | 251 (58.5%) | 178 (41.5%) |
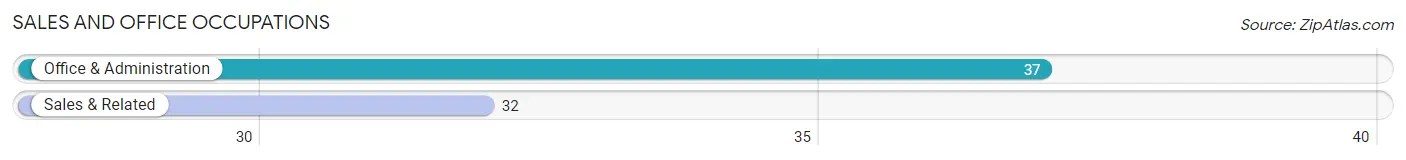
Sales and Office Occupations
The most common Sales and Office occupations in North Perry are Office & Administration (37 | 8.6%), and Sales & Related (32 | 7.5%).
Sales and Office Occupations by Sex
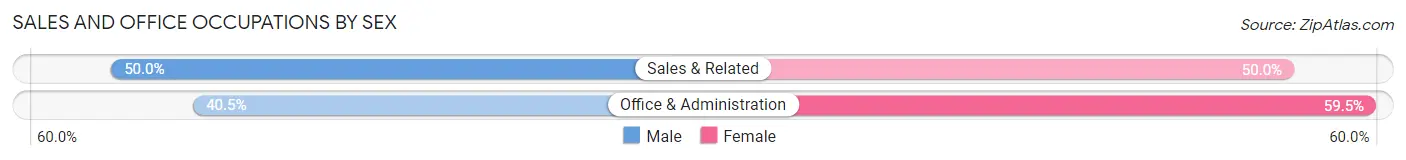
| Occupation | Male | Female |
| Sales & Related | 16 (50.0%) | 16 (50.0%) |
| Office & Administration | 15 (40.5%) | 22 (59.5%) |
| Total (Category) | 31 (44.9%) | 38 (55.1%) |
| Total (Overall) | 251 (58.5%) | 178 (41.5%) |
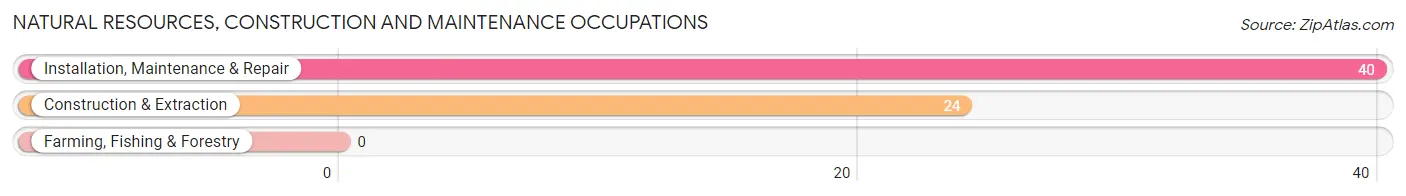
Natural Resources, Construction and Maintenance Occupations
The most common Natural Resources, Construction and Maintenance occupations in North Perry are Installation, Maintenance & Repair (40 | 9.3%), and Construction & Extraction (24 | 5.6%).
Natural Resources, Construction and Maintenance Occupations by Sex
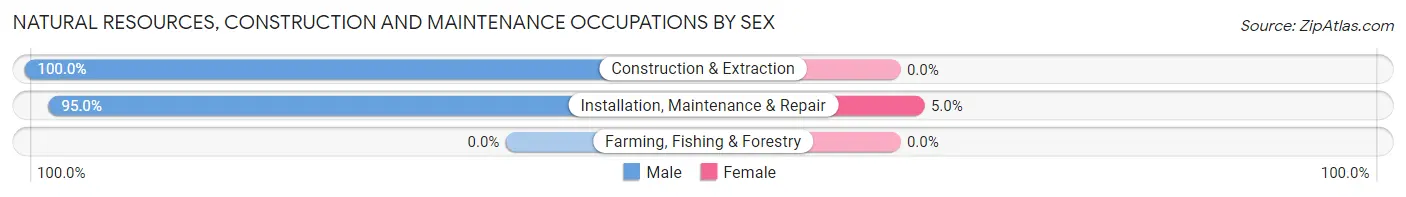
| Occupation | Male | Female |
| Farming, Fishing & Forestry | 0 (0.0%) | 0 (0.0%) |
| Construction & Extraction | 24 (100.0%) | 0 (0.0%) |
| Installation, Maintenance & Repair | 38 (95.0%) | 2 (5.0%) |
| Total (Category) | 62 (96.9%) | 2 (3.1%) |
| Total (Overall) | 251 (58.5%) | 178 (41.5%) |
Production, Transportation and Moving Occupations
The most common Production, Transportation and Moving occupations in North Perry are Production (50 | 11.7%), Transportation (12 | 2.8%), and Material Moving (10 | 2.3%).
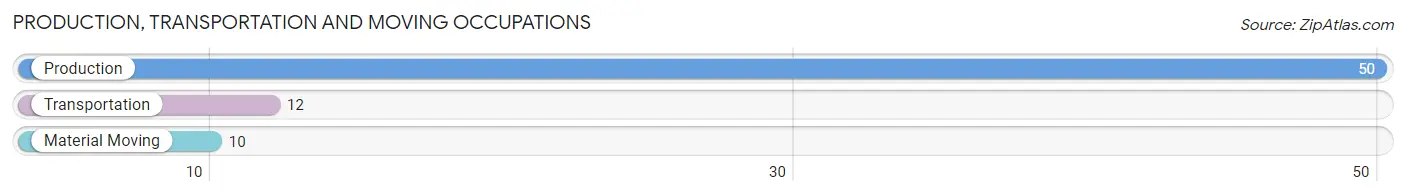
Production, Transportation and Moving Occupations by Sex

| Occupation | Male | Female |
| Production | 49 (98.0%) | 1 (2.0%) |
| Transportation | 12 (100.0%) | 0 (0.0%) |
| Material Moving | 8 (80.0%) | 2 (20.0%) |
| Total (Category) | 69 (95.8%) | 3 (4.2%) |
| Total (Overall) | 251 (58.5%) | 178 (41.5%) |
Employment Industries by Sex in North Perry
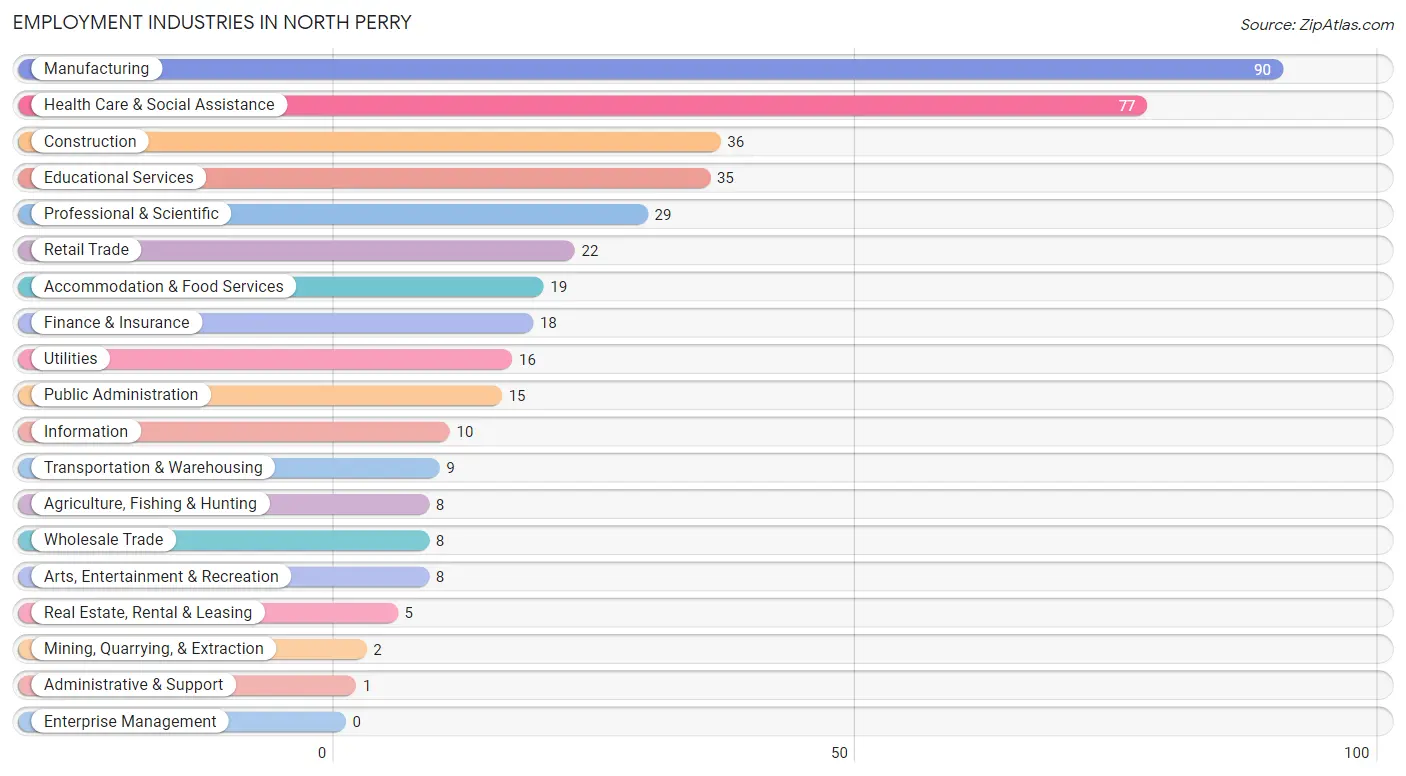
Employment Industries in North Perry
The major employment industries in North Perry include Manufacturing (90 | 21.0%), Health Care & Social Assistance (77 | 17.9%), Construction (36 | 8.4%), Educational Services (35 | 8.2%), and Professional & Scientific (29 | 6.8%).
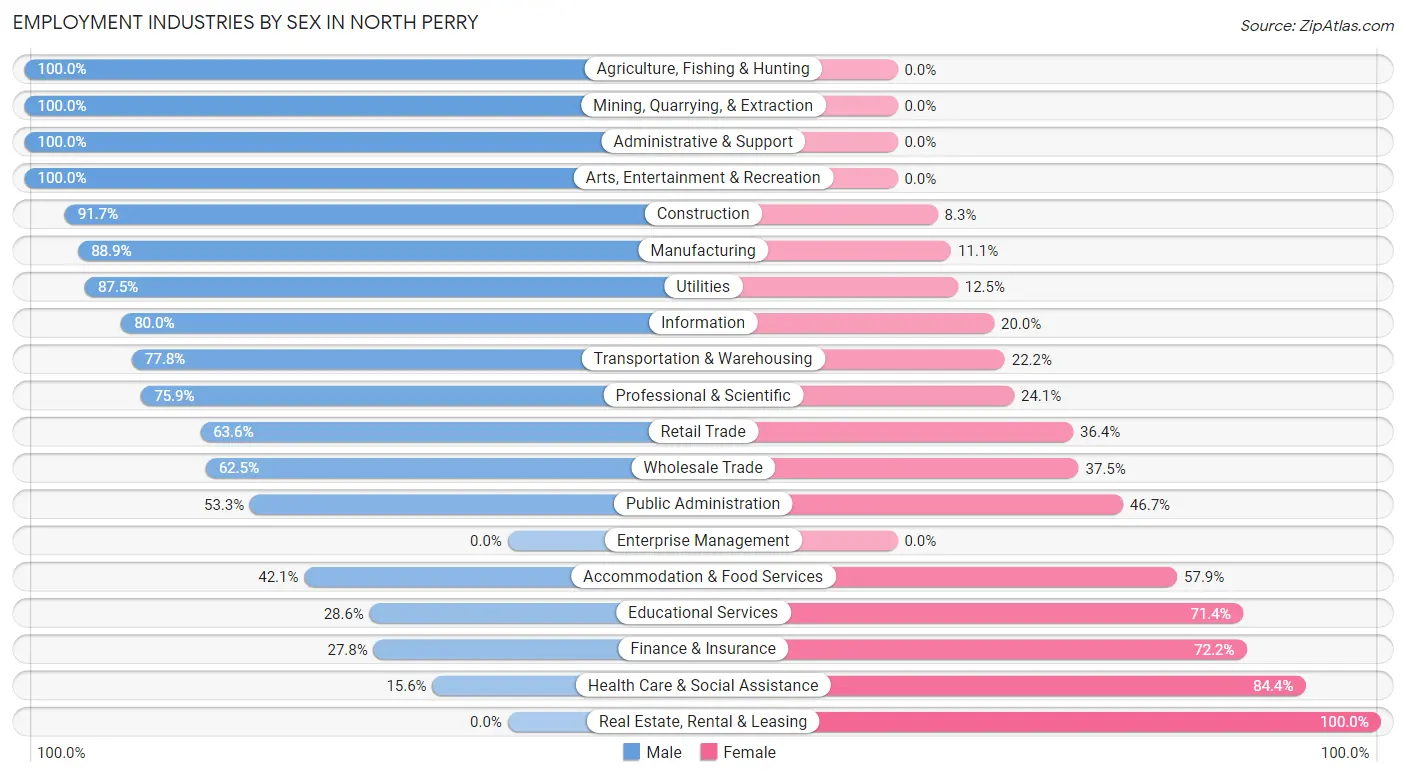
Employment Industries by Sex in North Perry
The North Perry industries that see more men than women are Agriculture, Fishing & Hunting (100.0%), Mining, Quarrying, & Extraction (100.0%), and Administrative & Support (100.0%), whereas the industries that tend to have a higher number of women are Real Estate, Rental & Leasing (100.0%), Health Care & Social Assistance (84.4%), and Finance & Insurance (72.2%).
| Industry | Male | Female |
| Agriculture, Fishing & Hunting | 8 (100.0%) | 0 (0.0%) |
| Mining, Quarrying, & Extraction | 2 (100.0%) | 0 (0.0%) |
| Construction | 33 (91.7%) | 3 (8.3%) |
| Manufacturing | 80 (88.9%) | 10 (11.1%) |
| Wholesale Trade | 5 (62.5%) | 3 (37.5%) |
| Retail Trade | 14 (63.6%) | 8 (36.4%) |
| Transportation & Warehousing | 7 (77.8%) | 2 (22.2%) |
| Utilities | 14 (87.5%) | 2 (12.5%) |
| Information | 8 (80.0%) | 2 (20.0%) |
| Finance & Insurance | 5 (27.8%) | 13 (72.2%) |
| Real Estate, Rental & Leasing | 0 (0.0%) | 5 (100.0%) |
| Professional & Scientific | 22 (75.9%) | 7 (24.1%) |
| Enterprise Management | 0 (0.0%) | 0 (0.0%) |
| Administrative & Support | 1 (100.0%) | 0 (0.0%) |
| Educational Services | 10 (28.6%) | 25 (71.4%) |
| Health Care & Social Assistance | 12 (15.6%) | 65 (84.4%) |
| Arts, Entertainment & Recreation | 8 (100.0%) | 0 (0.0%) |
| Accommodation & Food Services | 8 (42.1%) | 11 (57.9%) |
| Public Administration | 8 (53.3%) | 7 (46.7%) |
| Total | 251 (58.5%) | 178 (41.5%) |
Education in North Perry
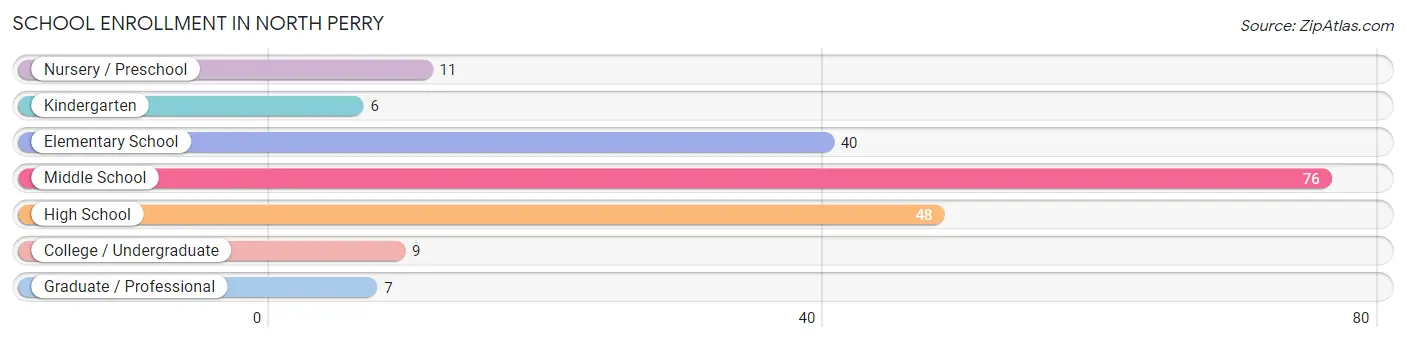
School Enrollment in North Perry
The most common levels of schooling among the 197 students in North Perry are middle school (76 | 38.6%), high school (48 | 24.4%), and elementary school (40 | 20.3%).
| School Level | # Students | % Students |
| Nursery / Preschool | 11 | 5.6% |
| Kindergarten | 6 | 3.0% |
| Elementary School | 40 | 20.3% |
| Middle School | 76 | 38.6% |
| High School | 48 | 24.4% |
| College / Undergraduate | 9 | 4.6% |
| Graduate / Professional | 7 | 3.5% |
| Total | 197 | 100.0% |
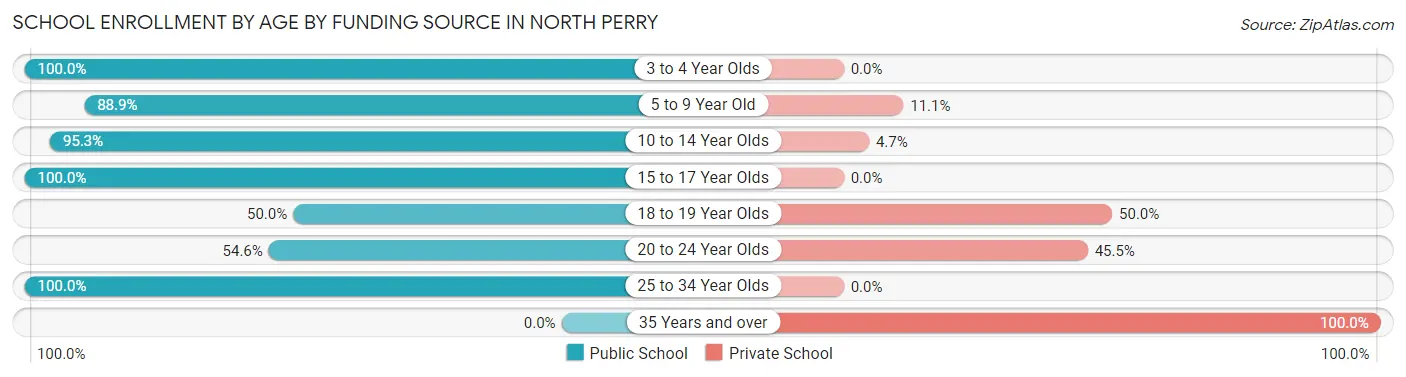
School Enrollment by Age by Funding Source in North Perry
Out of a total of 197 students who are enrolled in schools in North Perry, 18 (9.1%) attend a private institution, while the remaining 179 (90.9%) are enrolled in public schools. The age group of 35 years and over has the highest likelihood of being enrolled in private schools, with 2 (100.0% in the age bracket) enrolled. Conversely, the age group of 3 to 4 year olds has the lowest likelihood of being enrolled in a private school, with 7 (100.0% in the age bracket) attending a public institution.
| Age Bracket | Public School | Private School |
| 3 to 4 Year Olds | 7 (100.0%) | 0 (0.0%) |
| 5 to 9 Year Old | 40 (88.9%) | 5 (11.1%) |
| 10 to 14 Year Olds | 81 (95.3%) | 4 (4.7%) |
| 15 to 17 Year Olds | 42 (100.0%) | 0 (0.0%) |
| 18 to 19 Year Olds | 2 (50.0%) | 2 (50.0%) |
| 20 to 24 Year Olds | 6 (54.5%) | 5 (45.5%) |
| 25 to 34 Year Olds | 1 (100.0%) | 0 (0.0%) |
| 35 Years and over | 0 (0.0%) | 2 (100.0%) |
| Total | 179 (90.9%) | 18 (9.1%) |
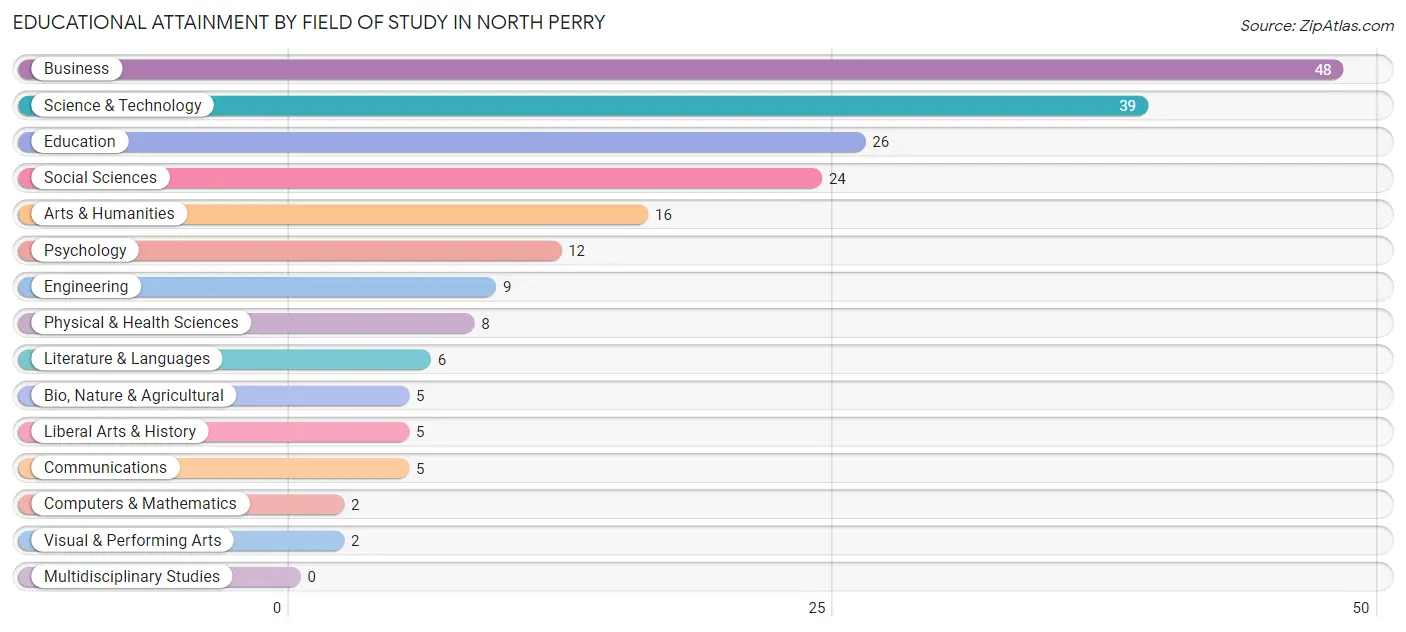
Educational Attainment by Field of Study in North Perry
Business (48 | 23.2%), science & technology (39 | 18.8%), education (26 | 12.6%), social sciences (24 | 11.6%), and arts & humanities (16 | 7.7%) are the most common fields of study among 207 individuals in North Perry who have obtained a bachelor's degree or higher.
| Field of Study | # Graduates | % Graduates |
| Computers & Mathematics | 2 | 1.0% |
| Bio, Nature & Agricultural | 5 | 2.4% |
| Physical & Health Sciences | 8 | 3.9% |
| Psychology | 12 | 5.8% |
| Social Sciences | 24 | 11.6% |
| Engineering | 9 | 4.3% |
| Multidisciplinary Studies | 0 | 0.0% |
| Science & Technology | 39 | 18.8% |
| Business | 48 | 23.2% |
| Education | 26 | 12.6% |
| Literature & Languages | 6 | 2.9% |
| Liberal Arts & History | 5 | 2.4% |
| Visual & Performing Arts | 2 | 1.0% |
| Communications | 5 | 2.4% |
| Arts & Humanities | 16 | 7.7% |
| Total | 207 | 100.0% |
Transportation & Commute in North Perry
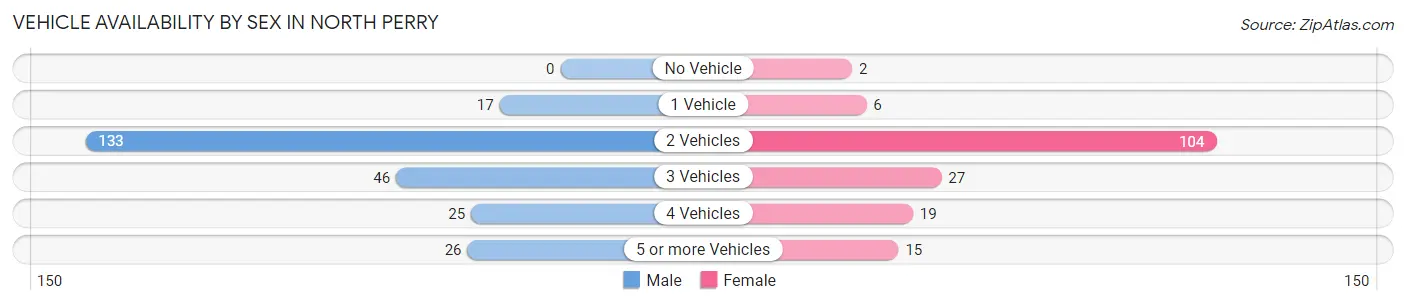
Vehicle Availability by Sex in North Perry
The most prevalent vehicle ownership categories in North Perry are males with 2 vehicles (133, accounting for 53.8%) and females with 2 vehicles (104, making up 76.9%).
| Vehicles Available | Male | Female |
| No Vehicle | 0 (0.0%) | 2 (1.2%) |
| 1 Vehicle | 17 (6.9%) | 6 (3.5%) |
| 2 Vehicles | 133 (53.8%) | 104 (60.1%) |
| 3 Vehicles | 46 (18.6%) | 27 (15.6%) |
| 4 Vehicles | 25 (10.1%) | 19 (11.0%) |
| 5 or more Vehicles | 26 (10.5%) | 15 (8.7%) |
| Total | 247 (100.0%) | 173 (100.0%) |
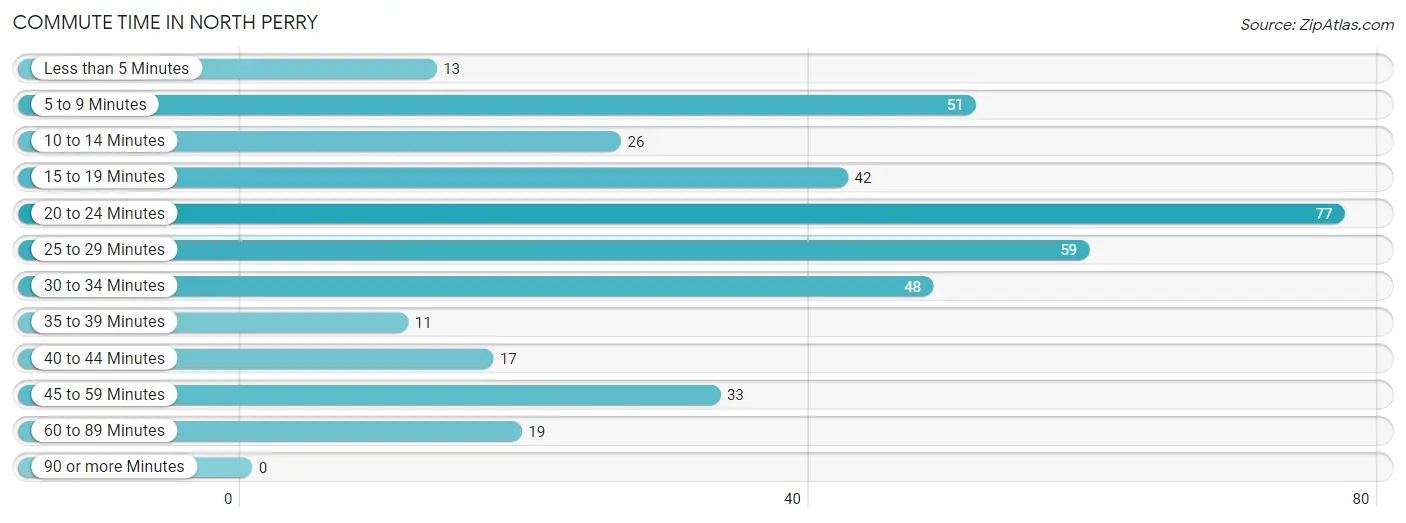
Commute Time in North Perry
The most frequently occuring commute durations in North Perry are 20 to 24 minutes (77 commuters, 19.4%), 25 to 29 minutes (59 commuters, 14.9%), and 5 to 9 minutes (51 commuters, 12.9%).
| Commute Time | # Commuters | % Commuters |
| Less than 5 Minutes | 13 | 3.3% |
| 5 to 9 Minutes | 51 | 12.9% |
| 10 to 14 Minutes | 26 | 6.6% |
| 15 to 19 Minutes | 42 | 10.6% |
| 20 to 24 Minutes | 77 | 19.4% |
| 25 to 29 Minutes | 59 | 14.9% |
| 30 to 34 Minutes | 48 | 12.1% |
| 35 to 39 Minutes | 11 | 2.8% |
| 40 to 44 Minutes | 17 | 4.3% |
| 45 to 59 Minutes | 33 | 8.3% |
| 60 to 89 Minutes | 19 | 4.8% |
| 90 or more Minutes | 0 | 0.0% |
Commute Time by Sex in North Perry
The most common commute times in North Perry are 25 to 29 minutes (40 commuters, 17.4%) for males and 20 to 24 minutes (40 commuters, 24.1%) for females.
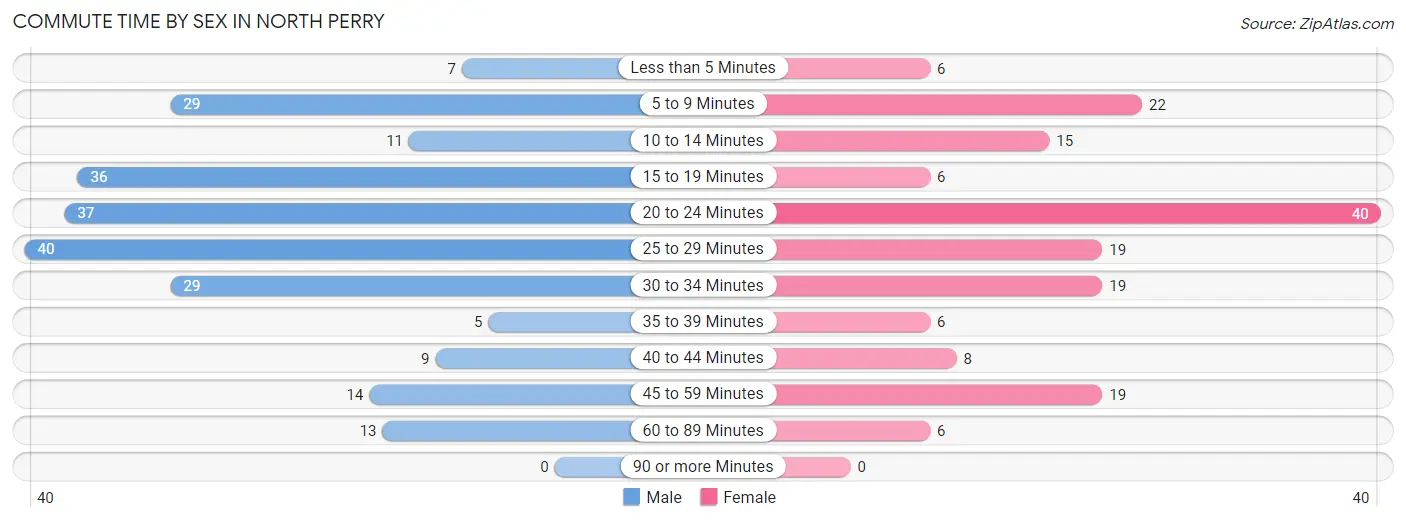
| Commute Time | Male | Female |
| Less than 5 Minutes | 7 (3.0%) | 6 (3.6%) |
| 5 to 9 Minutes | 29 (12.6%) | 22 (13.3%) |
| 10 to 14 Minutes | 11 (4.8%) | 15 (9.0%) |
| 15 to 19 Minutes | 36 (15.7%) | 6 (3.6%) |
| 20 to 24 Minutes | 37 (16.1%) | 40 (24.1%) |
| 25 to 29 Minutes | 40 (17.4%) | 19 (11.5%) |
| 30 to 34 Minutes | 29 (12.6%) | 19 (11.5%) |
| 35 to 39 Minutes | 5 (2.2%) | 6 (3.6%) |
| 40 to 44 Minutes | 9 (3.9%) | 8 (4.8%) |
| 45 to 59 Minutes | 14 (6.1%) | 19 (11.5%) |
| 60 to 89 Minutes | 13 (5.7%) | 6 (3.6%) |
| 90 or more Minutes | 0 (0.0%) | 0 (0.0%) |
Time of Departure to Work by Sex in North Perry
The most frequent times of departure to work in North Perry are 6:00 AM to 6:29 AM (37, 16.1%) for males and 9:00 AM to 9:59 AM (30, 18.1%) for females.
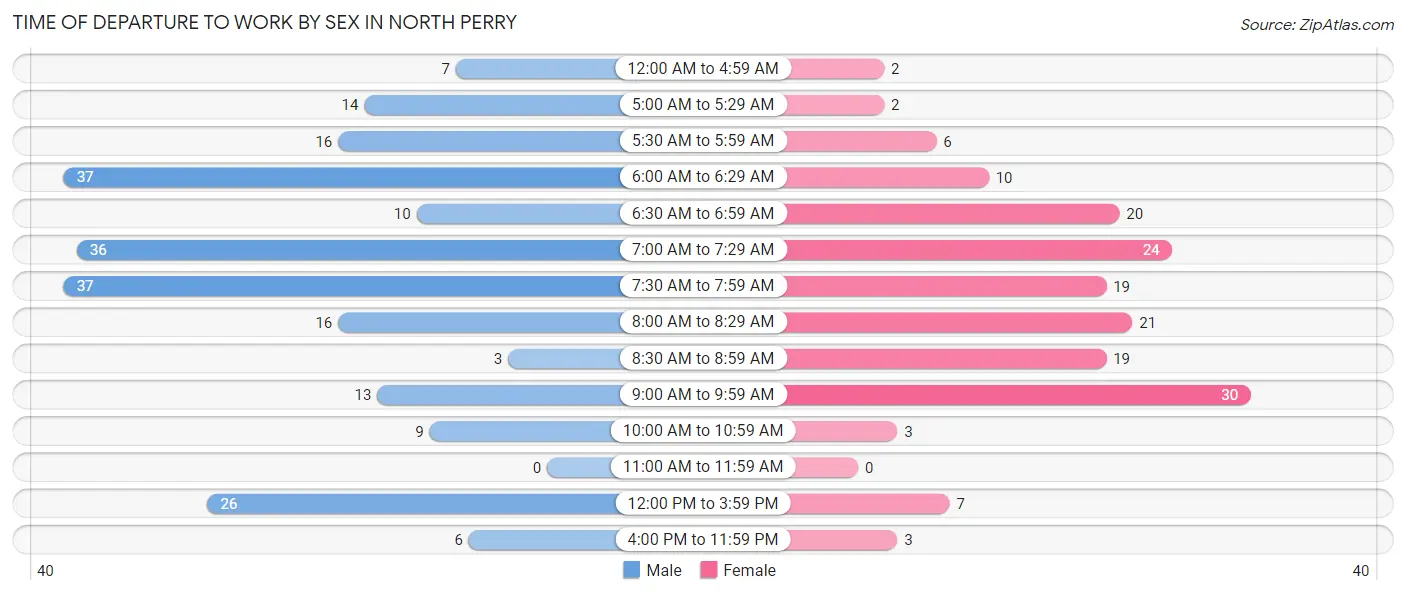
| Time of Departure | Male | Female |
| 12:00 AM to 4:59 AM | 7 (3.0%) | 2 (1.2%) |
| 5:00 AM to 5:29 AM | 14 (6.1%) | 2 (1.2%) |
| 5:30 AM to 5:59 AM | 16 (7.0%) | 6 (3.6%) |
| 6:00 AM to 6:29 AM | 37 (16.1%) | 10 (6.0%) |
| 6:30 AM to 6:59 AM | 10 (4.3%) | 20 (12.0%) |
| 7:00 AM to 7:29 AM | 36 (15.7%) | 24 (14.5%) |
| 7:30 AM to 7:59 AM | 37 (16.1%) | 19 (11.5%) |
| 8:00 AM to 8:29 AM | 16 (7.0%) | 21 (12.7%) |
| 8:30 AM to 8:59 AM | 3 (1.3%) | 19 (11.5%) |
| 9:00 AM to 9:59 AM | 13 (5.7%) | 30 (18.1%) |
| 10:00 AM to 10:59 AM | 9 (3.9%) | 3 (1.8%) |
| 11:00 AM to 11:59 AM | 0 (0.0%) | 0 (0.0%) |
| 12:00 PM to 3:59 PM | 26 (11.3%) | 7 (4.2%) |
| 4:00 PM to 11:59 PM | 6 (2.6%) | 3 (1.8%) |
| Total | 230 (100.0%) | 166 (100.0%) |
Housing Occupancy in North Perry
Occupancy by Ownership in North Perry
Of the total 323 dwellings in North Perry, owner-occupied units account for 298 (92.3%), while renter-occupied units make up 25 (7.7%).
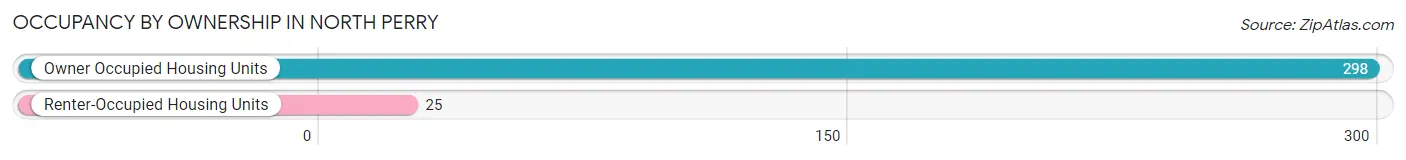
| Occupancy | # Housing Units | % Housing Units |
| Owner Occupied Housing Units | 298 | 92.3% |
| Renter-Occupied Housing Units | 25 | 7.7% |
| Total Occupied Housing Units | 323 | 100.0% |
Occupancy by Household Size in North Perry
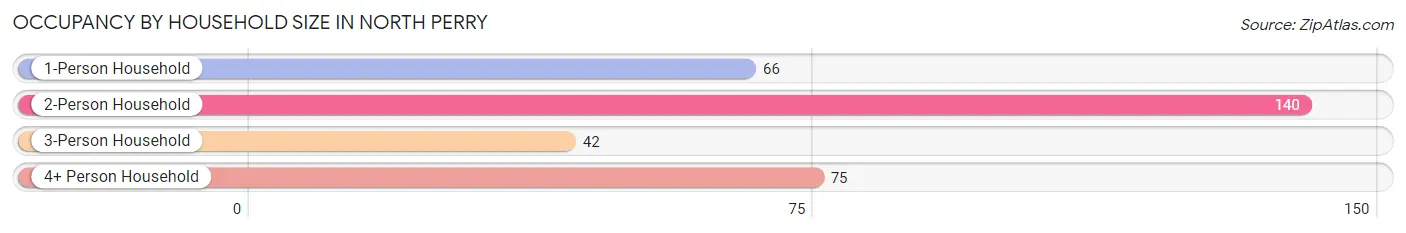
| Household Size | # Housing Units | % Housing Units |
| 1-Person Household | 66 | 20.4% |
| 2-Person Household | 140 | 43.3% |
| 3-Person Household | 42 | 13.0% |
| 4+ Person Household | 75 | 23.2% |
| Total Housing Units | 323 | 100.0% |
Occupancy by Ownership by Household Size in North Perry
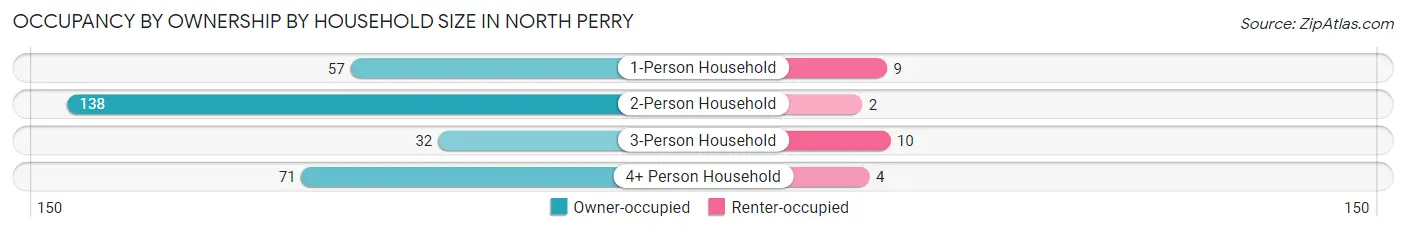
| Household Size | Owner-occupied | Renter-occupied |
| 1-Person Household | 57 (86.4%) | 9 (13.6%) |
| 2-Person Household | 138 (98.6%) | 2 (1.4%) |
| 3-Person Household | 32 (76.2%) | 10 (23.8%) |
| 4+ Person Household | 71 (94.7%) | 4 (5.3%) |
| Total Housing Units | 298 (92.3%) | 25 (7.7%) |
Occupancy by Educational Attainment in North Perry
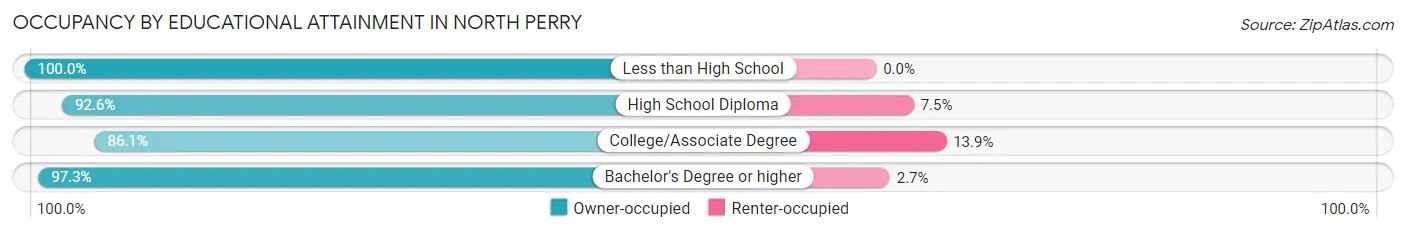
| Household Size | Owner-occupied | Renter-occupied |
| Less than High School | 10 (100.0%) | 0 (0.0%) |
| High School Diploma | 87 (92.5%) | 7 (7.4%) |
| College/Associate Degree | 93 (86.1%) | 15 (13.9%) |
| Bachelor's Degree or higher | 108 (97.3%) | 3 (2.7%) |
Occupancy by Age of Householder in North Perry
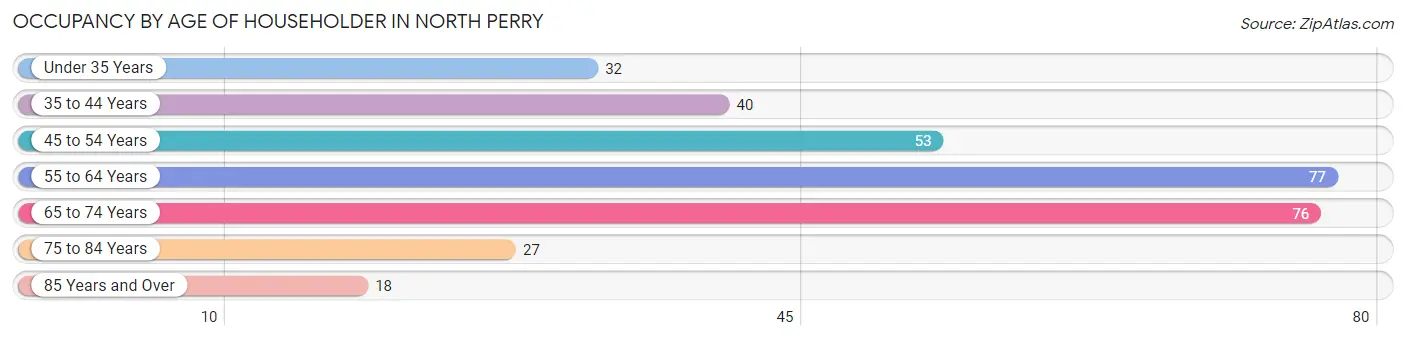
| Age Bracket | # Households | % Households |
| Under 35 Years | 32 | 9.9% |
| 35 to 44 Years | 40 | 12.4% |
| 45 to 54 Years | 53 | 16.4% |
| 55 to 64 Years | 77 | 23.8% |
| 65 to 74 Years | 76 | 23.5% |
| 75 to 84 Years | 27 | 8.4% |
| 85 Years and Over | 18 | 5.6% |
| Total | 323 | 100.0% |
Housing Finances in North Perry
Median Income by Occupancy in North Perry
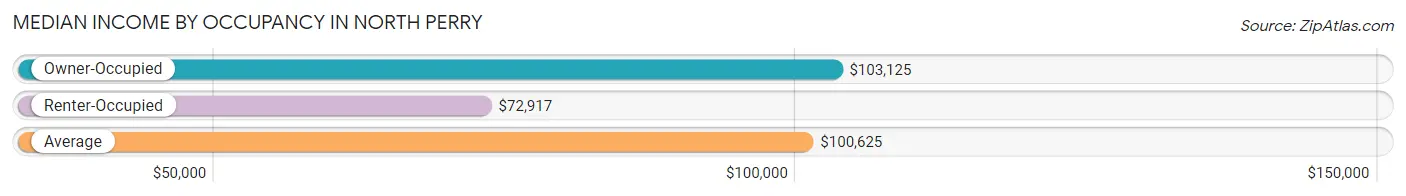
| Occupancy Type | # Households | Median Income |
| Owner-Occupied | 298 (92.3%) | $103,125 |
| Renter-Occupied | 25 (7.7%) | $72,917 |
| Average | 323 (100.0%) | $100,625 |
Occupancy by Householder Income Bracket in North Perry
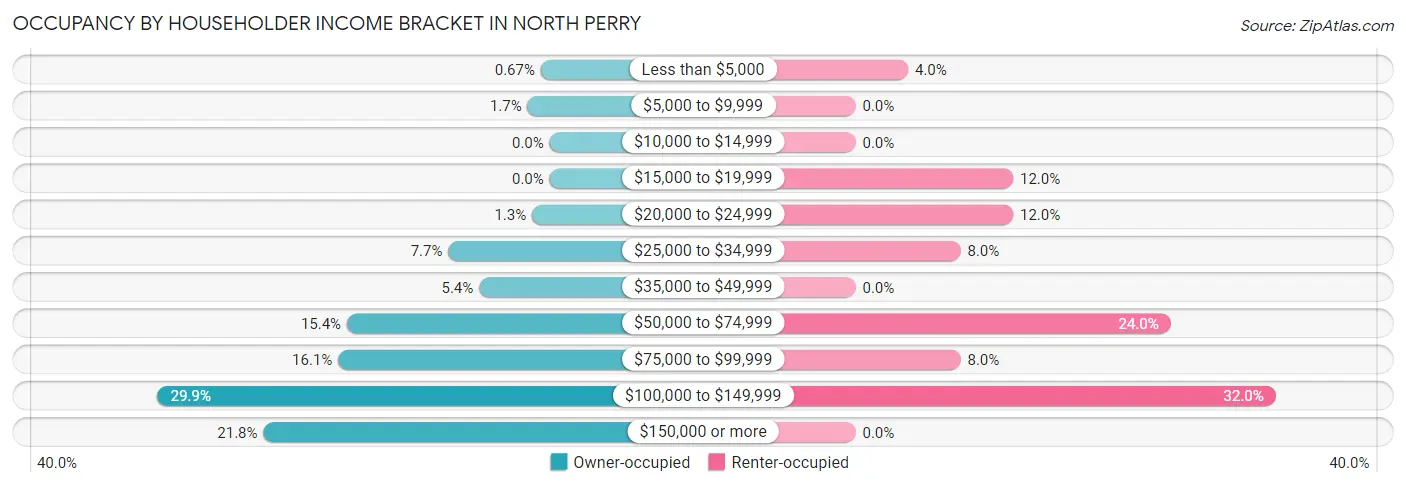
| Income Bracket | Owner-occupied | Renter-occupied |
| Less than $5,000 | 2 (0.7%) | 1 (4.0%) |
| $5,000 to $9,999 | 5 (1.7%) | 0 (0.0%) |
| $10,000 to $14,999 | 0 (0.0%) | 0 (0.0%) |
| $15,000 to $19,999 | 0 (0.0%) | 3 (12.0%) |
| $20,000 to $24,999 | 4 (1.3%) | 3 (12.0%) |
| $25,000 to $34,999 | 23 (7.7%) | 2 (8.0%) |
| $35,000 to $49,999 | 16 (5.4%) | 0 (0.0%) |
| $50,000 to $74,999 | 46 (15.4%) | 6 (24.0%) |
| $75,000 to $99,999 | 48 (16.1%) | 2 (8.0%) |
| $100,000 to $149,999 | 89 (29.9%) | 8 (32.0%) |
| $150,000 or more | 65 (21.8%) | 0 (0.0%) |
| Total | 298 (100.0%) | 25 (100.0%) |
Monthly Housing Cost Tiers in North Perry
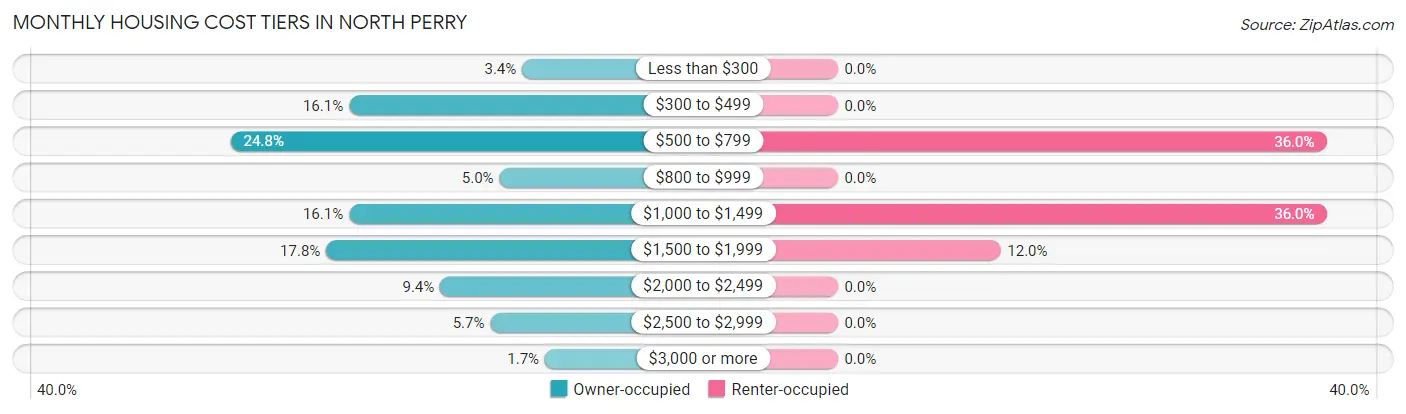
| Monthly Cost | Owner-occupied | Renter-occupied |
| Less than $300 | 10 (3.4%) | 0 (0.0%) |
| $300 to $499 | 48 (16.1%) | 0 (0.0%) |
| $500 to $799 | 74 (24.8%) | 9 (36.0%) |
| $800 to $999 | 15 (5.0%) | 0 (0.0%) |
| $1,000 to $1,499 | 48 (16.1%) | 9 (36.0%) |
| $1,500 to $1,999 | 53 (17.8%) | 3 (12.0%) |
| $2,000 to $2,499 | 28 (9.4%) | 0 (0.0%) |
| $2,500 to $2,999 | 17 (5.7%) | 0 (0.0%) |
| $3,000 or more | 5 (1.7%) | 0 (0.0%) |
| Total | 298 (100.0%) | 25 (100.0%) |
Physical Housing Characteristics in North Perry
Housing Structures in North Perry
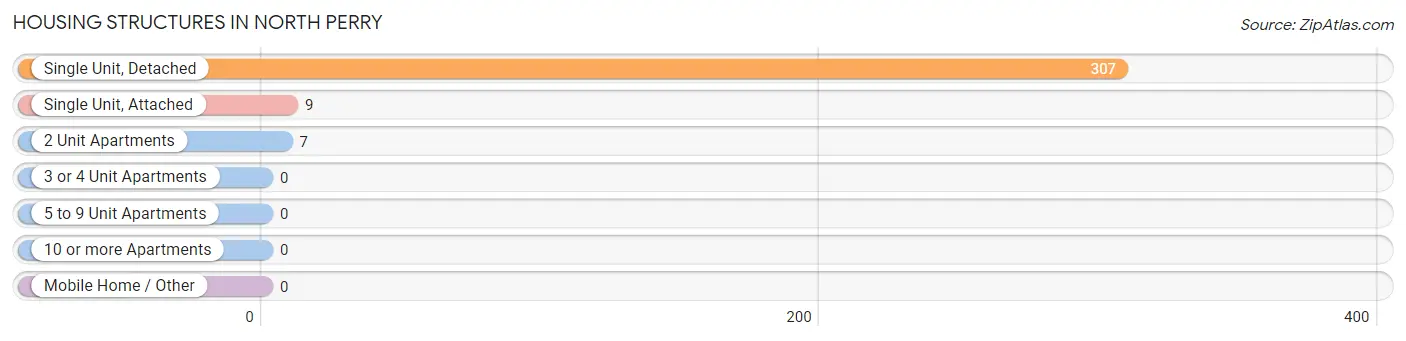
| Structure Type | # Housing Units | % Housing Units |
| Single Unit, Detached | 307 | 95.1% |
| Single Unit, Attached | 9 | 2.8% |
| 2 Unit Apartments | 7 | 2.2% |
| 3 or 4 Unit Apartments | 0 | 0.0% |
| 5 to 9 Unit Apartments | 0 | 0.0% |
| 10 or more Apartments | 0 | 0.0% |
| Mobile Home / Other | 0 | 0.0% |
| Total | 323 | 100.0% |
Housing Structures by Occupancy in North Perry
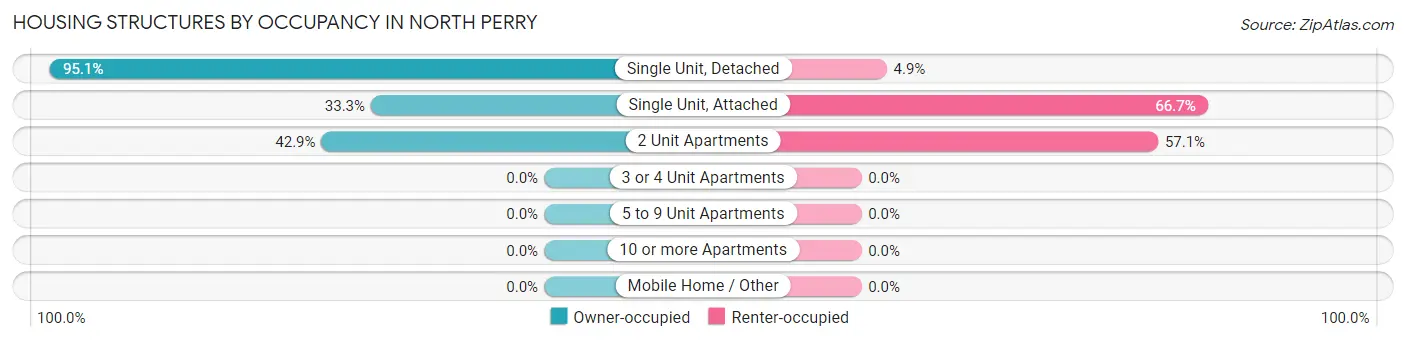
| Structure Type | Owner-occupied | Renter-occupied |
| Single Unit, Detached | 292 (95.1%) | 15 (4.9%) |
| Single Unit, Attached | 3 (33.3%) | 6 (66.7%) |
| 2 Unit Apartments | 3 (42.9%) | 4 (57.1%) |
| 3 or 4 Unit Apartments | 0 (0.0%) | 0 (0.0%) |
| 5 to 9 Unit Apartments | 0 (0.0%) | 0 (0.0%) |
| 10 or more Apartments | 0 (0.0%) | 0 (0.0%) |
| Mobile Home / Other | 0 (0.0%) | 0 (0.0%) |
| Total | 298 (92.3%) | 25 (7.7%) |
Housing Structures by Number of Rooms in North Perry
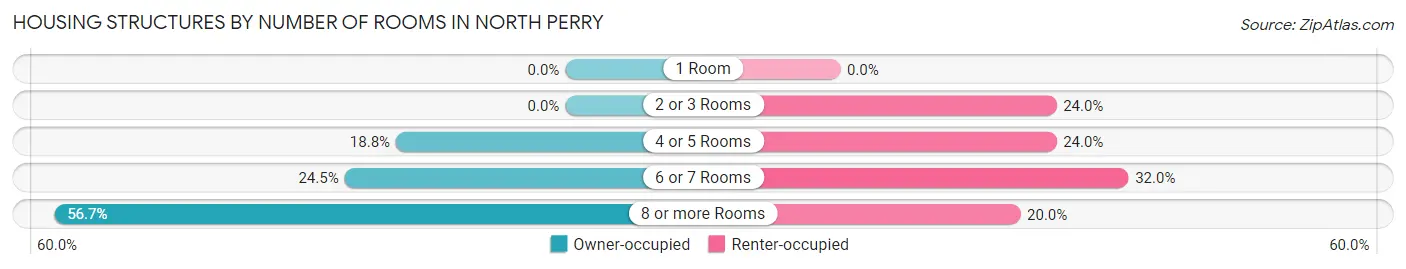
| Number of Rooms | Owner-occupied | Renter-occupied |
| 1 Room | 0 (0.0%) | 0 (0.0%) |
| 2 or 3 Rooms | 0 (0.0%) | 6 (24.0%) |
| 4 or 5 Rooms | 56 (18.8%) | 6 (24.0%) |
| 6 or 7 Rooms | 73 (24.5%) | 8 (32.0%) |
| 8 or more Rooms | 169 (56.7%) | 5 (20.0%) |
| Total | 298 (100.0%) | 25 (100.0%) |
Housing Structure by Heating Type in North Perry
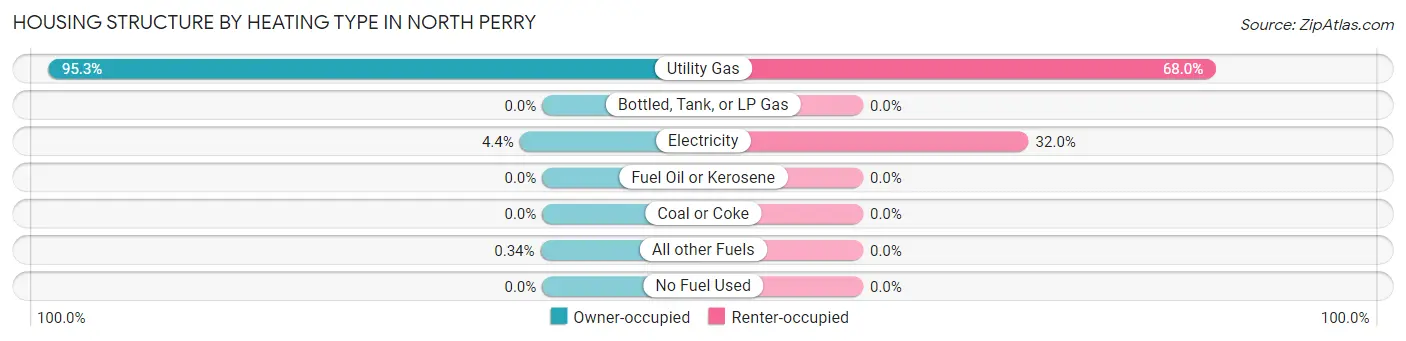
| Heating Type | Owner-occupied | Renter-occupied |
| Utility Gas | 284 (95.3%) | 17 (68.0%) |
| Bottled, Tank, or LP Gas | 0 (0.0%) | 0 (0.0%) |
| Electricity | 13 (4.4%) | 8 (32.0%) |
| Fuel Oil or Kerosene | 0 (0.0%) | 0 (0.0%) |
| Coal or Coke | 0 (0.0%) | 0 (0.0%) |
| All other Fuels | 1 (0.3%) | 0 (0.0%) |
| No Fuel Used | 0 (0.0%) | 0 (0.0%) |
| Total | 298 (100.0%) | 25 (100.0%) |
Household Vehicle Usage in North Perry
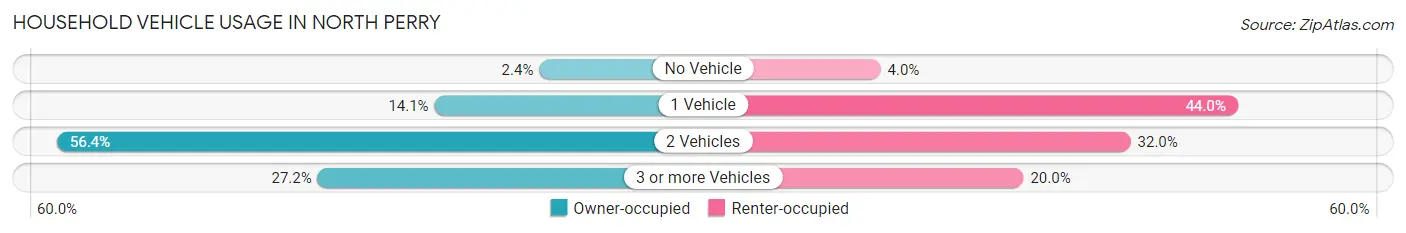
| Vehicles per Household | Owner-occupied | Renter-occupied |
| No Vehicle | 7 (2.4%) | 1 (4.0%) |
| 1 Vehicle | 42 (14.1%) | 11 (44.0%) |
| 2 Vehicles | 168 (56.4%) | 8 (32.0%) |
| 3 or more Vehicles | 81 (27.2%) | 5 (20.0%) |
| Total | 298 (100.0%) | 25 (100.0%) |
Real Estate & Mortgages in North Perry
Real Estate and Mortgage Overview in North Perry
| Characteristic | Without Mortgage | With Mortgage |
| Housing Units | 139 | 159 |
| Median Property Value | $247,200 | $253,100 |
| Median Household Income | $79,583 | $31 |
| Monthly Housing Costs | $533 | $4 |
| Real Estate Taxes | $2,750 | $0 |
Property Value by Mortgage Status in North Perry
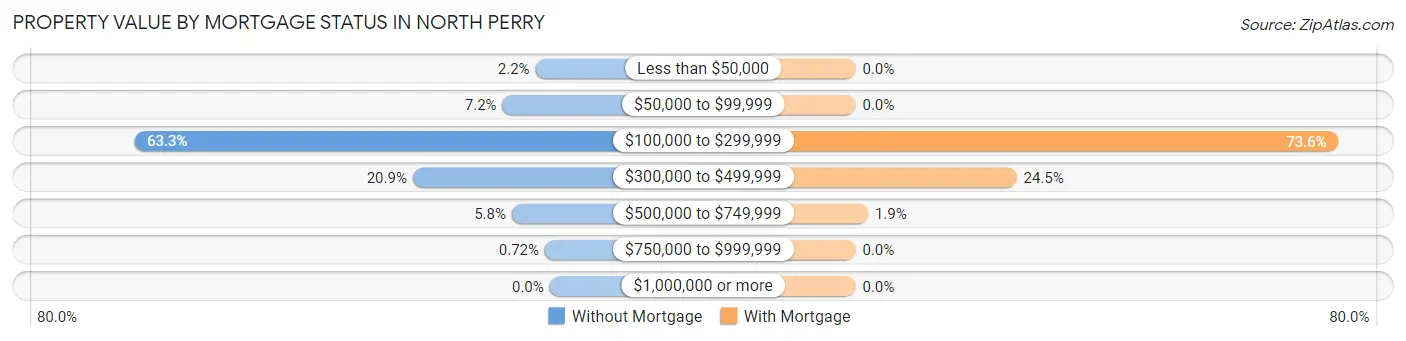
| Property Value | Without Mortgage | With Mortgage |
| Less than $50,000 | 3 (2.2%) | 0 (0.0%) |
| $50,000 to $99,999 | 10 (7.2%) | 0 (0.0%) |
| $100,000 to $299,999 | 88 (63.3%) | 117 (73.6%) |
| $300,000 to $499,999 | 29 (20.9%) | 39 (24.5%) |
| $500,000 to $749,999 | 8 (5.8%) | 3 (1.9%) |
| $750,000 to $999,999 | 1 (0.7%) | 0 (0.0%) |
| $1,000,000 or more | 0 (0.0%) | 0 (0.0%) |
| Total | 139 (100.0%) | 159 (100.0%) |
Household Income by Mortgage Status in North Perry
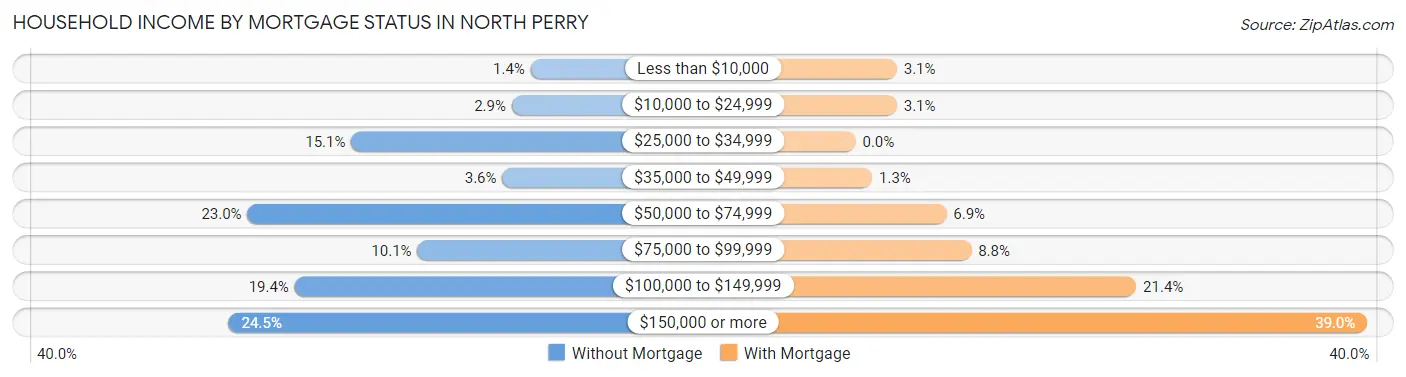
| Household Income | Without Mortgage | With Mortgage |
| Less than $10,000 | 2 (1.4%) | 5 (3.1%) |
| $10,000 to $24,999 | 4 (2.9%) | 5 (3.1%) |
| $25,000 to $34,999 | 21 (15.1%) | 0 (0.0%) |
| $35,000 to $49,999 | 5 (3.6%) | 2 (1.3%) |
| $50,000 to $74,999 | 32 (23.0%) | 11 (6.9%) |
| $75,000 to $99,999 | 14 (10.1%) | 14 (8.8%) |
| $100,000 to $149,999 | 27 (19.4%) | 34 (21.4%) |
| $150,000 or more | 34 (24.5%) | 62 (39.0%) |
| Total | 139 (100.0%) | 159 (100.0%) |
Property Value to Household Income Ratio in North Perry
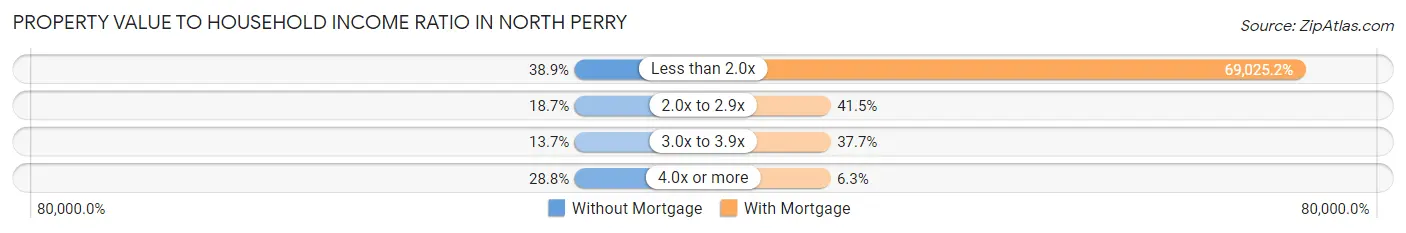
| Value-to-Income Ratio | Without Mortgage | With Mortgage |
| Less than 2.0x | 54 (38.9%) | 109,750 (69,025.2%) |
| 2.0x to 2.9x | 26 (18.7%) | 66 (41.5%) |
| 3.0x to 3.9x | 19 (13.7%) | 60 (37.7%) |
| 4.0x or more | 40 (28.8%) | 10 (6.3%) |
| Total | 139 (100.0%) | 159 (100.0%) |
Real Estate Taxes by Mortgage Status in North Perry
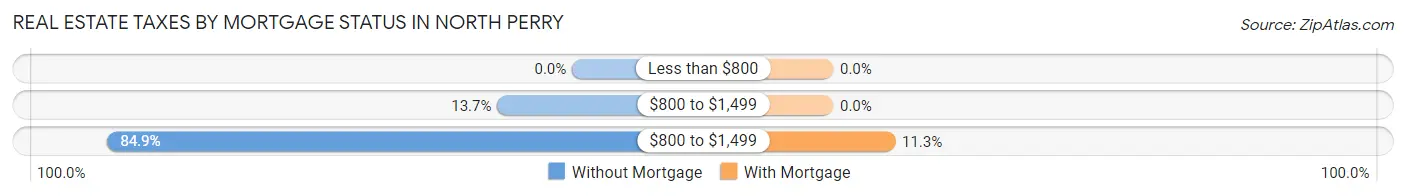
| Property Taxes | Without Mortgage | With Mortgage |
| Less than $800 | 0 (0.0%) | 0 (0.0%) |
| $800 to $1,499 | 19 (13.7%) | 0 (0.0%) |
| $800 to $1,499 | 118 (84.9%) | 18 (11.3%) |
| Total | 139 (100.0%) | 159 (100.0%) |
Health & Disability in North Perry
Health Insurance Coverage by Age in North Perry
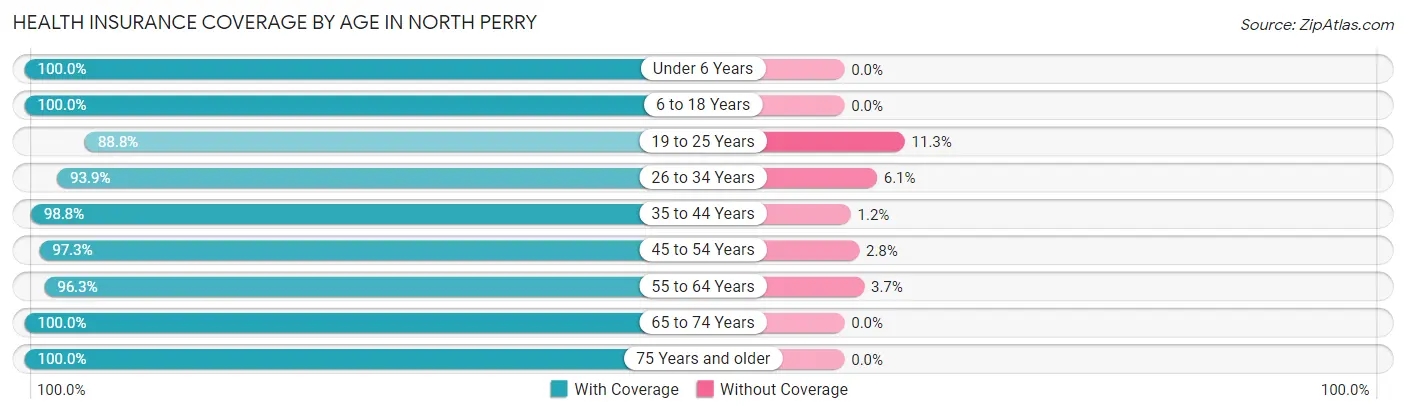
| Age Bracket | With Coverage | Without Coverage |
| Under 6 Years | 34 (100.0%) | 0 (0.0%) |
| 6 to 18 Years | 166 (100.0%) | 0 (0.0%) |
| 19 to 25 Years | 71 (88.7%) | 9 (11.3%) |
| 26 to 34 Years | 31 (93.9%) | 2 (6.1%) |
| 35 to 44 Years | 84 (98.8%) | 1 (1.2%) |
| 45 to 54 Years | 106 (97.3%) | 3 (2.8%) |
| 55 to 64 Years | 131 (96.3%) | 5 (3.7%) |
| 65 to 74 Years | 136 (100.0%) | 0 (0.0%) |
| 75 Years and older | 71 (100.0%) | 0 (0.0%) |
| Total | 830 (97.7%) | 20 (2.4%) |
Health Insurance Coverage by Citizenship Status in North Perry
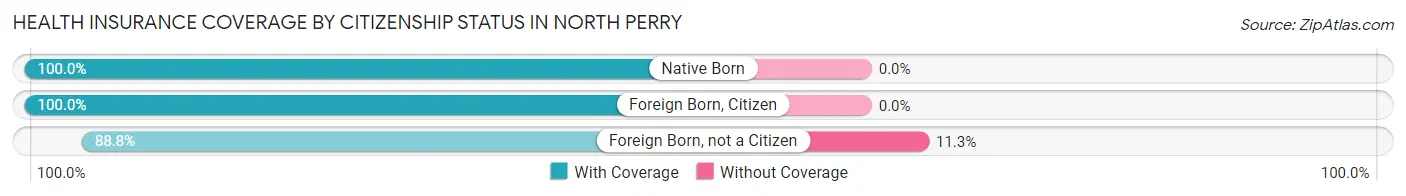
| Citizenship Status | With Coverage | Without Coverage |
| Native Born | 34 (100.0%) | 0 (0.0%) |
| Foreign Born, Citizen | 166 (100.0%) | 0 (0.0%) |
| Foreign Born, not a Citizen | 71 (88.7%) | 9 (11.3%) |
Health Insurance Coverage by Household Income in North Perry
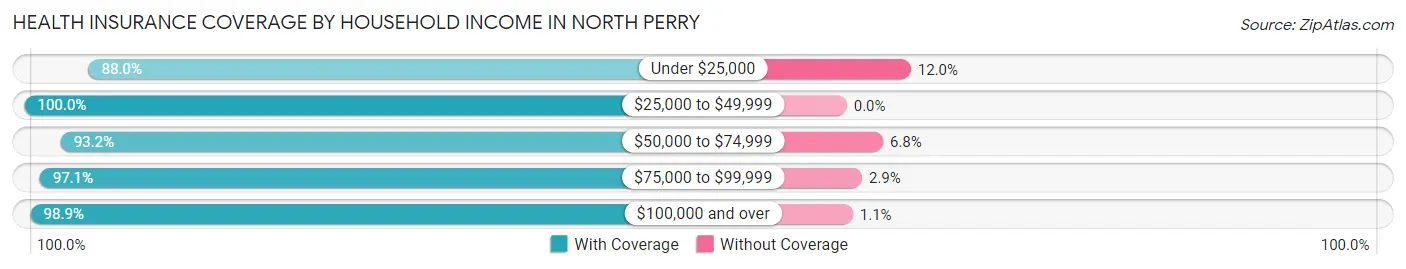
| Household Income | With Coverage | Without Coverage |
| Under $25,000 | 22 (88.0%) | 3 (12.0%) |
| $25,000 to $49,999 | 74 (100.0%) | 0 (0.0%) |
| $50,000 to $74,999 | 110 (93.2%) | 8 (6.8%) |
| $75,000 to $99,999 | 102 (97.1%) | 3 (2.9%) |
| $100,000 and over | 522 (98.9%) | 6 (1.1%) |
Public vs Private Health Insurance Coverage by Age in North Perry
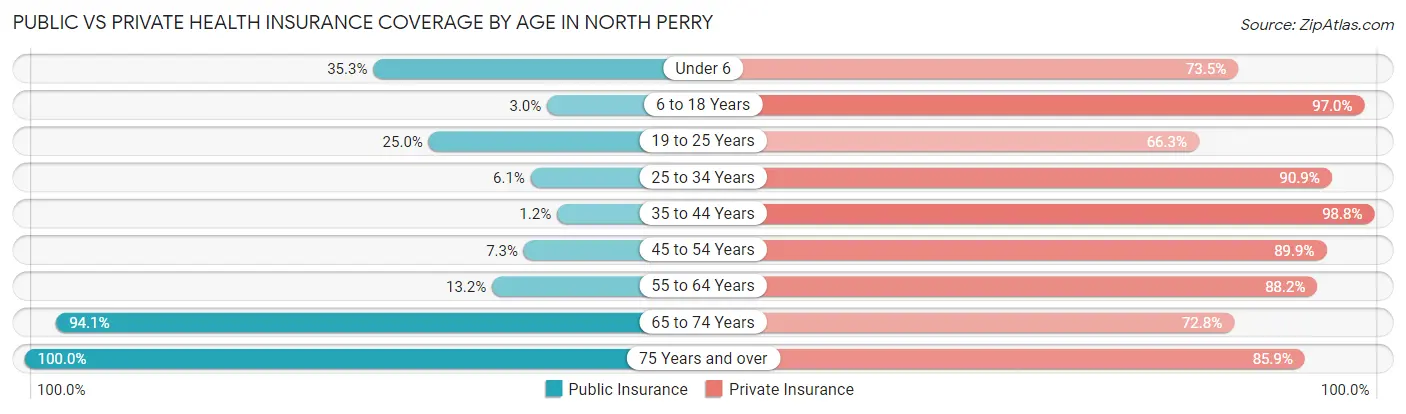
| Age Bracket | Public Insurance | Private Insurance |
| Under 6 | 12 (35.3%) | 25 (73.5%) |
| 6 to 18 Years | 5 (3.0%) | 161 (97.0%) |
| 19 to 25 Years | 20 (25.0%) | 53 (66.2%) |
| 25 to 34 Years | 2 (6.1%) | 30 (90.9%) |
| 35 to 44 Years | 1 (1.2%) | 84 (98.8%) |
| 45 to 54 Years | 8 (7.3%) | 98 (89.9%) |
| 55 to 64 Years | 18 (13.2%) | 120 (88.2%) |
| 65 to 74 Years | 128 (94.1%) | 99 (72.8%) |
| 75 Years and over | 71 (100.0%) | 61 (85.9%) |
| Total | 265 (31.2%) | 731 (86.0%) |
Disability Status by Sex by Age in North Perry
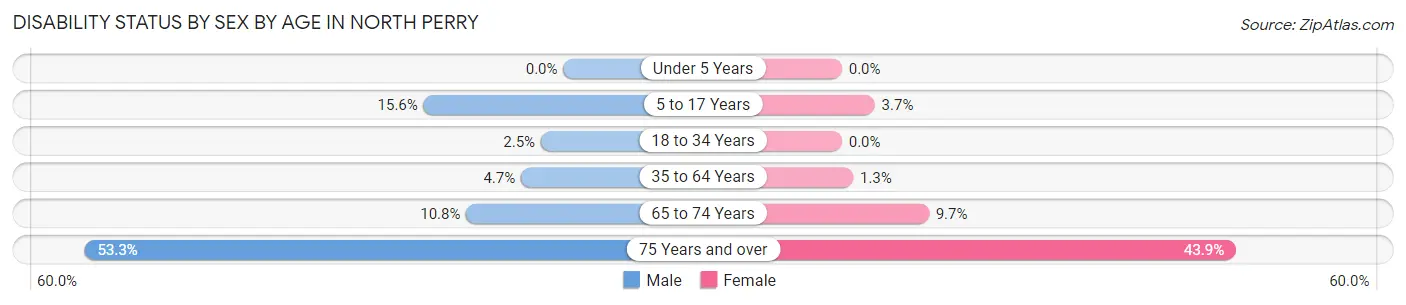
| Age Bracket | Male | Female |
| Under 5 Years | 0 (0.0%) | 0 (0.0%) |
| 5 to 17 Years | 14 (15.6%) | 3 (3.7%) |
| 18 to 34 Years | 2 (2.5%) | 0 (0.0%) |
| 35 to 64 Years | 8 (4.7%) | 2 (1.3%) |
| 65 to 74 Years | 8 (10.8%) | 6 (9.7%) |
| 75 Years and over | 16 (53.3%) | 18 (43.9%) |
Disability Class by Sex by Age in North Perry
Disability Class: Hearing Difficulty
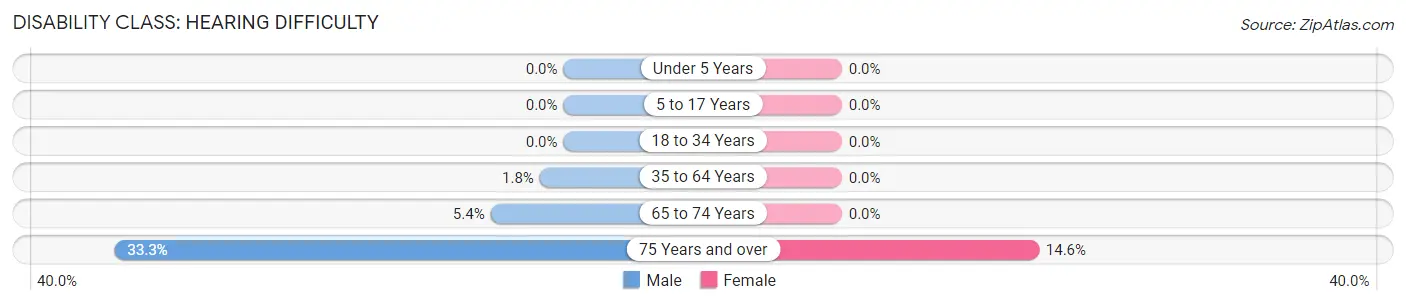
| Age Bracket | Male | Female |
| Under 5 Years | 0 (0.0%) | 0 (0.0%) |
| 5 to 17 Years | 0 (0.0%) | 0 (0.0%) |
| 18 to 34 Years | 0 (0.0%) | 0 (0.0%) |
| 35 to 64 Years | 3 (1.8%) | 0 (0.0%) |
| 65 to 74 Years | 4 (5.4%) | 0 (0.0%) |
| 75 Years and over | 10 (33.3%) | 6 (14.6%) |
Disability Class: Vision Difficulty
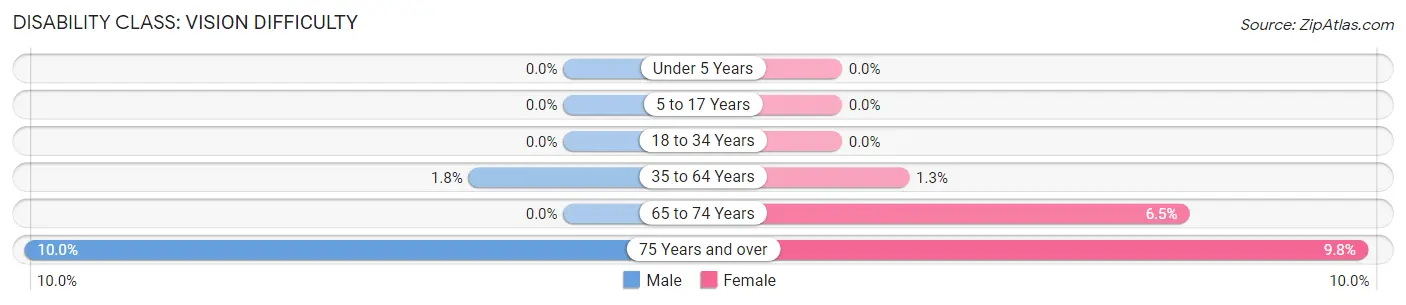
| Age Bracket | Male | Female |
| Under 5 Years | 0 (0.0%) | 0 (0.0%) |
| 5 to 17 Years | 0 (0.0%) | 0 (0.0%) |
| 18 to 34 Years | 0 (0.0%) | 0 (0.0%) |
| 35 to 64 Years | 3 (1.8%) | 2 (1.3%) |
| 65 to 74 Years | 0 (0.0%) | 4 (6.5%) |
| 75 Years and over | 3 (10.0%) | 4 (9.8%) |
Disability Class: Cognitive Difficulty
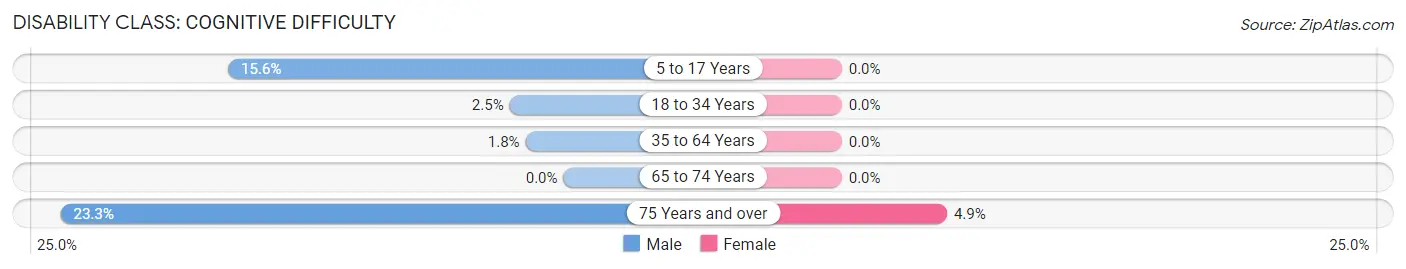
| Age Bracket | Male | Female |
| 5 to 17 Years | 14 (15.6%) | 0 (0.0%) |
| 18 to 34 Years | 2 (2.5%) | 0 (0.0%) |
| 35 to 64 Years | 3 (1.8%) | 0 (0.0%) |
| 65 to 74 Years | 0 (0.0%) | 0 (0.0%) |
| 75 Years and over | 7 (23.3%) | 2 (4.9%) |
Disability Class: Ambulatory Difficulty
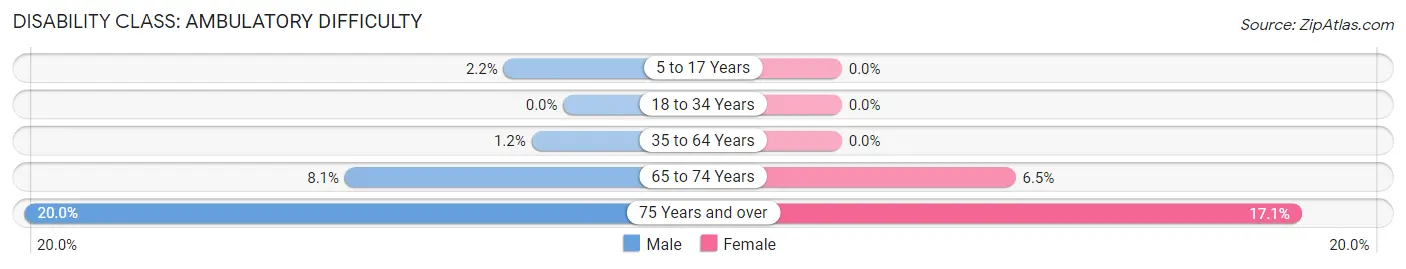
| Age Bracket | Male | Female |
| 5 to 17 Years | 2 (2.2%) | 0 (0.0%) |
| 18 to 34 Years | 0 (0.0%) | 0 (0.0%) |
| 35 to 64 Years | 2 (1.2%) | 0 (0.0%) |
| 65 to 74 Years | 6 (8.1%) | 4 (6.5%) |
| 75 Years and over | 6 (20.0%) | 7 (17.1%) |
Disability Class: Self-Care Difficulty
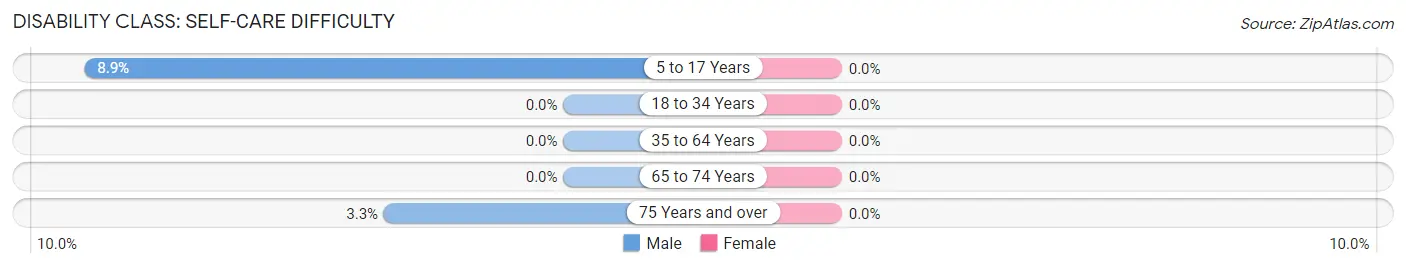
| Age Bracket | Male | Female |
| 5 to 17 Years | 8 (8.9%) | 0 (0.0%) |
| 18 to 34 Years | 0 (0.0%) | 0 (0.0%) |
| 35 to 64 Years | 0 (0.0%) | 0 (0.0%) |
| 65 to 74 Years | 0 (0.0%) | 0 (0.0%) |
| 75 Years and over | 1 (3.3%) | 0 (0.0%) |
Technology Access in North Perry
Computing Device Access in North Perry
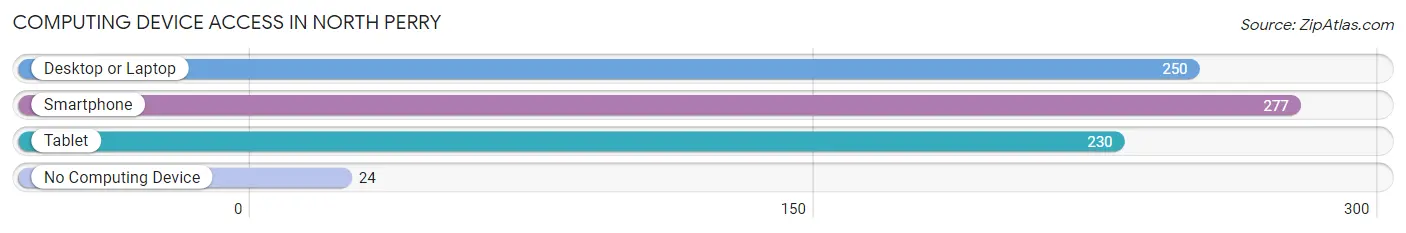
| Device Type | # Households | % Households |
| Desktop or Laptop | 250 | 77.4% |
| Smartphone | 277 | 85.8% |
| Tablet | 230 | 71.2% |
| No Computing Device | 24 | 7.4% |
| Total | 323 | 100.0% |
Internet Access in North Perry
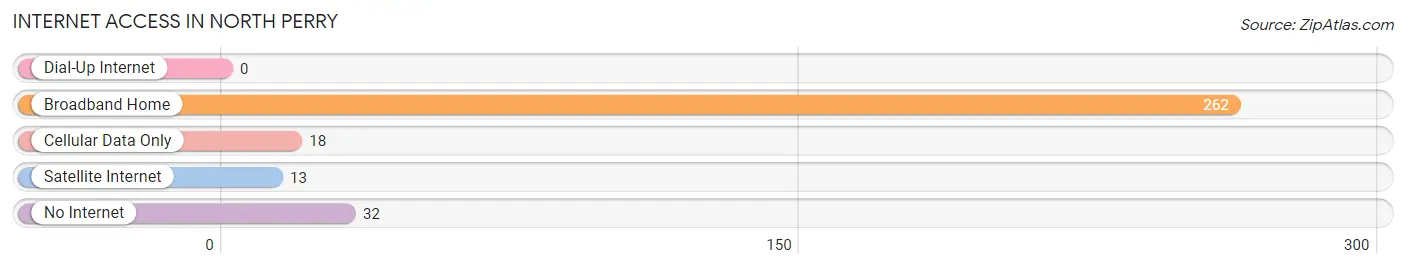
| Internet Type | # Households | % Households |
| Dial-Up Internet | 0 | 0.0% |
| Broadband Home | 262 | 81.1% |
| Cellular Data Only | 18 | 5.6% |
| Satellite Internet | 13 | 4.0% |
| No Internet | 32 | 9.9% |
| Total | 323 | 100.0% |
North Perry Summary
History
North Perry is a village located in Lake County, Ohio. It is situated on the eastern shore of Lake Erie, approximately 30 miles northeast of Cleveland. The village was founded in 1837 by a group of settlers from Connecticut. The settlers named the village after Commodore Oliver Hazard Perry, a hero of the War of 1812.
The village was originally a farming community, but it soon developed into a small industrial center. The first industry in the village was a sawmill, which was built in 1845. This was followed by a gristmill, a tannery, and a brickyard. The village also had a number of small businesses, such as a general store, a blacksmith shop, and a post office.
In the late 19th century, North Perry began to experience a period of growth. The village was incorporated in 1891, and the population grew to over 500 by the turn of the century. The village was connected to the outside world by the Lake Shore and Michigan Southern Railway, which ran through the village.
The village continued to grow throughout the 20th century. In the 1950s, the village was connected to the rest of the state by the Ohio Turnpike. This allowed for easy access to Cleveland and other cities in the region. The village also experienced a period of suburbanization in the 1960s and 1970s, as many people moved to the area from Cleveland.
Geography
North Perry is located in Lake County, Ohio. It is situated on the eastern shore of Lake Erie, approximately 30 miles northeast of Cleveland. The village is bordered by the cities of Mentor and Painesville to the north, and by the townships of Perry and Concord to the south.
The village is located in a hilly region, with elevations ranging from 600 to 800 feet above sea level. The terrain is mostly wooded, with some open fields and meadows. The village is located in the Great Lakes region, and is part of the Lake Erie watershed.
The climate in North Perry is humid continental, with warm summers and cold winters. The average annual temperature is around 50 degrees Fahrenheit, and the average annual precipitation is around 40 inches.
Economy
The economy of North Perry is largely based on manufacturing and services. The village is home to several manufacturing companies, including a plastics manufacturer, a metal fabricator, and a printing company. The village also has a number of service-based businesses, such as restaurants, retail stores, and professional services.
The village is also home to a number of small businesses, such as auto repair shops, hair salons, and convenience stores. The village is also home to a number of tourist attractions, such as the Lake Erie Nature and Science Center and the Lake County Historical Society.
Demographics
As of the 2010 census, the population of North Perry was 2,845. The population is predominantly white (94.3%), with small percentages of African American (2.2%), Asian (1.2%), and Hispanic (1.2%) residents. The median household income is $50,945, and the median home value is $150,000.
The village is served by the Perry Local School District, which includes two elementary schools, one middle school, and one high school. The village is also home to a branch of the Lakeland Community College.
Conclusion
North Perry is a small village located in Lake County, Ohio. It is situated on the eastern shore of Lake Erie, approximately 30 miles northeast of Cleveland. The village was founded in 1837 by a group of settlers from Connecticut, and it has since developed into a small industrial center. The village is home to several manufacturing companies, as well as a number of service-based businesses. The population of North Perry is predominantly white, with small percentages of African American, Asian, and Hispanic residents. The village is served by the Perry Local School District, and it is home to a branch of the Lakeland Community College.
Common Questions
What is Per Capita Income in North Perry?
Per Capita income in North Perry is $47,165.
What is the Median Family Income in North Perry?
Median Family Income in North Perry is $111,000.
What is the Median Household income in North Perry?
Median Household Income in North Perry is $100,625.
What is Income or Wage Gap in North Perry?
Income or Wage Gap in North Perry is 36.7%.
Women in North Perry earn 63.3 cents for every dollar earned by a man.
What is Inequality or Gini Index in North Perry?
Inequality or Gini Index in North Perry is 0.40.
What is the Total Population of North Perry?
Total Population of North Perry is 852.
What is the Total Male Population of North Perry?
Total Male Population of North Perry is 458.
What is the Total Female Population of North Perry?
Total Female Population of North Perry is 394.
What is the Ratio of Males per 100 Females in North Perry?
There are 116.24 Males per 100 Females in North Perry.
What is the Ratio of Females per 100 Males in North Perry?
There are 86.03 Females per 100 Males in North Perry.
What is the Median Population Age in North Perry?
Median Population Age in North Perry is 47.3 Years.
What is the Average Family Size in North Perry
Average Family Size in North Perry is 3.0 People.
What is the Average Household Size in North Perry
Average Household Size in North Perry is 2.6 People.
How Large is the Labor Force in North Perry?
There are 454 People in the Labor Forcein in North Perry.
What is the Percentage of People in the Labor Force in North Perry?
66.8% of People are in the Labor Force in North Perry.
What is the Unemployment Rate in North Perry?
Unemployment Rate in North Perry is 5.1%.