Cities with the Highest Percentage of Population Employed in Enterprise Management in Michigan
RELATED REPORTS & OPTIONS
Enterprise Management
Michigan
Compare Cities
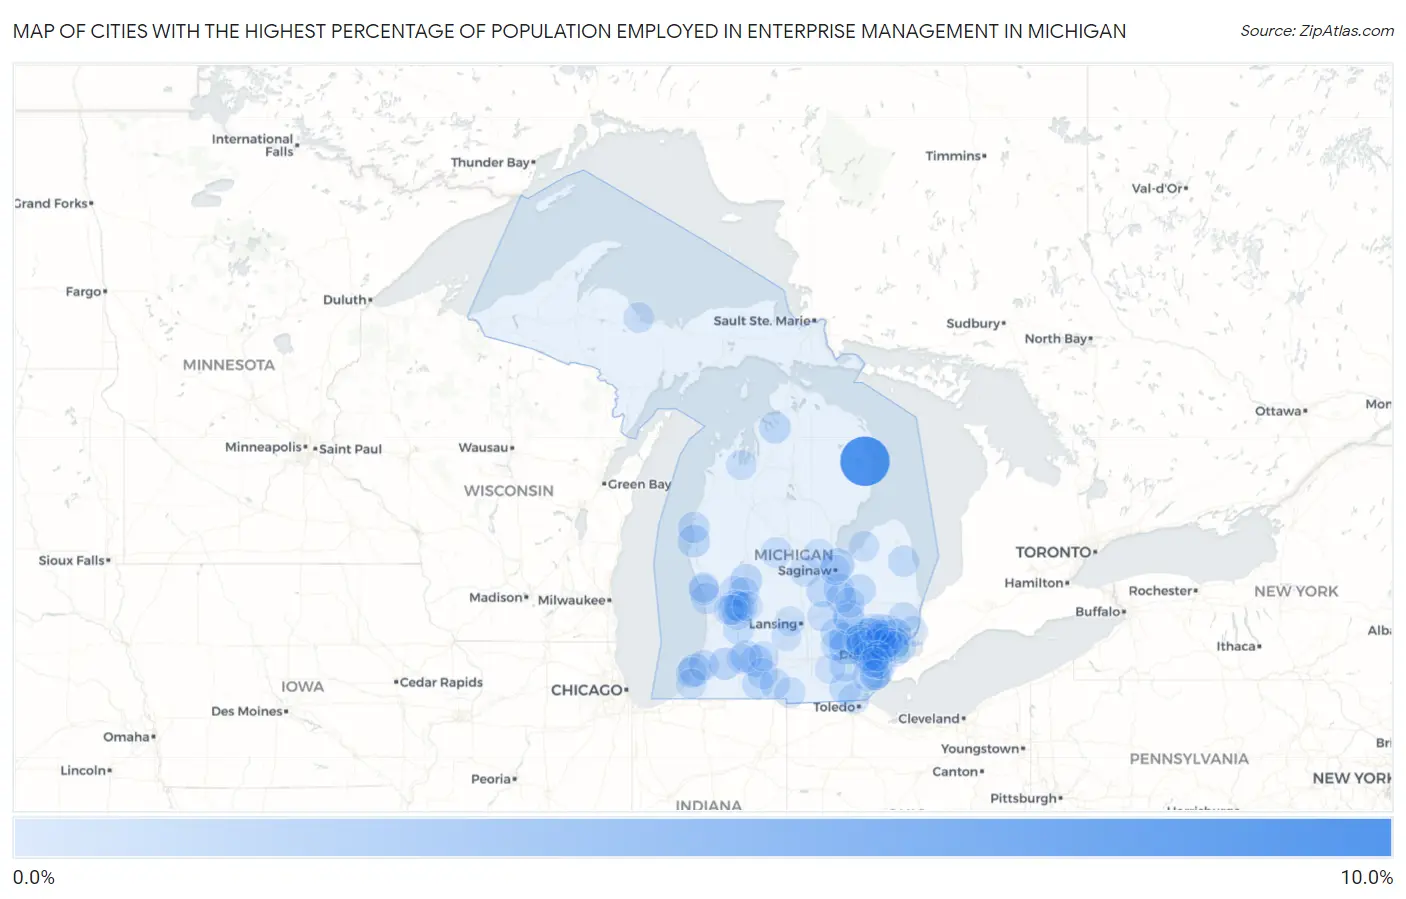
Map of Cities with the Highest Percentage of Population Employed in Enterprise Management in Michigan
0.0%
10.0%
Cities with the Highest Percentage of Population Employed in Enterprise Management in Michigan
| City | % Employed | vs State | vs National | |
| 1. | Lost Lake Woods | 10.0% | 0.13%(+9.87)#1 | 0.14%(+9.86)#14 |
| 2. | Whitmore Lake | 1.9% | 0.13%(+1.81)#2 | 0.14%(+1.80)#255 |
| 3. | Zilwaukee | 1.8% | 0.13%(+1.63)#3 | 0.14%(+1.62)#294 |
| 4. | Orchard Lake Village | 1.7% | 0.13%(+1.55)#4 | 0.14%(+1.54)#314 |
| 5. | Benton Heights | 1.4% | 0.13%(+1.28)#5 | 0.14%(+1.27)#393 |
| 6. | Pentwater | 1.2% | 0.13%(+1.05)#6 | 0.14%(+1.04)#483 |
| 7. | Paw Paw | 1.1% | 0.13%(+0.972)#7 | 0.14%(+0.964)#526 |
| 8. | Climax | 1.0% | 0.13%(+0.919)#8 | 0.14%(+0.910)#552 |
| 9. | Sand Lake | 1.0% | 0.13%(+0.895)#9 | 0.14%(+0.887)#571 |
| 10. | Brighton | 1.0% | 0.13%(+0.893)#10 | 0.14%(+0.885)#572 |
| 11. | Comstock Northwest | 0.97% | 0.13%(+0.844)#11 | 0.14%(+0.836)#618 |
| 12. | Boyne City | 0.97% | 0.13%(+0.841)#12 | 0.14%(+0.833)#621 |
| 13. | Lake Fenton | 0.95% | 0.13%(+0.819)#13 | 0.14%(+0.811)#637 |
| 14. | Oakley | 0.88% | 0.13%(+0.755)#14 | 0.14%(+0.746)#702 |
| 15. | East Grand Rapids | 0.88% | 0.13%(+0.753)#15 | 0.14%(+0.745)#704 |
| 16. | Keego Harbor | 0.86% | 0.13%(+0.729)#16 | 0.14%(+0.721)#723 |
| 17. | Utica | 0.83% | 0.13%(+0.697)#17 | 0.14%(+0.688)#759 |
| 18. | Deerfield | 0.82% | 0.13%(+0.688)#18 | 0.14%(+0.679)#764 |
| 19. | Otisville | 0.77% | 0.13%(+0.637)#19 | 0.14%(+0.629)#834 |
| 20. | Ludington | 0.73% | 0.13%(+0.602)#20 | 0.14%(+0.593)#882 |
| 21. | Village Of Grosse Pointe Shores | 0.73% | 0.13%(+0.598)#21 | 0.14%(+0.589)#888 |
| 22. | Deckerville | 0.71% | 0.13%(+0.579)#22 | 0.14%(+0.571)#916 |
| 23. | Colon | 0.67% | 0.13%(+0.543)#23 | 0.14%(+0.535)#963 |
| 24. | Howell | 0.67% | 0.13%(+0.535)#24 | 0.14%(+0.527)#973 |
| 25. | Wayland | 0.65% | 0.13%(+0.523)#25 | 0.14%(+0.514)#996 |
| 26. | Grosse Pointe | 0.57% | 0.13%(+0.442)#26 | 0.14%(+0.434)#1,141 |
| 27. | Plymouth | 0.56% | 0.13%(+0.434)#27 | 0.14%(+0.426)#1,165 |
| 28. | Wolverine Lake | 0.56% | 0.13%(+0.432)#28 | 0.14%(+0.424)#1,171 |
| 29. | Rockwood | 0.54% | 0.13%(+0.412)#29 | 0.14%(+0.404)#1,219 |
| 30. | Athens | 0.53% | 0.13%(+0.403)#30 | 0.14%(+0.395)#1,242 |
| 31. | Montrose | 0.53% | 0.13%(+0.397)#31 | 0.14%(+0.388)#1,259 |
| 32. | Sparta | 0.51% | 0.13%(+0.382)#32 | 0.14%(+0.373)#1,290 |
| 33. | Huntington Woods | 0.50% | 0.13%(+0.368)#33 | 0.14%(+0.360)#1,334 |
| 34. | Breckenridge | 0.49% | 0.13%(+0.364)#34 | 0.14%(+0.356)#1,341 |
| 35. | Gibraltar | 0.49% | 0.13%(+0.358)#35 | 0.14%(+0.349)#1,361 |
| 36. | Lake Isabella | 0.48% | 0.13%(+0.352)#36 | 0.14%(+0.344)#1,376 |
| 37. | Grand Haven | 0.47% | 0.13%(+0.339)#37 | 0.14%(+0.331)#1,408 |
| 38. | Lambertville | 0.46% | 0.13%(+0.327)#38 | 0.14%(+0.319)#1,429 |
| 39. | Reading | 0.45% | 0.13%(+0.323)#39 | 0.14%(+0.315)#1,446 |
| 40. | Pinckney | 0.45% | 0.13%(+0.323)#40 | 0.14%(+0.315)#1,447 |
| 41. | Rockford | 0.45% | 0.13%(+0.320)#41 | 0.14%(+0.312)#1,455 |
| 42. | Saline | 0.44% | 0.13%(+0.311)#42 | 0.14%(+0.303)#1,479 |
| 43. | Wayne | 0.44% | 0.13%(+0.306)#43 | 0.14%(+0.297)#1,494 |
| 44. | Farmington Hills | 0.44% | 0.13%(+0.305)#44 | 0.14%(+0.297)#1,497 |
| 45. | Birmingham | 0.43% | 0.13%(+0.297)#45 | 0.14%(+0.288)#1,525 |
| 46. | Livonia | 0.43% | 0.13%(+0.297)#46 | 0.14%(+0.288)#1,526 |
| 47. | Pearl Beach | 0.41% | 0.13%(+0.281)#47 | 0.14%(+0.273)#1,572 |
| 48. | Carleton | 0.40% | 0.13%(+0.271)#48 | 0.14%(+0.263)#1,616 |
| 49. | Novi | 0.39% | 0.13%(+0.262)#49 | 0.14%(+0.253)#1,648 |
| 50. | St Joseph | 0.39% | 0.13%(+0.256)#50 | 0.14%(+0.247)#1,671 |
| 51. | Fenton | 0.38% | 0.13%(+0.253)#51 | 0.14%(+0.245)#1,679 |
| 52. | Sebewaing | 0.38% | 0.13%(+0.247)#52 | 0.14%(+0.239)#1,704 |
| 53. | Walker | 0.37% | 0.13%(+0.241)#53 | 0.14%(+0.233)#1,734 |
| 54. | Berkley | 0.37% | 0.13%(+0.239)#54 | 0.14%(+0.231)#1,742 |
| 55. | Northville | 0.37% | 0.13%(+0.238)#55 | 0.14%(+0.229)#1,750 |
| 56. | Norton Shores | 0.36% | 0.13%(+0.235)#56 | 0.14%(+0.226)#1,761 |
| 57. | Richmond | 0.36% | 0.13%(+0.234)#57 | 0.14%(+0.226)#1,762 |
| 58. | Watervliet | 0.36% | 0.13%(+0.233)#58 | 0.14%(+0.225)#1,767 |
| 59. | Coldwater | 0.36% | 0.13%(+0.227)#59 | 0.14%(+0.218)#1,793 |
| 60. | Flushing | 0.35% | 0.13%(+0.224)#60 | 0.14%(+0.215)#1,803 |
| 61. | Hazel Park | 0.34% | 0.13%(+0.211)#61 | 0.14%(+0.203)#1,858 |
| 62. | Southgate | 0.34% | 0.13%(+0.208)#62 | 0.14%(+0.200)#1,874 |
| 63. | Oak Park | 0.31% | 0.13%(+0.178)#63 | 0.14%(+0.170)#1,995 |
| 64. | Wyandotte | 0.31% | 0.13%(+0.177)#64 | 0.14%(+0.168)#1,999 |
| 65. | Highland Park | 0.26% | 0.13%(+0.134)#65 | 0.14%(+0.126)#2,236 |
| 66. | Morrice | 0.26% | 0.13%(+0.130)#66 | 0.14%(+0.122)#2,260 |
| 67. | Marquette | 0.26% | 0.13%(+0.127)#67 | 0.14%(+0.119)#2,277 |
| 68. | Dearborn Heights | 0.26% | 0.13%(+0.125)#68 | 0.14%(+0.117)#2,288 |
| 69. | Sterling Heights | 0.25% | 0.13%(+0.124)#69 | 0.14%(+0.115)#2,296 |
| 70. | Mount Clemens | 0.25% | 0.13%(+0.122)#70 | 0.14%(+0.114)#2,306 |
| 71. | Clawson | 0.24% | 0.13%(+0.113)#71 | 0.14%(+0.105)#2,361 |
| 72. | Ferndale | 0.23% | 0.13%(+0.098)#72 | 0.14%(+0.089)#2,447 |
| 73. | Roosevelt Park | 0.23% | 0.13%(+0.097)#73 | 0.14%(+0.089)#2,452 |
| 74. | Cutlerville | 0.23% | 0.13%(+0.097)#74 | 0.14%(+0.088)#2,456 |
| 75. | Jenison | 0.22% | 0.13%(+0.089)#75 | 0.14%(+0.081)#2,500 |
| 76. | Southfield | 0.22% | 0.13%(+0.085)#76 | 0.14%(+0.076)#2,529 |
| 77. | Traverse City | 0.20% | 0.13%(+0.073)#77 | 0.14%(+0.065)#2,599 |
| 78. | Baroda | 0.20% | 0.13%(+0.071)#78 | 0.14%(+0.063)#2,607 |
| 79. | Troy | 0.20% | 0.13%(+0.071)#79 | 0.14%(+0.063)#2,613 |
| 80. | Grand Rapids | 0.20% | 0.13%(+0.070)#80 | 0.14%(+0.062)#2,619 |
| 81. | Grandville | 0.20% | 0.13%(+0.067)#81 | 0.14%(+0.059)#2,635 |
| 82. | South Rockwood | 0.20% | 0.13%(+0.066)#82 | 0.14%(+0.058)#2,646 |
| 83. | Saginaw | 0.19% | 0.13%(+0.063)#83 | 0.14%(+0.055)#2,667 |
| 84. | St Clair Shores | 0.19% | 0.13%(+0.061)#84 | 0.14%(+0.053)#2,689 |
| 85. | Westland | 0.19% | 0.13%(+0.058)#85 | 0.14%(+0.050)#2,709 |
| 86. | Flint | 0.17% | 0.13%(+0.035)#86 | 0.14%(+0.027)#2,875 |
| 87. | Kalamazoo | 0.16% | 0.13%(+0.034)#87 | 0.14%(+0.026)#2,883 |
| 88. | Rochester Hills | 0.15% | 0.13%(+0.024)#88 | 0.14%(+0.016)#2,960 |
| 89. | Manchester | 0.15% | 0.13%(+0.021)#89 | 0.14%(+0.013)#2,983 |
| 90. | Warren | 0.14% | 0.13%(+0.011)#90 | 0.14%(+0.003)#3,051 |
| 91. | Harper Woods | 0.14% | 0.13%(+0.010)#91 | 0.14%(+0.002)#3,058 |
| 92. | Wixom | 0.14% | 0.13%(+0.007)#92 | 0.14%(-0.001)#3,081 |
| 93. | Battle Creek | 0.12% | 0.13%(-0.006)#93 | 0.14%(-0.014)#3,191 |
| 94. | Auburn Hills | 0.12% | 0.13%(-0.010)#94 | 0.14%(-0.018)#3,227 |
| 95. | Charlotte | 0.12% | 0.13%(-0.010)#95 | 0.14%(-0.018)#3,228 |
| 96. | Dearborn | 0.11% | 0.13%(-0.019)#96 | 0.14%(-0.027)#3,322 |
| 97. | Taylor | 0.11% | 0.13%(-0.023)#97 | 0.14%(-0.031)#3,356 |
| 98. | Grand Ledge | 0.10% | 0.13%(-0.027)#98 | 0.14%(-0.035)#3,390 |
| 99. | Midland | 0.10% | 0.13%(-0.027)#99 | 0.14%(-0.036)#3,394 |
| 100. | Forest Hills | 0.10% | 0.13%(-0.030)#100 | 0.14%(-0.039)#3,419 |
Common Questions
What are the Top 10 Cities with the Highest Percentage of Population Employed in Enterprise Management in Michigan?
Top 10 Cities with the Highest Percentage of Population Employed in Enterprise Management in Michigan are:
#1
10.0%
#2
1.9%
#3
1.8%
#4
1.7%
#5
1.4%
#6
1.2%
#7
1.1%
#8
1.0%
#9
1.0%
#10
1.0%
What city has the Highest Percentage of Population Employed in Enterprise Management in Michigan?
Lost Lake Woods has the Highest Percentage of Population Employed in Enterprise Management in Michigan with 10.0%.
What is the Percentage of Population Employed in Enterprise Management in the State of Michigan?
Percentage of Population Employed in Enterprise Management in Michigan is 0.13%.
What is the Percentage of Population Employed in Enterprise Management in the United States?
Percentage of Population Employed in Enterprise Management in the United States is 0.14%.