Cities with the Highest Percentage of Population Employed in Enterprise Management in Iowa
RELATED REPORTS & OPTIONS
Enterprise Management
Iowa
Compare Cities
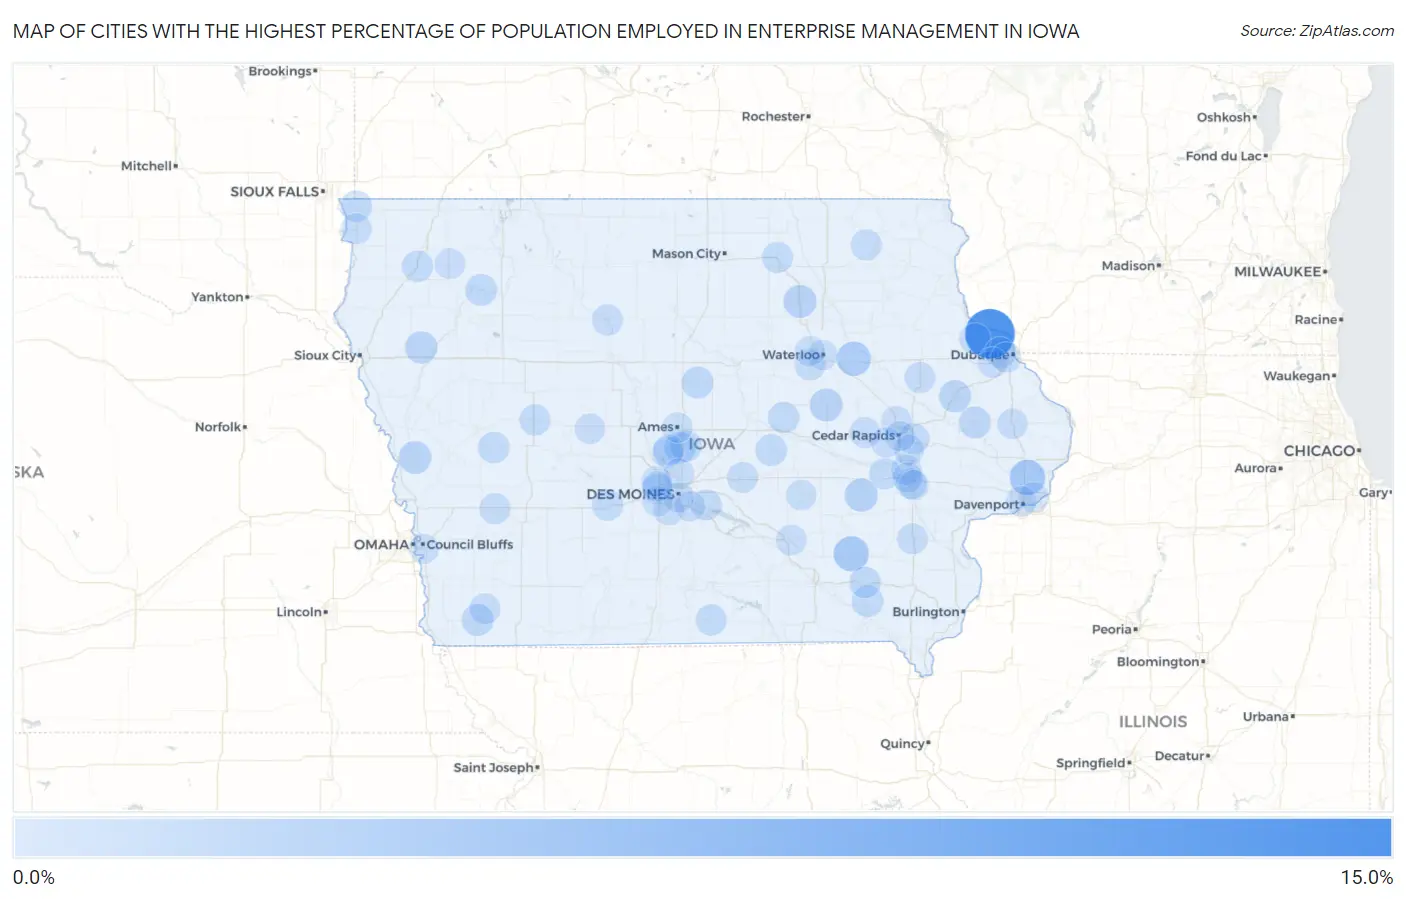
Map of Cities with the Highest Percentage of Population Employed in Enterprise Management in Iowa
0.0%
15.0%
Cities with the Highest Percentage of Population Employed in Enterprise Management in Iowa
| City | % Employed | vs State | vs National | |
| 1. | Balltown | 14.3% | 0.081%(+14.2)#1 | 0.14%(+14.1)#6 |
| 2. | Park View | 3.8% | 0.081%(+3.73)#2 | 0.14%(+3.67)#89 |
| 3. | Ollie | 3.5% | 0.081%(+3.43)#3 | 0.14%(+3.37)#100 |
| 4. | Jesup | 2.9% | 0.081%(+2.83)#4 | 0.14%(+2.78)#131 |
| 5. | Parnell | 2.1% | 0.081%(+1.99)#5 | 0.14%(+1.93)#231 |
| 6. | Plainfield | 1.9% | 0.081%(+1.84)#6 | 0.14%(+1.78)#257 |
| 7. | Dysart | 1.8% | 0.081%(+1.75)#7 | 0.14%(+1.69)#278 |
| 8. | Pisgah | 1.7% | 0.081%(+1.66)#8 | 0.14%(+1.60)#299 |
| 9. | Pierson | 1.4% | 0.081%(+1.36)#9 | 0.14%(+1.30)#381 |
| 10. | Monticello | 1.4% | 0.081%(+1.35)#10 | 0.14%(+1.30)#382 |
| 11. | Shenandoah | 1.1% | 0.081%(+1.04)#11 | 0.14%(+0.984)#515 |
| 12. | Wyoming | 1.1% | 0.081%(+1.04)#12 | 0.14%(+0.981)#518 |
| 13. | Radcliffe | 1.1% | 0.081%(+1.03)#13 | 0.14%(+0.968)#524 |
| 14. | Birmingham | 1.1% | 0.081%(+0.986)#14 | 0.14%(+0.929)#538 |
| 15. | Peterson | 1.0% | 0.081%(+0.950)#15 | 0.14%(+0.892)#568 |
| 16. | Gilman | 0.99% | 0.081%(+0.912)#16 | 0.14%(+0.855)#600 |
| 17. | Huxley | 0.92% | 0.081%(+0.841)#17 | 0.14%(+0.784)#666 |
| 18. | Cambridge | 0.87% | 0.081%(+0.788)#18 | 0.14%(+0.731)#710 |
| 19. | Fairfield | 0.86% | 0.081%(+0.780)#19 | 0.14%(+0.722)#721 |
| 20. | Larchwood | 0.85% | 0.081%(+0.768)#20 | 0.14%(+0.710)#731 |
| 21. | Garwin | 0.85% | 0.081%(+0.766)#21 | 0.14%(+0.709)#734 |
| 22. | Dexter | 0.83% | 0.081%(+0.750)#22 | 0.14%(+0.692)#753 |
| 23. | Bertram | 0.78% | 0.081%(+0.694)#23 | 0.14%(+0.637)#819 |
| 24. | Manilla | 0.75% | 0.081%(+0.667)#24 | 0.14%(+0.610)#866 |
| 25. | Hospers | 0.74% | 0.081%(+0.656)#25 | 0.14%(+0.598)#878 |
| 26. | Oxford | 0.72% | 0.081%(+0.635)#26 | 0.14%(+0.577)#904 |
| 27. | Corydon | 0.70% | 0.081%(+0.621)#27 | 0.14%(+0.564)#924 |
| 28. | Carroll | 0.70% | 0.081%(+0.616)#28 | 0.14%(+0.559)#934 |
| 29. | Floyd | 0.62% | 0.081%(+0.536)#29 | 0.14%(+0.479)#1,058 |
| 30. | Holy Cross | 0.61% | 0.081%(+0.525)#30 | 0.14%(+0.467)#1,076 |
| 31. | Spillville | 0.60% | 0.081%(+0.514)#31 | 0.14%(+0.457)#1,096 |
| 32. | Sheldahl | 0.59% | 0.081%(+0.510)#32 | 0.14%(+0.453)#1,104 |
| 33. | Ryan | 0.58% | 0.081%(+0.497)#33 | 0.14%(+0.439)#1,128 |
| 34. | Newhall | 0.57% | 0.081%(+0.492)#34 | 0.14%(+0.435)#1,135 |
| 35. | Walnut | 0.57% | 0.081%(+0.490)#35 | 0.14%(+0.433)#1,143 |
| 36. | Humboldt | 0.53% | 0.081%(+0.451)#36 | 0.14%(+0.394)#1,244 |
| 37. | Essex | 0.48% | 0.081%(+0.401)#37 | 0.14%(+0.343)#1,379 |
| 38. | Ainsworth | 0.48% | 0.081%(+0.399)#38 | 0.14%(+0.342)#1,383 |
| 39. | Runnells | 0.48% | 0.081%(+0.399)#39 | 0.14%(+0.342)#1,384 |
| 40. | Hudson | 0.47% | 0.081%(+0.392)#40 | 0.14%(+0.335)#1,398 |
| 41. | Inwood | 0.47% | 0.081%(+0.389)#41 | 0.14%(+0.332)#1,405 |
| 42. | Slater | 0.44% | 0.081%(+0.363)#42 | 0.14%(+0.306)#1,472 |
| 43. | Asbury | 0.41% | 0.081%(+0.333)#43 | 0.14%(+0.276)#1,561 |
| 44. | University Heights | 0.41% | 0.081%(+0.326)#44 | 0.14%(+0.269)#1,589 |
| 45. | Newton | 0.40% | 0.081%(+0.320)#45 | 0.14%(+0.263)#1,615 |
| 46. | University Park | 0.36% | 0.081%(+0.276)#46 | 0.14%(+0.219)#1,791 |
| 47. | Ankeny | 0.32% | 0.081%(+0.241)#47 | 0.14%(+0.184)#1,931 |
| 48. | Jefferson | 0.31% | 0.081%(+0.224)#48 | 0.14%(+0.167)#2,011 |
| 49. | Hiawatha | 0.30% | 0.081%(+0.222)#49 | 0.14%(+0.164)#2,031 |
| 50. | Primghar | 0.27% | 0.081%(+0.186)#50 | 0.14%(+0.129)#2,221 |
| 51. | Maquoketa | 0.26% | 0.081%(+0.180)#51 | 0.14%(+0.123)#2,257 |
| 52. | Norwalk | 0.25% | 0.081%(+0.173)#52 | 0.14%(+0.116)#2,292 |
| 53. | Fairfax | 0.25% | 0.081%(+0.173)#53 | 0.14%(+0.115)#2,297 |
| 54. | Bettendorf | 0.25% | 0.081%(+0.172)#54 | 0.14%(+0.115)#2,300 |
| 55. | North Liberty | 0.24% | 0.081%(+0.160)#55 | 0.14%(+0.103)#2,370 |
| 56. | Carlisle | 0.23% | 0.081%(+0.152)#56 | 0.14%(+0.095)#2,412 |
| 57. | Peosta | 0.19% | 0.081%(+0.110)#57 | 0.14%(+0.053)#2,686 |
| 58. | Clive | 0.19% | 0.081%(+0.106)#58 | 0.14%(+0.049)#2,718 |
| 59. | Ely | 0.17% | 0.081%(+0.088)#59 | 0.14%(+0.031)#2,832 |
| 60. | Montezuma | 0.16% | 0.081%(+0.075)#60 | 0.14%(+0.018)#2,941 |
| 61. | Davenport | 0.14% | 0.081%(+0.058)#61 | 0.14%(+0.001)#3,066 |
| 62. | West Des Moines | 0.14% | 0.081%(+0.058)#62 | 0.14%(+0.001)#3,071 |
| 63. | Des Moines | 0.12% | 0.081%(+0.034)#63 | 0.14%(-0.023)#3,280 |
| 64. | Dubuque | 0.11% | 0.081%(+0.027)#64 | 0.14%(-0.030)#3,348 |
| 65. | Ames | 0.11% | 0.081%(+0.026)#65 | 0.14%(-0.032)#3,361 |
| 66. | Grimes | 0.097% | 0.081%(+0.016)#66 | 0.14%(-0.041)#3,444 |
| 67. | Urbandale | 0.091% | 0.081%(+0.010)#67 | 0.14%(-0.048)#3,517 |
| 68. | Waterloo | 0.091% | 0.081%(+0.009)#68 | 0.14%(-0.048)#3,522 |
| 69. | Cedar Rapids | 0.076% | 0.081%(-0.005)#69 | 0.14%(-0.062)#3,651 |
| 70. | Coralville | 0.039% | 0.081%(-0.042)#70 | 0.14%(-0.100)#3,941 |
| 71. | Council Bluffs | 0.036% | 0.081%(-0.045)#71 | 0.14%(-0.103)#3,966 |
| 72. | Cedar Falls | 0.022% | 0.081%(-0.060)#72 | 0.14%(-0.117)#4,026 |
| 73. | Iowa City | 0.012% | 0.081%(-0.069)#73 | 0.14%(-0.127)#4,060 |
Common Questions
What are the Top 10 Cities with the Highest Percentage of Population Employed in Enterprise Management in Iowa?
Top 10 Cities with the Highest Percentage of Population Employed in Enterprise Management in Iowa are:
#1
14.3%
#2
3.8%
#3
3.5%
#4
2.9%
#5
2.1%
#6
1.9%
#7
1.8%
#8
1.7%
#9
1.4%
#10
1.4%
What city has the Highest Percentage of Population Employed in Enterprise Management in Iowa?
Balltown has the Highest Percentage of Population Employed in Enterprise Management in Iowa with 14.3%.
What is the Percentage of Population Employed in Enterprise Management in the State of Iowa?
Percentage of Population Employed in Enterprise Management in Iowa is 0.081%.
What is the Percentage of Population Employed in Enterprise Management in the United States?
Percentage of Population Employed in Enterprise Management in the United States is 0.14%.