Cities with the Highest Percentage of Population Employed in Enterprise Management in Maryland
RELATED REPORTS & OPTIONS
Enterprise Management
Maryland
Compare Cities
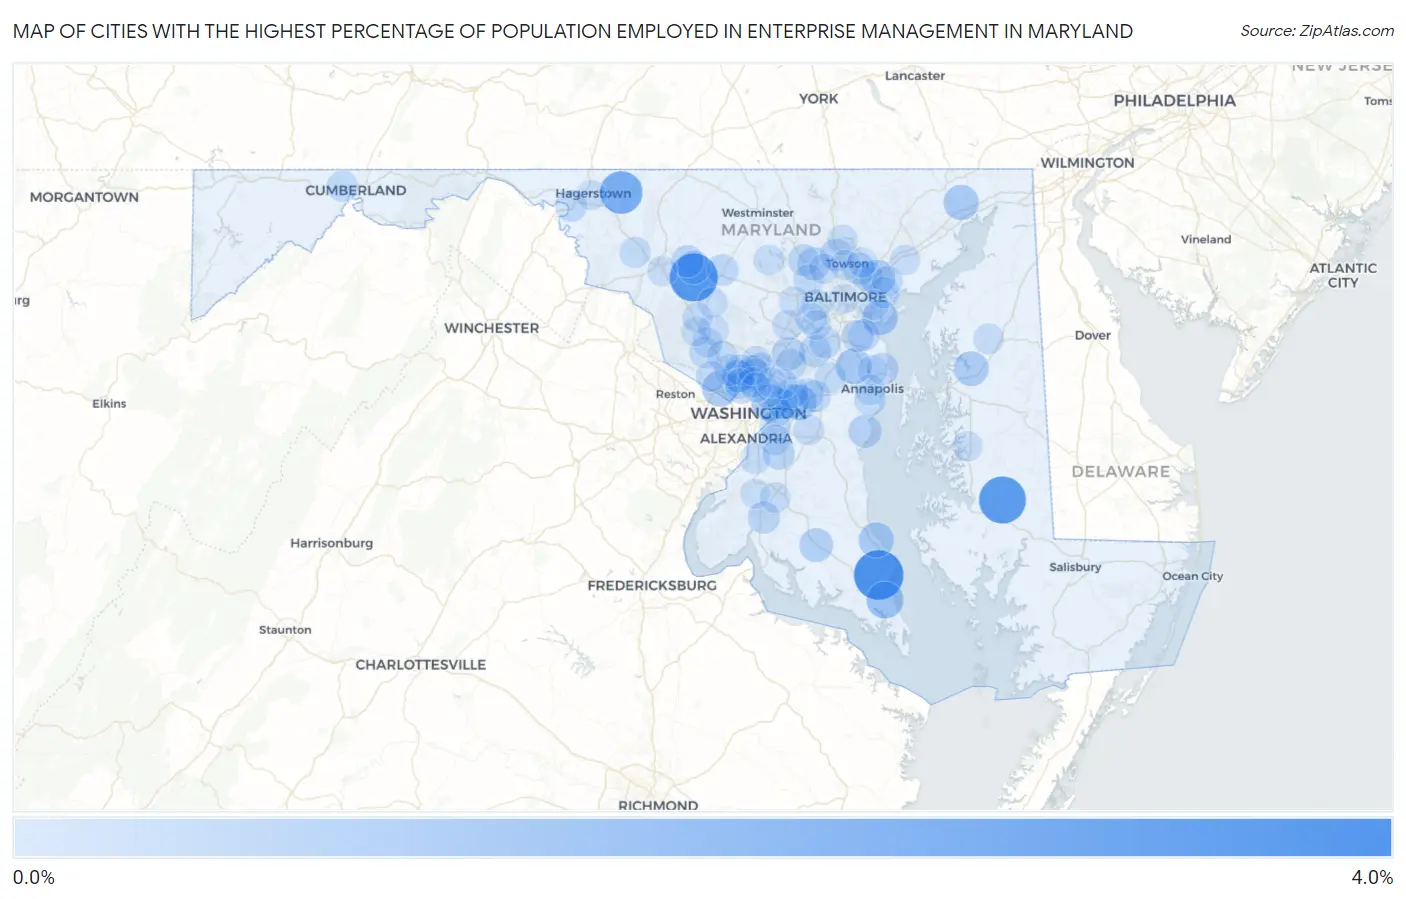
Map of Cities with the Highest Percentage of Population Employed in Enterprise Management in Maryland
0.0%
4.0%
Cities with the Highest Percentage of Population Employed in Enterprise Management in Maryland
| City | % Employed | vs State | vs National | |
| 1. | Solomons | 3.8% | 0.12%(+3.70)#1 | 0.14%(+3.68)#88 |
| 2. | Monrovia | 3.5% | 0.12%(+3.40)#2 | 0.14%(+3.38)#99 |
| 3. | East New Market | 3.3% | 0.12%(+3.17)#3 | 0.14%(+3.16)#112 |
| 4. | Cavetown | 2.4% | 0.12%(+2.30)#4 | 0.14%(+2.28)#189 |
| 5. | Lexington Park | 1.3% | 0.12%(+1.22)#5 | 0.14%(+1.21)#416 |
| 6. | Colmar Manor | 1.3% | 0.12%(+1.21)#6 | 0.14%(+1.19)#419 |
| 7. | Cabin John | 1.1% | 0.12%(+1.02)#7 | 0.14%(+1.00)#507 |
| 8. | Mitchellville | 1.1% | 0.12%(+0.997)#8 | 0.14%(+0.982)#517 |
| 9. | Herald Harbor | 1.1% | 0.12%(+0.987)#9 | 0.14%(+0.971)#522 |
| 10. | Edgemere | 1.0% | 0.12%(+0.905)#10 | 0.14%(+0.889)#569 |
| 11. | Port Deposit | 1.0% | 0.12%(+0.897)#11 | 0.14%(+0.882)#575 |
| 12. | Long Beach | 1.0% | 0.12%(+0.877)#12 | 0.14%(+0.861)#594 |
| 13. | Rossville | 0.99% | 0.12%(+0.866)#13 | 0.14%(+0.850)#607 |
| 14. | Centreville | 0.93% | 0.12%(+0.804)#14 | 0.14%(+0.789)#657 |
| 15. | Chevy Chase View | 0.76% | 0.12%(+0.639)#15 | 0.14%(+0.623)#843 |
| 16. | Mechanicsville | 0.74% | 0.12%(+0.617)#16 | 0.14%(+0.601)#874 |
| 17. | Springdale | 0.71% | 0.12%(+0.586)#17 | 0.14%(+0.570)#917 |
| 18. | Shady Side | 0.63% | 0.12%(+0.510)#18 | 0.14%(+0.495)#1,020 |
| 19. | New Market | 0.63% | 0.12%(+0.503)#19 | 0.14%(+0.488)#1,037 |
| 20. | Laurel | 0.62% | 0.12%(+0.502)#20 | 0.14%(+0.486)#1,042 |
| 21. | Garrison | 0.58% | 0.12%(+0.457)#21 | 0.14%(+0.442)#1,124 |
| 22. | Mays Chapel | 0.56% | 0.12%(+0.432)#22 | 0.14%(+0.417)#1,192 |
| 23. | Four Corners | 0.53% | 0.12%(+0.407)#23 | 0.14%(+0.392)#1,252 |
| 24. | Flower Hill | 0.52% | 0.12%(+0.398)#24 | 0.14%(+0.382)#1,271 |
| 25. | Linganore | 0.50% | 0.12%(+0.376)#25 | 0.14%(+0.361)#1,331 |
| 26. | White Oak | 0.49% | 0.12%(+0.365)#26 | 0.14%(+0.349)#1,360 |
| 27. | Parkville | 0.47% | 0.12%(+0.347)#27 | 0.14%(+0.331)#1,409 |
| 28. | Fort Meade | 0.46% | 0.12%(+0.338)#28 | 0.14%(+0.323)#1,418 |
| 29. | La Plata | 0.45% | 0.12%(+0.326)#29 | 0.14%(+0.310)#1,464 |
| 30. | Cape St Claire | 0.43% | 0.12%(+0.306)#30 | 0.14%(+0.290)#1,515 |
| 31. | Pasadena | 0.43% | 0.12%(+0.303)#31 | 0.14%(+0.288)#1,528 |
| 32. | Clinton | 0.40% | 0.12%(+0.281)#32 | 0.14%(+0.265)#1,599 |
| 33. | Martin S Additions | 0.40% | 0.12%(+0.275)#33 | 0.14%(+0.260)#1,625 |
| 34. | Abingdon | 0.40% | 0.12%(+0.273)#34 | 0.14%(+0.258)#1,633 |
| 35. | Green Valley | 0.39% | 0.12%(+0.267)#35 | 0.14%(+0.251)#1,663 |
| 36. | Severn | 0.39% | 0.12%(+0.266)#36 | 0.14%(+0.251)#1,664 |
| 37. | Riviera Beach | 0.38% | 0.12%(+0.252)#37 | 0.14%(+0.237)#1,710 |
| 38. | Mount Airy | 0.36% | 0.12%(+0.236)#38 | 0.14%(+0.221)#1,784 |
| 39. | Owings Mills | 0.35% | 0.12%(+0.223)#39 | 0.14%(+0.207)#1,833 |
| 40. | Bowie | 0.34% | 0.12%(+0.221)#40 | 0.14%(+0.205)#1,843 |
| 41. | Williamsport | 0.34% | 0.12%(+0.216)#41 | 0.14%(+0.200)#1,869 |
| 42. | South Kensington | 0.34% | 0.12%(+0.214)#42 | 0.14%(+0.198)#1,882 |
| 43. | Woodlawn Cdp Baltimore County | 0.34% | 0.12%(+0.214)#43 | 0.14%(+0.198)#1,883 |
| 44. | Suitland | 0.33% | 0.12%(+0.209)#44 | 0.14%(+0.193)#1,901 |
| 45. | North Bethesda | 0.32% | 0.12%(+0.196)#45 | 0.14%(+0.180)#1,946 |
| 46. | Middletown | 0.31% | 0.12%(+0.182)#46 | 0.14%(+0.167)#2,010 |
| 47. | Lanham | 0.30% | 0.12%(+0.182)#47 | 0.14%(+0.166)#2,014 |
| 48. | North Potomac | 0.30% | 0.12%(+0.179)#48 | 0.14%(+0.163)#2,039 |
| 49. | Annapolis Neck | 0.30% | 0.12%(+0.173)#49 | 0.14%(+0.158)#2,067 |
| 50. | Overlea | 0.29% | 0.12%(+0.167)#50 | 0.14%(+0.151)#2,099 |
| 51. | Essex | 0.28% | 0.12%(+0.154)#51 | 0.14%(+0.138)#2,170 |
| 52. | Fairmount Heights | 0.27% | 0.12%(+0.151)#52 | 0.14%(+0.135)#2,184 |
| 53. | Ilchester | 0.27% | 0.12%(+0.149)#53 | 0.14%(+0.134)#2,190 |
| 54. | La Vale | 0.27% | 0.12%(+0.144)#54 | 0.14%(+0.128)#2,224 |
| 55. | Catonsville | 0.25% | 0.12%(+0.124)#55 | 0.14%(+0.109)#2,336 |
| 56. | Crofton | 0.24% | 0.12%(+0.114)#56 | 0.14%(+0.098)#2,392 |
| 57. | Fairwood | 0.23% | 0.12%(+0.108)#57 | 0.14%(+0.093)#2,428 |
| 58. | Camp Springs | 0.23% | 0.12%(+0.107)#58 | 0.14%(+0.092)#2,432 |
| 59. | Woodlawn Cdp Prince George S County | 0.23% | 0.12%(+0.105)#59 | 0.14%(+0.090)#2,446 |
| 60. | Landover | 0.22% | 0.12%(+0.098)#60 | 0.14%(+0.082)#2,493 |
| 61. | Milford Mill | 0.21% | 0.12%(+0.087)#61 | 0.14%(+0.072)#2,554 |
| 62. | North Kensington | 0.20% | 0.12%(+0.080)#62 | 0.14%(+0.064)#2,604 |
| 63. | Middle River | 0.20% | 0.12%(+0.073)#63 | 0.14%(+0.058)#2,643 |
| 64. | South Laurel | 0.19% | 0.12%(+0.070)#64 | 0.14%(+0.054)#2,672 |
| 65. | Fort Washington | 0.19% | 0.12%(+0.070)#65 | 0.14%(+0.054)#2,673 |
| 66. | Annapolis | 0.19% | 0.12%(+0.065)#66 | 0.14%(+0.049)#2,713 |
| 67. | Church Hill | 0.18% | 0.12%(+0.062)#67 | 0.14%(+0.046)#2,737 |
| 68. | Rockville | 0.18% | 0.12%(+0.058)#68 | 0.14%(+0.042)#2,771 |
| 69. | Columbia | 0.17% | 0.12%(+0.046)#69 | 0.14%(+0.030)#2,845 |
| 70. | Marlboro Village | 0.16% | 0.12%(+0.034)#70 | 0.14%(+0.019)#2,938 |
| 71. | Eldersburg | 0.16% | 0.12%(+0.032)#71 | 0.14%(+0.017)#2,953 |
| 72. | Waldorf | 0.16% | 0.12%(+0.032)#72 | 0.14%(+0.017)#2,956 |
| 73. | Colesville | 0.15% | 0.12%(+0.025)#73 | 0.14%(+0.009)#3,005 |
| 74. | Chevy Chase | 0.14% | 0.12%(+0.019)#74 | 0.14%(+0.003)#3,047 |
| 75. | Potomac | 0.14% | 0.12%(+0.017)#75 | 0.14%(+0.002)#3,061 |
| 76. | Cockeysville | 0.13% | 0.12%(+0.011)#76 | 0.14%(-0.005)#3,119 |
| 77. | Ballenger Creek | 0.13% | 0.12%(+0.008)#77 | 0.14%(-0.007)#3,130 |
| 78. | Damascus | 0.13% | 0.12%(+0.002)#78 | 0.14%(-0.013)#3,184 |
| 79. | Joppatowne | 0.12% | 0.12%(-0.002)#79 | 0.14%(-0.018)#3,222 |
| 80. | Silver Spring | 0.12% | 0.12%(-0.004)#80 | 0.14%(-0.019)#3,237 |
| 81. | Montgomery Village | 0.12% | 0.12%(-0.008)#81 | 0.14%(-0.023)#3,282 |
| 82. | Easton | 0.11% | 0.12%(-0.009)#82 | 0.14%(-0.025)#3,298 |
| 83. | Greenbelt | 0.11% | 0.12%(-0.018)#83 | 0.14%(-0.033)#3,374 |
| 84. | Clarksburg | 0.10% | 0.12%(-0.019)#84 | 0.14%(-0.035)#3,386 |
| 85. | Hagerstown | 0.092% | 0.12%(-0.031)#85 | 0.14%(-0.046)#3,505 |
| 86. | Gaithersburg | 0.090% | 0.12%(-0.033)#86 | 0.14%(-0.049)#3,526 |
| 87. | Germantown | 0.084% | 0.12%(-0.039)#87 | 0.14%(-0.055)#3,575 |
| 88. | Towson | 0.084% | 0.12%(-0.039)#88 | 0.14%(-0.055)#3,578 |
| 89. | Hyattsville | 0.080% | 0.12%(-0.043)#89 | 0.14%(-0.059)#3,621 |
| 90. | College Park | 0.074% | 0.12%(-0.049)#90 | 0.14%(-0.065)#3,667 |
| 91. | Carney | 0.072% | 0.12%(-0.051)#91 | 0.14%(-0.067)#3,688 |
| 92. | Kemp Mill | 0.068% | 0.12%(-0.055)#92 | 0.14%(-0.070)#3,721 |
| 93. | Takoma Park | 0.065% | 0.12%(-0.059)#93 | 0.14%(-0.074)#3,755 |
| 94. | Arnold | 0.064% | 0.12%(-0.059)#94 | 0.14%(-0.075)#3,762 |
| 95. | Elkridge | 0.061% | 0.12%(-0.062)#95 | 0.14%(-0.078)#3,782 |
| 96. | Bensville | 0.057% | 0.12%(-0.066)#96 | 0.14%(-0.081)#3,804 |
| 97. | Ellicott City | 0.055% | 0.12%(-0.069)#97 | 0.14%(-0.084)#3,825 |
| 98. | Baltimore | 0.054% | 0.12%(-0.069)#98 | 0.14%(-0.084)#3,827 |
| 99. | Dundalk | 0.054% | 0.12%(-0.069)#99 | 0.14%(-0.084)#3,829 |
| 100. | Pikesville | 0.050% | 0.12%(-0.073)#100 | 0.14%(-0.089)#3,858 |
Common Questions
What are the Top 10 Cities with the Highest Percentage of Population Employed in Enterprise Management in Maryland?
Top 10 Cities with the Highest Percentage of Population Employed in Enterprise Management in Maryland are:
#1
3.8%
#2
3.5%
#3
3.3%
#4
2.4%
#5
1.3%
#6
1.3%
#7
1.1%
#8
1.1%
#9
1.1%
#10
1.0%
What city has the Highest Percentage of Population Employed in Enterprise Management in Maryland?
Solomons has the Highest Percentage of Population Employed in Enterprise Management in Maryland with 3.8%.
What is the Percentage of Population Employed in Enterprise Management in the State of Maryland?
Percentage of Population Employed in Enterprise Management in Maryland is 0.12%.
What is the Percentage of Population Employed in Enterprise Management in the United States?
Percentage of Population Employed in Enterprise Management in the United States is 0.14%.