Zip Codes with the Highest Percentage of Population Employed in Construction & Extraction in New York
RELATED REPORTS & OPTIONS
Construction & Extraction
New York
Compare Zip Codes
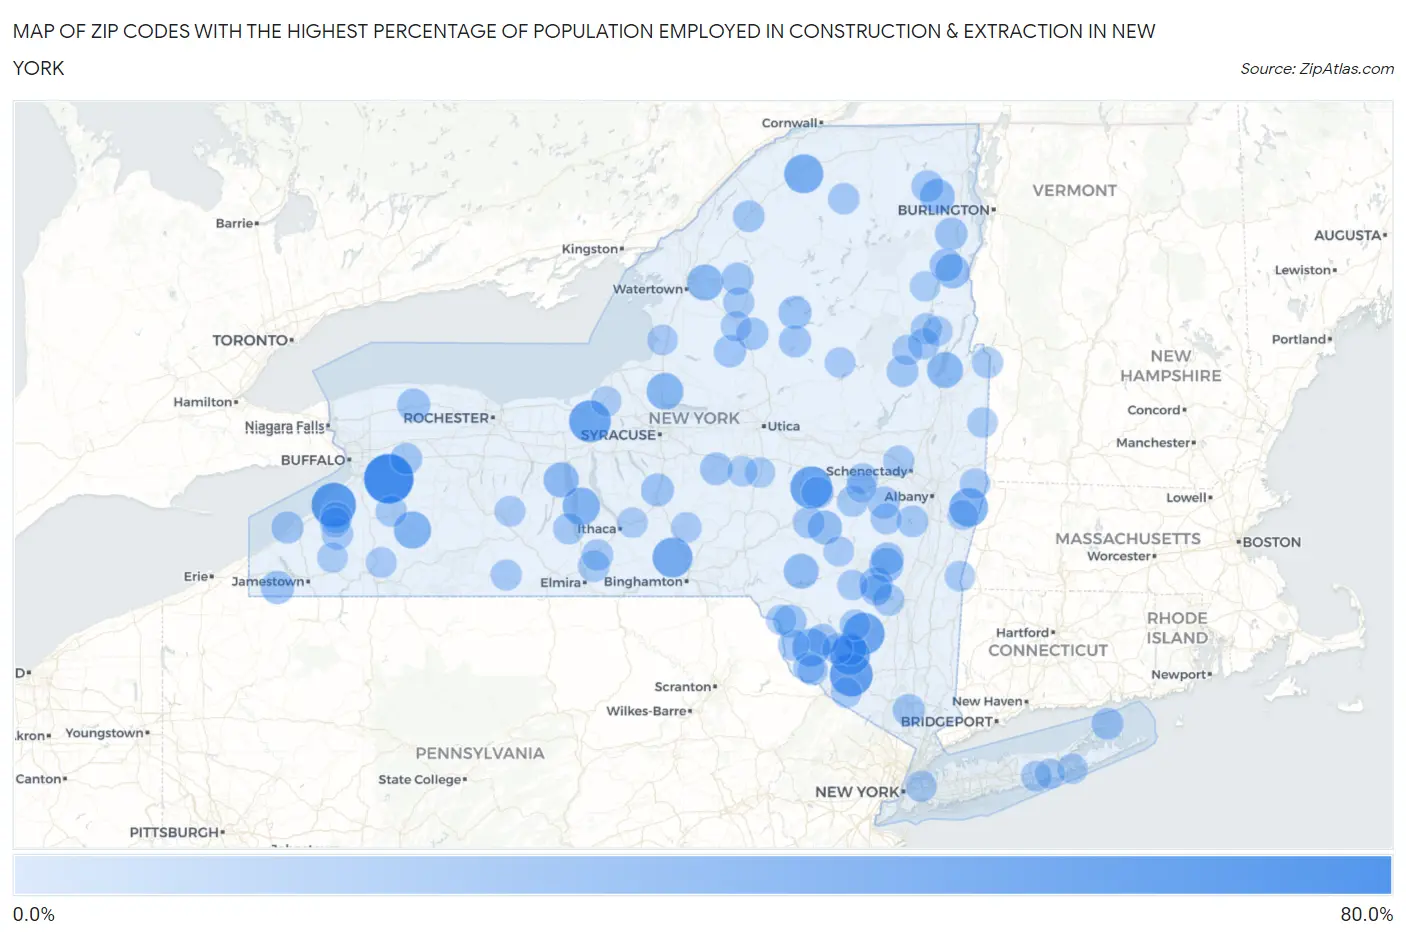
Map of Zip Codes with the Highest Percentage of Population Employed in Construction & Extraction in New York
0.0%
80.0%
Zip Codes with the Highest Percentage of Population Employed in Construction & Extraction in New York
| Zip Code | % Employed | vs State | vs National | |
| 1. | 14169 | 71.2% | 4.3%(+66.9)#1 | 5.0%(+66.2)#53 |
| 2. | 14027 | 55.9% | 4.3%(+51.6)#2 | 5.0%(+50.9)#98 |
| 3. | 10932 | 51.2% | 4.3%(+46.8)#3 | 5.0%(+46.2)#120 |
| 4. | 13450 | 48.0% | 4.3%(+43.7)#4 | 5.0%(+43.0)#140 |
| 5. | 13154 | 47.8% | 4.3%(+43.5)#5 | 5.0%(+42.8)#143 |
| 6. | 12489 | 47.6% | 4.3%(+43.3)#6 | 5.0%(+42.6)#147 |
| 7. | 12781 | 42.2% | 4.3%(+37.8)#7 | 5.0%(+37.2)#189 |
| 8. | 13802 | 42.1% | 4.3%(+37.8)#8 | 5.0%(+37.1)#191 |
| 9. | 13696 | 39.7% | 4.3%(+35.3)#9 | 5.0%(+34.7)#224 |
| 10. | 12169 | 38.3% | 4.3%(+33.9)#10 | 5.0%(+33.3)#240 |
| 11. | 12778 | 36.1% | 4.3%(+31.8)#11 | 5.0%(+31.2)#272 |
| 12. | 14860 | 34.9% | 4.3%(+30.6)#12 | 5.0%(+29.9)#292 |
| 13. | 14060 | 34.0% | 4.3%(+29.6)#13 | 5.0%(+29.0)#311 |
| 14. | 13103 | 32.7% | 4.3%(+28.3)#14 | 5.0%(+27.7)#340 |
| 15. | 13638 | 30.4% | 4.3%(+26.1)#15 | 5.0%(+25.4)#386 |
| 16. | 12820 | 30.4% | 4.3%(+26.1)#16 | 5.0%(+25.4)#388 |
| 17. | 14415 | 28.3% | 4.3%(+24.0)#17 | 5.0%(+23.3)#456 |
| 18. | 13752 | 27.4% | 4.3%(+23.1)#18 | 5.0%(+22.4)#491 |
| 19. | 12985 | 26.6% | 4.3%(+22.3)#19 | 5.0%(+21.6)#527 |
| 20. | 12998 | 25.5% | 4.3%(+21.1)#20 | 5.0%(+20.5)#565 |
| 21. | 13786 | 24.8% | 4.3%(+20.5)#21 | 5.0%(+19.8)#604 |
| 22. | 12485 | 24.7% | 4.3%(+20.4)#22 | 5.0%(+19.7)#611 |
| 23. | 12495 | 23.1% | 4.3%(+18.7)#23 | 5.0%(+18.1)#718 |
| 24. | 12769 | 22.3% | 4.3%(+18.0)#24 | 5.0%(+17.3)#768 |
| 25. | 12767 | 22.2% | 4.3%(+17.9)#25 | 5.0%(+17.2)#772 |
| 26. | 14767 | 22.2% | 4.3%(+17.9)#26 | 5.0%(+17.2)#781 |
| 27. | 13331 | 22.0% | 4.3%(+17.6)#27 | 5.0%(+17.0)#800 |
| 28. | 14479 | 21.7% | 4.3%(+17.4)#28 | 5.0%(+16.7)#819 |
| 29. | 12964 | 21.6% | 4.3%(+17.3)#29 | 5.0%(+16.6)#829 |
| 30. | 13087 | 21.5% | 4.3%(+17.2)#30 | 5.0%(+16.5)#839 |
| 31. | 12424 | 20.9% | 4.3%(+16.5)#31 | 5.0%(+15.9)#903 |
| 32. | 12950 | 20.7% | 4.3%(+16.4)#32 | 5.0%(+15.8)#915 |
| 33. | 13334 | 20.4% | 4.3%(+16.1)#33 | 5.0%(+15.4)#945 |
| 34. | 12023 | 19.8% | 4.3%(+15.5)#34 | 5.0%(+14.8)#1,015 |
| 35. | 13665 | 19.8% | 4.3%(+15.5)#35 | 5.0%(+14.8)#1,020 |
| 36. | 13325 | 19.7% | 4.3%(+15.4)#36 | 5.0%(+14.7)#1,030 |
| 37. | 13488 | 19.5% | 4.3%(+15.2)#37 | 5.0%(+14.5)#1,065 |
| 38. | 14166 | 19.4% | 4.3%(+15.1)#38 | 5.0%(+14.5)#1,072 |
| 39. | 13345 | 19.4% | 4.3%(+15.1)#39 | 5.0%(+14.5)#1,073 |
| 40. | 10596 | 19.4% | 4.3%(+15.1)#40 | 5.0%(+14.4)#1,075 |
| 41. | 12742 | 19.3% | 4.3%(+15.0)#41 | 5.0%(+14.3)#1,088 |
| 42. | 12978 | 19.2% | 4.3%(+14.8)#42 | 5.0%(+14.2)#1,109 |
| 43. | 13420 | 19.0% | 4.3%(+14.7)#43 | 5.0%(+14.0)#1,129 |
| 44. | 13750 | 18.4% | 4.3%(+14.1)#44 | 5.0%(+13.4)#1,233 |
| 45. | 11957 | 18.1% | 4.3%(+13.8)#45 | 5.0%(+13.2)#1,274 |
| 46. | 14040 | 17.9% | 4.3%(+13.6)#46 | 5.0%(+12.9)#1,309 |
| 47. | 12878 | 17.9% | 4.3%(+13.5)#47 | 5.0%(+12.9)#1,318 |
| 48. | 13681 | 17.8% | 4.3%(+13.5)#48 | 5.0%(+12.8)#1,328 |
| 49. | 14816 | 17.7% | 4.3%(+13.4)#49 | 5.0%(+12.7)#1,337 |
| 50. | 14041 | 17.6% | 4.3%(+13.3)#50 | 5.0%(+12.7)#1,359 |
| 51. | 12491 | 17.5% | 4.3%(+13.2)#51 | 5.0%(+12.5)#1,381 |
| 52. | 14168 | 17.5% | 4.3%(+13.1)#52 | 5.0%(+12.5)#1,390 |
| 53. | 14824 | 17.3% | 4.3%(+13.0)#53 | 5.0%(+12.3)#1,416 |
| 54. | 12046 | 17.3% | 4.3%(+13.0)#54 | 5.0%(+12.3)#1,420 |
| 55. | 14878 | 17.1% | 4.3%(+12.8)#55 | 5.0%(+12.1)#1,444 |
| 56. | 12980 | 17.1% | 4.3%(+12.8)#56 | 5.0%(+12.1)#1,445 |
| 57. | 12726 | 17.1% | 4.3%(+12.7)#57 | 5.0%(+12.1)#1,457 |
| 58. | 12457 | 17.1% | 4.3%(+12.7)#58 | 5.0%(+12.1)#1,459 |
| 59. | 14030 | 16.9% | 4.3%(+12.6)#59 | 5.0%(+11.9)#1,491 |
| 60. | 12147 | 16.6% | 4.3%(+12.3)#60 | 5.0%(+11.6)#1,570 |
| 61. | 12187 | 16.6% | 4.3%(+12.3)#61 | 5.0%(+11.6)#1,572 |
| 62. | 12150 | 16.5% | 4.3%(+12.2)#62 | 5.0%(+11.6)#1,580 |
| 63. | 12837 | 16.5% | 4.3%(+12.1)#63 | 5.0%(+11.5)#1,600 |
| 64. | 11368 | 16.4% | 4.3%(+12.1)#64 | 5.0%(+11.4)#1,619 |
| 65. | 12860 | 16.2% | 4.3%(+11.9)#65 | 5.0%(+11.2)#1,666 |
| 66. | 12817 | 16.2% | 4.3%(+11.8)#66 | 5.0%(+11.2)#1,673 |
| 67. | 12743 | 16.1% | 4.3%(+11.8)#67 | 5.0%(+11.1)#1,698 |
| 68. | 14855 | 16.0% | 4.3%(+11.7)#68 | 5.0%(+11.0)#1,710 |
| 69. | 13620 | 15.9% | 4.3%(+11.6)#69 | 5.0%(+10.9)#1,747 |
| 70. | 12160 | 15.7% | 4.3%(+11.4)#70 | 5.0%(+10.7)#1,794 |
| 71. | 12458 | 15.5% | 4.3%(+11.2)#71 | 5.0%(+10.5)#1,845 |
| 72. | 14741 | 15.4% | 4.3%(+11.0)#72 | 5.0%(+10.4)#1,892 |
| 73. | 12738 | 15.3% | 4.3%(+11.0)#73 | 5.0%(+10.3)#1,912 |
| 74. | 14808 | 15.3% | 4.3%(+11.0)#74 | 5.0%(+10.3)#1,915 |
| 75. | 11950 | 15.2% | 4.3%(+10.9)#75 | 5.0%(+10.2)#1,952 |
| 76. | 13404 | 15.1% | 4.3%(+10.8)#76 | 5.0%(+10.1)#1,985 |
| 77. | 12843 | 15.1% | 4.3%(+10.7)#77 | 5.0%(+10.1)#1,994 |
| 78. | 13863 | 15.0% | 4.3%(+10.7)#78 | 5.0%(+10.0)#2,007 |
| 79. | 10933 | 14.9% | 4.3%(+10.6)#79 | 5.0%(+9.92)#2,057 |
| 80. | 12873 | 14.8% | 4.3%(+10.4)#80 | 5.0%(+9.77)#2,123 |
| 81. | 12517 | 14.7% | 4.3%(+10.4)#81 | 5.0%(+9.74)#2,143 |
| 82. | 13145 | 14.7% | 4.3%(+10.3)#82 | 5.0%(+9.68)#2,165 |
| 83. | 12410 | 14.6% | 4.3%(+10.3)#83 | 5.0%(+9.62)#2,191 |
| 84. | 12474 | 14.6% | 4.3%(+10.3)#84 | 5.0%(+9.60)#2,200 |
| 85. | 14129 | 14.6% | 4.3%(+10.3)#85 | 5.0%(+9.60)#2,203 |
| 86. | 14726 | 14.5% | 4.3%(+10.2)#86 | 5.0%(+9.55)#2,220 |
| 87. | 12139 | 14.5% | 4.3%(+10.2)#87 | 5.0%(+9.54)#2,228 |
| 88. | 12138 | 14.4% | 4.3%(+10.1)#88 | 5.0%(+9.43)#2,269 |
| 89. | 13062 | 14.4% | 4.3%(+10.1)#89 | 5.0%(+9.43)#2,273 |
| 90. | 12737 | 14.4% | 4.3%(+10.0)#90 | 5.0%(+9.36)#2,290 |
| 91. | 13364 | 14.3% | 4.3%(+9.96)#91 | 5.0%(+9.29)#2,323 |
| 92. | 13355 | 14.2% | 4.3%(+9.85)#92 | 5.0%(+9.18)#2,374 |
| 93. | 12855 | 14.1% | 4.3%(+9.77)#93 | 5.0%(+9.11)#2,411 |
| 94. | 12741 | 14.1% | 4.3%(+9.77)#94 | 5.0%(+9.11)#2,412 |
| 95. | 11946 | 14.1% | 4.3%(+9.75)#95 | 5.0%(+9.09)#2,418 |
| 96. | 12092 | 14.0% | 4.3%(+9.67)#96 | 5.0%(+9.00)#2,461 |
| 97. | 12062 | 14.0% | 4.3%(+9.66)#97 | 5.0%(+8.99)#2,464 |
| 98. | 13111 | 13.9% | 4.3%(+9.59)#98 | 5.0%(+8.92)#2,501 |
| 99. | 12815 | 13.8% | 4.3%(+9.46)#99 | 5.0%(+8.79)#2,552 |
| 100. | 11941 | 13.8% | 4.3%(+9.43)#100 | 5.0%(+8.77)#2,562 |
Common Questions
What are the Top 10 Zip Codes with the Highest Percentage of Population Employed in Construction & Extraction in New York?
Top 10 Zip Codes with the Highest Percentage of Population Employed in Construction & Extraction in New York are:
What zip code has the Highest Percentage of Population Employed in Construction & Extraction in New York?
14169 has the Highest Percentage of Population Employed in Construction & Extraction in New York with 71.2%.
What is the Percentage of Population Employed in Construction & Extraction in the State of New York?
Percentage of Population Employed in Construction & Extraction in New York is 4.3%.
What is the Percentage of Population Employed in Construction & Extraction in the United States?
Percentage of Population Employed in Construction & Extraction in the United States is 5.0%.