Zip Codes with the Highest Percentage of Population with a Degree in Education in Massachusetts
RELATED REPORTS & OPTIONS
Education
Massachusetts
Compare Zip Codes
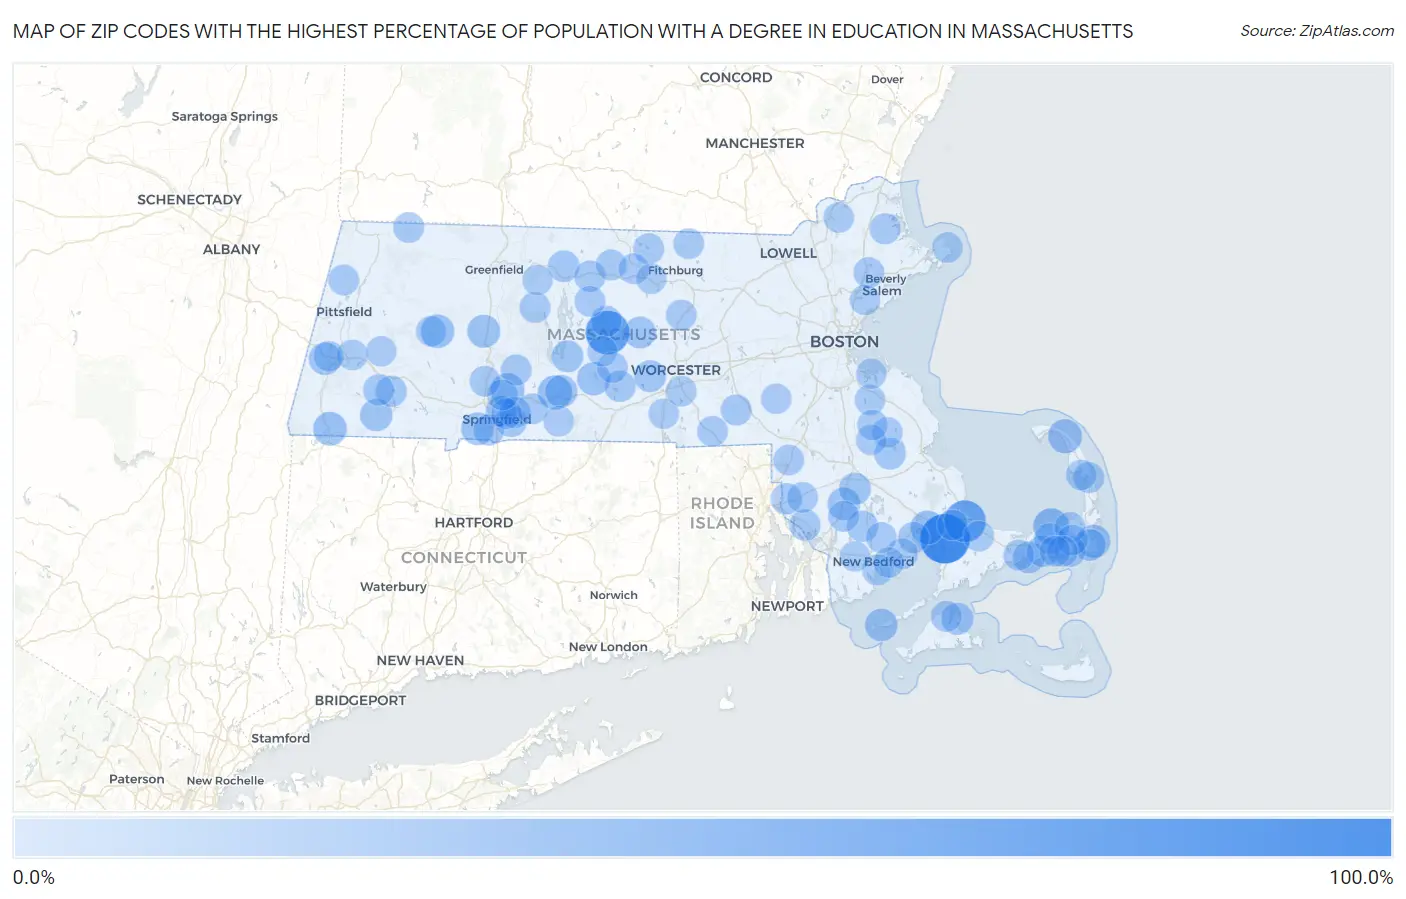
Map of Zip Codes with the Highest Percentage of Population with a Degree in Education in Massachusetts
0.0%
100.0%
Zip Codes with the Highest Percentage of Population with a Degree in Education in Massachusetts
| Zip Code | % Graduates | vs State | vs National | |
| 1. | 02553 | 100.0% | 8.2%(+91.8)#1 | 11.1%(+88.9)#239 |
| 2. | 01074 | 73.3% | 8.2%(+65.1)#2 | 11.1%(+62.3)#469 |
| 3. | 02561 | 64.6% | 8.2%(+56.4)#3 | 11.1%(+53.6)#619 |
| 4. | 02641 | 38.1% | 8.2%(+29.9)#4 | 11.1%(+27.0)#2,466 |
| 5. | 01079 | 30.8% | 8.2%(+22.6)#5 | 11.1%(+19.7)#4,199 |
| 6. | 02652 | 30.0% | 8.2%(+21.8)#6 | 11.1%(+19.0)#4,452 |
| 7. | 02571 | 29.0% | 8.2%(+20.8)#7 | 11.1%(+17.9)#4,897 |
| 8. | 01022 | 28.9% | 8.2%(+20.7)#8 | 11.1%(+17.8)#4,933 |
| 9. | 01222 | 28.1% | 8.2%(+19.9)#9 | 11.1%(+17.1)#5,257 |
| 10. | 01012 | 27.5% | 8.2%(+19.3)#10 | 11.1%(+16.4)#5,561 |
| 11. | 02650 | 26.3% | 8.2%(+18.1)#11 | 11.1%(+15.2)#6,160 |
| 12. | 01585 | 26.1% | 8.2%(+17.9)#12 | 11.1%(+15.1)#6,242 |
| 13. | 01088 | 24.8% | 8.2%(+16.6)#13 | 11.1%(+13.8)#7,033 |
| 14. | 02713 | 23.5% | 8.2%(+15.3)#14 | 11.1%(+12.5)#7,853 |
| 15. | 01030 | 23.5% | 8.2%(+15.3)#15 | 11.1%(+12.4)#7,883 |
| 16. | 02779 | 22.9% | 8.2%(+14.7)#16 | 11.1%(+11.9)#8,259 |
| 17. | 01229 | 22.7% | 8.2%(+14.5)#17 | 11.1%(+11.7)#8,410 |
| 18. | 01069 | 22.2% | 8.2%(+14.0)#18 | 11.1%(+11.2)#8,734 |
| 19. | 01255 | 22.2% | 8.2%(+14.0)#19 | 11.1%(+11.2)#8,758 |
| 20. | 02718 | 20.9% | 8.2%(+12.6)#20 | 11.1%(+9.79)#9,836 |
| 21. | 02557 | 20.8% | 8.2%(+12.6)#21 | 11.1%(+9.79)#9,841 |
| 22. | 01543 | 20.1% | 8.2%(+11.9)#22 | 11.1%(+9.08)#10,414 |
| 23. | 02673 | 20.1% | 8.2%(+11.9)#23 | 11.1%(+9.08)#10,416 |
| 24. | 01524 | 20.0% | 8.2%(+11.8)#24 | 11.1%(+8.96)#10,486 |
| 25. | 01082 | 19.8% | 8.2%(+11.6)#25 | 11.1%(+8.77)#10,686 |
| 26. | 02633 | 19.7% | 8.2%(+11.5)#26 | 11.1%(+8.67)#10,779 |
| 27. | 01364 | 19.3% | 8.2%(+11.1)#27 | 11.1%(+8.20)#11,201 |
| 28. | 02664 | 19.0% | 8.2%(+10.8)#28 | 11.1%(+7.92)#11,419 |
| 29. | 02660 | 18.7% | 8.2%(+10.5)#29 | 11.1%(+7.63)#11,704 |
| 30. | 02338 | 18.3% | 8.2%(+10.1)#30 | 11.1%(+7.24)#12,072 |
| 31. | 02717 | 18.2% | 8.2%(+10.0)#31 | 11.1%(+7.18)#12,137 |
| 32. | 01118 | 18.1% | 8.2%(+9.85)#32 | 11.1%(+6.99)#12,334 |
| 33. | 01104 | 17.8% | 8.2%(+9.63)#33 | 11.1%(+6.77)#12,537 |
| 34. | 01515 | 17.6% | 8.2%(+9.38)#34 | 11.1%(+6.53)#12,762 |
| 35. | 01119 | 17.4% | 8.2%(+9.23)#35 | 11.1%(+6.37)#12,928 |
| 36. | 02771 | 17.3% | 8.2%(+9.13)#36 | 11.1%(+6.28)#13,033 |
| 37. | 02777 | 17.2% | 8.2%(+9.02)#37 | 11.1%(+6.16)#13,163 |
| 38. | 01029 | 17.2% | 8.2%(+8.97)#38 | 11.1%(+6.12)#13,207 |
| 39. | 01331 | 17.2% | 8.2%(+8.95)#39 | 11.1%(+6.09)#13,235 |
| 40. | 02738 | 17.0% | 8.2%(+8.80)#40 | 11.1%(+5.95)#13,421 |
| 41. | 02646 | 16.9% | 8.2%(+8.73)#41 | 11.1%(+5.88)#13,492 |
| 42. | 02631 | 16.9% | 8.2%(+8.69)#42 | 11.1%(+5.84)#13,541 |
| 43. | 01253 | 16.7% | 8.2%(+8.46)#43 | 11.1%(+5.61)#13,784 |
| 44. | 02663 | 16.6% | 8.2%(+8.42)#44 | 11.1%(+5.56)#13,876 |
| 45. | 01005 | 16.5% | 8.2%(+8.29)#45 | 11.1%(+5.43)#14,009 |
| 46. | 01001 | 16.4% | 8.2%(+8.21)#46 | 11.1%(+5.36)#14,090 |
| 47. | 01747 | 16.3% | 8.2%(+8.12)#47 | 11.1%(+5.26)#14,183 |
| 48. | 01535 | 16.2% | 8.2%(+7.99)#48 | 11.1%(+5.13)#14,315 |
| 49. | 01430 | 16.1% | 8.2%(+7.94)#49 | 11.1%(+5.08)#14,367 |
| 50. | 02702 | 16.0% | 8.2%(+7.84)#50 | 11.1%(+4.99)#14,457 |
| 51. | 01436 | 16.0% | 8.2%(+7.78)#51 | 11.1%(+4.93)#14,526 |
| 52. | 02769 | 15.9% | 8.2%(+7.69)#52 | 11.1%(+4.84)#14,625 |
| 53. | 01033 | 15.8% | 8.2%(+7.60)#53 | 11.1%(+4.74)#14,731 |
| 54. | 01095 | 15.8% | 8.2%(+7.59)#54 | 11.1%(+4.73)#14,737 |
| 55. | 01109 | 15.7% | 8.2%(+7.52)#55 | 11.1%(+4.66)#14,845 |
| 56. | 02568 | 15.6% | 8.2%(+7.42)#56 | 11.1%(+4.56)#14,938 |
| 57. | 01072 | 15.6% | 8.2%(+7.37)#57 | 11.1%(+4.52)#14,986 |
| 58. | 01237 | 15.5% | 8.2%(+7.29)#58 | 11.1%(+4.44)#15,064 |
| 59. | 02601 | 15.5% | 8.2%(+7.27)#59 | 11.1%(+4.41)#15,083 |
| 60. | 01350 | 15.4% | 8.2%(+7.18)#60 | 11.1%(+4.33)#15,221 |
| 61. | 01020 | 15.4% | 8.2%(+7.17)#61 | 11.1%(+4.32)#15,231 |
| 62. | 01440 | 15.4% | 8.2%(+7.17)#62 | 11.1%(+4.31)#15,234 |
| 63. | 02739 | 15.4% | 8.2%(+7.16)#63 | 11.1%(+4.31)#15,239 |
| 64. | 01474 | 15.3% | 8.2%(+7.06)#64 | 11.1%(+4.21)#15,326 |
| 65. | 01969 | 15.3% | 8.2%(+7.05)#65 | 11.1%(+4.20)#15,341 |
| 66. | 01366 | 15.2% | 8.2%(+7.01)#66 | 11.1%(+4.16)#15,393 |
| 67. | 02645 | 15.1% | 8.2%(+6.91)#67 | 11.1%(+4.05)#15,533 |
| 68. | 02671 | 15.1% | 8.2%(+6.89)#68 | 11.1%(+4.04)#15,548 |
| 69. | 02639 | 15.1% | 8.2%(+6.88)#69 | 11.1%(+4.03)#15,572 |
| 70. | 02744 | 15.1% | 8.2%(+6.87)#70 | 11.1%(+4.01)#15,584 |
| 71. | 01040 | 15.1% | 8.2%(+6.86)#71 | 11.1%(+4.00)#15,599 |
| 72. | 01564 | 15.0% | 8.2%(+6.83)#72 | 11.1%(+3.97)#15,639 |
| 73. | 01238 | 15.0% | 8.2%(+6.80)#73 | 11.1%(+3.94)#15,672 |
| 74. | 02532 | 14.9% | 8.2%(+6.72)#74 | 11.1%(+3.87)#15,802 |
| 75. | 01569 | 14.8% | 8.2%(+6.64)#75 | 11.1%(+3.79)#15,895 |
| 76. | 02763 | 14.8% | 8.2%(+6.60)#76 | 11.1%(+3.75)#15,954 |
| 77. | 02563 | 14.8% | 8.2%(+6.59)#77 | 11.1%(+3.73)#15,968 |
| 78. | 02743 | 14.7% | 8.2%(+6.53)#78 | 11.1%(+3.68)#16,039 |
| 79. | 02341 | 14.7% | 8.2%(+6.48)#79 | 11.1%(+3.62)#16,108 |
| 80. | 01923 | 14.6% | 8.2%(+6.41)#80 | 11.1%(+3.55)#16,194 |
| 81. | 02667 | 14.4% | 8.2%(+6.20)#81 | 11.1%(+3.34)#16,451 |
| 82. | 02190 | 14.3% | 8.2%(+6.09)#82 | 11.1%(+3.24)#16,601 |
| 83. | 01084 | 14.3% | 8.2%(+6.08)#83 | 11.1%(+3.23)#16,693 |
| 84. | 01966 | 14.2% | 8.2%(+5.98)#84 | 11.1%(+3.13)#16,796 |
| 85. | 01057 | 14.2% | 8.2%(+5.98)#85 | 11.1%(+3.13)#16,800 |
| 86. | 02333 | 14.2% | 8.2%(+5.97)#86 | 11.1%(+3.12)#16,807 |
| 87. | 01540 | 14.1% | 8.2%(+5.89)#87 | 11.1%(+3.03)#16,902 |
| 88. | 02382 | 14.1% | 8.2%(+5.85)#88 | 11.1%(+3.00)#16,950 |
| 89. | 01262 | 14.0% | 8.2%(+5.82)#89 | 11.1%(+2.96)#16,999 |
| 90. | 01379 | 14.0% | 8.2%(+5.80)#90 | 11.1%(+2.95)#17,017 |
| 91. | 02054 | 14.0% | 8.2%(+5.78)#91 | 11.1%(+2.92)#17,043 |
| 92. | 01527 | 14.0% | 8.2%(+5.75)#92 | 11.1%(+2.89)#17,071 |
| 93. | 01473 | 13.9% | 8.2%(+5.72)#93 | 11.1%(+2.87)#17,113 |
| 94. | 02719 | 13.9% | 8.2%(+5.69)#94 | 11.1%(+2.83)#17,148 |
| 95. | 01531 | 13.9% | 8.2%(+5.68)#95 | 11.1%(+2.83)#17,153 |
| 96. | 01835 | 13.8% | 8.2%(+5.62)#96 | 11.1%(+2.77)#17,234 |
| 97. | 01223 | 13.8% | 8.2%(+5.56)#97 | 11.1%(+2.71)#17,325 |
| 98. | 01904 | 13.8% | 8.2%(+5.56)#98 | 11.1%(+2.70)#17,329 |
| 99. | 02191 | 13.7% | 8.2%(+5.48)#99 | 11.1%(+2.63)#17,436 |
| 100. | 02747 | 13.6% | 8.2%(+5.44)#100 | 11.1%(+2.59)#17,468 |
Common Questions
What are the Top 10 Zip Codes with the Highest Percentage of Population with a Degree in Education in Massachusetts?
Top 10 Zip Codes with the Highest Percentage of Population with a Degree in Education in Massachusetts are:
What zip code has the Highest Percentage of Population with a Degree in Education in Massachusetts?
02553 has the Highest Percentage of Population with a Degree in Education in Massachusetts with 100.0%.
What is the Percentage of Population with a Degree in Education in the State of Massachusetts?
Percentage of Population with a Degree in Education in Massachusetts is 8.2%.
What is the Percentage of Population with a Degree in Education in the United States?
Percentage of Population with a Degree in Education in the United States is 11.1%.