Zip Codes with the Highest Percentage of Population Employed in Office & Administration in Fall River, MA
RELATED REPORTS & OPTIONS
Office & Administration
Fall River
Compare Zip Codes
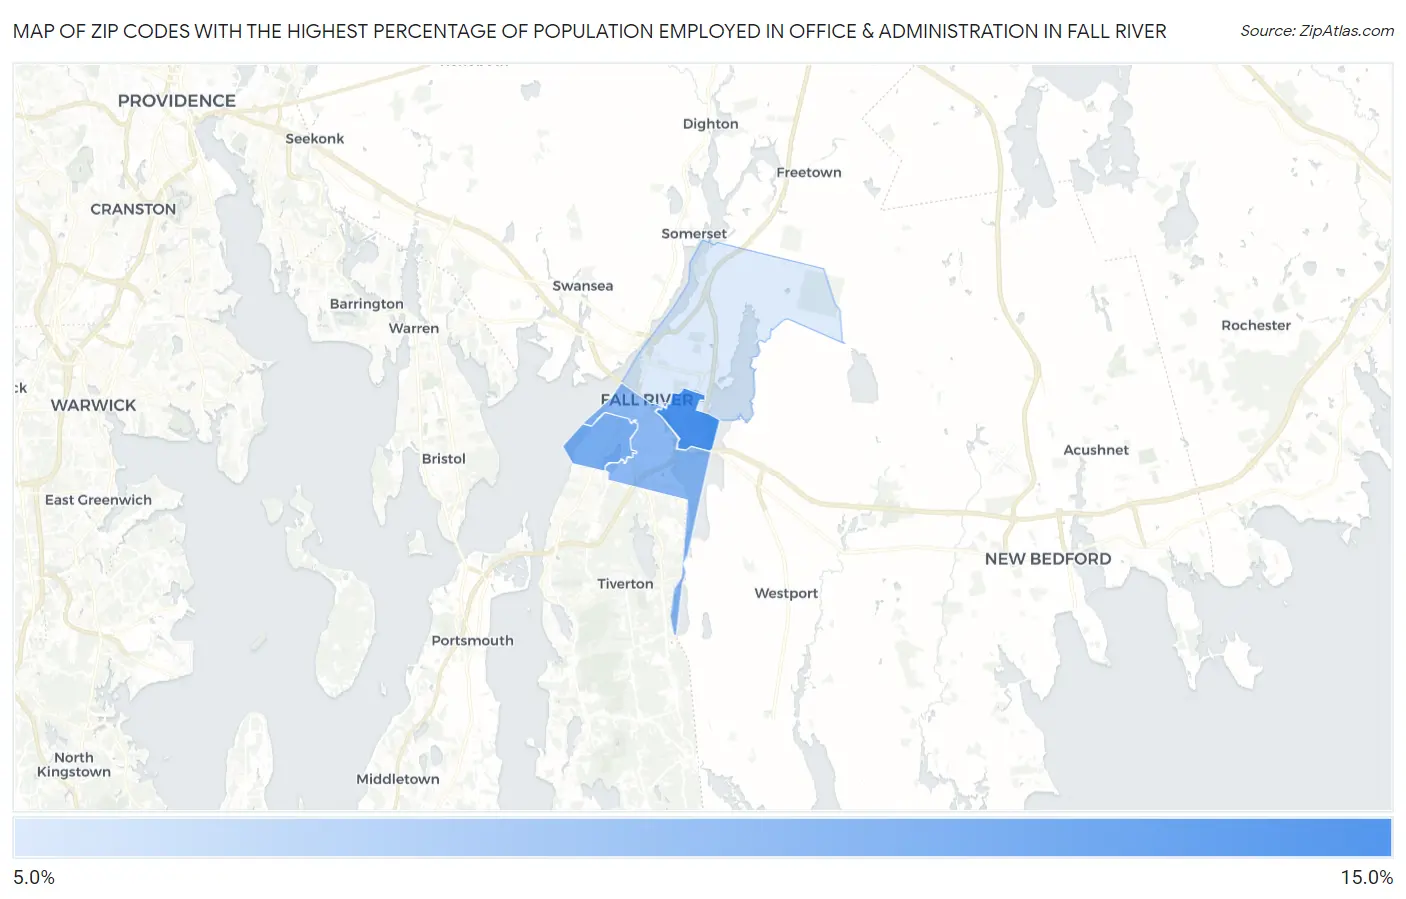
Map of Zip Codes with the Highest Percentage of Population Employed in Office & Administration in Fall River
9.1%
13.8%
Zip Codes with the Highest Percentage of Population Employed in Office & Administration in Fall River, MA
| Zip Code | % Employed | vs State | vs National | |
| 1. | 02723 | 13.8% | 9.6%(+4.19)#44 | 10.9%(+2.94)#6,365 |
| 2. | 02724 | 12.3% | 9.6%(+2.67)#88 | 10.9%(+1.42)#9,902 |
| 3. | 02721 | 11.7% | 9.6%(+2.12)#123 | 10.9%(+0.872)#11,554 |
| 4. | 02720 | 9.1% | 9.6%(-0.465)#272 | 10.9%(-1.71)#19,817 |
1
Common Questions
What are the Top 3 Zip Codes with the Highest Percentage of Population Employed in Office & Administration in Fall River, MA?
Top 3 Zip Codes with the Highest Percentage of Population Employed in Office & Administration in Fall River, MA are:
What zip code has the Highest Percentage of Population Employed in Office & Administration in Fall River, MA?
02723 has the Highest Percentage of Population Employed in Office & Administration in Fall River, MA with 13.8%.
What is the Percentage of Population Employed in Office & Administration in Fall River, MA?
Percentage of Population Employed in Office & Administration in Fall River is 11.2%.
What is the Percentage of Population Employed in Office & Administration in Massachusetts?
Percentage of Population Employed in Office & Administration in Massachusetts is 9.6%.
What is the Percentage of Population Employed in Office & Administration in the United States?
Percentage of Population Employed in Office & Administration in the United States is 10.9%.