Zip Codes with the Highest Percentage of Population Employed in Office & Administration in Haverhill, MA
RELATED REPORTS & OPTIONS
Office & Administration
Haverhill
Compare Zip Codes
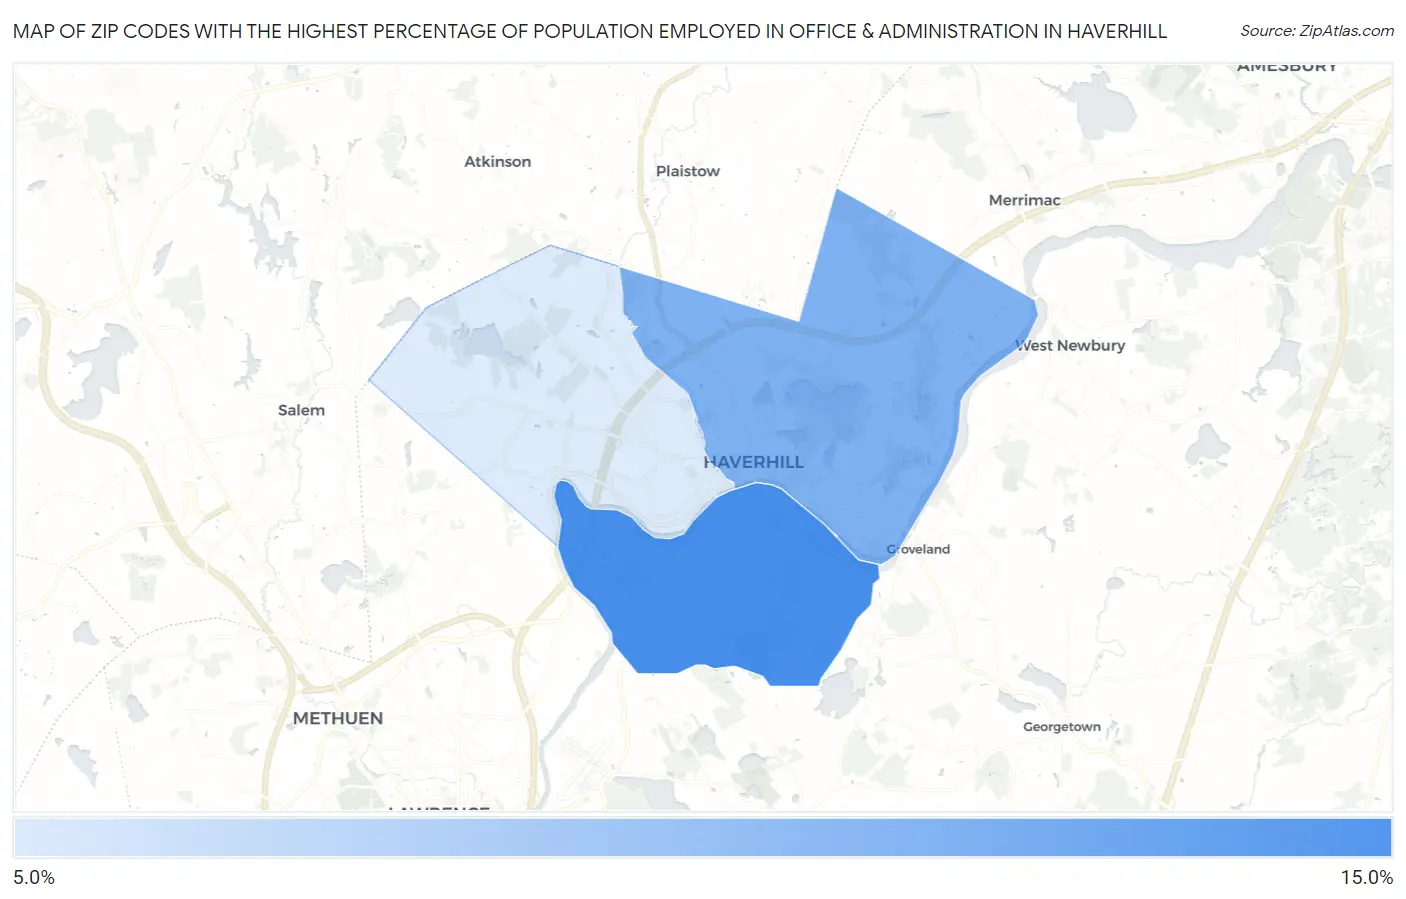
Map of Zip Codes with the Highest Percentage of Population Employed in Office & Administration in Haverhill
9.1%
13.3%
Zip Codes with the Highest Percentage of Population Employed in Office & Administration in Haverhill, MA
| Zip Code | % Employed | vs State | vs National | |
| 1. | 01835 | 13.3% | 9.6%(+3.65)#56 | 10.9%(+2.40)#7,465 |
| 2. | 01830 | 11.7% | 9.6%(+2.08)#125 | 10.9%(+0.834)#11,646 |
| 3. | 01832 | 9.1% | 9.6%(-0.554)#277 | 10.9%(-1.80)#20,100 |
1
Common Questions
What are the Top Zip Codes with the Highest Percentage of Population Employed in Office & Administration in Haverhill, MA?
Top Zip Codes with the Highest Percentage of Population Employed in Office & Administration in Haverhill, MA are:
What zip code has the Highest Percentage of Population Employed in Office & Administration in Haverhill, MA?
01835 has the Highest Percentage of Population Employed in Office & Administration in Haverhill, MA with 13.3%.
What is the Percentage of Population Employed in Office & Administration in Haverhill, MA?
Percentage of Population Employed in Office & Administration in Haverhill is 11.1%.
What is the Percentage of Population Employed in Office & Administration in Massachusetts?
Percentage of Population Employed in Office & Administration in Massachusetts is 9.6%.
What is the Percentage of Population Employed in Office & Administration in the United States?
Percentage of Population Employed in Office & Administration in the United States is 10.9%.